the effect of teacher mindset on low …d-scholarship.pitt.edu/32084/1/st. amant - dissertation...
TRANSCRIPT
THE EFFECT OF TEACHER MINDSET ON LOW-TRACKED STUDENTS
by
Tawnia Renee St.Amant
Bachelor of Science, California University of Pennsylvania, 2001
Master of Education, California University of Pennsylvania, 2008
Submitted to the Graduate Faculty of
School of Education in partial fulfillment
of the requirements for the degree of
Doctor of Education
University of Pittsburgh
2017
UNIVERSITY OF PITTSBURGH
School of Education
This dissertation was presented
by
Tawnia Renee St.Amant
It was defended on
April 19, 2017
and approved by
Dr. Maureen McClure, Ph.D., Professor
Dr. Charlene Trovato, Ph.D., Associate Professor
Dr. Tanner LeBaron Wallace, Ph.D., Associate Professor
Dissertation Advisor: Dr. Sean Kelly, Ph.D., Associate Professor
ii

Copyright © by Tawnia St.Amant
2017
iii

It is found that students in low tracked classes do not achieve as much academic growth
as those placed in high tracked levels. Although educational psychologists have extensively
studied the effect of “teacher expectations” on achievement, more recently, the concept of
Mindset has been introduced. Teachers who are unaware of the advances in neuroscience
regarding malleability of intelligence often believe students’ intelligence is fixed, and they view
struggles as failures instead of struggling as a critical part of learning. To explore this problem, a
study of instruction in low tracked classrooms was conducted.
A regional sample of teachers (n=36) participated in the initial survey. The survey has its
roots from Carol Dweck’s Mindset Assessment Profile Tool (Dweck, 2006) as well as
consultation from experts in the field. Findings indicate that 76% of the teachers score in the
growth mindset range. The study included observations of twelve classes to determine the rigor
of classroom activities based upon Webb’s Depth of Knowledge and interviews with six teachers
who teach low tracked students regarding lesson planning, assessment creation, and instruction
in low tracked classrooms. According to the literature and the information found in this study,
although many schools are touting the idea of detracking, tracking is still thriving in America’s
schools. Expectations that lower track students are unlikely to achieve academically could
THE EFFECT OF TEACHER MINDSET ON LOW TRACKED STUDENTS
Tawnia St.Amant, EdD
University of Pittsburgh, 2017
iv

potentially set these students up for failure from the start. Supporters of this viewpoint argue that
teachers generally hold limiting expectations for students in lower educational tracks (Wheelock,
1992). This study aimed to look at teachers with differing mindset scores and their approach to
and perception of teaching students in low academic tracks. While survey responses indicated
that study respondents generally adopt a growth mindset, observational data reveal some growth
mindset techniques such as student-centered learning are used infrequently.
v
TABLE OF CONTENTS
1.0 INTRODUCTION ........................................................................................................ 1
2.0 REVIEW OF LITERATURE ..................................................................................... 4
2.1 TRACKING IN EDUCATION .......................................................................... 4
2.1.1 Conceptual Framework .................................................................................. 6
2.1.2 Theories of Tracking ....................................................................................... 7
2.1.3 Current Practices in Tracking ...................................................................... 10
2.2 TEACHER’S PERCEPTIONS OF TRACKED STUDENTS ....................... 16
2.2.1 Teachers’ Perceptions of Tracking: Functional or Beneficial ................... 18
2.2.2 Teachers’ Perceptions of Student Academic Achievement in Low and
High Tracked Classes ................................................................................................ 19
2.2.3 Teachers’ Perceptions of Student Behavior in Low and High Tracked ... 22
Classes ......................................................................................................................... 22
2.2.4 Teachers’ Future-Expectations of Students in Varying Tracks ................ 23
2.2.5 Formation of Teacher Expectations ............................................................. 25
2.3 MINDSET AND LEARNING .......................................................................... 26
2.3.1 Educator’s Mindsets ...................................................................................... 29
2.4 RESEARCH QUESTIONS ............................................................................... 35
3.0 RESEARCH METHODOLOGY ............................................................................. 38
vi

3.1 INTRODUCTION ............................................................................................. 38
3.2 DATA COLLECTION AND ANALYSIS ....................................................... 41
3.2.1 Participants .................................................................................................... 41
3.2.2 Survey ............................................................................................................. 41
3.2.3 Independent Variables: Mindset Variables ................................................ 42
3.2.4 Independent Variables: Tracking Variables ............................................... 44
3.2.5 Observations................................................................................................... 44
3.2.6 Interviews ....................................................................................................... 46
4.0 FINDINGS .................................................................................................................. 49
4.1 TEACHER REPORTS OF TRACKING POLICIES .................................... 49
4.2 MINDSET SURVEY ......................................................................................... 51
4.3 OBSERVATIONS.............................................................................................. 53
4.4 INTERVIEW FINDINGS ................................................................................. 56
4.4.1 Differences in Instruction and Environment .............................................. 56
4.4.2 Student Behavior, Work Habits, and Interest in Learning ....................... 59
4.4.3 Differential Teacher Expectations ............................................................... 60
5.0 DISCUSSION AND CONCLUSION ....................................................................... 62
5.1 SUMMARY ........................................................................................................ 62
5.2 TRACKING ....................................................................................................... 63
SELF-REPORTED MINDSET SCORE .................................................................. 65
5.3 ......................................................................................................................................... 65
THEORIES OF INTELLIGENCE AND TEACHER INSTRUCTION ............... 67
5.4 ......................................................................................................................................... 67
vii
5.5 LIMITATIONS .................................................................................................. 68
IMPLICATIONS FOR RESEARCH AND FUTURE PRACTICE ...................... 69
5.6 ......................................................................................................................................... 69
CONCLUSION ........................................................................................................... 71
5.7 ......................................................................................................................................... 71
APPENDIX A .............................................................................................................................. 73
APPENDIX B .............................................................................................................................. 78
APPENDIX C .............................................................................................................................. 79
APPENDIX D .............................................................................................................................. 81
APPENDIX E .............................................................................................................................. 82
APPENDIX F .............................................................................................................................. 83
BIBLIOGRAPHY ....................................................................................................................... 84
viii

LIST OF TABLES
Table 1: Tracking in 8th Grade (Percent of Students) .................................................................. 15
Table 2: Research Matrix .............................................................................................................. 40
Table 3: Webb's Depth of Knowledge: Activities Sorted by Rigor .............................................. 46
Table 4: Survey Questions Regarding Tracking Procedures ........................................................ 49
Table 5: Mindset Survey ............................................................................................................... 52
Table 6: Observation Data Summary ............................................................................................ 54
ix
DEDICATION
To my husband, Mark, for his love, faith in me, and never-ending willingness to cover for me
during the long hours of research and writing.
To my parents for always pushing me to go farther than I thought I could and instilling in
me the value of hard work and the importance of education.
To Logan and Gerrit, my inspirations, never forget the importance of education, find your
passion, and follow your heart.
x
ACKNOWLEDGEMENTS
I would like to thank the teachers who took the time to complete the survey, participate in
the interviews and invite me into their classrooms to help me get quality results. I am also
grateful to the superintendents and principals of the districts and schools for their support of my
research and education.
I would also like to thank the members of my committee for their patience, support, and
help. I have learned so much from each of you. I am so grateful to Dr. Kelly for taking me on
and believing in my research and ideas. I extend my gratitude to Dr. Charlene Trovato for her
guidance and faith in me throughout this long journey. I am so appreciative of the many
Saturdays that I spent with Dr. Maureen McClure where she made me question everything I
thought I knew about education showing me how important it was to think outside the box. I
also wish to extend a sincere thank you to Dr. Tanner Wallace for joining my dissertation
committee and spending so much time providing me with rich and meaningful feedback and
expertise.
xi
1.0 INTRODUCTION
Throughout the history of American education and reform, one thing has remained
constant: the “select and sort” method of tracking students by achievement. Students are placed
in certain classes of varying academic level based upon a variety of variables: test scores, teacher
evaluations, previous academic performance, parental and, even, student choice. In one school, a
student may be tracked in a high or low academic level for all classes, while other schools allow
students to be discrepantly tracked. In this style of tracking, students may take a high-level
English class and a lower level math class. While it is possible for students to move between
levels, when students are tracked into a low-level class as high school freshmen, it is rare that
they exit from that level. On average, low-track students experience less achievement growth
than high-track students (Gamoran 1989). While there are many possible explanations for such
lower achievement, teacher expectations—including perceptions, and attitudes—for and about
low-track students may influence the quality of instruction in low-track classrooms (Brophy,
1985; Kelly & Carbonaro, 2012; Worthy, 2010; Harris, 2012; VanHoutte et al., 2013; Caughlan
& Kelly, 2004; Rattan et al., 2012).
Much of the research pertaining to teacher expectation and student performance supports
the assertion that teachers do form expectations, and they treat students differently based on
those expectations. Prior achievement, test scores, anecdotal information from other teachers,
current grades, socio-economic status, ethnicity, or appearance can drive these expectations. In
1
Kelly and Carbonaro’s (2012) study concerning curriculum tracking and teacher expectations,
specifically related to students who are discrepantly tracked, they focus on students with
discrepant track placements to determine how different teachers evaluate the same student. In
their analysis of the nationally representative NELS data, Kelly and Carbonaro find that: “Track
placements affect teacher expectations above and beyond student achievement and other
characteristics” (p. 289).
While educational psychologists have extensively studied the effect of “teacher
expectations” on achievement, more recently, the concept of mindset has been introduced. Can
understanding the difference between fixed and growth mindsets affect the education of
students? In Carol Dweck’s book Mindset: The New Psychology of Success (2006), she states,
“In a fixed mindset, people believe their basic qualities, like their intelligence or talent are
simply fixed traits. They spend their time documenting their intelligence or talent instead of
developing them. They also believe that talent alone creates success – without effort.” She goes
on to argue, “They’re wrong” (p. 62). Furthermore, Dweck explains, “In a growth mindset,
people believe that their most basic abilities can be developed through dedication and hard work
– brains and talent are just the starting point. This view creates a love of learning and resilience
that is essential for great accomplishment” (p. 63).
In her book, she dedicates numerous pages to how teachers might be instilling a growth
mindset in students; however, it is necessary to review research with a focus on growth mindset
and its application to teachers as well as students. When a teacher does not believe that
intelligence is malleable it can be detrimental to the learning of students. When students are
tracked, teachers with fixed mindsets may believe that a student in a lower level course will
never be able to fully understand Algebra II instead of understanding that it may take the student
2
longer to fully achieve proficiency. In this case, teachers may teach a watered down version of
the curriculum or they may even coddle the lower level students instead of fully preparing them.
In addition, teachers with fixed mindsets do not give students an opportunity to learn from
failure, nor do they teach students how to learn from failure. While this is disadvantageous to
student learning on a number of levels, in the era of high stakes testing, at a time when students
are expected to pass state standardized tests in order to graduate, teacher mindset could
harmfully affect graduation rates.
.
3

2.0 REVIEW OF LITERATURE
2.1 TRACKING IN EDUCATION
Throughout the history of American education and reform, one thing has remained constant:
the “select and sort” method of tracking students according to achievement. Students are placed
in certain classes of varying academic level based upon a variety of variables: test scores, teacher
evaluations, previous academic performance, parental and, even, student choice. In one school, a
student may be assigned to a high or low academic level for all of his classes, while other
schools allow students to be discrepantly tracked. In this style of tracking, students may take a
high level English class and a lower level math class. While it is possible for students to move
between levels, when students are tracked into a low level class as high school freshmen, it is
rare that they exit from that level. On average, low-track students experience less achievement
growth than high-track students (Gamoran 1989). While there are many possible explanations
for such lower achievement, teacher expectations—including perceptions, and attitudes—for and
about low-track students may influence the quality of instruction in low-track classrooms
(Brophy, 1985; Kelly & Carbonaro, 2012; Worthy, 2010; Harris, 2012; VanHoutte et al., 2013;
Caughlan & Kelly, 2004; Rattan et al., 2012).
Much of the research pertaining to teacher expectation and student performance supports
the assertion that teachers do form expectations, and they treat students differently based on
4
those expectations. These expectations can be derived from prior achievement, test scores,
anecdotal information from other teachers, current grades, socio-economic status, ethnicity or
appearance. In Kelly and Carbonaro’s (2012) study concerning curriculum tracking and teacher
expectations, specifically related to students who are discrepantly tracked, they focus on students
with discrepant track placements to determine how different teachers evaluate the same student.
In their analysis of the nationally representative NELS data, Kelly and Carbonaro find that:
“Track placements affect teacher expectations above and beyond student achievement and other
characteristics” (p. 289).
While educational psychologists have extensively studied the effect of “teacher
expectations” on achievement, more recently, the concept of mindset has been introduced. Can
understanding the difference between fixed and growth mindsets affect the education of
students? In Carol Dweck’s book Mindset: The New Psychology of Success (2006), she states,
“In a fixed mindset, people believe their basic qualities, like their intelligence or talent are
simply fixed traits. They spend their time documenting their intelligence or talent instead of
developing them. They also believe that talent alone creates success – without effort.” She goes
on to argue, “They’re wrong” (p. 62). Furthermore, Dweck explains, “In a growth mindset,
people believe that their most basic abilities can be developed through dedication and hard work
– brains and talent are just the starting point. This view creates a love of learning and resilience
that is essential for great accomplishment” (p. 63).
In her book, she dedicates numerous pages to how teachers might be instilling a growth
mindset in students; however, it is necessary to review research with a focus on growth mindset
and its application to teachers as well as students. When a teacher does not believe that
intelligence is malleable it can be detrimental to the learning of students. When students are
5
tracked, teachers with fixed mindsets may believe that a student in a lower level course will
never be able to fully understand Algebra II instead of understanding that it may take the student
longer to fully achieve proficiency. In this case, teachers may teach a watered down version of
the curriculum or they may even coddle the lower level students instead of fully preparing them.
In addition, teachers with fixed mindsets do not give students an opportunity to learn from
failure, nor do they teach students how to learn from failure. While this is disadvantageous to
student learning on a number of levels, in the era of high stakes testing, at a time when students
are expected to pass state standardized tests in order to graduate, teacher mindset could
harmfully affect graduation rates.
2.1.1 Conceptual Framework
In order to determine how schools group students in the present era of education, one
must first designate a definition of tracking and determine the difference between tracking and
ability grouping. Tracking takes place between academic classes, primarily occurring in high
schools and middle schools, while ability grouping is the grouping of students within classes and
is primarily found at the elementary level. The present tradition of tracking groups students for
individual classes; students are not assigned a specific track for all course work. While that
practice was commonplace in the 1960s and 1970s, it is now rare in the United States. Most
European and Asian school systems practice “streaming” which is akin to the early form of
tracking in the United states, where students take placement exams, and based on the scores, are
sorted into separate schools (Loveless, 2013).
In tracked academic subjects, students study a different curriculum that is subject-
specific. They may receive instruction from different teachers, for example. Advanced tenth
6

graders may attend an “honors English” class, while other students may attend “English 10;”
tracking is decided on a subject-by-subject basis (Loveless, 2013). For the purpose of this
literature review, tracking will be viewed as separating students by ability within the same high
school on a subject-by-subject basis.
2.1.2 Theories of Tracking
The research on tracking is extensive. While it seems that most of the literature denies
the benefits of tracking there are a variety of researchers who support the practice. An early
analysis of tracking supported by Turney (1931) suggested that tracking can facilitate instruction
by individualizing it while empowering educators to modify teaching techniques according to
class level and eliminating the probability that advanced students will experience boredom. He
goes on to note that tracking will “encourage slower students to participate since they will note
be overshadowed by more capable peers” (Ansalone, 2010, p.3). The efficiency perspective
describes tracking as a means of increasing societal efficiency by contributing to the proper
selection and channeling of national human resources. This perspective links the education
system to the labor market, and focuses on improved cognitive achievement, which it notes as a
significant and valuable contribution of tracking (Mosteller et al., 1996).
The self- development perspective views tracking as a pedagogical device that assists
overall learning and improves student self-concept. This perspective aligns itself with early
research revealing evidence that a positive self-concept will result when low achieving students
are grouped homogenously (VanFossen et al., 1987). This is derived from Festinger’s classical
social comparison theory (1954) explaining an individual’s need to have accurate appraisals of
their abilities, arguing that to form these appraisals, people compare themselves with others
7
holding similar abilities. Festinger hypothesized a unidirectional drive upward with regard to the
evaluation of these abilities (Suls & Wheeler, 2000). Several researchers have continued to
study this theory.
Mac Iver (1987) found pupils’ performance level in class determined the extent to which
pupils relied on social comparison information as a basis for self-evaluation. In looking at 1,570
fifth and sixth graders, he noted that students who performed well in math in comparison to their
classmates were more likely to decide they were good at math. Furthermore, Huguet et al.
(2001) found a similar beneficial effect of upward comparisons on course grades, and Mulkey et
al. (2005) showed that ability grouping, where students then compared themselves with similar
performing students, had positive instructional benefits. The authors found that tracking in 8th
grade was positively associated with 12th grade test scores, suggesting, in conjunction with the
other studies, that when students compare themselves with others who perform similarly, it may
inspire them to improve themselves (Blanton et al., 1999). However, this also could depend on
the tracking type. In a study examining how different types of tracking shape students’
mathematics self-concept, Chmielewski et al. (2013) found that students in course-by-course
tracking, high track students had higher mathematics self-concepts and low-track students had
lower mathematics self-concepts. For students in between-school and within-school streaming
the pattern is reversed suggesting that reference groups to which students compare themselves
differ according to the type of tracking utilized.
Those studies that support tracking argue that students differ in both their academic goals
and their learning environments, and schools should compensate for that. Despite the intended
benefits of tracking, it has been criticized because students in high tracks tend to widen their
achievement advantages over the students in low tracks. Gamoran (2009) notes that tracking
8
exacerbates inequality with little or no contribution to overall productivity, and this occurs
because gains for high achievers are offset by losses for low achievers (p.4). In looking at
students assigned to high, middle, low, and mixed ability classes within different types of
schools, there are no overall benefits to average achievement in contexts that levels instruction as
compared with classes that work with mixed-ability; however, sorting students into selective
schools and classes is associated with increasing gaps between high and low achievers
(Kerckhoff, 1993). Because of uneven quality of instruction attached to non-college tracks,
some students may learn less or be less likely to realize their goals when assigned to a low, or
non-college, tracking level (Gamoran & Mare, 1989). In fact, Gamoran (2009) identifies three
elements that would need to change to make low-track classes more effective: 1. The
assessments should be tied to futures that are more meaningful to students. He notes that the
current standardized multiple-choice tests are call for fragmented knowledge instead of coherent
mastery of a subject. 2. Assessments should offer incentives for students as well as schools.
Gamoran goes on to explain that schools are held accountable, but students are not. The
assessments should be tied to positive incentives like access to jobs or postsecondary education.
3. The course curriculum should be more aligned to the assessment (p. 14).
Oakes, Quartz, Ryan, & Lipton’s (2000) research supports the opposing view point
contending that lower tracks are characterized by an inferior education. In addition, she argues
that lower tracks contain a disproportionate number of Black and Hispanic students, and that
tracking facilitates the separation of social classes. Those who support this view agree that the
students in the upper tracks receive an extensive range of curriculum choices compared to the
emphasis on obedience and discipline stressed in the lower tracks. Other researchers argue that
instruction in the lower tracks is over-simplified (Ansalone, 2010). Although some educators
9
contend that low tracked, or non-college programs keep students attention and keep them from
dropping out of school (Mirel & Angus, 1986), according to Gamoran and Mare’s (1989) study
this is not the case. Even with creating models designed to reveal differences among students
that would show that some are more suited to benefit form one track of the other, this hypothesis
could not be supported. They found that the effects of tracking overcome an existing positive
selection biases, so that, in reality, fewer non-college students graduate as a result of their
tracking assignment (p. 1177). While there is a strong debate regarding the benefits of both
sides, there is clearly a strong tracking presence in the American education system.
2.1.3 Current Practices in Tracking
In a content analysis of curriculum guides, Kelly and Price (2011), looked at 128 high
schools in North Carolina to identify school tracking policies. This study examines differences
in tracking policies among diverse high schools, theories of social stratification and
corresponding tracking policies, and changes in tracking policies in recent years. Kelly and Price
further investigated the prevalence of course-taking policies on three core dimensions of
tracking: selectivity, scope, and electivity. Schools differ in the number of distinct tracks present
in each subject, the most important element of selectivity. Inclusiveness describes the proportion
of students in the highest tracks, while the extent to which students can choose courses of
different track levels is referred to as electivity. Scope is defined as the likelihood that students
take all of their subject matter courses in the same track level (p. 562). Through the data from
North Carolina, they found that tracking systems in schools are created through a variety of
policies, and while some schools increase the scope of tracking with co-requisites, in schools
10
without these requirements, students can be discrepantly tracked, accessing a high-track course
in their strong subject (p. 580-581).
In regard to selectivity in their sample of North Carolina schools, Kelly and Price (2011)
found that in social studies and English selectivity tends to be lower; however, it is not
uncommon for schools to have three or more levels of courses available in these subjects. Some
schools offer three or more levels of geometry, while 35% of schools offer four or more levels of
science courses. In the sample, other than three small “early college” schools that sent students
to community colleges for upper-level courses, all schools differentiated students into tracks in at
least some subjects (p. 572).
Kelly and Price (2011) also studied scope and electivity, noting that in a school where the
tracking system is high in scope, students are more likely to be enrolled consistently in high- or
low-track courses across all subjects. However, some schools use co-requisites, most commonly
in science, requiring students to take the same level of math and science courses. Almost all
schools in the study have some policies restricting enrollment in high track courses including test
score or grade minimums and teacher recommendations. Interestingly, the study also notes that
policies limiting electivity were used with similar frequency across subjects, with the exception
of upward mobility in mathematics, which was highly restricted (p. 573-574). These studies
determine that despite reports of detracking, all 128 schools in the sample engage in some form
of curriculum tracking. While there are differing policies to determine how students are placed
into various levels of classes, the tracking of students into varying class levels is a common
practice in most school systems. However, in the current school system, the explicit tracking
systems characterized by extremely high scope are not as prevalent as they were in the past.
11

While there are lower levels of scope, this study shows that the system has become more
complex. Policies have been created to limit course-taking opportunities (p. 579).
Although specifically we cannot compare today’s tracking system to that of the last
century due to the lack of research and data, the results of this study can be compared to Kelly’s
(2004) study of tracking policies in the 1997-1998 school year. The data collected in the 2011
study was compared to the previously collected data for 91 of the original 92 schools. The
comparison indicates that tracking policies have changed primarily on the dimension of
electivity. The prevalence of test and grade score requirements has increased in nearly all
subjects; however, the overall selectivity has not changed. While social studies is more highly
differentiated, English is less differentiated. This data does not show a change in the co-requisite
requirements affecting the scope of tracking systems (Kelly & Price, 2011).
LeTendre et al.’s (2003) study focuses on tracking as part of curricular differentiation and
student placement practices in public K-12 school systems. This study uses 1994-95 data from
the Case Study Project of the Third International Math and Science Study (TIMSS) to analyze
patterns of curricular differentiation in the United States, Germany, and Japan. The TIMSS
database provides detailed textual data that highlight national extremes, sub-patterns common to
various groups or regions, and inconsistencies between stated beliefs and observed actions of the
respondents. While the analysis shows that respondents to the TIMSS Case Study Project
expressed no single set of beliefs about tracking, types of differentiation where reported and
individual’s perceptions of the process of tracking in general were described (p. 48).
It is important to note that the LeTendre et al. study (2003) was not able to provide a
uniform definition of tracking; however, it did provide an overview of national patterns of school
organization and curricular differentiation noting that placement in differentiated secondary
12
tracks is determined by a wide range of procedures and processes. Movement between
secondary tracks is possible; however, there is a wide range of variation in difficulty, procedures,
and rates (p. 49). Without a uniform definition, the researchers identified five types of curricular
differentiation. Type 1 is based on school type, a form seldom practiced in the United States.
Type 2, also uncommon in the United States, is based on distinct within-school courses of study
that are common across a nation – such as electrical engineering courses in Japanese vocational
high schools. Type 3, the most common, is based on streams or tracks. For example, the
majority of U.S. students are given freedom of choice in choosing between a college preparatory
or vocational concentration. Type 4 differentiation, also common in the United States, is based
on ability grouping. Type 5 differentiation refers to a strong overlap between tracking and
socioeconomic status (usually overlapping with geographic location). Type 5 differentiation is
common in the U.S. insofar as district boundaries create high levels of segregation by socio-
economic status (SES), and SES is associated with course taking within schools as well. This
study describes the confusion among parents that the U.S. school system creates about how
curricular differentiation occurs. The study explains that some respondents believed that parents
could play a role in the placement of their child while others thought that parents were kept in the
dark, as teachers could only assign students to groups or classes based on previous grades (p.
65). LeTendre et al. (2003) point out that the case study data suggest that more affluent parents
are likely to try to influence their child’s educational opportunities in elementary school;
however, there is a high degree of variation from school to school and district to district in the
degree to which parents select their teacher or course placement at the secondary level. Kelly
(2004) also noted that there was little support for the idea that students of a high social class have
13
an advantage in math sequence placement because their parents are directly involved with the
placement process.
In “The 2013 Brown Center Report on American Education: How Well Are American
Students Learning,” Loveless (2013) includes a section entitled, “The Resurgence of Ability
Grouping and Persistence of Tracking.” The study examines the use of ability grouping and
tracking in America’s schools and focuses on surveys of ability grouping dating back to 1961
and NAEP data from 1990-2011. For the purpose of this study, we will focus on tracking at the
secondary level. Because tracking is a school level practice, the surveys were given to school
principals. In order to gather his data, Loveless looked at the NAEP surveys given from 1990 to
2011. While the wording of the survey varies somewhat from year to year, NAEP asks
principals, essentially, whether “students are assigned to classes based on ability so as to create
some classes that are higher in average ability or achievement than others.” Of the subjects
studied in NAEP, the most data is available for math, as it is surveyed ten times between the
eleven year span. While tracking in math dipped slightly in the 1990s and showed a small
increase in the 2000s, most fluctuations were too small to be considered significant. According
to Loveless (2013), this data shows about three-fourths of students attending tracked math
classes over the past two decades. The other subjects exhibit much less tracking than math. In
1990, principals reported that approximately 60% of students were tracked in English/Language
Arts (ELA); however, that number dropped to 32% in 1998. Tracking increased to 43% in 2003,
the last time the question was asked regarding that subject. Therefore, one cannot determine if
tracking endured and continued to increase in the 2000s. In looking at the subjects of science
and history, less data is found. While both subjects noted their highest figures in 1990, the data
indicates diminished tracking after that. It can be noted that for all subjects, the least amount of
14

tracking occurred between 1994 and 1998, which Loveless notes may be due to the detracking
movement. Loveless also mentions that the national patterns are consistent with studies of
California and Massachusetts. In those states, detracking was most intense in the early to mid
1990’s; however, mathematics classes seemed to resist the detracking movement. Table 1 shows
the percentage of students placed in a tracked class in eighth grade from 1990-2011 (Loveless,
2013).
Table 1: Tracking in 8th Grade (Percent of Students)
Year Mathematics English Science History
2011 76 - - -
2009 77 - - -
2007 75 - - -
2005 73 - - -
2003 73 43 - -
2000 73 - 26 -
1998 - 32 - 15
1996 71 35 21 -
1994 74 37 19 17
1992 73 50 - -
1990 75 60 29 29
Values reprinted from Brown Center on American Education, Loveless, T, 2013
15
According to Table 1, heterogeneously grouped classes became the norm in ELA,
science, and history. In fact, in 2009, a survey of Massachusetts schools with eighth grades
recorded 15.6% of schools offering heterogeneously-grouped classes in math; 49.2% offered
classes with two ability levels; and 35.2% offered three levels. However, in other subjects,
72.7% offered only heterogeneously grouped classes in ELA, 89.8% in history and 86.7% in
science (Loveless, 2013). While this data does show how tracking is being used, there are
limitations in looking at the national data. Although there is a significant amount of data for
mathematics, the data for ELA, science, and history is limited. One can look at the data from the
Massachusetts survey to understand that there are still schools using tracking while others are
minimizing it in various subjects; however, one cannot generalize how the remainder of the
nation is sorting students (Loveless, 2013). In fact, in Sean Kelly’s (2004) study on tracking
teachers, he notes that over 95% of schools use their teachers to teach different levels of classes,
thereby engaging in some type of tracking. While there is a pronounced difference in the
tracking data, it could be due to the methodology. Kelly looked at actual, official district policies
while the NAEP data relies on principal surveys. Principals may understand that tracking is not
a best practice, and therefore, social desirability may cause them to under-report the use of it in a
survey.
2.2 TEACHER’S PERCEPTIONS OF TRACKED STUDENTS
While detracking seemed to be a popular reform in education during the 1990s, with
heterogeneous grouping becoming the answer to the research that spoke out about the negative
impact of homogeneous groups, it seems that, presently, tracking still persists. According to
16
Loveless (2013), “Despite decades of vehement criticism and mountains of documents urging
schools to abandon their use, tracking and ability grouping persist-and for the past decade or so,
have thrived” (pg. 20). In this section, I provide a review of research on teacher perceptions
towards tracking as educational practice and differently tracked students. It is important to
understand how teachers perceive students in differently tracked levels. These perceptions can
influence lesson planning, assessments, and classroom environment. Furthermore, do teachers
have varying expectations of future outcomes for students in differently tracked levels? Finally,
how do teachers form their perceptions?
For decades, educational researchers have agreed that teachers’ opinions about students
can impact their educational growth. It was in 1968 that Rosenthal and Jacobson first presented
evidence regarding self-fulfilling prophecies in education. In fact, their argument contended that
students bring certain characteristics to the school context that are used by teachers as an
indication for their later educational success (Roesnthal & Jacobson, 1968). If this is the case, do
teachers form opinions about students based on the tracked level in which they have been
placed? In order to determine if teachers have biased opinions of differently tracked students, it
is important to look at the research regarding teachers’ perceptions of the act of tracking? Do
teachers hold poor expectations of success for lower tracked students? It is pertinent to
understand if teacher perceptions are affected by how a student is grouped academically before
they create their own expectations based on the student’s academic performance. However,
research on differential teacher expectations and perception in varying educational tracks is rare
(Kelly & Carbonaro, 2012). These questions are significant to the value of this study. It is also
important to understand how teacher perceptions and expectations are formed. Without a proper
17

understanding of teacher perceptions and expectations, raising standards will not benefit student
learning.
2.2.1 Teachers’ Perceptions of Tracking: Functional or Beneficial
Across the United States, secondary teachers teach varying levels of the same classes. A
teacher’s schedule may include three different levels of the same class including 9th Grade
English, College Preparatory 9th Grade English and Pre-Advanced Placement 9th Grade English.
In the math department, the same teacher may teach Algebra II and Advanced Algebra II.
Teachers can view these classes and levels in a variety of ways. Some teachers believe that
students may need more time to reach the same curriculum; others believe not all students are
capable of reaching the same standards, so the curriculum should be watered down. Regardless
of how the class is viewed, do teachers believe that selecting and sorting students is a relevant
strategy?
Some teachers view tracking as an efficient approach to meeting individual student
needs, in that, if all the students in the class are the same ability level, the teacher does not need
to spend excess time adapting instruction to meet the needs of specific students. In fact, many
teachers continue to support some form of tracking, not because they believe it will improve
student achievement, but instead, because it makes their jobs more manageable (Anasalone &
Biafora, 2004).
Other teachers believe tracking is important to help advanced students. Caughlan and
Kelly (2004) discuss the differences between a high and low tracked English classes noting a
18

teacher who argues that many of the kids in the regular class would hold back brighter students
in the advanced classes (p. 39).
Hallam and Ireson’s (2008) study compared the attitudes about tracking of teachers
teaching different subjects. These teachers teach low, high, or mixed ability classes in grades 7-9
in 45 secondary schools. The study found that teachers of mathematics and modern foreign
languages are more in favor of structured ability grouping than those who teach English or
humanities subjects.
English teachers responded to statements in favor of mixed ability teaching more
consistently than teachers in any other subject area, and math teachers disagreed most strongly
with most statements. In fact, when the teachers were asked if they thought their subject was
suitable for mixed ability teaching, the results indicated that while 80% of English teachers
agreed, only 18% of math concurred (Hallam & Ireson, 2008).
2.2.2 Teachers’ Perceptions of Student Academic Achievement in Low and High Tracked
Classes
For decades, studies have been completed on teacher expectations and perceptions of
students. In fact, Brophy and Good (1974) point out that several aspects of pacing, and of
student opportunity to learn are affected by teacher expectations, and Brophy (1985) argued that
“differential teacher treatment of intact groups and classes may well be a much more widespread
and powerful mediator of self-fulfilling prophecy effect on student achievement than differential
teacher treatment of individual students within the same group or whole class” (p. 309).
However, no one had empirically studied the possibility that there may be teachers who have
high or low expectations for all students in their classrooms (Rubie-Davies, 2006).
19
Kelly and Carbonaro (2012) argue that teachers and students respond poorly to low-track
classroom learning environments. The result is often classroom instruction that is less rigorous
and engaging for students, and ultimately, less rewarding for teachers. Their study indicates a
strong effect of track location on teacher expectations has been found, and students in the
academic and honors/advanced track are more likely to receive a positive response (Kelly &
Carbonaro, 2012). A study of teachers in a large urban district focusing on teachers’ perceptions
of students in lower tracks notes the discrepancy between teacher’s perceptions of high and low
tracked students.
Worthy’s (2010) study of 25 sixth grade teachers of “regular” and “honors” language arts
classes began as a study of instruction and materials in middle school language arts classes.
Although the interview protocol did not include questions about differentiation among students
or classes, teachers spoke about the distinctions between students in their two levels of classes.
Data was gathered from eight middle schools in a large urban district in Texas (Worthy, 2010).
Worthy (2010) used four characteristics to code the transcripts: differences in instruction
and environment between honors and regular classrooms, students’ behavior, work habits,
interest in learning, differential teacher expectations, and causes for regular students’ problems.
Only four out of 25 teachers supported the idea that homogenous grouping does not have to
mean deficient instruction for students in lower level classes. Teachers generally provide honors
classes with creative instruction and sophisticated materials giving freedom to work
interactively. Regular classes focus on isolated and basic skills and use simple materials. The
teachers require less work and make assignments and academic discourse less intellectually
demanding for regular classes (Worthy, 2010).
20
While Worthy (2010) found that teachers’ perceptions of students can be affected by the
student’s tracking placement, Harris (2012) examines how teacher expectations regarding the
implementation of academic standards promotes curriculum differentiation in middle schools. In
her findings, she argues that despite the fact that standards are supposed to promote equity, these
aims can be compromised by the contradictory expectations regarding standards. Harris’
analysis examines how the deficit beliefs among middle school teachers involved with America’s
Choice influenced the application of content standards. She specifically looked into how
teacher’s beliefs about students influenced the teaching of standards.
Harris (2012) worked with five middle schools located in urban contexts from the
northern and southern regions of the United States. Research teams interviewed teachers, school
administrators, guidance counselors, and school-level coaches who were responsible for
implementation of the design. The questions focused on various aspects of the America’s
Choice implementation and the use of standard-based curriculum and instruction over 3 years.
The analysis draws on approximately 270 teacher and school leader interviews (Harris, 2012).
Data was drawn from surveys and interviews, and case studies from the five middle schools were
studied in order to get insights about teacher beliefs and the role of standards within America’s
Choice Schools. While the information presented here concerns standard based curriculum,
some of the responses directly pertain to student levels. Some of the teachers attributed the
challenges they confronted to student IQ, home life, and culture. Although when surveyed about
whether they thought that most of their students could reach standards, 59% of America’s Choice
middle school teachers strongly or somewhat agreed with the statement (Harris, 2012), some
interview responses differed. One teacher noted, “I’m not really sure…They want us all to be
similar. I don’t know what they base the standards on. America’s Choice gives you a
21

curriculum, but it is impossible that they [the kids] will meet the standard because it’s no one’s
fault they just can’t because of IQ or home life or whatever. They have problems outside of
school larger than anything else I can imagine” (Harris, 2012, p. 137).
This study points out that while teachers can implement standards, they also vary their
expectations for students based on their perceptions about student academic preparation.
Although 67% of the teachers surveyed strongly or somewhat agreed they use the same criteria
to judge the quality of an assignment, 32% disagreed with this statement (Harris, 2012). In fact,
one teacher remarked, “Once I get a sense of where students are coming from, I assign grades
based on both quality and effort.” This relates to the perception that teachers expect students in
different levels to perform differently. Harris explains that deficit beliefs held by teachers about
students and their families can become an institutional barrier for expanding opportunities to
learn, stressing that, these perceptions of student capacity to achieve standards may lead to the
stratification of curriculum and instruction (Harris, 2012) thereby leading to a new form of
tracking.
2.2.3 Teachers’ Perceptions of Student Behavior in Low and High Tracked
Classes
VanHoutte, Demanet, and Stevens (2013) worked with 46 Flemish secondary schools
utilizing self-reported student measures and teachers’ evaluations of 6,545 students. Their study
examined if teachers’ evaluation of secondary school students’ cognitive capacity, effort in class,
and diligence in doing homework varied by track, and whether teachers’ perceptions are
informed by three variables. These variables include: typical students’ background features,
students’ resistance to school, and the label of students’ attendance in certain tracks. This study
22

found that school type appeared positively associated with the teachers’ evaluation of students’
effort in class. Students attending academic schools were perceived to be significantly more
diligent in doing homework by classroom teachers. (Van Houtte et al., 2013). This research
suggested that teachers who perceive students from lower tracks as less able, more disruptive and
less interested in schooling, compared to students in higher tracks, seem to adapt their pedagogy,
curriculum, and expectations in line with those perceptions. Therefore, lower track students’
efforts eventually are estimated higher than those of higher track students.
According to Kelly and Carbonaro (2012), low track students are frequently inattentive
and disruptive. It is also noted that both teachers and students respond poorly to low-track
classroom learning environments. Classroom instruction becomes less rigorous and engaging for
students and less rewarding for teachers (Kelly & Carbonaro, 2012). Indeed, the study describes
how behavior varies for the same student in different classrooms, depending on the track level of
the class. For example, Kelly and Carbonaro explain, “They behave like college students in high
track classes (where such behavior is normative), but they adjust their behavior “downward” in
lower track classes” (p. 276).
2.2.4 Teachers’ Future-Expectations of Students in Varying Tracks
Teachers can develop expectations about a student’s future based on a variety of student
characteristics. Much like the expectations that teachers have concerning student performance in
the classroom, teachers can carry over those expectations regarding students’ future plans.
Lesson-plans, classroom discussions, and teacher student interactions can develop based on those
expectations.
23
In Caughlan and Kelly’s (2004) study regarding the effects of tracking in two English
classes, they observed one teacher teaching two different tracks of English classes. The study
tracks the time Mrs. Vernon spends on “linking literature to life.” In the high track classes, she
spent 12 minutes and 42 seconds discussing the future while she only spent 25 seconds
discussing the future in the low track classes. When asked about it in the follow up interview,
she expressed statements using high degrees of certainty. In describing the high-track students’
success in college, she showed confidence in their ability to succeed; however, when discussing
the future of the low-track students, she seemed uncertain, using phrases like, “boy, I worry
about them” and “I can see some of them going to a junior college” (Caughlan and Kelly, 2004,
p. 51).
In “Curriculum Tracking and Teacher Expectations: Evidence from Discrepant Course
Taking Models,” Kelly and Carbonaro (2012) examined curriculum tracking and teacher
expectations specifically related to students who are discrepantly tracked. Kelly and Carbonaro
(2012) used data from NELS, a large national representative longitudinal study from the United
States of the graduating class of 1992 to focus on students with discrepant track placements and
determine how different teachers evaluate the same student. The sample consisted of the eighth
grade panel with teacher-reported track and expectations data and achievement and grade data at
the student level encompassing 15,357 teacher reports. Of the student reports, 5,852 students
had reports from two teachers. The analysis looked at two areas: establishing the effects of
tracking on teacher expectations in conventional regression models and examining the effects of
within student differences in tracking on teacher expectations using multilevel models (Kelly &
Carbonaro, 2012).
24

Results of this study show that approximately 90% of high-track teachers expect their
students to go to college while only 40% of low-track teachers mirror those expectations.
However, this varies from the students’ perspective, in that, 96.4% of higher track students
expect to attend college, and 74.8% of regular track students report expected college attendance
(Kelly and Carbonaro, 2012).
2.2.5 Formation of Teacher Expectations
While expectations can be derived from a variety of influences such as commonly held
stereotypes or cultural models, it is easy to imagine that several students in class might be
deemed to be poor achieving regardless of their actual performance, simply because they are in a
low-track class. Expectations that lower track students are unlikely to achieve academically
could potentially set these students up for failure from the start. Supporters of this viewpoint
argue that teachers generally hold limiting expectations for students in lower educational tracks
(Wheelock, 1992).
Family socioeconomic status/gender/race/ethnicity affect teacher expectations (Kelly &
Carbonaro, 2012), and track placement is positively correlated with socioeconomic status (Epple,
Newlon, & Romano, 2002); therefore, if a teacher creates positive expectations based on higher
socioeconomic status, she could create negative expectations about lower tracked students based
on the number of students in a lower socioeconomic bracket.
Other factors that affect expectations include status that can be accompanied with track
levels. Caughlan and Kelly (2004) argue that tracking provides students with a powerful
institutional identity. Teacher’s expectations regarding abilities and preferences of two differing
groups can be linked with the official status assignments of the students.
25

2.3 MINDSET AND LEARNING
Is it practical and unproductive to keep trying to educate students when they struggle?
Instead of assuming that they will learn with extra time and effort, many educators teach a
watered down curriculum to students who are assumed to be a lower ability level. Teachers who
are unaware of the advances in neuroscience regarding malleability of intelligence often believe
students’ intelligence is fixed, and they view struggles as failures instead of struggling as a
critical part of learning. Yet, research clearly shows that students can learn more with persistent
effort from those who educate them (Dweck, 2006).
If teachers have a fixed mindset, this could be detrimental to students. When people hold
a fixed mindset, they tend to quickly form judgments of others (Molden, Plaks, & Dweck, 2006).
Because they believe traits are fixed, once they have labeled or stereotyped a group or an
individual, they tend to disregard information that runs counter to their beliefs (Plaks, Stroessner,
Dweck, & Sherman 2001).
The studies of personalities and attitudes toward learning have shaped educators beliefs
for decades. Mindsets, according to psychologists, are people’s basic beliefs about the nature of
human attributes, such as intelligence or personality (Dweck, 2012). Some people believe that
these attributes are fixed traits, in that, a person has a fixed amount of intelligence or a certain
personality, and that cannot be changed. Those with a fixed mindset, or entity theory, believe
these ideas. However, others with a growth mindset, or an incremental theory, believe that all
people can become substantially more intelligent, and that anyone can develop their personality
over time (Dweck, 2012).
In conjunction with Dweck’s theories of intelligence, it is important to note Covington
and Beery’s (1976) self-worth theory that assumes that the highest human priority is the search
26

for self-acceptance, and that one’s worth often comes to depend on the ability to achieve
competitively (Covington, 1998). The premise of this theory is that one’s sense of worth is
directly linked to one’s accomplishments; therefore, unless a person is successful at something of
value, he or she “will be cut off from a major source of self-esteem” (Covington, 1984, p.8).
Covington (1984) also notes that effort is directly related to self worth, in that, strong effort is
sometimes rewarded and is recognized as a necessary component of successful performance.
Describing effort as a “double-edged sword,” (p. 10) Covington explains that while effort in
school is necessary to avoid teacher punishment, it can put students at risk because “a
combination of high effort and failure also leads to suspicions of low ability” (p. 10).
The research of Covington and Dweck intersect at this point in looking at how students
face failure. Covington (1984) indicates two self-serving strategies to avoid failure including
excuses and the assurance of success. These strategies specifically include not studying,
responding vaguely, not trying, asking questions whose answers are already known, and copying
from another student’s paper. Dweck (2006) explains that fixed mindset people see failure as an
indictment of their personal stupidity and incompetence. Therefore, those with a fixed mindset
may give up easily, avoid obstacles, and are more likely to consider cheating.
Students’ implicit theories of individual (not social) intelligence predict their academic
performance over time, and this, specifically, can be seen when the students face challenging
work (Blackwell et al., 2007). Students with a growth mindset tend to look for opportunities to
learn, develop learning strategies, and look for assessments of their weaknesses in order to
develop them (Dweck, 2006).
Experiments in intervention have also shown that changes in theories of intelligence can
affect academic behavior over a period of time. Blackwell et al. (2007) assessed middle school
27

students’ mindsets before they transitioned from elementary school to middle school and then
tracked their math performance for the next three years. At the end of the eighth grade year,
students who initially held a malleable mindset performed 5% better on average on a
standardized math exam than those with an initial fixed mindset (Blackwell et al., 2007).
Aronson, Fried and Good (2002) completed a study with an incremental theory treatment
group. They provided students in this group with scientific information concerning brain
functions and potential malleability, and they taught them that the brain grows stronger and
smarter by forming new connections. The treatment was compared to two control groups. The
first control group was taught the idea that different people have different intellectual strengths,
so people should not worry about performing poorly in a certain area. The second control group
was simply monitored over time. Upon comparing the three groups, the incremental theory
group showed a significant increase of overall grade point average at the end of the year of
approximately .23 grade points (Aronson, Fried and Good, 2002).
Good, Aronson, and Inzlicht (2003) examined two groups of seventh grade students. The
first group received a series of weekly mentoring e-mails over a period of one school year
explaining that a student holding an incremental theory would perform better on the statewide
achievement tests at the end of the year. Comparing that group of students with students
randomly assigned to a control group, students in the incremental group showed significantly
higher math and verbal achievement test scores. In fact, on the math portion of the test, middle
school girls’ scores were improved by more than one standard deviation in comparison to the
control group that did not learn an incremental theory of intelligence (Good et al., 2003). Noting
the evidence that mindset does affect learning, it is important to know if one person’s mindset
can affect the learning of another person.
28
2.3.1 Educator’s Mindsets
Anne Gutshall (2013) examined the extent to which there is a relationship between
teachers’ general views about the stability of ability and the stability of hypothetical students’
ability given a series of specific scenarios. Gutshall’s participants were teachers from a large
school district in the southeastern United States, who she recruited by attending faculty meetings
and asking for voluntary participation. The 238 teachers who completed the survey were then
asked to read one of four student scenarios detailing a student who was struggling in school in
specific areas but who also had positive attributes. The students in the scenarios were either
male or female and either had or had not been recently diagnosed with a learning disability. All
teachers were administered an initial paper-and-pencil survey that included the three-item
mindset scale created by Henderson and Dweck (1990). The percentage of teachers with a fixed
mindset, growth mindset, or no mindset was then calculated using the method created by
Henderson and Dweck. In this sample, 12.1% of teachers demonstrated no clear mindset, and
they did not participate in the scenario conditions (Gutshall, 2013).
After determining teacher mindset, teachers were asked to read one of four student
scenarios detailing a student who was struggling in school. The hypothetical scenarios consisted
of difficulty grasping main concepts and poor classroom assessment or poor classroom
assessments and failing grades. The students also had positive attributes such as leadership skills
or eagerness. Finally, the students were noted as having been recently diagnosed with a learning
disability (Gutshall, 2013). The Teachers were then asked to rate the students on three questions,
which were almost identical to the questions used to determine mindset but this time specific to
the student in the scenario, using a scale from 1 (strongly disagree) to 6 (strongly agree). An
29

example of the question follows: “Michael may be able to perform better in school; however, his
real ability will not change.”
After removing the 29 participants with no discernible theory regarding the stability of
intelligence, 209 respondents remained. Of the 209 remaining subjects, 70.3% exhibited a
growth mindset, and 29.6% showed a fixed mindset on the initial survey. Next, the mindset
scores were tabulated for the four different scenarios. Comparing the initial mindset scores to
teachers’ responses about specific students in the scenarios, it was found that teachers were about
equally likely to have a growth mindset when responding to a scenario as on the initial
questionnaire. However, some of the teachers who demonstrated a fixed mindset on the initial
questionnaire exhibited no defined mindset after reading the scenario. In examining the ratio of
fixed versus growth mindset, results indicate that teachers share characteristics similar to the
general population, and in comparing teachers’ initial mindsets with teachers’ mindsets for
scenarios, it was found that they were highly correlated (Gutshall, 2013).
While the findings of this research suggest that classroom teachers’ mindset views may in
fact remain the same in spite of learning disability, status or gender, the study is limited by
homogenous geography, in that, all teachers were from one school district. In this district, males
with disabilities outnumber females with disabilities two to one. This sample was also limited by
the voluntary nature of the study. Another limitation is the hypothetical scenarios. There was
also a procedural change identified in the method’s section, in that, the first set of teachers were
given two surveys, and only one was used for data analysis. This may have caused the
participants to be influenced by the information on the first survey (Gutshall, 2013).
Another study focusing on fixed and malleable intelligence looks at the question, “can
comforting struggling students demotivate them and potentially decrease the pool of students
30

pursuing math-related subjects?” In order to answer this question, Rattan, Good, and Dweck
(2012) completed four studies (Rattan et al., 2012).
In Study 1, 41 undergraduates at a competitive private university on the West coast
completed an online study about math education that started with a “general math attitudes”
survey. The participants were asked to agree or disagree with four statements that portrayed
math ability as fixed. While in Study 2, 95 undergraduates at a public college on the East coast
first read an article that manipulated implicit theories of math intelligence. The article presented
expert evidence indicating that math intelligence was either fixed or malleable. Following the
article they read the scenario described in Study 1, assuming the role of a 7th grade math teacher
about to meet with a student who scored 65% on the first test of the year. In this study, gender
was also manipulated. Participants indicated how they would respond to the student using a 7-
item index measuring the degree to which they would choose to comfort students for their low
ability and enact potentially unhelpful pedagogical practices. Participants in both Study 1 and
Study 2 were compensated through either course credit or pay (Rattan et al., 2012).
Study 3 addresses the same questions as Study 2; however, the participants were 41
graduate students who were instructors or teaching assistants at a competitive private university
on the West coast. All participants were Ph.D. candidates in a math related field. Participants
completed the 4-item implicit theories of math intelligence measure described in Study 1
followed by an 8-item questionnaire asking about their attitudes towards teaching. Students were
given another scenario adapted to the undergraduate teaching context. Again, participants were
compensated with pay (Rattan et al., 2012).
In Study 4, comfort-oriented feedback was compared to feedback more focused on
concrete strategies and control feedback that contained only the statements of support present in
31

all three conditions. Fifty-four students at a competitive private university on the West coast
completed an online study in which they imagined being in a calculus course, and they read
scenarios regarding differing types of feedback (Rattan et al., 2012).
The results in studies 1-3 indicated that instructors holding an entity (fixed) theory of
math intelligence more readily judged students to have low ability than those holding an
incremental (malleable) theory. Studies 2-3 also revealed that those holding an entity theory
were morel likely to both comfort students for low math ability and use “kind” strategies
unlikely to promote engagement with the field. This could mean assigning less homework. In
Study 4, students responding to comfort-oriented feedback not only perceived the instructor’s
entity theory and low expectations, but also reported lowered motivation and lower expectations
for their own performance. While the information resulting from this study is compelling, the
study itself is limited due to the hypothetical scenarios (Rattan et al., 2012).
Moving from a very broad perspective, looking at groups of students, to a singularly
focused case study of one middle school student, Kathleen Collins (2013) spent approximately
700 hours collecting data on Jay, a middle school student identified as learning disabled.
Through interviews, video and audiotaping, observations and field notes, and textual and graphic
artifacts, Collins gathered information on an African American boy living in a predominantly
white, rural community. Collins’ aim was to connect her work to recent research into the
overrepresentation of minority students in special education and explore social stereotypes in
determining how some students are identified as “disabled.”
Jay’s classroom teachers indicated failing grades in every academic subject; however,
state-mandated achievement tests rated his reading score as moderate. Collins (2013) remarks
that despite invitations to consider evidence of several positive performances, Laura, his teacher,
32
still responded to Jay as though he were less than capable. Collins conceptualizes ability
profiling as responding to a student as though he is disabled, or reading all of his actions and
interactions through a lens of deficiency (Collins, 2013). Collins notes in her findings that
Laura’s expectations for Jay’s contributions were so low, that she did not listen to him fully.
Because she had identified him as learning disabled, she viewed him in this light, and therefore,
treated him differently. Jay had moved to this school from another community; therefore,
Collins remarks, this caused Laura to look at him as an outsider. As a result, he was looked upon
as different, and due to the possible identification of a learning disorder, he is excluded from the
classroom community. However, Collins also notes that in other contexts, where he was not
positioned as an outsider, he participated successfully. Upon reflection of her study, Collins
asserts, “I had hoped that one of its outcomes would be Laura’s recognition of the ways in which
she contributed to Jay’s demonstration of [dis] ability by designing learning contexts that did not
allow him to use his intellectual and interactional strengths.” She hoped that this change would
result in a positive representation of Jay and the withdrawal of the referral for a special education
assessment; however, this was not the case (Collins, 2013).
Collins’ approach to the organization of the case study is a narrative analysis. While
Collins does thoroughly explain her methods, also including interview questions and tools,
noting her triangulation and analysis, Collins’ seems too close to the research which may skew
her views. She even notes, “My teacher sensibility clashed with my researcher sensibility on
more than one occasion during this work, and these tensions are made visible throughout the
narrative” (Collins, 2013).
Teachers’ attitudes and mindsets can certainly affect individual students, but the negative
stereotypes may disrupt more than performance (Good, Rattan, & Dweck, 2012). Many people
33
use the phrase, “I’m not a math person,” to explain the reason that they do not do well in math.
It is as if math is a special talent that only a few special, chosen people are blessed to obtain. In
fact, this fixed nature of math ability can be extremely evident in the mathematics community,
where there is a “talent-driven approach to math” (National Mathematics Advisory Panel, 2008).
Due to these beliefs, research has shown that students can turn away from challenges that might
undermine their belief that they have high ability (Nussbaum & Dweck, 2008).
Good, Rattan and Dweck (2012) tested and supported the hypotheses that students’ sense
of belonging can predict their desire to pursue math in the future, and two messages women may
hear in their math environments—the messages that math ability is a fixed trait and that women
have less of this ability than men—may work together to erode women’s sense that they belong
in math which could affect their desire to pursue math in the future. This study took place at a
highly selective university in the Northeast United States, where participants, including 471
males and 534 females completed the Sense of Belonging to Math scale as well as other
measures during their calculus course. This scale was completed three times throughout the
course. Furthermore, it is important to note that the average SAT score was 720 for males and
705 for females indicating that this sample represents students with a high skill level in math
(Good et al., 2012).
Findings indicated that the males’ sense of belonging was significantly greater than
females’ sense of belonging at the time of the second completion of the scale. The study showed
that although a women’s initial sense of belonging did not predict a later desire to continue in
math, the reduction in the women’s sense of belonging over time did predict lower intentions to
pursue math in the future. However, for males, none of the variables emerged as significant
factors to predict intentions to take math in the future (Good et al., 2012).
34
The study found that the more women perceived their math environments to convey
either a high degree of stereotyping or a fixed view of math intelligence; the lower was their
sense of belonging. This shows that women’s perceptions of their learning environment can
impact their sense of belonging but also, importantly, that their sense of belonging to math can
have real consequences for their career aspirations and achievement (Good et al., 2012).
2.4 RESEARCH QUESTIONS
While there is no modal policy, in either the U.S. or abroad, on how students are tracked,
it remains a common form of curricular organization. Students are being tracked into different
levels according to teacher recommendation, previous grades, standardized test scores, parent
and student choice. While some schools allow students to move between tracks, others require
students to remain in one track for all classes. It is evident that tracking is commonplace;
however, while there are commonalities between each type of differentiated placement, the
guidelines are at the discretion of the local school district. Studies found teachers who perceive
students from lower tracks as less able, more disruptive and less interested in schooling
compared to students in higher tracks, seem to adapt their pedagogy, curriculum, and
expectations in line with those perceptions (Kelly & Carbonaro, 2012). Teachers freely
discussed lowered expectations and watered-down instruction of students in regular classes
(Worthy, 2010).
The teacher has a central role in establishing a supportive classroom environment, and the
teacher’s attitude (shown by tone of voice, comments), enthusiasm, and interest in the subject
affect learners directly and indirectly (Dent & Harden, 2001). Moreover, teachers vary in
35
supportive practices, with the same student reporting substantially different levels of support
from different teachers (Kelly & Zhang, 2016). Teachers’ views about how students learn, their
mindset towards intelligence and achievement growth, may differ substantially across tracked
classrooms.
To address this issue, this study proposed three research questions. Research Question 1:
How are students tracked in the 21st Century United States educational system? In school
systems were tracking is prevalent, exploring the rationale behind how each student is placed
into a different tracking level may provide direction behind teacher expectations for student
success. In order to explore this inquiry, the teacher survey included questions on the survey
about the method used for student placement into different tracking levels. The researcher also
conducted interviews with teachers exploring this issue.
Research Question 2: How do teachers’ perceptions of student achievement, behavior,
and future plans vary between low and high tracked classes? To look into this query, the
researcher conducted observations of teachers instructing in low-tracked classrooms.
Observations focused on questioning techniques in class. Time spent on student-centered
activities compared to time spent on teacher-centered activities. The researcher also logged the
amount of time students worked on higher order thinking skills as compared to activities
requiring lower ordered thinking skills. Semi-structured interviews were conducted, and
transcriptions of the interview provided qualitative data for analysis.
Research Question 3: How does a teacher’s mindset affect instruction? In order to
address this question, participants completed a survey to determine the extent to which they
exhibited fixed mindset characteristics. Interviews were also conducted in order to obtain
qualitative data. The researcher observed the teachers instructing low tracked students and
36

focused on the rigor level of asked questions, the time spent on teacher-centered tasks compared
to student-centered tasks, and the rigor level of the activities in class.
37
3.0 RESEARCH METHODOLOGY
3.1 INTRODUCTION
This study explored teachers at two schools and how their mindset affects their planning,
instruction, assessing, and student learning in low tracked classes. In order to determine to what
extent a teacher exhibits fixed mindset characteristics, they were given a survey. The teachers
were observed and interviewed. To begin the research for this study a consent form with a
description of the study was sent to the superintendents of two school districts in western
Pennsylvania. Upon their consent, an application was submitted for IRB approval. Following
approval from the IRB, the researcher reached out to the principals of the two high schools to
secure times to complete the research. This research consisted of surveys, interviews, and
observations.
Responses were gathered from a survey of high school English and math teachers from
two high schools in Western Pennsylvania. The School in District A hosts a population of 1270
students. There are approximately 22* high school math and English teachers in the district. The
School in District B is made up of 590 students, with 14 math and English teachers in the high
school.
* The exact faculty size has not been reported in order to protect confidentiality.
38

Following analysis of the survey, the researcher began scheduling observational visits in
twelve classrooms. In order to get a full analysis, the researcher scheduled observations with six
classroom teachers in District A and six classroom teachers in District B. Each class was
observed twice, and six courses were chosen to move on to the next step.
The interview process consisted of six semi-structured interviews taking place in the
teachers’ classrooms. To cover all areas, three English courses and three math courses were
represented, and three teachers were chosen from school A along with three teachers from school
B. Following the interview, the transcripts were analyzed and coded. Table 2 presents the
approach to answering each research question listing the method, analysis, and interpretation.
39

Table 2: Research Matrix
Research Question Method Analysis Interpretation
How are students tracked in the 21st Century United States educational system?
Survey, Interviews
• Survey Items: 13-18 – Frequency Distribution
• 13-16 - Likert Scale 1=None, 2= A Few, 3=About half, 4= More than half but not all students, 5=All or almost all students1
• 17 – Likert Scale 1=Never, 2= Very Rarely, 3= Rarely, 4=Occasion-ally, 5=Very Frequently, 6= Always
• 19 – Open Ended • Interview questions 8-10
• Survey Items – Often/AtT– determine how students are placed in tracking levels
• Interview – themes and patterns will be used to determine coding
• Questions 8-10 will determine how a specific school tracks students.
How do teachers’ perceptions of student achievement, behavior, and future plans vary between low and high tracked classes?
Interviews, Observations
• Interview questions 1-7 • Observations • Questioning Techniques in class –
Webb’s DOK • Time on Task – Amount of Time
teacher talks vs. amount of time student talks
• Amount of time student is working on higher order thinking skills vs. lower order thinking skills –Webb’s DOK
• Interview – inductive coding looking for themes and patterns
• Webb’s DOK – 1 or 2 – lower order thinking 3 or 4 – high order thinking skills
How does a teacher’s mindset affect instruction?
Survey, Interviews, Observations
• Survey • Items 1-12 – fixed mindset –
frequency distribution • Questions 1, 4, 8, and 11 –
distractors • Likert Scale 1=Strongly Disagree to
6=Strongly Agree • Interview Questions 1-7 • Observations • Asked Questions – Webb’s DOK • Time on Task – Amount of Time
teacher talks vs. amount of time student talks
• Amount of time student is working on higher order thinking skills vs. lower order thinking skills –Webb’s DOK
• Survey Items 1-12 fixed mindset frequency distribution
• Interview – themes and patterns will be used to determine coding
• Teacher expectations based on the number of questions asked from each level 1-4
• Webb’s DOK – 1 or 2 – lower order thinking skills 3 or 4 – high order thinking skills
• Activities – Teacher expectations based on types of activities
40
3.2 DATA COLLECTION AND ANALYSIS
3.2.1 Participants
The identified population included highly qualified teachers at the high school level from
two school districts in western Pennsylvania. There are 125 teachers employed in the high
schools of the two districts. This sample of convenience was chosen from two districts where
the researcher had easy access to speak with and observe the teachers employed within the
district. The identified sample included all math and English teachers within the two districts.
Math and English teachers were targeted in response to findings that math teachers tend to favor
structured ability grouping while English teachers tend to prefer mixed ability grouping (Hallam
& Ireson, 2008). The survey was distributed to 37 teachers. Of the 37 teachers identified for the
sample, there were 19 English teachers and 18 math teachers. Three of the English teachers and
four of the math teachers also identified as special education teachers. The survey resulted in an
89% response rate consisting of responses from 15 English teachers and 18 math teachers.
Selected participants were also observed and interviewed. Of the teachers who responded to the
survey, six English teachers and six math teachers were selected to participate in observations.
Of those teachers selected to be observed, four English teachers and three math teachers
participated in the interview process.
3.2.2 Survey
The researcher scheduled time with the principals of each building to meet with the
English and math teachers to explain the survey. Each teacher received a participant letter about
41
the study and a copy of the survey. The teachers were given time to complete the survey, and
some chose to complete it at that time while others chose to submit it at a later date. The
researcher gave the teachers a week to complete the survey. Two days before collecting the
remainder of the surveys, the researcher contacted the teachers a second time by e-mail. This e-
mail contained a copy of the participant letter and a copy of the survey. This was intended to
reach teachers that may have misplaced the survey or were unable to attend the first meeting. To
evaluate the extent to which the teachers exhibited fixed mindset characteristics, a survey was
used. This survey has its roots from Carol Dweck’s Mindset Assessment Profile Tool (Dweck,
2006) as well as consultation from experts in the field. This short survey included 20 questions.
The first section consisted of 12 questions and focused on determining the mindset of the
teacher. In the survey, eight questions were adopted from Carol Dweck’s studies, and four
questions were used as distractors.
The second section of the survey asked the teachers to think about a specific class period.
The class periods were intentionally chosen to be the lowest tracked class in each teacher’s
schedule. The questions focused on how students were placed in the focal class and how often
students moved between academic levels. Teachers also used the survey to indicate their
willingness to participate in an interview about lesson planning.
3.2.3 Independent Variables: Mindset Variables
Each participant was given a Mindset profile and answered the questions according to
their own opinion. The Mindset profile was derived from Dr. Carol Dweck’s Mindset
Assessment Profile Tool with consultation from experts in the field. This survey had originally
been created to determine if a student/educator exhibits a growth mindset or a fixed mindset;
42

however, upon review of the original survey, it was noted that educators may have chosen
answers that they felt were “correct,” in that, educators are becoming more aware of the idea of
growth and fixed mindsets. Many educators may believe that a growth mindset is a more
desirable trait, or people expect educators to have a growth mindset; therefore, when the
participants answered the survey questions, the results may have been skewed. In order to
account for social desirability bias in this research, the survey questions were revised to
determine the level to which a person exhibits fixed mindset characteristics. Everyone exhibits
some level of fixed mindset qualities, so the questions from the survey were chosen to determine
if each participant showed more or less fixed mindset tendencies. Eight questions were chosen
based Carol Dweck’s Mindset Survey, and four questions were chosen as distracters. These
questions related to differentiation and grit; however, they were not directly related to mindset.
Upon completion of the Mindset survey, participants’ scores for the eight questions were
averaged. Each score was then matched to a descriptor corresponding with Dr. Dweck’s Mindset
survey. A person with a mindset score falling between five and 6 generally believes that
intelligence is fixed—it does not change much. A person who strongly believes intelligence is
fixed, believes that if one cannot perform perfectly, he would rather not do something. People
scoring in this range tend to believe that smart people do not have to work hard. If a person’s
score falls between 4 and 4.9, the person leans toward thinking that intelligence does not change
much with outside influence. He prefers not to make mistakes if he can help it and believes that
learning should be easy. A person with a score falling between 3 and 3.9 is unsure about
whether a person can change her intelligence. This person cares about performance, but she may
not believe one should have to work too hard for it. A person who has a score that falls between
2 and 2.9 believes that one’s intelligence is malleable. This person tends to believe that it is
43

more important to learn than to always perform well. Finally, if a score falls between 1 and 1.9,
the person exhibits a growth mindset, believing that the best way to learn is to work hard, and
that making mistakes leads to learning.
3.2.4 Independent Variables: Tracking Variables
The aim of this study was to determine how teacher mindset affects students in low
tracked courses. In order to study the effects of teacher mindset in these courses, it is important
to determine how students are tracked in each school that was studied. As part of the survey,
participants were asked to think about a specific class, the lowest level class on their schedule.
The questions focused on how students are tracked into these classes. The survey collected
teacher perceptions of how often students were tracked by standardized test scores, previous
grades, teacher recommendations, and student choice. There were also questions concerning
how often students moved up or down a level and how often students were discrepantly tracked.
3.2.5 Observations
The researcher chose classroom observation participants based on the teacher’s
willingness to participate in an interview. Upon completion of the survey, it was determined that
18 teachers, made up of 9 English and 9 math teachers, were willing to participate in the
interview process. The researcher chose six English teachers and six math teachers to
participate. In addition to focusing on subject, the researcher also looked at teaching placement,
in that, six teachers were chosen from each research site. Because this research is focused on
teachers and students in low-tracked classrooms, the researcher chose to observe the lowest
44
academically tracked classes. Finally, the researcher looked at mindset score and chose the
teachers teaching the lowest tracked classes and exhibiting the most fixed mindset characteristics
based on their survey score. The classroom observations focused on time spent on various tasks,
questions asked by the teacher, and questions answered by the students. Teachers and students
were observed engaging in classroom activities, and the time spent on each activity was
recorded. The type of activity (teacher centered vs. student centered) was noted, and the rigor of
each activity was analyzed according to Webb’s Depth of Knowledge. In addition, specific
teacher and student questions were examined for rigor and coded according to Webb’s Depth of
Knowledge.
Dweck notes that great teachers set high standards for all students. One way to look at
the standard of expectations set in a classroom is to determine the level of rigor presented in the
classroom. This study uses Webb’s Depth of Knowledge to analyze the rigor of activities and
questions presented in each classroom. The Depth of Knowledge (DOK) of an item refers to the
cognitive demands and complexity required by an item, and it describes the connections and
level of reasoning that the item requires a student to make when providing a response to an
assessment item (Webb, 1997). The DOK level does not refer to how easy or difficult and
assessment item is for students. Though the assessment item may be difficult for students to
answer, it may require a low level of cognitive processing. DOK levels do not change if the
population changes; the fact that the item may be harder for students of differing abilities does
not change the level of the item (Wyse and Viger, 2011). Webb’s alignment of the DOK levels
is separated into four distinct levels as seen in table 3.
45

Table 3: Webb's Depth of Knowledge: Activities Sorted by Rigor
Level One Activities Level Two Activities Level Three Activities Level Four Activities
Recall elements and details of story structure, such as sequencing of events, character, plot and setting. Conduct basic mathematical calculations. Label locations on a map. Represent in words or diagrams a scientific concept in a relationship. Perform routine procedures like measuring length or using punctuation marks correctly. Describe the features of a place or people.
Identify and summarize the major events in a narrative. Use context clues to identify the meaning of unfamiliar words. Solve routine multiple step problems. Describe the cause/effect of a particular event. Identify patterns in events or behavior. Formulate a routine problem given data and conditions. Organize, represent and interpret data.
Support ideas with details and examples. Use voice appropriate to the purpose and audience. Identify research questions and design investigations for a scientific problem. Develop a scientific model for a complex situation. Determine the author’s purpose and describe how it affects the interpretation of a reading selection. Apply a concept in other contexts.
Conduct a project that requires specifying a problem, designing and conducting an experiment, analyzing its data, and reporting results/solutions. Apply a mathematical model to illuminate a problem or situation. Analyze and synthesize information from multiple sources. Describe and illustrate how common themes are found across texts from different cultures. Design a mathematical model to inform and solve a practical or abstract situation.
Information reprinted from “Webb’s Alignment Tool” by Webb, N, 2006
3.2.6 Interviews
The researcher conducted interviews in order to obtain information concerning how
students are placed in different tracking levels and information about how each teacher planned
for differently tracked levels. Interviews were completed with teachers that agreed to participate
via the initial survey. Observations of twelve different classes were conducted, and the
researcher interviewed the teachers of six of those classes. The interviews were made up of
46

teachers of three math classes and three English/language arts classes. One of the math classes
was co-taught and one of the English/language arts classes was co-taught. The teachers of the
co-taught classes were interviewed together. In analyzing the mindset scores of the interviewed
teachers, five teachers scored between a 2 and 2.9, and 3 teachers scored between 3 and 3.9. A
person with a score falling between 3 and 3.9 is unsure about whether a person can change her
intelligence. This person cares about performance, but she may not believe one should have to
work too hard for it. A person who has a score that falls between 2 and 2.9 believes that one’s
intelligence is malleable. This person tends to believe that it is more important to learn than to
always perform well. The questions for the interview were established to coincide with the
original research questions. The researcher used the Just Press Record App to record the
interviews, and the app transcribed the interviews as well. The researcher also took notes during
the interviews. Following the interview, the researcher listened to the interviews and updated the
notes.
In the initial stage, the research read the interview notes. The next stage consisted of
listening to the interviews again adding extra details to the notes. The third stage consisted of
creating a chart with the research question, the interview question that corresponded to it, and a
list of main points from each interviewee’s answers. All transcripts were read and the notes were
organized in a chart. The chart consisted of the original research questions along with the
interview questions that coincided with them and the main points from each interview. The
researcher then looked for commonalities among the answers.
The interviewer asked questions that focused on planning, assessment, and activities in
the focal class that the teacher answered questions about in the survey. The interviewer also
asked about the differences between high and lower level tracked students, lesson planning, and
47

the differences between planning and presenting for each tracked level. Worthy’s (2010) study
of ability grouping employed interviews of 25 sixth grade teachers of “regular” and “honors”
language arts classes. According to the study, despite not asking any questions about ability
grouping or differentiation, this became the subject of the interviews. Upon coding the
interviews, the researcher found the following four categories to be significant: (a) differences in
instruction and environment between honors and regular classrooms; (b) students’ behavior,
work habits, and interest in learning; (c) differential teacher expectations; and (d) causes for
regular students’ problems (Worthy, 2010). This study employed the use of the same categories
in order to analyze the participant’s answers.
48
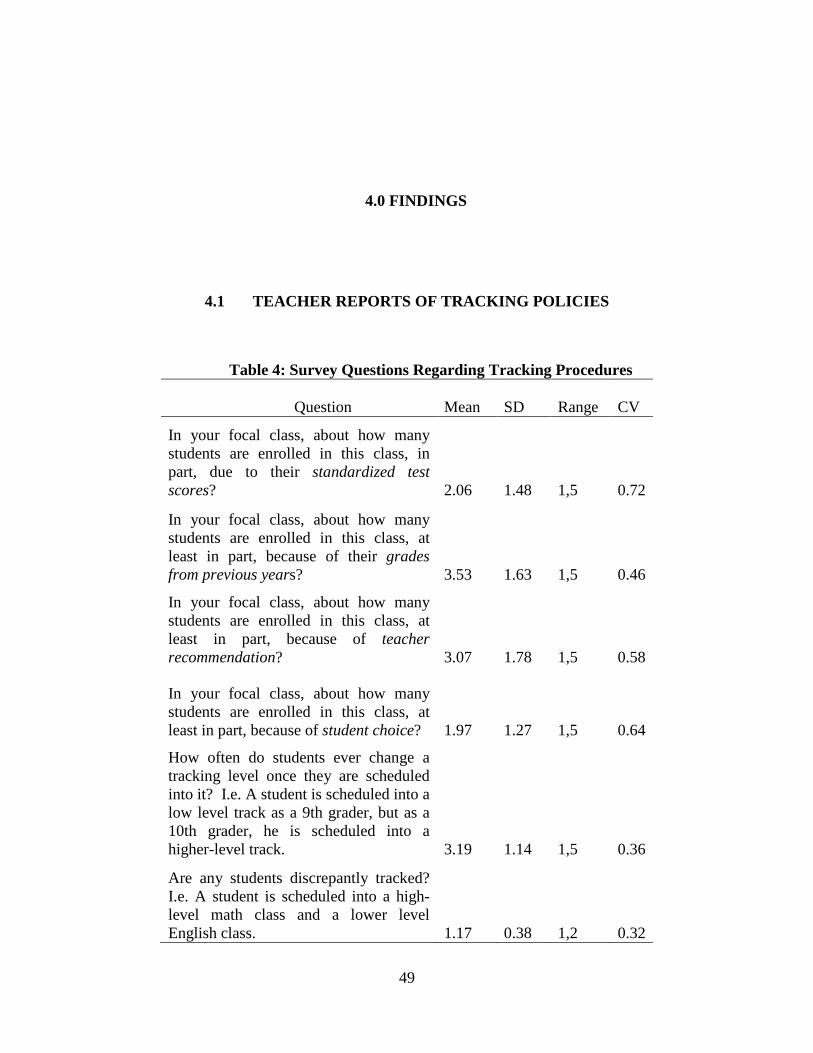
4.0 FINDINGS
4.1 TEACHER REPORTS OF TRACKING POLICIES
Table 4: Survey Questions Regarding Tracking Procedures
Question Mean SD Range CV
In your focal class, about how many students are enrolled in this class, in part, due to their standardized test scores? 2.06 1.48 1,5 0.72
In your focal class, about how many students are enrolled in this class, at least in part, because of their grades from previous years? 3.53 1.63 1,5 0.46
In your focal class, about how many students are enrolled in this class, at least in part, because of teacher recommendation? 3.07 1.78 1,5 0.58
In your focal class, about how many students are enrolled in this class, at least in part, because of student choice? 1.97 1.27 1,5 0.64
How often do students ever change a tracking level once they are scheduled into it? I.e. A student is scheduled into a low level track as a 9th grader, but as a 10th grader, he is scheduled into a higher-level track. 3.19 1.14 1,5 0.36
Are any students discrepantly tracked? I.e. A student is scheduled into a high-level math class and a lower levelEnglish class. 1.17 0.38 1,2 0.32
49
Table 4 presents the mean, standard deviation, range and coefficient of variation for each
of the survey questions. Teachers were asked to rate the number of students affected by each
assignment policy using a scale of none, a few, about half, more than half but not all, and all or
almost all. The coefficient of variation (CV) is used to describe the amount of variability relative
to the mean in order to determine which variables/items exhibit more variation or consistency.
In both districts the teachers perceive that most students are tracked according to their grades in
the classes taken in prior years and that standardized test scores play the smallest role in the
grouping of students. In fact, a majority of the teachers in both schools report that no students in
their focal class were tracked based on standardized test scores. The districts policies on tracking
differed slightly. In one district, the students were not tracked in English until their tenth grade
year, while in the second district it started in their ninth grade year. Both schools began tracking
math students as early as middle school. The information from the two districts were not
separated out because there was not a large differentiation in the means.
Upon further review of the results, it can be seen that the teachers in each district are not
providing consistent responses to each question. In District A, when asked if students were
tracked according to grades from the previous year, the majority of them agreed that all or almost
all students were tracked for that reason; however, in District B, there was no consistency in
agreement on any one policy. When asked if students were enrolled in a class because of teacher
recommendation, 32% of District A teachers indicated that all or almost all students were placed
for that reason; however, in District B, only 8% noted that all or almost all students were placed
for that reason. According to the teachers in District A, 77% agreed that no students are tracked
in their classes based on student choice; however, in District B 42% of the teachers said that no
students were placed due to student choice, and 58% indicated that a few students were placed
50

due to student choice. The data shows that teachers believe that relatively few students are
placed according to student choice, but instead, placement is based on a variety of criteria
including previous grades and teacher recommendations; however, respondents differed
considerably in which criteria they believed were most salient.
According to the survey most teachers perceive that students are discrepantly tracked in
both districts indicating that students can be tracked into different levels according to subject
instead of one level for all classes. In District A, 68% of the teachers indicated that students can
be discrepantly tracked, for example, students can be scheduled into a high-level math class and
a low-level English class. In District B, 83% of teachers indicated that discrepant tracking takes
place; therefore, there may be students in District B who are scheduled into an Advanced
Placement English while being placed in the lowest science class.
4.2 MINDSET SURVEY
Table 5 provides descriptive statistics for teacher responses to the mindset items.
51
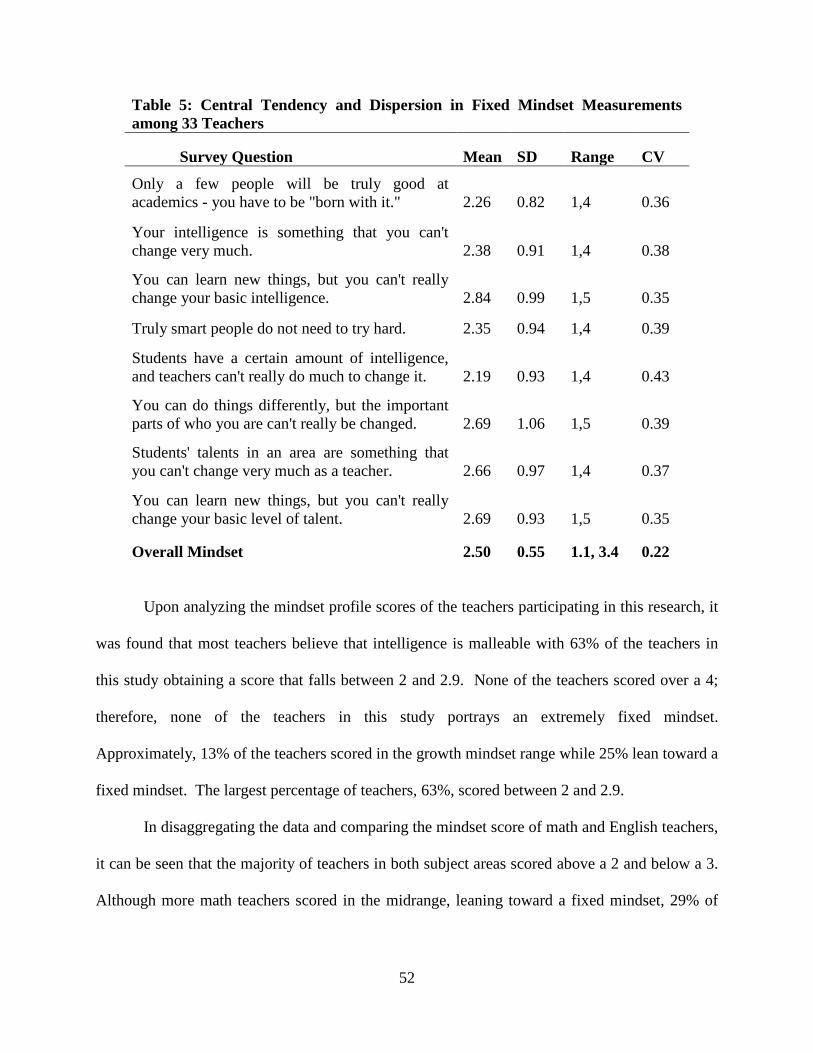
Table 5: Central Tendency and Dispersion in Fixed Mindset Measurements among 33 Teachers
Survey Question Mean SD Range CV
Only a few people will be truly good at academics - you have to be "born with it." 2.26 0.82 1,4 0.36
Your intelligence is something that you can't change very much. 2.38 0.91 1,4 0.38
You can learn new things, but you can't really change your basic intelligence. 2.84 0.99 1,5 0.35
Truly smart people do not need to try hard. 2.35 0.94 1,4 0.39
Students have a certain amount of intelligence, and teachers can't really do much to change it. 2.19 0.93 1,4 0.43
You can do things differently, but the important parts of who you are can't really be changed. 2.69 1.06 1,5 0.39
Students' talents in an area are something that you can't change very much as a teacher. 2.66 0.97 1,4 0.37
You can learn new things, but you can't really change your basic level of talent. 2.69 0.93 1,5 0.35
Overall Mindset 2.50 0.55 1.1, 3.4 0.22
Upon analyzing the mindset profile scores of the teachers participating in this research, it
was found that most teachers believe that intelligence is malleable with 63% of the teachers in
this study obtaining a score that falls between 2 and 2.9. None of the teachers scored over a 4;
therefore, none of the teachers in this study portrays an extremely fixed mindset.
Approximately, 13% of the teachers scored in the growth mindset range while 25% lean toward a
fixed mindset. The largest percentage of teachers, 63%, scored between 2 and 2.9.
In disaggregating the data and comparing the mindset score of math and English teachers,
it can be seen that the majority of teachers in both subject areas scored above a 2 and below a 3.
Although more math teachers scored in the midrange, leaning toward a fixed mindset, 29% of
52
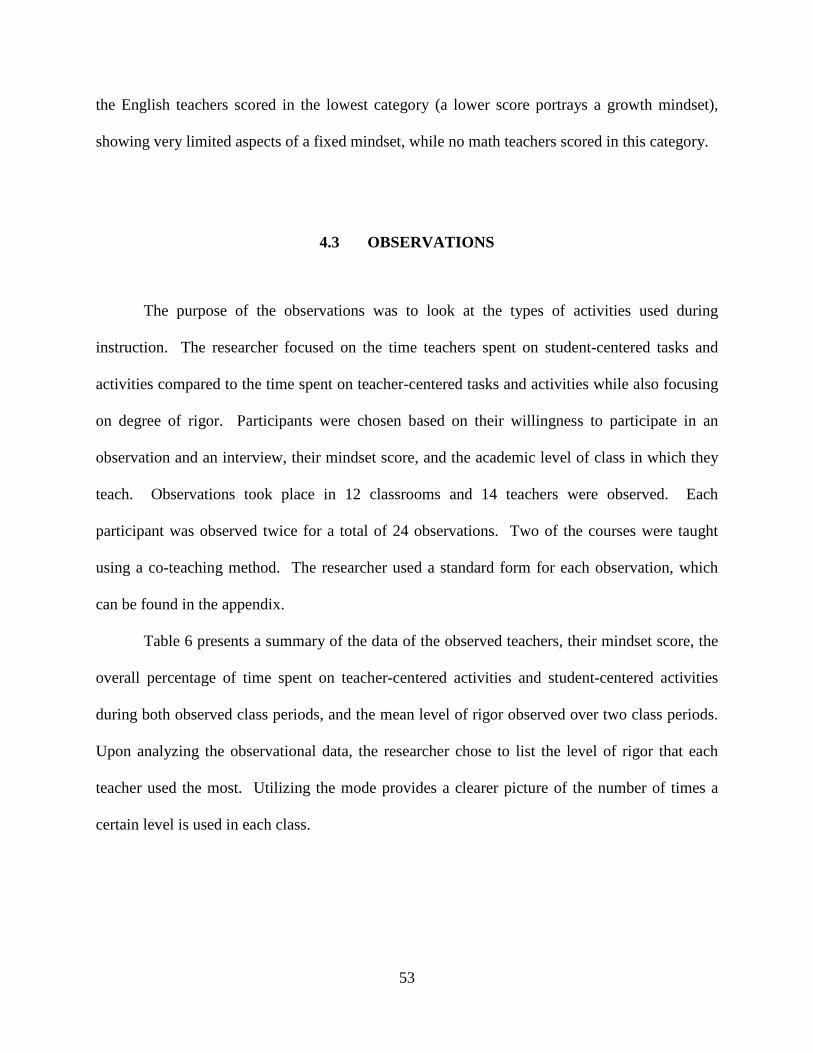
the English teachers scored in the lowest category (a lower score portrays a growth mindset),
showing very limited aspects of a fixed mindset, while no math teachers scored in this category.
4.3 OBSERVATIONS
The purpose of the observations was to look at the types of activities used during
instruction. The researcher focused on the time teachers spent on student-centered tasks and
activities compared to the time spent on teacher-centered tasks and activities while also focusing
on degree of rigor. Participants were chosen based on their willingness to participate in an
observation and an interview, their mindset score, and the academic level of class in which they
teach. Observations took place in 12 classrooms and 14 teachers were observed. Each
participant was observed twice for a total of 24 observations. Two of the courses were taught
using a co-teaching method. The researcher used a standard form for each observation, which
can be found in the appendix.
Table 6 presents a summary of the data of the observed teachers, their mindset score, the
overall percentage of time spent on teacher-centered activities and student-centered activities
during both observed class periods, and the mean level of rigor observed over two class periods.
Upon analyzing the observational data, the researcher chose to list the level of rigor that each
teacher used the most. Utilizing the mode provides a clearer picture of the number of times a
certain level is used in each class.
53

Table 6: Observation Data Summary
Teacher ID Subject
Mindset Score
Total percentage
of class time spent
on TCA
Total percentage
of class time spent
on LCA
Total Average Level of Rigor
Overall Mode of
Rigor Level
AE32 English 1.37 57% 43% 2.2 3 AE1019 English 1.9 53% 47% 2.2 2 AM32 Math 2.0 78% 22% 1.55 2 AM325 Math 2.12 73% 27% 1.9 2 BM1920 Math 2.25 100% 0% 1.4 1 BM1111 Math 2.25 65% 35% 1.7 2 BE72 English 2.37 84% 16% 1 1 BM166 Math 2.37 0% 100% 3 3 BE1211 English 2.62 84% 16% 1 1 AM813 Math 2.75 78% 22% 1.55 2 AE108 English 3.0 53% 47% 1.9 1 BE102 English 3.12 78% 22% 1.5 1 BE202 English 3.25 67% 33% 1.3 1 BM2610 Math 3.37 13% 88% 3 3
SD 0.57 0.27 0.28 0.63 0.8 Mean 2.36 0.61 0.36 1.72 1.72 CV 0.24 0.45 0.75 0.36 0.47
According to the data, the average mindset score is a 2.36 (SD=.57) indicating that the
average teacher believes that one’s intelligence is malleable, and the research shows that most of
the teachers surveyed fall within that range. The majority of teachers spent more than 50% of
instructional time on teacher-centered activities with the average being 61% of class time spent
on teacher-centered activities while only 36% of class time is spent on student-centered
activities.
Many of the classrooms consisted of a teacher at the board while students sat in their
seats answering questions. One example of this occurred in a math class. At the start of the
class, students were asked to take out their homework assignments. The teachers walked around
54

to check the assignments while the students completed example questions. After ten minutes, the
teachers went over the homework on the board. The teachers asked questions concerning the
homework, and the students answered the questions. Approximately fifteen minutes later, the
teachers read the homework questions out loud.
In another classroom, the students began by writing in their journals. They were given
fifteen minutes to describe a memorable moment in their life. Following this student-centered
activity, the teacher put facts about an author on the board as a review. The teacher then asked
the students to look at four different poems. He read the poems to the students then asked them
questions about the poems. The remainder of the class consisted of the teacher presenting
information about poems from the Japanese culture. After thirty minutes, the class ended with
the teacher putting a worksheet on the overhead and explaining multiple meaning words.
In another English classroom, for thirty minutes, students listened to a story being read to
them. They stopped briefly to answer questions asked by the teacher. Other students were
observed completing a diagnostic test on run-on sentences and fragments. They were given
approximately twenty-five minutes. The teacher then showed a twenty-minute video on how to
write correct sentences.
Two of the observed teachers spent more than 80% of instructional time on student-
centered activities. In both classes, the students were working on the same project integrating art
and math. They were given a set of directions to follow and interpret, and then they created the
project. In an English classroom, the teacher placed students into groups to work on a
vocabulary assignment. The students spent 40 minutes completing vocabulary charts analyzing
the word and connecting words to concepts from the story. In another English classroom, the
teacher played a game with the students. She asked them to create questions about the novel
55
they were reading. The students were asked to use the Webb’s Depth of Knowledge chart to
create questions from each rigor level. The students spent approximately twenty-five minutes on
this student-centered activity.
Most observed activities and questions were of low rigor according to Webb’s Depth of
Knowledge. The mean level of rigor was 1.72 (SD=.63). Due to the small sample size and
emphasis on understanding the local context of these districts, I do not report tests of statistical
significance. However, preliminary investigation of statistical significance suggests that most of
the group differences are not statistically significant by the conventional p < .05 standard, but are
significant at the p < .10 level.
4.4 INTERVIEW FINDINGS
The teachers were asked questions about class dynamic, lesson planning, and differences
between heterogeneously and homogeneously leveled classes. The teachers were also asked
about the methods used to track students. The answers were coded according to (a) differences
in instruction and environment between higher and lower leveled classrooms; (b) students’
behavior, work habits, and interest in learning; (c) differential teacher expectations (Worthy,
2010).
4.4.1 Differences in Instruction and Environment
Upon looking at differences in instruction between high and low level classes, of the
eight teachers interviewed, five specifically mentioned trying to do student-centered activities as
56

much as possible in the lower leveled classes. The five teachers included both English and math
teachers and their mindset scores ranged from 2 to 3.25. Two of those teachers, an English
teacher currently teaching homogenously tracked courses and a math teacher who moved from
teaching homogeneously tracked courses to heterogeneously tracked courses within the last three
years indicated that their lower class receives more student-centered instruction than their higher,
or AP, levels. The math teacher, when referring to teaching her upper level classes, noted, “I’m
in front of the classroom, and I’m lecturing, but it’s not really lecturing [it’s a] mix of the two.
I’ll go through examples, and I’ll show them, and I’ll point out things that are going to be
stumbling blocks.” The English teacher commented on the low-level English class having more
movement involved. She also indicated that the class was more student-centered and project
based. She went on to say that due to some extra time given in the AP classes, she was finally
forced to move to student-centered activities in the AP classes.
Of the five teachers that discussed student-centered activities, two of the teachers that
team teach a class indicated using more hands on activities with lower kids to get them more
engaged. They explained that in their lowest level class, they incorporate more hands-on
activities that are student interest based. One of the team teachers indicated that she likes to
incorporate topics of interest to engage them including quad riding and tractor pulls.
Upon looking at the remaining three teachers, who were a mix of English and math
teachers, two of the teachers co-teach a class, and they did not specifically mention student-
centered activities, one of the co-teachers noted not giving very many “project things.” While
these teachers’ mindset scores ranged from 2.62 to 3.4, it is important to note that the teacher
with the highest mindset score (leaning toward a fixed mindset), noted using more teacher led
instruction because “they don’t have the ability to learn independently.” These comments from
57
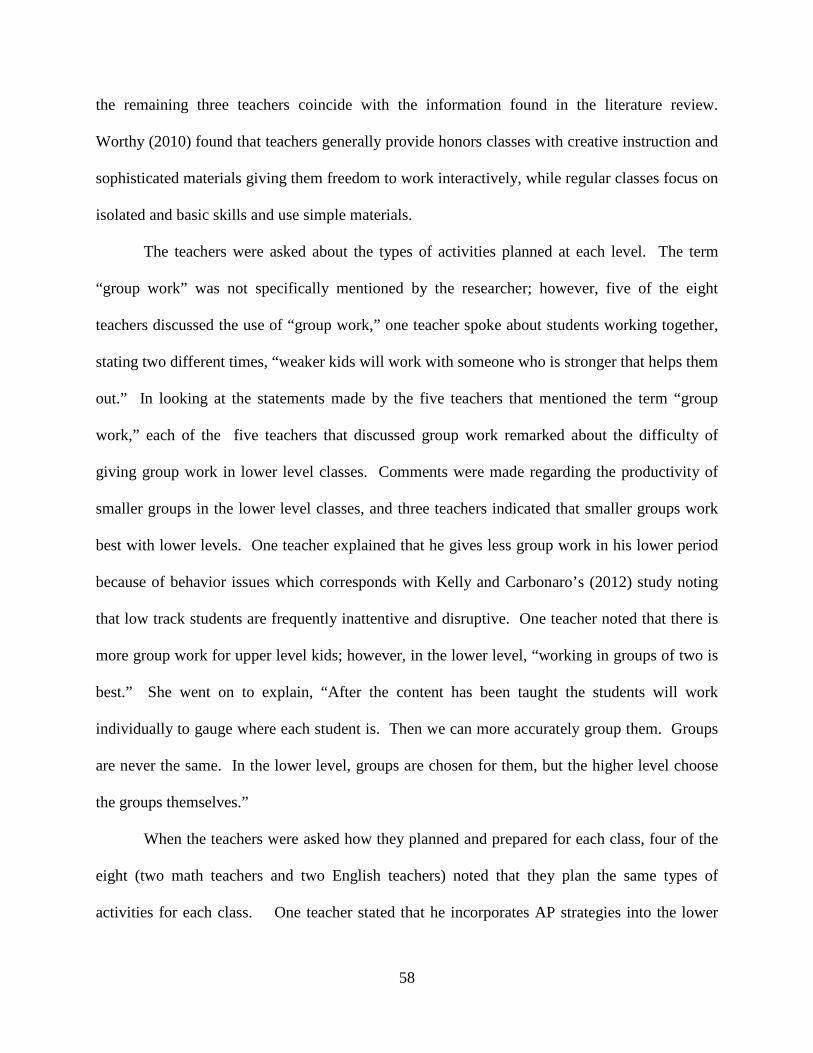
the remaining three teachers coincide with the information found in the literature review.
Worthy (2010) found that teachers generally provide honors classes with creative instruction and
sophisticated materials giving them freedom to work interactively, while regular classes focus on
isolated and basic skills and use simple materials.
The teachers were asked about the types of activities planned at each level. The term
“group work” was not specifically mentioned by the researcher; however, five of the eight
teachers discussed the use of “group work,” one teacher spoke about students working together,
stating two different times, “weaker kids will work with someone who is stronger that helps them
out.” In looking at the statements made by the five teachers that mentioned the term “group
work,” each of the five teachers that discussed group work remarked about the difficulty of
giving group work in lower level classes. Comments were made regarding the productivity of
smaller groups in the lower level classes, and three teachers indicated that smaller groups work
best with lower levels. One teacher explained that he gives less group work in his lower period
because of behavior issues which corresponds with Kelly and Carbonaro’s (2012) study noting
that low track students are frequently inattentive and disruptive. One teacher noted that there is
more group work for upper level kids; however, in the lower level, “working in groups of two is
best.” She went on to explain, “After the content has been taught the students will work
individually to gauge where each student is. Then we can more accurately group them. Groups
are never the same. In the lower level, groups are chosen for them, but the higher level choose
the groups themselves.”
When the teachers were asked how they planned and prepared for each class, four of the
eight (two math teachers and two English teachers) noted that they plan the same types of
activities for each class. One teacher stated that he incorporates AP strategies into the lower
58
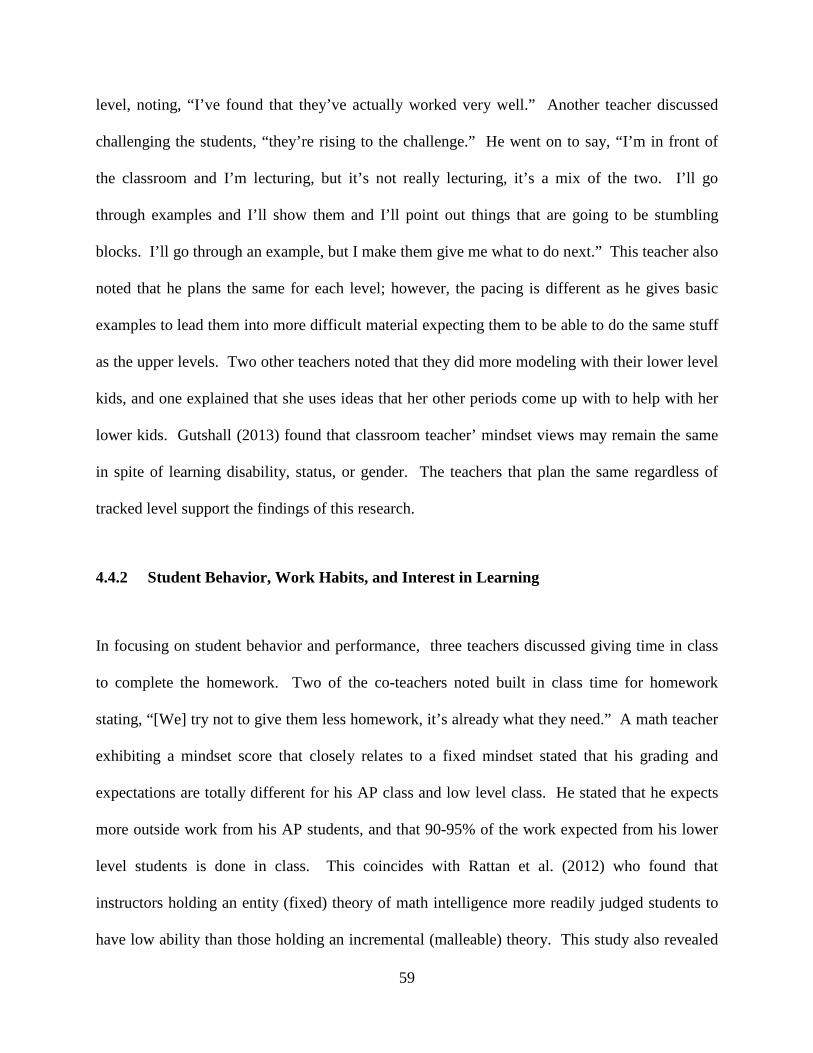
level, noting, “I’ve found that they’ve actually worked very well.” Another teacher discussed
challenging the students, “they’re rising to the challenge.” He went on to say, “I’m in front of
the classroom and I’m lecturing, but it’s not really lecturing, it’s a mix of the two. I’ll go
through examples and I’ll show them and I’ll point out things that are going to be stumbling
blocks. I’ll go through an example, but I make them give me what to do next.” This teacher also
noted that he plans the same for each level; however, the pacing is different as he gives basic
examples to lead them into more difficult material expecting them to be able to do the same stuff
as the upper levels. Two other teachers noted that they did more modeling with their lower level
kids, and one explained that she uses ideas that her other periods come up with to help with her
lower kids. Gutshall (2013) found that classroom teacher’ mindset views may remain the same
in spite of learning disability, status, or gender. The teachers that plan the same regardless of
tracked level support the findings of this research.
4.4.2 Student Behavior, Work Habits, and Interest in Learning
In focusing on student behavior and performance, three teachers discussed giving time in class
to complete the homework. Two of the co-teachers noted built in class time for homework
stating, “[We] try not to give them less homework, it’s already what they need.” A math teacher
exhibiting a mindset score that closely relates to a fixed mindset stated that his grading and
expectations are totally different for his AP class and low level class. He stated that he expects
more outside work from his AP students, and that 90-95% of the work expected from his lower
level students is done in class. This coincides with Rattan et al. (2012) who found that
instructors holding an entity (fixed) theory of math intelligence more readily judged students to
have low ability than those holding an incremental (malleable) theory. This study also revealed
59

that those exhibiting a fixed mindset were more likely to comfort students for low math ability
and use “kind” strategies like assigning less homework.
4.4.3 Differential Teacher Expectations
Comments concerning the difference between heterogeneously tracked classes and
homogenously tracked levels were more general. In regard to heterogeneously tracked classes,
one teacher stated, “I don’t think the top kids push themselves as much as they did before we
tracked students. There is more down time for those kids. Kids at the lower end suffer because
you can’t give them full attention.” Another teacher noted, “Writing was better when we broke
them into groups.” One teacher suggested, “Mixed classes clearly penalize the top learners.” In
discussing one homogeneously tracked low level class, the teacher stated, “Lack of
motivation/negativity amongst the students provides a hurtle; it gives us obstacles to overcome.”
I found it interesting that when asked about the differences between heterogeneously
tracked classes and homogeneously tracked classes, the three teachers that gave negative
comments about the heterogeneously tracked classes achieved a mindset score above three
(indicating a more fixed mindset). These teachers made comments concerning the top kids, kids
not pushing themselves or being penalized, and the bottom kids suffering. It is also important to
note that one of the teacher’s exhibiting the most fixed mindset score noted, “20% of their grade
is on respectful behavior such as being prepared for class and not sleeping.” This relates to
coddling students, which is a fixed mindset characteristic.
Overall, the teachers responded to the questions with similar answers. Of the eight
teachers interviewed, four noted that they plan the same for all levels, and they assess the same.
All eight of the teachers noted giving kids opportunities to fix mistakes and resubmit which is a
60
growth mindset characteristic. The teachers with the mindset scores that most closely leaned
toward a growth mindset specifically noted activities geared toward deliberative planning such as
putting answers on the board, walking the students through the answers, providing feedback, and
encouraging the students to elaborate. Guidance for deliberative practice is one of the major
characteristics of a teacher with a growth mindset (Conyers & Wilson, 2013). This also goes
along with solving problems aloud in the classroom in order to help students learn to think at
higher levels through effective modeling.
61

5.0 DISCUSSION AND CONCLUSION
5.1 SUMMARY
The primary objective of schools is to educate students. It is becoming increasingly
important for all students to be educated at the highest of levels. Although detracking began in
the 1990s, students are still sorted into different academic levels in schools across America.
Most students who are placed in low-level tracks at the start of their high school career remain in
those tracks until graduation. This is unsettling, and it poses an important question. Do students
in lower level groups underperform because they do not have the ability? Or, do they
underperform because they are expected to? According to Kelly and Carbonaro (2012), Track
placements affect teacher expectations above and beyond student achievement and other
characteristics” (p. 289). This invites the question: How do teacher’s attitudes affect student
success?
If it is true that assuming a student has the ability to achieve will aid in achievement, how
does this affect placement of students? If students are grouped by ability level, there is an
assumption that the lower ability level is placed in that setting for a reason – their lack of
ability. In the book Mindset, Carol Dweck (2006), states, “In a fixed mindset, people believe
their basic qualities, like their intelligence or talent are simply fixed traits. They spend their time
62
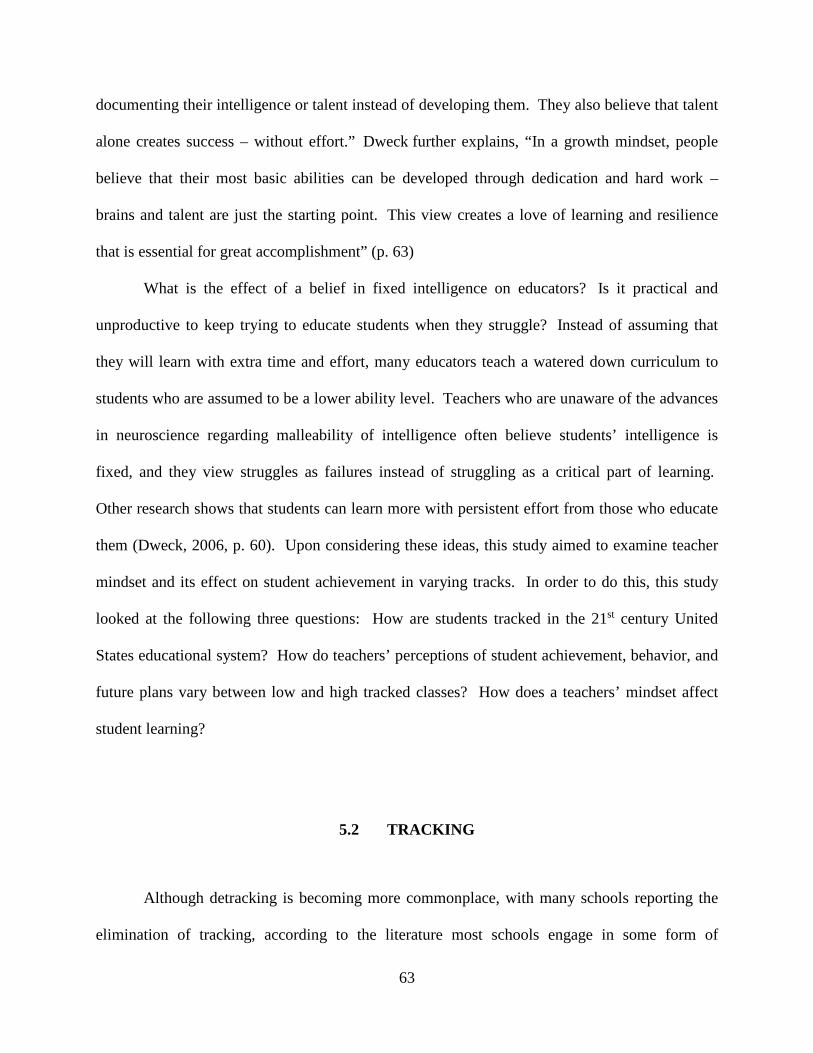
documenting their intelligence or talent instead of developing them. They also believe that talent
alone creates success – without effort.” Dweck further explains, “In a growth mindset, people
believe that their most basic abilities can be developed through dedication and hard work –
brains and talent are just the starting point. This view creates a love of learning and resilience
that is essential for great accomplishment” (p. 63)
What is the effect of a belief in fixed intelligence on educators? Is it practical and
unproductive to keep trying to educate students when they struggle? Instead of assuming that
they will learn with extra time and effort, many educators teach a watered down curriculum to
students who are assumed to be a lower ability level. Teachers who are unaware of the advances
in neuroscience regarding malleability of intelligence often believe students’ intelligence is
fixed, and they view struggles as failures instead of struggling as a critical part of learning.
Other research shows that students can learn more with persistent effort from those who educate
them (Dweck, 2006, p. 60). Upon considering these ideas, this study aimed to examine teacher
mindset and its effect on student achievement in varying tracks. In order to do this, this study
looked at the following three questions: How are students tracked in the 21st century United
States educational system? How do teachers’ perceptions of student achievement, behavior, and
future plans vary between low and high tracked classes? How does a teachers’ mindset affect
student learning?
5.2 TRACKING
Although detracking is becoming more commonplace, with many schools reporting the
elimination of tracking, according to the literature most schools engage in some form of
63

curricular tracking. In Kelly and Price’s (2011) study, they found that almost al schools in the
study had some policies restricting enrollment in high track courses including test score or grade
minimums or teacher recommendation. In looking at the two schools in this study, most teachers
felt that students were tracked according to their grades in the classes taken in prior years, and
standardized test scores played the smallest role in grouping students in the perceptions of
teachers from both school districts.
According to the teachers who were interviewed, in one school the math teacher noted
that students were tested at the end sixth grade in order to sort them into the tracked levels. In
the other school, the math teachers noted that the students were sorted after their sixth grade year
into either a pre-algebra class or a regular math class. This process allowed the students to
remain on a certain path until they graduated either moving from pre-algebra to algebra followed
by geometry then receiving a trigonometry course. Those students then had the opportunity to
take pre-calculus and AP Calculus. The other grouping of students moved into an algebra or a
supplemental algebra course in ninth grade. Those who completed algebra in ninth grade were
then able to take Algebra II, geometry, and either trigonometry or statistics. The supplemental
algebra course is paired with an Algebra I course, and those students may be directed to an
Algebra III class before graduating or they may take a low level integrated math class. Teachers
from both schools noted that the students who were tracked in a lower level in middle school
would have to “double up,” or take two math classes in one year of high school in order to
change math levels. Because these schools follow a traditional tracking structure, mobility
would be the exception. It is important to note, that in math, mobility would only occur if a
student takes an extra math class in order to “catch up” to his peers.
64

According to the English teachers in those school districts, tracking is still commonplace
in the school in District A; however, in in the school in District B, in ninth grade there is only
one English class offered to all students. In tenth grade, students are able to choose to take a Pre-
AP course with instructor approval, and in eleventh and twelfth grade AP options are offered
with instructor approval; however, each grade level only offers one other English class labeled as
college preparatory. In District A, the English teachers noted that students were tracked in
seventh grade, and remained in that track until 12th grade when English courses changed to open
enrollment. One English teacher in that school district noted that the students are
heterogeneously tracked in middle school, the top 50% are placed in honors and the bottom 50%
are placed in a regular English class. These teachers noted there is a post assessment and
teachers can recommend a level change; however, traditionally that does not happen. This
coincides with the studies that have been done on tracking, in that, data shows about three-
fourths of students attending tracked math classes over the past two decades while numbers have
dropped in English/Language Arts tracking. Although both schools still set a path for student
math classes, District B does very little tracking in English/Language arts, and although District
A sorts students in English/language arts, they only do so until their senior year
5.3 SELF-REPORTED MINDSET SCORE
Teachers have a tremendous influence in their classroom, and their views on malleable
intelligence have significant implications for their students’ academic performance, which can
affect beliefs and motivation (Jones, Bryant, Snyder, &Malone, 2012). A teacher’s mindset can
affect the environment and even student outcomes. Dweck (2006) believes, “teachers with the
65
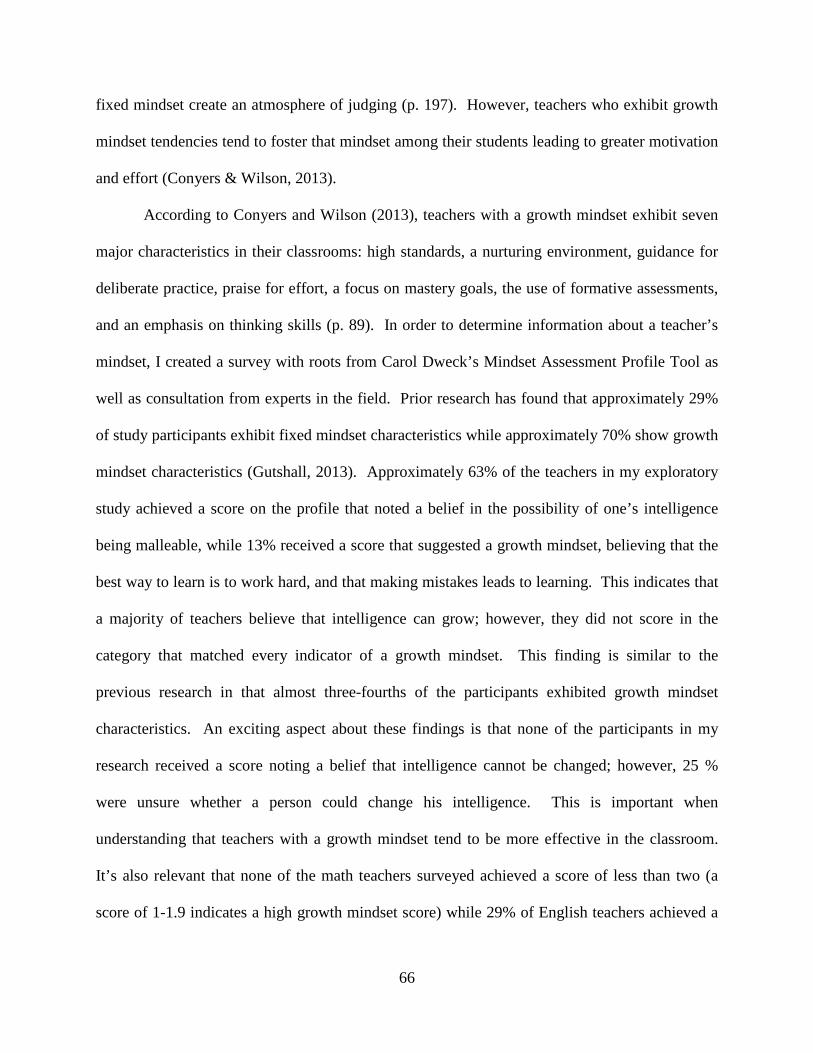
fixed mindset create an atmosphere of judging (p. 197). However, teachers who exhibit growth
mindset tendencies tend to foster that mindset among their students leading to greater motivation
and effort (Conyers & Wilson, 2013).
According to Conyers and Wilson (2013), teachers with a growth mindset exhibit seven
major characteristics in their classrooms: high standards, a nurturing environment, guidance for
deliberate practice, praise for effort, a focus on mastery goals, the use of formative assessments,
and an emphasis on thinking skills (p. 89). In order to determine information about a teacher’s
mindset, I created a survey with roots from Carol Dweck’s Mindset Assessment Profile Tool as
well as consultation from experts in the field. Prior research has found that approximately 29%
of study participants exhibit fixed mindset characteristics while approximately 70% show growth
mindset characteristics (Gutshall, 2013). Approximately 63% of the teachers in my exploratory
study achieved a score on the profile that noted a belief in the possibility of one’s intelligence
being malleable, while 13% received a score that suggested a growth mindset, believing that the
best way to learn is to work hard, and that making mistakes leads to learning. This indicates that
a majority of teachers believe that intelligence can grow; however, they did not score in the
category that matched every indicator of a growth mindset. This finding is similar to the
previous research in that almost three-fourths of the participants exhibited growth mindset
characteristics. An exciting aspect about these findings is that none of the participants in my
research received a score noting a belief that intelligence cannot be changed; however, 25 %
were unsure whether a person could change his intelligence. This is important when
understanding that teachers with a growth mindset tend to be more effective in the classroom.
It’s also relevant that none of the math teachers surveyed achieved a score of less than two (a
score of 1-1.9 indicates a high growth mindset score) while 29% of English teachers achieved a
66
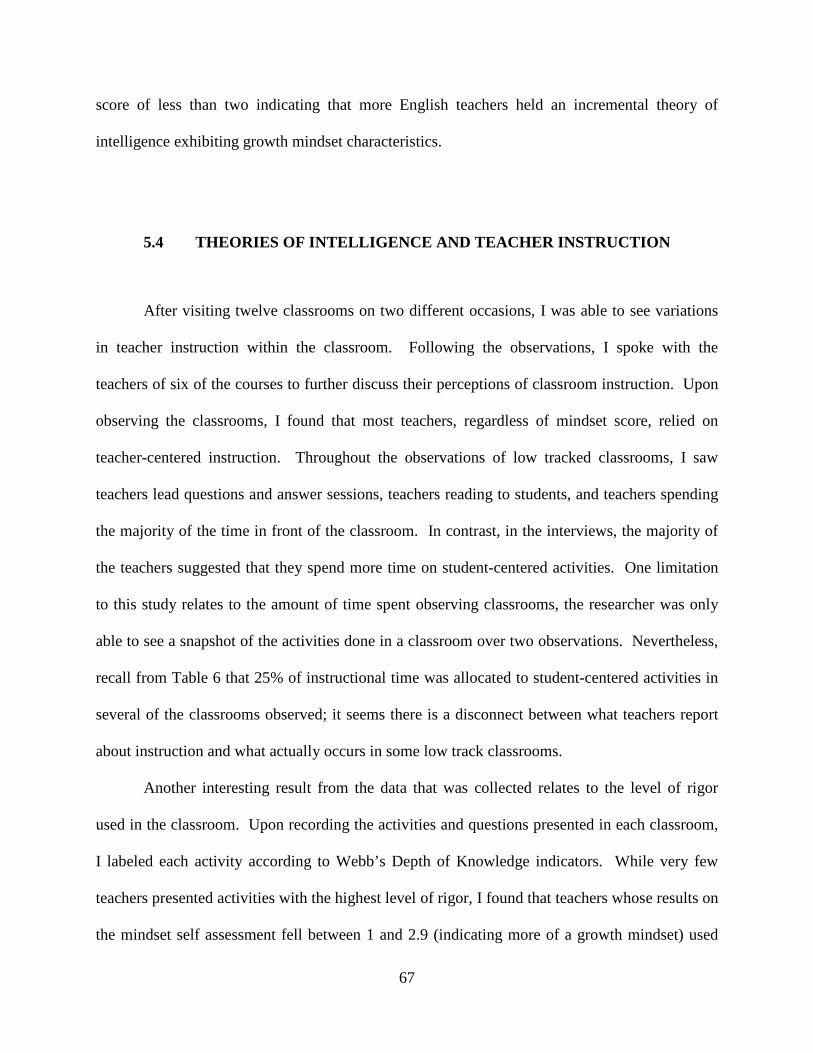
score of less than two indicating that more English teachers held an incremental theory of
intelligence exhibiting growth mindset characteristics.
5.4 THEORIES OF INTELLIGENCE AND TEACHER INSTRUCTION
After visiting twelve classrooms on two different occasions, I was able to see variations
in teacher instruction within the classroom. Following the observations, I spoke with the
teachers of six of the courses to further discuss their perceptions of classroom instruction. Upon
observing the classrooms, I found that most teachers, regardless of mindset score, relied on
teacher-centered instruction. Throughout the observations of low tracked classrooms, I saw
teachers lead questions and answer sessions, teachers reading to students, and teachers spending
the majority of the time in front of the classroom. In contrast, in the interviews, the majority of
the teachers suggested that they spend more time on student-centered activities. One limitation
to this study relates to the amount of time spent observing classrooms, the researcher was only
able to see a snapshot of the activities done in a classroom over two observations. Nevertheless,
recall from Table 6 that 25% of instructional time was allocated to student-centered activities in
several of the classrooms observed; it seems there is a disconnect between what teachers report
about instruction and what actually occurs in some low track classrooms.
Another interesting result from the data that was collected relates to the level of rigor
used in the classroom. Upon recording the activities and questions presented in each classroom,
I labeled each activity according to Webb’s Depth of Knowledge indicators. While very few
teachers presented activities with the highest level of rigor, I found that teachers whose results on
the mindset self assessment fell between 1 and 2.9 (indicating more of a growth mindset) used
67
more rigorous activities than those who received a score of three or higher. This relates to
Dweck’s (2006) description of effective characteristics associate with growth mindset educators
(p. 187).
There was one exception to this finding. The teacher who scored the highest on the self
assessment, falling into the category that indicated an uncertainty about changing ones
intelligence, offered students activities with an average level three rigor according to Webb’s
DOK. The students were working on this rigorous student-centered activity during both of my
observational experiences. However, while I was observing the class, the teacher indicated that
this was not a usual activity in this type of course (low tracked level). The teacher explained that
this was an activity developed by another teacher that taught the same level, and the students
were trying it. I would have liked the opportunity to spend more time in this classroom to
determine an average level of rigor.
5.5 LIMITATIONS
This study of teacher mindset and its effect on low tracked classes included various
limitations. In using self-reported surveys and interviews, participant’s responses can be limited
by social desirability bias. Because the survey questions focused on how the teachers perceived
intelligence, teachers may answer questions in a way they perceive to be favorable. Due to the
popularity of Carol Dweck’s (2006) book, Mindset: The New Psychology of Success, many
people may have read it and want to answer questions in a way that corresponds to the book
instead of answering with their true beliefs. Social desirability bias may also affect the interview
68

process in that teachers may over report information about strategies that they feel are desirable
to use in the classroom.
Another concern associated with this study is the sampling process. Both districts studied
were in the same geographical region. Although one was bigger than the other was, the
demographics were fairly similar. Many studies point out that teacher expectations can be
influenced by demographics; however, due to the landscape of the study, a wide range of
demographics was not covered. Therefore, the study cannot be broadly generalized beyond
western Pennsylvania. The exploratory nature of the study limits its usefulness as well. There is
limited prior research on teacher mindset and its effect on student learning; therefore, some of
the analysis may be subjective.
5.6 IMPLICATIONS FOR RESEARCH AND FUTURE PRACTICE
Prior studies show the benefits of instilling growth mindset characteristics in students.
Believing that intelligence is malleable and can be developed has significant impacts on learning.
The literature reveals that exhibiting growth mindset traits is a quality that an effective teacher
portrays. Teachers with growth mindsets set higher standards in the classroom and help all
students achieve those standards (Dweck, 2006).
The study results show that a majority of teachers portrays growth mindset traits.
Working with these qualities and promoting them in students could lead to higher student
achievement and motivation. An implication for practice is related to the professional
development offered to teachers. Training teachers to promote growth mindsets in students
could benefit successes of both the students and the schools. This could also lead to a future
69

study involving teaching incremental theories of intelligence in school, and its benefit on student
achievement.
Although a majority of the teachers portrayed growth mindsets, through observations, it
was noted that all teachers, regardless of mindset score spent more time using teacher-centered
activities than student-centered activities. A further study may need to be done focusing on the
use of teacher-centered instruction and exhibiting growth or fixed mindset characteristics.
A further implication of this study relies on professional development of teachers. If
exhibiting and promoting growth mindset characteristics is beneficial to the learning
environment and aids in the advancement of student successes, is it beneficial and cost effective
to provide professional development to help shape teacher mindsets. In order to understand this
better, further research needs to be completed on the ability of professional development to shape
teacher mindsets effectively. Is it enough to just understand what a growth mindset is and how
to display the traits or is more extensive development required?
Prior to completing this study, my interest rested in teacher mindsets and their effect on
student learning. I am still interested in further exploration of this topic. A future longitudinal
study may focus on teacher mindsets and student results on standardized tests. Studies of this
nature could result in changing hiring practices in school districts in order to focus on growth
mindset traits in the interview process. There could also be implications for pre-service teachers
and teacher education programs.
70
5.7 CONCLUSION
Teachers matter more to student achievement than any other aspect of schooling
(Teachers Matter, 2012). In understanding how important a teacher is to a classroom and a
school, it is important to make sure all teachers are effective. According to Carol Dweck (2006),
“The great teachers believe in the growth of intellect and talent, and they are fascinated with the
process of learning” (p. 188). She notes that great teachers set high standards for all students (p.
190) and teach students how to reach high standards (p. 192). Fixed minded teachers often think
of their role as simply to impart their knowledge (p. 195).
In reflecting upon this it is so important to make sure all schools are encouraging growth
mindsets in teachers. According to the literature and the information found in this study,
although many schools are touting the idea of detracking, tracking is still thriving in America’s
schools. As discussed in the review of literature, expectations that lower track students are
unlikely to achieve academically could potentially set these students up for failure from the start.
Supporters of this viewpoint argue that teachers generally hold limiting expectations for students
in lower educational tracks (Wheelock, 1992). This study aimed to look at teachers with
differing mindset scores and their approach to and perception of teaching students in low
academic tracks.
This study looked at a group of 37 teachers and found that 76% of them leaned toward a
growth mindset, scoring between 1 and 2.9 on the mindset survey. According to Dweck, this
could mean that the majority of teachers in this study exhibit effective teaching characteristics.
This is encouraging as it is so important that teachers model the mindset in the classroom and
foster the growth mindset in students. Fostering this mindset can lead to greater student
motivation and effort, which could greatly change the path of students in low tracked classes.
71

However, it must also be noted that this study found that most of the teachers, regardless of
mindset score, focused more on teacher-centered activities as opposed to learner, or student-
centered activities. This indicates that mindset did not show a pronounced difference in
instruction. Through observations, it was noted that most of the teachers who scored lower on
the mindset survey (exhibiting growth mindset characteristics) used activities with higher levels
of rigor more often indicating that incremental theorists (those exhibiting a growth mindset) may
plan more rigorous activities or ask more rigorous questions. However, more research needs to
be completed to determine the significance of this idea.
72

APPENDIX A
TEACHER SURVEY
Teacher ID _______________
Differentiation of Instruction Survey for Teachers
My study is trying to understand how teachers differentiate instruction for diverse
learners. Read each question and then note your level of agreement with the following
statements. Please remember there are no “right” or “wrong” answers in that I am most
interested in your own professional understanding of this topic gained from years working with
students in a variety of settings.
Thank you for your time.
1. I have had many opportunities to learn about strategies to successful differentiate
instruction.
Strongly Disagree (1) Disagree (2) Mostly Disagree (3) Mostly Agree (4) Agree (5) Strongly Agree (6)
73
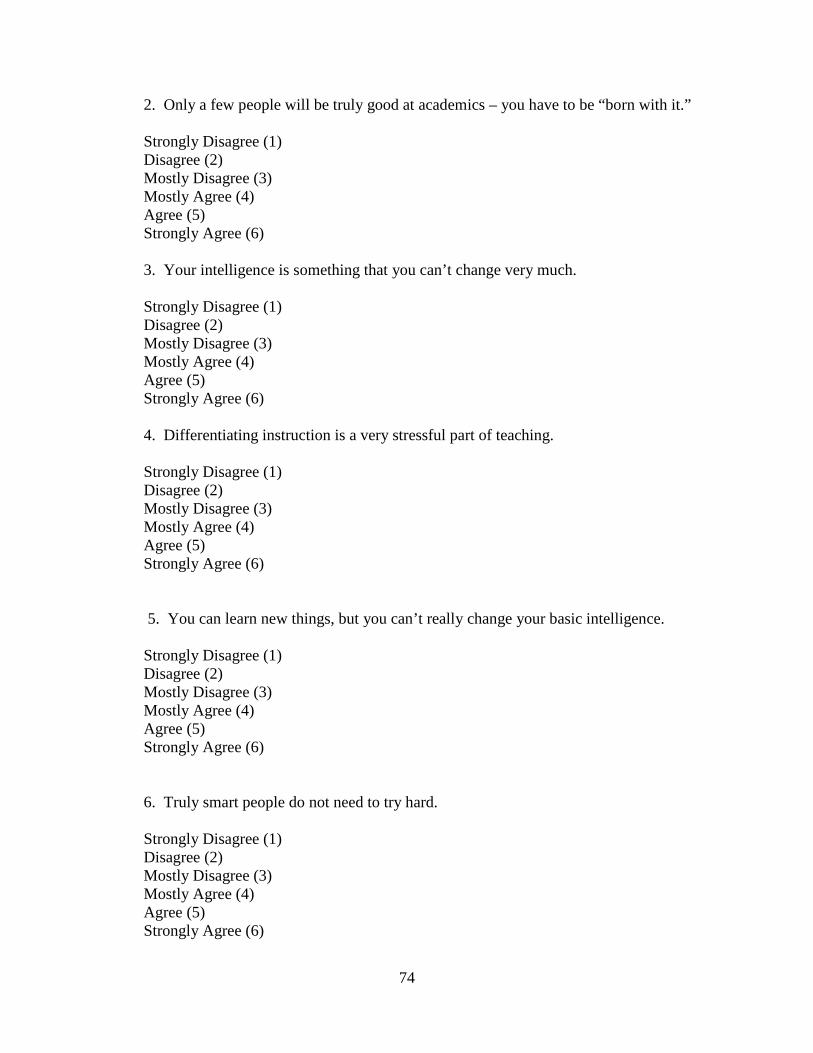
2. Only a few people will be truly good at academics – you have to be “born with it.”
Strongly Disagree (1) Disagree (2) Mostly Disagree (3) Mostly Agree (4) Agree (5) Strongly Agree (6)
3. Your intelligence is something that you can’t change very much.
Strongly Disagree (1) Disagree (2) Mostly Disagree (3) Mostly Agree (4) Agree (5) Strongly Agree (6)
4. Differentiating instruction is a very stressful part of teaching.
Strongly Disagree (1) Disagree (2) Mostly Disagree (3) Mostly Agree (4) Agree (5) Strongly Agree (6)
5. You can learn new things, but you can’t really change your basic intelligence.
Strongly Disagree (1) Disagree (2) Mostly Disagree (3) Mostly Agree (4) Agree (5) Strongly Agree (6)
6. Truly smart people do not need to try hard.
Strongly Disagree (1) Disagree (2) Mostly Disagree (3) Mostly Agree (4) Agree (5) Strongly Agree (6)
74
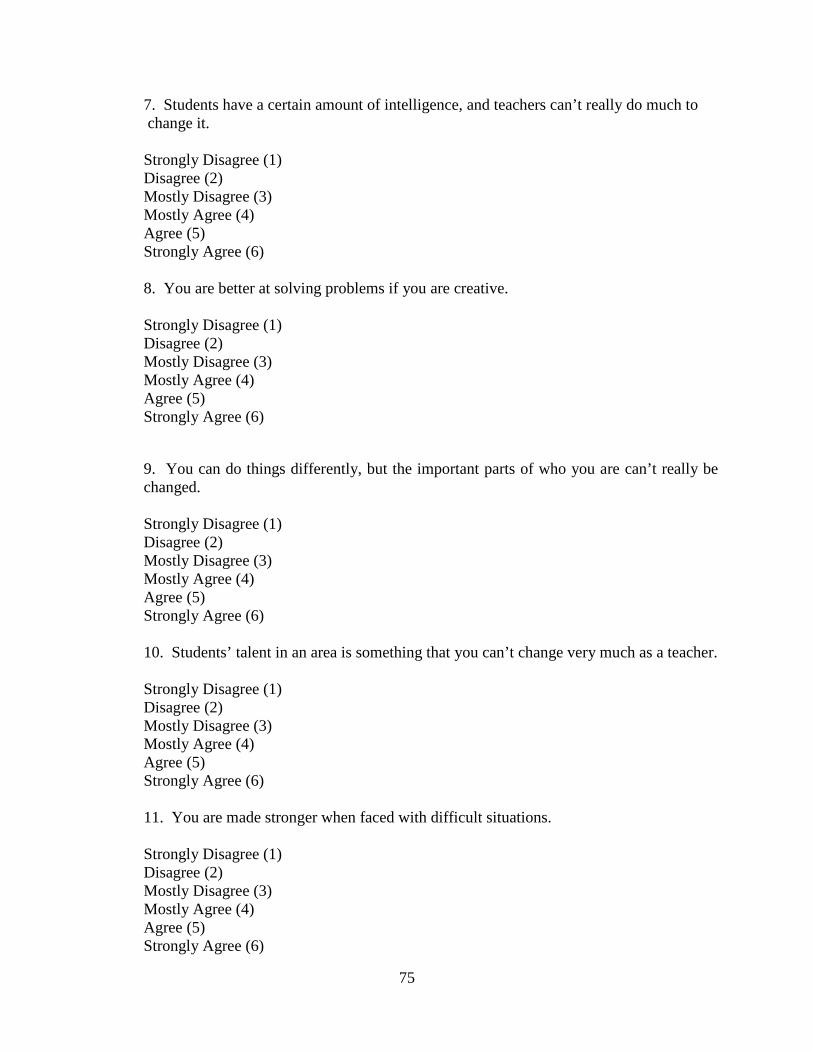
7. Students have a certain amount of intelligence, and teachers can’t really do much to change it. Strongly Disagree (1) Disagree (2) Mostly Disagree (3) Mostly Agree (4) Agree (5) Strongly Agree (6) 8. You are better at solving problems if you are creative. Strongly Disagree (1) Disagree (2) Mostly Disagree (3) Mostly Agree (4) Agree (5) Strongly Agree (6) 9. You can do things differently, but the important parts of who you are can’t really be changed. Strongly Disagree (1) Disagree (2) Mostly Disagree (3) Mostly Agree (4) Agree (5) Strongly Agree (6) 10. Students’ talent in an area is something that you can’t change very much as a teacher. Strongly Disagree (1) Disagree (2) Mostly Disagree (3) Mostly Agree (4) Agree (5) Strongly Agree (6) 11. You are made stronger when faced with difficult situations. Strongly Disagree (1) Disagree (2) Mostly Disagree (3) Mostly Agree (4) Agree (5) Strongly Agree (6)
75
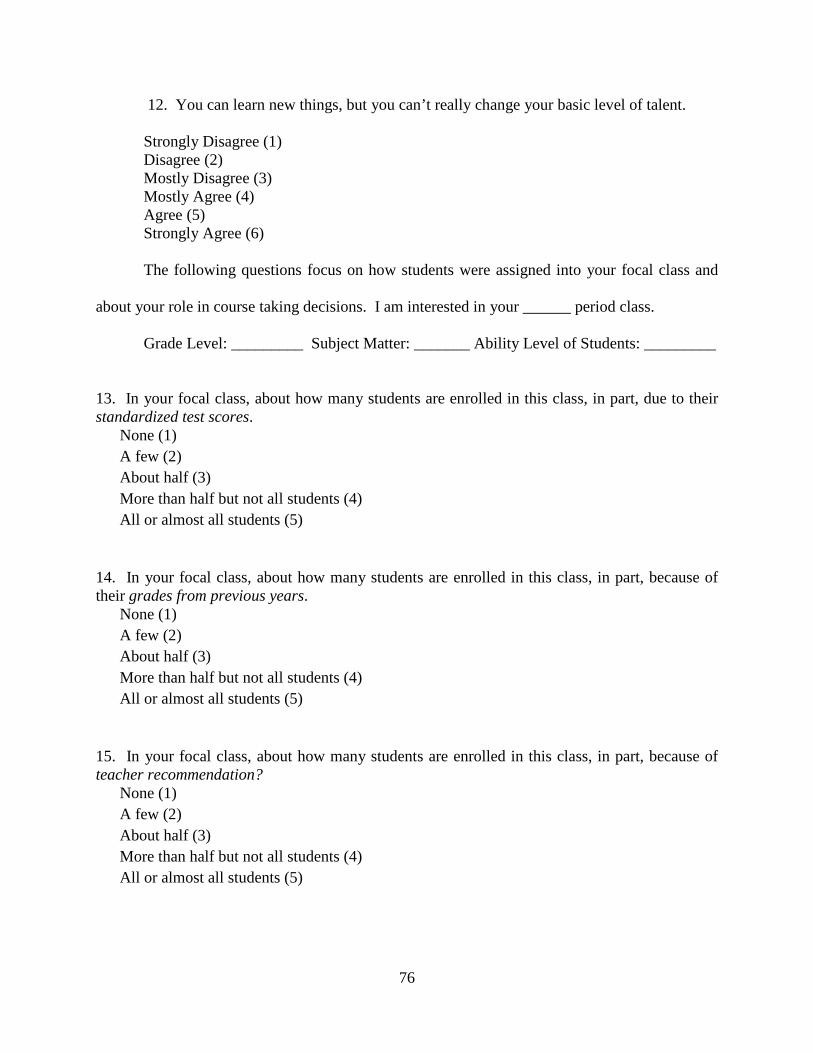
12. You can learn new things, but you can’t really change your basic level of talent.
Strongly Disagree (1) Disagree (2) Mostly Disagree (3) Mostly Agree (4) Agree (5) Strongly Agree (6)
The following questions focus on how students were assigned into your focal class and
about your role in course taking decisions. I am interested in your ______ period class.
Grade Level: _________ Subject Matter: _______ Ability Level of Students: _________
13. In your focal class, about how many students are enrolled in this class, in part, due to theirstandardized test scores.
None (1) A few (2) About half (3) More than half but not all students (4) All or almost all students (5)
14. In your focal class, about how many students are enrolled in this class, in part, because oftheir grades from previous years.
None (1) A few (2) About half (3) More than half but not all students (4) All or almost all students (5)
15. In your focal class, about how many students are enrolled in this class, in part, because ofteacher recommendation?
None (1) A few (2) About half (3) More than half but not all students (4) All or almost all students (5)
76
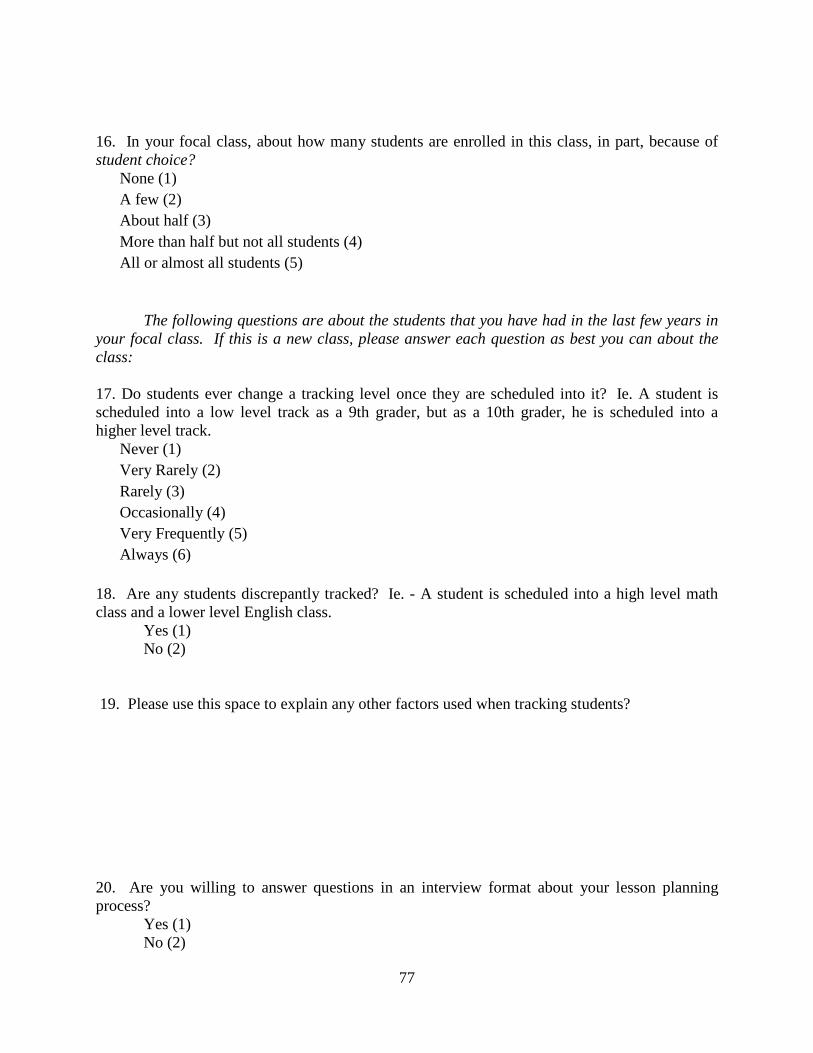
16. In your focal class, about how many students are enrolled in this class, in part, because ofstudent choice?
None (1) A few (2) About half (3) More than half but not all students (4) All or almost all students (5)
The following questions are about the students that you have had in the last few years in your focal class. If this is a new class, please answer each question as best you can about the class:
17. Do students ever change a tracking level once they are scheduled into it? Ie. A student isscheduled into a low level track as a 9th grader, but as a 10th grader, he is scheduled into ahigher level track.
Never (1) Very Rarely (2) Rarely (3) Occasionally (4) Very Frequently (5) Always (6)
18. Are any students discrepantly tracked? Ie. - A student is scheduled into a high level mathclass and a lower level English class.
Yes (1) No (2)
19. Please use this space to explain any other factors used when tracking students?
20. Are you willing to answer questions in an interview format about your lesson planningprocess?
Yes (1) No (2)
77

APPENDIX B
CLASSROOM OBSERVATION TOOL
Classroom Observations
Classroom observations will focus on time spent on various tasks and questions asked by the teacher. I will observe teachers and students engaged in classroom activities. I will examine
the level of questions asked and answered in low tracked classes. Those levels will be coded according to Webb’s Depth of Knowledge. Types of activities will be document; time spent on
teacher-centered and student-centered activities will be noted.
Activity/Question (Procedure) Type (TC or SC)
Start Finish DOK Notes
78
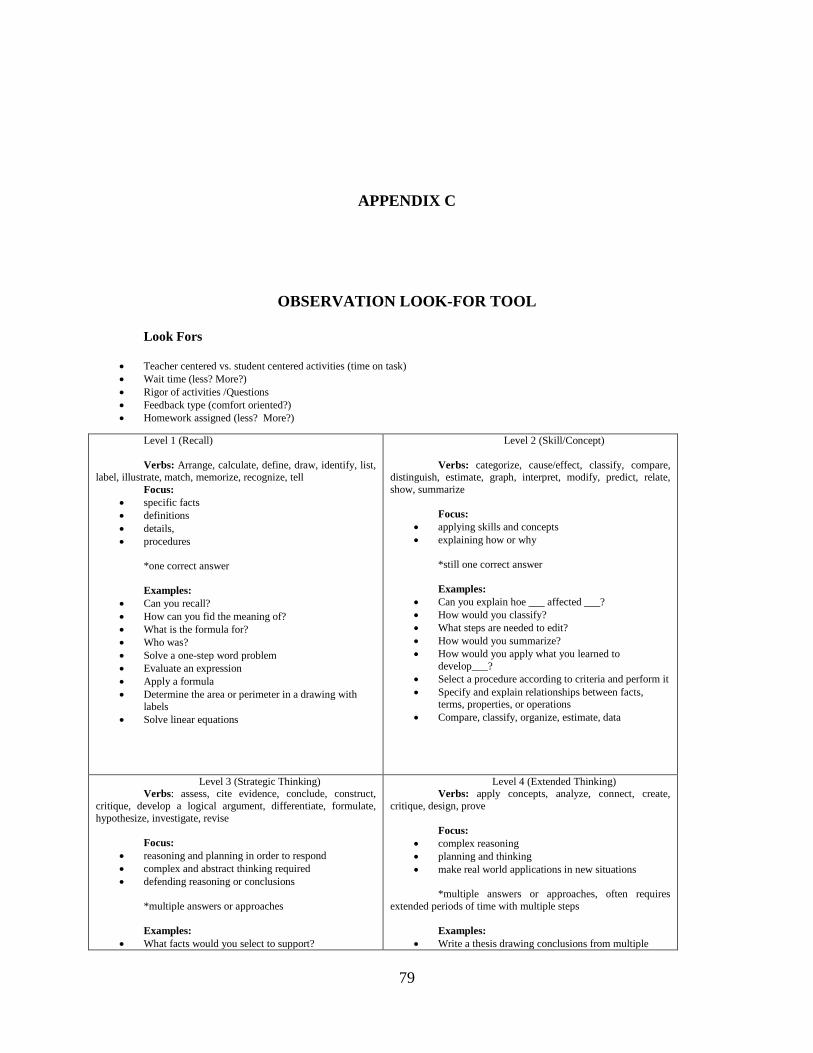
APPENDIX C
OBSERVATION LOOK-FOR TOOL
Look Fors
• Teacher centered vs. student centered activities (time on task) • Wait time (less? More?)• Rigor of activities /Questions • Feedback type (comfort oriented?) • Homework assigned (less? More?)
Level 1 (Recall)
Verbs: Arrange, calculate, define, draw, identify, list, label, illustrate, match, memorize, recognize, tell
Focus: • specific facts • definitions • details, • procedures
*one correct answer
Examples: • Can you recall?• How can you fid the meaning of? • What is the formula for? • Who was?• Solve a one-step word problem • Evaluate an expression• Apply a formula• Determine the area or perimeter in a drawing with
labels • Solve linear equations
Level 2 (Skill/Concept)
Verbs: categorize, cause/effect, classify, compare, distinguish, estimate, graph, interpret, modify, predict, relate, show, summarize
Focus: • applying skills and concepts • explaining how or why
*still one correct answer
Examples: • Can you explain hoe ___ affected ___?• How would you classify?• What steps are needed to edit? • How would you summarize? • How would you apply what you learned to
develop___? • Select a procedure according to criteria and perform it • Specify and explain relationships between facts,
terms, properties, or operations • Compare, classify, organize, estimate, data
Level 3 (Strategic Thinking) Verbs: assess, cite evidence, conclude, construct,
critique, develop a logical argument, differentiate, formulate, hypothesize, investigate, revise
Focus: • reasoning and planning in order to respond • complex and abstract thinking required • defending reasoning or conclusions
*multiple answers or approaches
Examples: • What facts would you select to support?
Level 4 (Extended Thinking) Verbs: apply concepts, analyze, connect, create,
critique, design, prove
Focus: • complex reasoning • planning and thinking • make real world applications in new situations
*multiple answers or approaches, often requiresextended periods of time with multiple steps
Examples: • Write a thesis drawing conclusions from multiple
79

• How could you test? • Can you elaborate on the reason? • Can you predict the outcome? • Best answer? Why? • What conclusion can be drawn? • Support your rationale? • Solve multiple step problem and provide support with
a mathematical explanation • Formulate an original problem
sources • Design and conduct and experiment • Apply one approach among many to solve problems • Design a mathematical model to inform/solve a
practical or abstract situation • Relate math concepts to real-world applications in
new situations
80

APPENDIX D
INTERVIEW QUESTIONS
• Tell me about your educational background.
• Can you describe your class dynamic? Tell me about the behavior, attitude, and work
ethic of students?
• How do you plan/prepare for each class level?
• Tell me how you formatively assess (check for understanding) for each level?
• What types of activities do you plan for each level?
• Do you plan more student- centered activities for higher levels or lower levels? Please
explain.
• Is there a difference between what you plan for each level and how it is carried out in
each class?
• Do you see any differences between heterogeneously tracked classes and homogeneously
tracked classes in regards to student performance? Teacher preparation? Assessment?
• When are students tracked (sorted into levels) in your school?
• How many students change levels? Do students ever begin in one track and move to a
different track? Low to high?
• What grade levels or subjects are heterogeneously tracked?
81

APPENDIX E
SUPERINTENDENT CONSENT FORM
Study of Tracking and Instruction
Superintendent of ______________ School District: As part of my doctoral studies at the University of Pittsburgh, I am conducting a research
study of the effect of teacher mindset on instruction and achievement. I will be conducting my research in two (2) district(s). In your district, ________ High School has been selected to participate. The data provided will help to understand the effect of teacher mindset on instruction, specifically in low-tracked classrooms.
With your district’s permission, I will be asking English/language arts and math teachers at the selected school to complete a teacher mindset and instructional practice survey. Following the survey, I will ask to meet with teachers to participate in interviews, and I will ask teachers to allow me to conduct two (2) observations of instruction during normal classroom time. In addition, students in each teacher’s classroom, contingent on student and parent consent, will be asked to complete a survey.
Your district’s participation in this study is entirely voluntary. Individual teachers and students will be free to decline participation at any time, and their responses will be kept strictly confidential. The data will only be used to generate statistical results. In order to protect the confidentiality of teacher and student responses, I will not report individual data from students or teachers.
I hope you will agree to participate and return this letter signed below to indicate permission to conduct this study in your district. If you have any questions about the study please contact Tawnia St.Amant at 724 875 2942. If you have further questions or want to talk with someone about the rights of research participants in your district, please contact the University of Pittsburgh IRB office at 412-383-1480, or by email at [email protected].
I sincerely hope that you decide to be part of this research project.
If you agree to participate in this study, please sign below:
____________________ _______________________ _________________ Print Name Superintendent’s Signature Date
82

APPENDIX F
STUDY INFORMATION LETTER FOR TEACHER/PARTICIPANTS
Study of Tracking and Instruction
You are being asked to participate in a research study concerning tracking and instruction. This research is being carried out by Tawnia StAmant, who is pursuing her doctoral degree at the University of Pittsburgh. This study will examine best practices for instruction and learning in low-tracked classrooms. The study will take place during normal classroom time. If you agree, you will be asked to complete a 20-minute teacher background and instructional practice survey. Following the survey, you may be asked to participate in an interview and to allow researchers to observe your class two (2) times throughout the school year. The interviews will be audio-recorded for data compilation purposes.
This study has been reviewed by the School District superintendent who has given permission to study several English/ language arts classrooms and math classrooms this year. As one of only 32 teachers selected to participate, the data collected in your classroom will help make the conclusions of this study representative of instructional practices and outcomes in your school district.
To protect your confidentiality, when the data is analyzed and reported, you will only be identified by a number, never by your name. No sensitive information is being collected and therefore, the risk to you from a confidentiality breach is minimal. Your participation is voluntary. If you choose to participate, you can stop at any time. You will also receive no compensation or extra benefits for your participation. I hope that we can use this study to see improvements in teaching and learning.
If you have any questions about the study, please contact Tawnia St.Amant, at 724 875 2942. If you have more questions, or want to talk with someone about your rights as a research participant, please contact the University of Pittsburgh IRB office at 412-383-1480, or by email at [email protected].
I sincerely hope that you decide to be part of this research project.
83
BIBLIOGRAPHY
Ansalone, G., & Biafora, F. (2004). Elementary school teachers' perceptions and attitudes to the
educational structure of tracking.
Ansalone, G. (2010). Tracking: Educational differentiation or defective strategy.
Educational Research Quarterly, 34(2), 3.
Ansalone, G., & Biafora, F. A. (2010). Tracking in the schools: Perceptions and attitudes
of parents. Race, Gender & Class, 17(1/2), 226–240.
Aronson, J., Fried, C. and Good, C. 2002. Reducing the effects of stereotype threat on
African American college students by shaping theories of intelligence. Journal
of Experimental Social Psychology, 38: 113–125.
Blackwell, L. A., Trzesniewski, K. H. and Dweck, C. S. 2007. Theories of intelligence
and achievement across the junior high school transition: A longitudinal study
and an intervention. Child Development, 78: 246–263.
Blanton, H., Buunk, B. P., Gibbons, F. X., & Kuyper, H. (1999). When better-than-
others compare upward: Choice of comparison and comparative evaluation as
independent predictors of academic performance. Journal of Personality and Social
Psychology, 76(3), 420–430.
Brophy, J., & Good, T. (1974) Teacher-student relationships: Causes and consequences.
New York: Holt, Rinehart & Winston.
84
Brophy, J. E. (1985). Teacher-student interaction. Teacher Expectancies. J. B. Dusek.
Hillsdale, N. J., Lawrence Erlbaum Associates: 303 - 328.
Brunello, G., & Checchi, D. (2007). Does school tracking affect equality of
opportunity? new international evidence. Economic Policy, 22(52), 781–861.
Caughlan, S., & Kelly, S. (2004). Bridging methodological gaps: Instructional and
institutional effects of tracking in two english classes. Research in the Teaching
of English, 39(1), 20-62.
Chmielewski, A. K., Dumont, H., & Trautwein, U. (2013). Tracking effects depend on
tracking type: An international comparison of students’ mathematics self-
concept. American Educational Research Journal, 50(5), 925–957.
Collins, K. M. (2013). Ability profiling and school failure: One child's struggle to be
seen as competent. New York: Routledge.
Conyers, M. &Wilson, D. (2013) Five big ideas for effective teaching. New York:
Teachers College Press
Covington, M.V. (1998). The will to learn. New York: Cambridge University Press.
Covington, M.V. & Beery, RG. (1976). Self-worth and school learning. New York: Holt,
Rinehart and Winston.
Dumas, F., Monteil, J. M., & Genestoux, N. (2001). Social comparison
choices in the classroom: Further evidence for students' upward comparison tendency and
its beneficial impact on performance. European Journal of SocialPsychology, 31(5),
557–578.
Dweck, C.S. (2006) Mindset: the new psychology of success. New York: Ballantine
Books.
85

Dweck, C.S. (2006) Test your mindset. Retrieved from www.mindsetonline.com.
Dweck, C. S. (2012). Mindsets and human nature: Promoting change in the middle east,
the schoolyard, the racial divide, and willpower. American Psychologist, 67(8),
614–622.
Epple, D., Newlon, E., & Romano, R. (2002). Ability tracking, school competition, and
the distribution of educational benefits. Journal of Public Economics, 83(1), 1–48.
Flessa, J. (2009). Urban school principals, deficit frameworks, and implications for
Leadership. Journal of School Leadership, 19(3), 334–373.
Gamoran, A. (2009). Tracking and inequality: New directions for research and practice
(WCER Working Paper No. 2009-6). Madison: University of Wisconsin–
Madison, Wisconsin Center for Education Research. Retrieved [e.g., August 20,
2009,] from http://www.wcer.wisc.edu/publications/workingPapers/papers.php
Gamoran, A., & Mare, R. D. (1989). Secondary school tracking and educational inequality:
Compensation, reinforcement, or neutrality? American Journal of Sociology, 94(5), 1146-
1183.
Good, C., Aronson, J. and Inzlicht, M. (2003). Improving adolescents’ standardized test
performance: An intervention to reduce the effects of stereotype threat. Journal
of Applied Developmental Psychology, 24: 645–662.
Good, C., Rattan, A., & Dweck, C. S. (2012) Why do women opt out?
A sense of belonging and women's representation in mathematics. Journal of
Personality and Social Psychology. Advance online publication.
Gutshall, C. A. (2013). Teachers’ mindsets for students with and
without disabilities. Psychology in the Schools, 50(10), 1073–1083.
86
Hallam, S., & Ireson, J. (2008). Subject domain differences in secondary school
teachers' attitudes towards grouping pupils by ability. Zbornik Instituta Za Pedagoska
Istrazivanja, 40(2), 369–387.
Harris, D. M. (2012). Varying teacher expectations and standards: Curriculum
differentiation in the age of standards-based reform. Education and Urban
Society, 44(2), 128–150.
Henderson, V. L., & Dweck, C. S. (1990). Achievement and motivation in adolescence:
A new model and data. In S. Feldman & G. Elliott (Eds.) At the threshold: The
developing adolescent. Cambridge, MA: Harvard University Press. Huguet, P.,
Jones, B. D., Bryant, L. H., Snyder, J. D., & Malone, D. (2012). Preservice and inservice
teachers’ implicit theories of intelligence. Teacher Education Quarterly, 39, 87–
101.
Kelly, S. (2004). Are teachers tracked? On what basis and with what
consequences. Social Psychology of Education, 7(1), 55–72.
Kelly, S. (2004). Do increased levels of parental involvement account for social class
differences in track placement? Social Science Research, 33(4), 626–659.
Kelly, S. & Carbonaro, W. (2012). Curriculum tracking and teacher expectations:
evidence from discrepant course taking models. Social Psychology of Education. 15(3).
271–294.
Kelly, S., & Price, H. (2011). The correlates of tracking policy: Opportunity hoarding,
status competition, or a technical-functional explanation? American Educational
Research Journal, 48(3), 560–585.
Kelly, S. & Zhang, Y. (2016). Teacher support and engagement in math and science:
87
Evidence from HSLS. The High School Journal, 99, 141–165.
Kerckhoff, A. (1993). Diverging pathways: Social structure and career deflections.
Cambridge, England: Cambridge University Press.
Kirkland, M. (1971). The effects of tests on students and schools. Review of
Educational Research, 41(4), 303–350.
Labaree, D. F. (2011). Consuming the public school. Educational Theory, 61(4), 381–
394.
LeTendre, G. K., Hofer, B. K., & Shimizu, H. (2003). What is tracking? Cultural
expectations in the United States, Germany, and Japan. American Educational
Research Journal, 40(1), 43–89.
Loveless, T. (2013). Brown Center on Education Policy. The brown center report
on american education. Retrieved from:
http://www.brookings.edu/research/reports/2013/03/18-tracking-ability-grouping-
Loveless
Mac Iver, D. (1987). Classroom factors and student characteristics predicting
students' use of achievement standards during ability self-assessment. Child
Development, 58(5), 1258–1271.
Mickelson, R. A. (2003). The academic consequences of desegregation and segregation:
Evidence from the charlotte-mecklenburg schools. North Carolina Law Review,
81(4), 1513.
Mirel, J.E. & Angus, D.L. (1986). The rising tide of custodialism: enrollment
88
increases in curriculum reform in Detroit, 1928-1940. Issues in Education
4, 101-120.
Molden, D. C., Plaks, J. E., & Dweck, C. S. (2006). “Meaningful” social inferences:
Effects of implicit theories on inferential processes. Journal of Experimental
Social Psychology, 42(6), 738–752.
Mosteller, F., Light, R., & Sachs, J. (1996). Sustained inquiry in education. Harvard
Educational Review, 66 (4), 797–842.
Mulkey, L. M., Catsambis, S., Steelman, L. C, & Crain, R. L. (2005). The long-term
effects of ability grouping in mathematics: A national investigation. Social Psychology of
Education, 8(2), 137–177.
National Mathematics Advisory Panel. (2008). Foundations for success: The final report
of the National Mathematics Advisory Panel. Jessup, MD: U.S. Department of
Education. National Science Foundation. (2006).
Nussbaum, A. D., & Dweck, C. S. (2008). Defensiveness versus remediation: Self-
theories and modes of self-esteem maintenance. Personality and Social
Psychology Bulletin, 34, 599–612.
Oakes, J., Quartz, K., Ryan, S. & Lipton, M. (2000). Becoming good American schools.
San Fransico: Josey Bass.
Oliver, R. G. (2002). A practical guide for medical teachers: J. A. dent and R. M. harden
(eds) churchill livingstone, 2001 Journal of Orthodontics, 29(2), 151.
Plaks, J. E., Stroessner, S. J., Dweck, C. S., & Sherman, J. W. (2001). Person theories
and attention allocation: Preferences for stereotypic versus counterstereotypic
information. Journal of Personality and Social Psychology, 80(6), 876.
89

Rattan, A., Good, C., & Dweck, C. (2012). It’s ok-not everyone can be good at
math: Instructors with an entity theory comfort (and demotivate)
students. Journal of Experimental Social Psychology, 48, 731–737.
Rosenthal, R., & Jacobson, L. (1968). Pygmalion in the classroom: Teacher expectation
and pupils’ intellectual development. New York, NY: Holt, Rinehart, & Winston.
Rubie‐Davies, C. M. (2006). Teacher expectations and student self‐perceptions:
Exploring relationships. Psychology in the Schools, 43(5), 537–552.
Suls, J., & Wheeler, L. (2000). A selective history of classic and neo-social comparison
theory. In J. Suls & L. Wheeler (Eds.), Handbook of social comparison: Theory
and research (pp. 1-23). Dordrecht, Netherlands: Kluwer.
Teaching inequality: The problem of public school tracking. (1989).
Harvard Law Review, 102(6), 1318–1341.
Teachers Matter: Understanding Teachers' Impact on Student Achievement. Santa
Monica, CA: RAND Corporation, 2012.
https://www.rand.org/pubs/corporate_pubs/CP693z1-2012-09.html.
Vanfossen, B., Jones, J., & Spade, J. (1987). Curriculum tracking and status
maintenance. Sociology of Education, 60, 104–122.
Van Houtte, M., Demanet, J., & Stevens, P. A. J. (2013). Curriculum tracking and
teacher evaluations of individual students: Selection, adjustment or
labeling? Social Psychology of Education, 16(3), 329–352.
Webb, N. L. (2007). Issues related to judging the alignment of curriculum standards and
assessments. Applied Measurement in Education, 20, 7–25.
Weinstein, R. S. (1996). High standards in a tracked system of schooling: For which
90
students and with what educational supports. Educational Researcher, 25(8), 16–
19. Wheelock, A. (1992). Crossing the tracks. New York: New Press.
Worthy, J. (2010). Only the names have been changed: Ability grouping revisited.
The Urban Review, 42(4), 271–295.
Wyse, A.E. & Viger, S.G. (2011). How item writers understand depth of knowledge.
Educational Assessment. 16(4), 185-206.
91