the effect of protected federal lands on economic ... in the non-metropolitan west ... effect of...
TRANSCRIPT

The Effect of Protected Federal Lands on Economic Prosperity in the Non-metropolitan West Ray Rasker#, Patricia H. Gude#, and Mark Delorey† #Headwaters Economics, Bozeman, MT – USA, †Ft. Collins, CO – USA
Abstract. The purpose of the study is to determine whether protected federal lands in the non-metropolitan U.S. West are associated with increased or decreased economic performance. A subset of federal lands managed by the National Park Service, the Forest Service, the Bureau of Land Management, or the Fish and Wildlife Service was considered protected and primari-ly managed for conservation. Generalized estimating equations were used to regress ten eco-nomic measures on protected land area while accounting for various confounding factors in-cluding presence of other natural amenities and degree of access to markets. Three economic measures were positively associated with protected public lands: per capita income (2010), growth in per capita income (1990-2010), and growth in per capita investment income (1990-2010). The study finds that, on average, counties with national parks, wilderness, and other forms of protected public lands benefit through increased economic performance.
1. Introduction
Environmental and recreational amenities can play a role in attracting people and stimulating eco-nomic activity in the non-metro (non-metropolitan) U.S. West. Federal lands, such as those managed by the U.S. Forest Service, the Bureau of Land Man-agement, and the National Park Service, provide many of these amenities. Almost half (46%) of the land in the West is managed by the federal govern-ment. These public lands include forests, wetlands, mountain ranges, rivers, and lakes that provide a vast array of outdoor opportunities, from hunting and fishing to wildlife viewing, skiing, and moun-tain biking (Riebsame et al., 1997). In this paper, we explore whether the presence of protected federal public lands, such as national parks, wilderness, and national monuments, is associated with higher levels of economic performance in non-metro counties. We define these as western counties identified by the U.S. Census Bureau as Rural Area or Micropoli-tan Statistical Area counties.
The economic role of public lands in the non-metropolitan West has its roots in a shift in thinking about what drives the development and migration process. In the past, economic theory described the process of development as “jobs first—then migra-tion.” The popular belief was that the opening of a factory, mine, or lumber mill created a demand for labor, and people migrated into an area to fill job openings. Today much of the population growth in the West can be explained instead by “migration first—then jobs,” where people first decide where they want to live, based in part on quality of life considerations, and then either look for a job, create jobs for themselves, or live off investment and retirement income.
The role of amenities in stimulating population growth and business location has become a growing area of inquiry. One argument suggests that recent advances in communications technologies and the decoupling of knowledge-based production from centralized manufacturing centers now allow people to do their work in remote rural locations.
JRAP 43(2): 110-122. © 2013 MCRSA. All rights reserved.
Effect of Protected Federal Lands on Economic Prosperity 111
According to Decker and Crompton (1993) many companies have become footloose, able to locate an-ywhere the owners want to live.
This phenomenon is not entirely new. In 1954, geographer Edward Ullman wrote that amenities are so important to footloose businesses that “the climate of California and Florida takes its place as a population magnet along with the coal of Pittsburgh and the soil of Iowa.” In other words, he suggested that environmental amenities might be as important as physical resources. He predicted that advances in technology would facilitate such a movement, as “cheap atomic or solar energy will make men still more footloose” (Ullman, 1954). Had he been able to predict the development of telecommunications technology and transportation infrastructure, he might instead have discussed the role of computers, fiber optic networks, the Internet, and improved transportation networks leading to accessible airline travel and overnight delivery services such as UPS and Federal Express.
The positive relationship between the presence of amenities and economic growth occurs through a number of mechanisms. One of them is amenity migration, which is the phenomenon of people mov-ing to live and work in areas of high natural ameni-ties (Chi and Marcouiller, 2012; Rasker et al., 2009; Gosnell and Abrams, 2009; Moss, 2006; Nelson, 2006). Advances in telecommunications technology, efficient and cost-effective delivery services such as FedEx and UPS, and the growth of regional airports and transportation infrastructure have made it pos-sible for some people to live in a rural setting while conducting business in a global economy (Beyers et al., 1996; McGranahan and Wojan, 2007). In the past, the vast distances of the West were an impediment to business trying to get products to markets, while in today’s economy these wide-open spaces are an asset that attracts people and business to some communities (Nelson, 2006; Lorah and Southwick, 2003; Deller et al., 2001).
The changing structure of the economy creates another opportunity for people and businesses to locate in the rural West. In the past, the economy of the non-metro West was dependent on agriculture and the extraction of oil, natural gas, coal, minerals, and wood products. Today, little of this region’s economy depends on these sectors. In 2010, agricul-ture in the non-metro West represented five percent of total employment, while the combined resource extraction industries constituted two percent of total employment. In contrast, 61 percent of all employ-ment in the non-metro West is in services, which
includes sectors such as professional and technical services (e.g., architects, engineers), educational and health services, utilities, finance and insurance, management of companies, arts and entertainment, and accommodation and food services. An addi-tional 18 percent of employment is in local, state, and federal government (U.S. Department of Com-merce, 2012).1
Rapid growth of non-labor income, which con-sists of dividends, interest, and rent (i.e., money earned from investments) and transfer payments (e.g., Medicare, retirement) represents another sig-nificant change in the region. In the non-metro West, non-labor income represented 40 percent of total personal income in 2010 and 65 percent of net new real income from 2000 to 2010 (U.S. Department of Commerce, 2011).
These changes reflect a restructuring of the glob-al economy, wherein some professionals, such as software developers, financial consultants, engi-neers, architects, and those in other “knowledge-based” service occupations, have been able to de-couple from the city and the factory floor, thereby becoming “footloose,” able to live almost anywhere (Cromartie and Nelson, 2009; McGranahan and Wojan, 2007; Gude et al., 2006; Vias and Carruthers, 2005; Beyers and Lindahl, 1996; Johnson and Rasker, 1995). These transformations of conventional con-straints on business location opened up parts of the country that were historically excluded from nation-al and international business networks, including much of the non-metro West. The rapid growth in non-labor income also means that parts of the West are attracting people with retirement and invest-ment income.
2. Literature review: the economic role of amenities and federal public lands
For the last two decades, a number of studies have investigated the economic role of amenities, including the role of public lands. Power (1991) ar-gued that “footloose entrepreneurs” bring their businesses with them when they locate to scenic ar-eas like Greater Yellowstone (also Cromartie and Wardwell, 1999; Nelson, 1999). Whitelaw and Nie-mi (1989) and Whitelaw (1992) argued that a new
1 We define resource extraction industries as the following from of the North American Industrial Classification System: Mining (including oil, gas, coal; NAICS 21), Timber (NAICS 321, 322). Services are defined as NAICS codes 22, 42, 44, 48, 51, 52, 53, 54, 55, 56, 61, 62, 71, 72, and 81.
112 Rasker, Gude, and Delorey
theory of economic development was needed, away from “jobs first, then migration,” to “migration first, then jobs.” They argued that today people decide where they want to live first and are closely influ-enced in their migration decision by the presence of amenities. This idea was confirmed by other stud-ies. Knapp and Graves (1989) reviewed the litera-ture and found that “employment growth appears to be caused largely by population growth rather than conversely.” Beyers and Lindahl (1996) surveyed rural owners of producer service firms, defined as firms in relatively high-wage sectors such as engi-neering, architecture, and information technology, and found that more than two-thirds of these export-oriented businesses cited quality of life fac-tors as the most important reason for their business location.
Snepenger et al. (1995) found that quality-of-life factors (environmental, recreational, and social amenities) are important in business owners’ deci-sions to locate in the northern portion of the Greater Yellowstone region. Nelson (1999) has shown that natural amenities, including those offered by public lands, are a key to attracting knowledge-based workers. McGranahan (1999) compared the popula-tion growth rates of U.S. counties, taking into ac-count measures such as climate, topography, and water area, and found that the highest growth oc-curred in counties with natural amenities. Shum-way and Otterstrom (2001) found that the greatest number of new migrants to the West were in coun-ties that they call “New West” counties, character-ized by their recreational nature, scenic amenities, proximity to national parks or other federal lands, and preponderance of service-based economies. They concluded that the importance of mineral, cat-tle, and lumber production is minimized in an econ-omy that is now based on “a new paradigm of the amenity region, which creates increased demands for amenity space, residential and recreational prop-erty, second homes, and environmental protection.”
A number of studies have shown that western counties with protected federal lands have faster rates of economic growth. Rudzitis and Johanson (1989, 1991) and Rudzitis (1993) demonstrated that counties with congressionally-designated wilderness areas grew faster than non-wilderness counties, and wilderness was an important motivator for reloca-tion according to new residents. Lorah and South-wick (2003) analyzed the relationship between the presence of protected lands (national monuments, national parks, and wilderness) and the performance
of the local counties’ economies. Their findings show that from 1969 to 1999 the population, em-ployment, and income growth rates were much higher for the non-metro counties with protected lands than those without protected lands. They also found that in the non-metro portions of the West the highest level of environmental protection on public lands is associated with the highest levels of growth. Holmes and Hecox (2002) found a significant posi-tive correlation between the percent of congression-ally-designated Wilderness land in a county and growth in population, income, and employment from 1970 to 2000. They concluded: “Wilderness counties generate far more growth in lower paying industries like hotels and other lodging places and eating and drinking establishments, but they also have remarkable growth in higher paying profes-sional services like legal services and investment offices relative to non-Wilderness counties in the rural West.” Rasker (2006) has also shown that pro-tected public lands, set aside for conservation and recreation rather than commodity production, are significant drivers of economic growth, and that higher levels of protection have led to faster rates of economic growth.
Several authors have pointed out that while pub-lic lands amenities may be important, they are by themselves not sufficient for stimulating and sus-taining economic growth. Booth (1999), in a study of growth in the mountainous states of the rural West, found that two forces are at work in determining growth:
On the one hand, the beauty of the landscape and other amenities are attracting population and in-come. On the other hand, access to regional met-ropolitan centers continues to be an important el-ement in locational decisions. The net result is that counties outside the commuting range of these metropolitan centers, but with close access and good interstate connections have greater popula-tion densities and more growth in densities than less accessible counties.
Rasker et al. (2009) and Rasker and Hansen (2000) confirmed the importance of access to mar-kets and larger population centers, particularly via commercial air service, in spite of the increasing im-portance of amenities to migration and business lo-cation. In addition, some studies have pointed to a neutral or negative economic effect associated with protected public lands. Lewis, Hunt, and Platinga (2002) discovered that public land conservation is associated with more robust population growth but

Effect of Protected Federal Lands on Economic Prosperity 113
not employment growth: “We find that net migra-tion rates were higher in counties with more conser-vation lands, but the effects are relatively small. No significant effect on employment growth is detect-ed.” Lewis, Hunt, and Platinga (2003) also discov-ered that public lands management practices, whether “preservationist” or “extractive,” had no effect on wage growth. Duffy-Deno (1998), in a study of 250 non-metro counties in the Rocky Moun-tains, found no evidence that the presence of con-gressionally-designated federal wilderness in the intermountain states was either directly or indirectly associated with growth in population or employ-ment. Eichman et al. (2010) found that the North-west Forest Plan, which reallocated 11 million acres of federal land from timber production to protecting old-growth forest species, led to a decrease in local employment growth and an increase in net migra-tion. They found that “The total negative effect on employment was offset only slightly by positive mi-gration-driven effects.” Charney, McLain, and Do-noghue (2008), who also reviewed the economic ef-fects of the Northwest Forest Plan, found that the shift from resource extraction to conservation did not always lead to amenity migration and communi-ty development.
This paper adds to a growing body of literature by exploring the economic role of protected public lands in the non-metro West during a period that includes rapid economic growth and a surge of amenity migration (1990s and the early half of the 2000s) and extends into a period that includes eco-nomic decline during the Great Recession (up until 2010). This paper offers a unique quantitative analy-sis of the economic effect of protected public lands by controlling for the effects of confounding factors, including the presence of other public lands, ameni-ties, and access to markets.
3. Data and methods
The study focused on non-metro (non-metropol-itan) counties in the West, excluding those counties defined by the U.S. Census Bureau as Central or Outlying Metropolitan Statistical Area Counties (Figure 1). The studied counties included 284 of the 413 counties in the contiguous western United States (Arizona, California, Colorado, Idaho, Montana,
New Mexico, Nevada, Oregon, Utah, Washington, and Wyoming). Metropolitan economies are large enough that we would not expect the presence of protected lands to be an important driver of eco-nomic activity in these counties.
3.1. Protected public lands (explanatory variables)
We adopted the definition of “protected public lands” from Rasker et al. (2009), in which specific federal land designations of the National Park Ser-vice (NPS), the Forest Service (FS), the Bureau of Land Management (BLM), or the Fish and Wildlife Service (FWS) were considered protected. These designations are: National Parks and Preserves (NPS), Wilderness (NPS, FWS, FS, BLM), National Conservation Areas (BLM), National Monuments (NPS, FS, BLM), National Recreation Areas (NPS, FS, BLM), National Wild and Scenic Rivers (NPS, FS, BLM), Waterfowl Production Areas (FWS), Wildlife Management Areas (FWS), Research Natural Areas (FS, BLM), Areas of Critical Environmental Concern (BLM), and National Wildlife Refuges (FWS). Lands administered by other federal agencies (including the Army Corps of Engineers, Bureau of Reclama-tion, Department of Defense, Department of Energy, and Department of Transportation) were not includ-ed, nor were state, local, or private lands. This defi-nition of protected public lands attempts to include areas that have a higher level of regulation against commercial extractive uses than other federal lands and a less changeable status than other designations (for example, Wilderness Study Areas and Invento-ried Roadless Areas).
Statistical analyses were conducted to determine whether or not the presence of more protected pub-lic lands in non-metro western counties is associated with increases or decreases in county economic measures. The explanatory variables were: (1) the acreage of protected public land per county, and (2) the sum of the acreage of protected public land in adjacent counties. These two variables were derived using Geographic Information Systems (GIS). The data sources were state-specific: Conservation Biol-ogy Institute, 2006, 2008; Arizona Land Resources Information System, 2009; and Montana Natural Heritage Program, 2008.

114 Rasker, Gude, and Delorey
Figure 1. Total area of protected public land for each of the 284 non-metro counties in the West.
3.2. Economic measures (response variables)
Ten economic variables were identified as being representative of overall county economic health (Table 1). The Bureau of Economic Analysis’ Re-gional Economic Information System (REIS) (U.S. Department of Commerce, 2011) provided source data for seven of these variables. REIS reports em-ployment by place of work and income by place of residence, which is optimal for evaluating the ossi-ble relationships between protected public lands, jobs, and income. All other sources were from the U.S. Census Bureau’s Population Division, the De-cennial Census, and the County Business Patterns database. Most of the economic measures used in this analysis are not available for geographies small-er than counties. We used the consumer price index
to adjust all dollar amounts to 2011 dollars prior to making other calculations.
Per capita income (PCI), average earnings per job, total employment, and total income were ob-tained from REIS Table CA30, Linecodes 110, 290, 240, and 10, respectively. Investment income was obtained from REIS Table CA05n, Linecode 46 (div-idends, interest, and rent), and age-related non-labor income was obtained from REIS Table CA35, by summing the values of Linecodes 30 (retirement and disability insurance benefits) and 111 (Medicare benefits).
Population-adjusted net migration was obtained from the U.S. Census Bureau's Population Division (U.S. Department of Commerce, 2010) by sum- ming domestic net migration with international net
Effect of Protected Federal Lands on Economic Prosperity 115
migration and dividing by the estimated population in 1990. The percent of the population greater than 25 years of age with a bachelor’s degree was ac-quired from the Decennial Census of Population and Housing (U.S. Department of Commerce, 2010b). Education was used as a measure of the quality of human resources and the potential for economic de-velopment, i.e., occupations such as engineering, architecture, finance, health care, and other jobs that require college-educated workers. Lastly, the Cen-sus Bureau’s County Business Patterns (CBP) data set (U.S. Department of Commerce, 2010c), which offers a more detailed breakdown of industries than
REIS, was used to calculate employment in high-wage services. High-wage services were defined as the following industries, as classified in the North American Industrial Classification system (NAICS): information (NAICS 51); finance and insurance (NA-ICS 52); real estate and rental and leasing (NAICS 53); professional, scientific, and technical services (NAICS 54); management of companies and enter-prises (NAICS 55); utilities (NAICS 22); educational services (NAICS 61); and health care and social as-sistance (NAICS 62). These are also occupations that are likely to require a college degree (Gude et al., 2012).
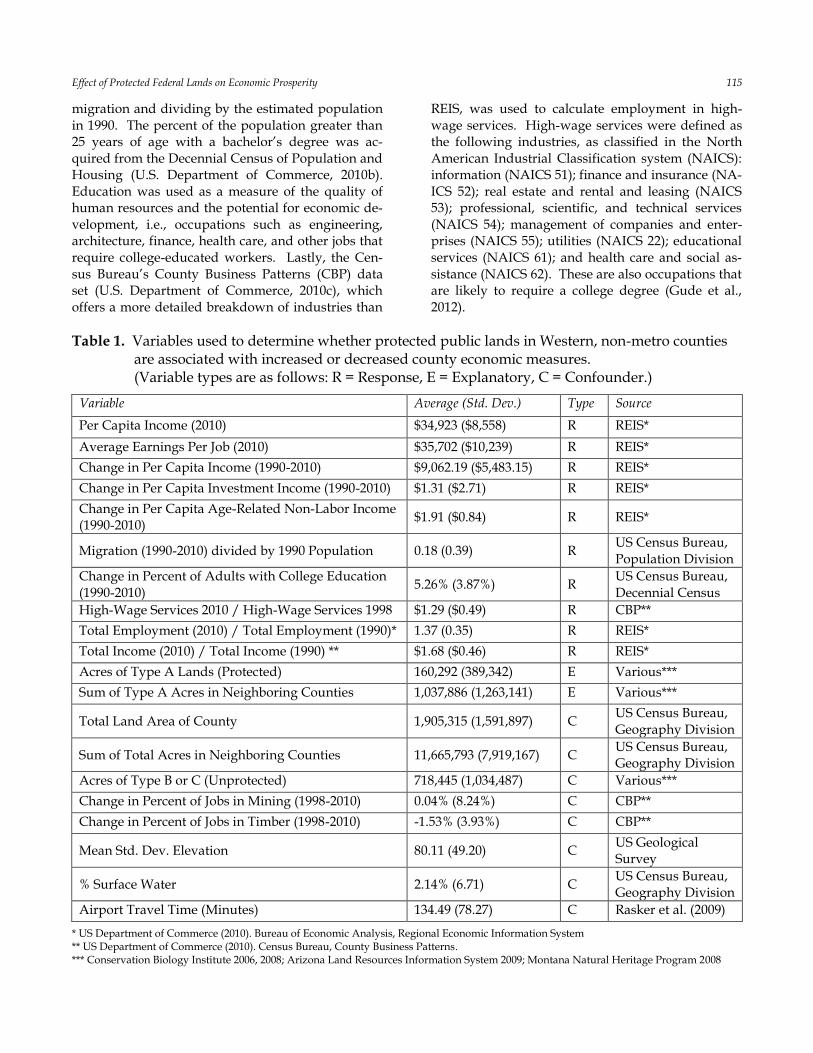
Table 1. Variables used to determine whether protected public lands in Western, non-metro counties are associated with increased or decreased county economic measures. (Variable types are as follows: R = Response, E = Explanatory, C = Confounder.)
Variable Average (Std. Dev.) Type Source
Per Capita Income (2010) $34,923 ($8,558) R REIS*
Average Earnings Per Job (2010) $35,702 ($10,239) R REIS*
Change in Per Capita Income (1990-2010) $9,062.19 ($5,483.15) R REIS*
Change in Per Capita Investment Income (1990-2010) $1.31 ($2.71) R REIS*
Change in Per Capita Age-Related Non-Labor Income (1990-2010)
$1.91 ($0.84) R REIS*
Migration (1990-2010) divided by 1990 Population 0.18 (0.39) R US Census Bureau, Population Division
Change in Percent of Adults with College Education (1990-2010)
5.26% (3.87%) R US Census Bureau, Decennial Census
High-Wage Services 2010 / High-Wage Services 1998 $1.29 ($0.49) R CBP**
Total Employment (2010) / Total Employment (1990)* 1.37 (0.35) R REIS*
Total Income (2010) / Total Income (1990) ** $1.68 ($0.46) R REIS*
Acres of Type A Lands (Protected) 160,292 (389,342) E Various***
Sum of Type A Acres in Neighboring Counties 1,037,886 (1,263,141) E Various***
Total Land Area of County 1,905,315 (1,591,897) C US Census Bureau, Geography Division
Sum of Total Acres in Neighboring Counties 11,665,793 (7,919,167) C US Census Bureau, Geography Division
Acres of Type B or C (Unprotected) 718,445 (1,034,487) C Various***
Change in Percent of Jobs in Mining (1998-2010) 0.04% (8.24%) C CBP**
Change in Percent of Jobs in Timber (1998-2010) -1.53% (3.93%) C CBP**
Mean Std. Dev. Elevation 80.11 (49.20) C US Geological Survey
% Surface Water 2.14% (6.71) C US Census Bureau, Geography Division
Airport Travel Time (Minutes) 134.49 (78.27) C Rasker et al. (2009)
* US Department of Commerce (2010). Bureau of Economic Analysis, Regional Economic Information System ** US Department of Commerce (2010). Census Bureau, County Business Patterns. *** Conservation Biology Institute 2006, 2008; Arizona Land Resources Information System 2009; Montana Natural Heritage Program 2008
116 Rasker, Gude, and Delorey
3.3. Confounding variables
Eight variables were identified as possibly con-founding associations between the protected public land variables and the economic variables (Table 1). Both total county area and the area in surrounding counties were treated as offset variables. The effect of an offset is to normalize the within county area of protected public lands or neighboring area of pro-tected public lands, respectively. The area of land in each county considered to be “unprotected public” was one potential confounding variable and was defined as NPS, FS, BLM, and FWS lands with des-ignations other than those that we considered pro-tected. This variable was included to evaluate whether the level of protection matters, versus the presence of any federal public lands, by isolating the effect of protection.
Mining and Timber employment data were ob-tained from CBP. These variables were included to account for the effects on economic performance of industries that fluctuate with commodity markets, for example the rise and fall in prices for natural re-sources. Mining (NAICS 21) consists of oil and gas extraction, mining except oil and gas, and support activities for mining. In addition, we added NAICS 486 and 237120, which capture oil and gas pipeline industries and employment. Timber was defined to include the manufacturing of wood products and paper (NAICS 113, 1153, 3211, 3221, 3212, 3219, 3222, 325191, 337129, and 337211). Like REIS, CBP reports employment by place of work.
Two variables were used to represent natural amenities that sometimes co-occur with protected public lands and thus may interfere with our ability to detect a true association between the protected public land variables and the economic variables: (1) mean variation in elevation, used to differentiate between mountainous and flat counties, and (2) per-cent of area that is surface water. Both of these vari-ables were calculated using GIS.
The last potential confounding variable was ac-cess to major airports, which has a demonstrated effect on economic performance (Rasker et al., 2009). The mean drive time to the nearest major airport was calculated following the methods of Rasker et al. (2009). Major airports were identified as those with greater than 15,000 enplanements per year. This level of traffic represents airports where resi-dents have the choice of several commercial flights per day. Travel time to the nearest major airport was calculated using cost-distance grid functions incorporating distance and automobile speed limits.
3.4. Statistical analyses
All statistical analyses were performed using R version 2.15.1. Redundancies in information con-tained in the economic variables and in the con-founding variables were investigated using princi-pal component analysis (PCA). Variable sets whose dimension could be reduced were replaced by a number of principal components if the set of princi-pal components could explain at least 85% of the variability in the complete variable set. Economic variables and the protected public land variables, as separate sets, were regressed on the potential con-founders to adjust for confounding effects.
In regressing the economic variables on the con-founders, three economic variables, High-Wage Services 2010 / High-Wage Services 1998, Total Employment 2010 / Total Employment 1990, and Total Income 2010 / Total Income 1990, were log-transformed prior to performing the regression. The matrix of economic variables was vectorized, and this vector of economic variables was regressed on the set of confounding variables using generalized estimating equations (GEE) assuming a normal dis-tribution. The covariance structure accounted for the correlation among variables from the same coun-ty and heteroskedasticity among the different eco-nomic variables.
The explanatory variables (protected public acre-age and protected public acreage in neighboring counties) were regressed on the confounders using a hurdle model with a binomial distribution assumed for the zero process, a negative binomial distribution assumed for the count process, and a random effect for county. Total county acreage or total neighbor-ing county acreage was included, as appropriate, as an offset in the count process portion of the model.
The explicit statistical model is:
𝑋 = {0 with probability 1 − 𝑝
𝑥 with probabilty 𝑝(𝜋𝑓(𝑥)), 𝑥 > 0 (1)
𝑌 = 𝑍𝛼 + 𝑋𝛽 + 𝜀, (2)
𝜀 ~ 𝑁(0, Σ), (3)
where 𝑝 =exp(𝑍𝛾+𝜏)
1+exp(𝑍𝛾+𝜏); 𝜋 =
1
1−𝑓(0); 𝜏 ~ 𝑁(0, 𝛤);
𝑓(𝑥) is the negative binomial mass function; Z and X are matrices of (reduced) confounders and explana-tory variables, respectively; α, β, and γ are vectors of unknown model parameters (to be estimated); ∑ is a covariance matrix of economic variables accounting for heteroskedasticity among counties

Effect of Protected Federal Lands on Economic Prosperity 117
and correlation within counties; and Γ is a covari-ance matrix of explanatory variables accounting for heteroskedasticity among counties and correlation within counties.
Normalized residuals were computed for both regressions, resulting in a set of economic residuals and a set of protected public land residuals. The economic residuals were then regressed on the pro-tected public land residuals using GEE, accounting for correlation within county and heteroskedasticity among economic residuals. Standard diagnostics were performed to ensure that distributional as-sumptions were reasonable. Estimated coefficients were interpreted as the increase in standard devia-tions of a response for an increase of one standard deviation of protected public land or neighboring protected public land. Where appropriate, results were back-transformed to the scale of the original data.
4. Results
In the 284 non-metro counties in the West, a total of 46.2 million acres of protected public lands are currently designated. Sixty-one non-metro western counties contain no protected public lands, 50 con-tain between 1,000 and 10,000 acres, 99 contain be-tween 10,000 and 150,000 acres, and 76 contain more
than 150,000 acres (Figure 1). Only nine non-metro western counties contain more than one million acres of protected public lands. These counties are: Inyo County, CA; Idaho County, ID; Valley County, ID; Flathead County, MT; Humboldt County, NV; Lincoln County, NV; Kane County, UT; Park Coun-ty, WY; and Teton County, WY.
The information contained in the ten economic variables could not be reduced to fewer than seven principal components. Therefore, the original ten variables were retained. The information contained in the six confounding variables was found to be reducible to three principal components with these three components preserving 89% of the variability of the original six variables. Regressions involving the set of confounding variables used the first three principal components of the confounding variables.
Three of the economic variables were found to be positively associated with the area of protected pub-lic land within the same county. These are shown in Table 2. With all other factors held constant, an in-crease in 10,000 acres of protected public land is as-sociated with a mean increase in per capita income (2010) of $436 (95% CI $115-758), with a mean in-crease in change in per capita income (1990-2010) of $237 (95% CI $42-433), and a mean change in in-vestment income (1990-2010) of $175 per person (95% CI $83-280).
Table 2. Economic variables associated with protected public lands in the same county.
Mean increase for a change in
10,000 acres of protected public land within the same county
95% Confidence Interval
Per Capita Income (2010) $436 $115 to 758
Change in Per Capita Income (1990-2010)
$237 $42 to 433
Change in Per Capita Investment Income (1990-2010)
$175 $83 to 280
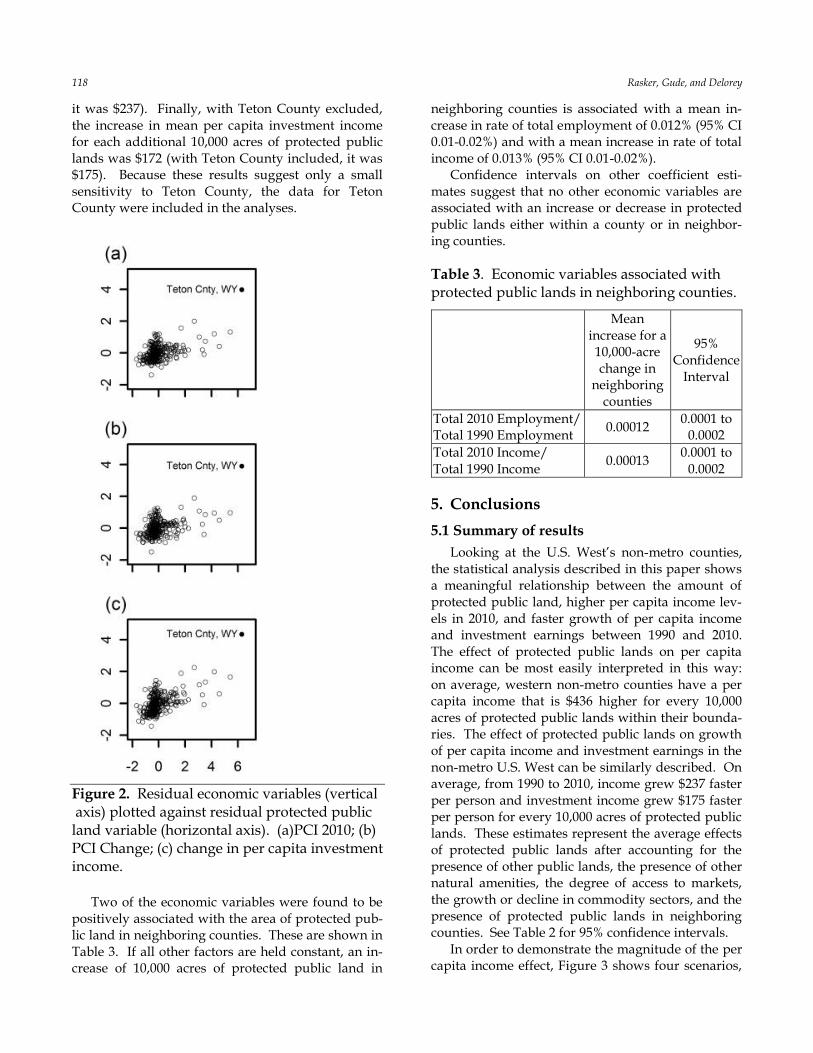
Figure 2 shows pairwise plots of normalized re-
siduals for the three economic factors associated with protected public lands. The horizontal axis in all three plots represents the normalized residuals for protected public lands after accounting for con-founding effects. Plotted on the vertical axes of Fig-ures 2(a), 2(b), and 2(c) are the normalized residuals, after accounting for confounding effects, of PCI 2010, PCI change, and change in per capita invest-ment income. Each graph shows that an increase in residual protected public lands is associated with an increase in the respective residual economic varia-ble. The residuals for Teton County, WY, are indi-
cated in each of the plots in Figure 2 by the solid dot. While generally consistent with the observed trend of the plots, diagnostics indicate that Teton County does have high influence and leverage. Its influence and leverage are within acceptable bounds, but re-sults were computed both with and without Teton County. With Teton County excluded, the increase in mean PCI 2010 for each additional 10,000 acres of protected public lands was $424 (with Teton County included, it was $436, as shown in Table 2). With Teton County excluded, the increase in mean PCI Change for each additional 10,000 acres of protected public lands was $230 (with Teton County included,
118 Rasker, Gude, and Delorey
it was $237). Finally, with Teton County excluded, the increase in mean per capita investment income for each additional 10,000 acres of protected public lands was $172 (with Teton County included, it was $175). Because these results suggest only a small sensitivity to Teton County, the data for Teton County were included in the analyses.
Figure 2. Residual economic variables (vertical axis) plotted against residual protected public land variable (horizontal axis). (a)PCI 2010; (b) PCI Change; (c) change in per capita investment income.
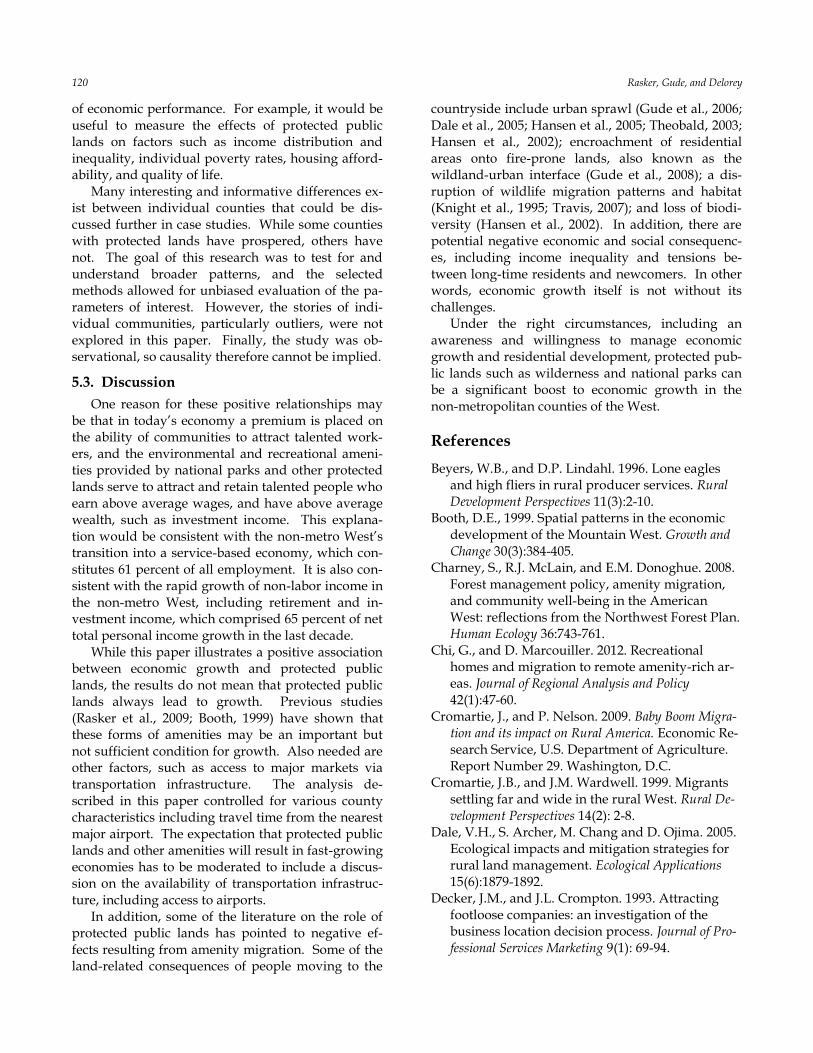
Two of the economic variables were found to be positively associated with the area of protected pub-lic land in neighboring counties. These are shown in Table 3. If all other factors are held constant, an in-crease of 10,000 acres of protected public land in
neighboring counties is associated with a mean in-crease in rate of total employment of 0.012% (95% CI 0.01-0.02%) and with a mean increase in rate of total income of 0.013% (95% CI 0.01-0.02%).
Confidence intervals on other coefficient esti-mates suggest that no other economic variables are associated with an increase or decrease in protected public lands either within a county or in neighbor-ing counties.
Table 3. Economic variables associated with protected public lands in neighboring counties.
Mean increase for a 10,000-acre change in
neighboring counties
95% Confidence
Interval
Total 2010 Employment/ Total 1990 Employment
0.00012 0.0001 to
0.0002
Total 2010 Income/ Total 1990 Income
0.00013 0.0001 to
0.0002
5. Conclusions
5.1 Summary of results
Looking at the U.S. West’s non-metro counties, the statistical analysis described in this paper shows a meaningful relationship between the amount of protected public land, higher per capita income lev-els in 2010, and faster growth of per capita income and investment earnings between 1990 and 2010. The effect of protected public lands on per capita income can be most easily interpreted in this way: on average, western non-metro counties have a per capita income that is $436 higher for every 10,000 acres of protected public lands within their bounda-ries. The effect of protected public lands on growth of per capita income and investment earnings in the non-metro U.S. West can be similarly described. On average, from 1990 to 2010, income grew $237 faster per person and investment income grew $175 faster per person for every 10,000 acres of protected public lands. These estimates represent the average effects of protected public lands after accounting for the presence of other public lands, the presence of other natural amenities, the degree of access to markets, the growth or decline in commodity sectors, and the presence of protected public lands in neighboring counties. See Table 2 for 95% confidence intervals.
In order to demonstrate the magnitude of the per capita income effect, Figure 3 shows four scenarios,

Effect of Protected Federal Lands on Economic Prosperity 119
ranging from 0 to 100,000 acres of protected public lands in non-metro western counties. The increase in per capita income explained by protected public lands ranges from $0 to $4,360 (95% CI $1,150-7,580). For example, all else being equal, a non-metro west-ern county with 50,000 acres of protected public
lands will have on average a per capita income that is $2,180 (95% CI $575-3,790) higher than a county with no protected public lands. To put this premi-um in perspective, the average per capita income for all non-metro western counties was $34,870 in 2010 (U.S. Department of Commerce, 2011).
Figure 3. The effect of protected public lands on per capita income. The effect is demonstrated for four
hypothetical non-metro counties that have 0, 10 thousand, 50 thousand, and 100 thousand acres of protected public lands. All else equal, the associated increase in income would be $0, $436, $2,180, and $4,360 per person. Confidence intervals are displayed with error bars.
Our analysis also indicates a positive relationship
between protected public lands in neighboring counties, growth in employment, and growth in in-come from 1990 to 2010. The estimated effect size is so small that these relationships, however, do not appear to be meaningful on their own. Collectively, the relationships described in this paper indicate that national parks, wilderness, national monu-ments, and other forms of protected public lands are beneficial to economic performance.
5.2 Limitations
Caution and reason should be used in interpret-ing the statistical results described in this paper. The linear relationship found between protected lands and economic performance holds within the range of data within our sample, but it has not been validated outside of this range. Importantly, the range of protected public land acreage within which one can make reasonable comparisons is conditional on the value of the other variables in the model. For example, one might be tempted to compare a county with 1,000,000 acres of protected public land to a hypothetically identical county with no protected
land and conclude that those 1,000,000 acres of pro-tected public land account for $43,600 in per capita income. However, this is not a reasonable compari-son since there are no counties within our sample with zero acres of protected public land that are identical (or similar) in all other ways to counties with 1,000,000 acres of protected land, making this an exercise in extrapolation. There is evidence that comparisons can be made among some counties within the range of protected public lands shown in Figure 3, but we would discourage comparisons be-yond that.
This study measured the effect of protected pub-lic lands on economic performance during two re-cent decades, 1990 to 2010. Although limitations related to sample size would likely be problematic, a temporal study of economic performance prior to and after the designation of protected public lands would also be informative. Further study could also be done using alternative definitions of protected public lands, such as the National Gap Analysis Program (GAP) protection-level categories or the International Union for Conservation of Nature (IUCN) categories, and using alternative measures
120 Rasker, Gude, and Delorey
of economic performance. For example, it would be useful to measure the effects of protected public lands on factors such as income distribution and inequality, individual poverty rates, housing afford-ability, and quality of life.
Many interesting and informative differences ex-ist between individual counties that could be dis-cussed further in case studies. While some counties with protected lands have prospered, others have not. The goal of this research was to test for and understand broader patterns, and the selected methods allowed for unbiased evaluation of the pa-rameters of interest. However, the stories of indi-vidual communities, particularly outliers, were not explored in this paper. Finally, the study was ob-servational, so causality therefore cannot be implied.
5.3. Discussion
One reason for these positive relationships may be that in today’s economy a premium is placed on the ability of communities to attract talented work-ers, and the environmental and recreational ameni-ties provided by national parks and other protected lands serve to attract and retain talented people who earn above average wages, and have above average wealth, such as investment income. This explana-tion would be consistent with the non-metro West’s transition into a service-based economy, which con-stitutes 61 percent of all employment. It is also con-sistent with the rapid growth of non-labor income in the non-metro West, including retirement and in-vestment income, which comprised 65 percent of net total personal income growth in the last decade.
While this paper illustrates a positive association between economic growth and protected public lands, the results do not mean that protected public lands always lead to growth. Previous studies (Rasker et al., 2009; Booth, 1999) have shown that these forms of amenities may be an important but not sufficient condition for growth. Also needed are other factors, such as access to major markets via transportation infrastructure. The analysis de-scribed in this paper controlled for various county characteristics including travel time from the nearest major airport. The expectation that protected public lands and other amenities will result in fast-growing economies has to be moderated to include a discus-sion on the availability of transportation infrastruc-ture, including access to airports.
In addition, some of the literature on the role of protected public lands has pointed to negative ef-fects resulting from amenity migration. Some of the land-related consequences of people moving to the
countryside include urban sprawl (Gude et al., 2006; Dale et al., 2005; Hansen et al., 2005; Theobald, 2003; Hansen et al., 2002); encroachment of residential areas onto fire-prone lands, also known as the wildland-urban interface (Gude et al., 2008); a dis-ruption of wildlife migration patterns and habitat (Knight et al., 1995; Travis, 2007); and loss of biodi-versity (Hansen et al., 2002). In addition, there are potential negative economic and social consequenc-es, including income inequality and tensions be-tween long-time residents and newcomers. In other words, economic growth itself is not without its challenges.
Under the right circumstances, including an awareness and willingness to manage economic growth and residential development, protected pub-lic lands such as wilderness and national parks can be a significant boost to economic growth in the non-metropolitan counties of the West.
References
Beyers, W.B., and D.P. Lindahl. 1996. Lone eagles and high fliers in rural producer services. Rural Development Perspectives 11(3):2-10.
Booth, D.E., 1999. Spatial patterns in the economic development of the Mountain West. Growth and Change 30(3):384-405.
Charney, S., R.J. McLain, and E.M. Donoghue. 2008. Forest management policy, amenity migration, and community well-being in the American West: reflections from the Northwest Forest Plan. Human Ecology 36:743-761.
Chi, G., and D. Marcouiller. 2012. Recreational homes and migration to remote amenity-rich ar-eas. Journal of Regional Analysis and Policy 42(1):47-60.
Cromartie, J., and P. Nelson. 2009. Baby Boom Migra-tion and its impact on Rural America. Economic Re-search Service, U.S. Department of Agriculture. Report Number 29. Washington, D.C.
Cromartie, J.B., and J.M. Wardwell. 1999. Migrants settling far and wide in the rural West. Rural De-velopment Perspectives 14(2): 2-8.
Dale, V.H., S. Archer, M. Chang and D. Ojima. 2005. Ecological impacts and mitigation strategies for rural land management. Ecological Applications 15(6):1879-1892.
Decker, J.M., and J.L. Crompton. 1993. Attracting footloose companies: an investigation of the business location decision process. Journal of Pro-fessional Services Marketing 9(1): 69-94.

Effect of Protected Federal Lands on Economic Prosperity 121
Deller, S.C., T.H. Tsai, D.W. Marcouiller, and D.B.K. English. 2001. The role of amenities and quality of life in rural economic growth. American Journal of Agricultural Economics 83(2):352-365.
Duffy-Deno, K. 1998. The effect of federal wilderness on county growth in the intermountain western United States. Journal of Regional Science 38(1):109-136.
Eichman, H., G.L. Hunt, J. Kerkvliet, and A.J. Plant-inga. 2010. Migration, and public land policy: ev-idence from the Northwest Forest Plan. Journal of Agricultural and Resource Economics 35(2):316-333.
Gosnell, H., and J. Abrams. 2009. Amenity migra-tion: diverse conceptualizations of drivers, socio-economic dimensions, and emerging challenges. GeoJournal 08 July 2009:1-20.
Gude P.H., R. Rasker, K.L. Jones, J.H. Haggerty, M.C. Greenwood. 2012. The recession and the new economy of the West: the familiar boom and bust cycle? Growth and Change 43(3): 419-441.
Gude, P.H., R. Rasker and J. van den Noort. 2008. Potential for future development on fire-prone lands. Journal of Forestry June:198-205.
Gude, P.H., A.J. Hansen, R. Rasker, B. Maxwell. 2006. Rates and drivers of rural residential devel-opment in the Greater Yellowstone. Landscape and Urban Planning 77:131-151.
Hansen, A.J., R.L. Knight, J.M. Marzluff, S. Powell, K. Brown, P.H. Gude and K. Jones. 2005. Effects of exurban development of biodiversity: patterns, mechanisms, and research needs. Ecological Ap-plications 15(6):1893-1905.
Hansen, A.J, R. Rasker, B. Maxwell, J.L. Rotella, J.D. Johnson, A. Wright Parmenter, U. Langer, W.B. Cohen, R.L. Lawrence, and M.P.V. Kraska. 2002. Ecological causes and consequences of demo-graphic change in the new West. Bioscience 52(2):151-162.
Holmes, P., and W. Hecox. 2002. Does wilderness impoverish rural areas? International Journal of Wilderness 10(3):34-39.
Johnson, J.D., and R. Rasker. 1995. The role of eco-nomic and quality of life values in rural business location. Journal of Rural Studies 11(4):405-416.
Knapp, T.A., and P.E. Graves. 1989. On the role of amenities in models of migration and regional development. Journal of Regional Science 29(1):71-87.
Knight, R.L., G.N. Wallace and W.E. Riebsame. 1995. Ranching the view: subdivisions versus agricul-ture. Conservation Biology 9(2):459-461.
Lewis, D.J., G.L. Hunt and A.J. Plantinga. 2003. Does public lands policy affect local wage growth? Growth and Change 34(1):64-86.
Lewis, D.J., G.L. Hunt and A.J. Plantinga. 2002. Pub-lic land conservation and employment growth in the northern forest region. Land Economics 78(2):245-259.
Lorah, P., and R. Southwick. 2003. Environmental protection, population change, and economic de-velopment in the rural western United States. Population and the Environment 24 (3):255-272.
McGranahan, D.A. 1999. Natural Amenities Drive Population Change. Economic Research Service, U.S. Department of Agriculture. Report 781, 1-24,
McGranahan, D.A., and T.R. Wojan. 2007. Recasting the creative class to examine growth processes in rural and urban counties. Regional Studies 41(2):197-216.
Moss, A.G.L. 2006. The amenity migrants: ecological challenge to contemporary Shangri-La. The Amenity Migrants: Seeking and Sustaining Moun-tains and Their Cultures. Trowbridge: Cromwell Press. pp. 1-25.
Nelson, P.B. 1999. Quality of life, nontraditional in-come, and economic growth: new development opportunities for the rural West. Rural Develop-ment Perspectives 14(2):32-37.
Nelson, P.B. 2006. Geographic perspectives on amenity migration across the USA: national-, re-gional-, and local-scale analysis. The Amenity Mi-grants: Seeking and Sustaining Mountains and Their Cultures. Trowbridge: Cromwell Press. pp. 55-72.
Power, T.M. 1991. Ecosystem preservation and the economy of the Greater Yellowstone area. Con-servation Biology 5(3):395-404.
R Core Team, 2012. “R: A Language and Environ-ment for Statistical Computing.” R Foundation for Statistical Computing, Vienna, Austria. ISBN 3-900051-07-0. www.R-project.org.
Rasker, R., P.H. Gude, J.A. Gude, J. van den Noort. 2009. The economic importance of air travel in high-amenity rural areas. Journal of Rural Studies 25(2009):343-353.
Rasker, R. 2006. An exploration into the economic impact of industrial development versus conser-vation on western public lands. Society and Natu-ral Resources 19(3):191-207.
Rasker R., and A. Hansen. 2000. Natural amenities and population growth in the Greater Yellow-stone region. Human Ecology Review 7(2):30-40.

122 Rasker, Gude, and Delorey
Riebsame, W.E., J. Rob, H. Gosnell, D.M. Theobald. 1997. Atlas of the New West: Portrait of a Changing Region. New York: W.W. Norton and Company. pp. 58-59.
Rudzitis, G. 1993. Nonmetropolitan geography: mi-gration, sense of place, and the American West. Urban Geography 14(6):574-585.
Rudzitis, G., and H.E. Johansen. 1991. How im-portant is wilderness? Results from a United States survey. Environmental Management 15:227-233.
Rudzitis, G., and H.E. Johansen. 1989. Migration into western wilderness counties: causes and conse-quences. Western Wildlands Spring:19-23.
Shumway J.M., and S.M. Otterstrom. 2001. Spatial patterns of migration and income change in the Mountain West: the dominance of service-based, amenity-rich counties. Professional Geographer 53(4): 492-502.
Snepenger, D.J., J.D. Johnson and R. Rasker. 1995. Travel-stimulated entrepreneurial migration. Journal of Travel Research 34(1): 40-44.
Theobald, D.M. 2003. Targeting conservation action through assessment of protection and exurban threats. Conservation Biology 17(6): 1624-1637.
Travis, W.R. 2007. New Geographies of the American West: Land Use and the Changing Patterns of Place. Washington, DC: Island Press.
Ullman, E.L. 1954. Amenities as a factor in regional growth. The Geographical Review January: 119-132.
U.S. Department of Commerce. 2012. Bureau of Eco-nomic Analysis, Regional Economic Information System, Washington, D.C. Table CA30.
U.S. Department of Commerce. 2011. Bureau of Eco-nomic Analysis, Regional Economic Information System, Washington, D.C.
U.S. Department of Commerce. 2010. Census Bu-reau, Population Division, Washington, D.C.
U.S. Department of Commerce. 2010a. Census Bu-reau, Systems Support Division, Washington, D.C.
U.S. Department of Commerce. 2010b. Census Bu-reau, County Business Patterns, Washington, D.C.
Vias, A.C., and J.I. Carruthers. 2005. Regional devel-opment and land use change in the Rocky Moun-tain West, 1982–1997. Growth and Change 36(2): 244-272.
Whitelaw, E. 1992. “Oregon's Real Economy.” Old Oregon. Winter, pp. 31-33.
Whitelaw, E.W., and E.G. Niemi. 1989. “Migration, Economic Growth, and Quality of Life.” Proceed-ings: Pacific Northwest Regional Economic Con-ference. April 26-28. Corvallis, Oregon.