the effect of potential large-scale bioreactor ...etheses.bham.ac.uk/2820/5/scott11phd.pdf · cell...
TRANSCRIPT

The Effect of Potential Large-Scale Bioreactor
Environmental Heterogeneities during Fed-Batch
Culture on the Performance of an Industrially-
Relevant GS-CHO Cell Culture, Producing an IgG
Antibody
By
William Harry Scott
A thesis submitted to The University of Birmingham for the
degree of DOCTOR of PHILOSOPHY
School of Chemical Engineering
College of Engineering and Physical Sciences

University of Birmingham Research Archive
e-theses repository This unpublished thesis/dissertation is copyright of the author and/or third parties. The intellectual property rights of the author or third parties in respect of this work are as defined by The Copyright Designs and Patents Act 1988 or as modified by any successor legislation. Any use made of information contained in this thesis/dissertation must be in accordance with that legislation and must be properly acknowledged. Further distribution or reproduction in any format is prohibited without the permission of the copyright holder.

ii
Abstract
This work aimed to study the effect of potential large-scale bioreactor environmental heterogeneities during fed-batch culture on the performance of an industrially-relevant GS-CHO cell culture, producing an IgG antibody. Heterogeneity was created by applying, for the first time in animal cell culture, a two-compartment scale-down model, using a combination of a well-mixed stirred tank reactor (STR) and plug flow reactor (PFR). Feeding of glucose substrate and alkali for pH control to the PFR was analogous to feeding them to the liquid surface of a large-scale bioreactor. The flow rate through the PFR was controlled with a peristaltic pump so that the mean residence time in the PFR was equal to typical mixing excursions at the ~20 m3 scale. In this way, perturbations created in the PFR were analogous to perturbations created by poor mixing typical of the large-scale. The results obtained were compared with controls in which either just the STR was used; or in which circulation took place but all feeds were introduced directly into the STR. In addition to the standard parameters, antibody titre and quality were measured and flow cytometry was used to indicate cell viability and the mode of cell death. For the latter, viability was monitored by dual staining with Calcein-AM and Propidium Iodide (Calcein-AM/PI) and the mode of death by dual staining with Annexin V conjugated to phycoerythrin and Sytox Green (AV-PE/SG). Typically, growth was continued for ~20 days and for the STR/PFR runs, this required continuous pumping for this time with a peristaltic pump. Durable neoprene was used in the pump head and the PFR tube was silicone. The results essentially fell into two categories: those without circulation and those with it. In all cases with recirculation, whether nutrients and alkali were added into the STR or the PFR, significantly decreased culture duration (~48 hours shorter) and antibody titre (~20% decrease) were found compared to those runs without circulation. All other key process indicators were the same for all cases, with or without recirculation, including death by necrosis. The equivalence of antibody quality in even those cases with greatly decreased viability provided strong evidence for robust antibody production in this cell line.
Clearly, in this study, it was not possible to conclude anything concerning the impact of bioreactor heterogeneities with this cell line. On the other hand, damage associated with peristaltic pumping has relevance to the many aspects of cell culture processes that require transfer of cells in suspension; for example, inoculation and harvest steps. For large culture volumes, pumping duration may be of significant duration. It is considered that the ‘squeezing’ motion by which peristaltic pumps cause flow may impose sufficient mechanical stress on the cells to cause the relatively poor performance. It is of course possible that it may be due to long term chemical leaching or other features of the flow loop but with the high biocompatibility of the materials used in this study, this reason is considered to be less likely.

iii
Acknowledgements
I thank all three of my supervisors, Professors Colin Thomas, Alvin Nienow and
Chris Hewitt for their expert advice and guidance over the years. Your guidance
kept me focused and gave me a new perspective on research. Our discussions often
provided me with a broader view and opened avenues of inquiry that would never
have occurred to me. I hope to emulate your dedication and insight.
Thanks to my industrial supervisors at MedImmune, Gareth Lewis and Ray
Field, for their invaluable support. Special thanks to all those at MedImmune who
were confronted with a PhD student and a tight schedule, but gave their valuable
time generously. I appreciate your patience and very hard work. The technical and
analytical expertise that you provided was crucial for the satisfactory completion of
my thesis.
I would like to thank Hazel Jennings and Elaine Mitchell for suffering my
near constant demands with good grace. As well as support with my laboratory
work, your fine sense of humour and ready supply of chocolates (yes, I ate them
all!) always perked me up when things were not going quite to plan. Thanks to Lynn
Draper for smoothing my path over the years.
I owe much of my learning, not to mention a lot of entertainment, to my
fellow students, especially Boyen Isailovic and Ken Lee – masters of the flow
cytometer. I was fortunate to know so many who were not only generous with their
time and knowledge, but also with their food...
Mum and Dad, thank you for all your help and sacrifices. I know you
sometimes wondered why I didn’t just stay in gainful employment. Sometimes, I
wondered the same. But the PhD was worth it.
Steven Meier at Genentech, I would like to thank you for helping to round
off my rough edges and show me what it takes to be the very best kind of engineer.
A final muchas gracias/ merci beaucoup/ ಾಣ ೌ ಯ / big ol’ thank ya’
to my good friends at Chez Juju in San Francisco, Chaitra, ‘Julien’ (Fr) and Julien
(US), for your support, tolerance and, dare I say it, fine company. Your
encouragement and careful administration of high-quality IPA provided much
needed relief from the rigours of writing-up.

iv
Contents
Nomenclature..................................................................................... xii
Abbreviations and Acronyms..........................................................................xii
Units and Measures ........................................................................................ xiv Greek Symbols ................................................................................................ xvi
Energy Dissipation Rate Symbols ................................................................ xvi
Chapter 1: Literature Survey ............................................................. 1
1.1 Motivation and Hypothesis ............................................................................ 1 1.2 Monoclonal Antibodies.................................................................................. 3
1.1.1 Antibody Quality ..................................................................................... 4
1.3 GS-CHO........................................................................................................ 6 1.4 Large-Scale.................................................................................................... 7
1.5 Mixing and Reactor Heterogeneity................................................................. 9 1.6 Energy Dissipation Rate and ‘Shear’............................................................ 14
1.7 Creation of Heterogeneity on Scale-Up ........................................................ 18 1.7.1 pH......................................................................................................... 22
1.7.2 CO2/Osmolality ..................................................................................... 26 1.7.3 Oxygen.................................................................................................. 28
1.7.4 Substrate ............................................................................................... 31 1.8 Scale-Down Methods................................................................................... 34
1.8.1 Single-Compartment Models ................................................................. 35 1.8.2 Two-compartment Models ..................................................................... 36
1.8.3 STR+STR .............................................................................................. 38 1.8.4 STR+PFR ............................................................................................. 41
1.9 Flow Cytometry........................................................................................... 44 1.9.1 Why Flow Cytometry? ........................................................................... 44
1.9.2 What is Flow Cytometry? ...................................................................... 44 1.9.3 Light Scattering..................................................................................... 45
1.9.4 Fluorescence......................................................................................... 47 1.10 Cell Characterisation Using Fluorescent Stains .......................................... 47

v
1.10.1 Stain Selection..................................................................................... 47
1.10.2 Plasma Membrane Integrity Stains...................................................... 48 1.10.3 Viability Stain ..................................................................................... 49
1.10.4 Mitochondrial Function Stains ............................................................ 50 1.10.5 Apoptosis Indicator Stain .................................................................... 54
Chapter 2: Materials and Methods................................................... 56
2.1 Cell Line...................................................................................................... 56 2.2 Cell Culture Maintenance............................................................................. 56
2.3 Cell Banking................................................................................................ 57 2.4 Revival of Cells from Cell Bank .................................................................. 58
2.5 Shake Flask Study........................................................................................ 58 2.5.1 CCCP Induced Cell Death Shake Flask Study ....................................... 58
2.6 Fed-batch Study........................................................................................... 59 2.7 Scale-down STR+PFR ................................................................................. 60
2.7.1 Control Study ........................................................................................ 62 2.7.2 pH gradients ......................................................................................... 62
2.7.3 pH and Nutrient gradients..................................................................... 65 2.8 STR Setup ................................................................................................... 65
2.8.1 Water Bath for Constant PFR Temperature........................................... 66 2.9 STR Cleaning Protocol ................................................................................ 66
2.10 Haemocytometry........................................................................................ 67 2.11 Flow Cytometry......................................................................................... 68
2.11.1 The Instrument .................................................................................... 68 2.11.2 Cleaning Procedure ............................................................................ 69
2.11.3 Alignment of Fluidics and Optics......................................................... 69 2.11.4 Ratiometric Cell Count........................................................................ 70
2.11.5 Viability Assessment............................................................................ 71 2.11.6 Mode of Cell-Death Assessment .......................................................... 73
2.11.7 Evaluation of Mitochondrial Activity and Membrane Potential ........... 73 2.11.8 Flow Cytometric Analysis: Gating on Unstained Control .................... 74
2.12 Nutrient and By-Product Analysis .............................................................. 75 2.13 Antibody Quantification............................................................................. 75
vi
2.14 Antibody Characterization ......................................................................... 75
2.14.1 Reducing and Non-Reducing SDS Page: Protein Molecular Weight .... 76 2.14.2 Mass Spectroscopy: Peptide Mapping and Antibody Mass .................. 77
2.14.3 Isoelectric focusing: Extent of Deamidation ........................................ 78 2.14.4 Antibody Glycan Analysis.................................................................... 78
Chapter 3: Results and Discussion of Preliminary Studies ............. 80
3.1 Development of Characterisation Methods................................................... 80 3.2 Characterisation of CCCP Induced Cell Death ............................................. 81
3.2.1 Mode of Cell Death with Annexin-V/PE and SG: Apoptosis or Necrosis 81 3.2.2 Cell Viability with Calcein-AM and PI: Live or Dead............................ 87
3.2.3 Mitochondrial Membrane Potential....................................................... 92 3.3 Culture Growth in Shake Flasks: Cell Count and Viability......................... 103
3.3.1 A Comparison of Haemocytometry and Flow Cytometry ..................... 103 3.3.2 Cell Viability with Calcein-AM and PI: Live or Dead.......................... 107
3.3.3 Cell Damage during Staining and Flow Cytometry.............................. 112 3.4 Culture Growth in a Fed-batch STR........................................................... 114
3.4.1 Comparison of STR and Shake Flask Cell Culture............................... 114 3.4.2 Cell Viability with Calcein-AM and PI: Live or Dead.......................... 122
3.4.3 Mode of Cell Death with AV-PE/SG: Apoptosis or Necrosis................ 125 3.5 Cell Culture Data ....................................................................................... 129
3.5.1 Glucose and Glutamate....................................................................... 129 3.5.2 pH....................................................................................................... 131
3.5.3 Lactate................................................................................................ 132 3.5.4 Ammonia............................................................................................. 138
3.5.5 Osmolality........................................................................................... 140 3.6 Fed-Batch STR Productivity: IgG Antibody Production............................. 141
Chapter 4: Results and Discussion of Scale-Down......................... 145
4.1 Introduction ............................................................................................... 145 4.2 Design of Scale-Down Experiments........................................................... 146
4.3 Characterisation of PFR ............................................................................. 148 4.3.1 Maximum estimated drop in DOT........................................................ 148

vii
4.3.2 Maximum estimated drop in Glucose................................................... 149
4.3.3 Maximum Energy Dissipation Rate in the PFR.................................... 150 4.3.4 Maximum Energy Dissipation Rate in the STR .................................... 151
4.4 Results and Discussion............................................................................... 154 4.4.1 Comparison of Flow Cytometer and Haemocytometer......................... 154
4.4.2 Cell Viability with Calcein-AM and PI: Live or Dead.......................... 166 4.4.3 Mode of Cell Death with Annexin-V/PE and SG: Apoptosis or Necrosis.................................................................................................................... 171 4.4.4 Cell Growth and Antibody Production................................................. 173
4.4.5 Glucose, Lactate and Ammonia........................................................... 182 4.4.6 Osmolality........................................................................................... 188
4.4.7 Antibody Quality ................................................................................. 191 4.5 Discussion ................................................................................................. 202
Chapter 5: Conclusions ................................................................... 219
Chapter 6: Recommendations for Future Work ........................... 226
References ........................................................................................ 229

viii
Figures
Figure 1-1: Large-scale (~20 m3) stirred tank reactor (STR) with shading to identify mixing zones.................................................................................................. 13
Figure 1-2: Scale-down simulation schematic (based on Hewitt et al., 2000).. ....... 39 Figure 1-3: Flow cytometer (FC) layout (adapted from that found in Omerod
(1999).. .......................................................................................................... 46 Figure 2-1: Scale-down, showing the 5 L (3 L working volume) stirred tank reactor
(STR) connected to the 150 mL plug flow reactor (PFR), referred to as STR+PFR. ..................................................................................................... 63
Figure 2-2: Scale-down set up, showing the STR+PFR with the PFR in a water bath at 36.5oC........................................................................................................ 64
Figure 2-3: FS-SS cytograph and GF-RF cytograph used to demonstate ratiometric counting with fluorescent beads at known concentration ................................ 72
Figure 3-1: Cytographs for mode of cell death: Annexin-V (AV) conjugated to phycoerythrin (PE) used with Sytox Green (AV-PE/SG) stained GS-CHO cells, before and after CCCP treatment.................................................................... 84
Figure 3-2: Cytographs for viability: Calcein-AM and Propidium Iodide (PI) (Calcein-AM/PI) stained GS-CHO cells before and after CCCP treatment. .... 89
Figure 3-3: Cytographs for mitochondrial membrane potential: DiOC6(3)/PI stained GS-CHO cells before and after CCCP treatment ............................................ 95
Figure 3-4: Cytographs for mitochondrial membrane potential: JC-1 stained GS-CHO cells before and after CCCP treatment .................................................. 99
Figure 3-5: Cytographs for mitochondrial membrane potential: CM-H2XRos stained GS-CHO cells before and after CCCP treatment .......................................... 102
Figure 3-6: Photographs of CCCP treated, fluorescent stained GS-CHO cells under fluorescent microscope ................................................................................ 104
Figure 3-7: Growth curves of GS-CHO cell culture in a 2 L shake flask; comparison of flow cytometric (FC) and haemocytometric (HC) methods. ..................... 108
Figure 3-8: Logarithmic growth curves of GS-CHO cell culture in a 2 L shake flask; comparison of flow cytometric (FC) and haemocytometric (HC) methods. .. 109
Figure 3-9: Shake flask growth data cytographs for GS-CHO cells stained with Calcein-AM/PI. Forward scatter light v side scatter light (FS-SS) ................ 117
Figure 3-10: Shake flask growth data cytographs for GS-CHO cells stained with Calcein-AM/PI. Green fluorescence v red fluorescence (GF-RF) ................. 118
Figure 3-11: Growth curves of GS-CHO cell culture in a 5 L fed-batch stirred tank reactor (STR); comparison of flow cytometric (FC) and haemocytometric (HC) methods ....................................................................................................... 119

ix
Figure 3-12: Logarithmic growth curves of GS-CHO cell culture in a 5 L fed-batch stirred tank reactor (STR); comparison of flow cytometric (FC) and haemocytometric (HC) methods................................................................... 120
Figure 3-13: Fed-batch stirred tank reactor (STR) cytographs for light scattering properties..................................................................................................... 123
Figure 3-14: Fed-batch stirred tank reactor (STR) cytographs for viability........... 124 Figure 3-15: Fed-batch stirred tank reactor (STR) cytographs for mode of cell death
.................................................................................................................... 127 Figure 3-16: Glucose, glutamate and glutamine concentrations in the fed batch
stirred tank reactor (STR)............................................................................. 130 Figure 3-17: Lactate and ammonia concentrations in the fed-batch stirred tank
reactor (STR)............................................................................................... 136 Figure 3-18: Specific rate of production for lactate, qLactate, and ammonia,
qAmmonia, in the fed-batch stirred tank reactor (STR)................................. 136 Figure 3-19: Medium osmolality in the fed-batch stirred tank reactor (STR)........ 143
Figure 3-20: IgG antibody titre in the fed-batch stirred tank reactor (STR)........... 144 Figure 3-21: Specific rate of antibody production, qIgG, and specific growth rate, µ,
in the fed-batch stirred tank reactor (STR) ................................................... 144 Figure 4-1: Schematic of the control experiment and test case experiments.......... 147
Figure 4-2: ΔDOT v RT (drop in dissolved oxygen tension v mean residence time in the plug flow reactor)................................................................................... 152
Figure 4-3: ΔDOT v VCN (drop in dissolved oxygen tension v viable cell number)..................................................................................................................... 153
Figure 4-4: Cytographs for comparison of light scattering properties of all scale-down experimental cases.............................................................................. 169
Figure 4-5: Cytographs for comparison of viability of all scale-down experimental cases. Staining with Calcein-AM/PI. ............................................................ 170
Figure 4-6: Cytographs for comparison of mode of cell death of all scale-down experimental cases. Staining with Annexin-V (AV) conjugated to phycoerythrin (PE) used with Sytox Green (AV-PE/SG).............................. 172
Figure 4-7: Comparison of control and test cases: viable cell number, VCN, dead cell number, DCN, and viability. ........................................................................ 177
Figure 4-8: Comparison of control and test cases: IgG antibody titre ................... 178
Figure 4-9: Comparison of control and test cases: specific rate of antibody production (qIgG) ........................................................................................ 179
Figure 4-10: Comparison of experiments with and without continuous recirculation through the plug flow reactor (PFR)............................................................. 180
Figure 4-11: Comparison of the specific rate of antibody production (qIgG) for experiments with and without continuous recirculation through the PFR...... 181

x
Figure 4-12: Comparison of IgG antibody titre for experiments with and without continuous recirculation through the plug flow reactor (PFR)....................... 181
Figure 4-13: Comparison of control and test cases: lactate and ammonia concentration .............................................................................................. 183
Figure 4-14: Comparison of control and test cases: specific rate of lactate production (qLactate). ................................................................................................... 184
Figure 4-15: Comparison of control and test cases: specific rate of ammonia production (qAmmonia). .............................................................................. 185
Figure 4-16: Comparison of lactate concentration for experiments with and without continuous recirculation through the PFR .................................................... 186
Figure 4-17: Comparison of ammonia concentration for experiments with and without continuous recirculation through the PFR........................................ 186
Figure 4-18: Comparison of the specific rate of ammonia production (qAmmonia) for experiments with and without continuous recirculation through the PFR.187
Figure 4-19: Comparison of the specific rate of lactate production (qLactate) for experiments with and without continuous recirculation through the PFR...... 187
Figure 4-20: Comparison of control and test cases: osmolality............................. 189
Figure 4-21: Comparison of the osmolality for experiments with and without continuous recirculation through the PFR..................................................... 190
Figure 4-22: SDS PAGE used for comparison of antibody mass. A: non-reducing conditions. B: reducing conditions.. ............................................................. 192
Figure 4-23: Isoelectric focusing for comparison of antibody charge (isoelectric point, Ip)...................................................................................................... 195
Figure 4-24: Schematic of the glycoforms of IgG found in this study................... 200 Figure 4-25: Mean relative % of each glycoform on the IgG antibody for each
experiment (bar chart A). Mean relative % of the predominant three glycoforms normalised to the control with recirculation (bar chart B) .......... 201

xi
Tables
Table 1-1: The effect of scale-up criteria on mixing time for a 10-fold linear scale-up...................................................................................................................... 20
Table 1-2: Reactor mixing times............................................................................ 24
Table 1-3: The majority of the scale-down studies in the literature ........................ 37 Table 4-1: Flow characteristics of the plug flow reactor (PFR)............................. 148
Table 4-2: Calculation of the mean difference between cell counts made using flow cytometry (FC) and haemocytometry (HC) .................................................. 155
Table 4-3: Calculation of the mean difference between cell counts made using flow cytometry (FC) and haemocytometry (HC), grouped into the three broad experimental cases ....................................................................................... 160
Table 4-4: Calculation of the mean difference between cell counts made using flow cytometry (FC) and haemocytometry (HC), grouped into the three broad experimental cases ....................................................................................... 161
Table 4-5: Maximum growth and productivity values for each of the six duplicate stirred tank reactor (STR) experiments......................................................... 176
Table 4-6: Comparison of the isoelectric point (Ip) from isoelectric focusing (IEF) analysis of purified harvest antibody from experiments 1 to 6 ...................... 194
Table 4-7: Accuracy of the method for IgG glycoform profiling .......................... 199

xii
Nomenclature Abbreviations and Acronyms
6SRGT 6 blade Scaba radial turbine
ATP Adenosine tri-phosphate
AV Annexin-V
AV-FITC/PI Annexin V conjugated to fluorescein isothiocynate used in
conjunction with propidium iodide
AV-PE Annexin V conjugated to Phycoerythrin
AV-PE/SG Annexin V conjugated to Phycoerythrin used in conjunction with
Sytox Green (Dual Stain)
BD Becton, Dickinson and Company
Calcein-AM Calcein acetoxymethylester
Calcein-AM/PI Calcein acetoxymethylester used in conjunction with propidium
iodide (Dual Stain)
CCCP Carbonyl cyanide m-chlorophenyl hydrazone
CFD Computational fluid dynamics
CHO Chinese hamster ovary
CM-H2XRos Chloromethyl-X-rosamine
dH2O Deionised water
DiOC6(3) 3,3’dihexiloxocarboxyanine iodide
DiOC6(3)/PI 3,3’dihexiloxocarboxyanine iodide used in conjunction with
propidium iodide (Dual Stain)
DMSO Dimethyl sulfoxide
DTT Dithiothreitol
EB Ethidium bromide
EC Endothelial cells
EDTA Ethylenediaminetetraacetic acid
ESI-Q-TOF Electrospray ionisation quadrapole time of flight (Mass spectrometry)
FACS Fluorescence activated cell sorting
FC Flow cytometry/Flow cytometer (Multiparameter)
FCCP Carbonyl cyanide p-(trifluoromethoxy) phenylhydrazone
FDA Fluorescein diacetate
FITC Fluorescein isothiocynate
FS Forward scatter light
FS-SS Forward scatter light v side scatter light

xiii
Fuc Fucose
Gal Galactose
GF Green fluorescence
GF-RF Green fluorescence v red fluorescence
GlcNAc N-acetyl glucose amine
GS Glutamine synthetase
GS-CHO Glutamine synthetase chinese hamster ovary
GS-NS0 Glutamine synthetase murine myeloma hybridoma
HC Haemocytometry/Haemocytometer
HL-60 Human promyelocytic leukemia cells
HPLC High-pressure liquid chromatography
IEF Isoelectric focusing
IgG Immunoglobulin G
JC-1 5,5’,6,6’-tetrachloro-1,1’,3,3’ tetraethylbenzimidazolcarbocyanine
iodide
LC Liquid chromatography
LDA Laser Doppler anemometry
LDH Lactate de-hydrogenase
Man Manose
MSX Methionine sulfoximine
MWCO Molecular weight cut off
NP-HPLC 2-AB Normal phase high pressure liquid chomatography with 2-
aminobenamide
NS0 Murine myeloma hybridoma
PBS Phosphate buffered saline (pH 7.4)
PE Phycoerythrin
PFR Plug flow reactor
PI Propidium iodide
pI Isoelectric point
PMT Photomultiplier tube
PS Phosphatidylserine
PTM Post translational modification
RF Red fluorescence
ROS Reactive oxidative species
RQ Respiratory quotient

xiv
SDS-PAGE Sodium dodecyl sulfate polyacrylamide gel electrophoresis
Sf-9/Sf-21 Spodoptera frugiperda
SG Sytox green
SS Side scatter light
STR Stirred tank (bio)reactor
TB Trypan blue
TC Torture chamber (a flow constriction device).
Units and Measures
A Interfacial area for gas exchange (m2)
B Impeller clearance from the bottom of the reactor (m)
barg Bar (gauge)
C Oxygen concentration in the liquid phase (mg L-1)
c Concentration of gas dissolved in solution (M)
C* Saturation concentration of oxygen in liquid (mg L-1)
cells mL-1 Cells per millilitre
%CV Coefficient of variation (%)
D Impeller diameter (m)
d-1 Bioreactor (STR) medium volumes per day
DCN Dead cell number (1 x 10⁵ cells mL-1)
DCN FC Dead cell number attained by flow cytometry (1 x 10⁵ cells mL-1)
DCN FC Dead cell number attained by haemocytometry (1 x 10⁵ cells mL-1)
DOT Dissolved oxygen tension (% of air saturation, referred to as %
saturation and %)
Fi Volume fraction of gas component i (%/100)
g Acceleration due to gravity (9.81 m s-2)
g mole-1 Gram per mole
h Hour
h-1 Per hour
k Equilibrium constant (dimensionless)
kDa KiloDalton
kLa Mass transfer coefficient (h-1)
L Litre
M Molar (mole per litre)
mg mL-1 Microgram per millilitre
mL Millilitre

xv
mM Millimolar
mmHg Millimeters of mercury
mOsm kg-1 Milliosmoles per kilogram
mW Milliwatt
N Agitation speed (rev s-1)
N m-2 Newtons per metre square (1 Pa)
nM Nanomolar o Degrees (angle) oC Degrees Celcius
OUR Oxygen uptake rate (mg m-3 s-1)
P Power input imparted by the impeller (W)
Pa Pascals (1 x 10⁴ Pa approximates to 75 mmHg)
pg cell-1 h-1 Picograms per cell per hour
Pn Total pressure (Pa)
Po Dimensionless impeller power number
pPi Partial pressure of gas component i (Pa)
qAmmonia Specific rate of ammonia production (pg cell-1 h-1)
QG Gas flowrate (m3 s-1)
qIgG Specific rate of immunoglobulin G production (pg cell-1 h-1)
qLactate Specific rate of lactate production (pg cell-1 h-1)
rev s-1 Impeller revolutions per second
rpm Impeller revolutions per minute
RT Mean residence time (s-1)
Sc Schmidt number (dimensionless)
T Diameter of STR (m)
TCN Total cell number (1 x 10⁵ cells mL-1)
TCN FC Total cell number attained by flow cytometry (1 x 10⁵ cells mL-1)
TCN FC Total cell number attained by haemocytometry (1 x 10⁵ cells mL-1)
U Units
V Volume of STR (m3)
VCN Viable cell number (1 x 10⁵ cells mL-1)
VCN FC Viable cell number attained by flow cytometry (1 x 10⁵ cells mL-1)
VCN FC Viable cell number attained by haemocytometry (1 x 10⁵ cells mL-1)
VCNmax Maximum viable cell number (1 x 10⁵ cells mL-1)
Viability FC Viability attained by flow cytometry (%)

xvi
Viability HC Viability attained by haemocytometry (%)
v/v Volume per volume
W kg-1 Watts per kilogram
w/v Weight per volume
Greek Symbols
ΔC Driving force (C*-C)
ΔViability Viability FC - Viability HC (%)
ΔDOT Drop in dissolved oxygen tension (% saturation)
ϧ Diffusivity (m2 s-1)
ΔVCN VCN FC - VCN HC (1 x 10⁵ cells mL-1)
ΔDCN DCN FC - DCN HC (1 x 10⁵ cells mL-1)
ΔTCN VCN FC - VCN HC (1 x 10⁵ cells mL-1)
ΔΨ Plasma membrane potential (mV)
ΔΨm Mitochondrial membrane potential (mV)
λk Kolmogoroff micro-scale of turbulence (m)
µ Specific growth rate (h-1)
η Viscosity (Pa s)
µL Microlitre
µM Micromolar
ν Kinematic viscosity (m2 s-1)
νs Superficial gas velocity (m s-1)
Energy Dissipation Rate Symbols
Mean specific energy dissipation rate from the impeller (W kg-1)
Local specific energy dissipation rate from the impeller (W kg-1)
Maximum local specific energy dissipation rate from the impeller
(W kg-1)
Local specific energy dissipation rate (W kg-1)
Mean specific energy dissipation rate (W kg-1)
Maximum local specific energy dissipation rate (W kg-1)
Median of the maximum specific energy dissipation rate provided by
the torture chamber (W kg-1)
Maximum energy dissipation rate in tubing (W m-3)
Maximum energy dissipation rate in tubing (W kg-1)
( )T I( )T I
Im( )T ax
T maxT
T
max( )TC
max, pipeEmax, pipe

1
Chapter 1: Literature Survey
1.1 Motivation and Hypothesis
In large-scale stirred tank reactors (STR) (Section 1.4), feeds such as acid, base and
nutrients (nutrient feed referred to from here as substrate) are normally added to the
liquid surface immediately below the feeding entry-point in the STR head-plate.
This has been shown to result in significant, deleterious perturbations that are
initially localised in the area around the feeding point (Section 1.7). Such
perturbations have been shown to decrease final product concentration (titre) in
microbial cell culture (Namdev and Thompson, 1992; Larsson et al., 1996;
Langheinrich and Nienow, 1999). Feeding to the impeller region shortens the
dispersion time of feeds significantly (Byland et al., 1998; Langheinrich and
Nienow, 1999), but is generally considered impracticable for clean-in-place (CIP)
sterility (Christi and Moo-Young, 1994). In large-scale microbial culture, very high
cell concentrations and the economic and practical restraints on power input for
agitation mean that vessel heterogeneity is difficult to avoid. These restraints are
also relevant in large-scale animal cell culture; however, poor mixing has typically
resulted from a deliberate curb on power input for impeller agitation motivated by
concerns over hydrodynamic cell damage (‘shear’) (Varley and Birch, 1999; Lara et
al., 2006; Nienow, 2006). The extent of concern has been shown to be misplaced
(Kunas, 1990; Zhang and Thomas, 1993; Nienow and Langheinrich, 1996) and often
instead attributable to bubble-bust-damage (Oh et al., 1989; Boulton-Stone, 1995;
Ma et al., 2004). Nevertheless, power input is still often relatively low (Nienow,
2006) and it is evident that animal cells are typically less robust that microbial cells.

Chapter 1: Literature Survey
2
Furthermore, greater understanding of animal cell culture requirements continues to
increase the maximum attainable cell concentration, which will increase vessel
heterogeneity (Nienow, 2006).
In microbial culture, two-compartment laboratory scale-down methods
(Section 1.8) have been used to conduct laboratory-scale research on the effect of
conditions like those found at the large-scale (Namdev and Thompson, 1992;
George et al., 1993; Hewitt et al., 2000; Amanullah et al., 2001). Research at the
large-scale (e.g., 20 m3) is limited by cost. For animal cells, only one such two-
compartment scale-down study has been conducted (Osman et al., 2002) and the
consequences of STR heterogeneity are poorly understood. This is troubling because
animal cell culture is the predominant means for production of high-value complex
therapeutic proteins and successful transfer from laboratory-scale development to
large-scale production is important for the commercial success of the drug pipeline
(Birch, 2005; Birch and Racher, 2006).
Thus, it is hypothesised that a two-compartment scale-down model, like that
used for scale-down of microbial cell culture, can be used to generate, and study the
influence of, perturbations in pH and substrate that sufficiently resemble those that
occur in a large-scale stirred tank reactor (STR) for commercial production of
therapeutic proteins from animal cell culture. Further, it is hypothesised that these
perturbations will influence important aspects of the culture performance, such as
antibody concentration (titre) and antibody characteristics (antibody quality). In this
study, a stirred tank reactor and plug flow reactor (STR+PFR) scale-down model
was chosen because the PFR is well suited to simulation of perturbations created by
additions to the feeding zone in a large-scale STR (Section 1.8.4).

Chapter 1: Literature Survey
3
The principle aim of this study was to investigate the effects of pH and
substrate gradients, which are typical of a poorly mixed large-scale STR used for
animal cell culture (Section 1.7.1 and Section 1.7.4), on biological performance of
an industrially relevant culture of glutamine synthetase Chinese hamster ovary cells
(GS-CHO, Section 1.3), using scaled down experiments (Section 2.7). Special
consideration was given to the effects of the scale-down on antibody titre and
antibody quality (such as glycosylation) (Section 1.1.1), as both are typically of
great importance in commercial drug production (Section 1.4).
Flow cytometry (FC) was used with the aim of investigating the physiology
of cells in scaled down experiments in greater depth than would be possible with the
traditional haemocytometer method (Section 1.9). An understanding of how
perturbations like those that are expected to occur in large-scale culture vessels
influence cell physiology, antibody titre and antibody quality should allow for better
decisions regarding process development, scale-up and operation.
1.2 Monoclonal Antibodies
Antibodies can distinguish between cells of individual members of a species and in
some cases can distinguish between proteins that differ by only a single amino acid.
Such exquisite binding specificity makes them ideal for directed therapy in the body.
By engineering antibodies in the laboratory, it is possible to create highly directed
therapeutic agents that are used, amongst other things, to deliver toxic substances to
cancer cells leaving normal cells unscathed, and to interrupt and block an
autoimmune response in diseases such as Crohn’s (Waldmann, 2003).

Chapter 1: Literature Survey
4
1.1.1 Antibody Quality
Therapeutic antibodies require complex posttranslational modifications (PTMs) for
efficient secretion, drug efficacy and stability. Common modifications include
glycosylation, misfolding and aggregation, oxidation of methionine, deamidation of
asparagine and glutamine, and proteolysis (Jenkins, 2007). The nature and extent of
PTMs that determine the efficacy of the antibody as a drug are influenced by
production conditions, such as culture environment. Product consistency is therefore
often reliant on successful control of crucial process parameters within specified
limits (Kozlowski and Swann, 2006).
To expedite the drug approval process it is important to establish the
protein’s characteristics during process development and to ensure that they remain
unaltered during scale-up to commercial production (Jenkins et al., 1996). A scale-
down model capable of creating large-scale conditions might therefore provide a
useful insight into the effects of scale-up on antibody quality. Antibody
characteristics are reportedly influence greatly by those aspects of culture
environment, such as pH and substrate concentration, which scale-up may alter.
1.2.1.1 Mass Heterogeneity
Mass heterogeneity is primarily introduced by antibody aggregation and chemical
modifications. Within the cell, process conditions can cause aggregation by altering
protein folding and secretion (Zhang et al., 2004; Chaderjian et al., 2005) and, once
the complete antibody is secreted into the culture medium, by subjecting the protein
to chemical (such as pH and salt concentration) and physical (such as shear stress)
degradation (Chi et al., 2003; Cromwell et al., 2006). Aggregation often increases at
alkali pH (Liu et al., 2008).

Chapter 1: Literature Survey
5
Protein aggregation is highly undesirable for therapeutic antibodies, because
the aggregates might result in an immunogenic reaction (small aggregates), or
complications following drug administration (particulates) (Hermeling et al., 2004;
Cromwell et al., 2006). The chemical modifications of interest typically alter protein
charge (Section 1.2.1.2). Glycosylation does not typically alter charge but is
important in its own right (Section 1.2.1.3).
1.2.1.2 Charge heterogeneity
Charge heterogeneity is primarily introduced by deamidation and C-terminal lysine
microheterogeneity (Tsai et al., 1993; Perkins et al., 2000). The antibody studied
here was without a C-terminal lysine: any change in charge was attributed to
deamidation. Deamidation of asparagine and glutamine introduces an additional
negative charge to the antibody and generates acidic species that decrease the
protein’s isoelectric point (pI) (Liu et al., 2008).
Deamidation of asparagine forms isoaspartate, which is not a natural amino
acid and can potentially be immunogenic (Jenkins, 2007). Furthermore, a decrease
to, or complete loss of, activity has been reported for IgG (Harris et al., 2001) and
other proteins such as recombinant DNAse (Cacia et al., 1993) and recombinant
soluble CD4 (Teshima et al., 1991). Like protein aggregation (Section 1.2.1.1), the
rate of non-enzymatic deamidation is reportedly accelerated at alkaline pH (Usami et
al., 1996; Jenkins, 2007; Liu et al., 2008), and hyperosmotic stress has also been
found to decrease the isoelectric point (Schmelzer and Miller, 2002).

Chapter 1: Literature Survey
6
1.2.1.3 Glycosylation
Glycosylation can play a crucial role in the activity of therapeutic proteins: the
majority glycan groups are attached to the Fc fragment, where they influence the
pharmacokinetics, bioactivity, secretion, in vivo clearance and solubility recognition
(Jenkins and Curling, 1994; Jenkins et al., 1996; Sinclair and Elliott, 2004).
Quantitative and qualitative aspects of glycosylation can be altered by many
aspects of the production process. The following are chosen for their relevance: the
type of culture vessel and culture method; for example, STR, perfusion, suspension
culture or attached culture on beads (Maiorella et al., 1993); critical culture
parameters, such as pH, pCO2, pO2 and ‘shear’ (Goochee and Monica, 1990; Senger
and Karim, 2003); and glucose concentration (Hayter et al., 1992a; Wong et al.,
2004). Furthermore, many alterations and effects are likely to be specific to the host
cell line (Sheeley et al., 1997).
1.3 GS-CHO
Chinese hamster ovary (CHO) cells are widely used to produce recombinant
antibodies, often using either the DHFR (dihydrofolate reductase) or GS (glutamine
synthetase) expression systems (Butler, 2005a; Merten, 2006). This research project
used a suspension variant (SV) of the CHO-K1 cell line (CHOK1SV), transfected
for GS gene expression, GS-CHO (Section 2.1). The GS gene expression system
provides a consistent means of rapidly generating high producing cell lines.
Glutamine synthetase (GS) is the enzyme responsible for the biosynthesis of
glutamine from glutamate and ammonia, and without it there is no pathway for
glutamine formation in a mammalian cell. Normally, unlike NS0 cells, CHO cell
lines express sufficient quantities of GS to survive without exogenous glutamine

Chapter 1: Literature Survey
7
(Barnes et al., 2000). Recombinant cell selection is made using a GS inhibitor,
methionine sulphoximine (MSX), to decrease endogenous GS activity, rendering it
insufficient, such that only transfectants that have stably incorporated the GS
expression vector into a transcriptionally active locus will survive (Birch and
Racher, 2006). The genetic linkage between GS and the transfected gene of interest
ensures that the transgene is co-amplified, enhancing the selection of high producing
strains (Birch and Racher, 2006).
1.4 Large-Scale
After the successful selection of a recombinant CHO cell line that produces the
desired antibody at high concentrations the cell culture must be characterised and the
production process developed to assure robust production at commercial
manufacturing scales. Depending on the application and dose concentration, some
proteins may be required in very large quantities (possibly hundreds of kg per year).
To meet the current great demand for therapeutic proteins in a profitable manner,
large-scale production has been intensified in ways that clearly increase the potential
for differences in culture performance in the development laboratory-scale vessel
(~5 L) and large-scale vessel (~20000 L: 20 m3) used for industrial production.
Stirred tank reactor (STR) scale has been increased, to benefit from economies of
scale; and volumetric throughput (i.e., cell concentration) of reactors has been
increased to improve volumetric productivity. Optimisation of processes during
development in the laboratory has therefore become paramount (Varley and Birch,
1999). Indeed, STR scale has increased from only 8 m3 a few decades ago to 20 m3
(Lonza, Portsmouth/NH facility) and typical maximum cell concentration has
increased to the order of 107 cells mL-1. Vessel scale and cell concentration are

Chapter 1: Literature Survey
8
predicted to continue increasing while demand for therapeutic proteins is high (Birch
and Racher, 2006; Nienow, 2006).
Considering the difference in STR size (scale), it is unsurprising that the
transfer from laboratory-scale development reactors to large-scale production
reactors may be accompanied by alterations to antibody titre and quality. Such
changes are often undesirable, but even ostensibly desirable changes to the cultures’
characteristics upon scale-up, such as increased glycosylation, may raise difficulties
for regulatory compliance. A considerable factor in the possible change in
performance during scale-up is likely to be the far greater heterogeneity that is
typical of the large-scale (Namdev and Yegneswaren, 1991; Larsson et al., 1996;
Nienow and Langheinrich, 1996; Bylund et al., 1999; Amanullah et al., 2001).
Increased heterogeneity is the corollary of increased mixing time, m , that is
typically caused by a decrease in agitation speed, N, made as part of the transfer to
the large-scale. The reasons for the decrease to N are twofold. Firstly, the required N
to satisfy O2 mass transfer requirements is lower than at the laboratory-scale.
Secondly, the ratio of impeller diameter, D, to vessel diameter, T, (D/T) is typically
held constant at scale-up; at constant N any increase to D very substantially
increases mean specific energy dissipation rate from the impeller, ( )T I , impacting
on concerns over hydrodynamic damage or ‘shear’ (referred to as shear, while
acknowledging that this usage may be considered imprecise, Section 1.6). Indeed,
concern over shear may often be the key consideration when setting N, even if shear
may not be as great a problem as is generally believed (Nienow, 2006). Thus, scale-
up is often made with a near constant mean specific energy dissipation rate from the

Chapter 1: Literature Survey
9
impeller, ( )T I , and, consequently, greatly increased mixing time, m (Osman et
al., 2001; Nienow, 2006).
Increased environmental heterogeneity caused by the far greater m that is
typical in a large-scale stirred tank reactor (STR) used for the industrial production
of therapeutic antibodies by animal cell culture can result in perturbations, decreased
control and, consequently, unpredictable process performance. Of primary concern
is that such perturbations may decrease antibody titre and change antibody quality
(Section 1.1.1). An understanding of the implications of poor mixing and STR
heterogeneity is therefore essential to surmount this problem and is the main thrust
of this thesis.
1.5 Mixing and Reactor Heterogeneity
Mixing time, m , can be approximated using a reasonably simple method: tracer is
added to the STR, and its concentration plotted against the time since addition;
concentration is measured by one or more suitable probes at fixed points in the STR
(Coulson and Richardson, 2000). Over time, under idealised conditions, the probe
shows a periodic concentration variation above and below the equilibrium tracer
concentration, with constant wavelength and diminishing amplitude. The period of
the wave is often termed the ‘circulation time’.
m is defined as the time at which the amplitude has decreased to within a
specified deviation from the equilibrium concentration. When additions of tracer are
made to the liquid surface, the duration of mixing is greatly increased because
intensive mixing is typically localised to the impeller region

Chapter 1: Literature Survey
10
Cutter (1966) found that 70% of energy dissipation took place in the
‘impeller zone’, creating a well-mixed impeller zone and poorly mixed bulk zone
(Figure 1-2). Note that the impeller region is loosely defined and the percentage of
the energy dissipation is dependent on the size of impeller region chosen. It is
unsurprising that maximum local specific energy dissipation rate from the impeller,
Im( )T ax , is close to the impeller.
It is logical to assume that local gradients of velocity close to the impeller are
orders of magnitude higher than the average values in the vessel (Midler and Finn,
1966). The higher local specific energy dissipation rate, ( )T I , in this region close to
the impeller has led some groups to define an impeller region based on a subjective
choice of a volume close to the impeller. Defined by Zhou and Kresta (1996) as
4.87% of the total volume into which 28.2% of the total energy is dissipated, and in
a recent study by Mollet et al. (2004) as a ‘square ring’ that contains 5.74% of the
total liquid in the vessel into which 27.8% of the total energy is dissipated.
Cutter (1966) was the first to quantify the variation in ( )T I throughout a
STR. Using a photographic method, Cutter ( 1966) found that in a tank stirred with a
Rushton turbine the ratio of the local specific energy dissipation rate to the mean
specific energy dissipation rate, ( )T I to ( )T I , or ( / )T T I , varied from 0.25 in the
bulk region of the tank to 70 near to the impeller. Showing that Im( )T ax was 280-fold
greater than in the bulk of the tank. Similarly, Costes and Couderc (1988) found that
Im( )T ax was 200-fold greater, and Mollet et al. (2004) found that it was 60-fold
greater. The mean specific energy dissipation rate from the impeller, ( )T I , is
therefore a poor indicator of the most turbulent environment in a STR.

Chapter 1: Literature Survey
11
It is established that as cells circulate randomly around the STR, following
turbulent flow patterns, they will be exposed to a continuous variation in ( )T I .
Further, that the ( )T I in the STR may, nevertheless, be considered as divided into
two distinct regions: the bulk of the STR, where ( )T I is often lower than ( )T I , and
the impeller region, where ( )T I may be at least 50-fold greater than ( )T I .
In the impeller zone, micromixing predominates, so blending is fast down to
the molecular scale, where it becomes limited by the rate of molecular diffusion; in
the bulk of the STR, macromixing that is controlled by convective bulk diffusion
and eddy diffusion is predominant (Manning et al., 1965; Brodkey and Reuss, 1982).
Thus, blending or mixing of the entire STR contents is limited by the rate of
turbulent diffusion in the bulk of the STR, independent from the agitator.
Feeding is typically restricted to the liquid surface of the STR by practical
limitations of clean-in-place (CIP) techniques (Christi and Moo-Young, 1994);
surface feeding creates a third zone that is transiently localised around the feeding
point— the feed zone. A conceptual model of feeding to a poorly mixed STR might
segregate the fluid contents of the STR into three-zones: the impeller zone, the bulk
zone, and the feed zone, as proposed by Namdev and Thompson (1992).
High concentration zones are predominantly formed around the feeding
points farthest from the impeller, where inefficient mixing fails to disperse the feed
rapidly – substrate and alkali often form high concentration regions in this way.
Langheinrich and Nienow (1999) used alkali plus an appropriate indicator to show
elegantly that plumes of elevated pH are created around the point of feeding of a
large-scale reactor; the dispersal of the purple plume was recorded. Evidently, until
the concentrated plume is completely dispersed a portion of the culture volume, and

Chapter 1: Literature Survey
12
the cells within that volume, will be exposed to an elevated pH, i.e., cells will be
exposed to perturbations for a duration approximating to m .
Low concentration zones will be created when the rate of consumption by
cellular activity is greater than the mixing rate - substrate and O2 can form low
concentration regions in this way. Furthermore, the two regions are not mutually
exclusive: the creation of O2 limitations within the glucose feed zone is a problem
that, for the time being, is considered restricted to microbial reactors, because of
their high cell concentration cultivation. However, it will almost certainly occur in
mammalian cell culture eventually, as increased understanding of cell culture
requirements allows for increased cell concentrations to increase volumetric
productivity.
Elevated substrate in the feed zone might also create localised accumulation
of metabolic by-products (metabolites) that alter pH and further exacerbate STR
heterogeneity (George et al., 1993). Concerns surrounding the shear sensitivity of
animal cells mean that scale-up is typically made at constant maxT I , at the expense
of greatly increased m , and increased heterogeneity (Section 1.7). A discussion of
current research on animal cell shear sensitivity will now be made to inform the
subsequent section on the creation of bioreactor heterogeneity.

Chapter 1: Literature Survey
13
iii. Well Mixed Regions
ii. Elevated concentration plume
iv. Tracer detection probe
i. Addition Zone. Tracer point of addition and addition point for substrate and pH control.
Large-Scale Heterogeneity (~20000L)
Figure 1-1: Large-scale (~20 m3) stirred tank reactor (STR) with shading to identify mixing zones: i) addition point at liquid surface; ii) elevated concentration in the addition zone; iii) well mixed impeller region; iv) probe for detection of tracer addition. This schematic is an adaption of the two-compartment model proposed by Oosterhuis and Kossen (1984).

Chapter 1: Literature Survey
14
1.6 Energy Dissipation Rate and ‘Shear’
In the large-scale culture of animal cells ‘shear’ and accompanying ‘shear
sensitivity’ has been a subject of considerable debate. ‘Shear’ here refers generally
to any hydrodynamic or mechanical mechanism that may damage the cell, and the
term shear will be used, in place of ‘shear’, while acknowledging that it does not
refer directly to shear stress or shear rate, which are difficult to define for the
turbulent flow present in a typical STR. The mean specific energy dissipation rate
from the impeller, T I , is considered a better means to characterise the turbulent
flow in a STR (Pohorecki et al., 1998).
In spite of the contrary evidence (Telling and Elsworth, 1965; Augestein et
al., 1971), perceived cell fragility (Midler and Finn, 1966; Nevaril el al., 1968;
Bluestein and Mockros, 1969) led to excessive caution in the design of large-scale
culture systems, which still suffer from restricted agitation and, consequently, poor
mixing (Nienow, 2006). Early concerns around the generation of damaging shear by
impeller agitation are now considered largely misplaced, thanks to numerous
demonstrations of consistent cell growth and productivity in STR agitated at
significantly higher speeds than are commonly used in industry (Oh et al., 1989;
Kunas, 1990; Nienow and Langheinrich, 1996). Two studies that effectively
demonstrated the resilience of animal cells to shear were conducted by Zhang and
Thomas (1993). In one study, they found that hybridoma cells were viable after
exposure to 1500 rpm (4 W kg-1) in an un-aerated tank with no air/liquid interface,
showing that agitation alone is much less damaging than many thought. In a study of
NS1 myeloma cells, passage through capillary tubes was used to demonstrate cell

Chapter 1: Literature Survey
15
integrity until specific energy dissipation rates, T , as high as 105-106 W kg-1 were
reached (Zhang and Thomas, 1993).
In the literature, it is now established with little doubt that most of the cell
damage is not a direct result of shear created by agitation and instead was caused
when cells became entrained with bubbles and were exposed to bubble bursting,
which can generate T in the order of 104-105 W kg-1. Fortunately, this damage can
be mitigated by surfactants, such as Pluronic-F68, that decrease cell attachment to
bubbles and thereby limit exposure to hydrodynamic damage created by bubble
bursting (Oh et al., 1989; Boulton-Stone, 1995; Kioukia et al., 1995; Wu, 1995).
More recent work (Ma et al., 2002) using a flow constriction device to expose cells
to a range of T has shown that CHO cell viability was not lowered until T was
raised to 104-105 W kg-1, several orders of magnitude higher than the maxT
generated by impellers in a typical large-scale STR, but equivalent to the maxT
found during bubble bursting (Boulton-Stone and Blake, 1993). The insensitivity of
animal cells to T even several orders of magnitude greater than is typical at the
large-scale is contested by two recent studies that report a noteworthy sub-lethal
influence of shear.
The first study (Senger and Karim, 2003), found that the proportion of Type
II recombinant tissue type plasminogen activator protein, r-tPA, was ‘maximised
under damaging levels of shear stress.’ Unfortunately, they do not specify the T I
in their STR and instead provide the Reynolds number, Re, as an indicator of the
levels of shear that might be expect. Nevertheless, they do provide the STR
dimensions and agitation speed of their experimental case with greatest shear (N =

Chapter 1: Literature Survey
16
200 rpm, D = 0.045 m, V = 1.5 x 10⁻³ m3) and state that a pitched blade (45o)
impeller was used. By assuming Po = 1.7 ( the Po for a 6SRGT radial impeller; note
that for a Rushton turbine Po = 5.5 (Nienow, 1998)) and ρ = 1000 kg m-3 (equal to
water) then from their STR dimensions power input from the impeller, P, can be
found from Equation 1-1:
3 5LP Po N D
P = 1.7 x 1000 x (3.33)3 x (0.045)5
P = 0.012 W
And mean specific energy dissipation, T I , rate from Equation 1-4:
/T LIP V
T I = 0.012/ (1000 x 1.5 x 10-3)
T I = 8 x 10⁻³ W kg-1.
It is surprising that this low T I resulted in extensive cell death, as this is contrary
to the findings of many of the studies discussed above. Since their experiment was
conducted with an air/liquid interface, it is possible that increased bubble
entrainment and the subsequent bubble disengagement damage was responsible for
the elevated cell death found at greater N.
The second study to report an altered glycosylation profile at elevated shear
(Godoy-Silva et al., 2009a) generated elevated shear by circulation through a
modified version of the flow constriction device developed by Ma et al. (2002), and
now referred to as the torture chamber. The torture chamber (TC) generated shear in
the laminar flow region by forcing cells suspended in medium through a 227 µm gap
Chapter 1: Literature Survey
17
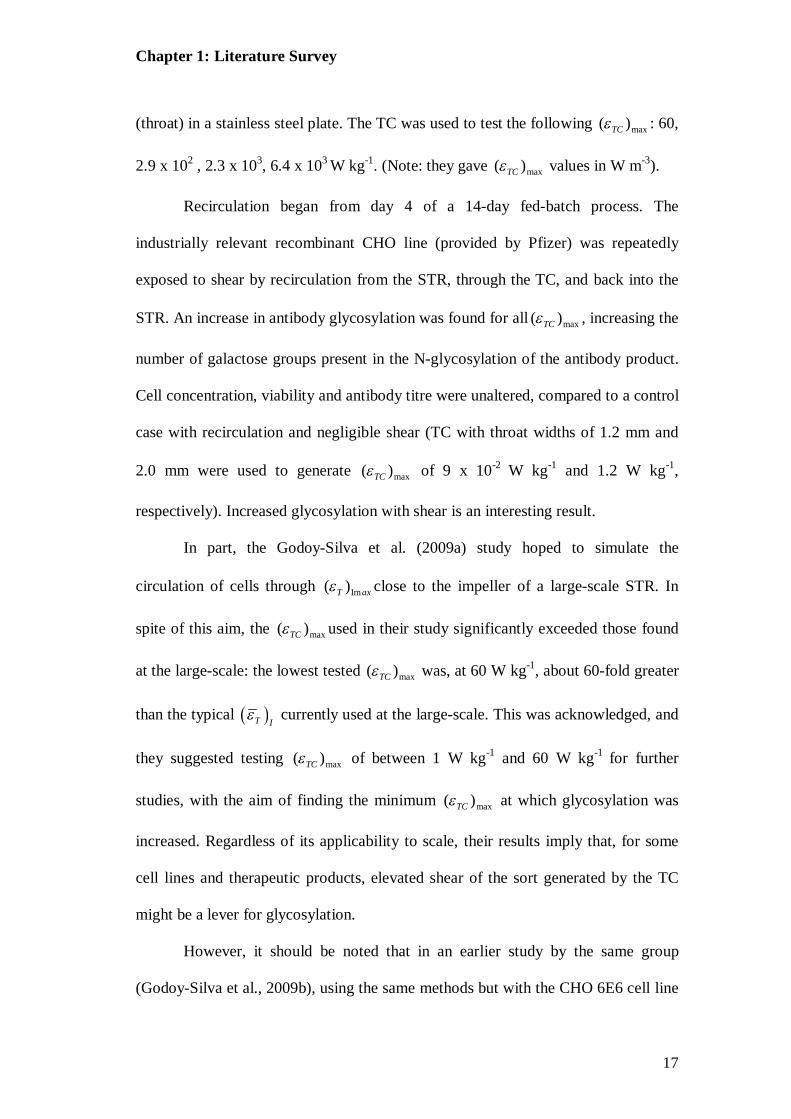
(throat) in a stainless steel plate. The TC was used to test the following max( )TC : 60,
2.9 x 10² , 2.3 x 10³, 6.4 x 10³ W kg-1. (Note: they gave max( )TC values in W m-3).
Recirculation began from day 4 of a 14-day fed-batch process. The
industrially relevant recombinant CHO line (provided by Pfizer) was repeatedly
exposed to shear by recirculation from the STR, through the TC, and back into the
STR. An increase in antibody glycosylation was found for all max( )TC , increasing the
number of galactose groups present in the N-glycosylation of the antibody product.
Cell concentration, viability and antibody titre were unaltered, compared to a control
case with recirculation and negligible shear (TC with throat widths of 1.2 mm and
2.0 mm were used to generate max( )TC of 9 x 10⁻² W kg-1 and 1.2 W kg-1,
respectively). Increased glycosylation with shear is an interesting result.
In part, the Godoy-Silva et al. (2009a) study hoped to simulate the
circulation of cells through Im( )T ax close to the impeller of a large-scale STR. In
spite of this aim, the max( )TC used in their study significantly exceeded those found
at the large-scale: the lowest tested max( )TC was, at 60 W kg-1, about 60-fold greater
than the typical T I currently used at the large-scale. This was acknowledged, and
they suggested testing max( )TC of between 1 W kg-1 and 60 W kg-1 for further
studies, with the aim of finding the minimum max( )TC at which glycosylation was
increased. Regardless of its applicability to scale, their results imply that, for some
cell lines and therapeutic products, elevated shear of the sort generated by the TC
might be a lever for glycosylation.
However, it should be noted that in an earlier study by the same group
(Godoy-Silva et al., 2009b), using the same methods but with the CHO 6E6 cell line

Chapter 1: Literature Survey
18
, no alteration to glycosylation was observed and viable cell number (VCN), viability
and antibody titre were observed to decrease with increasing shear. Since both
studies were purportedly performed in the same manner, the contrary results of the
two studies imply that there is a cell line specific response to the type of shear
generated by recirculation through the TC. Further study is necessary. Shear
continues to be an issue of ambiguity and the spectre of a sub-lethal influence to
product quality is unfortunately likely to invigorate efforts to minimise shear rather
than to maximise vessel homogeneity.
1.7 Creation of Heterogeneity on Scale-Up
It was stated above (Section 1.5) that blending or mixing of the entire STR contents
is limited by the rate of turbulent diffusion in the bulk of the reactor, well away from
the agitator. This forms the basis of the turbulence model of STR mixing, which
states that under turbulent flow conditions, the time required to homogenise the
contents of a STR, m (s), is independent of impeller type and is related to agitation
parameters by the equation (Nienow, 1997),
-1/3 -1/3 2/35.9 /m T gD T T 1-1
when H=T. For STR with an aspect ratio, AR (=H/R)>1, then (Nienow, 1997),
2.43/mµ H D 1-2
It was assumed that the density of the medium is close to that of water (1000 kg m-3)
and that the Reynolds number is greater than 1 x 10⁴. 2Re /L ND , where ρL is
the media density, η is the viscosity, D is the impeller diameter and N, its speed (rev
s-1). Furthermore, it is assumed that the very low gas flow rate used in animal cell
culture, to date, does not alter the impeller performance, so that gPo Po

Chapter 1: Literature Survey
19
(Langheinrich et al., 1998). It is clear from Equation 1-1 that m is proportional to
vessel diameter (T2/3) and at constant ( )T I will therefore increase on scale-up to a
geometrically similar STR, for which D/T is the same as the laboratory-scale.
Indeed, to maintain a constant m with an increase in the STR scale by only a
factor of 10 with dimensional consistency (constant D/T) will increase ( )T I
significantly. The calculation of the actual value follows.
The power input, P (W), to the STR, imparted by the impeller, is given by
3 5LP Po N D 1-3
and the mean specific energy dissipation rate (W kg-1 or m2 s-3) from the impeller is given by
/T LIP V 1-4
where V is the volume of medium in the STR and in a cylindrical tank is given by
3/ 4V T 1-5
Since D/T is constant, 3V D and from Equation 1-4
3 2( )T I N D 1-6
Thus, for a constant m , N is constant and D increases by a factor of 10, increasing
( )T I by 100-fold. This substantial increase in ( )T I impacts on concerns around the
‘shear sensitivity’ of animal cells, and it is therefore likely that a greatly decreased N
will be chosen for scale-up, increasing m (Equation 1-9).
Furthermore, the increase of ( )T I with scale means that a decrease in N
need not leave O2 mass transfer requirements unmet, and it may be considered
desirable to maintain O2 mass transfer characteristics on scale-up. The O2 mass

Chapter 1: Literature Survey
20
transfer coefficient Lk a (s-1) is related to the gassed mean specific energy
dissipation rate ( )T Ig (gas from sparging) and the superficial gas velocity, sv , by,
L T sIgk a A v 1-7
Equation 1-7 applies independent of the impeller type and scale; α and β are usually
about 0.5 0.1 , whatever the medium. A is extremely sensitive to medium
composition (Nienow, 2003). Thus for a linear scale-up, maintaining geometric
similarity and medium consistency, it is possible to meet O2 transfer requirements
with a decreased N, so long as sv is maintained.
Scale up criterion Designation Constant
P/V Constant
N Constant
UT Constant
Re Power Input or Energy Dissipation Rate P PαN3D5 1000 105 100 0.1
Mean Specific Energy Dissipation Rate P/V P/VαN3D2 1 100 0.1 10-4 Impeller Rotational Speed N 0.22 1 0.1 0.01 Impeller Diameter D 10 10 10 10 Mixing Time θm θm α N-1 4.64 1 10 100 Maximum Impeller Tip Speed UT UTαND 2.2 10 1 0.1 Reynolds Number Re ReαND2 22 100 10 1
Table 1-1: The effect of scale-up criteria for a 10-fold linear scale-up maintaining geometric similarity on mixing parameters that impact on stirred tank reactor (STR) performance. Adapted from Amanullah (1994).
Cell fragility concerns in animal cell culture often overshadow proper consideration
of m and have resulted in the acceptance of constant impeller tip-speed (UT) and
constant ( )T I as scale-up criteria.
Maintenance of UT is acknowledged by Varley and Birch (1999) as a scale-
up criterion, despite a 10-fold increase in m :

Chapter 1: Literature Survey
21
TU ND 1-8
Since 3 2( )T I N D and 1/3 1/3 2/3m 5.9 /T D T T , for constant D/T
1/3 2/33 2m N D D
1-9
and therefore
1m N 1-10
for a constant (D/T), and if N is held constant and D decreased for constant UT
1m D 1-11
Thus, as Nienow (2006) states, ‘maintaining constant tip speed is a major constraint
on scale-up with severe implications for mass transfer as well as homogeneity.’ Yet
there is little evidence to support the assertion that tip speed has a critical effect in
terms of shear; indeed, Amanullah et al. (2003) found in a mycelium fermentation
that damage went down on scale-up, despite an increase in tip speed.
To restrict hydrodynamic shear created by the impeller, scale-up is often
conducted with constant ( )T I as the criterion, but since
3 2( )T I N D 1-12
and D increases 10-fold, then N3 must decrease by 100-fold, so by finding x,
3
100 smallscaleN Nx
1-13
it is found that m is decreased by 4.64-fold. If STR heterogeneity is not a concern
this may seem appealing, since thanks to the low O2 uptake rate (OUR) of animal
cells, even at this decreased agitator speed, N, it is easy to meet the O2 demands of
the culture.
Chapter 1: Literature Survey
22
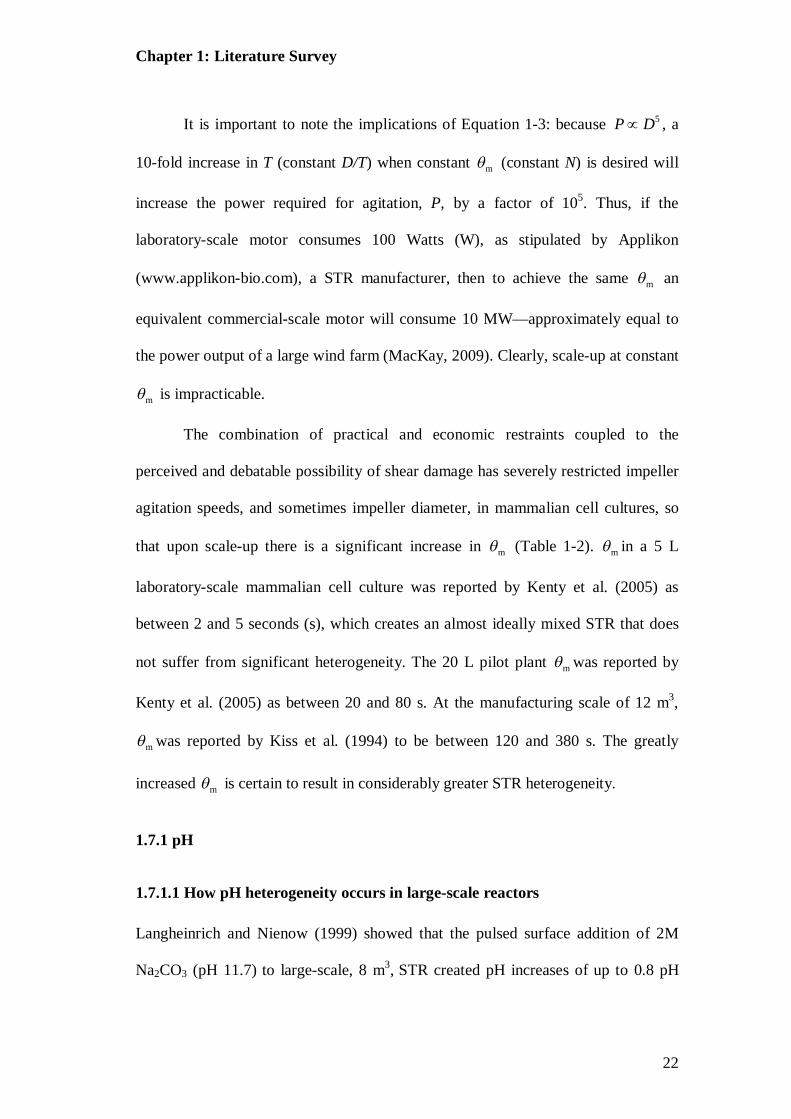
It is important to note the implications of Equation 1-3: because 5P D , a
10-fold increase in T (constant D/T) when constant m (constant N) is desired will
increase the power required for agitation, P, by a factor of 105. Thus, if the
laboratory-scale motor consumes 100 Watts (W), as stipulated by Applikon
(www.applikon-bio.com), a STR manufacturer, then to achieve the same m an
equivalent commercial-scale motor will consume 10 MW—approximately equal to
the power output of a large wind farm (MacKay, 2009). Clearly, scale-up at constant
m is impracticable.
The combination of practical and economic restraints coupled to the
perceived and debatable possibility of shear damage has severely restricted impeller
agitation speeds, and sometimes impeller diameter, in mammalian cell cultures, so
that upon scale-up there is a significant increase in m (Table 1-2). m in a 5 L
laboratory-scale mammalian cell culture was reported by Kenty et al. (2005) as
between 2 and 5 seconds (s), which creates an almost ideally mixed STR that does
not suffer from significant heterogeneity. The 20 L pilot plant m was reported by
Kenty et al. (2005) as between 20 and 80 s. At the manufacturing scale of 12 m3,
m was reported by Kiss et al. (1994) to be between 120 and 380 s. The greatly
increased m is certain to result in considerably greater STR heterogeneity.
1.7.1 pH
1.7.1.1 How pH heterogeneity occurs in large-scale reactors
Langheinrich and Nienow (1999) showed that the pulsed surface addition of 2M
Na2CO3 (pH 11.7) to large-scale, 8 m3, STR created pH increases of up to 0.8 pH

Chapter 1: Literature Survey
23
units, 0.6 units in excess of the desired 0.2 units step change for control. Having
coloured the alkali, they were able to observe an alkali plume covering a significant
portion of the upper half of the vessel. Larsson et al. (1996) estimated a total feed
zone volume of 10% in a 30 m3 STR (created by glucose feed to the liquid surface)
during Saccharomyces cerevisiae (S. cerevisiae) cultivation to 20 g L-1. In high cell
concentration culture, pH excursions have been shown to occur even in laboratory-
scale reactors: Ozturk (1996) observed the formation of a viscous ‘snow-ball’ close
to the addition point of concentrated alkali feed and this was clearly the result of cell
lysis (Nienow, 2006). Excursions in pH may not always have such dramatically
visible effects on cell culture, but they are certain to expose cells to a sub-optimal
growth environment.
1.7.1.2 The effect of pH on CHO cell culture
The effect of pH on CHO cell growth, protein production and protein glycosylation
has been established by several research groups. Borys et al. (1993) investigated the
effect of culture pH on a CHO cell culture producing a recombinant mouse placental
lactogen (mPL-I), and found that protein expression rate and extent of glycosylation
were maximum between pH 7.6 and 8.0, while glycosylation was observed to
decrease below pH 6.9 and above 8.2. Yoon et al. (2004) and Trummer and Fauland
(2006) have completed similar, but more comprehensive, studies of the effect of pH
on CHO culture that revealed pH effects on substrate consumption and protein yield;
both observed a specific protein yield decrease when the pH was decreased below
optimal for cell growth and viability.

Chapter 1: Literature Survey
24
Table 1-2: Based on Table 2 (Reported Mixing Times) in Lara et al. (2006). This table shows the mixing times, m , in several types of stirred tank reactor (STR) in a range of sizes. Note that in the 5 L (laboratory-scale) STR used to culture CHO cells m is reported to be only 2-5 seconds, which can be considered almost instantaneous; at the pilot plant scale the m is 20-80 seconds and therefore not ideal, but at manufacturing-scale it is reported to be in excess of 120 seconds, which will allow considerable STR heterogeneity. m3 used in place of 1000 L, for brevity.
Reactor Type Reactor
Configuration Scale Organism Mixing Time (seconds) Reference
Cell Culture STR - 5 L CHO 2-5 Kenty et al. (2005)
STR - 8.5 L Plant Cells 3-6 Leckie et al. (1991)
STR Helical Ribbon 11 L Plant Cells 18-25 Jolicoeur et al. (1992)
STR - 20 L CHO 20-80 Kenty et al. (2005)
STR - 8 m3 Mammalian Cells 40-200 Langheinrich et al. (1998)
STR - 10 m3 Plant Cells 20-200 Doran (1993)
STR - 12 m3 Mammalian Cells 120-360 Kiss et al. (1994)
STR Spin filter,
Hydrofoil impeller, 20 rpm
10 L CHO 120 Jem et al. (1994)
STR 250 L CHO 120 Jem et al. (1994)
STR Spin filter, Pitched Blade impeller, 80
rpm 250 L CHO 1620 Jem et al. (1994)
STR
spin filter, Hydrofoil impeller,
mixed through spin filter
1 m3 CHO 3120 Jem et al. (1994)
Bubble Column - 15 L Plant Roots 2400 Curtis (2000)
Airlift - 10 m3 Plant Cells 200-1000 Doran (1993)
Microbial Culture
STR Three Rushton impellers 12 m3 Microorganisms 10-50 van der Lans et al. (2000)
STR Three Scaba impellers 12 m3 Microorganisms 10-30 van der Lans et al. (2000)
STR Three Rushton impellers 30 m3 Microorganisms 125-250 van der Lans et al. (2000)
STR Three Scaba impellers 30 m3 Microorganisms 70-110 van der Lans et al. (2000)
Bubble Column - 2 m3 Microorganisms 18 Schugerl (1993)
Airlift - 2 m3 Microorganisms 80 Schugerl (1993)
Airlift tower loop - 4 m3 Baker's Yeast 100-175 Schugerl (1993)
Bubble Column - 40 m3 Microorganisms 80 Schugerl (1993)
Airlift - 40 m3 Microorganisms 100 Schugerl (1993)
Bubble Column - 150 m3 Baker's Yeast 10-1000 Sweere et al. (1987)

Chapter 1: Literature Survey
25
Glucose and lactate production rates were found by Trummer and Fauland (2006) to
have increased nearly twofold by elevating the pH value from 6.8 to 7.2, in
accordance with the findings of Yoon et al. (2004). Trummer and Fauland (2006)
also found that specific glutamine consumption rates also increased from pH 6.8 to
7.3, but to a lesser extent than specific glucose consumption rates. The specific
ammonia production rate, qAmmonia, decreased as pH was increased from 6.8 to
7.1, and remained constant thereafter; Yoon et al. (2004) found no influence on
glutamine and ammonia metabolism of CHO cells for a pH range between 6.85 and
7.60. Decreased antibody sialylation (a type of glycosylation, Section 1.2.1.3) was
observed by Borys et al. (1993) below pH 6.9 and above pH 8.2, while Trummer and
Fauland (2006) found that between pH 6.8 and pH 7.3 the degree of sialylation
remained constant.
An investigation of pH perturbations similar to those found in large-scale
animal cell reactors has been conducted by Osman et al. (2002) using a two-
compartment technique to create pH excursions similar to those that occur when
alkali is added to poorly mixed large-scale reactors. Their study is the only one of its
type to be conducted with mammalian cells; the details of the method are discussed
(Section 1.8.3). Osman et al. (2002) investigated the effect of single and multiple pH
perturbations on the growth of glutamine synthetase murine myeloma (GS-NS0) cell
culture. In two separate experiments, cells were exposed to single and multiple pH
perturbations. Single perturbations were created by a single shift in pH from pH 7.3
to either pH 8.0 or 9.0 for durations ranging from 0 to 90 minutes. No measurable
decrease in cell viability was found for pH 8.0 perturbations lasting from 0 to 90
minutes; pH 9.0 perturbations lasting for 10 minutes caused a 15% decrease in
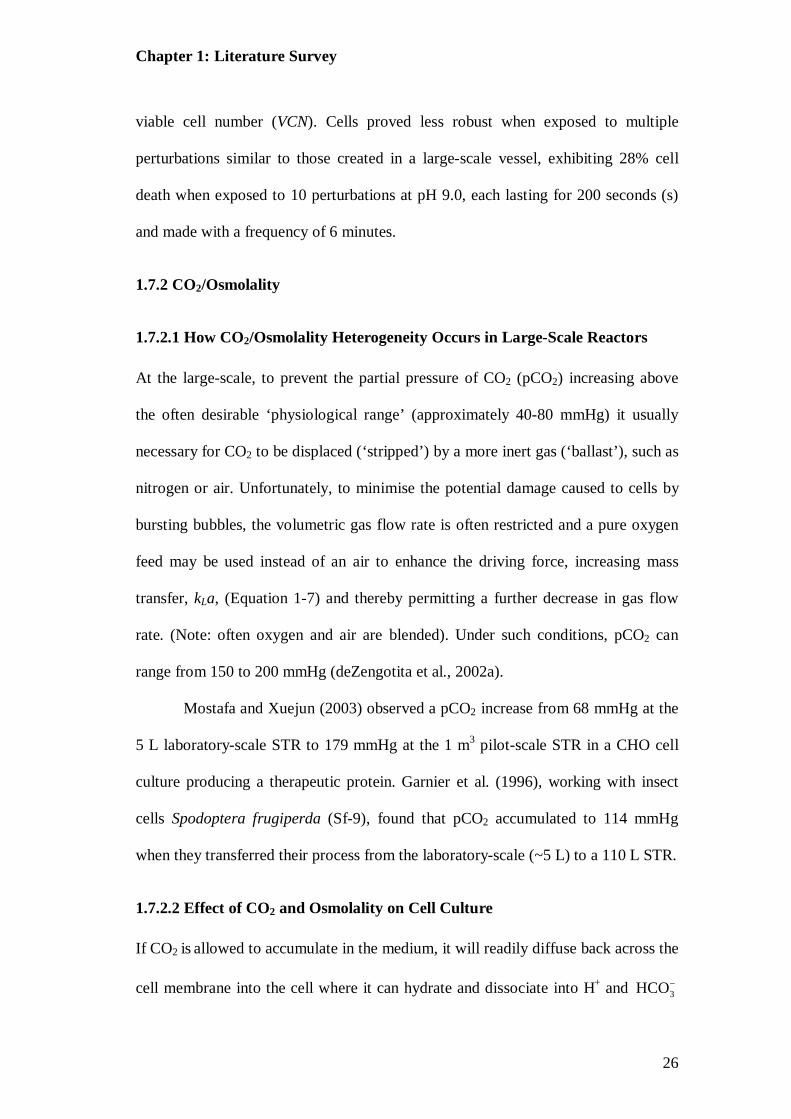
Chapter 1: Literature Survey
26
viable cell number (VCN). Cells proved less robust when exposed to multiple
perturbations similar to those created in a large-scale vessel, exhibiting 28% cell
death when exposed to 10 perturbations at pH 9.0, each lasting for 200 seconds (s)
and made with a frequency of 6 minutes.
1.7.2 CO2/Osmolality
1.7.2.1 How CO2/Osmolality Heterogeneity Occurs in Large-Scale Reactors
At the large-scale, to prevent the partial pressure of CO2 (pCO2) increasing above
the often desirable ‘physiological range’ (approximately 40-80 mmHg) it usually
necessary for CO2 to be displaced (‘stripped’) by a more inert gas (‘ballast’), such as
nitrogen or air. Unfortunately, to minimise the potential damage caused to cells by
bursting bubbles, the volumetric gas flow rate is often restricted and a pure oxygen
feed may be used instead of an air to enhance the driving force, increasing mass
transfer, kLa, (Equation 1-7) and thereby permitting a further decrease in gas flow
rate. (Note: often oxygen and air are blended). Under such conditions, pCO2 can
range from 150 to 200 mmHg (deZengotita et al., 2002a).
Mostafa and Xuejun (2003) observed a pCO2 increase from 68 mmHg at the
5 L laboratory-scale STR to 179 mmHg at the 1 m3 pilot-scale STR in a CHO cell
culture producing a therapeutic protein. Garnier et al. (1996), working with insect
cells Spodoptera frugiperda (Sf-9), found that pCO2 accumulated to 114 mmHg
when they transferred their process from the laboratory-scale (~5 L) to a 110 L STR.
1.7.2.2 Effect of CO2 and Osmolality on Cell Culture
If CO2 is allowed to accumulate in the medium, it will readily diffuse back across the
cell membrane into the cell where it can hydrate and dissociate into H+ and 3HCO

Chapter 1: Literature Survey
27
and alter the cell’s pHi (Alberts et al., 1989). If cellular control of pHi is lessened or
manipulated, viability and productivity will likely decrease and protein processing
be altered (deZengotita et al., 2002b).
Accumulation of CO2 in solution decreases the pH of the STR, and
subsequent pH control by alkali addition creates a concomitant increase in medium
osmolality. Osmolality is an important process variable that is ideally maintained
between 260 and 320 milliosmoles (mOsm kg-1), to mimic the osmolality of serum
at 290 mOsm kg-1 (Ozturk and Palsson, 1990). Reports of the effect of pCO2 and
osmolality on CHO cell growth, protein production and glycosylation are present in
the literature. Zhu et al. (2005) explored the effects of high pCO2 and osmolality on
CHO cell growth and production of antibody-fusion protein B1 in a laboratory-scale
STR. At a controlled osmolality (~350 mOsm kg-1), cells were exposed to an
elevation in pCO2 from 50 to 150 mmHg; this resulted in a specific growth cell
growth rate, µ, fall of 9%; an elevation in osmolality from 316 to 450 mOsm kg-1, at
a constant pCO2 of 50 mmHg, led to a 60% decrease in µ. At osmolality levels
above 500 mOsm kg-1 cell viability decreased but antibody titre remained unaltered,
indicating an increased specific productivity at hyperosmolality. The stress of
elevated pCO2 (160 mmHg) was exacerbated by elevated osmolality
(450 mOsmkg-1), causing a larger decrease in cell viability than exposure to each
separately. These results are in accordance with those of Kimura and Miller (1996)
who also explored the effects of elevated pCO2 and osmolality on growth and
recombinant production of CHO cells.
Osmolality and pCO2 may both alter the pHi of the cell’s organelles, but they
appear to have surprisingly little influence on protein glycosylation: tissue

Chapter 1: Literature Survey
28
plasminogen activator (tPA) produced in CHO cell culture at elevated pCO2 had
only around 1-2% decrease in the amount of N-glycolyl-neuramic acid as a fraction
of total sialic acid (Kimura and Miller, 1997). Negligible impact of pCO2 on
glycosylation was also observed in hybridoma culture, where pCO2 did not
significantly alter cells’ production and processing of the antibody. Glycosylation
was found to be less robust under the influence of hyperosmotic stress, which
increased the heterogeneity of the protein distribution, increasing the isoelectric
point by 0.41 pH units at 435 mOsmkg-1 (Schmelzer and Miller, 2002).
1.7.3 Oxygen
1.7.3.1 How Oxygen Heterogeneity Occurs in Large-Scale Reactors
In a poorly mixed bioreactor, heterogeneity may result in O2 limitations in parts of
the STR where the O2 transfer rate is exceeded by the cells’ rate of O2 consumption.
Dissolved O2 gradients do not yet occur in large-scale mammalian cell culture
because the O2 uptake rate (OUR) is still much less than typical microbial culture, at
about 5 x 10-17 mole O2 s-1 cell-1 (Gray et al., 1996; Carvlhal et al., 2003), which at 1
x 107 cells mL-1 equates to an OUR of 5 x 10-14 mole O2 L-1 s-1, compared to
microbial culture, which consume around 1.5 x 10⁻⁶ mol O2 s-1 g of dry cell weight
(DCW)-1 (Noguchi et al., 2004), which at 100 g (DCW)L-1 equates to an OUR of 1.5
x 10-4 mole O2 L-1 s-1. Indeed the presence of O2 gradients and O2 limitations in the
large-scale microbial culture, where cell concentration can reach 200 g (DCW) L-1 in
high cell concentration culture (Lee, 1996), is a recognised problem (Oosterhuis and
Kossen, 1984; Amanullah, 1994). However, agitation and sparging are limited in
animal cell culture by the prospect of hydrodynamic damage and as the cell

Chapter 1: Literature Survey
29
concentration of the cultures used for large-scale production are increased
significant O2 gradients in mammalian cell cultures are expected by Nienow and
Langheinrich ( 1996). Their prediction is based on a comparison of the characteristic
m to the rate of O2 mass transfer and rate of O2 uptake by cells (regime analysis,
Sweere et al. (1987)) in an 8 m3 STR used to culture CHO320 and NS0 at low cell
densities of 4 x 10⁵ and 2 x 10⁶ cells mL-1, for CHO and NS0 respectively. Potential
O2 limitations were observed for NS0 culture at a mean specific energy dissipation
rate from the impeller, ( )T I , of 0.0135 W kg-1. They note that this ( )T I is around
the low end of the range used in practice. Since cell cultures have been taken to over
1 x 10⁷ cells mL-1 for some time (Birch et al., 1985) and further gains in maximum
cell concentration are predicted (Birch and Racher, 2006), O2 limitation should be
anticipated.
1.7.3.2 The Effect of Oxygen on CHO cell culture
Oxygen is essential for efficient mammalian cell energy generation by aerobic
metabolism in mitochondria, where it is the terminal electron receptor during
oxidative phosphorylation. Cells must modulate their consumption of O2 to meet
energy demands, and to do this they must adapt to the O2 tension of their
environment (Batandier et al., 2002).
The observed impact of dissolved oxygen tension, DOT, as a percentage of
air saturation (% saturation, referred to here as %) on CHO cell culture performance
has not been universal across several studies; notably, those studies conducted in
STR where O2 demand was met by sparging observed the least effect on cell culture.
Kurano et al. (1990a) found that DOT did not significantly influence cell viability

Chapter 1: Literature Survey
30
until O2 limitation occurs at very low DOT (anoxic exposure) of about 5%
saturation, or when hypoxic exposure occurs at DOT above 90%. The most recent
study was conducted by Trummer and Fauland (2006), who found that cell viability
and product titre were not significantly influenced between 30% and 90%. The
lowest cell viable cell number (VCN) was observed at a DOT of 10%. No effect on
antibody specific productivity was observed. These findings contrast with those
made by Link et al. (2004), who observed that a DOT of 40% gave the highest
antibody titre, and Chotigeat et al. (1994), who observed a correlation between DOT
and productivity. Their results must, however, be treated with caution because these
two studies were made using culture methods that may not be analogous to large-
scale STR cell culture. Link et al. (2004) used silicon tubing to provide O2;
Chotigeat et al. (1994) studied a perfusion culture, a culture method that is currently
rarely used for large-scale production.
Trummer and Fauland (2006) observed no connection between DOT and cell
metabolism until the DOT was taken to 10% and below; cell growth decreased and
both glucose consumption and lactate production increased by 20%. Glutamine and
other amino acids were reportedly unaltered, even at a DOT of 10%. Kurano et al.
(1990a) found that glucose utilisation was most efficient between 50% and 100%.
The few studies that explored the effect of DOT on glycosylation profile of
the protein observed alterations: Trummer and Fauland (2006) found a loss of
protein sialylation at a DOT of 100%, and no effect on sialylation at any other
tension, including anoxic growth. A positive correlation between sialyltransferase
activity in CHO cells and DOT was reported by Chotigeat et al. (1994).

Chapter 1: Literature Survey
31
1.7.4 Substrate
1.7.4.1 How Substrate Heterogeneity Occurs in Large-Scale Reactors
During fed-batch cultures, substrate addition is generally made to the liquid surface
of the culture in the same manner as alkali additions (Section 1.7.1). Unlike alkali,
which is added in small batches as required for control, substrate addition is often
made continuously at a low flow rate, calculated based on cell growth. One would
therefore expect an accompanying high concentrate plume, as occurred during alkali
additions to the surface. The substrate plume would be persistent and likely of
relatively low magnitude, compared to the transient alkali plume. No studies on
substrate heterogeneity of mammalian cell culture are found in the literature, but a
high nutrient concentration plume that lowered protein titre and increased by-
product formation has been observed in microbial culture (Bylund et al., 1998;
Enfors et al., 2001). It is probably only a matter of time until rising cell densities in
large-scale animal cell culture that are needed to increase volumetric therapeutic
protein production make substrate gradient a concern (Nienow, 2006).
1.7.4.2 The Effect of Substrate and Metabolites on Cell Culture
The carbon sources glucose and glutamine are the most widely used substrates in
cell culture (Butler, 2005a); their catabolysis by cells releases energy and precursors
for biosynthesis. An overabundance or inefficient use of these substrates results in
the excretion of the metabolic by-products (metabolites) lactic acid (lactate), from
glucose, and ammonia from glutamine.

Chapter 1: Literature Survey
32
1.7.4.3 Lactate
Entry of glucose into the glycolytic pathway leads to the formation of pyruvate as
the product. In animal cells, pyruvate can either be shuttled into the TCA cycle or
converted into lactate. Aerobic lactate production is atypical for normal diploid cell
strains (Mulukutla et al., 2010); cancer cells, however, have been shown to produce
lactate in fully aerobic condition, termed the Warburg effect (Warburg, 1930).
Indeed, it is likely that glycolytic lactate production is connected to their
proliferative capabilities (Xu et al., 2005; Vazquez et al., 2010). Cell lines developed
for industrial cell culture share similar continuous growth abilities with cancer cells
and they too typically produce lactate under fully aerobic conditions (Mulukutla et
al., 2010). Lactate production under aerobic conditions is usually attributed to the
high flux of glucose to pyruvate and supposed inefficient coupling between
glycolysis and the tricarboxylic acid (TCA) cycle (Tsao et al., 2005). Recently,
lactate consumption has been reported in industrial cell culture, and is considered
desirable, by lowering concentrations of this potentially deleterious metabolite (Tsao
et al., 2005; Mulukutla et al., 2010).
Several studies of CHO and NS0 cell culture have reported a strong negative
influence of lactate on viability and weak or positive influence on protein
productivity (Kurano et al., 1990a; Newland et al., 1990; Ozturk et al., 1992; Xing et
al., 2008). Nevertheless, several contrary studies found little or no negative effect
(Reuveny et al., 1986; Reuveny et al., 1987; Kurano et al., 1990a; Lao and Toth,
1997).
There is some evidence that lactate acts indirectly by increasing osmolality
(Kurano et al., 1990b). After correcting for osmolality, Lao and Toth (1997)

Chapter 1: Literature Survey
33
attributed 25% of the observed growth inhibition to lactate. The increased antibody
production that has been attributed to accumulation of lactate was instead likely
caused by elevated osmolality, both from the lactate itself and, probably to greater
extent, the alkali required to increase pH (Kimura and Miller, 1996; Vivian et al.,
2002; Zhu et al., 2005). In poorly controlled vessels, and perhaps in localised
regions of those with poor mixing, lactate concentration may also be sufficient to
cause a detrimental fall in pH (Kubicek, 2001).
1.7.4.4 Ammonia
Accumulation of ammonia can disrupt intracellular pH (pHi) decreasing cell growth
and recombinant protein productivity (Chen and Harcum, 2005). Several studies
have shown ammonia inhibition of cell growth in CHO culture (Kurano et al.,
1990a; Chen and Harcum, 2005; Xing et al., 2008), while antibody yield was not
investigated; ammonia is known to decrease cell growth and antibody yield in
hybridoma cells (Reuveny et al., 1986). However, a similar study (Yang and Butler,
2000) exploring the effects of ammonia on CHO cells during erythropoietin
production (EPO) found cell growth inhibition above a concentration of 5 mM
ammonia, but observed an increase to EPO yield. In general, ammonia accumulation
was found to create a significant increase in glycoform heterogeneity and decrease
in terminal sialylation (Andersen and Goochee, 1994; Zanghi et al., 1998; Yang and
Butler, 2000).
1.7.4.5 Glucose and Glutamine Level
Consistent low concentration of glucose and glutamine has been shown to increase
cell viability and productivity while decreasing metabolite formation. Unfortunately,

Chapter 1: Literature Survey
34
glycosylation levels of recombinant proteins are also decreased: glucose starvation
creates a shortage of glucose-derived nucleotide sugars, which are replaced by
smaller species derived from alternate glycosylation pathways (Rearick et al., 1981;
Gu and Wang, 1998). In glucose limited chemostat CHO culture, Hayter et al.
(1992a) observed a decrease in the glycosylation of gamma interferon. Their finding
is supported by Wong et al. (2004) who conducted a series of fed-batch studies
exploring limited substrate concentration on CHO culture, again producing human
interferon gamma (IFN-γ): glucose and glutamine molalities below critical values of
0.7 mM and 0.1 mM, respectively, decreased sialylation and increased hybrid and
high mannose type glycans.
Thus, cells are prone to inhibition of cell growth and formation of potentially
deleterious metabolites at elevated concentration of substrate, and incomplete
protein glycosylation at a dearth of substrate. Process development entails steps to
optimise the substrate concentration for antibody titre and quality, but heterogeneity
in a typical poorly mixed large-scale animal cell STR may expose cells to
suboptimal concentrations, with the clear potential to decrease antibody titre and
alter antibody quality.
1.8 Scale-Down Methods
The aim of scale-down is to create, at the laboratory or pilot-scale, conditions
present at the large-scale. The type of scale-down considered here seeks to replicate
the heterogeneity of a large-scale STR in laboratory-scale STR, which otherwise has
near perfect mixing and STR homogeneity. Creation of heterogeneity like that
experienced during large-scale production, should provide some useful insight into
the expected performance of the cell culture process under conditions like those that

Chapter 1: Literature Survey
35
occur during manufacturing, without the considerable cost and difficulty of
performing large-scale runs. Further, it should be possible to optimise potentially
problematic process parameters and thereby improve the chances of a successful and
predictable scale-up.
To study cell behaviour effectively on scale-up a scale-down method is
required to simulate the conditions of large-scale heterogeneity with a reasonable
degree of accuracy. Several different methods of scale-down have been used to
simulate the O2, pH and substrate gradients in the cultivation of a range of different
organisms. The method is approached by adopting either a one or a two-
compartment system: single STR and loop reactors belong to the former, while STR
linked to another STR (STR+STR) and STR linked to a plug flow reactor, PFR,
(STR+PFR) to the latter.
In the following sections, relevant examples from the literature will be used
to discuss the relative merits of approaches to scale-down. Only a single study has
attempted a two-compartment scale-down of large-scale mammalian culture, using
the STR+STR method to create pH perturbations (Osman et al., 2002), so most of
following discussion will unavoidably centre on microbial scale-down studies, of
which there are many.
1.8.1 Single-Compartment Models
In a single-compartment scale-down, it is possible to model temporal gradients in
STR concentration, but not spatial gradients, as they would occur at the large scale.
Spatial gradients cannot be created in the laboratory-scale STR because it is not
compartmentalised and perturbations must therefore occur throughout the whole
reactor. In spite of this limitation, it does provide a simple method to explore the

Chapter 1: Literature Survey
36
effect of cell exposure to repeated process perturbations. The two-compartment
model was used in this study because of its greater suitability for modelling of
repeated perturbations throughout the duration a production cell culture. A review of
single-compartment scale-down can be found in Osman et al. (2002).
1.8.2 Two-compartment Models
The two-compartment model is usually founded on the premise that when
cells cycle around a heterogeneous large-scale STR they are effectively exposed to
two aggregated regions (zones) (Section 1.5). As a result of inefficient mixing, one
zone is subject to perturbations in the concentration of some fundamental parameter
and the other zone is not. Perturbations are created by either elevated or depleted
levels of a fundamental parameter. Primarily, elevated concentration is caused by
inefficient dispersal of feeds from a poorly mixed zone, and depleted concentration,
by inefficient mixing of a feed into a zone.
Two-compartment systems seek to recreate these separate zones, using two
homogeneous vessels. Accordingly, one vessel is controlled to simulate the
conditions in a well-mixed zone; the other vessel, to simulate a poorly mixed region.
Heterogeneity is introduced by cycling the cell culture between the two vessels
(Figure 1-3). Within the limits of the model, its efficacy as a simulation of large-
scale heterogeneity is largely dependent on the type and size of vessels, the location
of feed-points, and the cycle rate between them. Note that two-compartment scale-
down models provide only an approximation to conditions that actually occur in a
large-scale vessel; furthermore, the flow and dispersion conditions in the region
surrounding the feeding positions are not characterised.

Chapter 1: Literature Survey
37
Table 1-3: Based on Table 1 in Osman et al. (2002). The majority of the scale-down studies in the literature are presented. It can be seen that few studies have simulated pH heterogeneity, despite the importance of this parameter in process optimisation. Only one study has explored the effect of heterogeneity on mammalian cell culture: that of Osman et al. (2002).
Scale-Down Method Heterogeneity Organism
Comparison to Large-
Scale Performance
Author(s)
Single Compartment
STR Oxygen Penicillium chrysogenum Varder and Lilly (1982)
STR Oxygen Gluconobacter oxydans Oosterhuis (1985)
STR pH AB2-143.2 Hybridoma Cells Miller et al. (1988)
STR Oxygen Saccharomyces cerevisiae Sweere et al. (1988)
STR Oxygen Saccharomyces cerevisiae Namdev et al. (1991)
STR Oxygen Aspergillus niger Trager et al. (1991)
STR Oxygen Streptomyces clavuligerus Yegneswaran and Gray (1991)
STR Oxygen Bacillus subtilis Suphantharika et al. (1995)
STR Oxygen Spodoptera frugiperda Rhiel and Murhammer (1995)
Loop Oxygen A. pullulan McNiel and Kristiansen (1987)
Loop Oxygen Saccharomyces cerevisiae McNiel and Kristiansen (1990)
Two-compartment
STR+STR Oxygen Gluconobacter oxydans Good Oosterhuis et al. (1983)
STR+STR Oxygen Gluconobacter oxydans Good Oosterhuis et al. (1985)
STR+STR Oxygen Saccharomyces cerevisiae Not Made Sweere et al. (1988)
STR+STR Oxygen and pH Bacillus subtilis Not Made Amanullah (1993) (PhD thesis)
STR+STR Oxygen Enterobacter aerogenes Not Made Byun (1994)
STR+STR pH NSO Not Made Osman et al (2002)
STR+PFR Glucose Saccharomyces cerevisiae Not Made Fowler and Dunlop (1989)
STR+PFR Oxygen Penicillium chrysogenum Not Made Larsson and Enfors (1985)
STR+PFR Oxygen Escherichia coli Not Made Larsson and Enfors (1993)
STR+PFR Oxygen Saccharomyces cerevisiae Not Made Larsson and Enfors (1993)
STR+PFR Glucose Escherichia coli Fair Larsson and Enfors (1999)
STR+PFR Glucose Saccharomyces cerevisiae Not Made Namdev et al. (1992)
STR+PFR Oxygen and pH Bacillus subtilis Not Made Amanullah (1993) (PhD thesis)
STR+PFR Glucose and Oxygen Escherichia coli Good Hewitt et al. (2000)
STR+PFR Glucose and Oxygen Escherichia coli Good Hewitt et al. (2001)

Chapter 1: Literature Survey
38
Nevertheless, two-compartment scale-down should provide an improvement on
process development conducted entirely in perfectly mixed STR without due regard
to the problems that large-scale STR heterogeneity might present. Two-compartment
models have been created by connecting two STR together, and by connecting a
STR to a PFR.
1.8.3 STR+STR
Two stirred tank reactors (STR), usually a large STR and a small STR, are
connected by a small length of piping (time spent in the pipe should be
insignificant). Flow between the two vessels is typically mediated by peristaltic
pumps and is analogous to the interchange between the well-mixed impeller region
the poorly mixed region. In effect, the fluid flow created by the impeller in a large-
scale vessel is replaced by the pumped flow in the scale down model (Amanullah,
1994). The mean residence time (RT) in each compartment is dependent on two
factors: the size of the vessel and the flow rate provided by pumping.
The STR+STR model has been used by several groups working at the
laboratory-scale to simulate the O2 heterogeneity expected in large-scale microbial
reactors (Oosterhuis and Kossen, 1984; Amanullah, 1994; Byun et al., 1994).
Amanullah (1994) used a highly aerated small STR to model the impeller region,
and to model the poorly oxygenated bulk zone of a large-scale STR, a larger STR
was stripped of O2 by sparging with nitrogen. Circulation rates from 15 to 300 s
between the two STR were used to explore the response of Bacillus subtilis (B.
subtilis) to degrees of large-scale heterogeneity.
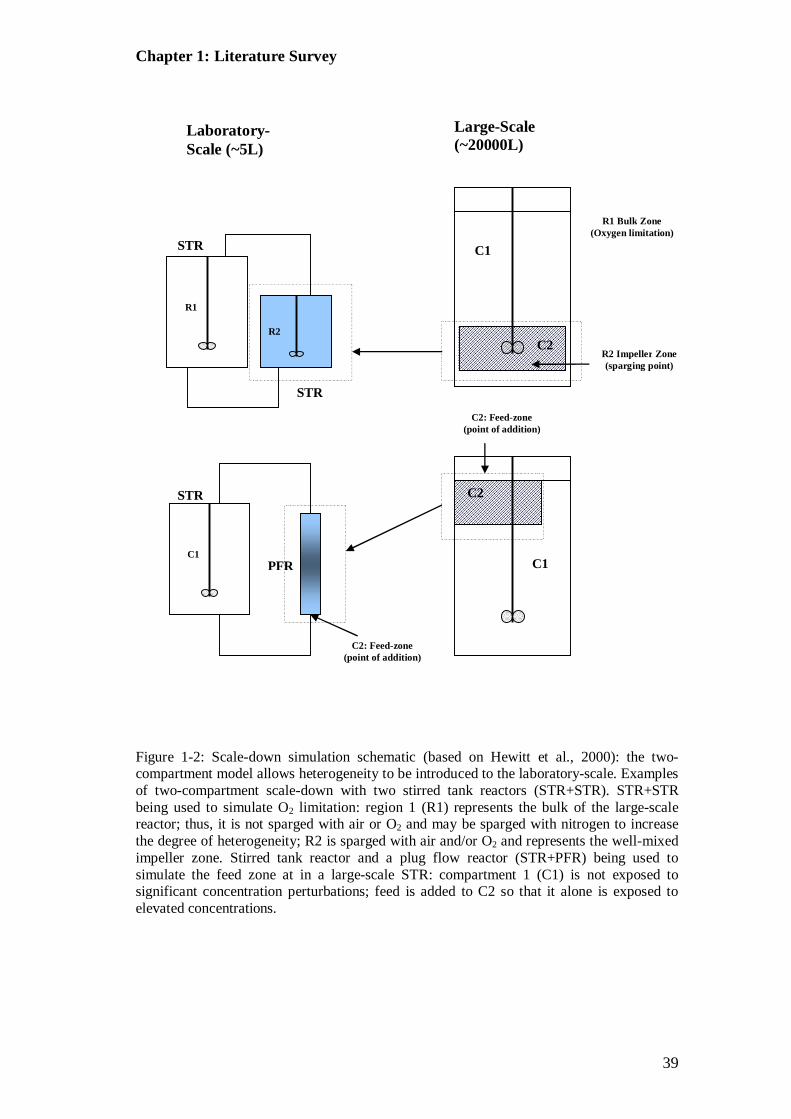
Chapter 1: Literature Survey
39
C1
C2
C2: Feed-zone (point of addition)
C2
C2: Feed-zone (point of addition)
C2 R2 Impeller Zone (sparging point)
R1 Bulk Zone (Oxygen limitation)
C1
STR
R2
R1
STR
Large-Scale (~20000L)
Laboratory-Scale (~5L)
C1
STR
PFR
Figure 1-2: Scale-down simulation schematic (based on Hewitt et al., 2000): the two-compartment model allows heterogeneity to be introduced to the laboratory-scale. Examples of two-compartment scale-down with two stirred tank reactors (STR+STR). STR+STR being used to simulate O2 limitation: region 1 (R1) represents the bulk of the large-scale reactor; thus, it is not sparged with air or O2 and may be sparged with nitrogen to increase the degree of heterogeneity; R2 is sparged with air and/or O2 and represents the well-mixed impeller zone. Stirred tank reactor and a plug flow reactor (STR+PFR) being used to simulate the feed zone at in a large-scale STR: compartment 1 (C1) is not exposed to significant concentration perturbations; feed is added to C2 so that it alone is exposed to elevated concentrations.

Chapter 1: Literature Survey
40
The same culture and laboratory-scale vessels were also used to explore pH
heterogeneity (Amanullah et al., 2001). In this case, the small STR, controlled at pH
6.5, represented the feeding zone of a poorly mixed large-scale STR; the large STR,
controlled at pH 7.2, represented the bulk, away from the feeding zone. To maintain
the two connected vessels at differing pH values required almost continuous addition
of alkali to the larger STR and acid to the smaller STR. This balancing act inevitably
increased osmolality so that it may have overwhelmed the effects of cycling through
a moderate pH excursion. Furthermore, the creation of a continuously elevated pH in
the small STR does not replicate the transient, irregular pH excursions in large-scale
reactors, which are created by batch alkali additions and added at irregular intervals
as required for pH control.
A part solution to the problem of osmolality increase created by successive
pH perturbations, or continuous alkali addition, is offered by Osman et al. (2002).
They connected a 2 L STR (large) and a 1 L STR (small) to investigate the effect of
perturbation frequency, duration and number on GS-NS0 cell growth. To produce a
perturbation, a predetermined volume of alkali (2M NaOH) was added to the small
STR to increase pH from 7.3 to either 8.0 or 9.0; a simultaneous equimolar addition
of acid to the large vessel maintained its pH at 7.3. Since the pH excursions were
transient and made to a small STR (an advantage over the single STR model), the
amount of alkali required was insufficient to create deleterious increases to
osmolality. To control for osmolality, an experimental case was performed in which
alkali was substituted for NaCl. Performance was equivalent to a control without
NaCl addition.
Chapter 1: Literature Survey
41
Unlike Amanullah et al. (2001), Osman et al. (2002) used their scale-down to
produce transient pH perturbations; however, perturbation regularity was set
arbitrarily and did not therefore simulate pH perturbations as they occur when batch
additions of alkali are made to control pH in a large-scale reactor. A better scale-
down should be achieved by adding alkali to the small STR only when it is required
for control of the culture; this is accomplished in several studies that used STR+PFR
(Section 1.8.4).
In both of the above studies the perturbation zone was one third of the total
culture volume, which is large compared to the feed zone ratio used by several other
studies: Bylund et al. (1999) and Hewitt and Nebe-Von-Caron (2001) used a 10%
feed zone ratio and only 5% was used by Namdev and Yegneswaren (1991) and by
Amanullah et al. (2001) in further studies. Studies using a 5-10% feed zone were not
conducted using the STR+STR model that probably restricted the vessel size
available to Amanullah (1994) and Osman et al. (2002), but with the STR+PFR
model that is more flexible thanks to the simpler fabrication of a PFR at various
sizes.
1.8.4 STR+PFR
In the same manner as the STR+STR configuration, flow between the two vessels is
provided by peristaltic pumping, which is conceptually analogous to impeller
pumping in the large-scale STR. The plug flow reactor, PFR, is well suited to
simulation of perturbations created by addition to a quiescent feeding zone in a
reactor: in an ideal PFR, mixing will be radial but not axial, allowing the creation of
a step change in concentration that persists and travels along the length of the PFR.
The mean residence time, RT, in the PFR can then be manipulated to simulate the

Chapter 1: Literature Survey
42
duration of a perturbation in the large-scale STR. Perturbations are created by
adding the feed (be it substrate or alkali) to the entry point of the PFR. In an ideal
PFR, feed then travels along the PFR as a pulse of high concentration. Often,
however, there is some degree of longitudinal dispersion and the pulse concentration
‘spreads’ into a Gaussian curve (Levenspiel, 1999). Once the volume of the PFR is
fixed, the recirculation rate dictates frequency at which cells enter the PFR and the
exposure time of cells within the perturbation as it travels down the length of the
PFR.
The method has been used by several groups to simulate O2, nutrient, and pH
perturbations (Table 1-3). O2 limitation is created either by metabolic consumption
of O2 within the unaerated PFR or by using nitrogen to strip O2 from the medium as
it flows into the PFR.
Namdev and Thompson (1992) used an STR+PFR configuration to
investigate the effects of substrate addition to the feeding zone on S. cerevisiae
culture at the large-scale. The PFR was fed intermittently, in accordance with the
Monte-Carlo method (Namdev and Yegneswaren, 1991), which attempts to account
for the time fluid elements spend in the bulk region of the STR as they cycle
between the feed zone and the impeller zone. By feeding in this way, they sought to
replicate the circulation time distribution of cells, and their resultant exposure times
to the feed zone that is found in a large-scale vessel.
A survey of the literature shows that the Monte-Carlo method of feeding is
not used in the majority of two-compartment studies. It was not used, for example,
by Hewitt et al. (2000) in a novel study that applied flow cytometry (FC) to
determine the physiological response of E. coli in a scale-down of substrate

Chapter 1: Literature Survey
43
heterogeneity that produced a good correlation to the culture’s performance in a 20
m3 large-scale fed-batch STR, characterised in earlier work by Hewitt et al. (1998).
Interestingly, substrate heterogeneity actually increased cell viability. The PFR used
by Hewitt et al. (2000) was developed by George et al. (1993) as part of a series of
scale-down studies (Table 1-3). Neither Namdev and Thompson (1992) nor Hewitt
et al. (2000) characterised their PFR so it is unknown if plug flow was achieved.
Nevertheless, George et al. (1993) established plug flow that was well characterised
and because they adapted the same method it can therefore be assumed that the PFR
used by Hewitt et al. (2000) was also in plug flow.
In one of the few studies that have investigated pH perturbations, Amanullah
et al. (2001) used the STR+PFR to model pH addition to the surface of a poorly
mixed large-scale STR during B. subtilis cultivation. Alkali was added to the PFR
by the STR control system when required to maintain pH at the controller set-point.
Characterisation of the PFR showed that stagnant zones were present at the flow rate
used to create a theoretical mean residence time of 120 s; small deviations from plug
flow were assumed and the axial dispersion model with a Gaussian flow distribution
(described by Levenspiel, 1999) was used to characterise the flow.
Decreased cell viability, the ratio of live cells to total cells, is often reported
when cells are exposed to concentration gradients that occur in heterogeneous
culture. Viability is typically found using Trypan Blue exclusion on the
haemocytometer (HC); however, this method is slow and subjective and does not
provide any additional information on cell physiology. In this study, HC will be
compared to a rapid objective analysis and quantification of cells provided by multi-
parameter flow cytometry (FC). This powerful technique shall be applied, for the

Chapter 1: Literature Survey
44
first time, to characterise the cell population in a scale-down of large-scale
mammalian cell culture, with the aim of improving the understanding of how GS-
CHO cultures respond to STR heterogeneity commensurate to that found in large-
scale vessels (Section 1.1).
1.9 Flow Cytometry
1.9.1 Why Flow Cytometry?
Flow cytometry (FC) facilitates the rapid monitoring (100-1000 cells s-1) of
individual cell physiological states. The judicious selection and application of a
mixture of fluorescent stains (in the literature, also referred to as fluorophores and
fluorescent dyes) that stain cells in a manner dependent on the cell’s physiological
state enables a high degree of differentiation of the cell population based on the
cells’ physiological characteristics. High throughput and precise analysis enables the
assessment of large numbers of cells on a cell-by-cell basis, providing a great degree
of statistical resolution in the characterisation of heterogeneous cell culture
populations and identification of sub-populations. FC has been used to study
changes in DNA, RNA, protein, IgG, mitochondrial activity, cell cycle and cell size
- enabling a comprehensive analysis of cell culture (Omerod, 1999). FC can thus be
used to identify and characterise the morphological and biochemical heterogeneity
of cell populations.
1.9.2 What is Flow Cytometry?
At the heart of the machine lies the flow-cell. When analysis is made, cells in
suspension are withdrawn from the sample-tube and forced by a stream of sheath
fluid, which is either water or an isotonic saline solution, to flow through a passage

Chapter 1: Literature Survey
45
in the flow-cell that hydro-dynamically restricts the movement of the cells and
forces them to flow in single file through the focal point of the laser with an
accuracy of 1 µm. This is referred to as hydrodynamic focusing. A cell travelling
through the flow-cell has light focused upon it by a series of lenses; it is the scatter
and reflection of this light from the cell that is collected and amplified, and finally
interpreted to characterise the cell (Figure 1-3).
An exhaustive description of the instrumentation present in a FC can be
found in Omerod (1999) and Shapiro (2003b). To understand how the interaction of
a light source with a cell provides the necessary information for characterisation of
properties as varied as cell size and mitochondrial membrane potential consideration
must be given to light scattering and fluorescence.
1.9.3 Light Scattering
When a laser beam travels through a cell the photons are scattered at all angles. The
intensity of light scattered between 0.5o and 5.0o is approximately correlated to both
the refractive index and cross-sectional area of the cell; this allows a relative
comparison of cell sizes. Light scattered at acute angles is collected by the
photodiode in-line with the illumination beam and is referred to as forward scatter
light.
The intensity of light scattering between 15o and 150o is correlated to the
roughness, irregularity or granularity of the surface and internal constituents of the
cells, but only as an approximate evaluation, and can thereby provide information on
cell viability and levels of intracellular structures, including DNA and protein (Al-
Rubeai, 1999; Shapiro, 2003b). Light scattered at between 15o and 150o is referred
to as side scatter light.

Chapter 1: Literature Survey
46
Figure 1-3: Flow cytometer (FC) layout (adapted from that found in Omerod (1999) the argon-ion laser emits blue light (488 nm) focused on the stream of suspended cells in the flow cell. Photo Multiplier Tubes (PMT) collect side scattered light from cells passing through the laser; the PMT measure four different colours, typically scattered primary-light (blue) and green, orange and red. In the forward direction, a photodiode measures forward scatter light (FS).
Laser
Flow Cell
PMT1
A
C
B
D
PMT2
PMT3
PMT4
Bandpass filters
Dichroic filters
E
F
D
Photodiode
Chapter 1: Literature Survey
47
The application of this sophisticated equipment to measure forward and side
scatter is useful to gauge cell size and granularity, and is an effective, and often
essential, method to discriminate cells from debris, but is often peripheral to the
collection and amplification of fluorescent light emissions.
1.9.4 Fluorescence
Fluorescence occurs in a FC when molecules of a fluorescent stain (stain) within the
cell absorb energy from the laser and their electron energy state is increased from
ground to excited; the energy that is lost when the electron returns to its ground state
is emitted as light (a radiative transmission) at a range of longer wavelengths,
referred to as the emission spectrum.
By careful stain selection, it is possible to detect fluorescence simultaneously
from two, three or even four compounds fluorescing at different wavelengths,
enabling several parameters to be measured at once. Multi-parametric analysis
permits a greater degree of cell characterisation
1.10 Cell Characterisation Using Fluorescent Stains
1.10.1 Stain Selection
Characterisation of multiple cell parameters with a number of stains potentially
enhances our knowledge of the cell’s specific physiological responses to
heterogeneity. In some cases, it was not possible to obtain information on the exact
structure and chemistry of a stain because such information remains proprietary. All
of the following stains are excited by the 488 nm spectral line of an argon-ion laser.

Chapter 1: Literature Survey
48
1.10.2 Plasma Membrane Integrity Stains
The mode of cell death can often be identified by cytoplasmic membrane
permeability: apoptotic cells are reported to retain their cytoplasmic membrane
integrity until cell degradation and secondary necrosis occurs in late-apoptotic cells;
necrotic cell death is accompanied by significant membrane degradation. A measure
of the permeability of a cell’s cytoplasmic membrane (‘membrane permeability’) is
therefore an effective method to discriminate between viable/early-apoptotic cells
and necrotic/late-apoptotic cells (Catchpoole and Stewart, 1993; Zamai et al., 1996).
Membrane disruption or permeability is now an established viability indicator in
mammalian cell culture (Altman et al., 1993; Al-Rubeai et al., 1996; Al-Rubeai,
1999) and is typically revealed by cellular staining with one of the two popular
membrane impermeable cationic stains, PI and EB.
1.10.2.1 Propidium Iodide
PI has two positive charges carried on its heterocyclic ring structure; EB is similarly
structured, but, unlike PI, has only one positive charge and may not therefore be
fully excluded by an intact cytoplasmic membrane. Once PI enters the cell it is
attracted to negatively charged cell constituents such as glycosaminoglycans and
nucleaic acids, and will intercalate between the bases of double stranded nucleic
acids. When bound to DNA its red fluorescent emission is enhanced by from 20- to
30-fold by the reducing environment. In this state, its excitation and emission
maxima are 535 nm and 617 nm, respectively. Since PI should effectively stain only
dead cells it provides a simplistic assay for the live and dead cell population, which,
when used on a FC, may be regarded as a more rapid and precise alternative to
manual counts using the Trypan Blue (TB) exclusion on a haemocytometer
Chapter 1: Literature Survey
49
(Darzynkiewicz, 1992; Al-Rubeai, 1996). The same could be said of Sytox Green,
which will also be used in this study, in conjunction with Annexin-V/PE (Section
1.10.5).
1.10.2.2 Sytox Green
Like PI, Sytox Green (SG) has a high affinity for nucleic acid, easily penetrates and
stains cells with compromised cytoplasmic membranes and yet will not cross the
cytoplasmic membrane of live cells (Haugland, 2002). SG is considerably more
impermeable even than PI. Its structure has not yet been published but its
impermeance is recognised and attributed to the presence of at least three positively
charged groups (Shapiro, 2003b). When bound to DNA, the green fluorescence of
SG is enhanced more than 500-fold, demonstrating considerably higher quantum
efficiency than PI. Furthermore, it has been reported, for cell cycle analysis of yeast,
to exhibit improved coefficients of variation (%CV) and an improvement on PI in its
correlation between DNA content and fluorescence (Haase, 2004). SG is widely
used as a dead-cell stain in conjunction with Annexin V (AV) to discriminate
effectively between apoptotic and necrotic cell death in various cell types
(Haugland, 2002; Mukhopadhyay et al., 2007). FC facilitates the use of a second
stain to provide a positive control or counter-stain and, where possible, a
combination of stains has been used in this study.
1.10.3 Viability Stain
1.10.3.1 Calcein-AM
‘As a general rule, cells that become stained with TB or PI are dead, but cells that
don’t are not necessarily viable’ (Shapiro, 2003b). To confirm the viability of cells
Chapter 1: Literature Survey
50
in this study, they were counter-stained with Calcein acetoxymethylester (Calcein-
AM), which reportedly requires activation by cellular processes and has a
fluorescent emission spectrum that is well separated from PI (Weaver, 1998).
Calcein-AM is a highly lipophilic vital stain, that lacks charge and thus
rapidly enters live cells where the lipophilic acetoxymethyl (AM) blocking group is
cleaved by non-specific esterases; after removal of its blocking group (AM), Calcein
produces a bright fluorescent green that is relatively insensitive to pH in the
physiologic range (Bratosin et al., 2005); it is also negatively charged and well
retained by intact cell membranes. Its excitation and emission maxima are 494 nm
and 517 nm, respectively (Haugland, 2002).
Calcein-AM is widely used as a viability assay for a variety of cell types
(Haugland, 2002), but has yet to find widespread use for analysis of mammalian
cells in STR culture, although it has been used by Isailovic et al. (2007) in
conjunction with PI to investigate cell-population heterogeneity in Spodoptera
frugiperda 21 culture grown in a 3 L STR. They describe three cell populations:
viable (Calcein-AM positive, PI negative), dead (Calcein-AM negative, PI positive)
and recently dead (Calcein-Am positive, PI positive). The latter, dual stained
population (DSP), was attributed by Isailovic (2007) to a greater uptake rate for PI
than the rate of Calcein-AM diffusion out of dead cells.
1.10.4 Mitochondrial Function Stains
If one considers the fundamental role of mitochondria and, thereby, ΔΨm in energy
generation, it should not be altogether surprising that ΔΨm can be used to monitor
metabolic integrity and assess the viability of the cell (Campbell et al., 1995; Kluck
et al., 1997; Shapiro, 2000). For example, in the early stages of apoptosis continued

Chapter 1: Literature Survey
51
energy generation preserves ΔΨm, while necrotic cells, in contrast, are reported to
exhibit early ΔΨm depreciation caused by mitochondrial membrane damage
(Darzynkiewicz et al., 1996). Fluorescent stains that reveal ΔΨm should therefore
provide a sensitive indication of cell metabolism and viability.
Fluorescent lipophilic cationic stains are ideal for measurement of ΔΨm as
they are drawn towards the highly negative membrane environment present in
functional mitochondria. If equilibrium is established with the stain then its uptake
by the mitochondria should be correlated to the potential difference across the
membrane, and cells that are suffering from some metabolic stress or damage to
their mitochondrial membrane that decreases ATP production will be observed to
have lower ΔΨm by a decrease in their stain uptake and, consequently, their
fluorescence (Shapiro, 2000).
1.10.4.1 DiOC6(3)
3,3-dihexyloxacarbocyanine iodide (DiOC6(3)) is a lipophilic cationic stain that
easily penetrates viable cells and at concentrations below 1 nm is reportedly
localised in the mitochondria. Its green fluorescence permits dual staining with red
fluorescent PI so that separation (by gating) of live and dead cells can be performed
and ΔΨm of live cells found. Its concentration in the mitochondria and therefore the
intensity of its green fluorescence has been observed to correlate with ΔΨm at
concentrations below 1 nm, above this very low concentration correlation with ΔΨm
was lost (Petit et al., 1995; Zamzami et al., 1995; Metivier et al., 1998). Loss of
correlation was attributed to the stain’s association with other cytoplasmic lipids;
evidence that supports this hypothesis was later found by Zuliani et al. (2003) when,
using fluorescent microscopy, they observed diffuse cytoplasmic fluorescence for

Chapter 1: Literature Survey
52
DiOC6(3). Salvioli et al. (1997) and Zuliani et al. (2003) found that DiOC6(3) was
considerable less efficient than JC-1 (Section 1.10.4.2) at tracking changes in ΔΨm,
and they suggest JC-1 be used in preference. Isailovic (2007) observed dual staining
with DiOC6(3) and PI, which was attributed to cytoplasmic staining of dead cells. In
this study, comparison of DiOC6(3) and JC-1 will be made, and their efficacy as
probes for ΔΨm in GS-CHO cell culture established.
1.10.4.2 JC-1
5,5’6,6’-tetrachloro-1,1’3,3’-tetraethylbenzimidazolcarbocyanine iodide (JC-1) is
also a lipophilic cationic stain that easily penetrates the intact cell membrane and
exhibits ΔΨm dependent accumulation in the mitochondria, but it should not create a
false indication of ΔΨm even when cytoplasmic binding occurs: a colour change
from green (525 nm) to red (590 nm) that is caused by the aggregation of the stain
monomer at highly localised concentrations that occur only in mitochondria
eliminates fluorescence contribution from cytoplasmic membrane binding. Indeed,
staining of the cell with the green fluorescent monomer is expected and convenient,
because it is the ratio of green to red fluorescence that indicates ΔΨm. Using the
ratio of two colours should effectively exclude the effect of factors, such as
mitochondrial size, shape and density, that can influence fluorescent measures of
ΔΨm reliant solely on the stain’s intensity (Cossarizza et al., 1993; Cossarizza et al.,
1994). Zuliani et al. (2003) observed using fluorescent microscopy that cells stained
with JC-1 have a bright green stained cytoplasm that contains distinctive red
mitochondria. Furthermore, JC-1 has been used successfully to monitor changes in
ΔΨm caused by mitochondrial depolarisation and apoptosis inducing agents
(Salvioli et al., 1997; Zuliani et al., 2003). Both JC-1 and DiOC6(3) facilitate
Chapter 1: Literature Survey
53
characterisation of mitochondrial activity by their correlation with ΔΨm, and this is
a useful measure that can be used to infer the mitochondrial integrity and respiratory
activity, but it does not provide a direct measure of respiration – for this CM-
H2XRos was used in this study (Section 1.10.4.3).
1.10.4.3 Mitotracker Red CM-H2XRos
Cellular respiration by oxidative phosphorylation in the mitochondria generates
reactive oxidative species (ROS) (Batandier et al., 2002); and their concentration is a
strong indicator of mitochondrial function. Indeed, several studies have reported that
the amount of ROS in healthy cells roughly correlate with activity of respiration
(Poot et al., 1996; Poot and Pierce, 1999b; Degli Esposti, 2002); this is corroborated
by research showing that when ΔΨm is lost production of ROS drops considerably
(Loschen et al., 1971; Chance et al., 1979; Korshunov et al., 1997).
Measurements of ROS have been reported using (8-(4’-chloromethyl)
phenyl-2, 3, 5, 6, 11, 12, 14, 15-octahydro-1H, 4H, 10H, 13H-diquinolizino-8H-
xanthene) (CM-H2XRos for short). CM-H2XRos has no charge or fluorescence when
it enters the cell, and only when it is oxidised within the cell by one or more reactive
oxidative species generated during mitochondrial respiration does it reveal a positive
charge and a red fluorescence that is sensitive to local oxidative activity. Owing to
its positive charge the oxidised form is sequestered by the mitochondria where it
binds to mitochondrial proteins, its red fluorescence can then be used to monitor the
degree of oxidative activity. Poot and Pierce (1999a) and Haugland (2002) used
antimycin A inhibition of electron flux to show the correlation between CM-H2XRos
and oxidative turnover, or ‘respirative activity’, in viable cells. They also observed
that CM-H2XRos fluorescence, and thus respirative activity, was unaltered during

Chapter 1: Literature Survey
54
the early stages of camptothecin induced apoptosis; in late-stage apoptotic cells loss
of CM-H2XRos fluorescence indicated that respiration had ceased. In an earlier
study (Poot et al., 1996), depressed CM-H2XRos fluorescence was observed when
respiration was inhibited with rotenone and antimycin A. These studies provide
convincing evidence that there exists a strong correlation between CM-H2XRos
fluorescence and cellular respiration. Nevertheless, Isailovic (2007) observed a poor
correlation to respiratory activity in SF-21 STR culture, which was attributed to
oxidation of the stain during storage. This stain has not yet been used to monitor
mitochondrial function of mammalian cells exposed to the particular stresses of
culture in a STR.
1.10.5 Apoptosis Indicator Stain
1.10.5.1 Annexin-V/PE used in conjunction with Sytox Green.
In viable mammalian cells, the phospholipid phosphatidylserine (PS) is normally
located on the cytosolic facing side of the cytoplasmic membrane; during apoptosis
it translocates to face the cell exterior (Fadok et al., 1992; Koopman et al., 1994). It
is not observed to translocate during necrosis (Darzynkiewicz et al., 1996). PS can
be bound by the vascular anticoagulant α (VACα,), referred to as Annexin V (AV),
which was found to preferentially bind to negatively charged phosphlipids such as
PS (Andree et al., 1990).
Simply by dual staining with AV conjugated to fluorescein isothiocyanate
(FITC), referred to here as AV-FITC, and the non-vital stain PI (AV-FITC/PI).
Vermes et al. (1995) and Ishaque and Al-Rubeai (1998) revealed three distinct sub-
populations using the dual stain on a FC: non-apoptotic cells (AV-FITC negative, PI
Chapter 1: Literature Survey
55
negative), apoptotic cells (AV-FITC positive, PI negative), late apoptotic and/or
necrotic cells (AV-FITC positive, PI positive). Note that this result would be entirely
applicable were SG used instead of PI and PE used instead of FITC, as in this study,
since the action of these stains is equivalent. Indeed, Koopman et al. (1994)
conducted their study using EB instead of PI, with the same result as specified
above. It is important to note that the above studies established that necrotic cells
could also be stained with AV (probably because of severe membrane
disintegration) and, without dual staining with PI can be misclassified as apoptotic.
Studies in the literature using the AV assay have reported PS translocation at
some point en-route to cell death by apoptosis in a variety of cell types; for example,
human lymphocytes (Castedo et al., 1996) murine hybridoma (TB/C3) (Ishaque and
Al-Rubeai, 1998) and HSB2-2 human leukaemia cells (Vermes et al., 1995),
although there remains some contention surrounding the timing of PS translocation
(Ishaque, 2000). Furthermore, the notable absence of PS translocation in cells over
expressing apoptosis inhibitors, bcl-2 and abl, corroborates those studies that
reported PS translocation as a fundamental characteristic of apoptotic cell death
(Martin et al., 1995). However, Frey (1997) contends that AV does not reveal
apoptosis in some cell lines (Raji, U937 and HL-60), perhaps because of differences
in lipid composition of the cytoplasmic membrane.

56
Chapter 2: Materials and Methods
2.1 Cell Line
This research project used a suspension variant (SV) of the CHO-K1 cell line
(CHOK1SV), pre-adapted to suspended growth in chemically defined medium and
transfected for GS gene expression, GS-CHO (Section 1.3). Glutamine synthetase
Chinese hamster ovary (GS-CHO) is a recombinant cell line using the glutamine
synthetase expression system that is proprietary to Lonza Biologics (Lonza). The
GS-CHO cell line used in this study has been engineered to produce an IgG antibody
for therapeutic purposes.
2.2 Cell Culture Maintenance
GS-CHO cells were grown as a suspension culture in polycarbonate Erlenmeyer
shake flasks with vented lids (Corning Incorporated, USA). Cells were grown in the
defined proprietary medium formulation CDCHO (Sigma-Aldrich, UK). An
incubator (LC12 –LEEC, UK) was used to maintain culture conditions at 36.5oC and
5% CO2, agitation of the flasks at a rate of 130 revolutions per minute (rpm) was
made by an orbital shaker (Denley Instruments, UK) placed onto a shelf of the
incubator. Flask volumes were progressively increased from 125 mL to 250 mL, 500
mL, 2 L containing a medium volume equal to one fifth of the flask volume; this
stepwise escalation in volume provided the necessary viable cell number (VCN) for
inoculation of the 3 L STR. The initial inoculum-flask was inoculated to 3 x 10⁵
cells mL-1; subsequent flasks were inoculated with sufficient volume to ensure
between 2 x 10⁵ and 3 x 10⁵ cells mL-1.

Chapter 2: Materials and Methods
57
Flask passages were made during the middle of the rapid growth phase after either 3
or 4 days of growth in the incubator. Thus, the 125 mL was passaged after 4 days,
the 250 mL flask after 3 days, the 500 mL after 4 days and after 3 days the 2 L was
used to inoculate the 3 L STR. To ensure consistency and that the passage number
was constant for each experiment, a fresh vial was revived from the frozen working
cell bank for each inoculum chain. This cell bank was sufficient to inoculate all of
the experiments of this study. All cell work was conducted in a laminar flow class II
safety cabinet (ICN Gelaire BSB3-SS – ICN Biomedicals, UK).
2.3 Cell Banking
Cells in their rapid growth phase (Figure 3-8) with a viability of more than 95%
were centrifuged (MSE Mistral 2000) in 50 mL centrifuge tubes at 179 g for 5
minutes. Supernatant was discarded, leaving the cell pellet, which was resuspended
to a concentration of 1.5 x 10⁷ cells mL-1. A mixture of 90% fresh medium and 10%
dimethyl sulfoxide (DMSO), percentage volume/volume (v/v), both at room
temperature, was used for re-suspension.
The cell-suspension was aliquoted to 1 mL in each 1.5 mL cryovial (Nunc –
Gibco, UK). A ‘Mr Frosty’ freezing container (Nalgene, Sigma Aldrich, UK) with
an external jacket containing isopropyl alcohol was used to control the rate of
freezing of the cryovials in a -80oC freezer over 24 hours (h), after which cells were
immediately transferred to liquid nitrogen at a temperature of about -190oC. To
maximise cell viability, the transfer of cells from the incubator to the -80oC freezer
was completed within 1 h.

Chapter 2: Materials and Methods
58
2.4 Revival of Cells from Cell Bank
No more than two cryovials were removed from liquid nitrogen at a time. On
removal, vials were placed in a 36.5oC water bath to be thawed. Immediately upon
cells’ thawing, vials were sprayed with ethanol and placed into the laminar flow
cabinet. The entire contents of the vial were then transferred into 25 mL of CDCHO
medium at 36.5oC in a 125 mL shake flask. Inoculated flasks placed were placed
into the incubator and maintained as described (Section 2.2).
2.5 Shake Flask Study
Shake flask studies were made in 2 L shake flasks in an incubator maintained at
36.5oC, 5% CO2 and 130 rpm, as detailed (Section 2.2).
2.5.1 CCCP Induced Cell Death Shake Flask Study
Carbonyl cyanide m-chlorophenyl hydrazone (CCCP) at a concentration of 1 mM in
dimethylsulphoxide (DMSO) was added to a final concentration of 100 µM to
cultures in mid-rapid growth phase (~7 x 10⁵ cells mL-1), growing in 250 mL of
CDCHO in 1 L vented lid Erlenmeyer flasks. After addition of CCCP, flasks were
rapidly returned to the shaker-incubator and incubated at 36.5oC for 12 h. At the end
of the incubation period cell physiology was assessed using flow cytometry (FC),
dual staining with the following stain couplets: Calcein-AM/PI; AV-PE/SG and
DiOC6(3)/PI.
Single staining was made with JC-1, as its dual emission spectrum
complicated dual staining. Single staining was made with CM-H2XRos because it
was necessary to fix the staining of the cell with paraformaldehyde, which alters cell
Chapter 2: Materials and Methods
59
properties for measurement with other stains. Staining methods are detailed (Section
2.11).
2.6 Fed-batch Study
Fed-batch growth took place in a 5 L stirred tank reactor, STR, (Applikon, UK) with
a 3 L working volume. STR vessels were glass with rounded bottoms. A single
marine (axial flow) impeller was mounted on the shaft; the ratio of the impeller
diameter (D) to the vessel diameter (T) was D/T = 1/3. The ratio of the height of the
STR culture (H) to the vessel diameter was H/T = 6/5 and the ratio of the distance of
the impeller from the vessel bottom (C) to the height of the STR culture was C/H =
1/6. The STR was controlled by a BioController ADI 1030 (Applikon, UK) to
conditions set on a BioConsole ADI 1035. Bicarbonate buffer and CO2 sparging
were used to increase or decrease pH, respectively, as necessary for maintenance of
pH control within set limits. The buffer had a pH of 9.7 at 21oC.
Feeding of the STR began when either the viable cell number (VCN) had
reached 1 x 10⁶ (measured by Trypan Blue, TB, exclusion) or after day 4 from
inoculation of the STR, whichever occurred first. Feeding rate was adjusted after
each sample (~ every 24 h) on the basis of specific growth rate, µ, so that cell growth
could be predicted for the next 24 h and glucose controlled at 4.5 1.5 g L-1. The
substrate had a pH of 2.5 at 21oC.
DOT was controlled at a set % of saturation with air (% saturation). pH and
DOT were measured using steam-sterilisable probes (Applisens - Applikon, UK).
Sparged gas entered the STR via a sparge-pipe, which released the gas underneath
the impeller through holes facing the bottom of the STR. The impeller agitation rate
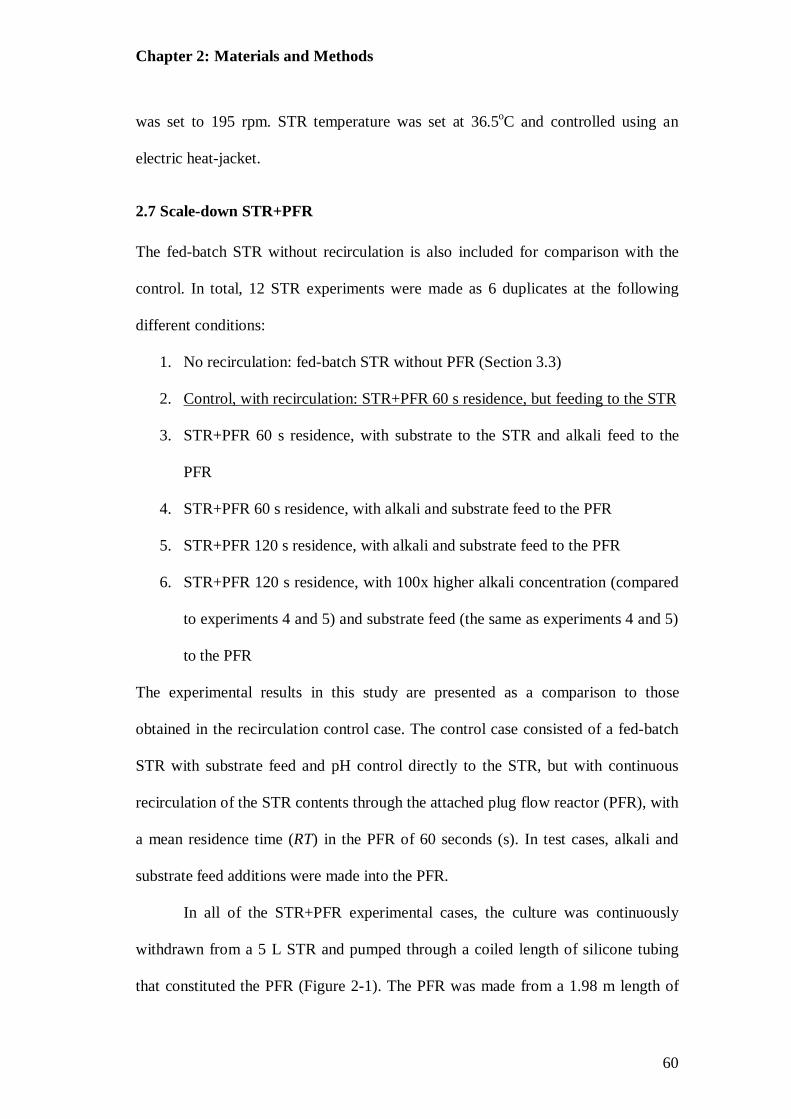
Chapter 2: Materials and Methods
60
was set to 195 rpm. STR temperature was set at 36.5oC and controlled using an
electric heat-jacket.
2.7 Scale-down STR+PFR
The fed-batch STR without recirculation is also included for comparison with the
control. In total, 12 STR experiments were made as 6 duplicates at the following
different conditions:
1. No recirculation: fed-batch STR without PFR (Section 3.3)
2. Control, with recirculation: STR+PFR 60 s residence, but feeding to the STR
3. STR+PFR 60 s residence, with substrate to the STR and alkali feed to the
PFR
4. STR+PFR 60 s residence, with alkali and substrate feed to the PFR
5. STR+PFR 120 s residence, with alkali and substrate feed to the PFR
6. STR+PFR 120 s residence, with 100x higher alkali concentration (compared
to experiments 4 and 5) and substrate feed (the same as experiments 4 and 5)
to the PFR
The experimental results in this study are presented as a comparison to those
obtained in the recirculation control case. The control case consisted of a fed-batch
STR with substrate feed and pH control directly to the STR, but with continuous
recirculation of the STR contents through the attached plug flow reactor (PFR), with
a mean residence time (RT) in the PFR of 60 seconds (s). In test cases, alkali and
substrate feed additions were made into the PFR.
In all of the STR+PFR experimental cases, the culture was continuously
withdrawn from a 5 L STR and pumped through a coiled length of silicone tubing
that constituted the PFR (Figure 2-1). The PFR was made from a 1.98 m length of

Chapter 2: Materials and Methods
61
9.8 mm internal diameter and 1.6 mm wall thickness platinum cured silicone tubing
(SLS, UK). A new length of tubing was used for each experiment.
The PFR was coupled to the STR by two sets of tubing: a 15 cm length of
3.2 mm internal diameter silicon tubing connected to a 20 cm length of 3.2 mm
internal diameter neoprene tubing (SLS, UK) that was fed through the peristaltic
pump. Neoprene tubing was used in the pump-head because its resilience allowed
continuous peristaltic pumping without tube damage - silicone tubing was found to
wear within 24 hours (h). A further 10 cm length of 3.2 mm internal diameter tubing
was bisected by a feeding point and connection to the beginning of the 1.98 m length
that constituted the PFR tubing. The feeding point was forked to allow addition of
bicarbonate buffer and nutrient feed. The total volume of the tubing after this
feeding point was 150 mL, 5% of the 3 L working volume of the 5 L STR, as used
by Namdev and Thompson (1992) and Amanullah et al. (2001).
A 15 cm length of 3.2 mm internal diameter and wall thickness tubing
connected the end of the PFR back to the STR head-plate. The total volume of
connection tubing before the entrance to the PFR, marked by the point from which
alkali and substrate additions were made, was ~5% of the PFR volume, an additional
3 s on top of the 60 s PFR residence.
The mean residence time (RT) within the PFR was controlled by the
pumping rate provided by a peristaltic pump (Watson Marlow 505 S – Watson
Marlow Pumps Group, UK). The PFR was submerged in a water-bath controlled at
36.5oC to prevent the contents of the PFR dropping below 36.5oC, as it was
important to ensure temperature gradients were not present.

Chapter 2: Materials and Methods
62
The pump was calibrated using the PFR and connection tubing under the
conditions of the model, with a gas liquid mixture entering the PFR. The RT in the
PFR was controlled by the pumping rate to 60 s or 120 s; these are the approximate
expected range of mixing times, θm, in a 20 m3 STR (Table 1-2). A photograph of
the scale-down equipment used in this study is provided (Figure 2-2).
2.7.1 Control Study
For the duration of the stirred tank reactor connected to the plug flow reactor,
(STR+PFR) control experimental case, alkali and substrate feed additions were
made directly to the STR in the same manner detailed for the fed-batch experimental
case that was without recirculation through the PFR (Section 2.6). The mean
residence time (RT) in the PFR was 60 s. In this recirculation control case, no
additions were made to the PFR; i.e., all additions were made to the STR.
2.7.2 pH gradients
To study the effect of pH gradients alone, alkali additions for control of pH, as
detailed (Section 2.6), were made to the PFR, while nutrient feed (substrate addition)
was made to the STR only. Residence time (RT) in the PFR was 60 s.
Chapter 2: Materials and Methods
63
Figure 2-1: Scale-down, showing the 5 L (3 L working volume) stirred tank reactor (STR) connected to the 150 mL plug flow reactor (PFR), referred to as STR+PFR; thus the PFR (and attendant connective tubing, after the point of feed addition) had 5% of the STR working volume. The PFR was made using a platinum cured silicone with following dimensions: 1.98 m length, internal diameter 9.8 mm, external diameter 11.4 mm (Section 2.7).
STR 3 L
PFR – 150 mL

Chapter 2: Materials and Methods
64
Figure 2-2: Scale-down set up, showing the stirred tank reactor (STR) connected to the plug flow reactor (PFR), referred to as (STR+PFR), with the PFR in a water bath at 36.5oC. The PFR was raised slightly out of the water bath so it could be located in this figure; during the experiments, the PFR was entirely submerged.
Controller Water bath 36.5oC
STR
Peristaltic Pump
PFR
Chapter 2: Materials and Methods
65
2.7.3 pH and Nutrient gradients
Two pH and nutrient gradient scale-down studies were conducted:
1. To study the combined effect of expected pH and nutrient gradients created
in a large-scale STR’s feed-zone, alkali and nutrient addition (referred to as substrate
feed) for control of pH and glucose concentration were made to the PFR (Section
2.6). For scale-down test experimental cases, no additions were made directly to the
STR and all additions were made to the PFR. Over separate experiments, RT in the
PFR was set at 60 s and 120 s.
2. Often a higher alkali concentration is used at the large-scale to decrease
volumes and associated costs; for this reason, a second pH and nutrient gradient
study was also conducted with 2 M Na2CO3, which is 100x more concentrated that
the alkali used for all other experimental cases, (pH of 12.3 at 21oC). As in the first
study above, the alkali was added with the substrate as necessary for control. RT in
the PFR was set at 120 s; this represented the ‘worst case scenario’ for creation of
addition zone (Section 1.5) associated heterogeneity in a 20 m3 STR.
2.8 STR Setup
After each experiment, pH and O2 probes were checked and calibrated before their
return to the STR. Before beginning a run, sterile medium in the STR, agitated at
195 rpm, was heated to 36.5oC, a sample was taken, its pH was measured with an
offline pH meter (SevenEasy™ - Mettler Toledo, UK) and the calibration of the
STR’s pH-probe was corrected, if off line pH differed from online pH by ± 0.02.
The STR was then set to the control pH at the setpoint (Section 2.6). When the
desired pH was attained, the O2-probe was again calibrated and O2 control was
initiated. Sparging rates were restricted (Section 2.6) to minimise damage from

Chapter 2: Materials and Methods
66
bubble bursting and to dampen control responses. The STR was inoculated only
after control values had been reached and maintained for at least 1 h, ideally, 24 h.
With a regularity of at least every 24 h, a sample was taken from the STR and pH
was checked offline and corrected as necessary.
2.8.1 Water Bath for Constant PFR Temperature
A 5 L water bath (Fisherbrand – Fisher Scientific, UK) was used to maintain the
PFR at 36.5oC. The water bath was filled to the brim with approximately 5 L of
deionised water (dH2O) and covered with floating balls to minimise evaporation.
The temperature was verified with a mercury thermometer that remained in the bath.
To maintain sterility, 200 g of CoSO4 (Sigma Aldrich, UK) and 100 g of
ethylenediaminetetraacetic acid (EDTA) were added, as well as water bath detergent
(SigmaClean™ water bath treatment – Sigma Aldrich, UK), as recommended by the
manufacturer. The water bath was placed beside the STR so that the PFR could be
effectively submerged.
2.9 STR Cleaning Protocol
Scrupulous cleaning of the STR was required to prevent the build-up of deleterious
material such as metabolic by-products, cell debris, DNA, and proteases, glycol and
proteins.
At the end of each experiment, the STR was steam sterilised at 121oC. After
sterilisation, the contents of the STR were disposed of and the pH and O2 probes
removed and carefully cleaned with dH2O. Sodium hydroxide (NaOH) at a
concentration of 1 M was made using dH2O that was dispensed into the STR
through one of the probe ports up to the impeller connection with the drive-shaft.
Chapter 2: Materials and Methods
67
To prevent damage to the drive shaft’s bearings, cleaning solutions were kept
below the small openings in the drive shaft. The impeller was then set to 200 rpm
and the STR heated to 50oC for a minimum of 12 h.
Following treatment with NaOH, the STR was emptied and cleaned with
dH2O. The ostensibly clean STR was then filled with 0.5 M citric acid, made using
dH2O, and for a minimum of 12 h it was agitated at 200 rpm at a temperature of
50oC. The STR was then emptied and again cleaned with dH2O. The head-plate of
the STR was then dismantled, the rubber washers were carefully removed and
placed in dH2O, and the dismantled head-plate was placed into 0.5 M citric acid and
left for a minimum of 12 h. The head-plate and ports were then washed thoroughly
in dH2O to remove every trace of acid. The STR was then put back together; latex
gloves wear worn during this procedure to minimise contamination. 50 mL of dH2O
was poured into the STR and it was then sealed, connected with the relevant tubing
for control and steam sterilised at 121oC.
2.10 Haemocytometry
Viable cell number (VCN) was determined with a haemocytometer (HC) (Neubauer
improved, 0.1 mm depth chamber) and Trypan Blue (TB) exclusion. If necessary,
cells were diluted with phosphate buffer solution (PBS) at pH 7.4 (Biotechnology
performance certified - Sigma Aldrich, UK) to ensure a concentration of less than l x
106 cells mL-1; they were then stained with TB (0.5%) at a 1:1 dilution. Dead cells
took up the stain and appeared blue when observed at 20x magnification on a
standard light microscope (OLYMPUS, Japan). Cells from four grids per slide were
counted twice and the VCN calculated based on a single grid volume of 10-4 mL.
The following equation was used to calculate the total cell number, TCN:

Chapter 2: Materials and Methods
68
4 14 2 104
Cells in squaresTCN dilution factor cells mL 2-1
From this TCN, VCN is found by counting unstained cells and dead cell number
(DCN), by counting stained cells.
2.11 Flow Cytometry
2.11.1 The Instrument
Flow cytometric (FC) analysis was made using a Coulter Epics Elite Analyser
(Beckman Coulter, UK) using a 15 milliwatt (mW) argon-ion laser at a wavelength
of 488 nanometres (nm). Laser light scattered at small angles (0.5o-5o) from the
incident beam, forward scatter light (FS), traversed a standard cross beam mask and
neutral filter before arriving at the FS detector, a photodiode. Light scattered at large
angles (15o-150o) to the incident, side scatter light (SS), was collected in a simple
collection lens, producing a collimated beam that first passed through a 488 nm band
pass filter reflecting light to the first photomultiplier tube (PMT1), where it was
converted into an electronically amplified signal. The remaining higher wavelength
light was separated for amplification by a series of long pass filters of wavelengths
525 nm (green light region), 575 nm (orange light region) and 635 nm (red light
region) that reflected light in to PMT2, PMT3 and PMT4, respectively.
EXPO™ 32 ADC Software for Coulter®, operating on the Windows 98 ™,
system was used for collection and presentation of the data produced by the FC. Off-
line data analysis was made using WIN MDI 2.9, which was free to download from
http://en.bio-soft.net/other/WinMDI.html.

Chapter 2: Materials and Methods
69
2.11.2 Cleaning Procedure
To prevent debris from accumulating, the flow cell was cleaned at the beginning and
end of analysis sessions. Cleaning was performed by running through the system’s
tubing full test tubes of 70% ethanol, 10-fold diluted bleach and COULTER
CLENZ® (Beckman Coulter, UK). A lens tissue was used to apply ethanol for
cleaning the exterior of the flow cell, lenses used to collect FS and SS, and beam
shaper lenses; light collection filters were cleaned using a dry lens tissue.
2.11.3 Alignment of Fluidics and Optics
Having cleared the flow chamber of debris, the quality of results is dependent on the
accuracy of the flow chamber’s alignment with the laser beam. The laser beam’s
focus must be the centre of a stream of cells flowing through the chamber,
illuminating whole cells as they pass through the excitation beam; further, the flow
chamber must be positioned so that SS is received by the photo-multiplier tubes
(PMT).
Alignment was made using fluorescent polystyrene beads (FLOW-
CHECK™ fluorospheres - Beckman Coulter, UK) of uniform fluorescence and size
(diameter 10 µm) at a concentration of 1 x 10⁶ beads mL-1 in an aqueous suspension
medium containing surfactants and preservatives. When excited by a 488 nm laser
the fluorospheres fluoresced at 525-700 nm. The bead solution was run through the
flow chamber at a data-rate of 40-50 events per second during acquisition of 10000
gated events.
Following the recommendations of Beckman Coulter, alignment was
established when the half-peak coefficient of variance (1/2 %CV) on the normal
distribution of fluorescence was between 0.8 and 1.5. The percentage coefficient of

Chapter 2: Materials and Methods
70
variation (%CV) is a common measure of the spread of a distribution, found by the
following equation:
%CV = standard deviation / mean channel width x 100 2-2
2.11.4 Ratiometric Cell Count
Using a fluorescent bead (fluorospheres) solution containing 1 x 10⁶ beads mL-1
allowed a simple ratiometric count to find the total cell number (TCN) by using the
percentage of cells that are found in quadrant 1 (Q1), % cells, and the percentage
fluorospheres that are found in quadrant 4 (Q4), % fluorospheres, (Figure 2-3):
6 -1% 10%
cellsTCN cells mLfluorospheres
2-3
To 600 µL of PBS at pH 7.4 (Biotechnology performance certified, Sigma Aldrich,
UK) 25 µL of fluorospheres and 25 µL of the cell sample were added. After
agitation, to ensure homogeneity, the mixture was analysed on the FC. The region of
interest was defined by ‘gating’ on the forward scatter light v side scatter light, FS-
SS, cytograph, excluding debris and electronic noise from the information before its
further analysis. Gated information was viewed on a green fluorescence v red
fluorescence, GF-RF, cytograph.
The percentage of cells and fluorospheres was defined using a quadrant to
separate the two populations (Figure 2-3). Note: cell numbers are presented as 1 x
105 cells mL-1 throughout the results of this study, not at 1 x 10⁶ cells mL-1, which
was used for the above calculation (Equation 2-3) because the concentration of
fluorescent beads was 1 x 10⁶ mL-1.

Chapter 2: Materials and Methods
71
2.11.5 Viability Assessment
Dual staining with Calcein-AM (Molecular Probes, UK) and PI (Molecular Probes,
UK) was used as a viability assay (Calcein-AM/PI). PI was prepared to a
concentration of 150 µmolar (µM) in PBS (pH = 7.4), and Calcein-AM to 50 µM in
DMSO. Cell culture samples to be stained were diluted in PBS at 36.5oC to a
concentration of 1 x 10⁶ cells mL-1. A 1 mL aliquot of the cell dilution was used for
each analysis. To each 1 mL, 25 µL of PI and 1 µL of Calcein-AM were added,
giving concentrations of 3.7 µM and 50 nanomolars (nM), respectively. Immediately
after addition of the fluorescent stains, samples were placed in an incubator at
36.5oC in an atmosphere of 5% CO2 for 15 minutes. Incubated samples were
immediately placed in a melting ice bath, ready for analysis on the FC.
Calcein-AM is a recent improvement on fluorescein diacetate (FDA), which
is an established viability counter-stain for PI (Szabo et al., 1982; Sugita et al., 1986;
Ross et al., 1989; Cocomartin et al., 1992). Calcein-AM was used in preference to
FDA because it has a brighter green fluorescence (GF) and better cell retention
(Barda-Saad et al., 1997; King, 2000). Calcein-AM has been shown to stain CHO
cells effectively for viability assessment (Wang et al., 2008).
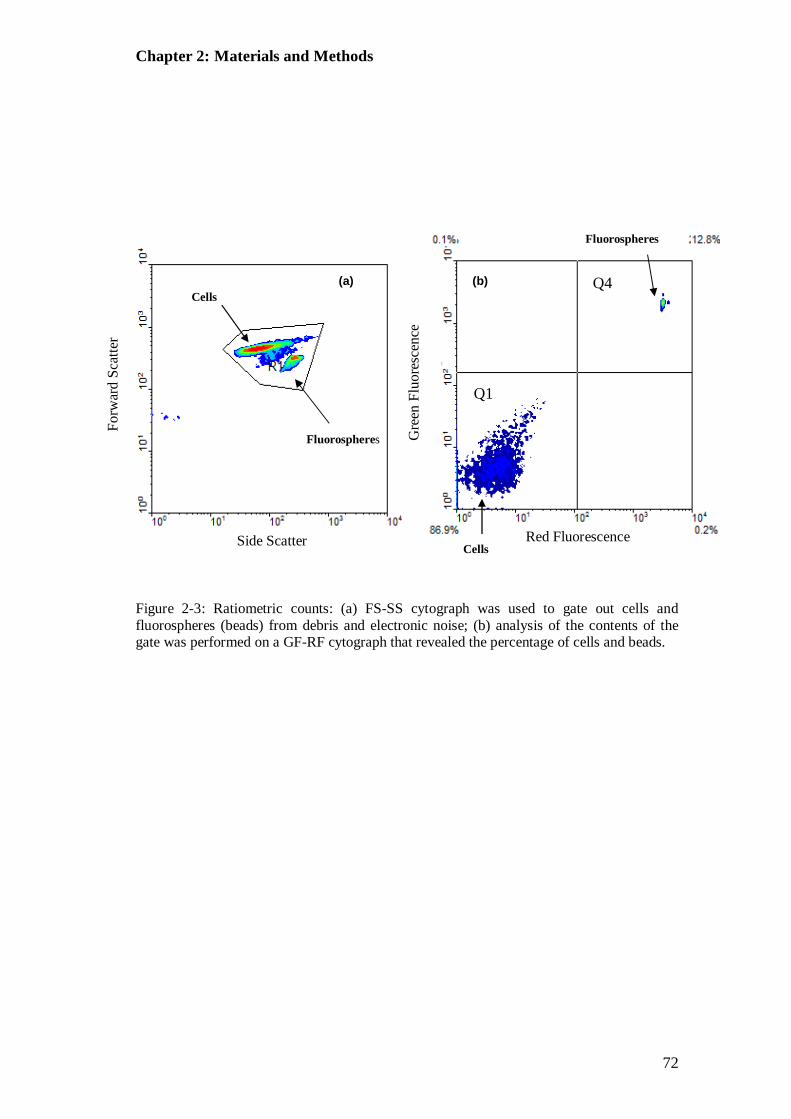
Chapter 2: Materials and Methods
72
Figure 2-3: Ratiometric counts: (a) FS-SS cytograph was used to gate out cells and fluorospheres (beads) from debris and electronic noise; (b) analysis of the contents of the gate was performed on a GF-RF cytograph that revealed the percentage of cells and beads.
Side Scatter
Forw
ard
Scat
ter
Cells
Fluorospheres
Red Fluorescence Cells
Fluorospheres
Gre
en F
luor
esce
nce
(a) (b)
Q1
Q4

Chapter 2: Materials and Methods
73
2.11.6 Mode of Cell-Death Assessment
Staining with Sytox Green (SG) and Annexin V (AV), conjugated to R-
phycoerythrin (PE) to give (AV-PE), all provided as a kit from Molecular Probes,
UK. The dual stain is referred to as AV-PE/SG. Cell culture samples to be stained
and analysed on the FC were diluted in PBS at 36.5oC to a concentration of 1 x 10⁶
cells mL-1. For each sample analysis, a 1 mL aliquot of the cell dilution was
required. These were first centrifuged at 179 g for 5 minutes and resuspended in 1
mL of PBS at 36.5oC before being centrifuged again (179 g for 5 minutes) and
resuspended in 100 µL of binding buffer solution (10 mM Hepes/NaOH, pH 7.4,
150mM KCl, 1mM MgCl2 and 1.8 mM CaCl2 from Molecular Probes, UK), only
then was AV-PE added to each to give a final concentration of 1 µg mL-1. Samples
were then incubated at 36.5oC and 5% CO2 for 15 minutes. SG to a final
concentration of 0.01 µM was then added to incubated samples that were
immediately placed in a melting ice bath, ready for analysis on the FC.
2.11.7 Evaluation of Mitochondrial Activity and Membrane Potential
Mitochondrial membrane potential (ΔΨm) and activity were assayed using the
following three molecular probes: 5,5’, 6,6’-tetrochloro-1,1,’3,3’–
tetraethylbenzimidazolcarbocyanine iodide (JC-1), 3,3’-dihexyloxacarboncyanine
iodide (DiOC6(3)) and CM-H2XRos (Molecular Probes, UK). JC-1 was prepared at a
concentration of 1000 µM, DiOC6 (3) to 0.9 µM and Mitotracker red, 50 µM. All
three mitochondrial stain concentrates were made using high-grade DMSO (Sigma-
Aldrich, UK). Cell culture samples to be stained and analysed on the FC were
diluted in PBS at 36.5oC to a concentration of less than or equal to 1 x 10⁶ cells mL-
1. For each sample analysis, stain was added to a 1 mL aliquot of the culture sample.

Chapter 2: Materials and Methods
74
JC-1 staining began with the addition of 1 µL of JC-1 concentrate to the 1
mL culture sample to give a final concentration of JC-1 of 1 µM. After addition of
the stain, samples were incubated at 36.5oC in an atmosphere of 5% CO2 for 15
minutes. Incubated samples were immediately placed in a melting ice bath, ready for
analysis on the FC.
DiOC6(3) was used with PI (DiOC6(3)/PI); staining began with the addition
of 1 µL of DiOC6(3) concentrate to the 1 mL culture sample to give a final
concentration of 0.9 nM. After addition of the stain, samples were incubated at
36.5oC and 5% CO2 for 15 minutes. Incubated samples were immediately stained
with 25 µL of PI, as for viability assessment (Section 2.11.5), and placed in a
melting-ice bath, ready for analysis on the FC.
CM-H2XRos staining began with the addition of 10 µL of CM-H2XRos to
the 1 mL culture sample to give a final concentration of 500 nM. After addition of
the stain, samples were incubated at 36.5oC and 5% CO2 for 15 minutes. Incubated
samples were centrifuged at 500 g for 10 minutes, re-suspended in a 4%
paraformaldehyde solution at 4oC and then stored at 4oC; this process fixed the stain.
Before FC analysis, the samples were centrifuged at 179 g for five minutes and re-
suspended in 1 mL of PBS at 4oC.
2.11.8 Flow Cytometric Analysis: Gating on Unstained Control
Cells as whole entities were first gated out in their FS-SS cytograph and transferred
to the GF-RF cytographs. The quadrant gate in the GF-RF cytographs was set in
such a way that control unstained cells appeared in the bottom left quadrant (Figure
2-3).

Chapter 2: Materials and Methods
75
2.12 Nutrient and By-Product Analysis
Culture samples were centrifuged at 179 g for 10 minutes and the supernatant stored
in 1.5 mL sample vial (Eppendorf, UK) at -80oC. For analysis, the samples were
thawed at room temperature and run through a Bioprofile 300B analyser (Nova
Biomedical, USA) according to the manufacturer’s protocols. The analysis included
quantification of glucose, lactate, ammonia (NH3), sodium ion (Na+), potassium ion
(K+) and osmolality.
2.13 Antibody Quantification
Culture samples were centrifuged at 179 g for 10 minutes and the supernatant stored
in 1.5 mL sample vials (Eppendorf, UK) at -80oC until they were thawed for
analysis. Volumetric product yield was quantified based on the absorption and
elution of the mAb to and from a high-pressure liquid chromatography (HPLC)
protein A column. mAb in the supernatant selectively bound to a protein A affinity
column (PA ImmunoDetection® sensor cartridge; Applied Biosystems, UK) in an
Agilent HPLC Series 1200 series HPLC (Agilent, UK); non-bound material was
washed from the column and bound product eluted by changing pH from 7.2 to 2.0.
For quantification, UV (280 nm) was used by the Agilent HPLC to monitor the
elution of the mAb against a matched IgG standard.
2.14 Antibody Characterization
The following four methods were used to assess the effects of the heterogeneity that
was introduced by the scale-down on product (mAb) consistency: mass analysis
using sodium dodecyl sulphate-polyacrylamide gel electrophoresis (SDS PAGE);
highly accurate mass analysis by mass spectrometry using liquid chromatography

Chapter 2: Materials and Methods
76
(LC) followed by electrospray ionisation (ESI) coupled to a quadrapole time-of-
flight (TOF) mass analyser, referred to as ESI-Q-TOF; charge analysis using
isoelectric focusing (IEF); glycoform profiling using normal phase high-pressure
liquid chromatography (NP-HPLC) using 2-aminobenzamide (2-AB) as the
fluorescent tag, referred to as NP-HPLC 2-AB. This suite of antibody
characterisation methods provided a comprehensive analysis of antibody quality.
2.14.1 Reducing and Non-Reducing SDS Page: Protein Molecular Weight
SDS PAGE is typically used to reveal mass heterogeneity, and is a sensitive
technique for detection of protein aggregation (Jiskoot et al., 1990; Kroon et al.,
1992; Lin et al., 2000); reduced SDS PAGE removes disulphide bonds and can
therefore be used to determine if they are responsible for aggregation (Liu et al.,
2005).
Purified harvest samples (taken at the final time point from each STR
experiment, referred to as harvest) were loaded onto precast NuPAGE™ 4-12%
BisTris 12 well polyacrylamide gels (Invitrogen, UK). Two separate analyses were
performed: non-reduced and reduced. Reduced samples were heated to 95oC in the
presence of a reducing agent (Invitrogen, UK); non-reduced samples were heated
without the reagent. Proteins were visualized using Coomassie Blue staining to
determine antibody purity. Purity is defined as the percentage intact IgG for non-
reducing gels and sum of the percentages for the heavy and light chain for reducing
gels.

Chapter 2: Materials and Methods
77
2.14.2 Mass Spectroscopy: Peptide Mapping and Antibody Mass
Mass spectroscopy is the most accurate method for mass analysis (Liu et al., 2008)
and is capable of revealing significant chemical modifications; the ESI-Q-TOF used
for analysis in this study has a reported mass accuracy of 100 parts per million
(ppm) (Zhang et al., 2009). Mass spectroscopy here provided a conformation of the
protein’s elemental composition, the nature of major modifications and major
glycoforms, but it can not readily identify small mass changes such as oxidation
(+16 Da) or dehydration (-18 Da), and is certainly unable to identify deamidation
(+1 Da) (Zhang et al., 2009). Small mass changes, such as these, alter the protein’s
charge and should have been indentified by IEF.
Purified harvest samples were dialysed for 18 h against 0.1 M ammonium
bicarbonate (NH4HCO3) at room temperature in Slide-A-Lyzer 3.5 kDa MWCO
(molecular weight cut off) dialysis cassettes (Pierce, USA). After buffer exchange,
100 µg of each sample was concentrated to dryness in a centrifugal vacuum
concentrator (miVac DNA, GeneVac, UK). 100 µg of each sample was then
dissolved in 50 µL of 0.35 M Tris, pH 8.6 containing 8 M Urea and 4 mM EDTA,
providing a 2 mg mL-1 solution. 30 mM dithiothreitol (DTT) (1.5 µL of 1 M DTT/50
µL protein sample) was then added to the protein sample and the sample incubated
for 4 h at 40oC. After the 4 h incubation, samples were left to cool to room
temperature in the dark. Once cooled, 40 mM of iodacetamide (2 µL of 1 M
iodacetamide/50 µL protein sample) was added to each sample, which was
incubated in the dark for 30 minutes at room temperature.
After the second incubation, the samples were diluted 1:8 with 0.1 M
ammonium bicarbonate and immediately transferred to -70oC for 12 h. Samples

Chapter 2: Materials and Methods
78
were thawed at room temperature and 0.16 units (U – specified by manufacturer) per
1 µg of sequencing grade modified trypsin (Promega, UK) per µg of protein was
added, e.g., 100 µg of 4 µL of 4U µL-1 solution of trypsin. The samples were then
incubated overnight (minimum 18 h, maximum 24 h) at 30oC.
After the third incubation, digestion of the protein was halted by adding
formic acid to a final concentration of ~1% v/v in water. Trypsin specifically cuts
lysine and arginine residues to produce a number of peptides.
The digested protein samples were then loaded onto a reverse-phase high
pressure liquid chromatography, HPLC (Ultimate 3000 LC – Dionex, USA),
attached in-line to an electrospray mass spectrometer (QStar XL Mass Spectometer
– Applied Biosystems, USA). In this way, the peptides were separated by reverse-
phase HPLC before entering the mass spectrometer, which provided the mass of
each peptide fragment.
2.14.3 Isoelectric focusing: Extent of Deamidation
Purified harvest samples were loaded onto a precast IsoGel® Agarose IEF plate
(FMC BioProducts, Rockland, ME) with a pH range from 3 to 10 and focused so
that the isoelectric pattern created by the antibody’s charge could be characterized.
Any changes in this pattern are indicative of structural changes in the antibody
molecule. For comparison, isoelectric focusing (IEF) standards (LKB Pharmacia)
with known isoelectric point (pI) values between pH 3 and pH 10 were also loaded.
2.14.4 Antibody Glycan Analysis
Glycans were removed from the antibody using an enzymatic deglycosylation kit
(Prozyme, Inc., USA) and following the manufacturer’s instructions. In preparation

Chapter 2: Materials and Methods
79
for glycan analysis, the purified glycan samples were fluorescently labelled with 2-
AB (2-aminobenzamide) by reductive amination, using the Signal 2-AB Labelling
Kit (Prozyme, Inc., USA), following manufacturer’s instructions. Briefly, prior to
labelling the purified glycan samples were aliquoted into 500 µL sample vials
(Eppendorf, UK) and dried without heating in a centrifugal vacuum concentrator
(miVac DNA - GeneVac, UK); labelling reagent was added and the samples
incubated at 65oC for 3 h; excess reagent was removed from the samples using the
GlycoClean S Cartridge (Prozyme, USA) in a procedure recommended by the
manufacturer. Fluorescently labelled glycan samples were then loaded onto a
Glycosep N HPLC and run according to the manufacturer’s protocol developed from
Guile et al. (1996).

80
Chapter 3: Results and Discussion of Preliminary Studies
3.1 Development of Characterisation Methods
The suitability of the fluorescent stains chosen to characterise cell physiology during
scale-down experiments was explored by using multi-parameter flow cytometry
(FC) in conjunction with fluorescent staining protocols developed (Section 2.11) to
monitor cell culture during normal shake flask culture (Section 2.2) and during
induced cell death (Section 2.5.1).
A preliminary control study to establish the characteristics of each staining
protocol during cell death was conducted by treating cells with CCCP (Section
2.5.1). CCCP is a protonophore that renders the mitochondrial inner membrane
permeable to protons and causes uncoupling of mitochondria, which means that the
transfer of electrons through the electron transport train should no longer be coupled
to ATP production, due to the loss of the electrochemical gradient (de Graaf et al.,
2004). CCCP has been found to induce apoptotic cell death in a variety of cell types
(Armstrong et al., 2001; Mlejnek, 2001; de Graaf et al., 2004) and is recognised
within the literature as an effective means for mitochondrial membrane
depolarisation (Duchen, 2004; Arimochi and Morita, 2006).
In this study, GS-CHO cell culture was incubated with 100 µM CCCP for 12
h, as used to induce apoptosis in IL3-dependent murine pro-B lymphoid cells
(FL5.12) and neomycin resistant Jurkat T-ALL cells (de Graaf et al., 2004);
incubation for 10 h with 50 µM CCCP was effectively used to induce apoptosis in
HL60 cells (Armstrong et al., 2001). In both their studies, mitochondrial
depolarisation and apoptosis were concurrent.

Chapter 3: Results and Discussion of Preliminary Studies
81
At the end of the incubation period, cell physiology was assessed using FC, staining
with Calcein-AM/PI, AV-PE/SG, JC-1, CM-H2XRos, and DiOC6(3)/PI. The
properties of this selection of stains have been discussed (Section 1.10).
3.2 Characterisation of CCCP Induced Cell Death
3.2.1 Mode of Cell Death with Annexin-V/PE and SG: Apoptosis or Necrosis
By dual staining with Annexin-V conjugated to Phycoerythrin (AV-PE) and Sytox
Green (AV-PE/SG) (Section 2.11.6), it was possible to use flow cytometry (FC) to
establish the mode of cell death in glutamine synthetase Chinese hamster ovary (GS-
CHO) cell culture after incubation with the recognised decoupler and apoptosis-
inducing toxin CCCP (Section 2.5.1). Untreated cells were over 90% viable (AV-PE
negative, SG negative), and the remaining cells were necrotic (AV-PE positive, SG
positive), as identified by their high green fluorescence (GF) (Figure 3-1, a). It is
clear from the concurrent red fluorescence (RF) of this population that membrane
rupture had revealed phosphatidylserine serine (PS). Necrotic cells are labelled A on
the green fluorescence v red fluorescence (GF-RF) cytograph and back-gated so that
only light scattering properties of necrotic cells are visible in the forward scatter
light v side scatter light (FS-SS) cytographs (Figure 3-1, A). The proportion of
necrotic cells (Figure 3-1, B) is shown to increase after incubation with CCCP; this
is clear when comparing the size of population A and B (Figure 3-1). There is no
apoptotic population (AV-PE positive, SG negative). Note that an apoptotic
population would show only high RF.
When viable (AV-PE negative, SG negative) and necrotic cells (AV-PE
positive, SG positive) were back gated to FS-SS cytographs (Figure 3-1, A and B)

Chapter 3: Results and Discussion of Preliminary Studies
82
viable cells corresponded to a distinct population with higher FS and lower SS and
necrotic cells to a distinct population with lower FS and higher SS. This is consistent
with the light-scattering properties of necrotic cells recently reported (Laporte et al.,
2006), but contrary to those reported in a review of cell death (Darzynkiewicz et al.,
1992), which observed that necrotic death was generally accompanied by decreased
FS paralleled by a decreased SS that was caused by dissolution of the cells’ contents.
Indeed, apoptotic cells were reported to show decreased FS and an increased SS,
reflecting cell shrinkage paralleled by increased granularity.
In this study, however, cells with these light scattering properties were
stained with the nucleic acid stain SG, which identifies cells as having a permeable
cytoplasmic membrane, and therefore as likely necrotic. Thus, in this study, cells
with decreased FS and elevated SS will be referred to as necrotic. The slight increase
in SS, seen here in necrotic cells, may be caused by the disintegration of cellular
organelles; perhaps, dissolution of cellular contents was insufficient to decrease FS.
Were it not for staining with SG that proved that the cytoplasmic membrane
was not intact, and that the cells could not therefore be early-apoptotic, the observed
light scattering might be misinterpreted as indicative of the early stages of apoptotic
death. Demonstrably, light scattering changes must be interpreted with caution and
accompanied by the more specific staining assay.
There are three possible reasons for the absence of an identified apoptotic
population: first, that, at the culture conditions used in this study, CCCP does not
induce apoptosis in this cell line; second, that the AV-PE/SG staining method is
flawed and incapable of detecting apoptotic cells that do exist; third, that the GS-

Chapter 3: Results and Discussion of Preliminary Studies
83
CHO cell line used studied here does indeed die only by necrosis. Each will be
addressed below.
As noted, CCCP has been proven to induce apoptotic cell death in a variety
of cell types (Armstrong et al., 2001; Mlejnek, 2001; de Graaf et al., 2004).
Apoptotic death induced by CCCP has also been identified by dual staining with AV
conjugated to green fluorescent fluorescein isothiocynate (FITC) and red fluorescent
PI (AV-FITC/PI) (de Graaf et al., 2004), and this dual stain is analogous to AV-
PE/SG. In view of its reported efficacy as an inducer of apoptosis, it is concluded
that CCCP does reliably induce apoptosis. Note that in this study the stain colours
and the corresponding attributes were the opposite way around from the many
studies using AV-FITC/PI: in this study, using AV-PE/SG, RF indicated PS
translocation (indicative of apoptosis, if GF negative) and GF indicated cytoplasmic
membrane rupture.
Comparison of FS-SS cytographs derived from each of the staining protocols
showed that the method used to stain with AV-PE/SG decreased the viable cell
population significantly more than other staining protocols, compared to unstained
cells (Figure 3-1 to Figure 3-5).
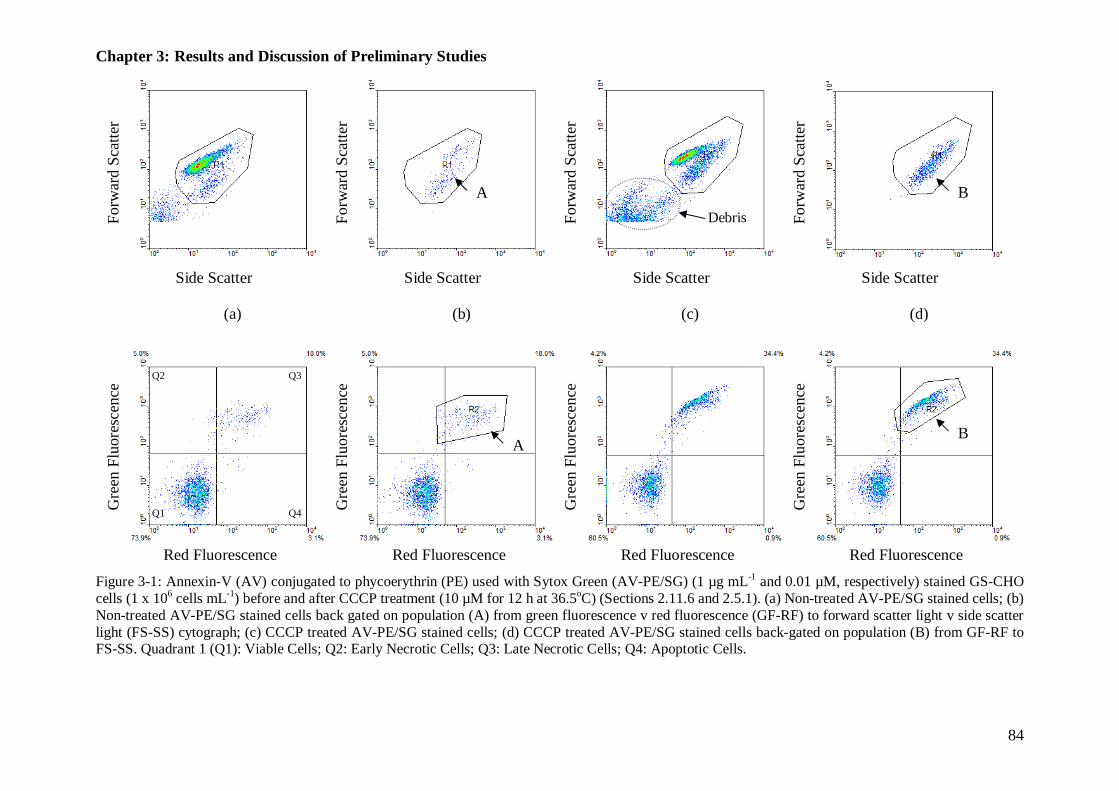
Chapter 3: Results and Discussion of Preliminary Studies
84
Figure 3-1: Annexin-V (AV) conjugated to phycoerythrin (PE) used with Sytox Green (AV-PE/SG) (1 µg mL-1 and 0.01 µM, respectively) stained GS-CHO cells (1 x 10⁶ cells mL-1) before and after CCCP treatment (10 µM for 12 h at 36.5oC) (Sections 2.11.6 and 2.5.1). (a) Non-treated AV-PE/SG stained cells; (b) Non-treated AV-PE/SG stained cells back gated on population (A) from green fluorescence v red fluorescence (GF-RF) to forward scatter light v side scatter light (FS-SS) cytograph; (c) CCCP treated AV-PE/SG stained cells; (d) CCCP treated AV-PE/SG stained cells back-gated on population (B) from GF-RF to FS-SS. Quadrant 1 (Q1): Viable Cells; Q2: Early Necrotic Cells; Q3: Late Necrotic Cells; Q4: Apoptotic Cells.
Forw
ard
Scat
ter
Forw
ard
Scat
ter
Forw
ard
Scat
ter
Forw
ard
Scat
ter
Side Scatter Side Scatter Side Scatter Side Scatter
Gre
en F
luor
esce
nce
Gre
en F
luor
esce
nce
Gre
en F
luor
esce
nce
Gre
en F
luor
esce
nce
Red Fluorescence Red Fluorescence Red Fluorescence Red Fluorescence
(a) (b) (c) (d)
B
B A
A
Q4
Q3 Q2
Q1
Debris

Chapter 3: Results and Discussion of Preliminary Studies
85
This decrease in cell viability was probably caused by the centrifugation
steps necessary to wash the cells in PBS and then re-suspend them in a high Ca+
binding buffer, which is required for maximum AV binding to PS. The same
decrease in viability was observed with Calcein-AM/PI staining after exposing cells
to the same washing steps. It is possible that other steps in the sampling and staining
method contributed to the decrease in viability (Section 3.3.3).
Since the staining protocol probably injured cells, it is reasonable to suggest
that cells were damaged to such an extent that any apoptotic population had its
cytoplasmic membrane ruptured during staining and thereafter presented necrotic
features, i.e., a permeable cytoplasmic membrane identified by staining with SG.
This is unlikely for three good reasons. First, that samples stained with AV-PE/SG
without washing and binding buffer steps retained their unstained viability but did
not exhibit apoptotic features, showing only a smaller necrotic population; crucially,
some PS labelling with AV-PE occurred in the necrotic population, showing that PS
labelling of apoptotic cells could have occurred without the binding buffer. Second,
that low-level cell damage of the sort experienced during the staining protocol
would probably trigger apoptosis in some viable cells. Third, that apoptotic
morphology, as detailed for wild-type CHO cells (Arden and Betenbaugh, 2004),
was at no point observed by microscopy. Indeed, cells were observed to swell and
rupture, as is typical of necrosis (Darzynkiewicz et al., 1996). Note: cell damage
during staining implies that there existed a sub-population of viable cells that were
more susceptible to damage.
Because apoptotic cell death has been observed in CHO culture, it is sensible
to question the efficacy of the staining protocol, but confirmation of the technique’s

Chapter 3: Results and Discussion of Preliminary Studies
86
efficacy as a means for detection of apoptosis is abundant in the literature. AV used
in conjunction with a nucleic acid stain, typically PI or EB, is an established method
with proven capability to detect apoptosis (Sgonc and Gruber, 1998) and the staining
protocol used in this study (using conjugated AV and a nucleic acid stain) is
reported to stain apoptotic cells successfully in many relevant flow cytometric
studies of cell culture (Koopman et al., 1994; Vermes et al., 1995; Ishaque, 2000).
Few reports could be found using SG, but the likely reason is that SG was developed
by Molecular Probes after PI and EB, and has yet to be adopted widely. SG has
improved nucleic acid binding, superior exclusion from viable cells and a brighter
fluorescence (Shapiro, 2003b). Despite the relative scarcity of AV-PE/SG,
successful identification of viable, apoptotic and necrotic cells is reported, using the
same staining protocol and stain combination outlined in this report (Mukhopadhyay
et al., 2007; Varum et al., 2007). In the literature, the method’s efficacy is clear.
Thus, there is strong evidence supporting both the efficacy of the apoptosis
inducer and the method of apoptosis detection. It is therefore concluded that the GS-
CHO strain used in this study died not by apoptosis, as might be expected, but by
necrosis. Evidence supporting this conclusion is provided by the absence of
morphological indicators and the negative staining for apoptosis after application of
the proven apoptosis inducer CCCP. Apoptosis was absent in CHO cells studied by
Singh and Al-Rubeai (1994), but was identified in several other studies of CHO cells
(Moore et al., 1995; Goswami et al., 1999; Tey et al., 2000; Arden and Betenbaugh,
2006).
These results emphasise the importance of combined staining for
identification of multiple, interrelated cell characteristics. Here, cytoplasmic
Chapter 3: Results and Discussion of Preliminary Studies
87
membrane permeability indicated necrosis, where AV-PE staining alone would have
indicated apoptosis. This staining protocol (Section 2.11.6) was also used for stirred
tank reactor (STR) experiments (Sections 3.4.3 and 4.4.3), as it was important to
monitor, and not presume, the mode of cell death for culture in the STR.
3.2.2 Cell Viability with Calcein-AM and PI: Live or Dead
Dual staining with Calcein acetoxymethyl (Calcein-AM) and Propidium Iodide (PI)
(Calcein-AM/PI) (Section 2.11.5) was used to delineate three cell populations:
viable cells (Calcein positive, PI negative) identified by bright green fluorescence
(GF), dead cells (Calcein negative, PI positive) identified by red fluorescence (RF)
and an intermediate sub-group (Calcein positive, PI positive) that have both GF and
RF, referred to here as the dual stained population (DSP).
These three populations were back gated to FS-SS cytographs (Figure 3-2).
Viable cells corresponded to a distinct population with higher FS and lower SS;
dead cells, a distinct population with lower FS and slightly higher SS signal (Figure
3-2, D). The third population, the dual stained population (DSP), had the same SS as
the viable cell population, but with considerably elevated FS, placing them on the
upper-end of the viable cell population (Calcein positive, PI negative). This was
elucidated by back-gating the DSP to a FS-SS cytograph (Figure 3-2, C). The light
scattering properties detailed above may be cautiously interpreted to provide an
insight into the morphology and physiology of the three populations.
The dead or necrotic cells identified with Calcein-AM/PI (Calcein negative
and PI positive) had the same the light scattering properties as necrotic cells
identified with AV-PE/SG (AV-PE positive and SG positive) (Section 3.2.1). It is
unsurprising to find that the light scattering properties of the populations identified
Chapter 3: Results and Discussion of Preliminary Studies
88
as necrotic by positive nucleic acid staining were in accordance: PI and SG are both
effective nucleic acid stains that should be excluded from viable cells. The light
scattering properties of respective viable cell populations were also in accordance.
The DSP exhibited the FS and SS reported for early stage necrotic cells
(Darzynkiewicz et al., 1992), which suggests that, like early necrotic cells, they had
not yet begun to degrade structurally, implying that their death had not occurred a
long time before analysis on the FC. This is consistent with the conclusion made by
Isailovic (2007) in a flow cytometric characterisation study of Spodoptera
frugiperda-21 (Sf-21) using Calcein-AM/PI; dual staining was attributed to either
the persistence of esterase activity in dead cells or slow leakage of Calcein from
recently permeable (dead) cells.
Unlike mitochondrial membrane potential, ΔΨm, which is wholly reliant on
cytoplasmic membrane integrity, and cannot persist after the cytoplasmic membrane
has become permeable to PI or SG, it is perfectly reasonable to expect esterase
activity to continue after the cell death: esterase activity is likely to be independent
of cellular respiration. Other intracellular enzymes, such as lactate dehydrogenase
(LDH) and galactosidase, usually retain activity when released from ruptured cells,
and often, incidentally, to the detriment of extracellular product (Goergen et al.,
1993; Gramer et al., 1995).

Chapter 3: Results and Discussion of Preliminary Studies
89
Figure 3-2: Calcein-AM/PI (50 nM and 3.7 µM, respectively) stained GS-CHO (1 x 10⁶ cells mL-1) cells before and after CCCP treatment (10 µM for 12 h at 36.5oC) (Sections 2.11.5 and 2.5.1). (a) Non-treated Calcein-AM/PI stained cells; (b) Non-treated Calcein-AM/PI stained cells back gated on population (C) from green fluorescence v red fluorescence (GF-RF) to forward scatter light v side scatter light (FS-SS) plot; (c) CCCP treated Calcein-AM/PI stained cells; (d) CCCP treated Calcein-AM/PI stained cells back-gated on population (D) from GF-RF to FS-SS.
Forw
ard
Scat
ter
Forw
ard
Scat
ter
Forw
ard
Scat
ter
Forw
ard
Scat
ter
Side Scatter Side Scatter Side Scatter Side Scatter
Gre
en F
luor
esce
nce
Gre
en F
luor
esce
nce
Gre
en F
luor
esce
nce
Gre
en F
luor
esce
nce
Red Fluorescence Red Fluorescence Red Fluorescence Red Fluorescence
(a) (b) (c) (d)
C
C D
D

Chapter 3: Results and Discussion of Preliminary Studies
90
Four hypotheses as to the nature of this dual stained population (DSP), i.e., cells
stained with Calcein-AM and PI, are here propounded. Further evidence allowed them to
be tested (Sections 3.4.2 and 4.4.2). First hypothesis: if the presumption of continued
enzyme activity after death is rejected, then the DSP must have died after addition of
Calcein-AM to the sample, to allow Calcein to be formed in the cell before enzyme
activity ceased at the time of death. Cell death during staining implies that there existed a
sub-population of viable cells that was less robust than the majority of viable cells, which
evidently remained viable. For this hypothesis, Calcein would need to have been retained
in the dead cell for a minimum of 15 minutes. The time required for sample staining (i.e.,
addition of the stain and then an incubation period).
Second hypothesis: if it is accepted that enzyme activity did continue after cell
death, the clear absence of intermediary levels of green fluorescence implies that a
catastrophic drop in esterase activity or retention of Calcein occurred soon after death.
Thus, the DSP must have died recently, and, if so, was composed of one or a mixture of
two cases: one, cells that had recently perished in the shake flask; two, cells that were
viable when taken from the shake flask and were then killed during staining and analysis.
Both cases allow testable predictions to be made.
In the first case, the DSP population died in the stirred tank reactor (STR). Cells
that had recently died in the STR are, it is suggested, revealed by dual staining when the
sample is assayed on the FC. Therefore, when µ is no longer increasing (i.e., when the
rapid growth phase ends) its size should be proportional to the rate of cell death (rd).
In the second case, the DSP population is assumed present as a sub-population in
the STR, but is not killed until after sampling (i.e., removal from the STR). The DSP is
therefore proportional to the number of less robust viable cells in the STR, i.e., cells that

Chapter 3: Results and Discussion of Preliminary Studies
91
are especially sensitive to whatever factors could cause death during sampling and
staining. Sensitivity might reasonably be expected to increase as ‘toxic’ metabolites (such
as lactate and ammonia) accumulate, as generally occurs in closed vessel cultures
(Sections 3.5.3 and 3.5.4). The existence of a sub-population of less robust cells was also
necessary for the hypothesis above, proposing that enzyme activity ceased at the time of
cell death (indicated here by staining with PI), and this less robust sub-population can
therefore be inferred regardless of the presumed cellular enzyme activity. Support for the
hypothesis that the DSP represented a sub-population of less robust cells that were killed
during staining is provided by the observed increase in necrotic cell death during AV-
PE/SG staining (Section 3.2.1). However, the two staining methods do differ: only AV-
PE/SG includes a buffer change step (Section 2.11.6), which may be damaging. Thus,
between the two methods, cell damage may vary in extent, and possibly type (i.e., lethal or
sub-lethal). A third contrary hypothesis is therefore possible.
Third hypothesis: the DSP represented a small percentage of cells that were
especially resilient and that after death retained significant enzyme activity or exhibited
especially slow leakage of Calcein. In this hypothesis, the dual staining could be entirely
unrelated to time since cell death. Perhaps the sub-population of dual stained cells had
their cytoplasmic membrane rendered permeable to PI but with sufficient structure
maintained to allow for continued enzyme activity and slow leakage of Calcein. Neither
recent cell death nor a sub-population of less robust cells are required to explain dual
staining if it is assumed that this dead cell population was able to persist in the shake-flask
because further degradation did not occur or degradation was at lower rate than the
majority of dead cells. If this third hypothesis is correct, this resilient population would be

Chapter 3: Results and Discussion of Preliminary Studies
92
expected to accumulate and the DSP should therefore be proportional to the dead cell
number (DCN).
Fourth hypothesis: intercalation with DNA provides PI with hydrophobic
conditions required for peak fluorescence (Section 1.10.2.1), but some non-specific
binding may occur (Shapiro, 2003a) and has been suggested as a cause for the lower
viability observed when staining with PI on the FC, as compared the viability of the same
sample when staining with TB on the HC (Al-Rubeai et al., 1996). However, since
strongly hydrophobic conditions, such as those occurring during intercalation with DNA,
are required for peak fluorescence, non-specific binding of PI should be revealed as a
population with diminished red fluorescence (RF). The DSP did not appear to have lower
RF and this hypothesis should be dismissed here without further evidence.
These results re-emphasise the importance and utility of dual staining: by using
both Calcein-AM and PI together, a sub-population of cells is revealed that would be
mistakenly counted as viable when staining with only Calcein-AM. The DSP population
was observed in the STR and these hypotheses were revisited (Sections 3.3.1 and 4.4.2).
3.2.3 Mitochondrial Membrane Potential
The maintenance of mitochondrial membrane potential, ΔΨm, is essential for energy
generation by oxidative phosphorylation and its loss has been shown to be one of the
fundamental indicators of apoptotic cell death (Desagher and Martinou, 2000; Ly et al.,
2003); loss of ΔΨm is also an indicator of necrosis (Darzynkiewicz et al., 1996), and any
ΔΨm assay would, if a definitive mode of cell death were sought, ideally provide
simultaneous staining with a membrane impermeable stain.
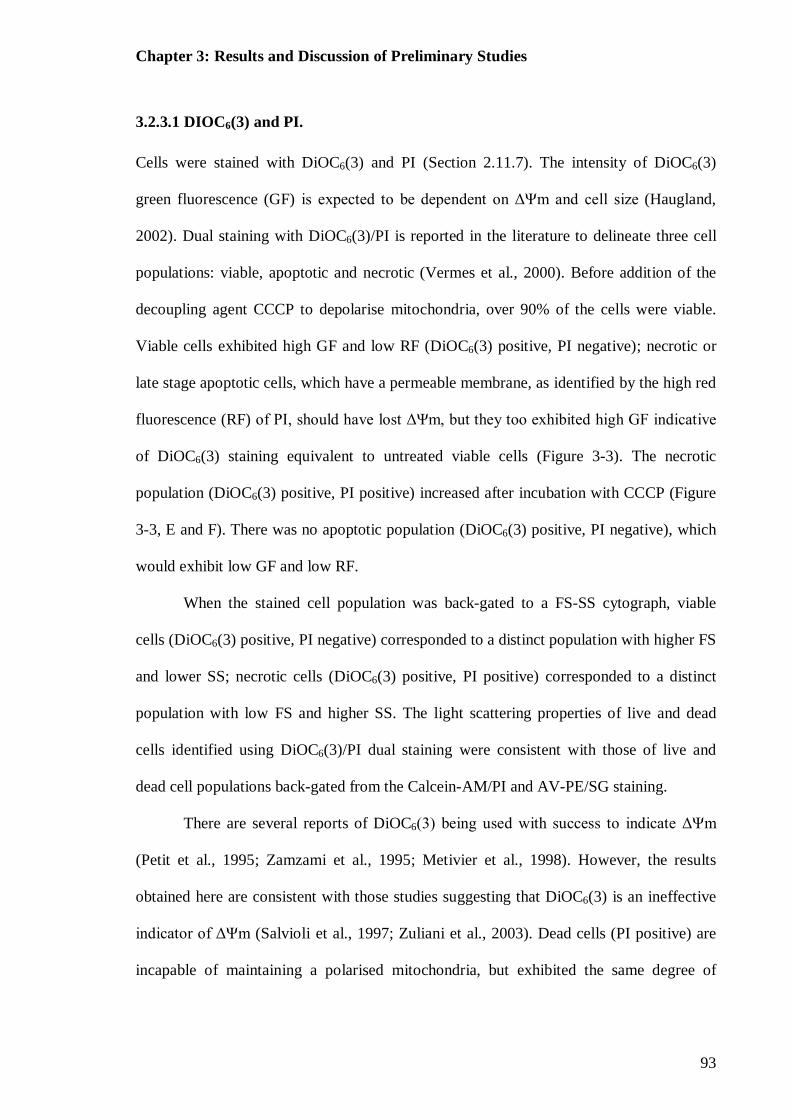
Chapter 3: Results and Discussion of Preliminary Studies
93
3.2.3.1 DIOC6(3) and PI.
Cells were stained with DiOC6(3) and PI (Section 2.11.7). The intensity of DiOC6(3)
green fluorescence (GF) is expected to be dependent on ΔΨm and cell size (Haugland,
2002). Dual staining with DiOC6(3)/PI is reported in the literature to delineate three cell
populations: viable, apoptotic and necrotic (Vermes et al., 2000). Before addition of the
decoupling agent CCCP to depolarise mitochondria, over 90% of the cells were viable.
Viable cells exhibited high GF and low RF (DiOC6(3) positive, PI negative); necrotic or
late stage apoptotic cells, which have a permeable membrane, as identified by the high red
fluorescence (RF) of PI, should have lost ΔΨm, but they too exhibited high GF indicative
of DiOC6(3) staining equivalent to untreated viable cells (Figure 3-3). The necrotic
population (DiOC6(3) positive, PI positive) increased after incubation with CCCP (Figure
3-3, E and F). There was no apoptotic population (DiOC6(3) positive, PI negative), which
would exhibit low GF and low RF.
When the stained cell population was back-gated to a FS-SS cytograph, viable
cells (DiOC6(3) positive, PI negative) corresponded to a distinct population with higher FS
and lower SS; necrotic cells (DiOC6(3) positive, PI positive) corresponded to a distinct
population with low FS and higher SS. The light scattering properties of live and dead
cells identified using DiOC6(3)/PI dual staining were consistent with those of live and
dead cell populations back-gated from the Calcein-AM/PI and AV-PE/SG staining.
There are several reports of DiOC6(3) being used with success to indicate ΔΨm
(Petit et al., 1995; Zamzami et al., 1995; Metivier et al., 1998). However, the results
obtained here are consistent with those studies suggesting that DiOC6(3) is an ineffective
indicator of ΔΨm (Salvioli et al., 1997; Zuliani et al., 2003). Dead cells (PI positive) are
incapable of maintaining a polarised mitochondria, but exhibited the same degree of
Chapter 3: Results and Discussion of Preliminary Studies
94
DiOC6(3) staining, as indicated by GF, as did viable cells, stained with DiOC6(3) alone.
Indeed, the results of this study also indicated that DiOC6(3) is insensitive to cytoplasmic
membrane potential (ΔΨ), which is lost when the cytoplasmic membrane is ruptured.
Binding of the stain in a charge independent manner suggests that the lipophilic
properties of the stain allowed non-specific cytoplasmic and cell organelle staining.
Salvioli et al. (1997) support this presumption in their similar study that provides a
germane comparison with the results in this report. They also induced mitochondrial
depolarisation using a decoupler that is analogous to CCCP, FCCP (carbonyl cyanide p-
(trifluoromethoxy) phenylhydrazone), and in accordance with this study, observed little
change to DiOC6(3) fluorescence.
Furthermore, no response was observed after treatment of the leukemic cells with
the K+ ionophore, valinomycin. Contrary to this study, a marked fluorescence decrease
was observed when ΔΨ was dissipated by treatment with KCL-rich medium or Na+/K+
ATPase inhibitor ouabain (Salvioli et al., 1997).
Terasaki et al. (1984), Haugland (2002) and Shapiro (2003a) all found that at low
concentrations the stain was effectively localised in the mitochondria, and Rottenberg and
Wu (1998) suggest that by maintaining the stain concentration below 1 nm cytoplasmic
binding can be minimised by decreasing accumulation of the cation from the medium in
the cytoplasm; this approach seeks to decrease the sensitivity of the stain to the
cytoplasmic membrane potential (ΔΨ). However, in this study DiOC6(3) at a
concentration of 0.9 nm (chosen specifically to minimise cytoplasmic binding) was
insensitive to the ΔΨ and ΔΨm of CHO cells. Further decrease in the stain concentration
is therefore likely to be ineffective.

Chapter 3: Results and Discussion of Preliminary Studies
95
Figure 3-3: DiOC6(3)/PI stained (0.9 µM and 3.7 µM, respectively) GS-CHO cells (1 x 10⁶ cells mL-1) before and after CCCP treatment (10 µM for 12 h at 36.5oC) (Sections 2.11.7 and 2.5.1). (a) Non-treated DiOC6(3)/PI stained cells; (b) Non-treated DiOC6(3)/PI stained cells back gated on population (E) from green fluorescence v red fluorescence (GF-RF) to forward scatter light v side scatter light (FS-SS) plot; (c) CCCP treated DiOC6(3)/PI stained cells; (d) CCCP treated DiOC6(3)/PI stained cells back-gated on population (F) from GF-RF to FS-SS.
Forw
ard
Scat
ter
Forw
ard
Scat
ter
Forw
ard
Scat
ter
Forw
ard
Scat
ter
Side Scatter Side Scatter Side Scatter Side Scatter
Red Fluorescence Red Fluorescence Red Fluorescence Red Fluorescence
Gre
en F
luor
esce
nce
Gre
en F
luor
esce
nce
Gre
en F
luor
esce
nce
Gre
en F
luor
esce
nce
(a) (b) (c) (d)
E
E
F
F

Chapter 3: Results and Discussion of Preliminary Studies
96
This was demonstrated by a concentration ranging study (Isailovic, 2007):
dual staining with both DiOC6(3) and PI was observed at DiOC6(3) concentrations
ranging from 0.2 nm to 18 nm. Isailovic (2007) found that dual staining with
DiOC6(3) and PI occurred regardless of the concentration, and concluded, as this
report does, that DiOC6(3) is an unreliable indicator of ΔΨm.
3.2.3.2 JC-1
DiOC6(3) proved to be an ineffective monitor of ΔΨm, as was feared on the basis of
previous studies found in the literature (Section 1.10.4.1). Salvioli et al. (1997)
conducted a similar study with a decoupling toxin (FCCP) and suggested JC-1 as an
effective alternative to DiOC6(3). JC-1 exists either as a green fluorescent (527 nm)
monomer at depolarized membrane potential (J-monomer) or as an orange
fluorescent (590 nm) aggregate (J-aggregate) at hyperpolarised membrane potential
(Haugland, 2002), as present in normally functioning mitochondria.
Cells were stained with JC-1 (Section 2.11.7) and before addition of CCCP
two populations were clearly visible: a large population corresponding to 90% of the
cells exhibited relatively low green fluorescence (GF) and red fluorescence (RF) and
a small population, the remaining 10% of the cells, exhibited elevated GF and RF
(Figure 3-4, a). After incubation with CCCP, the population of elevated green and
red fluorescent cells remained unaltered, (Figure 3-4, b). The large population with
low GF and low RF corresponded to a distinct population with higher FS and lower
SS; these light scattering properties matched those of cells identified as viable by
dual staining with AV-PE/SG and with Calcein-AM/PI (Figure 3-1 and Figure 3-2).
The small population with high GF and high RF corresponded to a distinct
population with lower FS and slightly higher SS (Figure 3-4, G and H); these light

Chapter 3: Results and Discussion of Preliminary Studies
97
scattering properties matched those of cells identified as dead or necrotic by staining
with Calcein-AM/PI and AV-PE/SG. A small sub-population of cells with low GF
and high RF was also identified (Figure 3-4, I); after staining with CCCP these
corresponded to the middle of the viable cell population, when back gated to a FS-
SS cytograph (not shown). Fluorescent microscopy showed that the RF from JC-1
was localised in the mitochondria and the GF was diffuse throughout the cytoplasm
(Figure 3-6, c).
Viable (i.e., respiring cells) are expected to maintain ΔΨm and therefore to
exhibit higher RF and lower GF than dead cells, which lose ΔΨm when they cease
respiring, so it was surprising to find that the majority of viable cells have lower GF
and lower RF than dead cells. When the cells were incubated with CCCP the
proportion of cells with elevated GF and RF was found to increase, compare
population G with H (Figure 3-4). This is again in accordance with the increase in
dead cells observed when staining with Calcein-AM/PI and AV-PE/SG, and lends
further support to the conclusion that this population was dead.
Although it is surprising, the concurrent increase in GF and RF does not
imply that the mitochondrial membrane potential (ΔΨm) had increased in this
population: the ratio of RF to GF is used to indicate ΔΨm, and it is clear that the
ratio of J-monomers and J-aggregates was constant during cell death (Figure 3-4).
Indeed, the use of a ratio of the two colours (527 nm J-monomers and 590 nm J-
aggregates) is intended to discount factors that may increase stain total uptake, such
as mitochondrial size, shape and density, and is one of the vaunted benefits of JC-1
(Haugland, 2002). Evidently, the concurrent increase in GF and RF was caused by
some factor that increased the total stain uptake.

Chapter 3: Results and Discussion of Preliminary Studies
98
When cells die by necrosis they exhibit osmotic swelling and their
mitochondria dilate (Desagher and Martinou, 2000); note that this swelling and
dilation is caused by the influx which accompanies cytoplasmic membrane rupture,
and when it occurs both ΔΨm and ΔΨ are lost. The increased cell volume that
typically accompanies necrotic death could certainly account for the increase in GF
from J-monomers, but for mitochondrial dilation to increase the numbers of J-
aggregates would mean that J-aggregates could be formed and persist when ΔΨm
was lost. J-aggregates form at high concentration densities of J-monomer (Haugland,
2002) so if conditions prevailed that allowed J-monomers to persist and accumulate
in the mitochondria then J-aggregates could well have formed. Such conditions are
improbable, once ΔΨm has dissipated.
Nevertheless, J-aggregates have been observed to form spontaneously in
solution when JC-1 was used to stain bacteria, providing evidence of spontaneous
aggregation that does not necessarily require hyper-polarity (Shapiro, 2003a). There
are, however, no reports in the literature of increased J-monomer and J-aggregate
concentrations within dead cells. Although the efficacy of the stain as an indicator of
ΔΨm is cast into doubt by the staining observed for necrotic cells, the presence of a
viable cell population with elevated J-aggregates (Figure 3-4, I), could indicate that
CCCP treatment created a sub-population of viable cells with elevated ΔΨm.

Chapter 3: Results and Discussion of Preliminary Studies
99
Figure 3-4: JC-1 stained (1 µM) GS-CHO cells (1 x 10⁶ cells mL-1) before and after CCCP treatment (10 µM for 12 h at 36.5oC) (Sections 2.11.7 and 2.5.1). (a) Non-treated JC-1 stained cells; (b) Non-treated JC-1 stained cells back gated on population (G) from green fluorescence v red fluorescence (GF-RF) to forward scatter light v side scatter light (FS-SS) cytograph; (c) CCCP treated JC-1 stained cells with population (I) from GF-RF identified on FS-SS; (d) CCCP treated JC-1 stained cells back-gated on population (H) from GF-RF to FS-SS.
Forw
ard
Scat
ter
Forw
ard
Scat
ter
Forw
ard
Scat
ter
Forw
ard
Scat
ter
Side Scatter Side Scatter Side Scatter Side Scatter
Gre
en F
luor
esce
nce
Gre
en F
luor
esce
nce
Gre
en F
luor
esce
nce
Gre
en F
luor
esce
nce
Red Fluorescence Red Fluorescence Red Fluorescence Red Fluorescence
(a) (b) (c) (d)
G
G
H
H
I
I

Chapter 3: Results and Discussion of Preliminary Studies
100
The mitochondrial decoupling that CCCP causes has been found to increase
respiration rate (Rottenberg and Wu, 1998), and may well have been responsible for
this population.
From the ambiguous results observed, it is concluded that JC-1 is an
unreliable indicator of ΔΨm. Hence, JC-1 was not used for STR analysis (Sections
3.4 and 4.4).
3.2.3.3 CM-H2XRos
CM-H2XRos does not fluoresce until it enters a respiring cell, where it is oxidized to
the fluorescent mitochondrion-selective stain and sequestered by the mitochondria
(Haugland, 2002). The untreated population of mid-rapid growth phase cells stained
with CM-H2XRos (Section 2.11.7) was homogenous with regard to magnitude of
CM-H2XRos oxidation, as indicated by the intensity of the red fluorescence (RF)
(Figure 3-5). After incubation with CCCP, two populations are clearly visible, one
with elevated RF (Figure 3-5, J). Increased RF has been observed by several other
studies using toxic substances to induce cells’ death; and is often attributed to one of
two different mechanisms.
CM-H2XRos fluorescence increases with respiration activity, which CCCP
has been shown to stimulate above the basal rate (Rottenberg and Wu, 1998). This
assertion is supported by Poot and Pierce (1999): fluorescence was strongly linked
to oxidative turnover when it decreased as cells were exposed to the respiration
complex III inhibitor antimycin A. However, in the same study, fluorescence in late-
stage apoptotic cells, as identified by loss of mitochondrial membrane potential
(Poot et al., 1997), did not respond to antimycin A, and was thought to be caused by
oxidative degradation of lipids (lipid peroxidation), such as the mitochondrial
Chapter 3: Results and Discussion of Preliminary Studies
101
membrane, occurring by release of reactive oxidative species (ROS), e.g., O2- and
OH-. CM-H2XRos has been successfully used to monitor the ROS (Kim et al., 2002;
Shanker et al., 2004; Shanker et al., 2005; Park et al., 2006) that are expected to be
released during mitochondrial degeneration (Batandier et al., 2002). In this
literature, induced ROS release was reported to increase CM-H2XRos fluorescence.
The literature suggests that CM-H2XRos can reveal differences in respiration and
that it is also influenced by ROS— two factors that may not be mutually exclusive.
Thus, two mechanisms could have resulted in the increased red fluorescence:
first, increased respiration rate that resulted from some degree of mitochondrial
decoupling, which allowed greater movement of protons; second, increased
generation of ROS that accompanied mitochondrial degeneration (Batandier et al.,
2002). Light scattering properties could be used to help discriminate between the
two.
Unfortunately, the staining method used for CM-H2XRos required fixing the
cells in paraformaldehyde, and fixing altered their light scattering properties, making
analysis difficult. Nevertheless, back gating to the FS-SS clearly showed that the cell
population with elevated RF corresponded to a population with elevated FS and SS
(Figure 3-5, J); these light scattering properties were identified as those of dead cells
when staining with AV-PE/SG and Calcein-AM/PI (Section 3.2.1 and Section
3.2.2). Based on the light-scattering properties of necrotic or dead GS-CHO
populations, which have been established with confidence in this report by back-
gating from stained cell populations, it is concluded that increased RF was generated
by ROS released during mitochondrial degradation.

Chapter 3: Results and Discussion of Preliminary Studies
102
Figure 3-5: CM-H2XRos (500 nM) stained GS-CHO (1 x 10⁶ cells mL-1) cells before and after CCCP treatment (10 µM for 12 h at 36.5oC) (Sections 2.11.7 and 2.5.1). (a) Non-treated CM-H2XRos stained cells; (b) CCCP treated CM-H2XRos stained cells; (c) CCCP treated CM-H2XRos stained cells back-gated on population (J) from green fluorescence v red fluorescence (GF-RF) to forward scatter light v side scatter light (FS-SS).
Forw
ard
Scat
ter
Forw
ard
Scat
ter
Forw
ard
Scat
ter
Side Scatter Side Scatter Side Scatter
Gre
en F
luor
esce
nce
Gre
en F
luor
esce
nce
Gre
en F
luor
esce
nce
Red Fluorescence Red Fluorescence Red Fluorescence
(a) (b) (c)
J
J

Chapter 3: Results and Discussion of Preliminary Studies
103
CM-H2XRos was not used for STR analysis (Sections 3.4 and 4.4) because suitable
nitrogen storage conditions were not available. Without the nitrogen storage
recommended by the stain manufacturer (Molecular Probes), oxidation of the stain is
known to occur. It is unlikely that significant oxidation occurred in the 12 hours
between staining of untreated and CCCP treated cells, but recent research (Isailovic,
2007) has shown that for a 20 day study, as required to characterise growth in a
typical fed-bath STR, oxidation of the stain during improper storage renders it
useless.
3.3 Culture Growth in Shake Flasks: Cell Count and Viability
Shake flask culture is widely used for the early stages of process development, as
well as for cell clone screening studies. Shake flasks are the most widely used
reaction vessel in biotechnology and have been for many decades (Maier et al.,
2004). Despite its prevalence and importance as a culture vessel, a review of the
literature found that characterisation of animal cell physiology during shake flask
culture is rare.
3.3.1 A Comparison of Haemocytometry and Flow Cytometry
GS-CHO cell culture growth in a 2 L shake flask was monitored over a 280 h period.
2 mL samples were taken every 24 h from each flask for immediate analysis by flow
cytometry (FC) and haemocytometry (HC). FC live/dead cell counts were made
using dual staining with Calcein-AM and Propidium Iodide (PI) (Section 2.11.5),
and HC live/dead cell counts were made using Trypan Blue (TB) exclusion (Section
2.10).
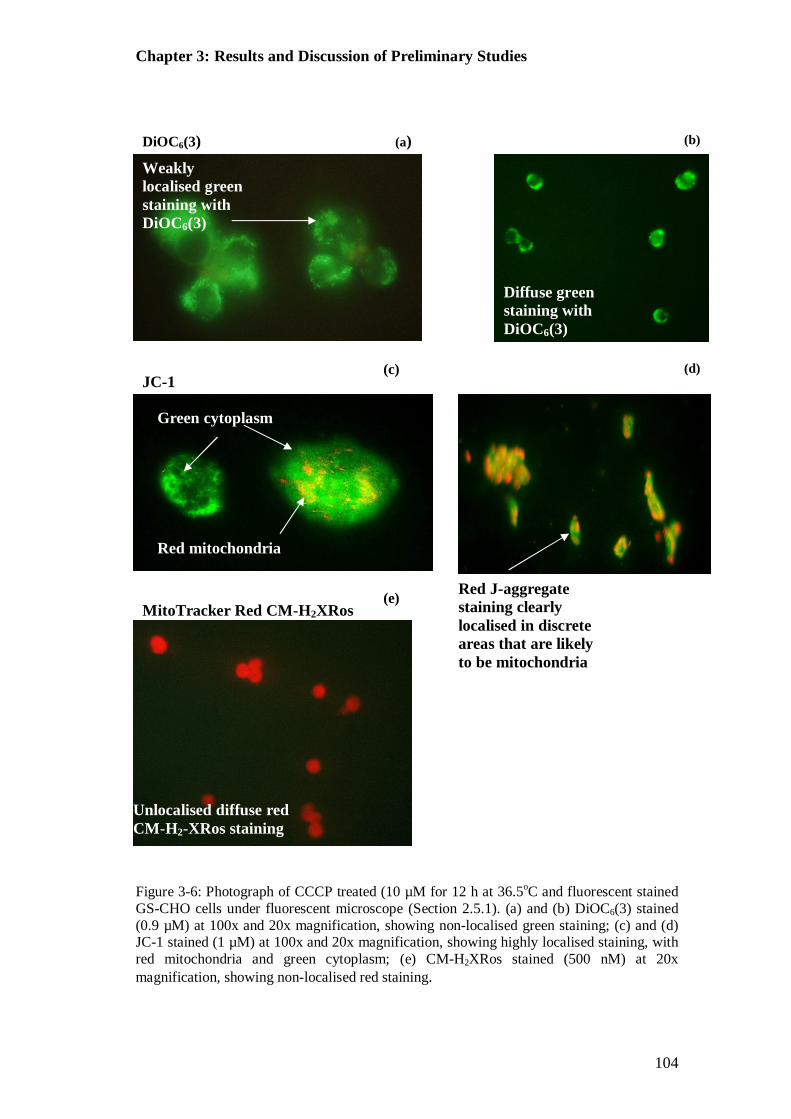
Chapter 3: Results and Discussion of Preliminary Studies
104
Figure 3-6: Photograph of CCCP treated (10 µM for 12 h at 36.5oC and fluorescent stained GS-CHO cells under fluorescent microscope (Section 2.5.1). (a) and (b) DiOC6(3) stained (0.9 µM) at 100x and 20x magnification, showing non-localised green staining; (c) and (d) JC-1 stained (1 µM) at 100x and 20x magnification, showing highly localised staining, with red mitochondria and green cytoplasm; (e) CM-H2XRos stained (500 nM) at 20x magnification, showing non-localised red staining.
MitoTracker Red CM-H2XRos (e)
JC-1 (c) (d)
DiOC6(3) (b) (a)
Red mitochondria
Green cytoplasm
Weakly localised green staining with DiOC6(3)
Diffuse green staining with DiOC6(3)
Red J-aggregate staining clearly localised in discrete areas that are likely to be mitochondria
Unlocalised diffuse red CM-H2-XRos staining

Chapter 3: Results and Discussion of Preliminary Studies
105
PI and TB are probably similar enough for a useful comparison to be made: both are
used on the principle that viable cells will exclude the stain, providing a simple
viability assessment. Calcein-AM should stain viable cells green and was used to
provide a positive control for dead cell staining by PI on the FC. The common HC
method lacks a corresponding positive control.
TB exclusion is widely used for live/dead cell counting in the
biopharmaceutical industry, where viable cell counts are important for process
optimisation and calculation of nutrient feed rates in fed-batch STR cultures; thus,
HC was justifiably used throughout this research to provide a ready comparison with
commercial data. The purpose of this study was to explore and define the relative
efficacy of the two methods that were used to monitor viable cell number during the
fed-batch experiment (Section 3.4) and scale-down experiments (Chapter 4). By
using Calcein-AM as a positive control with PI, this study built on the work of Al-
Rubeai et al. (1996) who compared TB exclusion on the HC with PI exclusion on
the FC as methods for evaluation of cell number and viability in CHO culture.
Comparative studies of the HC and the FC using simultaneous staining with PI and a
positive control have been conducted: fluorescein diacetate has been employed for
hybridoma cell culture (Altman et al., 1993) and Calcein-AM for insect cell culture
(Isailovic, 2007); the compelling findings of their research provide further impetus
for a comparison of the two methods on this industrially relevant GS-CHO cell line
(proprietary to Lonza).
To determine viability and draw a viability curve for analysis by FC one
must inspect the forward scatter light v side scatter light (FS-SS) cytographs and
their corresponding green fluorescence v red fluorescence (GF-RF) cytographs

Chapter 3: Results and Discussion of Preliminary Studies
106
(Figure 3-9 and Figure 3-10). Cells stained with Calcein-AM/PI revealed the three
populations present and detailed for CCCP induced cell death (Section 3.2.2);
accordingly, the same relationship between the cells’ light scattering and their
staining is revealed by back-gating from GF-RF cytographs to FS-SS cytographs
(Figure 3-9 and Figure 3-10, A and B).
Viable cell curves were drawn for counts using each method (Figure 3-7). A
comparison of the two curves finds them alike, particularly so when plotted on a
logarithmic axis (Figure 3-8), revealing three broad phases that correlate with a rapid
growth phase, stationary phase and death phase, as is typical of cell culture growth
in any closed vessel. Cells grew from the seeding concentration of ~2 x 10⁵ cells mL-
1 to a maximum viable cell number (VCNmax) of 44 ± 2 x 10⁵ cells mL-1 (mean ±
range of data, until otherwise stated) determined by FC and, correspondingly, 47 ± 2
x 105 cells mL-1 determined by the HC (Figure 3-7). This cell culture performance
exceeded expectations for batch culture, which is expected to be limited to 20-30 x
105 cells mL-1 (Al-Rubeai et al., 1992).
An initial peak viable cell number (VCN) was reached after ~ 72 h, shown by
both methods, marking the end of rapid growth phase, at cell viability of 36 ± 3 x
105 cells mL-1 determined by FC and 29 ± 1 x 10⁵ cells mL-1 by HC; this correlates
to a steeper gradient on the curve of VCN determined by FC. Accordingly, the mean
specific growth rate (µ) during the rapid growth phase was slightly greater for FC, at
0.027 h-1 compared to 0.026 h-1 by HC, with corresponding doubling times of 25 h
and 27 h respectively. No great difference.
At this stage, the number of experiments was insufficient for a statistically
meaningful test of the difference between VCN counts made with two methods
Chapter 3: Results and Discussion of Preliminary Studies
107
(ΔVCN). However, further studies with continued combined analysis by FC and HC
provided the opportunity for a statistical test of the difference between counts made
by the flow cytometer (FC) and haemocytometer (HC) of both viable cell number
(VCN) and dead cell number (DCN) (Section 4.4.1). A similarly rigorous
comparison could not be found in the literature.
3.3.2 Cell Viability with Calcein-AM and PI: Live or Dead
Samples were taken approximately every 24 h from the shake flask culture (Section
3.3.1) and stained with Calcein-AM/PI for analysis on the flow cytometer (FC)
(Section 2.11.5). Three populations were revealed in each sample, stained with
Calcein-AM, PI, or both stains (i.e., the dual stained population, DSP). This finding
is entirely consistent with the findings of the control study in which cell death was
induced by the toxin CCCP (Section 3.2.2), and shows that the light scattering and
staining exhibited in that study is not restricted to induced cell death. Based on the
results of CCCP induced cell death and staining with Calcein-AM/PI (Section 3.2.2),
a preliminary conclusion was made that the DSP was very probably dead, perhaps
recently so. Since this population also appeared in the shake flask culture it merits
further discussion.

Chapter 3: Results and Discussion of Preliminary Studies
108
Figure 3-7: Growth curves of GS-CHO cell culture in a 2 L shake flask inoculated at 2 x 10⁵ cells mL-1. Comparison of flow cytometric (FC) ratiometric count method (Sections 2.11.4) with Calcein-AM/PI staining (Section 2.11.5) (solid line, open points) and haemocytometric (HC) Trypan Blue (TB) exclusion method (Section 2.10) (dashed line, closed points) for cell count and viability assessment: viable cell number (square), dead cell number (triangle) and viability (circle). Each time point is the average of two counts, error bars represent the data range of the duplicate samples.
0
10
20
30
40
50
60
0 40 80 120 160 200 240 2800
20
40
60
80
100
Cel
l num
ber (
1 x
105 c
ells
mL-1
)
Via
bilit
y (%
)
Time (hour)
0
1 0 0
0 1 0
FC Viability HC ViabilityFC VCNHC VCNFC DCN HC DCN

Chapter 3: Results and Discussion of Preliminary Studies
109
Figure 3-8: A logarithmic growth curve of GS-CHO cell culture in a 2 L shake flask inoculated at 2 x 10⁵ cells mL-1. Comparison of flow cytometric (FC) ratiometric count method (Section 2.11.4) with Calcein-AM/PI staining (Section 2.11.5) (solid line, open points) and haemocytometric (HC) Trypan Blue (TB) exclusion method (Section 2.10) (dashed line, closed points) for cell count and viability assessment, plotted with a logarithmic y-axis: viable cell number (square).
1.E+05
1.E+06
1.E+07
0 40 80 120 160 200 240 280
Cel
l num
ber (
cells
mL-1
)
Time (hour)
0 1 0
FC VCN
HC VCN
Chapter 3: Results and Discussion of Preliminary Studies
110
It is clear that the DSP, as a percentage of the combined VCN and DCN, the
total cell number (TCN), did not increase significantly as the culture declined
(Figure 3-10), but instead showed little variation throughout the culture, varying
randomly around 4% ± 2% (mean ± standard deviation, N = 13). (Note: N is the
number of independent samples). Three hypotheses conceivably explained the
origins of this population (Section 3.2.2); allowing predictions of the expected
variation of the DSP in a typical batch or fed-batch shake flask or STR culture.
These predictions can now be tested.
If dual staining was the result of recent cell death in the STR then the
percentage size of the DSP should have been almost zero in the early stages of the
culture, when rate of death was very low. It should then have increased as the rate of
cell death (rd) increased from the stationary phase to the death phase. If a proportion
of viable cells were more robust and maintained enzyme activity and slow Calcein
leakage after death then the percentage size of the sub-population should have
increased as the number of cell deaths increased. Since the sub-population was
constant, these two hypotheses should be dismissed. Can it therefore be concluded
that the DSP was composed of a sub-population of less robust viable cells that died
during staining?
If the DSP represented a less robust proportion of viable cells that were
present in the STR before sampling, staining and analysis, the proportion must have
increased as viability decreased. Indeed, since the DSP, as a proportion of the total
population size, exhibited little variation in spite of the decreased viable population
(from which it would be drawn), the proportion of less robust cells would have to

Chapter 3: Results and Discussion of Preliminary Studies
111
have increased to a degree that matched the decrease in viability – this might
reasonably be expected.
In a batch culture, viability typically decreases with culture duration, as
accumulation of metabolites (Sections 3.5.3 and 3.5.4), primarily ammonia and
lactate, and substrate limitation (e.g., glucose or glutamine limitation) increasingly
inhibit cell growth and alter cell protein production (Rearick et al., 1981; Lao and
Toth, 1997; Sun and Zhang, 2004; Chen and Harcum, 2005). It is entirely reasonable
to propose that the same deleterious factors responsible for decreased percentage
viability could have increased the proportion of less robust cells in those viable cells
that remained. In this way, the DSP would remain constant.
In conclusion, sensitivity to factors that might cause cell death appears to be
a variant amongst the viable cell population. Furthermore, the proportion of cells
that exhibit such sensitivity can be expected to increase as conditions in the STR
became increasingly deleterious for cell culture. Deleterious conditions are indicated
by falling viability. The sensitivity of this sub-population was such that it was killed
at some point during staining with Calcein-AM/PI and analysis with FC. If enzyme
activity is assumed to have ceased immediately at the point of cell death, then the
DSP must have been created after staining, to allow Calcein formation. If activity is
assumed to have continued, then the DSP could have been created at any point after
the sample was taken from the STR. In either case, FC analysis may be implicated in
cell-death.

Chapter 3: Results and Discussion of Preliminary Studies
112
3.3.3 Cell Damage during Staining and Flow Cytometry
Flow cytometry (FC) could have resulted in the death of less robust viable cells in
four ways: incubation, stain toxicity, stain’s solvent toxicity and direct
hydrodynamic or mechanical damage (‘shear’); these will be discussed in turn.
As noted (Section 2.11.5), a 15 minute incubation period at 36.5oC was
recommended for optimal staining with the FC stains used in this study (Haugland,
2002). No such incubation was required for haemocytometry (HC). It is possible that
during this incubation period a deleterious change in pH occurred. A deliberate shift
in pH from 7.3 to above 8.5 decreased viability of GS-NS0 culture after 10 minutes
(Osman et al., 2001). Note that alkali addition or CO2 stripping by sparging the STR
with an inert gas was very likely required to achieve such a high pH in their sodium
bicarbonate buffered medium. A shift of this magnitude was unlikely in the
incubated samples. In Osman et al. (2001), a shift to pH 6.5 decreased viability, but
only after more than 600 minute. Since the pH in the culture studied here was
already low (pH 6.8) from day 4, any shift in pH that accompanied transfer to the
incubator would likely have been to increase pH, as some CO2 may have been lost.
PI is a toxic mutagen, so too, for that matter, is TB (Haugland, 2002). These
toxins are unlikely to have decreased VCN: nucleic stains are most harmful only
when they enter the cell and interact with nucleic acid or nucleic acid metabolism
(Pin et al., 2006), and the utility of PI and TB, of course, depends on their short-term
inability to interact with and enter live cells. Calcein-AM has very low levels of
toxicity (Jacopo et al., 2000; Haugland, 2002). Of course, the indicator for cell death
is permeablisation of the cytoplasmic membrane to PI or TB, but at this point the

Chapter 3: Results and Discussion of Preliminary Studies
113
cell is no longer able to maintain an active metabolism and should not be induced to
further degradation by toxins.
PI and TB were dissolved in phosphate buffer solution (PBS), which was
likely benign, but Calcein-AM must be dissolved in an aprotic solvent, such as
dimethyl sulfoxide (DMSO), which may be deleterious. To mitigate solvent toxicity,
in this study less than 0.1% DMSO was used, as recommended (Haugland, 2002)
and supported by the literature. Qi et al. (2008) found cell cultures were unharmed
by 0.1-0.25% DMSO over 24 h, and Fiore and Degrassi (1999) actually used 1.5%
DMSO to inhibit cell concentration dependent apoptosis in CHO cells. Furthermore,
a review reports several studies in which DMSO concentrations below 1.0% did not
interfere with results (Santos et al., 2003).
Cells are probably exposed to greater hydrodynamic forces during FC than
HC: in FC, cells must be hydrodyamically focused for accurate arrival at the focal
point of the laser; HC requires only pipette manipulation. Nevertheless, no reports of
hydrodynamic damage caused by FC cell analysis could be found in the literature;
damage attributed to FC is restricted to fluorescence activated cell sorting (FACS).
Reportedly, during sorting (using a Becton, Dickinson and Company (BD)
FACSVantage) cell viability was decreased by extensional forces created by the
large pressure drop across the exit nozzle (Mollet et al., 2008). In this the study here,
cells were analysed by light scattering from within the flow-cell: any hydrodynamic
forces associated with the exit nozzle likely occurred downstream of assessment of
viability. In conclusion, stain toxicity and hydrodynamic forces are unlikely to have
created the DSP by killing less robust viable cells, but a pH change during
incubation may have.

Chapter 3: Results and Discussion of Preliminary Studies
114
3.4 Culture Growth in a Fed-batch STR
The predominant means for the large-scale production of recombinant protein is the
stirred tank reactor (STR) (Birch and Racher, 2006). For late stage process
development, laboratory-scale and pilot-scale STR are required to create conditions
that resemble those expected during production in a large-scale (~20 m3) STR.
Nevertheless, when biopharmaceutical companies develop a protein production
process for transfer to large-scale, shake flask culture, because of its simplicity and
low cost, is often used to conduct preliminary studies and to escalate cell numbers.
3.4.1 Comparison of STR and Shake Flask Cell Culture
Glutamine synthetase Chinese hamster ovary (GS-CHO) cell culture growth in
duplicate 5 L fed-batch stirred tank bioreactors, STR, (Section 2.6) was monitored
over a 20-day period. 2 mL samples were taken from each STR for immediate
analysis on the flow cytometer (FC) and haemocytometer (HC) on average every 24
hours (h). FC and HC analysis methods were the same as those used for the shake
flask (Section 3.3).
As earlier (Section 3.3.1), a comparison of FC and HC is concurrent to
analysis of culture performance. Here culture performance in the shake flask and the
STR are compared. Note two important differences between the culture methods:
first, methionine sulfoximine (MSX) inhibition of the glutamine synthetase (GS)
gene was not present in the STR, permitting antibody production, which did not
occur in the shake flask, because MSX was present; second, the STR received a
substrate feed to maintain glucose at between 3 and 6 gL-1.
Viable cell number (VCN), dead cell number (DCN) and viability from FC
and HC cell counts were very similar (Figure 3-11 and Figure 3-12). As in the shake

Chapter 3: Results and Discussion of Preliminary Studies
115
flask culture, there did not appear to be a significant difference between the two cell
count methods. Nevertheless, cell counts from the two methods were compared
using sufficient experiments for acceptable statistical analysis (Section 4.4.1).
Growth followed three distinct phases, typical of cell culture: rapid growth,
stationary phase and death phase (Figure 3-12). As in the shake flask, there was no
obvious lag phase in cell growth.
Cells grew from the inoculation VCN of 2 x 10⁵ cells mL-1 to a maximum
viable cell number (VCNmax) of 93 ± 5 x 10⁵ cells mL-1 (mean ± range of data, until
otherwise stated) determined by FC (Figure 3-12) and correspondingly 80 ± 8 x 10⁵
cells mL-1 determined by HC. This VCNmax is in accordance the expected growth of
the GS-CHO cell line (Birch and Racher, 2006). VCNmax in the STR was ~50%
greater than in the shake flask, and likely reflects the combined benefits of substrate
feeding and effective control of the culture environment.
Culture duration, measured from inoculation until viability fell below 30%,
increased from 280 h in the shake flask cultures to 480 h in the STR. Furthermore,
rapid growth in the STR continued for 234 h, 160 h longer than in the shake flask,
albeit at one third of the mean specific growth rate, µ. Much of the increased culture
duration in the STR could be accounted for by the protracted rapid growth phase. In
the rapid growth phase µ was 0.0144 h-1 by FC and 0.0147 h-1 by HC; doubling
times, td, were 47 h and 48 h, respectively. These values are essentially the same for
FC and HC. Thus, td in the rapid growth phase of the STR was almost twice the td in
the rapid growth phase of the shake flask culture (25 h and 28 h) (Section 3.3.1).
Butler (2004a) state that td in animal cell culture is typically 24 h. In the
literature, reported td for CHO and hybridoma cell culture could be found ranging

Chapter 3: Results and Discussion of Preliminary Studies
116
from 11 h to 39 h (Kurano et al., 1990a; Hayter et al., 1991; Hayter et al., 1992a;
Ozturk et al., 1992; Godoy-Silva et al., 2009b). The almost halving of µ from the
shake flask to the STR is likely to be explained by a crucial difference between the
two experiments: methionine sulfoximine (MSX) was present only in the shake flask
culture (Section 2.2). MSX inhibits the GS gene, which is responsible for antibody
production as well as regulating glutamate synthesis. In the shake flask, antibody
production was inhibited by MSX; in the STR, antibody production was
considerable (Figure 3-20).
Thus, the low µ in the STR usefully demonstrates the significant burden of
antibody production. Nevertheless, the influence of the substrate feed should also be
considered. At the concentration range maintained in the STR, glucose has been
found to decrease µ (Kurano et al., 1990a; Fieder et al., 1995; Takuma et al., 2007).
However, the shake flask and STR used the same medium (with MSX added to the
shake flask) and they therefore had the same initial glucose concentration (6 g L-1).
Furthermore, substrate feeding could not have altered growth until 96 h and in the
shake flask VCNmax of ~ 40 x 105 cells mL-1 was reached after only 80 h; whereas
in the STR after 80 h VCN was ~ 10 x 105 cells mL-1.
In the stationary phase the VCN oscillated (Figure 3-11) in the same manner
observed in the shake flask experiment, although in the STR cell counts using the
HC also oscillated, unlike in the shake flask (Figure 3-7). The mean VCN during the
stationary phase was 77 ± 9 x 10⁵ cells mL-1 by FC, and 68 ± 7 x 10⁵ cells mL-1 by
HC.

Chapter 3: Results and Discussion of Preliminary Studies
117
Figure 3-9: Shake flask growth data cytographs for GS-CHO cells stained with Calcein-AM/PI (50 nM and 3.7 µM, respectively) (Section 2.11.5). Forward scatter light v side scatter light (FS-SS): (a) 0 hour (h): inoculation; (b) 24 h; (c) 46 h; (d) 72 h; (e) 98 h; (f) 120 h; (g) 146 h; (h) 168 h; (i) 196 h; (j) 221 h; (k) 244 h; (l) 266 h; (m) 281 h. Population A and B, cytograph (l), are live and dead cell populations, respectively and correspond to populations A and B, cytograph (l), in Figure 3-10, showing Calcein-AM/PI staining.
Side Scatter Side Scatter Side Scatter
Side Scatter Side Scatter Side Scatter
Forw
ard
Scat
ter
Forw
ard
Scat
ter
Side Scatter Side Scatter Side Scatter
Forw
ard
Scat
ter
Side Scatter Side Scatter Side Scatter
Forw
ard
Scat
ter
Forw
ard
Scat
ter
Side Scatter
(a)
(d)
(g)
(j)
(m)
(k)
(h)
(e)
(b)
(i)
(l)
(c)
(f)
Debris
Debris
A
B
Debris
Gate

Chapter 3: Results and Discussion of Preliminary Studies
118
Figure 3-10: Shake flask growth data cytographs for GS-CHO cells stained with Calcein-AM/PI (50 nM and 3.7 µM, respectively) (Section 2.11.5), created at time points corresponding to Figure 3-7. Green fluorescence v red fluorescence (GF-RF): (a) 0 hour (h): inoculation; (b) 24 h; (c) 46 h; (d) 72 h; (e) 98 h; (f) 120 h; (g) 146 h; (h) 168 h; (i) 196 h; (j) 221 h; (k) 244 h; (l) 266 h; (m) 281 h. Population A and B, cytograph (l), are live and dead cell populations, respectively and correspond to populations A and B in Figure 3-9, showing forward scatter light v side scatter light properties of the cells.
Red Fluorescence Red Fluorescence Red Fluorescence
(a)
(b)
(c)
(d)
(e)
(f)
(g)
(j)
(i)
(h)
Gre
en F
luor
esce
nce
Gre
en F
luor
esce
nce
Gre
en F
luor
esce
nce
Gre
en F
luor
esce
nce
Red Fluorescence Red Fluorescence Red Fluorescence
Red Fluorescence Red Fluorescence Red Fluorescence
Red Fluorescence
Gre
en F
luor
esce
nce
Red Fluorescence Red Fluorescence
Red Fluorescence
(k) (l)
(m)
B
A

Chapter 3: Results and Discussion of Preliminary Studies
119
Figure 3-11: Growth curves of GS-CHO cell culture in a 5 L fed-batch stirred tank reactor (STR) with a 3 L medium volume (‘working volume’) inoculated at 2 x 10⁵ cells mL-1 (Section 2.6): comparison of cell count and viability assessment by the flow cytometric method (Section 2.11.4) and haemocytometric method (Section 2.10). The flow cytometric method used the ratio of a standard concentration (1 x 10⁶ beads mL-1) of fluorescent beads to cells to provide a total cell number (TCN) (Section 2.11.4), and Calcein-AM/PI staining (50 nM and 3.7 µM, respectively) as a viability indicator (Section 2.11.5). Haemocytometry was conducted as a typical Trypan Blue (TB) exclusion method (Section 2.10). Flow cytometry: solid line, open points. Haemocytometry: dashed line, closed points. Viable cell number (VCN) (square), dead cell number (DCN) (triangle) and viability (circle). Each time point is the average of duplicate experiments, error bars represent the data range of the duplicate experiments.
Time (hour) V
iabi
lity
(%)
Cel
l num
ber (
1 x
105 c
ells
mL-1
)
0
20
40
60
80
100
120
0 96 192 288 384 4800
20
40
60
80
100
0
1 0 0
0 1 0
FC Viability HC ViabilityFC VCNHC VCNFC DCN HC DCN

Chapter 3: Results and Discussion of Preliminary Studies
120
Figure 3-12: A comparison of viable cell number (VCN) (square) found by the flow cytometric method (solid line, open point) (Sections 2.11.4 and 2.11.5) and the haemocytometric method (dashed line) (Section 2.10). Refer to Figure 3-11, for original growth curves.
1.E+05
1.E+06
1.E+07
0 96 192 288 384 480
Time (hour)
Cel
l num
ber (
cells
mL-1
)
0
1
0
0
0 1 0
FC VCN
HC VCN

Chapter 3: Results and Discussion of Preliminary Studies
121
Clearly, both methods revealed a considerable fluctuation in VCN throughout the
stationary phase. For the shake flask culture it was reasoned that cell death released
nutrients into the medium, providing a stimulus and renewed growth to nutrient
deprived cells. During a fed-batch culture, however, it is much less likely that cells
became nutrient limited: typically, the limiting substrate is glucose, and by feeding
this was continuously abundant (6 g L-1). Nevertheless, is still possible that some
nutrient deprivation was occurring. Note that perturbations in the VCN of a GS-
CHO culture were recorded, but not explained, in the growth curve provided by
Lonza (Birch, 2005), who own the rights to the cell line.
In accordance with the shake flask study, the percentage viability was, on
average, lower when measured by FC than by HC: in the shake flask by 2 ± 4%
(mean ± standard deviation, until otherwise stated) and in the STR by 3 ± 2%
(Figure 3-11). The viability in the STR dropped below 90% after (by the FC
method) 307 h, while in the shake flask this point is reached after 168 h. Almost all
of this 139 h protraction is accounted for by extension of the rapid growth phase in
the STR.
In conclusion, cell culture performance in the fed-batch STR was a
considerable improvement on the performance in the batch shake flask. Transfer
from shake flask to STR is not always associated with improved VCN, viability and
antibody titre (Buchs and Zoels, 2001; Reyes et al., 2003), but the fundamental
differences between the two vessels favour the attainment of optimal culture
conditions in the STR.
Chapter 3: Results and Discussion of Preliminary Studies
122
3.4.2 Cell Viability with Calcein-AM and PI: Live or Dead
The FS-SS and corresponding GF-RF cytographs for analysis of the STR culture
(Figure 3-13 and Figure 3-14) closely resemble those for the shake flask culture
(Figure 3-9 and Figure 3-10). Throughout much of the culture, the GF-RF
cytographs show that the cell population could be split into three populations:
viable (Calcein positive, PI negative), dead (Calcein negative, PI positive) and dual
stained (Calcein positive, PI positive). This reflects the same split as CCCP induced
death (Section 3.2.2) and the shake flask (Section 3.3.1).
The DSP (as a percentage of the total population) remained constant at 3.5 ±
0.8% (mean ± standard deviation, N = 40) and was similar to the DSP found (4 ± 2)
in the shake flask study (Section 3.3.2). Unlike that study, the number of
independent samples, N, was greater than 30 and the 95% confidence interval could
be found with acceptable reliability, giving a DSP of 3.5 ± 0.2% (mean ± 95%
confidence interval). Thus, the DSP found in the STR supports the conclusions of
that study (Section 3.3.2). Factors that could have caused less robust cells to stain
during sampling and staining have been discussed (Section 3.3.3).
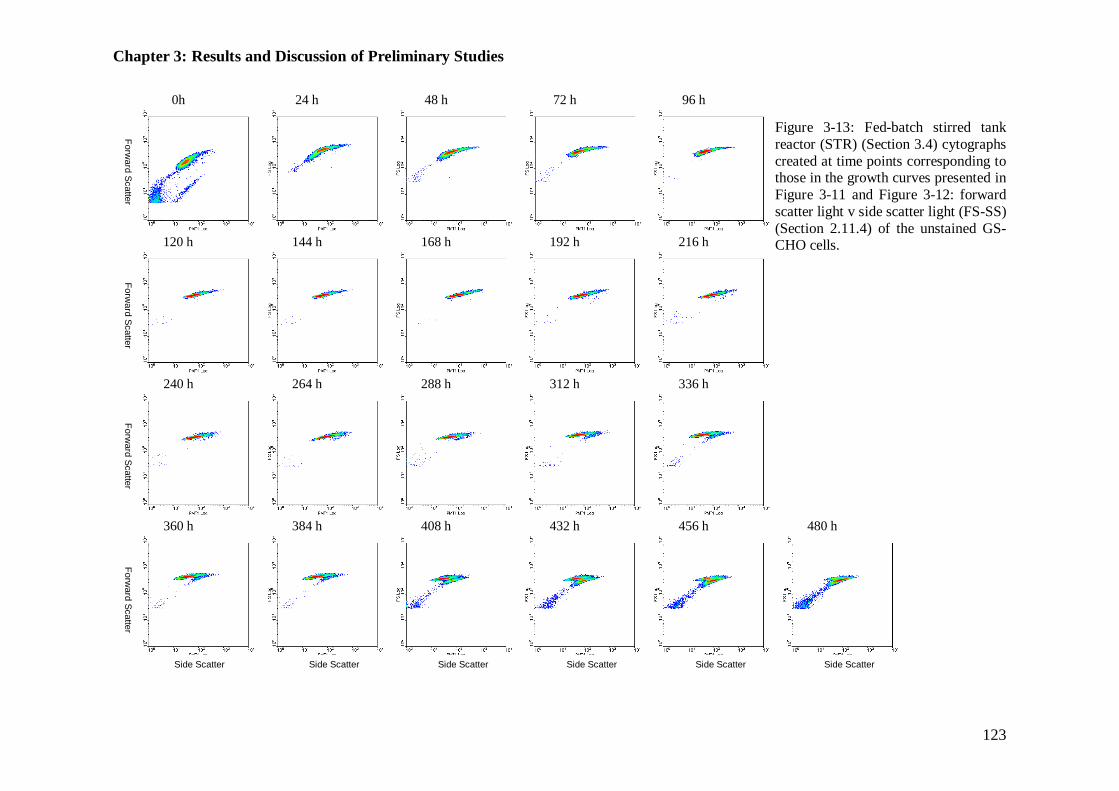
Chapter 3: Results and Discussion of Preliminary Studies
123
Figure 3-13: Fed-batch stirred tank reactor (STR) (Section 3.4) cytographs created at time points corresponding to those in the growth curves presented in Figure 3-11 and Figure 3-12: forward scatter light v side scatter light (FS-SS) (Section 2.11.4) of the unstained GS-CHO cells. 144 h
0h 24 h 48 h 72 h 96 h
168 h 192 h 216 h
240 h 264 h 288 h 312 h 336 h
360 h 384 h 408 h 432 h 456 h 480 h
120 h
Forward Scatter
Forward Scatter
Forward Scatter
Forward Scatter
Side Scatter Side Scatter
Side Scatter
Side Scatter
Side Scatter
Side Scatter

Chapter 3: Results and Discussion of Preliminary Studies
124
Figure 3-14: Fed-batch stirred tank reactor (STR) (Section 3.4) cytographs created at time points corresponding to those in the growth curves presented in Figure 3-11 and Figure 3-12: GS-CHO cells stained with Calcein-AM/PI (50 nM and 3.7 µM, respectively) (Section 2.11.5); green fluorescence v red fluorescence (GF- RF).
216 h
0 h 24 h 48 h 72 h 96 h
120 h 144 h 168 h 192 h
240 h 264 h 288 h 312 h 336 h
360 h 384 h 408 h 432 h 456 h 480 h
Green Fluorescence
Green Fluorescence
Green Fluorescence
Green Fluorescence
Red Fluorescence Red Fluorescence Red Fluorescence Red Fluorescence Red Fluorescence Red Fluorescence
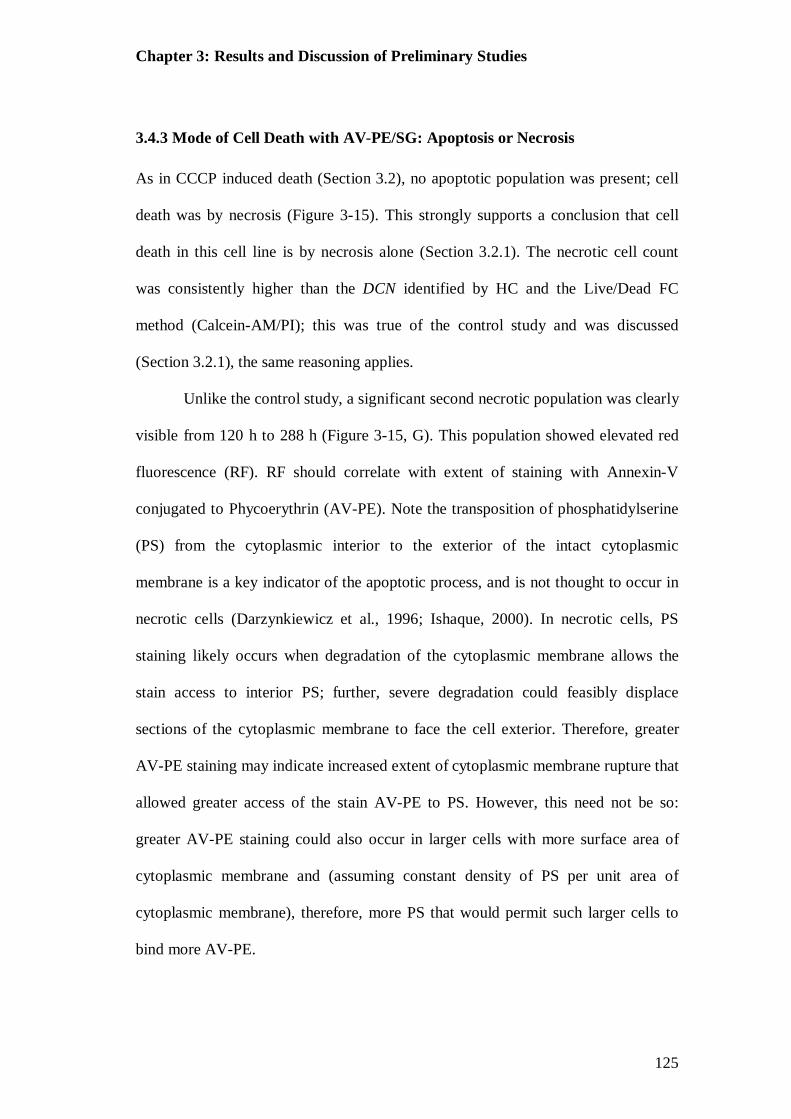
Chapter 3: Results and Discussion of Preliminary Studies
125
3.4.3 Mode of Cell Death with AV-PE/SG: Apoptosis or Necrosis
As in CCCP induced death (Section 3.2), no apoptotic population was present; cell
death was by necrosis (Figure 3-15). This strongly supports a conclusion that cell
death in this cell line is by necrosis alone (Section 3.2.1). The necrotic cell count
was consistently higher than the DCN identified by HC and the Live/Dead FC
method (Calcein-AM/PI); this was true of the control study and was discussed
(Section 3.2.1), the same reasoning applies.
Unlike the control study, a significant second necrotic population was clearly
visible from 120 h to 288 h (Figure 3-15, G). This population showed elevated red
fluorescence (RF). RF should correlate with extent of staining with Annexin-V
conjugated to Phycoerythrin (AV-PE). Note the transposition of phosphatidylserine
(PS) from the cytoplasmic interior to the exterior of the intact cytoplasmic
membrane is a key indicator of the apoptotic process, and is not thought to occur in
necrotic cells (Darzynkiewicz et al., 1996; Ishaque, 2000). In necrotic cells, PS
staining likely occurs when degradation of the cytoplasmic membrane allows the
stain access to interior PS; further, severe degradation could feasibly displace
sections of the cytoplasmic membrane to face the cell exterior. Therefore, greater
AV-PE staining may indicate increased extent of cytoplasmic membrane rupture that
allowed greater access of the stain AV-PE to PS. However, this need not be so:
greater AV-PE staining could also occur in larger cells with more surface area of
cytoplasmic membrane and (assuming constant density of PS per unit area of
cytoplasmic membrane), therefore, more PS that would permit such larger cells to
bind more AV-PE.

Chapter 3: Results and Discussion of Preliminary Studies
126
To differentiate between the two necrotic populations the lower RF
population is referred to as ‘early necrotic’ and the higher RF as ‘late necrotic’, with
RF indicative of PE-AV staining increasing from early to late necrotic.
Light scattering can be used as an indicator of cell size and internal
‘granularity’. Larger cells might exhibit greater FS. Heavily degraded cells might
exhibit lower SS, having lost intracellular constituents from the disrupted
cytoplasmic membrane. Light scattering properties of viable and necrotic cells have
been discussed (Section 3.2.1).
When the late necrotic population was back gated to a FS-SS cytograph it
exhibited the same light scattering characteristics as the cells with lower AV-PE
staining (not shown). The equivalence of FS and SS between the two necrotic
populations with differing levels of AV-PE staining does not provide evidence for a
difference in cell membrane integrity or cell size that might explicate AV-PE
between the two populations. However, light scattering properties have been shown
to be an imprecise indicator of cells’ morphology (Section 3.2.1). It is certainly
possible that further cytoplasmic membrane degradation did not result in any further
change to the cells’ internal milieu, and, equally, that cell size was not accurately
indicated by light scattering. In summary, elevated RF, as an indicator of elevated
AV-PE staining, could be attributed to elevated cytoplasmic membrane degradation
or larger cell size. Consideration should therefore be given to the mechanisms
underlying the extent of cytoplasmic degradation and the size of cells. The culture
environment could influence both.
Chapter 3: Results and Discussion of Preliminary Studies
127
Figure 3-15: Fed-batch stirred tank reactor (STR) (Section 3.4) cytographs created at time points corresponding to those in the growth curves presented in Figure 3-11 and Figure 3-12: GS-CHO cells stained with Annexin V conjugated to phycoerythrin (AV-PE) used with Sytox Green (SG), (AV-PE/SG) (Section 2.11.6); green fluoresce v red fluorescence (GF-RF).
0 h 24 h 48 h 72 h 96 h
120 h 144 h 168 h 192 h 216 h
240 h 264 h 288 h 312 h 336 h
360 h 384 h 408 h 432 h 456 h 480 h
Green Fluorescence
Green Fluorescence
Green Fluorescence
Green Fluorescence
Red Fluorescence Red Fluorescence Red Fluorescence Red Fluorescence Red Fluorescence Red Fluorescence
G
Chapter 3: Results and Discussion of Preliminary Studies
128
The late necrotic population was observed in the first sample taken from the
STR after substrate feeding began at 96 h. This also coincided with the drop in pH
from 7.1 to 6.8. (Note: pH was deliberately allowed to fall from 7.1 to 6.8 and was
successfully controlled at 6.8 ± 0.1, Section 2.6). From 96 h to 120 h, the osmolality
had also risen sharply from 325 mOsm kg-1 to 350 mOsm kg-1, reaching a plateau of
375 mOsm kg-1 at 160 h. The population of dead cells revealed by Live/Dead cell
count on the FC and HC was negligible at 120 h, when the ‘late necrotic’ sub-
population first appeared. The disappearance of the ‘early necrotic’ population at
312 h corresponded to the beginning of a rapid decline in culture viability (Figure
3-12), at that point the necrotic population was singularly ‘late necrotic’.
Since a sub-population of viable cells can be severely ruptured by the
staining method, one might reasonably expect gross damage to occur to necrotic
cells, which already exhibit membrane degradation; this process may explain the
replacement of the ‘early necrotic’ with the ‘late necrotic’ population. The ‘late
necrotic’ population could therefore provide an indicator of culture stress.
Chapter 3: Results and Discussion of Preliminary Studies
129
3.5 Cell Culture Data
3.5.1 Glucose and Glutamate
Glucose, as the primary carbon source for cell growth, and glutamate, the primary
nitrogen source (Xie and Wang, 1994), were provided by a substrate feed. Feeding
rate was controlled to maintain glucose between 3 and 6 g L-1.
GS-CHO cells are able to utilise glutamate to produce their own glutamine
(Zhang et al., 2006), and the substrate feed was glutamine free. Glutamine was not
provided for two good reasons. First, cells without the strong expression of the GS
transcript, which confers antibody production, will, it is hoped, be nitrogen limited
when glutamine concentration is low; this should provide a selection pressure for
productive cells even in absence of MSX, which is used to suppress endogenous
glutamine synthetase activity during producer-cell selection. Second, glutamate
feeding generally results in a lower ammonia concentration in the culture than
glutamine feeding (Zhang et al., 2006). In cells without GS, glutamate is unlikely to
support such high levels of growth (Capiaumont et al., 1995) and the GS transcript
should confer a growth advantage in glutamine free medium.
Surplus glutamine was found to accumulate (Figure 3-16), in accordance
with (Zhang et al., 2006). Although this removed selection bias for GS cells, it did
not appear to be accompanied by loss of the GS transcript and proliferation of cells
unburdened with antibody production, which would have been indicated by a fall in
specific antibody production (qIgG) that was accompanied by increased µ. Thus, it is
inferred that the cell line was stable, in accordance with a comprehensive study of
GS-CHO stability by Porter et al. (2007).
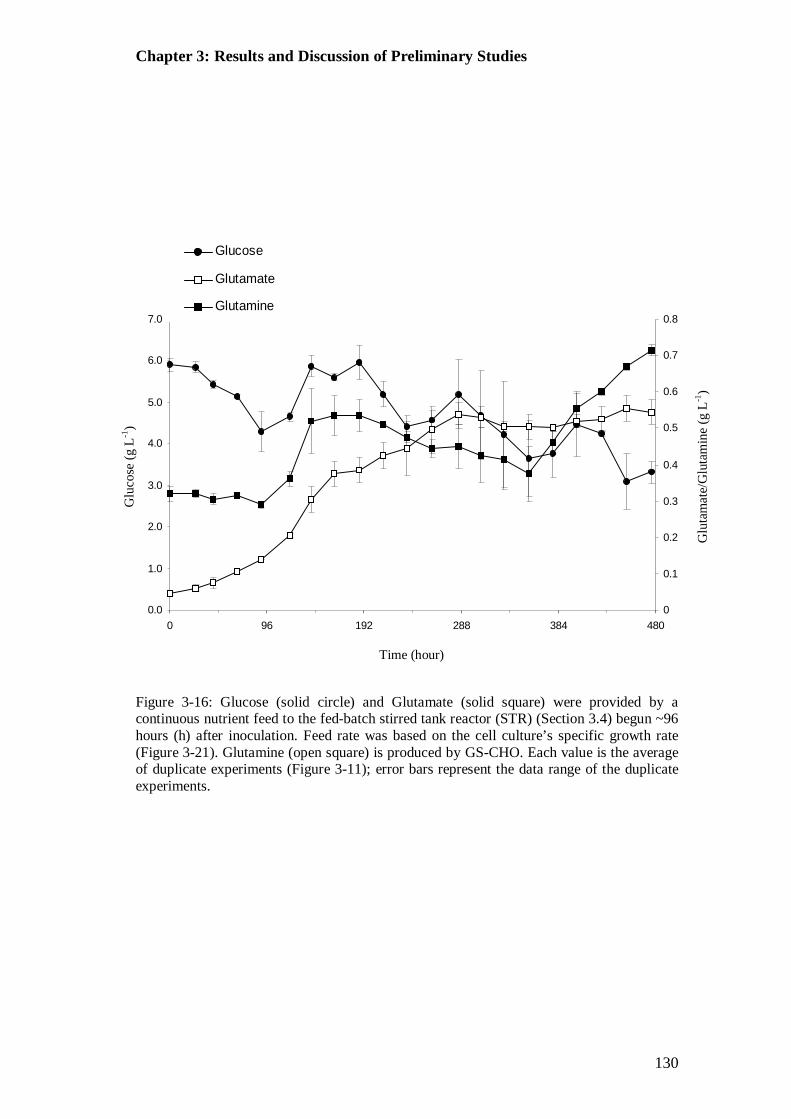
Chapter 3: Results and Discussion of Preliminary Studies
130
Figure 3-16: Glucose (solid circle) and Glutamate (solid square) were provided by a continuous nutrient feed to the fed-batch stirred tank reactor (STR) (Section 3.4) begun ~96 hours (h) after inoculation. Feed rate was based on the cell culture’s specific growth rate (Figure 3-21). Glutamine (open square) is produced by GS-CHO. Each value is the average of duplicate experiments (Figure 3-11); error bars represent the data range of the duplicate experiments.
0.0
1.0
2.0
3.0
4.0
5.0
6.0
7.0
0 96 192 288 384 4800
0.1
0.2
0.3
0.4
0.5
0.6
0.7
0.8
Glu
cose
(g L
-1)
Time (hour)
Glu
tam
ate/
Glu
tam
ine
(g L
-1)
0
1 0
0
0 1 0
Glucose
Glutamate
Glutamine

Chapter 3: Results and Discussion of Preliminary Studies
131
Feeding began after 96 h or when the viable cell number (VCN) reached 10 x 105
cells mL-1, whichever was sooner. In this culture, feed was initiated at 96 h, which
coincided with the VCN exceeding 10 x 105 cells mL-1. When feeding began, it
created an immediate rise in the levels of glucose and glutamate (Figure 3-16).
Glucose consumption could not be measured during these STR runs because of
equipment limitations. Glucose consumption has been found to correlate well with
lactate production in mammalian cell culture (Hu et al., 1987). However, the lactate
profile of this culture included a significant period of lactate consumption (Figure
3-17; Section 3.5.3); this type of metabolic behaviour remains to be elucidated and
precludes an inferred estimate of glucose consumption.
As antibody production is allied to growth and is greatly decreased when the
rapid growth phase ends (Section 3.6), glucose that was consumed in the stationary
phase must have been required almost entirely for maintenance of cell homeostasis
(Bailey and Ollis, 1986), referred to as maintenance energy. The increase in
maintenance energy throughout the stationary phase likely reflects the increasing
burden placed on the cell population by rising lactate, ammonia, and osmolality.
Note that the change in glucose and glutamine concentration (Figure 3-16) is not a
good indicator of consumption rate, because feed rate was altered every 24 h to
maintain glucose at 3-6 g L-1.
3.5.2 pH
The pH of the culture was controlled by the addition of a bicarbonate alkali (Section
2.6). The STR began at pH 7.1 and pH was allowed to gradually fall until it had
reached pH 6.8, after ~100 h. For the remainder of the culture period the STR was
controlled with alkali and CO2 at pH 6.8 ± 0.1. There was no observed difficulty

Chapter 3: Results and Discussion of Preliminary Studies
132
controlling the culture within this dead-band (i.e., the pH did not oscillate markedly
around the setpoint). The pH began to drop from 7.1 soon after the substrate feed
commenced at 90.5 h, and by 120 h had reached pH 6.8. Being highly acidic (pH
2.5), the substrate feed was almost certainly implicated in the pH drop; it is likely
that lactate accumulation until ~192 h also contributed greatly (Figure 3-17). It was
noted that alkali was required to prevent the culture falling below pH 6.79;
unfortunately, because of equipment limitations this could not be quantitatively
recorded, substrate feed, lactate and alkali contributed to an increased medium
osmolality (Figure 3-19).
A pH shift was created to optimise conditions for product titre and product
quality. No obvious decrease in viable cell number (VCN) and viability were
associated with the pH shift, implying that the rate at which pH fell was slow
enough for cells to acclimatize. pH perturbations, such as a rapid drop (order of
seconds or minutes) from pH 7.1 to pH 6.8, have been shown to decrease viability
(Osman et al., 2001)
3.5.3 Lactate
Lactate and ammonia are the predominant metabolites of animal cell culture
(Section 1.7.4.2). Lactate is a by-product of glycolytic glucose metabolism (Tsao et
al., 2005). Lactate accumulation occurred from the beginning of the culture, rising to
an initial peak value of ~2.5 g L-1 mid-way through the rapid growth phase (Figure
3-17). The specific rate of lactate production, qLactate, continued to fall throughout
the rapid growth phase and was unaffected by the start of feeding from 96 h (Figure
3-18).

Chapter 3: Results and Discussion of Preliminary Studies
133
From about 200 h, 48 h before the end of the rapid growth, lactate
concentration began to fall, falling rapidly less than 24 h before the stationary phase
began, and reaching its lowest point of 0.0 g L-1 48 h after the cell culture finished
its rapid growth phase. Much of the lactate consumption period was accompanied by
a stable ammonia concentration: either ammonia production had ceased or
production and consumption were balanced (Figure 3-17).
After reaching a minimum at the end of the rapid growth phase, the lactate
concentration then rose throughout the stationary and death phases, reaching a
maximum stable value in the last 48 h of culture, 3.0 g L-1, which corresponded to a
period of rapid decline in cell viability and indicates that metabolism had ceased
(accepting the unlikely possibility of increased metabolic efficiency at this stage). In
CHO cell culture, lactate concentration has been observed to inhibit cell growth
when above 5.22 g L-1 (58 mM) (Xing et al., 2008) and 5.4 g L-1 (60 mM) (Lao and
Toth, 1997). The relatively modest lactate values reached (3.0 g L-1) here were
unlikely to have greatly inhibited cell growth directly, but by increasing osmolality
may well have indirectly, as reported (Kurano et al., 1990a; Lao and Toth, 1997).
Osmolality is discussed (Section 3.5.5).
qLactate was greatest at the beginning of the culture (~35 pg lactate cell-1
h-1) decreasing with time to a minimum at the start of the stationary phase (Figure
3-18); It then rose slowly by less than 10 pg lactate cell-1 h-1 over the duration of the
culture period. This trend is in accordance with CHO cell and hybridoma cell
cultures found in the literature, as is the maximum and minimum qLactate (Kurano
et al., 1990a; Hayter et al., 1991; Ljunggren and Haggstrom, 1994; Godoy-Silva et
al., 2009b). Godoy-Silva et al. (2009b) observed a drop in qLactate throughout the
Chapter 3: Results and Discussion of Preliminary Studies
134
growth phase from a maximum value of 60 to a minimum of 30 in STR culture;
Hayter et al. (1991), from 45 to 0 in shake flask culture. Similar values are reported
for hybridoma culture (Ljunggren and Haggstrom, 1994).
In this culture, lactate accumulation was followed by a significant period of
lactate consumption (Figure 3-17), similar to that observed by Tsao et al., 2005,
although, unlike here, they did not not observe a significant resumption of lactate
production after consumption. Tsao et al., 2005 observed that pH had a profound
effect on lactate consumption in CHO cell culture experiments conducted at pH 7.4,
7.1 and 6.8. Lactate consumption was much at greater pH 6.8.
Here the lactate consumption period was concurrent with the transition from
rapid growth phase to the stationary phase (Figure 3-12) and is shows astonishing
congruence with the decline in specific antibody production rate (qIgG) and specific
growth rate (µ) (Figure 3-20 and Figure 3-21). Lactate production resumed in the
stationary phase and continued as viability fell.
Published reports of lactate consumption are few; nevertheless, it has been
reported that consumption of lactate is an attribute of ‘well performing industrial cell
culture’ (Mulukutla et al., 2010). This may be true, but, in accordance with the
results seen here, Li et al., 2010 reported (in an oral paper) that a strong correlation
is often seen between lactate depletion (later in culture duration) and acceleration of
viability decline and productivity plateau and speculate that lactate feeding may
benefit cultures where lactate is consumed after initial accumulation. Neither of
these two groups attempt to explicate lactate consumption.
Lactate production, in industrial, glucose fed, cell culture, typically results
from the high flux of glucose to pyruvate and supposed inefficient coupling between

Chapter 3: Results and Discussion of Preliminary Studies
135
glycolysis and the TCA cycle (Tsao et al., 2005). Aerobic lactate production is
atypical for normal diploid cell strains; here it likely to be an attribute of the highly
proliferative CHO cell strain, and is therefore akin to the Warburg effect reported in
similarly rapacious cancer cells (Vaquez et al., 2010; Dang and Semenza, 1999;
Warburg, 1930). Recent evidence that lactate is remetabolised as a prominent
substrate for oxidative tumour growth invites further comparison with cancer cells
(Sonveaux et al., 2008; Feron, 2009). Lactate consumption in industrial cell culture
has received less attention and has generally been associated with depletion of the
limiting substrate (usually, glucose) (Ozturk et al., 1992). If not to enable its
consumption, glucose limitation is typically observed to decrease lactate production
(Ljunggren and Haggstrom, 1994; Zhou et al., 1995; Europe et al., 2000).
Altamirano et al. (2006) reported significant co-metabolism of lactate and galactose
at limited levels of glucose.
In this study, however, glucose was maintained at between 3 and 6 g L-1. A
concentration considered amply sufficient. Limiting values in the literature are
somewhat lower, reported for CHO at 0.22 g L-1 (1.22 mM) (Lu et al., 2005) and
recombinant CHO (rCHO) at 1.08 g L-1 (6 mM) (Sun and Zhang, 2004); the elevated
substrate consumption of rCHO is attributed to requirements of recombinant protein
production. Efficient metabolism of glucose uses pyruvate for oxidative metabolism
instead of inefficient glycolysis. If glucose limitation often results in its efficient
utilisation and low lactate production, perhaps, in this case, an artificial glucose
limitation occurred.

Chapter 3: Results and Discussion of Preliminary Studies
136
Figure 3-17: Concentrations of lactate (solid line, closed square) and ammonia (solid line, open square) in the fed-batch stirred tank reactor (STR) (Section 3.4) were found using a Bioprofile analyser (Section 2.12) . Each value is the average of duplicate experiments (Figure 3-11); error bars represent the data range of the duplicate experiments.
Figure 3-18: Specific rate of production for lactate, qLactate, (solid line, closed square) and ammonia, qAmmonia, (solid line, open square) in the fed-batch stirred tank reactor (STR). Each value is the average of duplicate experiments (Figure 3-11); error bars represent the data range of the duplicate experiments.
-10
10
30
50
70
0 96 192 288 384 480-0.5
-0.25
0
0.25
0.5
0.75
1qLactateqAmmonia
qLac
tate
(pg
cell-1
h-1
)
Time (hour)
qAm
mon
ia (p
g ce
ll-1 h
-1)
0.0
1.0
2.0
3.0
4.0
0 96 192 288 384 4800
0.1
0.2
0.3
0.4 LactateAmmonia
Time (hour)
Lact
ate
(g L
-1)
Am
mon
ia (g
L-1
)

Chapter 3: Results and Discussion of Preliminary Studies
137
The maximum feasible rate of glucose transport into the cell or into the cell’s
mitochondria may have been insufficient to meet energy demand. Lactate
consumption may thus have provided rapidly growing cells with an additional
source of pyruvate for efficient oxidative generation of energy.
Lactate consumption may also have provided a means to increase NADH
concentration towards a desired cytosolic NADH/NAD+ redox state. Increased
NADH is unlikely to have directly benefited proliferation, as its main role is a
reducing agent for biosynthesis. The reported influence of extracellular pH (pHe) on
cellular control of redox state (Shafer and Buettner, 2001) may help to explain the
influence of pHe on lactate consumption, as observed by Tsao et al. (2005).
According to Le Chatelier’s principle, low pH should have favoured the
influx of weak acids, such as lactate. Thus, low culture pH may have provided a
sufficient proton gradient across the cell membrane for the energetically favourable
consumption of lactate. It is conceivable that glucose consumption was constrained
by a fundamental thermodynamic limit on the maximum possible proton gradient
across the mitochondrial membrane (Antinozzi et al., 2002). If this were the case,
lactate consumption could have provided the reducing equivalents needed to restore
or maintain a favourable redox environment at high rates of glucose oxidation.
On the one hand, lactate consumption may be indicative of the unmet
nutrient demands. On the other hand, glycolytic activity, and lactate production, may
be a prerequisite for a highly proliferative state of the cell culture, as is thought
generally to be the case in cancer cells (Xu et al., 2005;Vazquez et al., 2010), which
exhibit aerobic production of lactate (Warburg effect). Lactate consumption may
therefore reflect, and have at its origin, the concomitant change from rapid growth to
Chapter 3: Results and Discussion of Preliminary Studies
138
a stationary phase – this is supported by the utility of lactate-derived NADH for
biosynthesis and not growth. This could imply that insufficient reducing agents are
available for biosynthesis. In both cases, the concurrent decline in qIgG and µ
(Figure 3-21) may be remedied by lactate feeding, as suggested by Li et al., 2010.
Considering the possible importance of metabolism on product titre, a useful
further study might investigate the influence of dichloroacetate (DCA) on such cell
culture. As a treatment for lactic acidosis, DCA is reported to increase pyruvate
dehydrogenase activity, improve glucose utilisation, and lactate oxidation
(Stacpoole, 1983; Toth et al., 1993; Krishna et al., 1994). It is unknown how
manipulation of the lactate metabolism would influence ammonia production, which
ceased during the lactate consumption phase, implying a shift to glutamine
metabolism.
3.5.4 Ammonia
Ammonia 3NH is a by-product, or metabolite, (Section 1.7.4.4) of the glutamate
and glutamine metabolism (glutaminolysis), and is also produced by the thermal
degradation of glutamine (Butler, 2004a). Throughout the growth phase of the
culture, ammonia accumulated at a low rate until, after 160 h, it reached 0.09 g L-1
(5 mM). This ammonia concentration is reported to inhibit cell growth in CHO
culture (Hayter et al., 1991; Yang and Butler, 2000; Xing et al., 2008), and is more
than double a value reported to decrease cell viability and antibody productivity in,
clearly less robust, hybridoma cells (Reuveny et al., 1986). Contrary to the literature,
0.09 g L-1 was attained halfway through the rapid growth phase and viability and µ
remained stable.
Chapter 3: Results and Discussion of Preliminary Studies
139
It was probably a coincidence then that when the ammonia concentration
reached an initial maximum and plateau at 0.09 g L-1 it then remained stable, with a
slight decline, until the end of the rapid growth phase. At the beginning of the
stationary phase, VCN began to oscillate (Figure 3-11) and the ammonia
concentration once again began to increase (Figure 3-17). The ammonia
concentration of 0.25 g L-1 at 360 h coincided with an abrupt decline in viability
(Figure 3-11) and increase in osmolality (Figure 3-19). Before 360 h osmolality was
stable and low, while lactate was rising but low. Thus, only ammonia was at a
deleterious concentration when viability began to decline significantly. In the
absence of other obvious deleterious factors, this drop in viability strongly suggests
that ammonia accumulation was a key factor in the eventual rapid decline of the
culture.
As noted (Section 3.5.3), the plateau and slight decline in ammonia
concentration coincided with lactate consumption (Figure 3-17), beginning at
approximately the same time (~192 h), but ending ~24 h earlier (~264 h). In GS-
CHO cells, glutamine synthetase (GS) catalyses the condensation of ammonia and
glutamate to form glutamine (Barnes et al., 2000) and the majority of ammonia was
likely generated by metabolic hydrolysis of glutamine. Thus, the shift from
ammonia production to a steady-state in this period implies either that glutamine
hydrolysis to glutamate, and associated release of ammonia, did not occur or that
hydrolysis continued and the ammonia was stored or metabolised. Glutamine is a
valuable nitrogen and energy source (Newsholme et al., 2003a; Newsholme et al.,
2003b) and its hydrolysis is likely to have continued even as µ and qIgG fell. Thus,
the metabolism of ammonia, for elevated glutamine synthesis is in accordance with

Chapter 3: Results and Discussion of Preliminary Studies
140
the nutrient deprivation hypothesis mooted for lactate consumption, but because
glutamine is often a source of carbon for the tricarboxylic acid cycle (TCA) and
nitrogen for biosynthesis, such speculation does not clarify the utility of the
metabolic shift for the cells in culture. It is clear that a potentially desirable shift in
cell metabolism is concomitant with certainly undesirable shift in cell growth and
productivity kinetics; the order of cause and effect remains to be elucidated.
3.5.5 Osmolality
Compared to levels of metabolites (Sections 3.5.3 and 3.5.4), osmolality (Section
1.7.2) was relatively stable until 360 h (Figure 3-19). It rose from 300 mOsm kg-1 at
inoculation to an initial peak of 400 mOsm kg-1 at 160 h. The osmolality first began
to rise markedly at about 96 h, in parallel with substrate feeding to maintain glucose
and a requirement for alkali to maintain pH at the new setpoint of 6.8 (from 7.1).
Rising lactate production associated with glucose consumption probably provided a
significant contribution to osmolality, as indicated by the simultaneous peak in
lactate concentration and osmolality. The osmolality then fell, as lactate fell, to ~375
mOsm kg-1, remaining stable at ~375 mOsm kg-1 until the death phase. After 360 h,
as the culture entered the death phase, the osmolality was likely elevated by rising
metabolites (lactate, ammonia and glutamine), substrate concentrations, and the
alkali required to control the culture’s pH.
Osmolality is reported both to have inhibited cell growth and increased
specific antibody production (Ozturk and Palsson, 1990; Ozturk et al., 1992; Kimura
and Miller, 1996; Kim and Lee, 2002; Schmelzer and Miller, 2002; de Zengotia et
al., 2002). A large study on inhibitory threshold values reported that inhibition of
CHO cell growth did not begin until 382 mOsm kg-1 (Xing et al., 2008). Therefore,

Chapter 3: Results and Discussion of Preliminary Studies
141
the osmolality reached before the death phase may have shortened the rapid growth
phase, but was unlikely to have significantly decreased cell viability.
Elevation in osmolality from 316 to 450 mOsm kg-1 has been found to
decrease µ by 60% (Kimura and Miller, 1996; Zhu et al., 2005). Similarly, a 50%
decrease in viability was found when osmolality was increased from 320 to 450
mOsm kg-1 (de Zengotia et al., 2002). Thus, the increase in osmolality from 375 at
360 h to over 500 mOsm kg-1 at the end of this culture is likely to have contributed
greatly to rapid culture decline. In summary, osmolality did not appear to precipitate
decline of the culture; rather, it closely followed decline and likely eventually
attributed to the demise.
3.6 Fed-Batch STR Productivity: IgG Antibody Production
The specific immunoglobulin G antibody productivity (qIgG) rose to a peak of ~1.5
pg cell-1 h-1 at ~119 h (Figure 3-21), in the middle of the rapid growth phase. This
lag in production was probably the result of the cells’ adjustment to antibody
production: MSX, which inhibited GS transcription in the shake flask (Section 3.4.2)
and STR inoculum cultures, was no longer present in the STR culture. At the end of
the rapid growth phase, the culture had reached a peak of 820 mg mL-1 (rounded to 3
significant figures, 3.s.f., here and elsewhere). Antibody titre slowly increased
throughout the stationary phase to a maximum of 1020 mg mL-1 by the beginning of
the death phase. Antibody production ceased when the death phase began.
The specific rate of antibody production, qIgG, and the maximum antibody
titre (Figure 3-20 and Figure 3-21) were in accordance with those values provided
by Lonza for GS-CHO (Birch and Racher, 2006). Here, it is clear that qIgG was
associated with µ (Figure 3-21). Indeed ~80% of antibody production occurred in

Chapter 3: Results and Discussion of Preliminary Studies
142
the first 160 h. The decline in qIgG and µ was matched by a decline in metabolic
activity, as indicated by diminished qLactate and qAmmonia (Figure 3-18). Growth
associated antibody production, seen here, correlates well with the literature for
antibody production in CHO cell culture (Hayter et al., 1991; Chen et al., 2001;
Godoy-Silva et al., 2009b).
Nevertheless, the abrupt decline in qIgG that occurred at the end of the rapid
growth phase was not in accordance with the growth and antibody productivity
reported for GS-CHO by Birch and Racher (2006). They observed a continuous
linear increase in antibody titre from the beginning of the rapid growth phase and
continuing throughout much of the stationary phase. However, it is evident from the
contradictory reports in the literature that antibody production and its relationship to
cell growth can vary with cell line. For example, there are several reports of
antibody production – in hybridoma cells, at least – asserting that production was
restricted to the G1 and S phases of the cell cycle (Mccormick et al., 1984; Al-
Rubeai and Emery, 1990; Amos et al., 1992; Kromenaker and Srienc, 1994), yet this
restriction was not universally observed (Hayter et al., 1992b), and was clearly not
present in this GS-CHO cell line. It is concluded that antibody production of this
GS-CHO cell line was strongly allied to cell growth, following classic Luedeking-
Piret (Luedeking and Piret, 1959) production kinetics. There is insufficient evidence
to conclude that the decline in cell growth and commensurate decline in productivity
were precipitated by a metabolic shift (perhaps caused by unmet nutrient demands)
that resulted in lactate consumption (Section 3.5.3) and quiescence of ammonia
production (Section 3.5.4).

Chapter 3: Results and Discussion of Preliminary Studies
143
Figure 3-19: Medium osmolality in the fed-batch stirred tank reactor (STR) (Section 3.4) was found using a Bioprofile analyser (Section 2.12). Each value is the average of duplicate experiments (Figure 3-11); error bars represent the data range of the duplicate experiments.
300
350
400
450
500
550
600
0 96 192 288 384 480
Time (hour)
Osm
olal
ity (m
Osm
kg-1
)
0
1
0
0 1 0
Osmolality

Chapter 3: Results and Discussion of Preliminary Studies
144
Figure 3-20: IgG antibody titre (Section 2.13) for in the fed-batch stirred tank reactor (STR) (Section 3.4). Each value is the average of duplicate experiments (Figure 3-11); error bars represent the data range of the duplicate experiments.
Figure 3-21: Specific rate of antibody production, qIgG, (solid line, closed square) and specific growth rate, µ, (dashed line, open square) for GS-CHO culture in a fed-batch bioreactor. Each value is the average of duplicate experiments (Figure 3-11); error bars represent the data range of the duplicate experiments.
IgG Titre
0
1 0
0 1 0
IgG Titre
Time (hour)
0
200
400
600
800
1000
1200
0 40 80 120 160 200 240 280 320 360 400 440 480 520
IgG
Ant
ibod
y Ti
tre (m
g m
L-1)
-0.5
0.0
0.5
1.0
1.5
2.0
0 40 80 120 160 200 240 280 320 360 400 440 480 520-0.05
-0.04
-0.03
-0.02
-0.01
0
0.01
0.02
0.03
qIgG
(pg
cell-1
h-1
)
Time (hour)
µ (h
-1)
0
20
0 10
qIgG
Specific growth rate

145
Chapter 4: Results and Discussion of Scale-Down
4.1 Introduction
By seeking to create perturbations that were of similar magnitude and frequency to
those in a large-scale vessel, this study differs in two important aspects from the
only other known study of mammalian cell culture using a two-compartment scale-
down system (Osman et al., 2002). Firstly, it differs in the volume of the second
compartment, representative of the feed zone. In this study, the volume of the plug
flow reactor (PFR) was chosen as 5% of the volume of the laboratory-scale stirred
tank reactor (STR). Five percent represents the expected relative volume of the feed
zone in a large-scale stirred tank reactor STR. Osman et al. (2002) chose a
seemingly arbitrary 17% of the STR volume. They do not specify why this
percentage was chosen. The inflexibility of the STR+STR model (because glass
STR are made in standard sizes, and are expensive to have made bespoke) suggests
that 17% was fixed by vessel constraints, and not entirely by consideration of large-
scale heterogeneity. Secondly, it differs in the timing of perturbations: Osman et al.
(2002) created perturbations with a predefined regularity. Whereas in this study,
perturbations in pH were possible every time that alkali was required for pH control,
like the addition zone of a large-scale STR (Section 1.5).

Chapter 4: Results and Discussion of Scale-Down
146
4.2 Design of Scale-Down Experiments
In such a model, PFR volume, V, is selected to be proportional to the approximate
size of the concentration plume when an addition to the large-scale reactor is first
made. The volumetric flow rate, Q, is then manipulated so that the mean residence
time, RT, within the PFR is equal to the large-scale mixing time, θm. Assuming plug
flow, the PFR is designed thus:
1/3 1/3 2/3m 5.9 /T D T T 4-1
mRT 4-2
R
VRTQ
4-3
Based on earlier estimates of the volume of the region of elevated concentration
after feeding (feed zone) in a large-scale STR, the volume of the PFR used for this
study was 5% of the laboratory-scale STR volume (Namdev and Thompson, 1992;
Bylund et al., 1999; Amanullah et al., 2001; Hewitt and Nebe-Von-Caron, 2001).
The PFR was therefore 150 mL for the 3 L STR (Section 2.7).

Chapter 4: Results and Discussion of Scale-Down
147
Figure 4-1: Schematic of the control experiment and test case experiments. Showing a 150 mL plug flow reactor (PFR) made from a length of platinum cured silicone tubing (1.98 m length, 9.8 mm internal diameter and 1.6 mm wall thickness). In the control, additions were made only to the 5L stirred tank reactor (STR) (3 L working volume) (Section 2.7.1). In the test case, additions were made only to the entry point of the PFR (Section 2.7). For both control and test cases, recirculation from the STR through the PFR was continuous from day 0 and at a fixed flow-rate of either 150 or 75 mL min-1, creating a mean residence time in the PFR (RT) of 60 or 120 seconds (s).
Feed-zone (point of addition)
Scale-Down (Test Runs)
Control (PFR)
PFR
STR
PFR
Point of addition
STR
pH and O2 Probes (and in
Control)

Chapter 4: Results and Discussion of Scale-Down
148
4.3 Characterisation of PFR
RT Q
Maximum estimated drop
in DOTa
Maximum estimated drop in
glucoseb εmax in PFR
tubingc εmax in the STRd s mL min-1 % % W kg-1 W kg-1
60 150 17 0.3 0.04 1 120 75 35 0.15 0.009 1
Table 4-1: Flow characteristics of the plug flow reactor (PFR). Sample calculations are provided (Sections 4.3.1– 4.3.4).
4.3.1 Maximum estimated drop in DOT
Based on the assumption of plug flow (radial mixing, but not axial mixing), the
maximum drop in DOT (ΔDOT) created by cellular consumption of oxygen in the
PFR is calculated thus:
maxOxygenConsumption OUR VCN RT 4-4
100OxygenConsumedDOTDOT saturation
4-5
Where OUR, specific oxygen uptake rate, is assumed to be 3 x 10-13 mol O2 cells-1 h-
1 (Nienow and Langheinrich, 1996), tubing is assumed to be impermeable to
oxygen, VCNmax, the maximum viable cell number, is assumed to be 100 x 105
cells mL-1 and RT is equal to 60 s.
1353 10 100 10 60
3600OxygenConsumption
825 10OxygenConsumption x mol O
8
7
5 10 1002.9 10
DOT
17%DOT saturation

Chapter 4: Results and Discussion of Scale-Down
149
The ΔDOT is calculated using the DOT of water at 37oC saturated with O2 from air
sparged into the STR at atmospheric pressure. In all experiments in this study, the
DOT in the STR was 30% of air saturation (%); thus, the initial DOT of medium
entering the PFR was assumed to be at 30%, and a ΔDOT greater than 30% might be
expected to result in oxygen limitation.
4.3.2 Maximum estimated drop in Glucose
Using the same assumption of plug flow, the maximum estimated percentage drop in
glucose in the PFR (ΔGluc) can, likewise, be calculated:
GlucoseConsumption GUR VCN RT 4-6
100GlucoseConsumptionGlucGlucose Feed Concentration
4-7
Where GUR, glucose uptake rate, is assumed to be 54 pg glucose cell-1 h-1 (Hayter et
al., 1991), VCNmax is the assumed to be 100 x 105 cells mL-1 and RT is the expected
mean RT for cells in PFR.
1155.4 10 100 10 60
3600GlucoseConsumption
6 19 10GlucoseConsumption g mL
The percentage drop in glucose concentration, ΔGluc, is calculated using the glucose
concentration of the medium, which was maintained at 0.006 g mL-1 (6 g L-1) by
feeding (Section 2.6).
6
3
9 10 1006 10
Gluc
0.15%Gluc

Chapter 4: Results and Discussion of Scale-Down
150
4.3.3 Maximum Energy Dissipation Rate in the PFR
Flow is the PFR and connecting tubing was found to be in the laminar flow regime
(Section 4.3) and max, pipeE , W m-3, which occurs at the walls of the tubing, can
therefore be calculated according to Equation (8) in Mollet et al. (2004):
2
max, 2 6
16pipe
QER
4-8
Division by density, ρ, (1000 kg m-3) changes the units from W m-3 to W kg-1,
giving the following equation:
62
2
max,16
RQ
pipe 4-9
where ν, kinematic viscosity of the medium, was 1 x 10⁻⁶ m2s-1 (assumed to equal to
water). Q (m3 s-1) in the PFR was 150 mL min-1 (2.5 x 10⁻⁶ m3 s-1) and 75 mL min-1
(1.25 x 10⁻⁶ m3 s-1) for retention times of 60 s and 120 s, respectively. R, radius of
the pipe, was 3.2 mm for connection tubing, and 4.8 mm for the PFR. max, pipe was
generated in the connection tubing, as it had the smaller radius.
632
26
6max,
102.3141.3
1060
15016101pipe
14
106
max, 1006.1101101pipe
1max, 009.0 kgWpipe

Chapter 4: Results and Discussion of Scale-Down
151
4.3.4 Maximum Energy Dissipation Rate in the STR
Calculated according to equations for power input, P, and energy dissipation in a
STR (Equations 1-3 and 1-4 in Section 1.7), using the impeller diameter, D, and
agitation rate, N (Section 2.6).
53 DNPoP 4-10
53
055.06020010008.1
P
WP 034.0
VP
bulkT 4-11
003.01000
034.0
bulkT
1011.0 kgWbulkT
Im( )T ax is based on the assumption that Im( )T ax = 100 x ( )T bulk (Section 1.5). This
is one of the larger estimates reported in the literature (Section 1.5) and the resulting
axT Im should not be considered conservative. In any case, these factors are
generally unreliable as they critically depend on the volume chosen for the ‘impeller
region’ (Section 1.5).
100Im bulkTaxT 4-12
1Im 1 kgWaxT
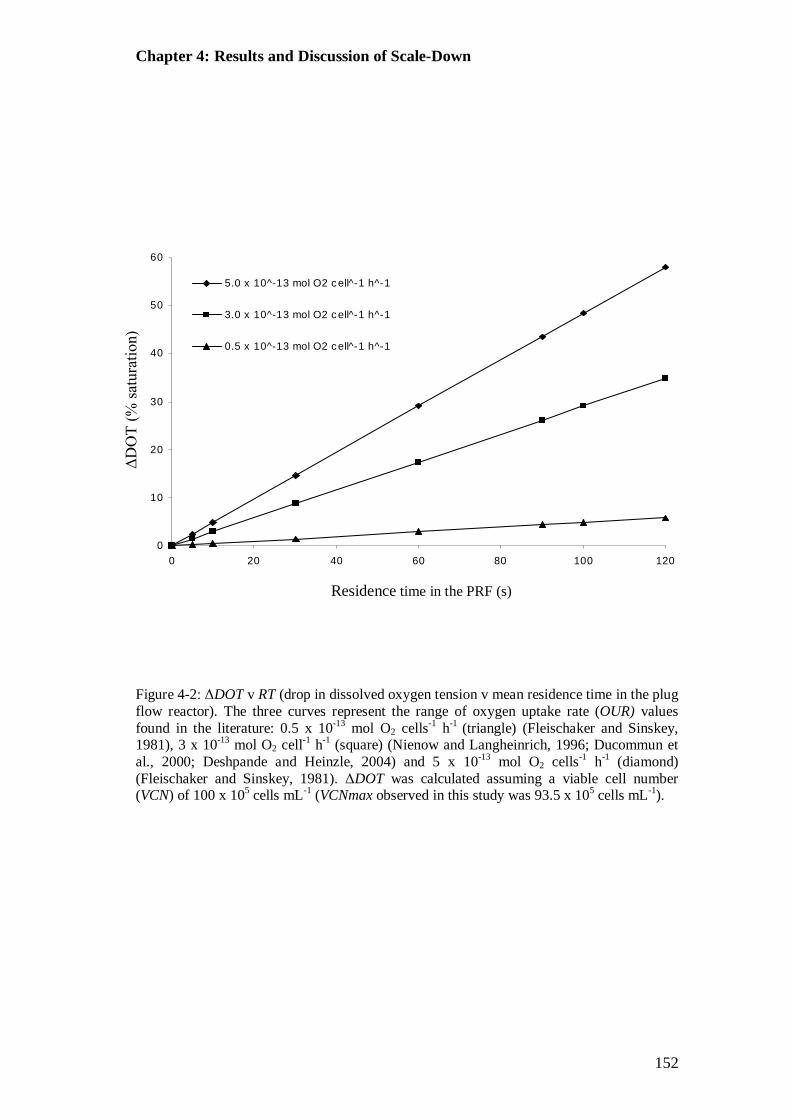
Chapter 4: Results and Discussion of Scale-Down
152
Figure 4-2: ΔDOT v RT (drop in dissolved oxygen tension v mean residence time in the plug flow reactor). The three curves represent the range of oxygen uptake rate (OUR) values found in the literature: 0.5 x 10⁻¹³ mol O2 cells-1 h-1 (triangle) (Fleischaker and Sinskey, 1981), 3 x 10-13 mol O2 cell-1 h-1 (square) (Nienow and Langheinrich, 1996; Ducommun et al., 2000; Deshpande and Heinzle, 2004) and 5 x 10-13 mol O2 cells-1 h-1 (diamond) (Fleischaker and Sinskey, 1981). ΔDOT was calculated assuming a viable cell number (VCN) of 100 x 105 cells mL-1 (VCNmax observed in this study was 93.5 x 10⁵ cells mL-1).
ΔD
OT
(% sa
tura
tion)
0
10
20
30
40
50
60
0 20 40 60 80 100 120
5.0 x 10^-13 mol O2 cell̂ -1 h^-1
3.0 x 10^-13 mol O2 cell̂ -1 h^-1
0.5 x 10^-13 mol O2 cell̂ -1 h^-1
Residence time in the PRF (s)
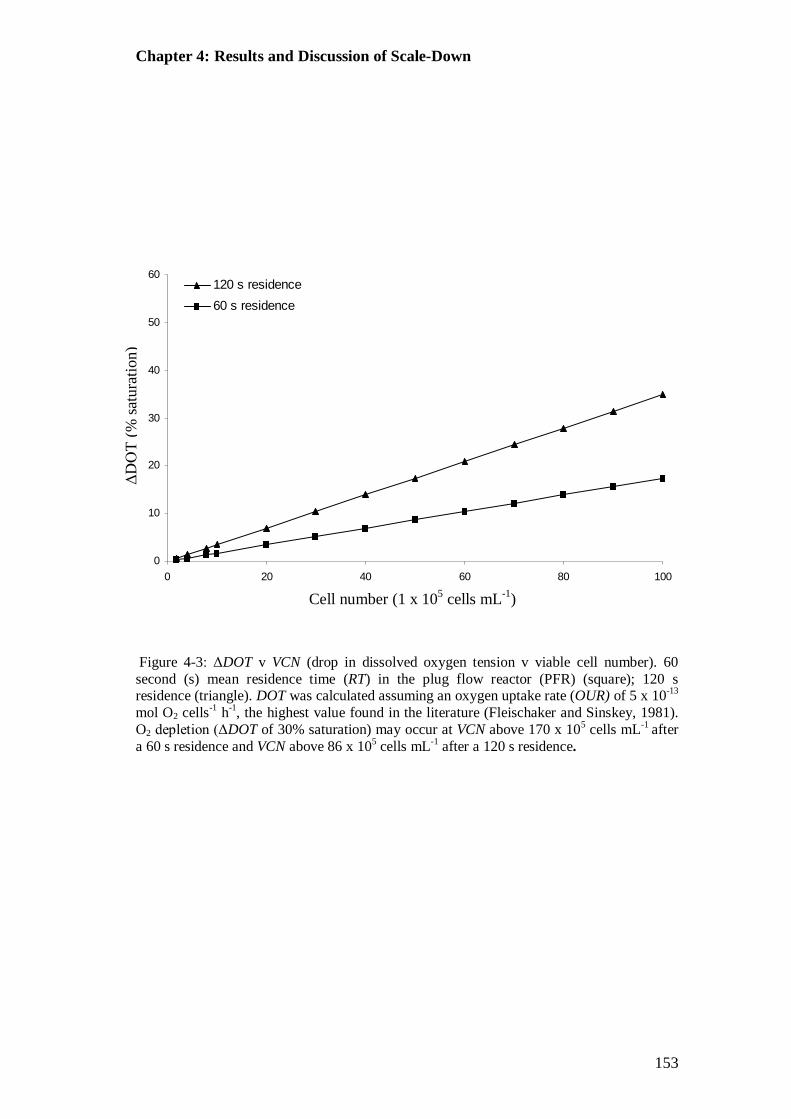
Chapter 4: Results and Discussion of Scale-Down
153
Figure 4-3: ΔDOT v VCN (drop in dissolved oxygen tension v viable cell number). 60 second (s) mean residence time (RT) in the plug flow reactor (PFR) (square); 120 s residence (triangle). DOT was calculated assuming an oxygen uptake rate (OUR) of 5 x 10-13 mol O2 cells-1 h-1, the highest value found in the literature (Fleischaker and Sinskey, 1981). O2 depletion (ΔDOT of 30% saturation) may occur at VCN above 170 x 105 cells mL-1 after a 60 s residence and VCN above 86 x 105 cells mL-1 after a 120 s residence.
ΔDO
T (%
satu
ratio
n)
0
10
20
30
40
50
60
0 20 40 60 80 100
120 s residence60 s residence
Cell number (1 x 10⁵ cells mL-1)

Chapter 4: Results and Discussion of Scale-Down
154
4.4 Results and Discussion
4.4.1 Comparison of Flow Cytometer and Haemocytometer
12 stirred tank reactor (STR) experiments (6 duplicates) were conducted (Section
2.7); haemocytometry (HC) and flow cytometry (FC) were both used to count
viable, dead and total cell number (VCN, DCN and TCN) (Sections 2.10 and 2.11).
To compare the two count methods, the difference between the VCN, DCN, TCN
and Viability for each time point in each STR was calculated by taking the HC value
from the FC value (e.g., ΔVCN = VCN FC - VCN HC); this gave 229 values for the
difference in VCN and DCN between the two methods. A statistical test (Shapiro
Wilk W test) for goodness of fit to the normal distribution showed that the values for
ΔVCN, ΔDCN, ΔTCN (ΔTCN = ΔVCN + ΔDCN) and ΔViability were insufficiently
normal to allow usage of a t-test for hypothesis testing. For data that are not
normally distributed non-parametric methods such as the Wilcoxon signed rank test
used here can provide a valid hypothesis test. With a null hypothesis that the mean
difference (Δ) between the two count methods was zero (Ho = 0), the results of the
test strongly support the following assertions: that, on average, throughout all of the
experiments, the TCN was significantly greater when measured by flow cytometry
(p < 0.05); that no significant difference between the two methods existed for VCN
(p > 0.05); that the DCN was significantly greater when measured by flow cytometry
(p < 0.05) (Table 4-2). The equivalence of the mean ΔTCN (9 ± 12) (expressed as
mean ± standard deviation, unless otherwise stated) and the mean ΔDNC (7 ± 9) and
the low mean ΔVCN (1 ± 10) strongly supports the conclusion that an elevated count
of dead cells is responsible for the greater TCN given by flow cytometry.

Chapter 4: Results and Discussion of Scale-Down
155
ΔVCN ΔDCN ΔTCN ΔViability
(1 x 10⁵ cells mL-1)
(%) Mean 1 7 9 -7 Std Dev 10 9 12 10 Std Err Mean 1 1 1 1 Upper 95% Mean 2 8 10 -6 Lower 95% Mean 0 6 7 -8 Number of values (N) 229 229 224 229 Hypothesized Value (Ho) 0 0 0 0 Actual Estimate (Ha) 1 7 9 -7 Degrees of Freedom 228 228 223 228 Test Statistic (Rank) 1463 11176 9171 -11307 Prob > |t| 0.1402 0.0001 0.0001 0.0001 Prob > t 0.0701 0.0001 0.0001 1 Prob < t 0.9299 1 1 0.0001
Table 4-2: Calculation of the mean difference between cell counts made using flow cytometry (FC) and haemocytometry (HC), showing the difference between counts of the viable cell number (VCN), dead cell number (DCN) and total cell number (TCN). ΔVCN = VCN FC – VCN HC. Non-parametric statistical analysis (Wilcoxon Signed Rank Test) was required because the distribution was not sufficiently normal for the familiar t-test. Rejection of null hypothesis (Ho) at P > 0.05; therefore, the mean ΔDCN, ΔTCN and Viability is statistically significant and the ΔVCN is insignificant. Cell number values rounded to the nearest 1 x 10⁵ cells mL-1.

Chapter 4: Results and Discussion of Scale-Down
156
Inspection of the data when plotted (Figure 4-4) suggests that the ΔDCN was
significant only in those experiments with recirculation and that, since ΔVCN was
insignificant in all experimental cases, ΔTCN too was significant only in
experiments with recirculation.
Equal variances are required for a comparison of means using the analysis of
variance (ANOVA) method to determine if a statistical difference exists between
means, and, if it does, whether any of the means are significantly larger or smaller
than the rest of the set of means. Unfortunately, the variances were found to be
unequal and ANOVA would not provide a useful result. However, it is still possible
to perform a non-parametric matched-pair test to establish the significance of the
difference. This test establishes if the difference between two means is statistically
significant.
Comparison of the mean ΔDCN was made between three experimental cases:
fed-batch STR (STR) without recirculation in the PFR (Experiment 1), Control STR
with recirculation in the PFR at a 60 s mean residence time, but with feeding to the
STR (Experiment 2) and test cases with recirculation and feeding to the PFR
(Experiments 3, 4, 5 and 6 combined).
Before comparison of the three cases, the mean ΔDCN for each of the three
cases was tested separately against the null hypothesis, Ho, that the mean ΔDCN,
was zero, i.e., Ho=0. This test indicated that in all of the three cases, with and
without recirculation, there was a statistically significant difference between the
DCN found by HC and FC, ΔDCN (Table 4-3); furthermore, ΔDCN was almost
fivefold greater for both experimental cases with recirculation than without (Table
4-3). Thus, it may reasonably be inferred that some aspect of recirculation greatly

Chapter 4: Results and Discussion of Scale-Down
157
increased the count difference between HC and FC so that the DCN was
significantly greater when measured by FC than by HC.
The following comparison of means establishes if there was a statistically
significant difference in the ΔDCN between the above three experimental cases:
without recirculation, with recirculation but feeding to the STR, and with
recirculation and feeding to the PFR. The difference between the mean ΔDCN was
found by subtracting the mean ΔDCN for each case (e.g., mean ΔDCN of
Experiments 3, 4, 5 and 6 – mean ΔDCN of Experiment 1). These values were then
tested against the null hypothesis that there was zero difference, on average, between
the ΔDCN found in each of the three experimental cases, i.e., ΔDCN was equal for
the three cases, Ho = 0.
As implied by the roughly fivefold greater ΔDCN found for experiments
with recirculation, recirculation cases had a significantly greater ΔDCN than cases
without recirculation. There was no significant difference between ΔDCN for cases
with recirculation. (Table 4-4). In summary, the DCN found by FC was significantly
higher than the DCN found by HC for all experimental cases. However, the degree
to which the DCN found by FC exceeded the DCN found by HC, ΔDCN, was itself
significantly greater for experimental cases with recirculation than cases without
recirculation. There was no significant difference between ΔDCN for all cases with
recirculation. There was no significant difference in VCN given by both counting
methods, ΔVCN, for all experimental cases. Since there was no significant
difference between VCN for both count methods, but DCN was found to be
significantly greater by FC, then the TCN must be significantly greater by FC.
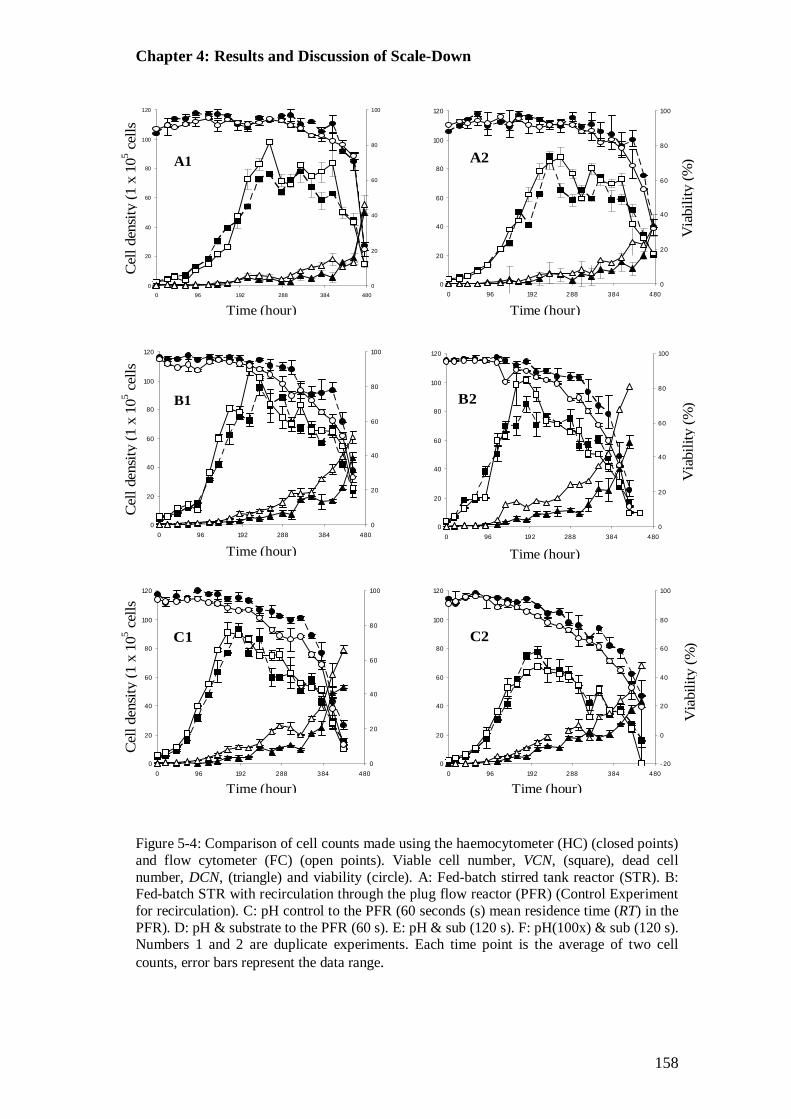
Chapter 4: Results and Discussion of Scale-Down
158
Figure 5-4: Comparison of cell counts made using the haemocytometer (HC) (closed points) and flow cytometer (FC) (open points). Viable cell number, VCN, (square), dead cell number, DCN, (triangle) and viability (circle). A: Fed-batch stirred tank reactor (STR). B: Fed-batch STR with recirculation through the plug flow reactor (PFR) (Control Experiment for recirculation). C: pH control to the PFR (60 seconds (s) mean residence time (RT) in the PFR). D: pH & substrate to the PFR (60 s). E: pH & sub (120 s). F: pH(100x) & sub (120 s). Numbers 1 and 2 are duplicate experiments. Each time point is the average of two cell counts, error bars represent the data range.
Time (hour)
Cel
l den
sity
(1 x
105 c
ells
A2
0
20
40
60
80
100
120
0 96 192 288 384 4800
20
40
60
80
100
Time (hour)
Cel
l den
sity
(1 x
105 c
ells
0
20
40
60
80
100
120
0 96 192 288 384 4800
20
40
60
80
100
B2
Time (hour)
Time (hour)Time (hour)
Cel
l den
sity
(1 x
105 c
ells
0
20
40
60
80
100
120
0 96 192 288 384 480
0
20
40
60
80
100
Via
bilit
y (%
)
Time (hour)
0
20
40
60
80
100
120
0 96 192 288 384 4800
20
40
60
80
100
C1
0
20
40
60
80
100
120
0 96 192 288 384 4800
20
40
60
80
100
Via
bilit
y (%
)
C2
0
20
40
60
80
100
120
0 96 192 288 384 480- 20
0
20
40
60
80
100
Via
bilit
y (%
)
A1
B1

Chapter 4: Results and Discussion of Scale-Down
159
Figure 5-4: Comparison of cell counts made using the haemocytometer (HC) (closed points) and flow cytometer (FC) (open points). Viable cell number (square), dead cell number (triangle) and viability (circle). A: Fed-batch stirred tank reactor (STR). B: Fed-batch STR with recirculation through the plug flow reactor (PFR) (Control experiment for recirculation). C: pH control to the PFR (60 seconds (s) mean residence time (RT) in the PFR, s). D: pH & substrate to the PFR (60 s). E: pH & sub (120 s). F: pH(100x) & sub (120 s). Numbers 1 and 2 are duplicate experiments. Each time point is the average of two cell counts, error bars represent the data range.
D1
0
20
40
60
80
100
120
0 96 192 288 384 4800
20
40
60
80
100
Time (hour)
Cel
l den
sity
(1 x
105 c
ells
D2
0
20
40
60
80
100
120
0 96 192 288 384 480- 20
0
20
40
60
80
100
Time (hour)
Via
bilit
y (%
)
F1
0
20
40
60
80
100
120
0 96 192 288 384 4800
20
40
60
80
100
Time (hour)
Cell
dens
ity (1
x 1
05 cel
ls
0
20
40
60
80
100
120
0 96 192 288 384 4800
20
40
60
80
100
E1
Time (hour)
Cel
l den
sity
(1 x
105 c
ells
F2
0
20
40
60
80
100
120
0 96 192 288 384 4800
20
40
60
80
100
Via
bilit
y (%
)
Time (hour)
E2
0
20
40
60
80
100
120
0 96 192 288 384 4800
20
40
60
80
100
Via
bilit
y (%
)
Time (hour)
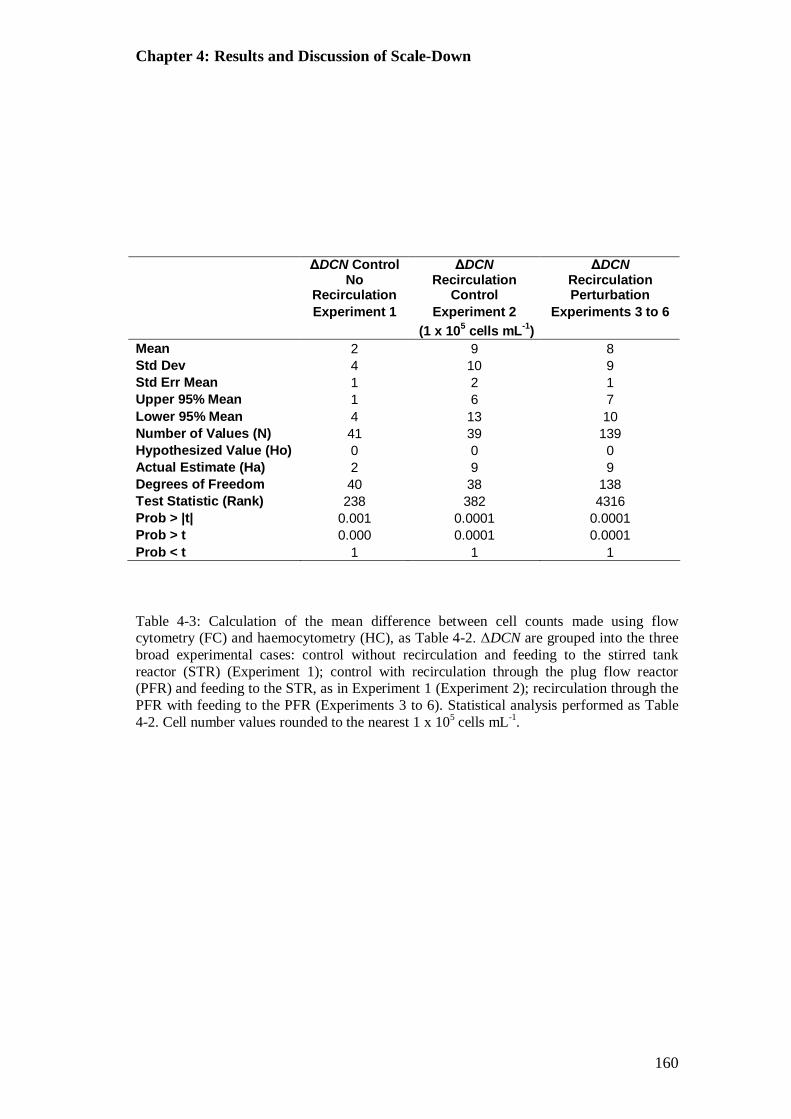
Chapter 4: Results and Discussion of Scale-Down
160
Table 4-3: Calculation of the mean difference between cell counts made using flow cytometry (FC) and haemocytometry (HC), as Table 4-2. ΔDCN are grouped into the three broad experimental cases: control without recirculation and feeding to the stirred tank reactor (STR) (Experiment 1); control with recirculation through the plug flow reactor (PFR) and feeding to the STR, as in Experiment 1 (Experiment 2); recirculation through the PFR with feeding to the PFR (Experiments 3 to 6). Statistical analysis performed as Table 4-2. Cell number values rounded to the nearest 1 x 10⁵ cells mL-1.
ΔDCN Control No
Recirculation
ΔDCN Recirculation
Control
ΔDCN Recirculation Perturbation
Experiment 1 Experiment 2 Experiments 3 to 6 (1 x 10⁵ cells mL-1) Mean 2 9 8 Std Dev 4 10 9 Std Err Mean 1 2 1 Upper 95% Mean 1 6 7 Lower 95% Mean 4 13 10 Number of Values (N) 41 39 139 Hypothesized Value (Ho) 0 0 0 Actual Estimate (Ha) 2 9 9 Degrees of Freedom 40 38 138 Test Statistic (Rank) 238 382 4316 Prob > |t| 0.001 0.0001 0.0001 Prob > t 0.000 0.0001 0.0001 Prob < t 1 1 1

Chapter 4: Results and Discussion of Scale-Down
161
Table 4-4: Calculation of the mean difference between cell counts made using flow cytometry (FC) and haemocytometry (HC), as Table 4-2. ΔDCN are grouped into the three broad experimental cases: control without recirculation and feeding to the stirred tank reactor (STR) (Experiment 1); control with recirculation through the plug flow reactor (PFR) and feeding to the STR, as in Experiment 1 (Experiment 2); recirculation through the PFR with feeding to the PFR (Experiments 3 to 6). Statistical analysis performed as Table 4-2. Cell number values rounded to the nearest 1 x 10⁵ cells mL-1.
Recirculation Control - Control No Recirculation
Recirculation Perturbation -
Control No Recirculation
Recirculation Perturbation - Recirculation
Control
Experiments (2) - (1) (3 to 6) - (1) (3 to 6) - (2)
Rank 328 317 57.5
Prob > |z| 0.0001 0.0001 0.43
Prob > z 0.0001 0.0001 0.21
Prob < z 1 1 1

Chapter 4: Results and Discussion of Scale-Down
162
As noted, ΔVCN was statically insignificant and VCN was therefore
equivalent for both analysis methods during all experiments. Based on the good
accordance in VCN between the two different methods, one should be confident that
its value was correct, accepting, of course, that VCN could have been equally
incorrect for both count methods. The same confidence cannot be extended to DCN.
The large and statistically significant ΔDCN found in experiments with recirculation
and the small and insignificant difference found in experiments without recirculation
clearly implies that the recirculation altered the cell culture in a way that led to an
erroneous DCN in at least one of the two counting methods. Bearing in mind that the
FC DCN was on average greater that the HC DCN, to determine where the fault lies,
one should consider the causes of an artificially low cell count from the HC and of
an artificially high cell count from the FC.
There is only one plausible cause for an artificially low DCN found by HC:
the extra dead cells were consistently ignored during the cell count. As discussed
(Section 1.10), HC is subjective, and relies of the user’s judgement to discriminate
between viable and dead cells (with the aid of TB to stain dead cells) and to count
them accurately while ignoring cell debris, such as fragments of cell wall and cell
nuclei that are released from lysed cells. Since the same person made all counts with
the HC, it might be expected that any error in the count method would have occurred
for all experiments, and not just those with recirculation. One of the duplicate STR
for experiment 1 (no recirculation control case) was performed after Experiment 2
and 3 (recirculation cases), and any change in technique after conducting the first
experiment can therefore be discounted. Thus, it is likely that the HC count was
consistent. The FC is somewhat more complicated than the HC and, in turn,

Chapter 4: Results and Discussion of Scale-Down
163
counting can be subject to more complications. Error can be introduced by several
means: poor alignment, poor choice of gate and enumeration of particles that closely
resemble cells. Alignment and gating rely partly on judgement (although methods
for alignment minimise error, Section 2.11.3); cell enumeration is performed solely
by the instrument, but the final ratiometric count does rely on gating of fluorescent
spheres of know concentration (Section 2.11.4). Each will be discussed in turn.
Poor alignment is unlikely to have occurred, thanks to measures used to test
the alignment before each sample run (Section 2.11.3). Nevertheless, had it
occurred, it is unlikely to have persisted for more than one sample date because the
FC was aligned before each sample and had multiple users known to conduct regular
alignment. Furthermore, poor alignment would probably have also altered VCN and
not DCN alone. One can be confident that poor alignment did not create a consistent
elevation of the DCN.
Gating was applied at two levels: first, a forward scatter light v side scatter
light (FS-SS) gate to select the cells, instead of debris or other particulates, on the
basis of their refractive index and light scattering (Section 1.10.3); second, a green
fluorescence v red fluorescence (GF-RF) gate (or quadrant) to group this selection
into live and dead cells based on their staining with Calcein-AM/PI (Section 2.11.5).
Thus, improper choice of gate could result in the selection of particles other than
cells, such as debris, and subsequent incorrect apportioning of the percentage live
and dead cells. As with poor alignment, any problem with gate selection was
unlikely to have persisted and would probably have altered the VCN.
Nevertheless, if cell debris sufficiently resembled the CHO cells in size,
shape and refractive index it could have been included in the first gate. To increase

Chapter 4: Results and Discussion of Scale-Down
164
the DCN, subsequent placement in the dead cell quadrant would be required,
indicating that the debris was stained with Propidium Iodide (PI) and thereby
suggesting, though not confirming, the presence of DNA. Intercalation with DNA
provides PI with hydrophobic conditions required for peak fluorescence (Section
1.10.2.1), but some non-specific binding may also occur (Shapiro, 2003a) and has
been suggested as a cause for the lower viability observed in a comparison of TB
and PI (Al-Rubeai et al., 1996). In this case, non-specific binding of PI to viable
cells cannot alone account for the greater DNC, since it would not have increased
the TCN, and would, by staining live cells, presumably have also decreased VCN.
Furthermore, as discussed (Section 3.2.2), non-specific binding of PI to cell debris,
or viable cells, should be revealed as a population with decreased red fluorescence
(RF).
If cell debris can be shown to be greater for experiments with recirculation,
then admission of cell debris by the first gate, and subsequent placement of that
debris in the dead cell quadrant provides a probable cause for the increase in DCN.
The FS-SS plots do indeed reveal that a considerable increase in cell debris was
present from about 120 h of culture in all of the experiments with recirculation
(Figure 4-4, Debris). Alternatively, the count found by HC was low for all
experiments with recirculation,
Thus, it is concluded that some aspect of experiments with recirculation
resulted in an elevated DCN and that cell debris, which is seen to be considerably
greater in experiments with recirculation, was probably responsible. It is thought
that a proportion of the cell debris present in experiments with recirculation (Figure
4-4, 2 – 6) was unavoidably included in the FS-SS gate for cells because the light

Chapter 4: Results and Discussion of Scale-Down
165
scattering properties of the cell debris were very similar to those of intact cells at
that stage in the culture. Light scattering and staining characteristics of the cell
debris candidate are considered below (Section 4.4.2 and Section 4.4.3). The
inclusion of cell debris in the cell count artificially increased the TCN. Cell debris
stained with PI appeared in the dead cell quadrant, increasing DCN and causing
viability (VCN/ (VCN+DCN)) to appear lower. The equivalence of TCN and DCN
suggests that all of the cell debris stained with PI. It should now be considered if the
cell debris that increased the DCN and TCN was already present in the STR or if it
was created by destruction of dead cells in the FC.
4.4.1.1 Creation of Cell Debris
Cell death in the STR often ends in lysis and disintegration of the cell (Goergen et
al., 1993), which very likely created the debris in the FS-SS plots; cell debris was
not observed in the fed-batch without recirculation experiment until a significant
decline in viability occurred in the final 48 h of the culture duration. In test cases
(experimental cases with recirculation), however, cell debris was present from 200 h
and was severe by 330 h, in accordance with the greater decline in viability from the
end of exponential growth (Figure 4-4). The quantity of cell debris in experiments
with recirculation appears to be so great that it suggests recirculation accelerated the
degradation of dead cells. Mechanisms by which recirculation could have generated
cell debris are discussed (Section 4.5).
If cell debris was not already present in the STR at the time of sampling, then
it would clearly have to have been created at some point during the sampling,
staining and analysis by FC. Mechanisms by which FC could result in cell death and
cell degradation have been discussed (Section 3.3.3), it was concluded that FC itself

Chapter 4: Results and Discussion of Scale-Down
166
was unlikely to have damaged cells, but that incubation and staining period may
have lowered viability. However, significant destruction of viable cells is effectively
ruled out by the equal VCN found for both count methods. Destruction of dead cells
by the FC would imply that dead cells from recirculation experiments had greater
susceptibility to catastrophic damage during the FC count; recirculation may well
have altered the physiology of the cells, and increased susceptibility to damage
cannot be ruled out. Possible aspects of recirculation that might alter cell physiology
are discussed (Section 4.5).
4.4.2 Cell Viability with Calcein-AM and PI: Live or Dead
The forward scatter light v side scatter light (FS-SS) cytographs (Figure 4-4) and the
green fluorescence v red fluorescence (GF-RF) cytographs (Figure 4-5) obtained for
viability assessment of experiments with recirculation were all equivalent. The
amount of debris was considerable higher in the recirculation experiments (from
experiments 2 to 6) (Figure 4-4, Debris); this was associated with considerably
lower viability and higher cell death and may therefore be attributed to high levels of
cell lysis and cell disintegration. Unlike the fed-batch STR experiment 1, the amount
of cell debris in the recirculation experiments from 2 to 6 was so great, and likely of
similar size to the cell population, that it was probably not fully excluded by gating
of the viable cell population. Cell debris was probably responsible for population A
in Figure 4-5.
Throughout much of the culture, the GF-RF cytographs (Figure 4-5) showed
that the cell population could be split into three populations, in accordance with GF-
RF cytographs for the fed-batch STR. However, in the recirculation experiments a
fourth population was present, characterised by high red fluorescence (RF),
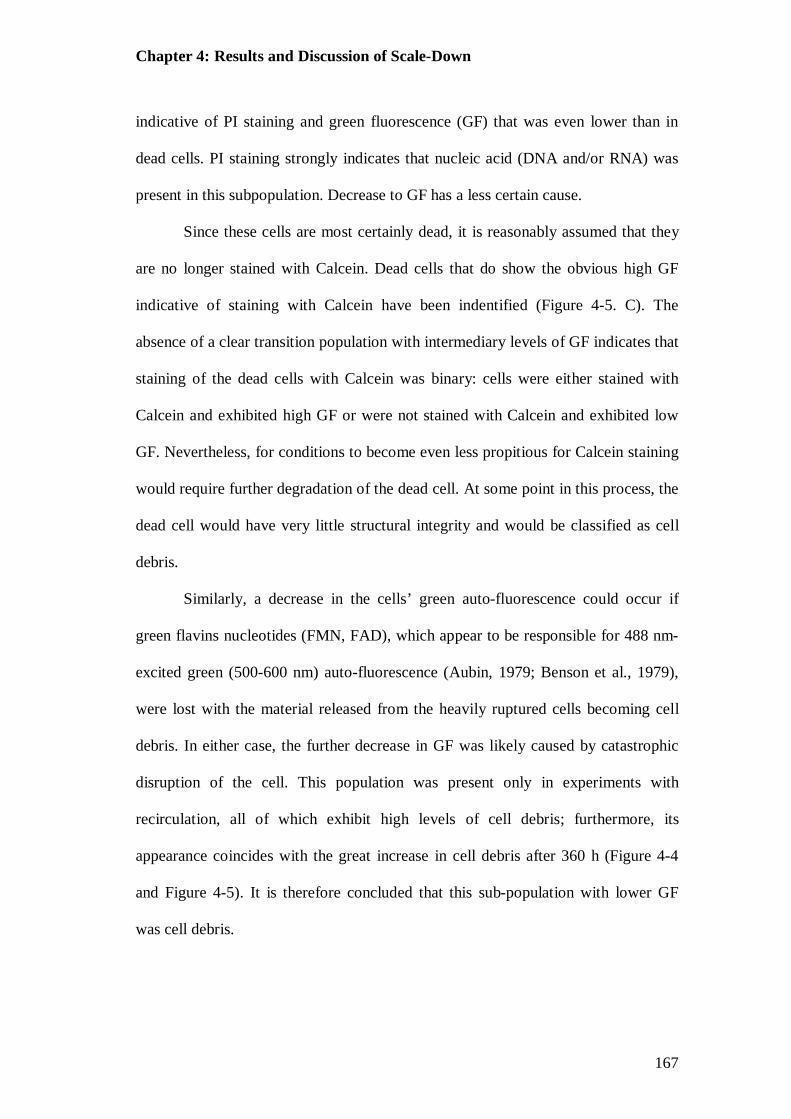
Chapter 4: Results and Discussion of Scale-Down
167
indicative of PI staining and green fluorescence (GF) that was even lower than in
dead cells. PI staining strongly indicates that nucleic acid (DNA and/or RNA) was
present in this subpopulation. Decrease to GF has a less certain cause.
Since these cells are most certainly dead, it is reasonably assumed that they
are no longer stained with Calcein. Dead cells that do show the obvious high GF
indicative of staining with Calcein have been indentified (Figure 4-5. C). The
absence of a clear transition population with intermediary levels of GF indicates that
staining of the dead cells with Calcein was binary: cells were either stained with
Calcein and exhibited high GF or were not stained with Calcein and exhibited low
GF. Nevertheless, for conditions to become even less propitious for Calcein staining
would require further degradation of the dead cell. At some point in this process, the
dead cell would have very little structural integrity and would be classified as cell
debris.
Similarly, a decrease in the cells’ green auto-fluorescence could occur if
green flavins nucleotides (FMN, FAD), which appear to be responsible for 488 nm-
excited green (500-600 nm) auto-fluorescence (Aubin, 1979; Benson et al., 1979),
were lost with the material released from the heavily ruptured cells becoming cell
debris. In either case, the further decrease in GF was likely caused by catastrophic
disruption of the cell. This population was present only in experiments with
recirculation, all of which exhibit high levels of cell debris; furthermore, its
appearance coincides with the great increase in cell debris after 360 h (Figure 4-4
and Figure 4-5). It is therefore concluded that this sub-population with lower GF
was cell debris.

Chapter 4: Results and Discussion of Scale-Down
168
The dual stained population (DSP), a population of cells stained with
Calcein-AM and PI, was 4.4 ± 0.3% (mean ± 95% confidence interval, N = 177) in
the experiments with recirculation and 3.5 ± 0.2% (N = 40) in the experiment
without. A hypothesis test (Wilcoxon Sign Rank Test) for Ho = 0 found the
difference between the two means insignificant (P > 0.05). Therefore, it cannot be
said that the DSP, perhaps representative of the proportion of less robust viable cells
in the culture, was greater in experiments with recirculation. Perhaps such cells did
not remain viable in the STR for long, and instead rapidly contributed to the DCN or
quantity of cell debris. The DSP was equivalent for all experiments with
recirculation, providing evidence that perturbations made in these scale-down
experiments had little effect on the culture viability.

Chapter 4: Results and Discussion of Scale-Down
169
Figure 4-4: Comparison of cytographs: forward scatter light v side scatter light (FS-SS) of unstained GS-CHO cells from all stirred tank reactor (STR) experiment, with and without recirculation through the plug flow reactor (PFR). Numbers 1 to 6 refer to experiments 1 to 6. Suspected cell debris is labelled as ‘Debris’.
1.
2.
3.
4.
5.
6.
0 h 120 h 240 h 360 h 480 h
0 h 120 h 240 h 360 h 456 h
0 h 120 h 240 h 360 h 432 h
0 h 120 h 240 h 360 h 456 h
0 h 120 h 240 h 360 h 432 h
0 h 120 h 240 h 360 h 432 h
Forw
ard
Scat
ter
Fo
rwar
d Sc
atte
r
Forw
ard
Scat
ter
Fo
rwar
d Sc
atte
r
Forw
ard
Scat
ter
Fo
rwar
d Sc
atte
r
Side Scatter
Side Scatter
Side Scatter
Side Scatter
Side Scatter
Debris

Chapter 4: Results and Discussion of Scale-Down
170
Figure 4-5: Comparison of cytographs: Calcein-AM/PI stained GS-CHO cells; green fluorescence v red fluorescence (GF-RF). Numbers 1 to 6 refer to experiments 1 to 6. A labels what is likely to be cell debris that could not be gated out of the sample; B labels dead cells, stained with PI; C labels cells thought to have died recently, stained with both Calcein-AM and PI.
Gre
en F
luor
esce
nce
G
reen
Flu
ores
cenc
e
Gre
en F
luor
esce
nce
Gre
en F
luor
esce
nce
G
reen
Flu
ores
cenc
e
Gre
en F
luor
esce
nce
120 h 240 h 360 h 480 h
120 h 240 h 360 h 456 h 0 h
0 h 120 h 240 h 360 h 432 h
0 h 120 h 240 h 360 h 456 h
0 h 120 h 240 h 360 h 432 h
0 h 120 h 240 h 360 h 432 h
0 h
Red Fluorescence
Red Fluorescence
Red Fluorescence
Red Fluorescence
Red Fluorescence
1.
2.
3.
4.
5.
6.
A
B
C

Chapter 4: Results and Discussion of Scale-Down
171
4.4.3 Mode of Cell Death with Annexin-V/PE and SG: Apoptosis or Necrosis
Cell death was, for all experiments, found to occur by necrosis (AV-PE positive, SG
positive), not by apoptosis (AV-PE positive, SG negative) (Figure 4-6), as was
observed in experiments using CCCP to induce cell death (Section 3.2.1), cell
culture in a shake flask (Section 3.3) and cell culture in a fed-batch STR (Section
3.4). Recirculation through the PFR, though observed to increase cell death, did not
alter the mode by which it occurred, nor did the introduction of pH and substrate
heterogeneity via the scale-down experiments.
This transition region (Figure 4-6, Transition) implies that staining
sometimes may not provide exact delineation of discrete population sub-groups.
Further, that the cells’ transition from viable to necrotic is unlikely to be
instantaneous and may instead be a continuum in which dying cells briefly share
staining characteristics of the more discrete viable and necrotic populations.
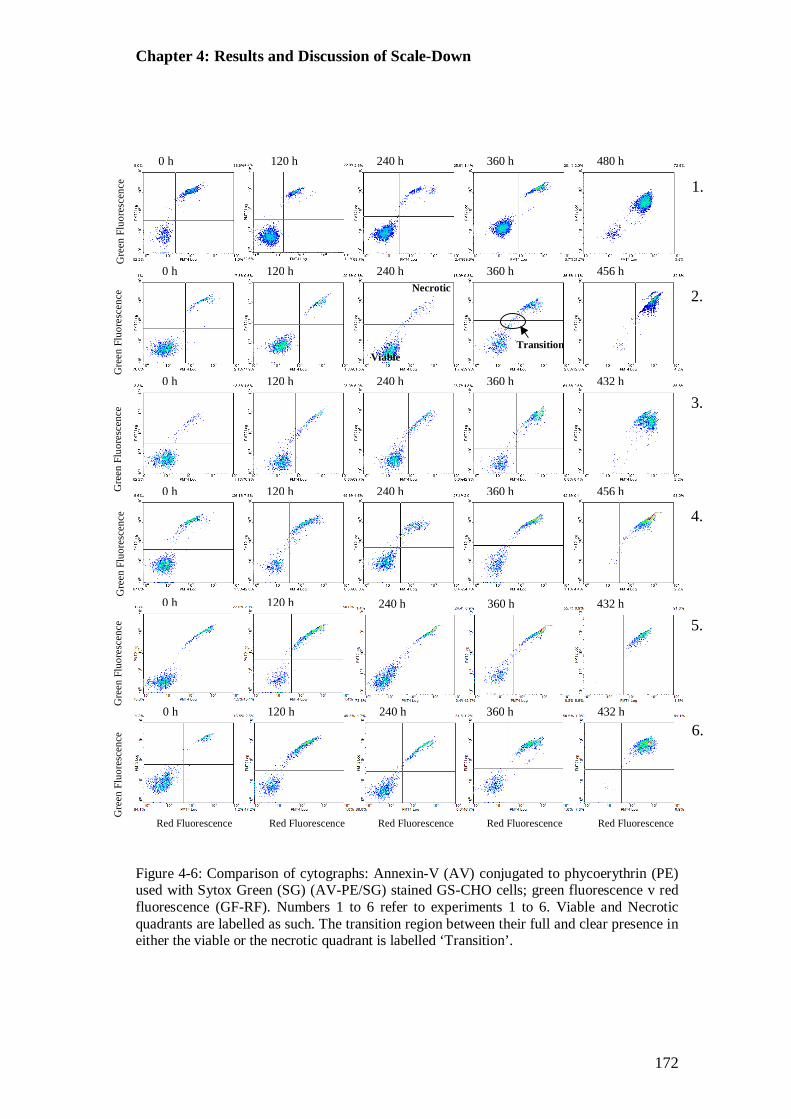
Chapter 4: Results and Discussion of Scale-Down
172
Figure 4-6: Comparison of cytographs: Annexin-V (AV) conjugated to phycoerythrin (PE) used with Sytox Green (SG) (AV-PE/SG) stained GS-CHO cells; green fluorescence v red fluorescence (GF-RF). Numbers 1 to 6 refer to experiments 1 to 6. Viable and Necrotic quadrants are labelled as such. The transition region between their full and clear presence in either the viable or the necrotic quadrant is labelled ‘Transition’.
Gre
en F
luor
esce
nce
G
reen
Flu
ores
cenc
e
Gre
en F
luor
esce
nce
Gre
en F
luor
esce
nce
G
reen
Flu
ores
cenc
e
Gre
en F
luor
esce
nce
120 h 240 h 360 h 480 h 0 h
0 h 120 h 240 h 360 h 456 h
0 h 120 h 240 h 360 h 432 h
0 h 120 h 240 h 360 h 456 h
0 h 120 h 240 h 360 h 432 h
0 h 120 h 240 h 360 h 432 h
Red Fluorescence
Red Fluorescence
Red Fluorescence
Red Fluorescence
Red Fluorescence
1.
2.
3.
4.
5.
6.
Necrotic
Viable Transition
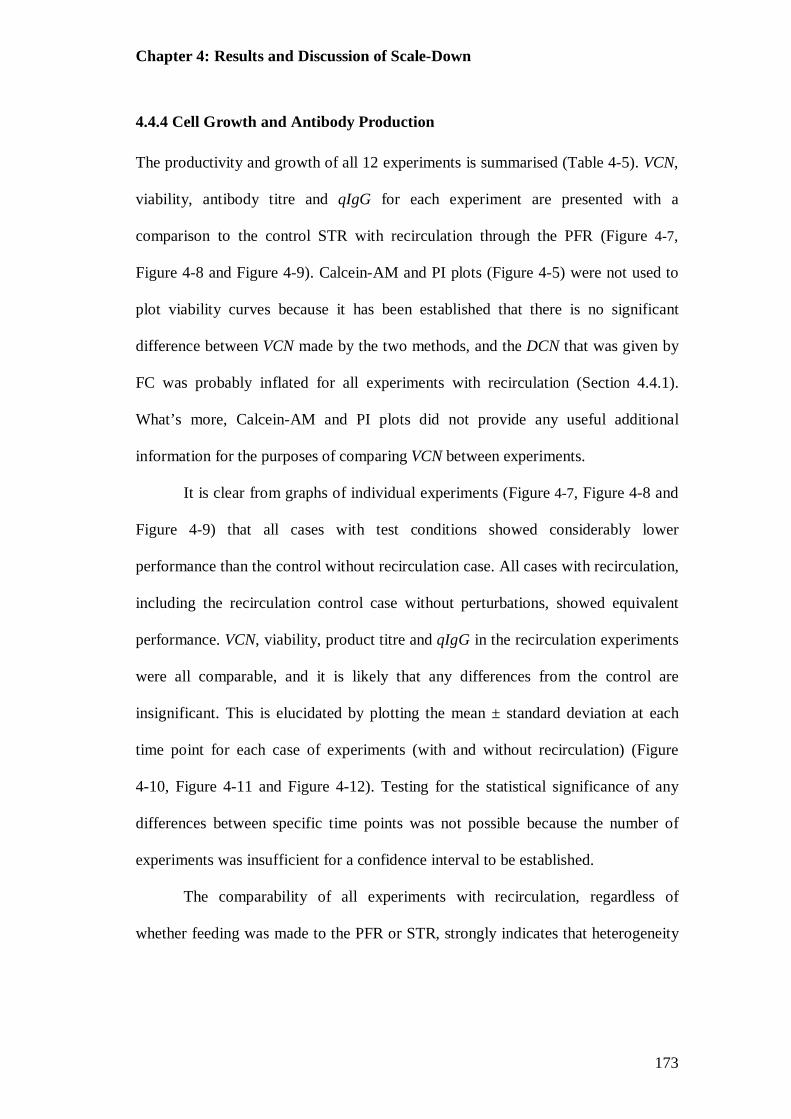
Chapter 4: Results and Discussion of Scale-Down
173
4.4.4 Cell Growth and Antibody Production
The productivity and growth of all 12 experiments is summarised (Table 4-5). VCN,
viability, antibody titre and qIgG for each experiment are presented with a
comparison to the control STR with recirculation through the PFR (Figure 4-7,
Figure 4-8 and Figure 4-9). Calcein-AM and PI plots (Figure 4-5) were not used to
plot viability curves because it has been established that there is no significant
difference between VCN made by the two methods, and the DCN that was given by
FC was probably inflated for all experiments with recirculation (Section 4.4.1).
What’s more, Calcein-AM and PI plots did not provide any useful additional
information for the purposes of comparing VCN between experiments.
It is clear from graphs of individual experiments (Figure 4-7, Figure 4-8 and
Figure 4-9) that all cases with test conditions showed considerably lower
performance than the control without recirculation case. All cases with recirculation,
including the recirculation control case without perturbations, showed equivalent
performance. VCN, viability, product titre and qIgG in the recirculation experiments
were all comparable, and it is likely that any differences from the control are
insignificant. This is elucidated by plotting the mean ± standard deviation at each
time point for each case of experiments (with and without recirculation) (Figure
4-10, Figure 4-11 and Figure 4-12). Testing for the statistical significance of any
differences between specific time points was not possible because the number of
experiments was insufficient for a confidence interval to be established.
The comparability of all experiments with recirculation, regardless of
whether feeding was made to the PFR or STR, strongly indicates that heterogeneity

Chapter 4: Results and Discussion of Scale-Down
174
in pH and substrate had little effect on important culture parameters: the
predominant influence on cell culture was recirculation through the PFR.
A 0.15% drop in glucose concentration (ΔGluc) in the PFR of was predicted
at 100 x 105 (Section 4.3.2). Since the VCNmax found in this study were less than 100
x 105 cells mL-1, glucose consumption in the PFR is unlikely to have influenced
performance of the cell culture (Table 4-1). At VCNmax, DOT in the PFR may have
dropped from 30% to close to 0% in experiments 5 and 6 (120 s residence), but is
unlikely to have dropped below 15% in experiments 2, 3, and 4 (60 s residence)
(Figure 4-2 and Figure 4-3).
For all recirculation experiments, at the end of the rapid growth phase,
viability began to drop significantly 24 hours (h) after the VCNmax was attained. All
the recirculation experiments were characterised by a shallow but clear decline in
cell viability from the end of their rapid growth phase; this contrasted with the fed-
batch STR, which exhibited an abrupt decline in cell viability after a stationary
phase in which viability was above 80% for approximately 192 h (Figure 4-10). This
difference indicates a differing cause for cell death.
In test experiments, the duration of the culture with recirculation was 428
± 18 h (mean ± standard deviation, N = 10) compared to 508 ± 45 h
(mean ± standard deviation, N = 2) for the experiment without recirculation. Note:
culture duration measures the point until viability fell below 30%; often 30%
viability was reached between samples taken every 24 h, meaning that the culture
was sometimes terminated below 30%, adding to the culture duration by a
theoretical maximum of 24 h.

Chapter 4: Results and Discussion of Scale-Down
175
In all experimental cases, protein production occurred predominantly during
rapid cell growth (Figure 4-9 and Section 3.6). Increased µ in all of the recirculation
experiments was not accompanied by elevated antibody titre (Figure 4-9), and
antibody titre was lower for experiments with recirculation (Figure 4-12). qIgG was
equivalently lower for experiments with recirculation (Figure 4-11). In all
experiments, approximately 20% of the antibody titre was produced in the stationary
phase. Thus, antibody titre was likely decreased by a combination of the shorter
duration of the productive rapid growth phase and the lower qIgG. It is possible that
recirculation placed a burden on the cells that meant some of their resources that
would have been directed towards antibody production were instead used to
maintain cellular integrity. The probable nature of any burden created by
recirculation is discussed (Section 4.5).

Chapter 4: Results and Discussion of Scale-Down
176
Experimental Case µmax VCNmax qIgGmax Titre (h-1) 105 cells mL-1 pg cell-1 h-1 (mg L-1) Fed-batch STR 0.026 78 1.48 1003 Fed-batch STR 0.025 89 1.65 1031 Control (PFR) 0.027 86 1.04 786 Control (PFR) 0.047 84 1.18 811 pH (60 s) 0.026 94 1.14 776 pH (60 s) 0.031 81 1.44 752 pH & sub (60 s) 0.028 75 1.02 791 pH & sub (60 s) 0.033 77 0.97 729 pH & sub (120 s) 0.027 82 1.26 804 pH & sub 120 s) 0.033 82 1.26 784 pH (100x) & sub (120 s) 0.030 80 1.29 841 pH (100x) & sub (120 s) 0.028 80 1.31 819 Table 4-5: Maximum growth and productivity values for each of the six duplicate stirred tank reactor (STR) experiments: maximum specific growth rate (µmax); maximum viable cell number (VCNmax); maximum specific rate of antibody productivity (qIgGmax); harvest antibody titre (Titre). Values rounded to the nearest 1 x 10⁵ cells mL-1.

Chapter 4: Results and Discussion of Scale-Down
177
Figure 4-7: Comparison of viable cell number, VCN, (square), dead cell number, DCN, (triangle) and viability (circle) for the test experiments (solid line, closed points) with the control (PFR) experiment (solid line, open points). A: Fed-batch STR. B: pH (60 s). C: pH & sub (60 s). D: pH & sub (120 s). E: pH (100x) & sub (120 s). Each time point is the average of duplicate experiments, error bars represent the data range of the duplicate experiments.
0
1 0
2 0
3 0
4 0
5 0
6 0
7 0
8 0
9 0
1 0 0
0 5 1 0
Viability Scale-Down Control
Viability Scale-Down Test
VCN Scale-Down Control
VCN Scale-Down Test
DCN Scale-Down Control
DCN Scale-Down Test
Time (hour)
Cel
l num
ber (
1 x
105 c
ells
mL-1
)
0
20
40
60
80
100
120
0 96 192 288 384 4800
20
40
60
80
100
Time (hour)
Cel
l num
ber (
1 x
105 c
ells
mL-1
)
B
0
20
40
60
80
100
120
0 96 192 288 384 4800
20
40
60
80
100
Cel
l num
ber (
1 x
105 c
ells
mL-1
)
Time (hour)
C
0
20
40
60
80
100
120
0 96 192 288 384 4800
20
40
60
80
100
Time (hour)
Cel
l num
ber (
1 x
105 c
ells
mL-1
)
D
0
20
40
60
80
100
120
0 96 192 288 384 4800
20
40
60
80
100
Cel
l num
ber (
1 x
105 c
ells
mL-1
)
Time (hour)
E
0
20
40
60
80
100
120
0 96 192 288 384 4800
20
40
60
80
100
A
Via
bilit
y (%
)
Via
bilit
y (%
)
Via
bilit
y (%
)

Chapter 4: Results and Discussion of Scale-Down
178
Figure 4-8: Comparison of IgG antibody titre (square) for test experiments (solid line, closed points) with the control (PFR) experiment (solid line, open points). Cell number (dashed line, diamond) plotted on a logarithmic y-axis for growth phase identification. A: Fed-batch STR. B: pH (60 s). C: pH & sub (60 s). D: pH & sub (120 s). E: pH (100x) & sub (120 s). Each time point is the average of duplicate experiments, error bars represent the data range of the duplicate experiments.
E
0
200
400
600
800
1000
1200
0 96 192 288 384 4801.E+05
1.E+06
1.E+07
Time (hour)
IgG
Ant
ibod
y Ti
tre (m
g L-1
)
Cel
l num
ber (
cells
mL-1
)
0
200
400
600
800
1000
1200
0 96 192 288 384 4801.E+05
1.E+06
1.E+07
D
Time (hour)
C
0
200
400
600
800
1000
1200
0 96 192 288 384 4801.0E+05
1.0E+06
1.0E+07
Time (hour)
IgG
Ant
ibod
y Ti
tre (m
g L-1
)
Cel
l num
ber (
cells
mL-1
)
0
200
400
600
800
1000
1200
0 96 192 288 384 4801.E+05
1.E+06
1.E+07
B
Time (hour)
0
200
400
600
800
1000
1200
0 96 192 288 384 4801.E+05
1.E+06
1.E+07
A
Time (hour)
IgG
Ant
ibod
y Ti
tre (m
g L-1
)
Cel
l num
ber (
cells
mL-1
)
0
2 0
4 0
6 0
8 0
1 0 0
0 5 1 0
IgG Titre Scale-Down Control
IgG Titre Scale-Down Test
VCN Scale-Down Control
VCN Scale-Down Test

Chapter 4: Results and Discussion of Scale-Down
179
Figure 4-9: Comparison of specific rate of antibody production, qIgG, (square) for test experiments (solid line, closed points) with the control (PFR) experiment (solid line, open points). A: Fed-batch STR. B: pH (60 s). C: pH & sub (60 s). D: pH & sub (120 s). E: pH (100x) & sub (120 s). Each time point is the average of duplicate experiments, error bars represent the data range of the duplicate experiments.
-0.5
0.0
0.5
1.0
1.5
2.0
0 96 192 288 384 480
A qI
gG (p
g ce
ll-1 h
-1)
Time (hour)
E
-0.5
0.0
0.5
1.0
1.5
2.0
0 96 192 288 384 480
qIgG
(pg
cell-1
h-1
)
Time (hour)
-0.5
0.0
0.5
1.0
1.5
2.0
0 96 192 288 384 480
D
Time (hour)
-0.5
0.0
0.5
1.0
1.5
2.0
0 96 192 288 384 480
C
qIgG
(pg
cell-1
h-1
)
Time (hour)
B
-0.5
0.0
0.5
1.0
1.5
2.0
0 96 192 288 384 480
Time (hour)
0100
0 10
qIgG Scale-Down Control
qIgG Scale-Down Test
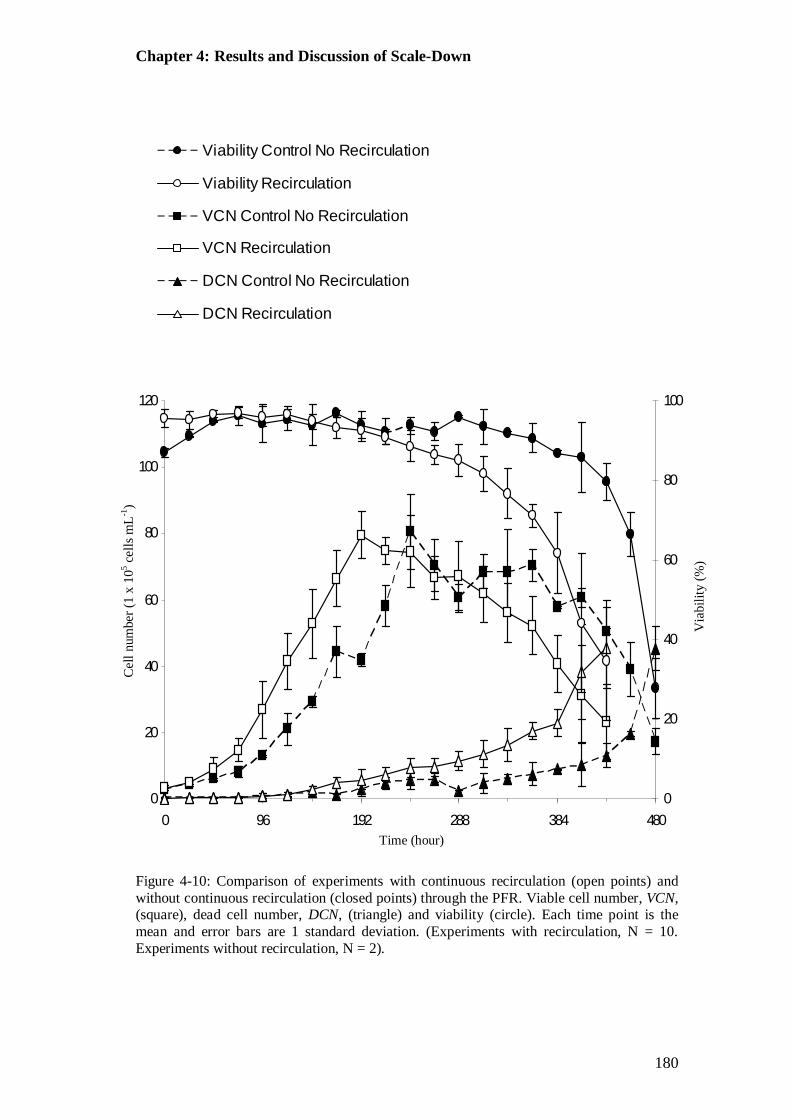
Chapter 4: Results and Discussion of Scale-Down
180
Figure 4-10: Comparison of experiments with continuous recirculation (open points) and without continuous recirculation (closed points) through the PFR. Viable cell number, VCN, (square), dead cell number, DCN, (triangle) and viability (circle). Each time point is the mean and error bars are 1 standard deviation. (Experiments with recirculation, N = 10. Experiments without recirculation, N = 2).
0
20
40
60
80
100
120
0 96 192 288 384 4800
20
40
60
80
100
Via
bilit
y (%
)
Cel
l num
ber (
1 x
105 c
ells
mL-1
)
Time (hour)
0
2 0
4 0
6 0
8 0
1 0 0
0 5 1 0
Viability Control No Recirculation
Viability Recirculation
VCN Control No Recirculation
VCN Recirculation
DCN Control No Recirculation
DCN Recirculation

Chapter 4: Results and Discussion of Scale-Down
181
Figure 4-11: Comparison of the specific rate of antibody production (qIgG) for experiments with (open square) and without (closed square) continuous recirculation through the PFR. Each time point is the mean and error bars are 1 standard deviation. (Experiments with recirculation, N = 10. Experiments without recirculation, N = 2).
Figure 4-12: Comparison of IgG antibody titre for experiments with (open points) and without (closed points) continuous recirculation through the PFR. Each time point is the mean and error bars are 1 standard deviation. (Experiments with recirculation, N = 10. Experiments without recirculation, N = 2).
Time (hour)
-0.5
0
0.5
1
1.5
2
0 96 192 288 384 480
qIgG Control No Rec irculation
qIgG Rec irculationqI
gG (p
g ce
ll-1 h-1
)
0
200
400
600
800
1000
1200
0 96 192 288 384 480
IgG Titre Control
IgG Titre Recirculation
Time (hour)
IgG
Ant
ibod
y Ti
tre (
mg
L-1)
010 0
0 10
IgG Titre Control No Recirculation
IgG Titre Recirculation
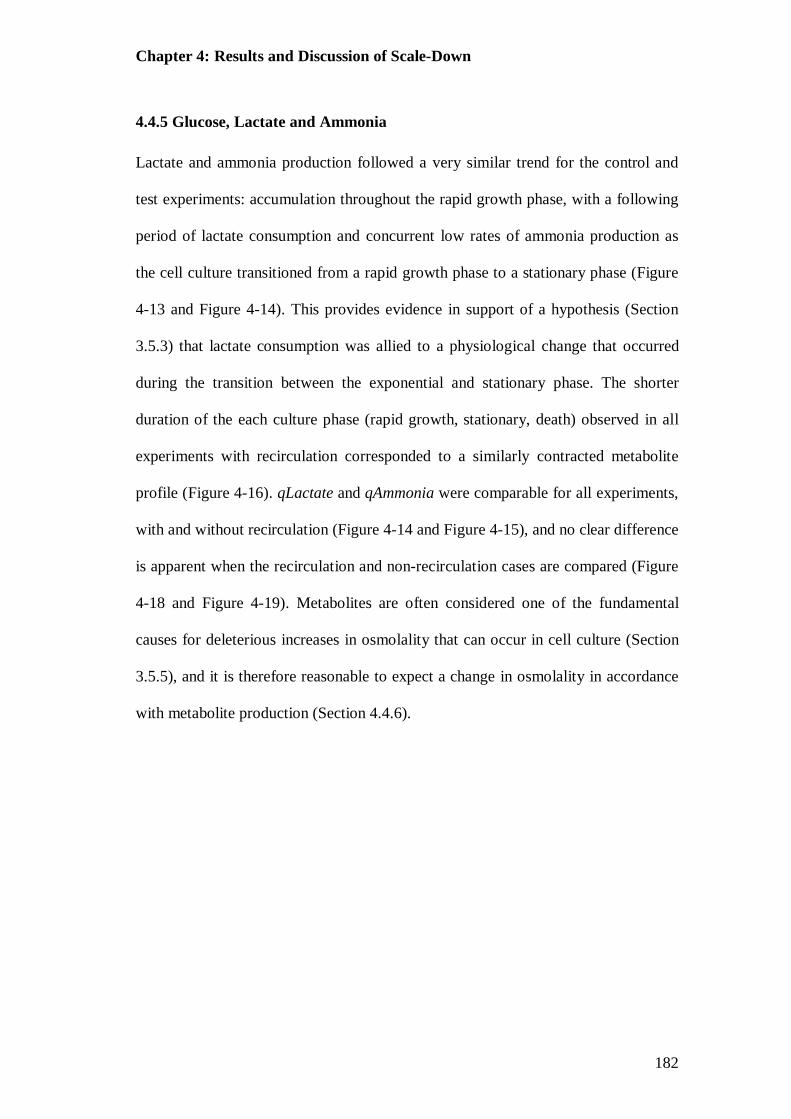
Chapter 4: Results and Discussion of Scale-Down
182
4.4.5 Glucose, Lactate and Ammonia
Lactate and ammonia production followed a very similar trend for the control and
test experiments: accumulation throughout the rapid growth phase, with a following
period of lactate consumption and concurrent low rates of ammonia production as
the cell culture transitioned from a rapid growth phase to a stationary phase (Figure
4-13 and Figure 4-14). This provides evidence in support of a hypothesis (Section
3.5.3) that lactate consumption was allied to a physiological change that occurred
during the transition between the exponential and stationary phase. The shorter
duration of the each culture phase (rapid growth, stationary, death) observed in all
experiments with recirculation corresponded to a similarly contracted metabolite
profile (Figure 4-16). qLactate and qAmmonia were comparable for all experiments,
with and without recirculation (Figure 4-14 and Figure 4-15), and no clear difference
is apparent when the recirculation and non-recirculation cases are compared (Figure
4-18 and Figure 4-19). Metabolites are often considered one of the fundamental
causes for deleterious increases in osmolality that can occur in cell culture (Section
3.5.5), and it is therefore reasonable to expect a change in osmolality in accordance
with metabolite production (Section 4.4.6).

Chapter 4: Results and Discussion of Scale-Down
183
Figure 4-13: Comparison of lactate (circle) and ammonia (square) concentration for test experiments (solid line, closed points) with the control (PFR) experiment (solid line, open points). A: Fed-batch STR. B: pH (60 s). C: pH & sub (60 s). D: pH & sub (120 s). E: pH (100x) & sub (120 s). Each time point is the average of duplicate experiments, error bars represent the data range of the duplicate experiments.
A
0.0
1.0
2.0
3.0
4.0
0 96 192 288 384 4800
0.1
0.2
0.3
0.4
Lact
ate
(g L
-1)
Time (hour)
0.0
1.0
2.0
3.0
4.0
0 96 192 288 384 4800
0.1
0.2
0.3
0.4
E
Lact
ate
(g L
-1)
Time (hour)
Am
mon
ia (g
L-1
)
0.0
1.0
2.0
3.0
4.0
0 96 192 288 384 4800
0.1
0.2
0.3
0.4
D
0.0
1.0
2.0
3.0
4.0
0 96 192 288 384 4800
0.1
0.2
0.3
0.4
C
Time (hour)
Lact
ate
(g L
-1)
Time (hour)
Am
mon
ia (g
L-1
)
0.0
1.0
2.0
3.0
4.0
0 96 192 288 384 4800
0.1
0.2
0.3
0.4
B
Time (hour)
Am
mon
ia (g
L-1
)
0
10 0
0 10
Lactate Scale-Down Control
Lactate Scale-Down Test
Ammonia Scale-Down Control
Ammonia Scale-Down Test

Chapter 4: Results and Discussion of Scale-Down
184
Figure 4-14: Comparison of specific rate of lactate production (qLactate) (square) for test experiments (solid line, closed points) with the control (PFR) experiment (solid line, open points). A: Fed-batch STR. B: pH (60 s). C: pH & sub (60 s). D: pH & sub (120 s). E: pH (100x) & sub (120 s). Each time point is the average of duplicate experiments, error bars represent the data range of the duplicate experiments.
-10
10
30
50
70
0 96 192 288 384 480
A
Time (hour)
qLac
tate
(pg
cell-1
h-1)
E
-10
10
30
50
70
0 96 192 288 384 480
qLac
tate
(pg
cell-1
h-1)
-10
10
30
50
70
0 96 192 288 384 480
C
qLac
tate
(pg
cell-1
h-1)
Time (hour)
Time (hour)
-10
10
30
50
70
0 96 192 288 384 480
B
Time (hour)
qLac
tate
(pg
cell-1
h-1)
-10
10
30
50
70
0 96 192 288 384 480
D
Time (hour)
qLac
tate
(pg
cell-1
h-1)
0
1 0 0
0 5 1 0
qLactate Scale-Down Control
qLactate Scale-Down Test

Chapter 4: Results and Discussion of Scale-Down
185
Figure 4-15: Comparison of specific rate of ammonia production, qAmmonia, (square) for test experiments (solid line, closed points) with the control (PFR) experiment (solid line, open points). A: Fed-batch STR. B: pH (60 s). C: pH & sub (60 s). D: pH & sub (120 s). E: pH (100x) & sub (120 s). Each time point is the average of duplicate experiments, error bars represent the data range of the duplicate experiments.
qAm
mon
ia (p
g ce
ll-1 h-1
)
qAm
mon
ia (p
g ce
ll-1 h-1
)
-0.5
-0.25
0
0.25
0.5
0.75
1
0 96 192 288 384 480
E
-0.5
-0.25
0
0.25
0.5
0.75
1
0 96 192 288 384 480
D
qAm
mon
ia (p
g ce
ll-1 h-1
)
Time (hour)
-0.5
-0.25
0
0.25
0.5
0.75
1
0 96 192 288 384 480
C
-0.5
-0.25
0
0.25
0.5
0.75
1
0 96 192 288 384 480
B
qAm
mon
ia (p
g ce
ll-1 h-1
)
Time (hour)
-0.5
-0.25
0
0.25
0.5
0.75
1
0 96 192 288 384 480
A qA
mm
onia
(pg
cel
l-1 h-1
)
Time (hour)
020
0 5 10
qAmmonia Scale-Down Control
qAmmonia Scale-Down Test

Chapter 4: Results and Discussion of Scale-Down
186
Figure 4-16: Comparison of lactate concentration for experiments with (open points) and without (closed points) continuous recirculation through the PFR. Each time point is the mean and error bars are 1 standard deviation. (Experiments with recirculation, N = 10. Experiments without recirculation, N = 2).
Figure 4-17: Comparison of ammonia concentration for experiments with (open points) and without (closed points) continuous recirculation through the PFR. Each time point is the mean and error bars are 1 standard deviation (Experiments with recirculation, N = 10. Experiments without recirculation, N = 2).
0.0
1.0
2.0
3.0
4.0
0 96 192 288 384 480
Lactate Control No Recirculation
Lactate Recirculation
Lact
ate
(g L
-1)
Time (hour)
Am
mon
ia (g
L-1
)
Time (hour)
0.0
0.1
0.2
0.3
0.4
0 96 192 288 384 480
Ammonia Control No Recirculation
Ammonia Recirculation

Chapter 4: Results and Discussion of Scale-Down
187
Figure 4-18: Comparison of the specific rate of ammonia production (qAmmonia) for experiments with (open points) and without (closed points) continuous recirculation through the PFR. Each time point is the mean and error bars are 1 standard deviation. (Experiments with recirculation, N = 10. Experiments without recirculation, N = 2).
Figure 4-19: Comparison of the specific rate of lactate production (qLactate) for experiments with (open points) and without (closed points) continuous recirculation through the PFR. Each time point is the mean and error bars are 1 standard deviation. (Experiments with recirculation, N = 10. Experiments without recirculation, N = 2).
qAm
mon
ia (p
g ce
ll-1 h
-1)
Time (hour)
-0.5
-0.25
0
0.25
0.5
0.75
1
0 96 192 288 384 480
qAmmonia Control No Recirculation
qAmmonia Recirculation
qLac
tate
(pg
cell-1
h-1
)
Time (hour)
-10
10
30
50
70
0 96 192 288 384 480
qLactate Control No Recirculation
qLactate Recirculation

Chapter 4: Results and Discussion of Scale-Down
188
4.4.6 Osmolality
Osmolality was in accordance for all experiments with recirculation (Figure 4-20).
In accordance with the earlier production of metabolites that accompanied the
greater µ in the rapid growth phase of all experiments with recirculation, a clear
difference in osmolality began at ~288 h when lactate and ammonia concentrations
began to rise again, having risen with the rapid growth phase and fallen during the
stationary phase (Figure 4-11 and Figure 4-13). This indicates that responsibility for
the majority of the osmolality increase rested with the quantity of metabolites in the
medium. Apart from experiment 6, all experiments with recirculation (Figure 4-20,
B – E) had broadly equivalent osmolality; the final osmolality achieved in
experiment 6 (Figure 4-20, E) was ~50 mOsm kg-1 greater than the control
recirculation experiment.
The equivalence of osmolality in all experiments with recirculation
regardless of mean residence time (RT) in the PFR (60 s and 120 s), apart from
experiment 6 (120 s residence in the PFR and 100x alkali), suggests that transfer lag
was not great until exacerbated by the 100x stronger alkali. The negligible difference
between recirculation experiments up until that point suggests that great quantities
of alkali are necessary only in the very late stages of the culture. Elevated
osmolality, especially ‘hyperosmolality’ has been reported to improve antibody titre
(Section 1.7.2). In this study, elevated osmolality occurred after antibody production
had ceased and could not have greatly influenced antibody titre (Figure 4-8 and
Figure 4-9).
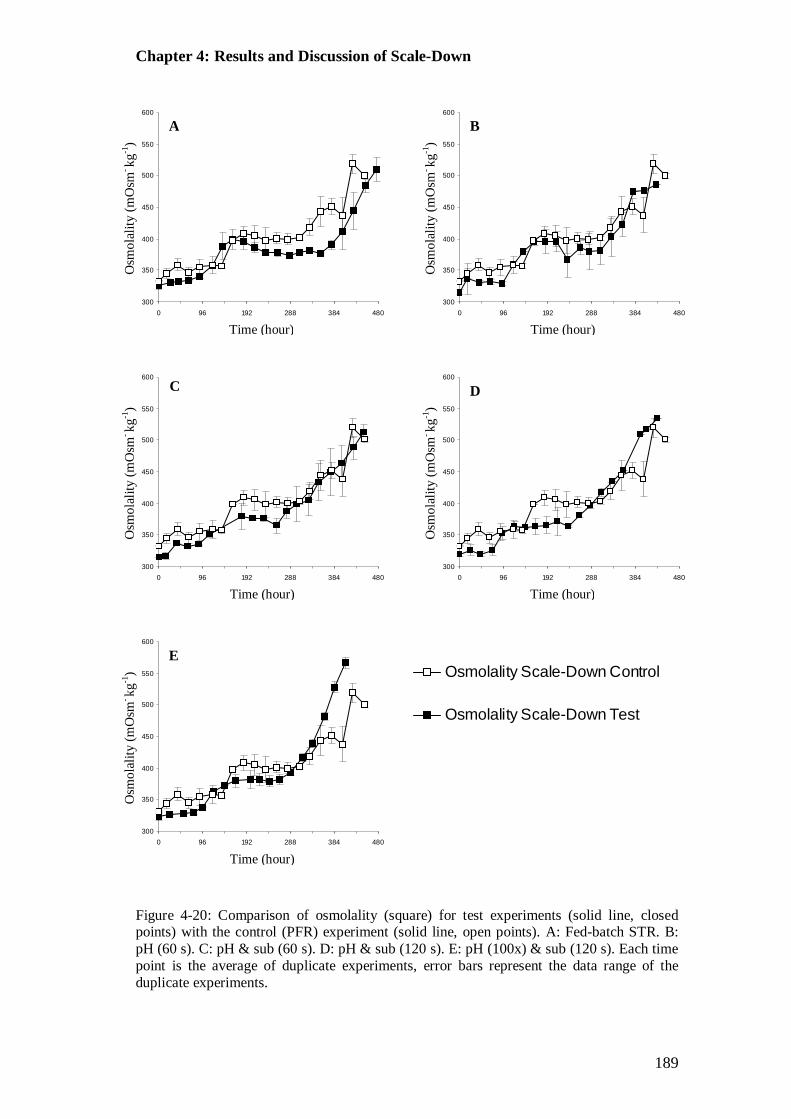
Chapter 4: Results and Discussion of Scale-Down
189
Figure 4-20: Comparison of osmolality (square) for test experiments (solid line, closed points) with the control (PFR) experiment (solid line, open points). A: Fed-batch STR. B: pH (60 s). C: pH & sub (60 s). D: pH & sub (120 s). E: pH (100x) & sub (120 s). Each time point is the average of duplicate experiments, error bars represent the data range of the duplicate experiments.
E
300
350
400
450
500
550
600
0 96 192 288 384 480
Osm
olal
ity (m
Osm
- kg-1
)
Time (hour)
300
350
400
450
500
550
600
0 96 192 288 384 480
C
Osm
olal
ity (m
Osm
- kg-1
)
Time (hour)
D
300
350
400
450
500
550
600
0 96 192 288 384 480
Time (hour)
300
350
400
450
500
550
600
0 96 192 288 384 480
B
300
350
400
450
500
550
600
0 96 192 288 384 480
A O
smol
ality
(mO
sm- kg
-1)
Time (hour) Time (hour)
Osm
olal
ity (m
Osm
- kg-1
)
Osm
olal
ity (m
Osm
- kg-1
)
0100
0 10
Osmolality Scale-Down Control
Osmolality Scale-Down Test
Chapter 4: Results and Discussion of Scale-Down
190
Figure 4-21: Comparison of the osmolality for experiments with (open points) and without (closed points) continuous recirculation through the PFR. Each time point is the mean and error bars are 1 standard deviation. (Experiments with recirculation, N = 10. Experiments without recirculation, N = 2).
300
350
400
450
500
550
600
0 96 192 288 384 480
Osmolality Control No Recirculation
Osmolality Recirculation
Osm
olal
ity (m
Osm
kg-1
)
Time (hour)

Chapter 4: Results and Discussion of Scale-Down
191
4.4.7 Antibody Quality
Product consistency, referred to as antibody quality, can be crucial for the efficacy
of the antibody as a drug and has been found to be influenced by process conditions
(Section 1.1.1). Several antibody characterisation methods provided a
comprehensive analysis of antibody quality (Section 2.14). However, to be sure that
there were no minute changes to quality (i.e., efficacy) would have required a
complementary set of studies including assessment of in vitro and in vivo bioactivity
and comparative pharmacokinetics and pharmacodynamics studies in relevant
species.
4.4.7.1 Mass Heterogeneity
Mass heterogeneity is typically the result of varying degrees of antibody
aggregation. Aggregation is sensitive to process conditions and can be indicative of
antibody misfolding and degradation by chemical (e.g., pH) or physical processes
(e.g., shear) (Section 1.1.1). SDS PAGE (Section 2.14) showed that the molecular
mass profiles were comparable for all experimental cases: both band placement and
band intensity were comparable (Figure 4-22). Mass spectroscopy showed that the
maximum difference between the control and the sample experiments was 6 Da; this
is well within the expected ± 100 ppm (parts per million) variation (0.01% of the
mass of this Mab) for mass analysis using ESI-Q-TOF (Zhang et al., 2009), and
should not therefore be considered as indicative of mass heterogeneity. Thus, it is
concluded that the conditions of the scale-down did not result in significant antibody
aggregation or degradation.

Chapter 4: Results and Discussion of Scale-Down
192
1 2 3 4 5 6 M1 M2 SDS PAGE (B)
1 2 3 4 5 6 M1 M2
SDS PAGE (A)
Figure 4-22: SDS PAGE used for comparison of antibody mass (Section 2.14.1). A: non-reducing conditions. B: reducing conditions. Samples shown here were taken from the final time-point (harvest) of each experiment (when % cell viability fell below 30%) and M1 and M2 refer to the molecular weight marker lanes. Lanes 1 to 6 refer to experiments 1 to 6. Experiments (Section 2.7, for details): 1. Fed-Batch STR (Control without recirculation); 2. Recirculation Control (60 s); 3. pH (60 s); 4. pH & sub (60 s); 5. pH & sub (120 s); 6. pH (100x) & sub (120 s).
Chapter 4: Results and Discussion of Scale-Down
193
4.4.7.2 Charge Heterogeneity
Charge heterogeneity is primarily introduced by deamidation and C-terminal lysine
micro-heterogeneity (Tsai et al., 1993; Perkins et al., 2000). C-terminal lysine was
not present on the antibody studied here and any charge alteration should be
attributable to deamidation. Deamidation of asparagine and glutamine introduces an
additional negative charge to the antibody and generates acidic species that decrease
the protein’s isoelectric point (pI) (Liu et al., 2008). These factors have been found
sensitive to process condition (Section 1.1.1) and the isoelectric point (Ip) might
reasonably be expected to have fallen after repeated exposure to elevated osmolality
and pH during alkali addition to the PFR. Isoelectric focusing, IEF, (Section 2.14)
showed that the charge profile was comparable for all the experimental cases; both
band placement and band intensity were comparable (Table 4-6 and Figure 4-23).
The gradual and slight decrease in pH from the left to the right of the gel is
attributed to a slight distortion across the gel; this is clear from a comparison of the
two standard lanes. The decrease in mean Ip from experiments 1 to 6 is no greater
than the variation between the two standards and considered insignificant (Table
4-6).

Chapter 4: Results and Discussion of Scale-Down
194
Table 4-6: Comparison of the isoelectric point (Ip) for isoelectric focusing (IEF) analysis (Section 2.14) of purified harvest antibody from experiments 1 to 6 (Section 2.7) - values from a scan of the Gel plate (Figure 5-23). Experiments (Section 2.7, for details): 1. Fed-Batch STR (Control without recirculation); 2. Recirculation Control (60 s); 3. pH (60 s); 4. pH & sub (60 s); 5. pH & sub (120 s); 6. pH (100x) & sub (120 s). The difference between the mean Ip and control mean Ip (ΔControl) is in accordance with the expected error for the IEF method.
Experiment 1 2 3 4 5 6 6.72 6.70 6.66 6.61 6.63 6.61 6.60 6.57 6.54 6.49 6.49 6.48 6.50 6.47 6.45 6.42 6.41 6.40 6.46 6.43 6.40 6.36 6.36 6.35 6.42 6.38 6.36 6.34 6.30 6.29 6.37 6.32 6.30 6.26 6.24 6.23 Mean Ip 6.51 6.48 6.45 6.41 6.41 6.39 ΔControl 0.03 Control (PFR) -0.03 -0.06 -0.07 -0.08

Chapter 4: Results and Discussion of Scale-Down
195
Figure 4-23: Isoelectric focusing for comparison of antibody charge (isoelectric point, Ip). S1 and S2 refer to the standard Ip marker lanes (Section 2.14.3). Lanes 1 to 6 refer to experiments 1 to 6. Experiments (Section 2.7, for details): 1. Fed-Batch STR (Control without recirculation); 2. Recirculation Control (60 s); 3. pH (60 s); 4. pH & sub (60 s); 5. pH & sub (120 s); 6. pH (100x) & sub (120 s).
1 2 3 4 5 6 S1 S2
Isoelectric Focusing

Chapter 4: Results and Discussion of Scale-Down
196
4.4.7.3 Glycoform Heterogeneity
Glycoform heterogeneity is used here to mean a variation in the oligosaccharides
attached to the antibody. As discussed (Section 1.1.1), antibody glycoform can be
sensitive to many process parameters in the STR. Since alterations to glycoform
have been observed at extremes of pH, at hyperosmolality, substrate limitation and
elevated ammonia, it was reasonable to expect that both substrate and alkali
perturbations in the PFR might alter the antibody’s glycoform profile.
Five glycoforms were identified by NP-HPLC 2-AB: GOF and G1F
accounted for the majority of all glycoforms, and G0, G1 and G2F are of low
abundance. Note: the NP-HPLC 2-AB used in this study is comparable to glycoform
profiling by mass spectroscopy (Thaysen-Andersen et al., 2009). The
oligosaccharide structure for each of the above glycoform notations is provided
(Figure 4-24). Normalised against the control experiment (experiment 2), some
variation in glycoform is evident (Figure 4-25, B). Relative glycoform profiling
(Figure 4-25, A) revealed that quantitatively this variation was not considerable and
one should take care before attributing it to the scale-down. There are three possible
causes for the variation in glycoform: the analytical method, typical variation
between duplicate STR experiments, and the conditions of the scale down.
In the literature, only one study could be found to have assessed the accuracy
of glycoform analysis by NP-HPLC 2-AB (Thaysen-Andersen et al., 2009); the
percentage cumulative variance (%CV) calculated from their results and the %CV of
an interassay control study of a large-scale study are presented for comparison with
the results of this study (Table 4-7). Two observations were made: first, the
analytical error was greater for low abundance glycoforms; second, the %CV was
Chapter 4: Results and Discussion of Scale-Down
197
equivalent for the Thaysen-Andersen et al. (2009) and the large-scale studies, but
roughly double for this scale-down study. Thus, the glycoform variation observed in
the scale-down was not wholly accounted for by the expected variation in the
analytical method. This, however, does not mean that the variation should be
attributed to the scale-down method, for such inconsiderable variation between
scale-down samples could be attributable to typical variation between multiple
identical vessels. Acceptable statistical analysis would require at least 10 (ideally
>20) independent replicates.
Comparison with analysis conducted by Thaysen-Andersen et al. (2009) and
the large-scale study was made from a single sample from a single vessel, and
variation can therefore be clearly identified as being introduced only by the
analytical method. In this scale-down study, however, six samples were taken from a
series of six different experimental cases that had been conducted in duplicate. The
cost and difficulty of thorough antibody quality analysis meant that it was not
possible to analyse duplicates from the same experimental case. Sample variation
could therefore have been introduced by several factors: the frozen storage period (-
80oC), which differed for each sample, the purification process and by the analytical
process; furthermore, it is certainly possible that some glycoform variation occurs
between practically identical experiments. Unfortunately, the typically glycoform
profile variation between identical STR experiments conducted in the large-scale
study is unavailable.
Perturbations did not cause significant change to culture performance
compared to the control, and all of the other techniques for protein analysis were
equivalent. Thus, following cell viability and productivity, one might expect the

Chapter 4: Results and Discussion of Scale-Down
198
glycoform profile in experiments with recirculation through the PFR to be
comparable, but different from the control experiment without recirculation. Even
this was not so, and the small variation appeared to be arbitrary. Considering the
expected variation in the analytical method for a single sample, it is concluded that
the glycoform variation between experiments was unlikely to have been significant
and should not be attributed to variation in the conditions created by the scale-down.

Chapter 4: Results and Discussion of Scale-Down
199
Thaysen-Andersen et al., 2009 Large-Scale Scale-Down Glycoform mean %CV mean %CV mean %CV
G0-N 0.90 16.67 n/a n/a n/a n/a G0 2.34 8.55 5.35 6.30 2.24 17
G0F 49.97 2.84 82.61 0.53 68.5 6.3 G1 n/a n/a 2.11 15.97 1.12 33
G1F 40.58 2.93 9.57 4.49 24.87 11.1 G2F 6.22 8.04 0.60* n/a 3.3 30
Table 4-7: Accuracy of the NP-HPLC 2-AB method for IgG glycoform profiling. Glycans removed from the antibody by enzymatic deglycosyalion were fluorescently labelled with 2-AB (2-aminobenzamide) and loaded on a Glycosep™ N HPLC for analysis (Section 2.14.2). The mean % relative amount of each glycoform and the % cumulative variance, %CV, for the six different experimental cases in this scale-down study (Section 2.7) were analysed once (N = 1) by one operator and compared with accuracy studies conducted using a single sample. The large-scale study analysed the same sample six times (N = 6) using six different operators. Thaysen-Andersen et al., (2009) did not specify number of operators and repeated analysis three times (N = 3). Note: n/a refers to glycoforms that were not present. * %CV is not provided for G2F in the large-scale study because G2F was not detected by 4 out of the 6 operators.
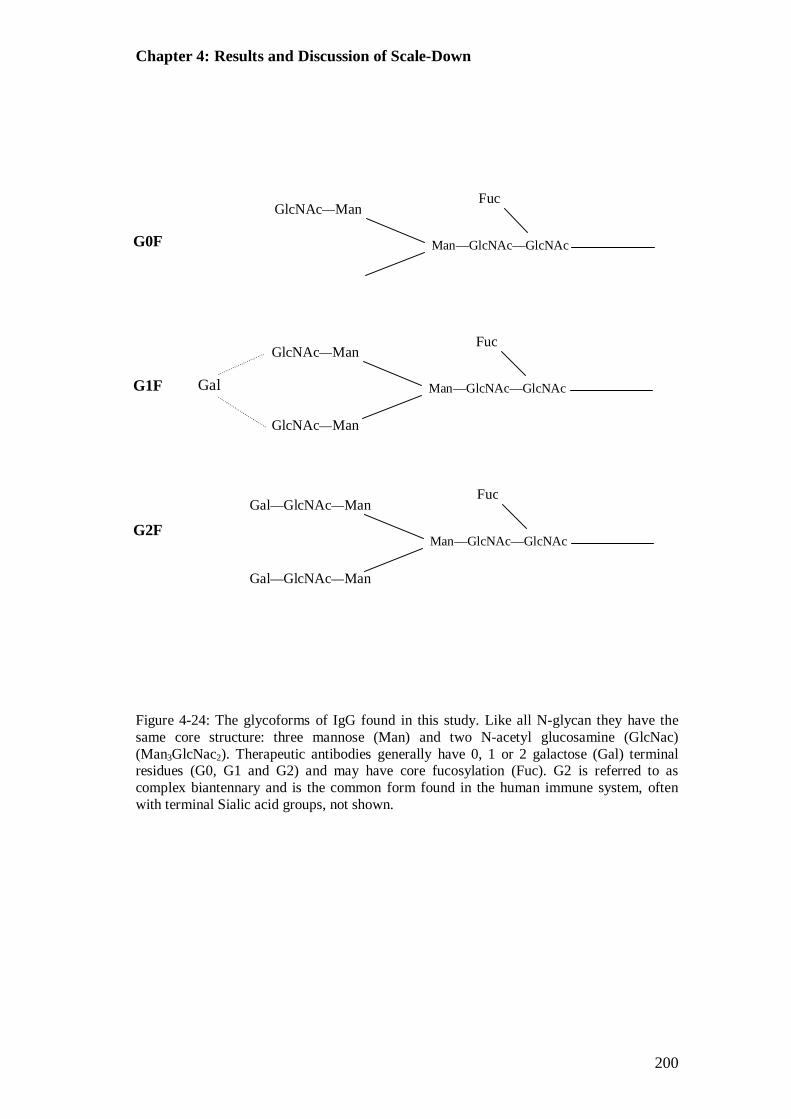
Chapter 4: Results and Discussion of Scale-Down
200
Figure 4-24: The glycoforms of IgG found in this study. Like all N-glycan they have the same core structure: three mannose (Man) and two N-acetyl glucosamine (GlcNac) (Man3GlcNac2). Therapeutic antibodies generally have 0, 1 or 2 galactose (Gal) terminal residues (G0, G1 and G2) and may have core fucosylation (Fuc). G2 is referred to as complex biantennary and is the common form found in the human immune system, often with terminal Sialic acid groups, not shown.
Man—GlcNAc—GlcNAc
Fuc Gal—GlcNAc—Man
Gal—GlcNAc—Man
Man—GlcNAc—GlcNAc
Fuc GlcNAc—Man
GlcNAc—Man
Gal
Man—GlcNAc—GlcNAc
Fuc GlcNAc—Man
G0F G1F G2F

Chapter 4: Results and Discussion of Scale-Down
201
Figure 4-25: Bar chart A: mean relative % of each glycoform on the IgG antibody for each experimental case. Bar chart B: mean relative % of the predominant three glycoforms normalised to the Control (PFR), which is set at 100. Fed-batch STR (white); Control (PFR) (black); pH (60 s) (grey); pH & sub (60 s) (diagonal stripe); pH & sub (120 s) (checked); pH (100x) & sub (120 s) (striped). Using non-parametric ANOVA no significant difference was found in a multiple comparison to the control STR experiment.
Nor
mal
ised
rela
tive
amou
nt o
f gly
cofo
rm (%
)
Predominant Glycoforms
0
25
50
75
100
125
150
175
200
G0F G1F G2F
Fed Batch STR Control (PFR)pH (60 s)pH & sub (60 s)pH & sub (120 s)pH (100x) & sub (120 s)
B
0
50
100
150
200
250
300
350
400
G0 G0F G1 G1F G2F
Fed Batch STR Control (PFR)pH (60 s)pH & sub (60 s)pH & sub (120 s)pH(100x) & sub (120 s)
Rel
ativ
e am
ount
of g
lyco
form
(%)
Glycoform Profile
A

Chapter 4: Results and Discussion of Scale-Down
202
4.5 Discussion
It has been consistently found that there was no significant difference between the
control experiments and test experiments. A significant difference was observed
only between the antibody titre, VCN, and viability of the fed-batch experiment
without circulation through the PFR and all experiments with recirculation. The
notable difference between the fed-batch experiment (1) and recirculation
experiments (2 – 6), which are equivalent, leads to the already manifest conclusion:
pH and substrate perturbations lasting for 60 s and 120 s had little effect on growth
and viability of the GS-CHO cell line used in this study and other perturbations
introduced by the PFR had negligible influence. Recirculation itself was the
predominant factor.
This clearly demonstrates that, compared to the effects of circulating the
culture through the PFR, the exposure of the culture to perturbations in pH and
substrate of duration between 60 and 120 s and frequency determined by pH control
and glucose requirement had little or no influence on the growth, production and
antibody quality of the GS-CHO culture used in this study. The negligible influence
of pH perturbations on cell culture is contrary to the findings of the Osman et al.
(2002) study of multiple pH perturbations in GS-NS0 cell culture.
Antibody quality was comprehensively addressed and found unaltered by the
scale-down. Changes to the glycoform profile were not considered significant and
are attributed to typical variation in low abundance glycoforms, introduced by the
analysis method. Unlike protein synthesis, antibody glycosylation is not template
driven and is purportedly especially sensitive to process conditions (Wold, 1981;
Goochee and Monica, 1990; Butler, 2004b). This study, however, showed that
Chapter 4: Results and Discussion of Scale-Down
203
glycosylation was altered neither by the conditions of the scale-down nor by
recirculation.
It is surprising that antibody quality, which has been shown to be sensitive to
nutrient levels, pH and shear (Section 1.1.1), was not altered by circulation that so
manifestly altered cell growth and viability. This might be because the glycosylation
of this antibody was in any case limited: in the majority of the literature, the
predominant reported influence of process conditions on glycoform profile is to
decrease sialylation (Borys et al., 1993; Andersen and Goochee, 1994; Wong et al.,
2004; Trummer and Fauland, 2006), yet the CHO cell line used in this study lacks
significant levels of sialyltransferase activity and the antibody is therefore expected
to have negligible sialylation. Sialylation is the final step in glycoform processing,
required for complex biantennary glycoforms that perfectly match the immunogenic
qualities of antibodies generated by the human immune system, and it may be that in
the animal cells used for therapeutic protein production sialylation is more sensitive
to culture environment than steps earlier in the glycosylation pathway. Alternatively,
perturbations may simply have been too brief to influence the protein: Werner et al.
(1998) found the glycosylation profile of GS-CHO cells to be very stable, and
alterations of any sort to immunoglobulins typically required exposure of the entire
STR volume to sub-optimal conditions for hours and sometimes days.
Osman et al. (2002) found that the frequency of GS-NS0 exposure
significantly altered the affect of pH perturbations (pH 7.3 to pH 8.0) on cell
viability, showing that when the frequency of perturbations lasting 200 seconds (s)
was increased from every 60 minutes to every 6 minutes cell death increased from
‘3.4% to 28.3%’. However, comparison between this study and their study is

Chapter 4: Results and Discussion of Scale-Down
204
impaired by the differences between the two scale-down models: they created
perturbations in 17% of the culture volume that lasted for 200 s, as opposed to the
5% volume and maximum residence of 120 s used here. Between the two studies,
frequency of perturbations was also likely to have differed considerably. In their
study, perturbations were made with an arbitrarily regularity that was defined by the
experimenter. In this study, perturbations occurred only when alkali was required to
control pH at the setpoint, as in a large-scale STR. Unfortunately, equipment failures
meant it was impossible to record the frequency of alkali additions. Nevertheless,
the relatively low pH setpoint for the process used in this study was chosen, in part,
to minimise the requirement for alkali.
No studies of the effect of single or multiple glucose perturbations could be
found in the literature. The effect of glucose limitation on mammalian cell growth is
reasonably well documented: glucose limitation is typically beneficial by decreasing
production of metabolites (Europe et al., 2000). Since glucose concentration in the
STR was not limiting, substrate perturbations in the PFR were unlikely to increase
the production of metabolites greatly. Of greater concern was inhibition caused
directly by glucose.
Only a few reports could be found concerning the direct inhibitory affect of
elevated glucose concentration (Kurano et al., 1990a; Terada et al., 1998); these
studies show that glucose inhibition can occur, but provide no account of the
behaviour of animal cells when exposed to glucose elevation for a short duration.
Experiments with substrate feeding to the PFR showed no significant difference in
qLactate or µ compared to the other experiments. Thus, it can be concluded that
either the perturbations in substrate created by the almost continuous slow feed of

Chapter 4: Results and Discussion of Scale-Down
205
substrate were insufficient to affect this GS-CHO culture, or that the cells were
insensitive to elevated glucose perturbations of the sort created in the PFR. It is
probable that both are true: perturbations generated by the substrate were slight and
the cells robust.
Glucose perturbations created in two-compartment scale-down studies to
generate glucose perturbations like those that occur in large-scale microbial STRs
have been shown to alter microbial cell growth and recombinant protein productivity
(Bylund et al., 1999; Hewitt et al., 2000; Hewitt and Nebe-Von-Caron, 2001).
However, the low cell density, significantly lower rate of cell death, td, and
correspondingly lower glucose uptake rate (GUR) and (OUR) of mammalian cell
culture again makes a comparison between the two very difficult. For the high GUR
in high cell concentration microbial culture will certainly result in greater glucose
feed requirements and likely create much larger glucose perturbations that can cause
O2 deprivation in the PFR as a result of the cells’ high OUR during glucose
metabolism (Section 1.8.4).
Maintenance of consistent antibody characteristics is in accordance with the
findings of Osman et al. (2001) that the antibody charge profile was unaltered (as
measured by isoelectric focusing, IEF) when the harvested antibody in cell culture
supernatant was incubated at the range of pH values investigated in their pH shift
study. Unfortunately, their method accounted only for antibody quality changes that
might have occurred in the culture medium after secretion from the cell, neglecting
the possible influence of pH shifts on cellular antibody production mechanisms
(Section 1.7.1.2). Antibody quality was not reported in their later study of multiple
pH perturbations using a two-compartment model (Osman et al., 2002).

Chapter 4: Results and Discussion of Scale-Down
206
Consideration will now be given to what factor or factors created by
recirculation through the PFR decrease cell viability in the stationary phase by
approximately 20 to 30%, shortened culture duration by 48 h and decreased
antibody titre by ~200 mg mL-1, yet did not significantly alter any measured aspect
of antibody quality.
What deleterious factors could recirculation through the PFR have
introduced? There are at least three: first, heterogeneity introduced by the PFR;
second, some sort of shear that was, perhaps, created by the rollers of the pump, air-
liquid interfaces, or at the pipe wall; third, ‘difficult-to-identify’ factors such as
leaching of contaminants from polymer connectors for tubing segments, or some
deleterious surface interaction with the PFR’s silicone and neoprene tubing. The
possible combined synergistic effects of multiple factors may have been more
damaging than would be expected from their effects alone. Each of these three
factors, heterogeneity, shear and difficult-to-identify will be discussed in turn.
First, heterogeneity is inherent in design of the scale-down equipment. Even
when alkali and substrate additions were made to the STR, the cell population will
inevitably have been exposed to an environment in the PFR that differed from the
perfectly mixed and controlled environment of the STR. The absence of pH control
in the PFR meant that if significant quantities of metabolites were produced then the
pH could be altered to the detriment of cells in the PFR. Nevertheless, it is clear that
were the effects of any pH drop in the control recirculation experiment harmful, then
pH alterations created by alkali additions to the PFR would surely have been to even
greater detriment. The equivalence of all experimental cases with recirculation
Chapter 4: Results and Discussion of Scale-Down
207
implies that any pH perturbation created during recirculation in the PFR was
unlikely to have been responsible for the difference created by recirculation.
The absence of an O2 supply to the PFR could, if the OUR were great, have
resulted in O2 limitation within the duration in the PFR, and the same is true for
substrate and substrate limitation. Both O2 limitation and substrate limitation are
found in similar two-compartment studies for microbial cells (Section 1.8). Animal
cells are much less rapacious. The µ observed in this study was almost 100-fold
lower than microbial culture (doubling time of around 24 h, compared to 20 minutes
for E.coli) with concomitantly lower substrate and O2 consumption and metabolite
production. Calculations (Section 4.3.1) indicate that at 86 x 106 cells mL-1 and 120
s residence time (RT) in the PFR low dissolved oxygen tension (DOT) may have
occurred. However, cell culture behaviour was equivalent between all recirculation
experiments and those conducted with a mean residence time (RT) of 60 s in the
PFR were unlikely to have experienced a drop in DOT of more than 15% even at
VCNmax (Section 4.3.1), such a drop is very unlikely to have altered cell
physiology. In the literature for animal cell culture, O2 limitation has been reported
to decrease viability and titre when DOT drops below 5 or 10% (Section 1.7.3).
Thus, either the small DOT perturbations probable in the PFR with 60 s residence
decreased cell viability and titre to the same extent as possible larger perturbations at
120 s residence, or perturbations in DOT in both cases were insufficient to influence
this cell culture. The latter is the more likely, since the oxygen consumption
expected in the 60 s PFR is unlikely to have caused a DOT to drop that was
deleterious.

Chapter 4: Results and Discussion of Scale-Down
208
As cells flowed through the PFR, they were exposed to the hydrodynamic
environment created by the interaction of fluid with connecting tubes, ancillary
fittings and the contact forces and localised shear in the peristaltic pump (Kieran et
al., 1995; Natarajan and Mokhtarzadeh-Dehghan, 2000). Based on shear sensitivity
studies (Section 1.6), cell damage in the conventional sense (‘pure’ shear) would
require any shear mechanism in the pump to generate approximately an energy
dissipation rate, ε, of at least 1 x 10² W kg-1. Calculations show (Sections 5.4.3 and
5.4.4) that the maximum energy dissipation rate, max, pipe , created at the walls of the
tubing in the PFR was, at 0.04 W kg-1, far less than the maximum local energy
dissipation rate, Im( )T ax , in the STR (1 W kg-1, assuming Im( )T ax = 100 x ( )T bulk ),
and at least 3 orders of magnitude lower than the threshold for damage reported in
the literature. Therefore, if hydrodynamic ‘pump damage’ occurred in the PFR
circuit, it may only be attributed to one or a combination of uncertain hydrodynamic
mechanisms, such as compression or cavitation, such damaging mechanisms are
referred to here as shear, even if this term is not strictly applicable in its pure sense.
Pump damage was not reported in any of the previous two-compartment
scale-down studies found in the literature. This may be expected for small robust
microbial cells, but may be surprising for ‘shear sensitive’ mammalian cells.
However, currently only one group could be found to have attempted a two-
compartment scale-down study using mammalian cells (Osman et al., 2002) and it is
unclear if their pumping was continuous or only during perturbations.
In studies of the continuous pumping of blood cells for medical purposes
such as cardiopulmonary bypass (CPB), peristaltic pumping (sometimes referred to
as roller pumping in the blood literature) has been cited as a cause of lysis

Chapter 4: Results and Discussion of Scale-Down
209
(haemolysis) and cumulative sub-lethal damage (Tamari et al., 1993; Morgan et al.,
1998; Valeri et al., 2006). It is well established that CPB damages blood
(Yarborough et al., 1966; Mulholland et al., 2000; Mulholland et al., 2005), and this
damage is attributed to non-physiological forces (Blackshear et al., 1965; Nevaril et
al., 1968; Leverette et al., 1972).
In the field of blood perfusion, a great deal of research has focused on ways
to decrease this damage; for example, the materials are now exceptionally
biocompatible (Mulholland et al., 2005). In addition, there are reports that
haemolysis has been decreased by replacement of peristaltic pump with centrifugal
pump (Takeda et al., 1984; Morgan et al., 1998); however, contradictory studies
have observed no significant difference between haemolysis in peristaltic and
centrifugal pumping (Takahama et al., 1985; Hansbro et al., 1999; Valeri et al.,
2006). In peristaltic pumping, haemolysis and sometimes sub-lethal impairment has
been generally attributed to compression of the tubing and a portion of cells that
may become compressed with that section of tubing as the pump rollers rotate
(Berstein et al., 1967; Sutera, 1977; Watanabe et al., 2006). Noon et al. (1985) found
that blood damage in long-term perfusion was decreased by increasing roller
diameter and tubing diameter, and increasing occlusion so that tubing compression
was decreased to the point that it was just sufficient to create flow.
Using computational fluid dynamics to model a two-roller pump, Mulholland
et al. (2005) reported the existence of ‘a sharp peak in shear stress occurs in roller
pumps when the rollers are almost occluding the tube…and because the fluid is
incompressible, the pressure between the rollers becomes very high and the fluid is
driven through the narrow gaps very fast.’ They state that, as a result, there exists a

Chapter 4: Results and Discussion of Scale-Down
210
very thin boundary layer with high-velocity gradient, thus giving rise to a sharp peak
of shear stress, which can reach values of almost 1000 Pa. Haemolysis has also been
attributed to ‘detrimental flow structures’ such as areas of turbulence, stagnation,
vortices, high shear-stresses, negative pressure and cavitation (Tsujino et al., 1999;
Mulholland et al., 2005; Lee et al., 2009). It is possible that one or a combination of
these mechanisms reported to have caused haemolysis resulted in the detrimental
affect of recirculation in this study.
The literature provides strong evidence that roller pumps are capable of
generating shear that will damage blood cells. How well this translates to GS-CHO
cell behaviour during pumping is unknown. Blood cells, like vascular endothelial
cells (Malek and Izumo, 1994; Lehoux et al., 2006), may well be physiologically
adapted to respond to shear, while GS-CHO have likely been widely adopted for
therapeutic production because of their relative insensitivity to shear. Critically, the
flow rates of blood pumping studies are typically far greater than used in this study.
A flow rate of at least 8000 mL min-1 is required for CPB, whereas the maximum
flow rate in this study was only 150 mL min-1. Nevertheless, if the mechanism of
damage was occlusion by compression of the tubing, flow rate may not have been a
key factor in damage. Furthermore, only a small number of cells need be damaged
with each rotation of the pump for any of these shear mechanisms to become a
significant cause of cell damage during continuous recirculation over the duration of
a cell culture, which, needless to say, is many times longer than even the most
traumatic operation. Cell damage might take the form of lethal (immediate lysis) or
sub-lethal damage; both are thought to occur in the peristaltic pumping of blood.
Chapter 4: Results and Discussion of Scale-Down
211
Osman et al. (2002) do not report pump damage in their two-compartment
(STR+STR) study of pH perturbations in GS-NS0 culture, using a recirculation flow
rate of 100 mL min-1, provided by a peristaltic pump like the one used in this study
(Watson Marlow, 502 S). They do not specify if pumping between the two STR was
continuous, or when required to create the pH perturbations. Since perturbations
were conducted at specific times, the latter is possible. Neither do they provide a
comparison of the recirculation control experiment to a control experiment without
recirculation, so it cannot be established whether recirculation itself was deleterious,
but to a lesser degree than the pH perturbations.
Perfusion culture of mammalian cells provides another, more frequently
studied, example of two-compartment culture. Pump damage was found to decrease
the viability of a variety of cell types, including of insect (Merten, 2000; Gorenflo et
al., 2004), hybridoma (LaPorte et al., 1996) and CHO cells (Kim et al., 2008). Pump
damage was a reported problem in the literature on perfusion culture, but no studies
could be found that provided a control study in which cell culture was pumped
around the perfusion circuit without perfusion of fresh medium and removal of by-
products (e.g., metabolites). In spite of possible pump damage, perfusion culture is
also often reported to have greater cell concentration and protein productivity than
fed-batch culture (Meuwly et al., 2006; Choo et al., 2007). Pumping effects may be
overwhelmed by the benefits generated by the continuous removal of by-products
and continuous supply of fresh medium. In support of this premise, perfusion
systems that do not circulate a cell suspension, such as depth-filter perfusion
systems, are often reported to provide improvements over conventional perfusion
(Lee et al., 2005). The rates of pumping in perfusion culture are, in any case, lower

Chapter 4: Results and Discussion of Scale-Down
212
than in this scale-down study, and are therefore likely to be less damaging. This
point is illustrated by perfusion rates, which are sometimes reported in STR volumes
per day (d-1). Perfusion systems might typically be operated at from 1 to 10 d-1,
around 1 to 10 mL min-1 for a 2 L laboratory-scale STR (Merten, 2000; Lee et al.,
2005; Choo et al., 2007; Kim et al., 2008). Compare this to the scale-down
experiments in this study that had a flow rate equivalent to from 108 to 216 d-1, for
120 s and 60 s residence times (RT), respectively.
Given that no damage was reported in the Osman et al. (2002) two-
compartment (STR+STR) study and that other continuous pumping studies provided
a poor comparison (i.e., flow rate is far greater for CPB and far lower for perfusion
cell culture), it was reasonable to consider peristaltic pumping as acceptable for
recirculation in this two-compartment study.
If it were accepted that pump damage, and therefore probably a shear flow or
shear mechanism of some sort (using shear in it loosest sense), were responsible for
the difference between the normal fed-batch STR and all of the experiments with
recirculation, then recirculation cases might bear some comparison with animal cell
culture under conditions of elevated shear. Unfortunately, there are few reliable
studies in this area and the mechanism by which shear damage was created would
likely differ from this scale-down study. Nevertheless, there is limited evidence that
cells’ response to shear varies throughout the duration of a typical STR cell culture
in accordance with the results of this scale-down study.
In the rapid phase of growth, cells have exhibited decreased susceptibility to
‘shear damage’ and, in accordance with this study, responded to shear with
increased µ (Mardikar and Niranjan, 2000). Furthermore, as in this study, during the

Chapter 4: Results and Discussion of Scale-Down
213
stationary and death phases, ‘shear sensitivity’ has been reported to increase with a
concomitant decrease in viability (Petersen et al., 1988; Zang et al., 1993).
Two relevant studies investigated the effects of ‘repetitive hydrodynamic
stress’ on CHO cells (Godoy-Silva et al., 2009b; Godoy-Silva et al., 2009a): rCHO
cells were, for the duration of the culture, circulated through a flow constriction
device, referred to as the torture chamber (TC). The TC was used to create a defined
energy dissipation rate, TC . The median of a distribution of maximum energy
dissipation rates, maxTC , was used to characterise the extent of the hydrodynamic
forces, the shear, acting on cells in the TC. A syringe pump was used instead of a
peristaltic, purportedly to create relatively pulse free flow; avoidance of ‘pump
damage’ was not reported as a factor in pump selection. The syringe pump was also
likely chosen as a reliable means to overcome the pressure drop created by the TC.
No ‘pump damage’ was reported.
Compared to the expected maximum local energy dissipation rate, maxT I ,
in a large-scale STR (less than 0.01 W kg-1) the values generated in their studies are
high; nevertheless, the repeated exposure to shear in the TC may be analogous to the
repeated exposure to the pump in this study, and it might therefore be instructive to
compare the two. Godoy-Silva et al. (2009b) found that repeated exposure to shear
ranging from 2.9 x 10² W kg-1 to 2.3 x 10³ W kg-1 increased µmax and decreased
viability, and culture duration of CHO cells (CHO-6E6), in accordance with this
study. However, the group’s later study (Godoy-Silva et al., 2009a) using the same
shear method on a different industrially relevant rCHO cell line (provided by Pfizer),
reported that maxTC from 60 W kg-1 to 6 x 10³ W kg-1 increased the glycosylation
Chapter 4: Results and Discussion of Scale-Down
214
of an IgG antibody (glycosylation was not measured in their earlier study) and did
not significantly alter any other aspect of the culture’s performance, including
viability, VCNmax and antibody titre. Different cell lines were used for their two
studies and it is therefore likely that their results were cell line specific, as they
noted (Godoy-Silva et al., 2009a). Sensitivity to shear has been found to vary
between cell lines (McQueen and Bailey, 1989; Zhang et al., 1993). It is important
to note that type and intensity of shear may be important (Tanzeglock et al., 2009),
and are certain to have differed between the PFR studied here and the TC.
Shear in the above continuous recirculation study (Godoy-Silva et al.,
2009a), was considered to have influenced protein production pathways in-vivo.
However, once secreted from the cell, the antibody very likely continues to be
sensitive to the effects of shear and there are several reports in the literature of
elevated protein aggregation and unfolding because of shear. Thus, if the detrimental
effects of recirculation on the cell culture were created by shear, then why was the
antibody unaffected?
When air-liquid interfaces are carefully removed, laminar shear rates in the
order of 1 x 10⁷ s-1 are reportedly required to cause aggregation and/or protein
unfolding in concentrated solutions of proteins of viscosity equal to water (Jaspe and
Hagen, 2006). Shear stress is perhaps a better measure of the denaturing force acting
on the protein; moreover, the shear stress required to disrupt animal cells is well
documented in the literature. The typical therapeutic protein formulation used in
studies for sensitivity to shear rate is a Newtonian fluid with viscosity similar to
water (Jaspe and Hagen, 2006), using viscosity, η (1 x 10⁻³ Pa s), shear stress,
(Pa), is simply calculated from shear rate, (s-1), using . Thus, using the

Chapter 4: Results and Discussion of Scale-Down
215
reported antibody damaging shear rate of 1 x 10⁷ s-1, antibody damage might be
expected at shear stresses above 1 x 10⁴ Pa.
Shear stresses reported as causing cell damage vary considerably from 19 x
10-3 Pa to 100 Pa with exposure times between 24 h and 10 minutes (Born et al.,
1992). Thus, it is clear that the shear stress required to disrupt animal cells is at least
two orders of magnitude less than that typically required to aggregate or unfold
globular proteins. Therefore, shear in the pump could have been sufficient to
decrease cell viability, while being insufficient to alter antibody folding and
aggregation.
Other potentially deleterious hydrodynamic factors (shear) such as air-liquid
interfaces (Maa and Hsu, 1997; Oliva et al., 2003) pump cavitation and bubble
entrainment have also been reported to cause aggregation and/or unfolding of
proteins during pumping for cross flow filtration (Narendranathan and Dunhill,
1982; van Reis and Zydney, 2007). The insignificant difference in antibody quality
between all experimental cases in this study suggests that such factors were not great
or were mitigated. Considering the far greater reported sensitivity of typical animal
cells to shear stress than therapeutic proteins, it is certainly possible that the cell
damage could have occurred at shear stress levels far below that required to damage
the antibody, and, as mentioned above, shear of this type has been found to damage
blood cells during continuous pumping. Thus, shear in the pump, such as cavitation
and other forms of bubble creation and destruction could have been sufficient to
decrease cell viability, while being insufficient to alter antibody folding and
aggregation.

Chapter 4: Results and Discussion of Scale-Down
216
In long-duration shear experiments, it has been speculated that the action of
damage to proteins attributed to shear might actually be attributable to uncontrolled
difficult-to-identify factors. Perhaps this is also the case for the pumping of animal
cells. Surface adsorption and associated conformational perturbations has been
reported to act synergistically with shear to cause IgG aggregation (Biddlecombe et
al., 2007), and during peristaltic pumping of recombinant interleukin-2, exposure to
silicone rubber surfaces (and not shear) caused 97% loss in bioactivity (Tzannis et
al., 1997). Sub-visible particulates have been shed from stainless steels pumps
causing aggregation (Cromwell et al., 2006; Tyagi et al., 2009). In addition, it has
been speculated that difficult-to-identify, uncontrolled factors in longer duration
shear experiments, like leaching of contaminants, could cause protein aggregation
(Bee et al., 2009).
In this study, neoprene particle contamination might have been caused by
tube wear at the pump head, and chemicals may leach from tubing or connecting
polymers (Hill et al., 2001); no reports were found of chemical leaching from
neoprene. In this study, the peristaltic pump created visible tube wear on the exterior
of the tubing in the pump head (neoprene was chosen because of its resilience),
perhaps some small particles were created by wear of the inner bore of the tubing,
such a process is referred to as spallation (Barron et al., 1986; Briceño and Runge,
1992). Particles were not observed, but could have been sub-visible. Whether they
existed is unknown, but such factors evidently did not alter antibody quality. It is
possible that the cell damage occurred at levels of physical and chemical
contaminants far below those damaging to the antibody, and surface interactions
may have detrimentally influenced only the cells. No reports in the literature could
Chapter 4: Results and Discussion of Scale-Down
217
be found that considered the influence of such factors during continuous long-
duration pumping of cell culture. No reports of chemical leaching from neoprene
tubing could be found in the literature. No reports could be found of cell viability
and titre diminution by non-visible neoprene or silicone particulates.
Silicone is generally considered stable and non-toxic, but it has been reported
that the method used to vulcanize the silicone influences its biocompatibility:
peroxide cured silicone tubing was found to be toxic to a suspension of tobacco
cells. Platinum cured silicone tubing, as used for the PFR in this study, was found to
be non-toxic (Park et al., 2005). In addition, biocompatibility is controlled for
assiduously in recent blood pumping studies, and damage from similar pumping
occurred (Mulholland et al., 2005). Nevertheless, by their very nature, it is difficult
to rule out the influence of such ‘difficult-to-identify’ factors on VCN, viability and
titre.
All three factors, heterogeneity, shear and difficult-to-identify could have
contributed to the damaging effects of recirculation. Indeed, possible synergistic
effects of all three could have exacerbated the negative influence of any other factor
that alone may have been negligible. Nevertheless, despite the absence of evidence
in the literature for peristaltic pump damage of animal cells at the flow rates used in
this study, it is proposed here that ‘shear’ was the predominant means by which cell
damage occurred, perhaps the occlusion mechanism that has been proposed to create
damage in blood pumping. Even if the maximum shear stress in the peristaltic pump
used in this study was an order an of magnitude less than the expected maximum
shear stress (~1000 Pa) calculated by CFD of a peristaltic blood pump, this GS-CHO

Chapter 4: Results and Discussion of Scale-Down
218
cell line need not be especially shear sensitive to have suffered some appreciable
damage over the duration of the culture.
In the literature, no study could be found that subjected a fed-batch animal
cell culture to continuous peristaltic pumping for the duration of the culture.
Comparison with perfusion culture is difficult because of the low flow rates used for
perfusion and fact that perfusion itself is intended to alter culture performance.
Insensitivity of this GS-CHO cell line to pH and substrate perturbations deliberately
introduced to the PFR suggests that heterogeneity created by recirculation alone had
little influence. The predominance of silicone and neoprene in cell culture suggest
high biocompatibility with cell culture, lowering the probability of difficult-to-
indentify factors; clearly, such factors were below the threshold required to damage
the antibody.
GS-CHO cell growth and protein production was shown in this study to be
robust, in accordance with Werner et al. (1998), and it can be concluded that if pH
and substrate perturbations in a large-scale (20 m3) STR are similar to those created
in this scale-down then they are unlikely to affect any important aspect of GS-CHO
culture performance.

219
Chapter 5: Conclusions
Research for this thesis was conducted to test the hypothesis that a two-compartment
scale-down model, like that used for scale-down of microbial cell culture, can be
used to generate perturbations in pH and substrate that resemble those that occur in a
large-scale stirred tank reactor for commercial production of therapeutic proteins
from animal cell culture. Further, that these perturbations influence important
aspects of the culture performance, such as antibody concentration (titre) and
antibody characteristics (antibody quality).
The results of this thesis provide evidence against both parts of this
hypothesis and instead support two conclusions, on the basis that the cell line used
in this study is not considered to be especially sensitive. Firstly, that recirculation
itself is a confounding factor in the creation of similar two-compartment scale-down
models for animal cell culture generally. It is considered likely that this is because of
their greater sensitivity, compared to microbial cells, to mechanical damage created
by some aspect of pumping, but greater sensitivity to other difficult-to-identify
factors cannot be excluded. Secondly, that perturbations in pH and substrate have no
significant influence to culture of this cell line with this process (e.g., medium
composition, feeds composition, feed schedule and reactor control parameters), and,
therefore, that perturbations associated with vessel heterogeneity at the large-scale
are unlikely to influence culture of the cell line at large-scale. Such perturbations,
however, may influence other cell lines more sensitive to pH or feed perturbations.
Experiments using a scale-down model combining a stirred tank reactor and
plug flow reactor (STR+PFR) were conducted with the aim of creating pH and

Chapter 5: Conclusions
220
substrate heterogeneity that was similar to the expected heterogeneity in these
parameters in a typical poorly mixed large-scale STR used for cultivation of animal
cells for therapeutic antibody production. pH and substrate perturbations were found
to have no significant effect on any measured parameter of the cell culture, including
cell viability, antibody titre and antibody quality (e.g., glycosylation). It was shown
that no significant difference existed between all experiments in which culture was
recirculated continuously from the STR and through the PFR. Scale-down
experiments in which perturbations were created in the PRF at mean residence times
(RT) of 60 seconds and 120 seconds (s) were all equivalent to the scale-down control
experiment, which had continuous recirculation, but pH control and substrate feed to
the STR. Thus, this strongly implies that for this scale-down model recirculation is a
confounding factor in the investigation of the influence of pH and substrate
perturbations.
All experiments with recirculation from the STR though the PFR by
continuous pumping with a peristaltic pump were found to have decreased viability
and antibody titre. Recirculation was found to decrease specific rate of antibody
productivity, qIgG, and shorten the rapid growth phase by approximately 48 hours
(h). Unlike the fed-batch STR, experiments with recirculation did not have a
pronounced stationary phase and cell death and significant viability decline began at
the end of the rapid growth phase. Metabolite profiles were unaltered in magnitude
and followed cell growth. Antibody quality was consistent for all experiments, with
or without recirculation, showing that antibody quality attributes for this cell line
were unaltered by deleterious conditions that resulted in considerably decreased cell

Chapter 5: Conclusions
221
viability and, furthermore, likely increased significantly the quantity of extracellular
agents considered able to alter antibody-characteristics.
It has not been possible to arrive at any firm conclusions as to the nature of
damage created by recirculation. Deleterious oxygen and other substrate
deprivations are considered unlikely because of animal cells’ low oxygen uptake rate
(OUR) and glucose uptake rate (GUR). (Note: substrate here refers to the nutrients in
the medium and feed, and composition was predominantly glucose). Calculations
using the expected OUR from the literature showed that oxygen limitation was
possible only at viable cell numbers (VCN) above 86 x 106 cells mL-1 for 120
seconds (s) mean residence time (RT) in the PFR and 170 x 105 cell mL-1 for the 60 s
RT case. Substrate consumption for the RT in the PFR was negligible. The
equivalence of both experimental cases (RT of 60 s and 120s), and the very unlikely
occurrence of oxygen limitation in the 60 s RT case, suggests that neither oxygen
nor substrate limitation were significant factors in either case.
The maximum energy dissipation rate generated by laminar flow at the wall
of the tubing at the maximum flow rate and minimum tubing diameter, max, pipe , was
shown (Section 4.3.3) to be three orders of magnitude below the minimum energy
dissipation rate, T , expected to cause damage to typical animal cells. The proven
industrial efficacy of the commercial glutamine synthetase Chinese hamster ovary
(GS-CHO) cell line used in this study means that greater than typical sensitivity was
improbable. Nevertheless, it is proposed that the most likely cause for recirculation
damage was some sort of shear, which may have been created by one or several
mechanisms, such as bubble entrainment, cavitation and shear stress created by tube
compression in the pump head. Several studies of the effects of peristaltic pumping

Chapter 5: Conclusions
222
on blood cells provide evidence that blood cells are damaged by the peristaltic
pumping and not oxygen deprivation or biocompatibility issues. Difficult-to-identify
uncontrolled factors such as poor biocompatibility of tubing materials may have
resulted from chemical leaching and particulate-cell interactions, which may have
increased significance with duration of recirculation. It is of course possible that one
or multiple types of shear and difficult-to-identify factors were acting synergistically
to become more damaging than they would have been alone, but with the high
biocompatibility of the materials used in this study this reason is considered less
likely.
For the first time, flow cytometer was applied to monitor the effects of the
scale-down on multiple parameters. Cell culture viability was measured on the flow
cytometer (FC) using a dual stain with Calcein-AM and Propidium Iodide (PI)
(Calcein-AM/PI). Calcein-AM was used as a positive control for viability; exclusion
stain PI was used to indentify dead cells based on their cytoplasmic membrane
integrity. This FC staining protocol was compared to the traditional method for
discrimination between live and dead cells: haemocytometer and Trypan Blue (TB)
exclusion. Both methods were used for all experiments; this allowed a reliable
statistical comparison of viable and dead cell counts by the two methods. This
comparison indicated that the flow cytometric method had erroneously included cell
debris in the dead cell count, increasing the total cell count above that found by the
haemocytometer. The likely cause for the inclusion of cell debris was the large
quantities of debris present in all scale-down experiments. No significant difference
in the viable cell number (VCN) was found between the flow cytometric and
haemocytometric methods.
Chapter 5: Conclusions
223
The presence of a small sub-population (~5%) that stained with both
Calcein-AM and PI in all experiments, demonstrates that Calcein-AM was an
unreliable single indicator of viability, contrary to the claims of some research
papers. The likely cause of the dual stained population was relatively slow exclusion
of Calcein (the fluorescent product) and/or energy independence of the intracellular
esterase reaction. It is thought highly probably that dual stained cells were killed at
some point during the staining method. Sample manipulation and a change of
environment are thought to have been responsible for cell death during the staining
procedure. Dual staining is therefore thought to provide a possible indicator of
a sub-population of viable cells that have increased sensitivity to the sub-optimal
conditions encountered during sampling and staining.
Dual staining with annexin V conjugated to phycoerythrin (AV-PE) and the
exclusion stain, Sytox Green (SG), (AV-PE/SG) was used to identify mode of cell
death in all experiments. SG is analogous to PI. AV-PE stains phosphatidylserine
(PS) when it translocates from the inside to the outside of the cytoplasmic
membrane; in apoptosis, this translocation of PS occurs while the integrity of the
cytoplasmic membrane is maintained. AV-PE was shown to be unreliable as a single
stain indicator of apoptosis because staining with the exclusion stain, SG, identified
cells as having permeable cytoplasmic membrane, and therefore as having died by
necrosis, not apoptosis. Indeed, in all experiments, cell death occurred only by
necrosis. The proven apoptosis inducer CCCP did not induce apoptotic cell death in
this cell line, and caused an increase in cell death by necrosis. The dual staining
results emphasise the importance and utility of combined staining with an exclusion
stain. Were AV-PE used alone, necrotic cells might easily have been misinterpreted

Chapter 5: Conclusions
224
as apoptotic. Indeed the light scattering properties of the necrotic cells in this study
were shown to be similar to those stated for apoptotic cells in one review paper.
An effort was made to develop flow cytometric protocols for monitoring
mitochondrial membrane potential (ΔΨm) by screening DiOC6(3) in conjunction
with PI, JC-1, and CM-H2XRos. CCCP was used as a ‘decoupler’ that has been
shown to effectively remove mitochondrial membrane potential in other studies.
Dual staining with DiOC6(3) and PI (DiOC6(3)/PI) showed that cells that stained
positive for intact ΔΨm with DiOC6(3) and positive for permeable cytoplasmic
membrane with PI. ΔΨm is very likely lost when the cytoplasmic membrane has lost
integrity and become permeable to PI; thus, DiOC6(3) proved to be an ineffective
monitor of ΔΨm. Binding of the stain in a ΔΨm independent manner suggests that
the lipophilic properties of the stain allowed non-specific cytoplasmic and cell
organelle staining.
The efficacy of JC-1 as an indicator of ΔΨm was cast into doubt by the
presence of staining indicative of elevated ΔΨm in cells that were shown, by back-
gating, to be necrotic in their light scattering properties. The light scattering
properties of necrotic cells in the cell line were established with confidence by back
gating from the green fluorescence v red fluorescence cytographs (GF-RF) of cells
stained with the two different exclusion stains, PI and SG, to forward scatter light v
side scatter light cytographs (FS-SS). Based on its ambiguous results, it was
concluded that JC-1 was an unreliable indicator of ΔΨm.
CM-H2XRos revealed a subpopulation of cells with elevated fluorescence.
By back gating to FS-SS cytographs it was shown that this population was likely
dead; however, it should be noted that the staining method involved fixing the cells

Chapter 5: Conclusions
225
in paraformaldehyde, which may have altered the cells’ light scattering properties.
Assuming that this population was dead, the elevated fluorescence was attributed to
increased levels of reactive oxidative species (ROS) created during mitochondrial
degradation, as opposed to elevated respiration, perhaps by decoupling. Despite
these positive results that suggest the stain could be used to detect elevated ROS,
CM-H2XRos did not pass through the screening stage because recent research by
another group had shown that nitrogen storage, which was unavailable, was required
for the stain to retain activity over the course of a typical cell culture period. Thus,
all of the prospective ΔΨm monitoring stains were found unsuitable at the screening
stage and were not used for characterisation of the fed-batch stirred tank reactor
(STR) or scale-down experiments.
Cell debris was shown by FS-SS cytographs to increase greatly in all
experiments with recirculation, indicating that dead cells were rapidly degraded by
some process that occurred during recirculation. Flow cytometric analysis of the
scale-down experiments showed that the mode of cell death and degree of
population heterogeneity was invariant for all experiments and was therefore
unchanged by the deleterious conditions created in the scale-down experiments. In
view of these results, it is likely that scale-up of this process to a poorly mixed STR
would not result in a more than acceptable alteration to antibody titre and antibody
quality.

226
Chapter 6: Recommendations for Future Work
Testing different pumps could establish if type of pump and pump specific shear
mechanisms are responsible for damage during continuous recirculation. One
mechanism of damage in peristaltic pumping might be the compression of a small
proportion of cells as the peristaltic pump’s rollers push fluid through the tubing. A
peristaltic pump with adjustable occlusion (i.e., the amount the roller compresses the
tubing), may surmount this problem. Tube diameter and roller width might also be
beneficially varied.
Consideration should also be given to pumps that operate using different
mechanisms to move fluid. Modern free flotation magnetically levitated (‘MagLev’)
centrifugal pumps (Hijikata et al., 2008) are purportedly capable of aseptically
pumping blood at the flow rates required for the scale-down with reported low levels
of haemolysis. In blood pumping, some studies have found that replacement of
peristaltic pump with centrifugal pump decreased haemolysis.
Syringe pumping has been used for continuous recirculation similar to that
conducted in this study without reported ‘shear damage’ and could be set-up so that
the syringe plunger stopped just short of the end of syringe head, to avoid possible
cell compression. However, syringe pumps may be unable to reach the relatively
large flow rate required for a 60-second mean residence time in the PFR. To avoid
problems of plunger wear, a Teflon plunger used with a glass syringe would likely
be required for continuous pumping during a 20-day culture. To identify poor
biocompatibility and other difficult-to-identify factors, different types of material for
tubing and connectors should be investigated.

Chapter 6: Recommendations for Future Work
227
Construction of a bespoke plug flow reactor (PFR) that creates turbulent
axial mixing at flow rates that would otherwise be in the laminar flow regime in pipe
flow would improve attainment of true plug flow. True plug flow would be useful
for modelling the scale-down mathematically, but may not significantly improve the
validity of the scale-down. Turbulence could be introduced by baffles or a
screw/helix. The PFR would need to be robust and either disposable or easily
cleaned and sterilised. A disposable option might be simply constructed by the
insertion of a reusable flexible plastic helix of appropriate diameter into a length of
silicon or neoprene tubing, as used in this study. A stainless steel construction is
recommended for any non-disposable option.
Significant and deleterious oxygen limitation was unlikely to have occurred
in the PFR, as shown by calculations of oxygen uptake rate (OUR); nevertheless, the
PFR would be improved by the incorporation of an O2 probe at its terminus. The
scale-down would also benefit by characterisation of the pH perturbation in the PFR.
Characterisation could be accomplished by the incorporation of two pH probes in
the PFR: one probe immediately down stream of the feeding point and a second
probe at the terminus. To accomplish this would probably require several control
units.
Further research with a scale-down would benefit from the comparison of
several different cell lines, as there is evidence in the literature that sensitivity to
perturbations (and ‘shear damage’) varies considerably between different cell lines.
Therapeutic proteins, too, have been shown to have varying sensitivity to conditions
in the STR, both during intracellular processing and while in the medium after
secretion from the cell.
Chapter 6: Recommendations for Future Work
228
Flow cytometric analysis demonstrated that the cell culture was unlikely to
exist as a binary mixture of live and dead cells, and was instead likely composed of
a mixture of cells with varying degrees of viability, and perhaps productivity. If cells
with elevated productivity were identified this could be used with the scale-down to
aid development of an improved process for transfer to the large-scale.
Mitochondrial membrane potential (ΔΨm) is known to correlate with mitochondrial
activity which is may be correlated with protein productivity. It would certainly
benefit characterisation of the scale-down if an effective protocol for measurement
of ΔΨm were developed for this cell line.
Apoptotic cell death was not observed in the GS-CHO cell line used for this
study, using the proven AV-PE/SG staining method. To support further the
conclusion that apoptosis does not occur in this cell line, different staining protocols
for mode of cell death would have to be developed and investigated. Knowledge of
the mode of cell death might permit future studies to optimise the process conditions
in the scale-down to favour the most desirable mode of cell death for any particular
process, possibly influencing productivity and down stream processing.

229
References
Akagi Y, Ito K, and Sawada S (1993). Radiation-Induced Apoptosis and Necrosis in Molt-4 Cells: a Study of Dose Effect Relationship and Their Modification. International Journal of Radiation Biology. 64: 47-56.
Al-Rubeai M (1999). Monitoring Animal Cell Growth and Productivity by Flow Cytometry. In: Animal Cell Biotechnology, (145-153). Humana Press.
Al-Rubeai M and Emery AN (1990). Mechanisms and Kinetics of Monoclonal Antibody Synthesis and Secretion in Synchronous and Asynchronous Hybridoma Cell Cultures. Journal of Biotechnology. 16: 67-85.
Al-Rubeai M, Emery AN, Chalder S, and Goldman MH (1993). A Flow Cytometric Study of Hydrodynamic Damage to Mammalian Cells. Journal of Biotechnology. 31: 161-177.
Al-Rubeai M, Kloppinger M, Fertig G, Miltenburg HG, and Emery AN (1992). Monitoring of Biosynthetic and Metabolic Activity in Animal Cell Culture Using Flow Cytometric Methods. In: European Society for Animal Cell Technology, The 11th Meeting., (301-306). Oxford: Butterworth-Heinemann.
Al-Rubeai M, Oh SKW, Musaheb R, and Emery AN (1990). Modified Cellular Metabolism in Hybridomas Subjected to Hydrodynamic and Other Stresses. Biotechnology Letters. 12: 323-328.
Al-Rubeai M, Singh RP, Goldman MH, and Emery NH (1995). Death Mechanisms of Animal Cells in Conditions of Intense Agitation. Biotechnology and Bioengineering. 45: 463-472.
Al-Rubeai M, Welsenback K, Lloyd R, and Emery AN (1996). A Rapid Method for Evaluation of Cell Number and Viability by Flow Cytometry. Cytotechnology. 24: 161-168.
Alberts B, Bray D, Lewis J, Raff M, Roberts K, and Watson JD (1989). Molecular Biology of the Cell. New York: Taylor & Francis.
Altamirano C, Illanes A, Becerra S, Cairo JJ, and Godia F (2006). Considerations on the Lactate Consumption by CHO Cells in the Presence of Galactose. Journal of Biotechnology. 125: 547-556.
Altman SA, Randers L, and Govind R (1993). Comparison of Typan Blue Exclusion and Fluorometric Assays for Mammalian Cell Viability Determinations. Biotechnology Progress. 9: 671-674.
Amanullah A (1994). Scale Down Models of Mixing Performance in Large Scale Bioreactors. University of Birmingham.
Amanullah A, McFarlane CM, Emery AN, and Nienow AW (2001). Scale-Down Model to Simulate Spatial PH Variations in Large-Scale Bioreactors. Biotechnology and Bioengineering. 73: 390-399.
230
Amanullah A, Nienow AW, and Buckland BC (2003). Mixing in the Fermentation and Cell Culture Industries. In: Handbook of Industrial Mixing; Science and Practice, (1071-1157). New York: Wiley-Interscience.
Amos B, Al-Rubeai M, and Emery AN (1992). Hybridoma Growth and Antibody Production in Extended Stationary States. In: Animal Cell Technology - Developments, Processes and Products, (254-257). Oxford: Butterworth-Heinemann.
Ananthakrishnan V, Gill WN, and Allen JB (1965). Laminar Dispersion in Capillaries: Part 1. Mathematical Analysis. American Institution of Chemical Engineers Journal. 11: 1063-1072.
Andersen DC and Goochee CF (1994). The Effect of Cell-Culture Conditions on the Oligosaccharide Structures of Secreted Glycoproteins. Current Opinion in Biotechnology. 5: 546-549.
Andree HA, Reutelingsperger CP, Hauptmann R, Hemker HC, Hermens WT, and Willems GM (1990). Binding of Vascular Anticoagulant Alpha (VAC Alpha) to Planar Phospholipid Bilayers. Journal of Biological Chemistry. 265: 4923-4928.
Arden and Betenbaugh (2006). Regulating Apoptosis in Mammalian Cell Cultures. Cytotechnology. 50: 77-92.
Arden N and Betenbaugh MJ (2004). Life and Death in Mammalian Cell Culture: Strategies for Apoptosis Inhibition. Trends in Biotechnology. 22: 174-180.
Arimochi H and Morita K (2006). Characterization of Cytotoxic Actions of Tricyclic Antidepressants on Human HT29 Colon Carcinoma Cells. European Journal of Pharmacology. 541: 17-23.
Armstrong JS, Steinauer KK, French J, Killoran PL, Walleczek J and Kochanski J et al. (2001). Bcl-2 Inhibits Apoptosis Induced by Mitochondrial Uncoupling but Does Not Prevent Mitochondrial Transmembrane Depolarization. Experimental Cell Research. 262: 170-179.
Aubin JE (1979). Autofluorescence of Viable Cultured Mammalian Cells. Journal of Histochemistry and Cytochemistry. 27: 36-43.
Augenstein DC, Sinskey AJ, and Wang DIC (1971). Effect of Shear on Death of 2 Strains of Mammalian Tissue Cells. Biotechnology and Bioengineering. 13: 409-418.
Bailey JE and Ollis DF (1986). Biochemical Engineering Fundamentals. New York: McGraw-Hill.
Bajpai RK and Reuss M (1982). Coupling of Mixing and Microbial Kinetics for Evaluating the Performance of Bioreactors. The Canadian Journal of Chemical Engineering. 60: 384-392.
Barda-Saad M, Zhang AS, Zipori D, and Rozenszajn LA (1997). Adhesion of Thymocytes to Bone Marrow Stromal Cells: Regulation by BFGF and IFN-{Gamma}. Stem Cells. 15: 229-236.
231
Barnes LM, Bentley CM, and Dickson AJ (2000). Advances in Animal Cell Recombinant Protein Production: GS-NS0 Expression System. Cytotechnology. 32: 109-123.
Barron D, Harbottle S, Hoenich NA, Morley AR, Appleton D, and McCabe JF (1986). Particle Spallation Induced by Blood Pumps in Hemodialysis Tubing Sets. Artificial Organs. 10: 226-235.
Batandier C, Fontaine E, Keriel C, and Leverve XM (2002). Determination of Mitochondrial Reactive Oxygen Species: Methodological Aspects. Journal of Cellular and Molecular Medicine. 6: 175-187.
Bee JS, Stevenson JL, Mehta B, Svitel J, Pollastrini J, and Platz R et al. (2009). Response of a Concentrated Monoclonal Antibody Formulation to High Shear. Biotechnology and Bioengineering. 103: 936-943.
Benson RC, Meyer RA, Zaruba ME, and McKhann GM (1979). Cellular Autofluorescence--Is It Due to Flavins? Journal of Histochemistry and Cytochemistry. 27: 44-48.
Berstein EF, Indeglia RA, Shear MA, and Varco RL (1967). Sublethal Damage to the Red Blood Cell From Pumping. Circulation. 35: 226-233.
Biddlecombe JG, Craig AV, Zhang H, Uddin S, Mulot S, and Fish BC et al. (2007). Determining Antibody Stability: Creation of Solid-Liquid Interfacial Effects Within a High Shear Environment. Biotechnology Progress. 23: 1218-1222.
Birch J. (2005). Future Perspectives of Antibody Manufacturing (Lonza).
Birch J, Thompson PW, and Boraston R (1985). Production of Monoclonal Antibodies in Large-Scale Cell Culture. Biochemical Society Transactions 609th Meeting. 13: 10-11.
Birch JR and Racher AJ (2006). Antibody Production. Advanced Drug Delivery Reviews. 58: 671-685.
Blackshear PLJ, Dorman FD, and Steinbach JH (1965). Some Mechanical Effects That Influence Hemolysis. American Society for Artificial Internal Organs. 11: 112-117.
Bluestein M and Mockros L (1969). Hemolytic Effects of Energy Dissipation in Flowing Blood. Medical and Biological Engineering and Computing. 7: 1-16.
Born C, Zhang Z, AlRubeai M, and Thomas CR (1992). Estimation of Disruption of Animal-Cells by Laminar Shear-Stress. Biotechnology and Bioengineering. 40: 1004-1010.
Borys MC, Linzer DI, and Papoutsaki ET (1993). Culture pH Affects Expression Rates and Glycosylation of Recombinant Mouse Placental Lactogen Proteins by Chinese Hamster Ovary (CHO) Cells. Biotechnology (N Y). 11: 720-724.
Boulton-Stone JM (1995). The Effect of Surfactant on Bursting Gas Bubbles. Journal of Fluid Mechanics. 302: 231-257.
Boulton-Stone JM and Blake JR (1993). Gas Bubbles Bursting at a Free Surface. Journal of Fluid Mechanics. 254: 103-111.

232
Bourne T, Fossati G, and Nesbitt A (2008). A PEGylated Fab' Fragment Against Tumor Necrosis Factor for the Treatment of Crohn Disease - Exploring a New Mechanism of Action. Biodrugs. 22: 331-337.
Bratosin D, Mitofan L, Palii C, Estaquier J, and Montreuil J (2005). Novel Fluorescence Assay Using Calcein-AM for the Determination of Human Erythrocyte Viability and Aging. Cytometry Part A. 66A: 78-84.
Briceño JC and Runge TM (1992). Tubing Spallation in Extracorporeal Circuits. An In Vitro Study Using an Electronic Particle Counter. The International Journal of Artificial Organs. 15: 222-228.
Brodkey RS and Reuss M (1982). Fundamentals of Turbulent Motion, Mixing and Kinetics. Chemical Engineering Communications. 8: 1-23.
Browing J, Varnedoe NB, and Swinford LR (1951). Fragility of Tetrahymena Geleii in Different Salt Solutions. Texas Reports on Biology and Medicine. 9: 420-427.
Buchs J and Zoels B (2001). Evaluation of Maximum to Specific Power Consumption Ratio in Shaking Bioreactors. Journal of Chemical Engineering Japan. 34: 647-653.
Butler M (2004a). Growth and Maintenance of Cells in Culture. In: Animal Cell Culture & Technology, (47-66). Padstow: Garland Science/ BIOS Scientific Publishers.
Butler M (2004b). The Glycosylation of Proteins in Cell Culture. In: Animal Cell Culture & Technology, (113-134). New York: Garland Science/BIOS Scientific Publishers.
Butler M (2005a). Animal Cell Cultures: Recent Achievements and Perspectives in the Production of Biopharmaceuticals. Applied Microbiology and Biotechnology. 68: 283-291.
Butler M (2005b). Optimisation of the Cellular Metabolism of Glycosylation for Recombinant Proteins Produced by Mammalian Cell Systems. Cytotechnology. 50: 57-76.
Bylund F, Collet E, Enfors S, and Larsson G (1998). Substrate Gradient Formation in the Large-Scale Bioreactor Lowers Cell Yield and Increases by-Product Formation. Bioprocess Engineering. 18: 171-180.
Bylund F, Guillard F, Enfors SO, Tragardh C, and Larsson G (1999). Scale Down of Recombinant Protein Production: a Comparative Study of Scaling Performance. Bioprocess Engineering. 20: 377-389.
Byun T, Zeng A, and Deckwer W (1994). Reactor Comparison and Scale-Up for the Microaerobic Production of 2,3-Butanediol by Enterobacter Aerogenes at Constant Oxygen Transfer Rate. Bioprocess and Biosystems Engineering. 11: 167-175.
Cacia J, Quan CP, Vasser M, Sliwkowski MB, and Frenz J (1993). Protein Sorting by High Performance Liquid Chromatography. I: Biomimetic Interaction Chromatography of Recombinant Human Deoxyribonuclease I on Polyionic Stationary Phase. Journal of Chromatography. 634: 229-239.

233
Campbell NA, Reece JB, and Mitchell LG (1995). Cellular Respiration: Harvesting Chemical Energy. In: Biology, (147-167). New York: Benjamin Cummings.
Capiaumont J, Legrand C, Carbonell D, Dousset B, Belleville F, and Nabet P (1995). Methods for Reducing the Ammonia in Hybridoma Cell Cultures. Journal of Biotechnology. 39: 49-58.
Carvlhal AV, Marcelino I, and Carrondo MJT (2003). Metabolic Changes During Cell Growth Inhibition by P27 Overexpression. Applied Microbiology and Biotechnology. 63: 164-173.
Castedo M, Hirsch T, Susin SA, Zamzami N, Marchetti P, and Macho A et al. (1996). Sequential Acquisition of Mitochondrial and Plasma Membrane Alterations During Early Lymphocyte Apoptosis. Journal of Immunological Methods. 157: 512-521.
Catchpoole DR and Stewart BW (1993). Etoposide-Induced Cytotoxicity in Two Human T-Cell Leukemic Lines: Delayed Loss of Membrane Permeability Rather Than DNA Fragmentation As an Indicator of Programmed Cell Death. Cancer Research. 53: 4287-4296.
Chaderjian WB, Chin ET, Harris RJ, and Etcheverry TM (2005). Effect of Copper Sulfate on Performance of a Serum-Free CHO Cell Culture Process and the Level of Free Thiols in the Recombinant Antibody Expressed. Biotechnology Progress. 21: 550-553.
Chance B, Sies H, and Boveris A (1979). Hydrogen Peroxide Metabolism in Mammalian Organs. Physiological Reviews. 59: 527-605.
Chen P and Harcum SW (2005). Effects of Amino Acid Additions on Ammonium Stressed CHO Cells. Journal of Biotechnology. 117: 277-286.
Chen Z, Lutkemeyer D, Iding K, and Lehmann J (2001). High-Density Culture of Recombinant Chinese Hamster Ovary Cells Producing Prothrombin in Protein-Free Medium. Biotechnology Letters. 23: 767-770.
Chi EY, Krishnan S, Randolph TW, and Carpenter JF (2003). Physical Stability of Proteins in Aqueous Solution: Mechanism and Driving Forces in Nonnative Protein Aggregation. Pharmaceutical Research. 20: 1325-1336.
Chien S (2008). Effects of Disturbed Flow on Endothelial Cells. Annals of Biomedical Engineering. 36: 554-562.
Choo CY, Tian Y, Kim WS, Blatter E, Conary J, and Brady CP (2007). High-Level Production of a Monoclonal Antibody in Murine Myeloma Cells by Perfusion Culture Using a Gravity Settler. Biotechnology Progress. 23: 225-231.
Christi Y and Moo-Young M (1994). Clean-in-place systems for industrial bioreactors: design, validation and operation. Journal of Industrial Microbiology. 13: 201-207.
Chotigeat W, Watanapokasin Y, Mahler S, and Gray PP (1994). Role of Environmental-Conditions on the Expression Levels, Glycoform Pattern and Levels of Sialyltransferase for Hfsh Produced by Recombinant Cho Cells. Cytotechnology. 15: 217-221.

234
Cocomartin JM, Oberink JW, Vanderveldendegroot TAM, and Beuvery EC (1992). Viability Measurements of Hybridoma Cells in Suspension-Cultures. Cytotechnology. 8: 57-64.
Cohen MG, Sun XM, Snowden RT, Dinsdale D, and Skilleter DN (1992). Key Morphological Features of Apoptosis May Occur in Absence of Internucleosomal DNA Fragmentation. Biochemistry Journal. 286: 331-334.
Cohen SN, Chang ACY, Boyer HW, and Helling RB (1973). Construction of Biologically Functional Bacterial Plasmids In-Vitro. Proceedings of the National Academy of Sciences of the United States of America. 70: 3240-3244.
Cossarizza A, Baccaranicontri M, Kalashnikova G, and Franceschi C (1993). A New Method for the Cytofluorometric Analysis of Mitochondrial Membrane Potential Using the J-Aggregate Forming Lipophilic Cation 5,5',6,6'-Tetrachloro-1,1',3,3'-Tetraethylbenzimidazolcarbocyanine Iodide (JC-1). Biochemical and Biophysical Research Communications. 197: 40-45.
Cossarizza A, Kalashnikova G, Grassilli E, Chiappelli F, Salvioli S, and Capri M et al. (1994). Mitochondrial Modifications During Rat Thymocyte Apoptosis: A Study at the Single Cell Level. Experimental Cell Research. 214: 323-330.
Costes J and Couderc JP (1988). Study by Laser Doppler Anemometry of the Turbulent Flow Induced by a Rushton Turbine in a Stirred Tank: Influence of the Size of the Units - II. Spectral Analysis and Scales of Turbulence. Chemical Engineering Science. 43: 2765-2772.
Coulson JW and Richardson JF (2000). Coulson and Richardson's Chemical Engineering Volume 1: Fluid Flow, Heat Transfer and Mass Transfer. Oxford: Butterworth-Heinemann.
Cromwell MEM, Hilario E, and Jacobson F (2006). Protein Aggregation and Bioprocessing. American Association of Pharmaceutical Scientists. 8: 572-579.
Cruz HJ, Dias EM, Peixoto CM, Moreira JL, and Carrondo MJT (2000). Product Quality of a Recombinant Fusion Protein Expressed in Immobilised Baby Hamster Kidney Cells Grown in Protein-Free Medium. Biotechnology Letters. 22: 677-682.
Curtis WR (2000). Hairy Roots, Bioreactor Growth. In: Encyclopedia of Cell Technology, (827-841). New York: John Wiley & Sons.
Cutter LA (1966). Flow and Turbulence in a Stirred Tank. American Institution of Chemical Engineers Journal. 12: 35-45.
Dang CV, Semenza GL. (1999). Oncogenic Alterations of Metabolism. Trends in Biochemical Sciences. 24: 68-72.
Darzynkiewicz Z, Bruno S, and Bino G (1992). Features of Apoptotic Cells Measured by Flow Cytometry. Cytometry. 13: 795-808.
Darzynkiewicz Z, Gloria J, Li X, Gorcyzca W, Murakami T, Traganos F (1996). Cytometry in Cell Necrobiology: Analysis of Apoptosis and Accidental Cell Death (Necrosis). Cytometry. 27: 1-20.

235
de Graaf AO, van den Heuvel LP, Dijkman HBPM, De Abreu RA, Birkenkamp KU, and de Witte T et al. (2004). Bcl-2 Prevents Loss of Mitochondria in CCCP-Induced Apoptosis. Experimental Cell Research. 299: 533-540.
deZengotita VM, Schmelzer AE, and Miller WM (2002a). Characteracterisation of Hybridoma Cell Responses to Elevated pCO2 and Osmolality: Intracellular pH, Cell Size, Apoptosis, and Metabolism. Biotechnology and Bioengineering. 77: 369-380.
deZengotita VM, Abston LR, Schmelzer AE, Shaw S, and Miller WM (2002b). Selected Amino Acids Protect Hybridoma and CHO Cells From Elevated Carbon Dioxide and Osmolality. Biotechnolgy and Bioengineering. 78: 741-752.
Degli Esposti M (2002). Measuring Mitochondrial Reactive Oxygen Species. Methods. 26: 335-340.
Desa DOJ (2010). Transfer Lag. In: Instrumentation for Process Control Fundamentals, (142-143). New York: Taylor & Francis.
Desagher S and Martinou JC (2000). Mitochondria As the Central Control Point of Apoptosis. Trends in Cell Biology. 10: 369-377.
Deshpande RR and Heinzle E (2004). On-Line Oxygen Uptake Rate and Culture Viability Measurement of Animal Cell Culture Using Microplates With Integrated Oxygen Sensors. Biotechnology Letters. 26: 763-767.
Doran PM (1993). Design of Bioreactors for Plant Cells and Organs. In: Bioprocess Design and Control, (115-168). Heidelberg: Springer.
Dove A (2002). Uncorking the Biomanufacturing Bottleneck. Nature Biotechnology. 20: 777-779.
Duchen MR (2004). Mitochondria in Health and Disease: Perspectives on a New Mitochondrial Biology. Molecular Aspects of Medicine. 25: 365-451.
Ducommun P, Ruffieux PA, Furter MP, Marison I, and von Stockar U (2000). A New Method for on-Line Measurement of the Volumetric Oxygen Uptake Rate in Membrane Aerated Animal Cell Cultures. Journal of Biotechnology. 78: 139-147.
Elo MA, Karjalainen HM, Sironen RK, Valmu L, Redpath NT, and Browne GJ et al. (2005). High Hydrostatic Pressure Inhibits the Biosynthesis of Eukaryotic Elongation Factor 2. Journal of Cellular Biochemistry. 94: 497-507.
Enfors S-O, Jahic M, Rozkov A, Xu B, Hecker M, and KJ Morrow et al. (2001). Physiological Responses to Mixing in Large Scale Bioreactors. Journal of Biotechnology. 85: 175-185.
Europe AF, Gambhir A, Fu PC, and Hu WS (2000). Multiple Steady States With Distinct Cellular Metabolism in Continuous Culture of Mammalian Cells. Biotechnology and Bioengineering. 67: 25-34.
Fadok VA, Voelker DR, Campbell PA, Cohen JJ, Bratton DL, and Henson PM (1992). Exposure of Phosphatidylserine on the Surface of Apoptotic Lymphocytes Triggers

236
Specific Recognition and Removal by Macrophages. Journal of Immunological Methods. 148: 2207-2216.
Li F, Hashimura Y, Pendleton R, Harms J, Collins E, and Lee B (2006). A Systematic Approach to Scale-Down Model Development and Characterisation of Commercial Cell Culture Processes. Biotechnology Progress. 22: 696-703.
Fieder J, Schorn P, Bux R, and Noe W (1995). Increase of Productivity in Recombinant CHO by Enhanced Glucose Levels. In: Animal Cell Technology: Development Towards 21st Century, (163-167). Dordrecht: Kluwer Academic Publishers.
Fiore M and Degrassi F (1999). Dimethyl Sulfoxide Restores Contact Inhibition-Induced Growth Arrest and Inhibits Cell Density-Dependent Apoptosis in Hamster Cells. Experimental Cell Research. 251: 102-110.
Fleischaker RJ and Sinskey A (1981). Oxygen Demand and Supply in Cell Culture. European Journal of Applied Microbiology and Biotechnology. 12: 193-197.
Frey T (1997). Correlated Flow Cytometric Analysis of Terminal Events in Apoptosis Reveals Absense of Some Changes in Some Model Systems. Cytometry Part A. 28: 253-263.
Fukuda K, Masamichi K, and Chui JF (1993). Demonstration of Extensive Chromatin Cleavage in Transplanted Morris Hepatoma 7777 Tissue: Apoptosis or Necrosis? American Journal of Pathology. 142: 935-946.
Garnier A, Voyer R, Rosanne T, Perret S, Barbara J, and Kamen A (1996). Dissolved Carbon Dioxide Accumulation in a Large Scale and High Density Production of TGF Receptor With Baculovirus Infected Sf-9. Cytotechnology. 22: 53-63.
Geckil H, Stark BC, and Webster DA (2001). Cell Growth and Oxygen Uptake of Escherichia Coli and Pseudomonas Aeruginosa Are Differently Effected by the Genetically Engineered Vitreoscilla Hemoglobin Gene. Journal of Biotechnology. 85: 57-66.
George S, Larsson G, and Enfors S-O (1993). A Scale-Down Two-Compartment Reactor With Controlled Substrate Oscillations: Metabolic Response of Saccharomyces Cerevisiae. Bioprocess Engineering. 9: 249-257.
Godoy-Silva R, Chalmers JJ, Casnocha SA, Bass LA, and Ma N (2009a). Physiological Responses of CHO Cells to Repetitive Hydrodynamic Stress. Biotechnology and Bioengineering. 103: 1103-1117.
Godoy-Silva R, Mollet M, and Chalmers JJ (2009b). Evaluation of the Effect of Chronic Hydrodynamical Stresses on Cultures of Suspended CHO-6E6 Cells. Biotechnology and Bioengineering. 102: 1119-1130.
Goergen JL, Marc A, and Engasser JM (1993). Determination of Cell Lysis and Death Kinetics in Continuous Hybridoma Cultures From the Measurement of Lactate Dehydrogenase Release. Cytotechnology. 11: 189-195.

237
Goldman MH, Ison AP, James DC, and Bull AT (1997). Monitoring Proteolysis of Recombinant Human Interferon-Gamma During Batch Culture of Chinese Hamster Ovary Cells. Cytotechnology. 23: 103-111.
Goldstein G (1986). An Overview of Orthoclone Okt3. Transplantation Proceedings. 18: 927-930.
Goochee CF, Gramer MJ, Andersen DC, Bahr JB, and Rasmussen JR (1991). The Oligosaccharides of Glycoproteins: Bioprocess Factors Affecting Oligosaccharide Structure and Their Effect on Glycosylation Properties. Biotechnology (NY). 9: 1347-1355.
Goochee CF and Monica T (1990). Environmental Effects on Protein Glycosylation. Biotechnology (NY). 8: 421-427.
Gorenflo VM, Pfeifer TA, Lesnicki G, Kwan EM, Grigliatti TA, and Kilburn DG et al. (2004). Production of a Self-Activating CBM-Factor X Fusion Protein in a Stable Transformed Sf9 Insect Cell Line Using High Cell Density Perfusion Culture. Cytotechnology. 44: 93-102.
Goswami J, Sinskey AJ, Steller H, Stephanopoulos GN, and Wang DIC (1999). Apoptosis in Batch Cultures of Chinese Hamster Ovary Cells. Biotechnology and Bioengineering. 62: 632-640.
Gramer MJ, Goochee CF, Chock VY, Brousseau DT, and Sliwkowski MB (1995). Removal of Sialic Acid From a Glycoprotein in CHO Cell Culture Supernatant by Action of an Extracellular CHO Cell Sialidase. Nature Biotechnology. 13: 692-698.
Gray DR, Chen S, Howarth W, Inlow D, and Maiorella BL (1996). CO2 in Large-Scale and High-Density CHO Cell Perfusion Culture. Cytotechnology. 22: 65-78.
Gu X and Wang DIC (1998). Improvement of Interferon Gamma Sialylation in Chinese Hamster Ovary Cell Culture by Feeding of N-Acetylmannosamine. Biotechnology and Bioengineering. 58: 642-648.
Guile GR, Rudd PM, Wing DR, Prime SB, and Dwek RA (1996). A Rapid High-Resolution High-Performance Liquid Chromatographic Method for Separating Glycan Mixtures and Analyzing Oligosaccharide Profiles. Analytical Biochemistry. 240: 210-226.
Gupta A and Rao G (2003). A Study of Oxygen Transfer in Shake Flasks Using a Non-Invasive Oxygen Sensor. Biotechnology and Bioengineering. 84: 351-358.
Haase SB (2004). Cell Cycle Analysis of Budding Yeast Using SYTOX Green. Current Protocols in Cytometry. 7.23.
Hansbro SD, Sharpe DA, Catchpole R, Welsh KR, Munsch CM, and McGoldrick JP et al. (1999). Haemolysis During Cardiopulmonary Bypass: an in Vivo Comparison of Standard Roller Pumps, Nonocclusive Roller Pumps and Centrifugal Pumps. Perfusion. 14: 3-10.
Hansen K, Kjalke M, Rasmussen P, Kongerslev L, and Ezban M (1997). Proteolytic Cleavage of Recombinant Two-Chain Factor VIII During Cell Culture Production Is

238
Mediated by Protease(s) From Lysed Cells. The Use of Pulse Labelling Directly in Production Medium. Cytotechnology. 24: 227-234.
Hansford GS and Humphrey AE (1966). The Effect of Equipment Scale and Degree of Mixing on Continuous Fermentation Yield at Low Dilution Rates. Biotechnology and Bioengineering. 8: 85-96.
Harris RJ, Kabakoff B, Macchi FD, Shen FJ, Kwong M, and Andya JD et al. (2001). Identification of Multiple Sources of Charge Heterogeneity in a Recombinant Antibody. Journal of Chromatography B: Biomedical Sciences and Applications. 752: 233-245.
Haugland RP (2002). Handbook of Fluorescent Probes and Research Products.
Hayter PM, Curling EMA, Baines AJ, Jenkins N, Salmon I, and Strange PG et al. (1991). Chinese Hamster Ovary Cell Growth and Interferon Production Kinetics in Stirred Batch Culture. Applied Microbiology and Biotechnology. 34: 559-564.
Hayter PM, Curling EMA, Baines AJ, Jenkins N, Salmon I, and Strange PG et al. (1992a). Glucose-Limited Chemostat Culture of Chinese-Hamster Ovary Cells Producing Recombinant Human Interferon-Gamma. Biotechnology and Bioengineering. 39: 327-335.
Hayter PM, Kirkby NF, and Spier RE (1992b). Relationship Between Hybridoma Growth and Monoclonal Antibody Production. Enzyme and Microbial Technology. 14: 454-461.
Henzler HJ and Shedel M (1991). Suitability of the Shaking Flask for Oxygen Supply to Microbial Cultures. Bioprocess Engineering. 7: 121-131.
Hermeling S, Crommelin DJ, Schellekens H, and Jiskoot W (2004). Structure-Immunogenicity Relationships of Therapeutic Proteins. Pharmaceutical Research. 21: 897-903.
Hewitt CJ, Boon LA, and McFarlane CM (1998). The Use of Flow Cytometry to Study the Impact of Fluid Mechanical Stress on Escherichia Coli W3110 During Continuous Cultivation in an Agitated Bioreactor. Biotechnology and Bioengineering. 59: 612-620.
Hewitt CJ and Nebe-Von-Caron G (2001). An Industrial Application of Multiparameter Flow Cytometry: Assessment of Cell Physiological State and Its Application to the Study of Microbial Fermentations. Cytometry. 44: 179-187.
Hewitt CJ, Nebe-Von-Caron G, Axelsson R, Farlane CM, and Nienow AW (2000). Studies Related to the Scale-Up of High-Cell-Density E. Coli Fed-Batch Fermenations Using Multiparameter Flow Cytometry: Effect of a Changing Microenvironment With Respect to Glucose and Dissolved Oxygen Concentration. Biotechnology and Bioengineering. 70: 381-390.
Hijikata W, Shinshi T, Asama J, Li J, Hoshi H, and Takatani S et al. (2008). A Magnetically Levitated Centrifugal Blood Pump With a Simple-Structured Disposable Pump Head. Artificial Organs. 32: 531-540.
239
Hill SS, Shaw BR, and Wu AHB (2001). The Clinical Effects of Plasticizers, Antioxidants, and Other Contaminants in Medical Polyvinylchloride Tubing During Respiratory and Non-Respiratory Exposure. Clinica Chimica Acta. 304: 1-8.
Hoeks F, Mommers R, Guter D, Willems M, Osman JJ, and Khan M et al. (2004). Industrial Applications of Mixing and Mass Transfer Studies.
Hu WS, Dodge TC, Frame KK, and Himes VB (1987). Effect of Glucose on the Cultivation of Mammalian Cells. Developments in Biological Standardization. 66: 279-290.
Ifandi V and Al-Rubeai M (2005). Regulation of Cell Proliferation and Apoptosis in CHO-K1 Cells by the Coexpression of C-Myc and Bcl-2. Biotechnology Progress. 21: 671-677.
Isailovic B (2007). The Use of Multi-Parameter Flow Cytometry for Characterisation of Insect Cell Baculovirus Culture. University of Birmingham.
Isailovic B, Hicks R, Taylor IW, Nienow A, and Hewitt CJ (2007). The Use of Multi-Parameter Flow Cytometry for Characterisation of Insect Cell-Baculovirus Cultures. Cell Technology for Cell Products. In: Cell Technology for Cell Products, (575-577). Dordrecht: Springer.
Ishaque A (2000). Apoptosis in Mammalian Batch Cell Cultures. University of Birmingham.
Ishaque A and Al-Rubeai M (1998). Use of Intracellular PH and Annexin-V Flow Cytometric Assays to Monitor Apoptosis and Its Suppression by Bcl-2 Over-Expression in Hybridoma Cell Culture. Journal of Immunological Methods. 221: 43-57.
Jacopo U, Rita G, Silvana B, Renato S, Roberto C, Bianca MR et al. (2000). Calcein-AM Is a Detector of Intracellular Oxidative Activity. Histochemistry and Cell Biology. 122: 499-505.
Jaspe J and Hagen SJ (2006). Do Protein Molecules Unfold in Simple Shear Flow. Biophysical Journal. 91: 3415-3424.
Jayapal KR, Wlaschin KF, Hu WS, and Yap MGS (2007). Recombinant Protein Therapeutics From CHO Cells - 20 Years and Counting. Chemical Engineering Progress. 103: 40-47.
Jem JK, Fateen S, and Michaels J (1994). Mixing Phenomena in Industrial Bioreactors With Perfusion Spin Filters. In: Animal Cell Technology: Products of Today, Prospects for Tomorrow, (392-396). Oxford: Butterworth Heinemann.
Jenkins N (2007). Modification of Therapeutic Proteins: Challenges and Prospects. Cytotechnology. 53: 121-125.
Jenkins N and Curling EM (1994). Glycosylation of Recombinant Proteins: Problems and Prospects. Enzyme and Microbial Technology. 16: 354-364.
Jenkins N, Parekh RB, and James DC (1996). Getting Glycosylation Right: Implications for the Biotechnology Industry. Nature Biotechnology. 14: 975-981.
240
Jiskoot W, Beuvery EC, de Koning AAM, Herron JN, and Crommelin DJA (1990). Analytical Approaches to the Study of Monoclonal Antibody Stability. Pharmaceutical Research. 7: 1234-1241.
Jolicoeur M, Chavarie C, Carreu PJ, and Archambault J (1992). Development of a Helical Ribbon Impeller Bioreactor for High Density Plant Cell Suspension Culture. Biotechnology and Bioengineering. 39: 511-521.
Jones PT, Dear PH, Foote J, Neuberger MS, and Winter G (1986). Replacing the Complementarity-Determining Regions in a Human Antibody With Those From a Mouse. Nature. 321: 522-525.
Kaarinanta K, Elo MA, Sironen RK, Karjalainen HM, Helminen HJ, and Lammi MJ (2003). Stress Responses of Mammalian Cells to High Hydrostatic Pressure. Biorheology. 40: 87-92.
Katinger HWD (1976). Physiological Response of Candida-Tropicalis Grown on N-Paraffin to Mixing in a Tubular Closed-Loop Fermenter. European Journal of Applied Microbiology. 3: 103-114.
Kays WM and Crawford ME (1980). Convective Heat and Mass Transfer. New York: McGraw-Hill.
Kenty B, Li Z, Vanden T, and Lee S (2005). Mixing in Laboratory-Scale Bioreactors Used for Mammalian Cell Culture. In: 229th American Chemical Society National Meeting, San Diego, CA, USA.
Kieran PM, O'Donnell HJ, Malone DM, and MacLoughlin PF (1995). Fluid Shear Effects on Suspension Cultures of Morinda Citrifolia. Biotechnology and Bioengineering. 45: 415-425.
Kim BJ, Oh DJ, and Chang HN (208). Limited Use of Centritech Lab II Centrifuge in Perfusion Culture of RCHO Cells for the Production of Recombinant Antibody. Biotechnology Progress. 24: 166-174.
Kim DY, Won SJ, and Gwag BJ (2002). Analysis of Mitochondrial Free Radical Generation in Animal Models of Neuronal Disease. Free Radical Biology and Medicine. 33: 715-723.
Kim NS and Lee GM (2002). Response of Recombinant Chinese Hamster Ovary Cells to Hyperosmotic Pressure: Effect of Bcl-2 Expression. Journal of Biotechnology. 95: 237-248.
Kimura R and Miller WM (1997). Glycosylation of CHO-Derived Recombinant TPA Produced Under Elevated pCO2. Biotechnology Progress. 13: 311-317.
Kimura R and Miller WM (1996). Effects of Elevated pCO2 and/or Osmolality on the Growth and Recombinant TPA Production of CHO Cells. Biotechnology and Bioengineering. 52: 152-160.
King MA (2000). Detection of Dead Cells and Measurement of Cell Killing by Flow Cytometry. Journal of Immunological Methods. 243: 155-166.

241
Kioukia N, Nienow AW, Emery AN, and Al-Rubeai M (1995). Physiological and Environmental Factors Affecting the Growth of Insect Cells and Infection With Baculovirus. Journal of Biotechnology. 38: 243-251.
Kiss R, Croughan M, and Trask J (1994). Mixing Time Characterisation in Large-Scale Mammalian Cell Bioreactors. In American Institute of Chemical Engineers Annual Meeting, San Francisco, CA, USA. Paper No. 55c.
Kluck RM, Bossy-Wetzel E, Green DR, and Newmeyer DD (1997). The Release of Cytochrome c From Mitochondria: A Primary Site for Bcl-2 Regulation of Apoptosis. Science. 275: 1132-1136.
Kohler G and Milstein C (1975). Continuous Cultures of Fused Cells Secreting Antibody of Predefined Specificity. Nature. 256: 495-497.
Kohler G and Milstein C (2005). Pillars Article: Continuous Cultures of Fused Cells Secreting Antibody of Predefined Specificity. Journal of Immunological Methods. 174: 2453-2455.
Koopman G, Reutelingsperger CP, Kuijten GA, Keehnen RM, Pals ST, and van Oers MH (1994). Annexin V for Flow Cytometric Detection of Phosphatidylserine Expression on B Cells Undergoing Apoptosis. Blood. 84: 1415-1420.
Korshunov SS, Skulachev VP, and Starkov AA (1997). High Protonic Potential Actuates a Mechanism of Production of Reactive Oxygen Species in Mitochondria. Federation of European Microbial Societies Letters. 416: 15-18.
Kozlowski S and Swann P (2006). Current and Future Issues in the Manufacturing and Development of Monoclonal Antibodies. Advanced Drug Delivery Reviews. 58: 707-722.
Krishna S, Supanaranond W, Pukrittayakamee S, Karter D, Supputamongkol Y, Davis TME, Holloway PA, White NJ (1994). Dichloroacetate for Lactic Acidosis in Severe Malaria: A Pharmacokinetic and Parmacodynamic Assessment. Metabolism. 43: 974-981.
Kromenaker SJ and Srienc F (1994). Cell Cycle Kinetics of Accumulation of Heavy and Light Chain Immunoglobulin Proteins in Mouse Hybridoma Cell Line. Cytotechnology. 14: 205-218.
Kroon DJ, Baldwin-Ferro A, and Lalan P (1992). Identification of Sites of Degradation in a Therapeutic Monoclonal Antibody by Peptide Mapping. Pharmaceutical Research. 9: 1386-1393.
Kubicek CP (2001). Organic Acids. In: Basic Biotechnology, (305-324). Cambridge: Cambridge University Press.
Kumpel BM, Rademacher TW, Rook GA, Williams PJ, and Wilson IB (1994). Galactosylation of Human IgG Monoclonal Anti-D Produced by EBV-Transformed B-Lymphoblastoid Cell-Lines in Dependent on Culture Method and Affects Fc Receptor Mediated Functional Activity. Human Antibodies and Hybridomas. 5: 143-151.

242
Kunas KT (1990). Damage Mechanisms of Suspended Animal Cells in Agitated Bioractors With and Without Bubble Entrainment. Biotechnology and Bioengineering. 36: 476-483.
Kurano N, Leist C, Messi F, Kurano S, and Fiechter A (1990a). Growth Behavior of Chinese Hamster Ovary Cells in a Compact Loop Bioreactor. 2. Effects of Medium Components and Waste Products. Journal of Biotechnology. 15: 113-128.
Kurano N, Leist C, Messi F, Kurano S, and Fiechter A (1990b). Growth Behaviour of Chinese Hamster Ovary Cells in a Mechanically Stirred Internal Loop Bioreact. 1. Effects of Physical and Chemical Enviroments. Journal of Biotechnology. 15: 99-110.
Lakhotia SK, Bauer KD, and Papoutsakis ET (1992). Damaging Agitation Intensities Increase DNA Synthesis Rate and Alter Cell-Cycle Phase Distributions in CHO Cells. Biotechnology and Bioengineering. 40: 978-990.
Lammi MJ, Elo MA, Sironen RK, Karjalainen HM, Kaarniranta K, and Helminen HJ. (2004). Hydrostatic Pressure Induces Changes in Cellular Protein Synthesis. Biorheology. 41: 309-313.
Langheinrich C and Nienow AW (1999). Control of PH in Large-Scale, Free Suspension Animal Cell Bioreactors: Alkali Addition and PH Excursions. Biotechnology and Bioengineering. 66: 171-179.
Langheinrich C, Nienow AW, Eddleston T, Stevenson NC, Emery AN, and Clayton TM et al. (1998). Liquid Homogenization Studies in Animal Cell Bioreactors of Up to 8 M3 in Volume. Food and Bioproducts Processing. 76: 107-116.
Langheinrich C, Nienow AW, Eddleston T, Stevenson NC, Emery AN, and Clayton TM et al. (2002). Oxygen Transfer in Stirred Bioreactors Under Animal Cell Culture Conditions. Food and Bioproducts Processing. 80: 39-44.
Lao MS and Toth D (1997). Effects of Ammonium and Lactate on Growth and Metabolism of a Recombinant CHO Culture. Biotechnology Progress. 13: 688-691.
Laporte C, Kosta A, Klein G, Aubry L, Lam D, and Tresse E et al. (2006). A Necrotic Cell Death Model in a Protist. Cell Death and Differentiation. 14: 266-274.
LaPorte TL, Shevitz J, Kim Y, and Wang SS (1996). Long Term Shear Effects on a Hybridoma Cell Line by Dynamic Perfusion Devices. Bioprocess and Biosystems Engineering. 15: 1-7.
Lara AR, Galindo E, Ramirez OT, and Palomares LA (2006). Living With Heterogeneities in Bioreactors. Molecular Biotechnology. 34: 355-381.
Larsson G, Tornkvist M, Wernersson ES, Tragardh C, Noorman H, and Enfors SO (1996). Substrate Gradients in Bioreactors: Origin and Consequences. Bioprocess Engineering. 14: 281-289.
Leckie F, Scragg AH, and Cliffe KC (1991). Effect of Bioreactor Design and Agitator Speed on the Growth and Alkaloid Accumulation by Cultures of Catharantus Roseus. Enzyme and Microbial Technology. 13: 296-305.
243
Lee H, Homma A, Tatsumi E, and Taenaka Y (2009). Observation of Cavitation Pits on a Mechanical Heart Valve Surface in an Artificial Heart Used in in Vivo Testing. Journal of Artificial Organs. 12: 105-110.
Lee JC, Chang HN, and Oh DJ (2005). Recombinant Antibody Production by Perfusion Cultures of RCHO Cells in a Depth Filter Perfusion System. Biotechnology Progress. 21: 134-139.
Lee SY (1996). High Cell-Density Culture of Escherichia Coli. Trends in Biotechnology. 14: 98-105.
Lehoux S, Castier Y, and Tedgui A (2006). Molecular Mechanisms of Vascular Responses to Haemodynamic Forces. Journal of Interal Medicine. 259: 381-392.
Levenspiel O (1999). The Dispersion Model. In: Chemical Reaction Engineering, (293-320). Danvers: John Wiley & Sons.
Leverette LB, Hellums JD, Alfrey CP, and Lynch EC (1972). Red Blood Cell Damage by Shear Stress. Biophysical Journal. 12: 257-273.
Li C and Xu C (2007). Mechanical Stress-Initiated Signal Transduction in Vascular Smooth Muscle Cells in Vitro and in Vivo. Cellular Signaling. 19: 881-891.
Li J, Vijayasankaran N, Hudson T, Amanullah A, Loong Wong C (2010). Can Lactate Actually be Beneficial to CHO Cell Culture Processes? In: 60th Society for Industrial Microbiology Annual Meeting, San Francisco, CA, USA.
Li YSJ, Haga JH, and Chien S (2005). Molecular Basis of the Effects of Shear Stress on Vascular Endothelial Cells. Journal of Biomechanics. 38: 1949-1971.
Lin JJ, Meyer JD, Carpenter JF, and Manning MC (2000). Stability of Human Serum Albumin During Bioprocessing: Denaturation and Aggregation During Processing of Albumin Paste. Pharmaceutical Research. 17: 391-396.
Link T, Backstrom M, Graham R, Essers R, Zorner K, and Gatgens J et al. (2004). Bioprocess Development for the Production of a Recombinant MUC1 Fusion Protein Expressed by CHO-K1 Cells in Protein-Free Medium. Journal of Biotechnology. 110: 51-62.
Liu H, Gaza-Bulseco G, Faldu D, Chumsae C, and Sun J (2008). Heterogeneity of Monoclonal Antibodies. Journal of Pharmaceutical Sciences. 97: 2426-2447.
Liu J, Nguyen MD, Andya JD, and Shire SJ (2005). Reversible Self-Association Increases the Viscosity of a Concentrated Monoclonal Antibody Aqueous Solution. Journal of Plant Research. 94: 1928-1940.
Ljunggren J and Haggstrom L (1994). Catabolic Control of Hybridoma Cells by Glucose and Glutamine Limited Fed-Batch Cultures. Biotechnology and Bioengineering. 44: 808-818.
Lodish H, Berk A, Zipursky SL, Matsudaira P, Baltimore D, and Darnell J (1999). Protein Structure and Function. In: Molecular Cell Biology, (50-99). New York: WH Freeman and Company.

244
Loschen G, Floho L, and Chance B (1971). Respiratory Chain Linked H2O2 Production in Pigeon Heart Mitochondria. Federation of European Microbial Societies Letters. 18: 261-264.
Lu SB, Sun XM, and Zhang YX (2005). Insight into Metabolism of CHO Cells at Low Glucose Concentration on the Basis of the Determination of Intracellular Metabolites. Process Biochemistry. 40: 1917-1921.
Luedeking R and Piret EL (1959). A Kinetic Study of the Lactic Acid Fermentation. Batch Process at Controlled pH. Journal of Biochemical and Microbiological Technology and Engineering. 1: 393-412.
Ly JD, Grubb DR, and Lawen A (2003). The Mitochondrial Membrane Potential in Apoptosis; an update. Apoptosis. 8: 115-128.
Ma N, Koelling KW, and Chalmers JJ (2002). Fabrication and Use of a Transient Contractional Flow Device to Quantify the Sensitivity of Mammalian and Insect Cells to Hydrodynamic Forces. Biotechnology and Bioengineering. 80: 428-437.
Ma N, Chalmers JJ, Auniņš JG, Zhou W and Xie L (2004). Quantitative Studies of Cell-Bubble Interactions and Cell Damage at Different Pluronic F-68 and Cell Concentrations. Biotechnology Progress. 20: 1183–1191.
Maa YF and Hsu CC (1997). Protein Denaturation by Combined Effect of Shear and Air-Liquid Interface. Biotechnology and Bioengineering. 54: 503-512.
MacKay DJC (2009). Sustainable Energy - Without the Hot Air. Cambridge: UIT Cambridge.
Madshus IH (1988). Regulation of Intracellular PH in Eukaryotic Cells. Biochemistry Journal. 250: 1-8.
Maier U and Buchs J (2001). Characterisation of Gas-Liquid Transfer in Shaking Bioreactors. Biochemical Engineering Journal. 7: 99-106.
Maier U, Losen M, and Buchs J (2004). Advances in Understanding and Modeling the Gas-Liquid Mass Transfer in Shake Flasks. Biochemical Engineering Journal. 17: 155-167.
Maiorella BL, Winkelhake J, and Young J (1993). Effect of Culture Conditions on IgM Antibody Structure, Pharmacokinetics and Activity. Nature Biotechnology. 11: 387-392.
Majid FAA (2001). The Fidelity and Reproducibility of Large Scale Animal Cell Cultures: Impact of Bcl-2 Over-Expressions on Product Glycosylation. University of Birmingham.
Malek AM and Izumo S (1994). Molecular Aspects of Signal Transduction of Shear Stress in Endothelial Cells. Journal of Hypertension. 12: 989-999.
Manning FS, Wolf D, and Keairns DL (1965). Model Simulation of Stirred Tank Reactors. AIChE J. 11: 723-727.

245
Mardikar SH and Niranjan K (2000). Observations on the Shear Damage to Different Animal Cells in a Concentric Cylinder Viscometer. Biotechnology and Bioengineering. 68: 697-704.
Martin SJ, Reutlingsperger CP, McGahon AJ, Rader JA, van Shie RC, LaFace DM et al. (1995). Early Redistribution of Plasma Membrane Phosphatidylserine Is a General Feature of Apoptosis Regardless of the Initiating Stimulus: Inhibition by Over Expression of Bcl-2 Adn Abl. The Journal of Experimental Medicine. 182: 1545-1556.
Mathews CK, van Holde KE, and Ahern KG (2000). Carbohydrate Metabolism II: Biosynthesis. In: Biochemistry, (560-593). San Francisco: Benjamin Cummings.
Mccormick F, Trahey M, Innis M, Dieckmann B, and Ringold G (1984). Inducible Expression of Amplified Human Beta Interferon Genes in CHO Cells. Molecular and Cellular Biology. 4: 166-172.
McNeil B and Kristiansen B (1990). Simulated Scale-Up of a Yeast Fermentation Using a Loop Bioreactor. Biotechnology Letters. 12: 39-44.
McQueen A and Bailey JE (1989). Influence of Serum Level, Cell Line, Flow Type and Viscosity on Flow-Induced Lysis of Suspended Mammalian Cells. Biotechnology Letters. 11: 531-536.
Mercille S and Massie B (1994). Induction of Apoptosis in Oxygen-Deprived Cultures of Hybridoma Cells. Cytotechnology. 15: 117-128.
Merten OW (2000). Constructive Improvement of the Ultrasonic Separation Device ADI 1015. Cytotechnology. 34: 175-179.
Merten OW (2006). Introduction to Animal Cell Culture Technology - Past, Present and Future. Cytotechnology. 50: 1-7.
Metivier D, Dallaporta B, Zamzami N, Larochette N, Susin SA, Marzo I et al. (1998). Cytofluorometric Detection of Mitochondrial Alterations in Early CD95/Fas/APO-1-Triggered Apoptosis of Jurkat T Lymphoma Cells. Comparison of Seven Mitochondrion-Specific Fluorochromes. Immunology Letters. 61: 157-163.
Meuwly F, Papp F, Ruffieux PA, Bernard AR, Kadouri A, and von Stockar U (2006). Use of Glucose Consumption Rate (GCR) As a Tool to Monitor and Control Animal Cell Production Processes in Packed-Bed Bioreactors. Journal of Biotechnology. 122: 122-129.
Midler M and Finn RK (1966). A Model System for Evaluating Shear in Design of Stirred Fermentors. Biotechnology and Bioengineering. 8: 71-84.
Miller WM, Blanch HW, and Wilke CR (1987). A Kinetic Analysis of Hybridoma Growth and Metabolism in Batch and Continuous Suspension Culture: Effect of Nutrient Concentration, Dilution Rate, and PH. Biotechnology and Bioengineering. 32: 947-965.

246
Mlejnek P (2001). Caspase-3 Activity and Carbonyl Cyanide M-Chlorophenylhydrazone-Induced Apoptosis in HL-60 Cells. Atla-Alternatives to Laboratory Animals. 29: 243-249.
Mollet M, Godoy-Silva R, Berdugo C, and Chalmers JJ (2008). Computer Simulations of the Energy Dissipation Rate in a Fluorescence-Activated Cell Sorter: Implications to Cells. Biotechnology and Bioengineering. 100: 260-272.
Mollet M, Ma NN, Zhao Y, Brodkey R, Taticek R, and Chalmers JJ (2004). Bioprocess Equipment: Characterization of Energy Dissipation Rate and Its Potential to Damage Cells. Biotechnology Progress. 20: 1437-1448.
Moore A, Donahue CJ, Hooley J, Stocks DL, Bauer KD, and Mather JP (1995). Apoptosis in CHO Cell Batch Cultures: Examination by Flow Cytometry. Cytotechnology. 17: 1-11.
Moore A, Mercer J, Dutina G, Donahue CJ, Bauer KD, Mather JP et al. (1997). Effects of Temperature Shift on Cell Cycle, Apoptosis and Nucleotide Pools in CHO Cell Batch Cultues. Cytotechnology. 23: 47-54.
Morgan IS, Codispoti M, Sanger K, and Mankad PS (1998). Superiority of Centrifugal Pump Over Roller Pump in Paediatric Cardiac Surgery: Prospective Randomised Trial. European Journal of Cardio-Thoracic Surgery. 13: 526-532.
Morrison SL, Johnson MJ, Herzenberg LA, and Oi VT (1984). Chimeric Human Antibody Molecules: Mouse Antigen-Binding Domains With Human Constant Region Domains. Proceedings of the National Academy of Sciences of the United States of America. 81: 6851-6855.
Mostafa SS and Xuejun G (2003). Strategies for Improved DCO2 Removal in Large-Scale Fed-Batch Cultures. Biotechnology Progress. 19: 45-51.
Mukhopadhyay P, Rajesh M, Hasko G, Hawkins BJ, Madesh M, and Pacher P (2007). Simultaneous Detection of Apoptosis and Mitochondrial Superoxide Production in Live Cells by Flow Cytometry and Confocal Microscopy. Nature Protocols. 2: 2295-2301.
Mulholland JW, Massey W, and Shelton JC (2000). Investigation and Quantification of the Blood Trauma Caused by the Combined Dynamic Forces Experienced During Cardiopulmonary Bypass. Perfusion. 15: 485-494.
Mulholland JW, Shelton JC, and Luo XY (2005). Blood Flow and Damage by the Roller Pumps During Cardiopulmonary Bypass. Journal of Fluids and Structures. 20: 129-140.
Mulukutla BC, Khan S, Lange A, Hu WS (2010). Glucose Metabolism in Mammalian Cell Culture: New Insights for Tweaking Vintage Pathways. Trends in Biotechnology. 28: 476-484.
Munzert E, Heidemann R, Buntemeyer H, Lehmann J, and Muthing J (1997). Production of Recombinant Human Antithrombin III on 20-L Bioreactor Scale: Correlation of Supernatant Neuraminidase Activity, Desialylation, and Decrease of Biological
247
Activity of Recombinant Glycoprotein. Biotechnology and Bioengineering. 56: 441-448.
Munzert E, Muthing J, Buntemeyer H, and Lehmann J (1996). Sialidase Activity in Culture Fluid of Chinese Hamster Ovary Cells During Batch Culture and Its Effect on Recombinant Human Antithrombin III Integrity. Biotechnology Progress. 12: 559-563.
Namdev KP and Thompson BG (1992). Effect of Feed Zone in Fed-Batch Fermentations of Saccharomyces Cerevisiae. Biotechnology and Bioengineering. 40: 235-246.
Namdev KP and Yegneswaren PK (1991). Experimental Simulation of Large-Scale Bioreactor Environments Using a Monte Carlo Method. The Canadian Journal of Chemical Engineering. 69: 513-519.
Narendranathan TJ and Dunhill P (1982). The Effect of Shear on Globular Proteins During Ultrafiltration: Studies of Alcohol Dehydrogenase. Biotechnology and Bioengineering. 24: 2103-2107.
Natarajan S and Mokhtarzadeh-Dehghan MR (2000). Numerical Prediction of Flow in a Model of a (Potential) Soft Acting Peristaltic Blood Pump. International Journal for Numerical Methods in Fluids. 32: 711-724.
Nevaril CG, Lynch EC, Alfrey CP, and Hellums JD (1968). Erythrocyte Damage and Destruction Induced by Shearing Stress. Journal of Laboratory and Clinical Medicine. 71: 784-790.
Newland M, Greenfield PF, and Reid S (1990). Hybridoma Growth Limitations: The Roles of Energy Metabolism and Ammonia Production. Cytotechnology. 3: 215-229.
Newsholme P, Lima MMR, Procopio J, Pithon-Cur TC, Doi SQ, Bazotte RB, Curi R. (2003a). Glutamine and Glutamate as Vital Metabolites. Brazilian Journal of Medical and Biological Research. 36:153 – 163.
Newsholme P, Procopio J, Lima MMR, Pithon-Curi TC, Curi R (2003b). Glutamine and Glutamate – Their Central Role in Cell Metabolism and Function. Cell Biochemistry and Function. 21: 1 – 9.
Nienow AW and Langheinrich C (1996). Homogenisation and Oxygen Transfer Rates in Large Agitated and Sparged Animal Cell Bioreactors: Some Implications for Growth and Production. Cytotechnology. 22: 87-94.
Nienow AW (1997). On Impeller Circulation and Mixing Effectiveness in the Turbulent Flow Regime. Chemical Engineering Science. 52: 2557-2565.
Nienow AW (1998). Hydrodynamics of Stirred Bioreactors. Applied Mechanics Review. 51: 3-32.
Nienow AW (2003). Aeration-Biotechnology. In: Kirk Othmer Encyclopaedia of Chemical Technology New York: Wiley.
Nienow AW (2006). Reactor Engineering in Large Scale Animal Cell Culture. Cytotechnology. 50: 9-33.

248
Noguchi Y, Nakai Y, and Shimba N (2004). The Energetic Conversion Competence of Escherichia Coli During Aerobic Respiration Studies by 31P NMR Using a Circulation Fermentation System. Journal of Biochemistry. 136: 509-515.
Noon GP, Kane LE, Feldman L, Peterson JA, and DeBakey ME (1985). Reduction of Blood Trauma in Roller Pumps for Long-Term Perfusion. World Journal of Surgery. 9: 65-71.
Oh SKW, Nienow AW, Al-Rubeai M, and Emery AN (1989). The Effects of Agitation Intensity With and Without Continuous Sparging on the Growth and Antibody Production of Hybridoma Cells. Journal of Biotechnology. 12: 45-61.
Oliva A, Santoveña A, Fariña J, and Llabrés M (2003). Effect of High Shear Rate on Stability of Proteins: Kinetic Study. Journal of Pharmaceutical and Biomedical Analysis. 33: 145-155.
Omerod MG (1999). Flow Cytometry. Guilford: BIOS Scientific Publishers.
Oosterhuis NMG and Kossen NWF (1984). Dissolved Oxygen Concentration Profiles in a Production-Scale Bioreactor. Biotechnology and Bioengineering. 26: 546-550.
Oosterhuis NMG, Kossen NWF, Oliver APC, and Schenk ES (1985). Scale-Down and Optimisation Studies of the Gluconic Acid Fermentation by Gluconobacter Oxydans. Biotechnolgy and Bioengineering. 27: 711-720.
Osman JJ, Birch J, and Varley J (2001). The Response of GS-NS0 Myeloma Cells to PH Shifts and PH Perturbations. Biotechnology and Bioengineering. 75: 63-73.
Osman JJ, Birch J, and Varley J (2002). The Response of GS-NS0 Myeloma Cells to Single and Multiple PH Perturbations. Biotechnology and Bioengineering. 79: 398-407.
Ozturk SS (1996). Engineering Challenges in High Density Cell Culture Systems. Cytotechnology. 22: 3-16.
Ozturk SS and Palsson BO (1990). Effect of Medium Osmolarity on Hybridoma Growth, Metabolism, and Antibody Production. Biotechnology and Bioengineering. 37: 989-993.
Ozturk SS and Polsson BO (1990). Effects of Dissolved Oxygen on Hybridoma Growth, Metabolism and Antibody Production in Continuous Culture. Biotechnology Progress. 6: 437-446.
Ozturk SS, Riley MR, and Palsson BO (1992). Effects of Ammonia and Lactate on Hybridoma Growth, Metabolism, and Antibody Prodution. Biotechnology and Bioengineering. 39: 418-431.
Papagianni M, Mattey M, and Kristiansen B (2003). Design of a Tubular Loop Bioreactor for Scale-Up and Scale-Down of Fermentation Processes. Biotechnology Progress. 19: 1498-1504.
Park ES, Gao X, Chung JM, and Chung K (2006). Levels of Mitochondrial Reactive Oxygen Species Increase in Rat Neuropathic Spinal Dorsal Horn Neurons. Neuroscience Letters. 391: 108-111.
249
Park H, Berzin IJL, and Gordana V (2005). Evaluation of Silicone Tubing Toxicity Using Tobacco BY2 Culture. In Vitro Cellular and Developmental Biology. 41: 555-560.
Passini CA and Goochee CF (1989). Response of Mouse Hybridoma Cell Line to Heat Shock, Agitation and Sparging. Biotechnology Progress. 5: 175-188.
Pavlou AK and Belsey MJ (2005). The Therapeutic Antibodies Market to 2008. European Journal of Pharmaceutics and Biopharmaceutics. 59: 389-396.
Perani A, Singh R, Chauhan R, and Al-Rubeai M (1998). Variable Functions of Bcl-2 in Mediating Bioreactor Stress- Induced Apoptosis in Hybridoma Cells. Cytotechnology. 28: 177-188.
Perkins M, Theiler R, Lunte S, and Jeschke M (2000). Determination of the Origin of Charge Heterogeneity in a Murine Monoclonal Antibody. Pharmaceutical Research. 17: 1110-1117.
Petersen JF, McIntire LV, and Papoutsakis ET (1988). Shear Sensitivity of Cultured Hybridoma Cells (Crl-8018) Depends on Mode of Growth, Culture Age and Metabolite Concentration. Journal of Biotechnology. 7: 229-246.
Petit PX, Lecoeur H, and Zorn E (1995). Alterations in Mitochondrial Structure and Function Are Early Events of Dexamethasone-Induced Thymocyte Apoptosis. The Journal of Cell Biology. 130: 157-167.
Pin S, Chen H, Lein PJ, and Wang MM (2006). Nucleic Acid Binding Agents Exert Local Toxic Effects on Neurites Via a Non-Nuclear Mechanism. Journal of Neurochemistry. 96: 1253-1266.
Pohorecki R, Nienow AW, Chisti Y, Chalmers JJ, and Baldyag J (1998). Fluid Mechanics Problems in Biotechnology. Applied Mechanics Review. 51: 1-121.
Poot M, Gibson LL, and Singer VL (1997). Detection of Apoptosis in Live Cells by MitoTracker Red CMXRos and SYTO Dye Flow Cytometry. Cytometry. 27: 358-364.
Poot M and Pierce RH (1999a). Detection of Changes in Mitochondrial Function During Apoptosis by Simultaneous Staining With Multiple Fluorescent Dyes and Correlated Multiparameter Flow Cytometry. Cytometry. 35: 311-317.
Poot M and Pierce RH (1999b). Detection of Changes in Mitochondrial Function During Apoptosis by Simultaneous Staining With Multiple Fluorescent Dyes and Correlated Multiparameter Flow Cytometry. Cytometry. 35: 311-317.
Poot M, Zhang YZ, Kramer JA, Wells KS, Jones LJ, Hanzel DK et al. (1996). Analysis of Mitochondrial Morphology and Function With Novel Fixable Fluorescent Stains. Journal of Histochemistry and Cytochemistry. 44: 1363-1372.
Porter AJ, Dickson AJ, Barnes LM, and Racher AJ (2007). Antibody Production by GS-CHO Cell Lines Over Extended Culture Periods. Cell Technology for Cell Products. 19: 137-140.

250
Qi W, Ding D, and Salvi RJ (2008). Cytotoxic Effects of Dimethyl Sulphoxide (DMSO) on Cochlear Organotypic Cultures. Hearing Research. 236: 52-60.
Racher AJ, Looby D, and Griffiths JB (1990). Use of Lactate Dehydrogenase Release to Assess Changes in Culture Viability. Cytotechnology. 3: 301-307.
Rathore AS (2009). Roadmap for Implementation of Quality by Design (QbD) for Biotechnology Products. Trends in Biotechnology. 27: 546-553.
Rearick JI, Chapman A, and Kornfeld S (1981). Glucose Starvation Alters Lipid-Linked Oligosaccharide Biosynthesis in Chinese Hamster Ovary Cells. Journal of Biological Chemistry. 256: 6255-6261.
Reuveny S, Velez D, Macmillan JD, and Miller L (1986). Factors Affecting Cell-Growth and Monoclonal-Antibody Production in Stirred Reactors. Journal of Immunological Methods. 86: 53-59.
Reuveny S, Velez D, Macmillan JD, and Miller L (1987). Factors Affecting Monoclonal Antibody Production in Culture. Developments in Biological Standardization. 66: 169-175.
Reyes C, Pera C, and Galindo E (2003). Reproducing Shake Flasks Performance in Stirred Fermentors: Production of Alginates by Azotobacter Vinelandii. Journal of Biotechnology. 105: 189-198.
Reynolds JE, Li J, and Eastman A (1996). Detection of Apoptosis by Flow Cytometry of Cells Simultaneously Stained for Intracellular PH (Carboxy SNARF-1) and Membrane Permeability (Hoechst 33342). Cytometry. 25: 349-357.
Rhiel M and Murhammer DW (1995). The Effect of Oscillating Dissolved Oxygen Concentrations on the Metabolism of a Spodoptera Frugiperda IPLB-Sf21-AE Clonal Isolate. Biotechnology and Bioengineering. 47: 640-650.
Riley S (2006). The Future of Monoclonal Antibodies Therapeutics. Business Insights Business Report.
Ross DD, Joneckis CC, Ordonez JV, Sisk AM, Wu RK, Hamburger AW et al. (1989). Estimation of Cell-Survival by Flow Cytometric Quantification of Fluorescein Diacetate Propidium Iodide Viable Cell Number. Cancer Research. 49: 3776-3782.
Rottenberg H and Wu S (1998). Quantitative Assay by Flow Cytometry of the Mitochondrial Membrane Potential in Intact Cells. Biochimica Et Biophysica Acta. 1404: 393-404.
Ruszkowski S (1995). A Rational Method for Measuring Blending Performance, and Comparison of Different Impeller Types. Institute of Chemical Engineers Symposium Series. 136: 283-291.
Salvioli S, Ardizzoni A, Franceschi C, and Cossarizza A (1997). JC-1, but Not DiOC6(3) or Rhodamine 123, Is a Reliable Fluorescent Probe to Assess MMP in Intact Cells: Implications for Studies on Mitochondrial Functionality During Apoptosis. FEBS Letters. 411: 77-82.
251
Santos NC, Figueira-Coelho J, Martins-Silva J, and Saldanha C (2003). Multidisciplinary Utilization of Dimethyl Sulfoxide: Pharmacological, Cellular, and Molecular Aspects. Biochemical Pharmacology. 65: 1035-1041.
Schmelzer AE and Miller WM (2002). Hyperosmotic Stress and Elevated pCO2 Alter Monoclonal Antibody Charge Distribution and Monosaccaride Content. Biotechnology Progress. 18: 346-353.
Schugerl K (1993). Comparison of Different Bioreactor Performances. Bioprocess Engineering. 9: 215-223.
Senger RS and Karim MN (2003). Effect of Shear Stress on Intrinsic CHO Culture State and Glycosylation of Recombinant Tissue-Type Plasminogen Activator Protein. Biotechnology Progress. 19: 1199-1209.
Senior PJ and Windass J (1980). The ICI Single Cell Protein Process. Biotechnology Letters. 2: 205-210.
Sgonc R and Gruber J (1998). Apoptosis Detection: an Overview. Experimental Gerontology. 33: 525-533.
Shafer FQ, Buettner GR (2001). Redox Environment of The Cell as Viewed Through The Redox State of The Glutathione Disulfide/ Glutathione Couple. Free Radical Biology and Medicine. 30: 1191 – 1212.
Shanker G, Aschner JL, Syversen T, and Aschner M (2004). Free Radical Formation in Cerebral Cortisal Astrocytes in Culture Induced by Methylmercury. Brain Research. Molecular Brain Research. 10: 48-57.
Shanker G, Syversen T, Aschner JL, and Aschener M. (2005). Modulatory Effect of Glutathione Status and Antioxidants on Methylmercury-Induced Free Radical Formation in Primary Cultures of Cerebral Astrocytes. Brain Research. Molecular Brain Research. 13: 11-22.
Shapiro HM (2000). Membrane Potential Estimation by Flow Cytometry. Methods. 21: 271-279.
Shapiro HM (2003a). Parameters and Probes. In: Practical Flow Cytometry, (273-410). New Jersey: John Wiley & Sons.
Shapiro HM (2003b). Practical Flow Cytometry. New Jersey: John Wiley & Sons.
Sheeley DM, Merrill BM, and Taylor LCE (1997). Characterization of Monoclonal Antibody Glycosylation: Comparison of Expression Systems and Identification of Terminal [Alpha]-Linked Galactose. Analytical Biochemistry. 247: 102-110.
Shultz JS (1964). Cotton Closure as an Aeration Barrier in Shaken Flask Fermentations. Applied Microbiology. 12: 305-310.
Simpson NH, Milner AE, and AlRubeai M (1997). Prevention of Hybridoma Cell Death by Bcl-2 During Sub-Optimal Culture Conditions. Biotechnology and Bioengineering. 54: 1-16.
252
Simpson NH, Singh RP, Perani A, Goldenzon C, and Al-Rubeai M (1998). In Hybridoma Cultures, Deprivation of Any Single Amino Acid Leads to Apoptotic Death, Which Is Suppressed by the Expression of the Bcl-2 Gene. Biotechnology and Bioengineering. 59: 90-98.
Sinclair AM and Elliott S (2004). Glycoengineering: The Effect of Glycosylation on the Properties of Therapeutic Proteins. Journal of Pharmaceutical Sciences. 94: 1626-1636.
Singh RP and Al-Rubeai M (1994). Cell Death in Bioreactors: A Role for Apoptosis. Biotechnology and Bioengineering. 44: 720-726.
Singh RP and Al-Rubeai M (1998). Apoptosis and Bioprocess Technology. Advances in Biochemical Engineering/Biotechnology. 62: 167-184.
Stacpoole PW (1989). The Pharmacology of Dichloroacetate. Metabolism. 38: 1124-1144.
Stephanopoulos GN (1984). Dynamic Behaniour of Second-Order Systems. In: Chemical Process Control, (186-211). Upper Saddle River, NJ: Prentice Hall.
Sugita M, Muroya T, Sugishita T, Tenjin Y, and Satoh H (1986). Sorting of Living and Dead Cells by Flow Cytometry-Staining Principle and Basic Experiment. Gan No Rinsho. 32: 268-273.
Sun X and Zhang Y (2004). Glutamine Cannot Support Recombinant CHO Cell Growth and Maintenance in the Absence of Glucose. Process Biochemistry. 39: 719-722.
Sutera SP (1977). Flow-Induced Trauma to Blood Cells. Circulation Research. 41: 2-8.
Sweere APJ, Luyben KChAM, and Kossen NWF (1987). Regime Analysis and Scale-Down: Tools to Investigate the Performance of Bioreactors. Enzyme and Microbial Technology. 9: 386-398.
Szabo G, Kiss A, and Tron L (1982). Permeabilization of Lymphocytes With Polyethylene Glycol-1000 - Discrimination of Permeabilized Cells by Flow-Cytometry. Cytometry. 3: 59-63.
Takahama T, Kanai F, Hiraishi M, Onishi K, Yamazaki Z, Suma K et al. (1985). Long-Term Non Heparinized Left Heart Bypass (LHB): Centrigugal Pump or Roller Pump. Transactions - American Society for Artificial Internal Organs. 31: 372-376.
Takeda H, Goda T, Uzawa S, Matsukura H, Sakai K, and Tanabe TA (1984). A Comparison of Centrifugal and Roller Pumps. An Experimental Study. Japanese Journal for Thoracic Surgery. 37: 273-277.
Takuma S, Hirashima C, and Piret JM (2007). Dependence on Glucose Limitation of the pCO2 Influences on CHO Cell Growth, Metabolism and IgG Production. Biotechnology and Bioengineering. 97: 1479-1488.
Tamari Y, Lee-Sensiba K, Leonard EF, Parnell V, and Tortolani AJ (1993). The Effects of Pressure and Flow on Hemolysis Caused by Bio-Medicus Centrifugal Pumps and Roller Pumps. Guidelines for Choosing a Blood Pump. The Journal of Thoracic and Cardiovascular Surgery. 106: 997-1007.
253
Tanzeglock T, Soos M, Stephanopoulos G, and Morbidelli M (2009). Induction of Mammalina Cell Death by Simple Shear and Extensional Flows. Biotechnology and Bioengineering. 104: 360-370.
Taylor ME and Drickamer K (2006). Introduction to Glycobiology. Oxford: Oxford University Press.
Telling RC and Elsworth R (1965). Submerged Culture of Hamster Kidney Cells in a Stainless Steel Vessel. Biotechnology and Bioengineering. 7: 417-434.
Terada M, Inaba M, and Yano Y (1998). Growth-Inhibitory Effect of a High Glucose Concentration on Osteoblast-Like Cells. Bone. 22: 17-23.
Terasaki M, Song J, Wong JR, Weiss MJ, and Chen LB (1984). Localization of Endoplasmic-Reticulum in Living and Glutaraldehyde-Fixed Cells With Fluorescent Dyes. Cell. 38: 101-108.
Teshima G, Porter J, Yim K, Ling V, and Guzzetta A (1991). Determination of Soluble CD4 at Asparagine-52 Results in Reduced Binding Capacity for the HIV-1 Envelope Glycoprotein Gp120. Biochemistry. 30: 3916-3922.
Tey BT, Singh RP, Piredda L, Piacentini M, and Al-Rubeai M (2000). Influence of Bcl-2 on Cell Death During the Cultivation of a Chinese Hamster Ovary Cell Line Expressing a Chimeric Antibody. Biotechnology and Bioengineering. 68: 31-43.
Thaysen-Andersen M, Mysling S, and Hojrup P (2009). Site-Specific Glycoprofiling of N-Linked Glycopeptides Using MALDI-TOF MS: Strong Correlation Between Signal Strength and Glycoform Quantities. Analytical Chemistry. 81: 3933-3943.
Toth P, El-Shanti H, Eivins S, Rhead WJ, Klein JM (1993). Transient Improvement of Congenital Lactic Acidosis in a Male Infant with Pyruvate Decarboxylase Deficiency Treated with Dichloroacetate. The Journal of Pediatrics. 123: 427-440.
Trummer E and Fauland K (2006). Process Parameter Shifting: Part I. Effect of DOT, PH and Temperature on the Performance of Epo-Fc Expressing CHO Cells Cultivated in Controlled Batch Bioreactors. Biotechnology and Bioengineering. 94: 1033-1044.
Tsai PK, Bruner MW, Irwin JI, Ip CCY, Oliver CN, and Nelson RW et al. (1993). Origin of the Isoelectric Heterogeneity of Monoclonal Immunoglobulin H1B4. Pharmaceutical Research. 10: 1580-1586.
Tsao YS, Cardoso AG, Condon RGG, Voloch M, Lio P, and Lagos JC et al. (2005). Monitoring Chinese Hamster Ovary Cell Culture by the Analysis of Glucose and Lactate Metabolism. Journal of Biotechnology. 118: 316-327.
Tsujino T, Miura M, Komori N, and Inoue K (1999). Cavitational Occurence Around Rotational Bodies in Water and Blood. Natural Science. 48: 21-27.
Tyagi AK, Randolph TW, Dong A, Maloney KM, Hitscherich C, and Carpenter JF (2009). IgG Particle Formation During Filling Pump Operation: A Case Study of Heterogeneous Nucleation on Stainless Steel Nanoparticles. Journal of Pharmaceutical Sciences. 98: 94-104.

254
Tzannis ST, Hrushesky WJM, Wood PA, and Przybycien TM (1997). Adsorption of a Formulated Protein on a Drug Delivery Device Surface. Journal of Colloid and Interface Science. 189: 216-228.
Tzima E (2006). Role of Small GTPases in Endothelial Cytoskeletal Dynamics and the Shear Stress Response. Circulation Research. 98: 176-185.
Urlaub G and Chasin LA (1980). Isolation of Chinese Hamster Cell Mutants Deficient in Dihydrofolate Reductase Activity. Proceedings of the National Academy of Sciences of the United States of America. 77: 4216-4220.
Usami A, Ohtsu A, Takahama S, and Fujii T (1996). The Effect of pH, Hydrogen Peroxide and Temperature on the Stability of Human Monoclonal Antibody. Journal of Pharmaceutical and Biomedical Analysis. 14: 1133-1140.
Valeri CR, Macgregor H, Ragno G, Healey N, Fonger J, and Khuri SF (2006). Effects of Centrifugal and Roller Pumps on Survival of Autologous Red Cells in Cardiopulmonary Bypass Surgery. Perfusion. 21: 291-296.
van der Lans RGLM, Vrabel P, Luyben KChAM, Boon L, and Nienow A (2000). Mixing in Large-Scale Vessels With Multiple Radian or Radial and Axial Up-Pumping Impellers: Modelling and Measurements. Chemical Engineering Science. 55: 5881-5896.
van Reis R and Zydney A (2007). Bioprocess Membrane Technology. Journal of Membrane Science. 297: 16-50.
Varley J and Birch J (1999). Reactor Design for Large Scale Suspension Animal Cell Culture. Cytotechnology. 29: 177-205.
Varum S, Bento C, Sousa AP, Gomes-Santos CSS, Henriques P, and Almeida-Santos T et al. (2007). Characterization of Human Sperm Populations Using Conventional Parameters, Surface Ubiquitination, and Apoptotic Markers. Fertility and Sterility. 87: 572-583.
Vazquez A, Lui J, Zhou Y, and Oltvai ZN (2010). Catabolic Efficiency of Aerobic Glycolysis: The Warburg Effect Revisited. BMC Systems Biology. 4: 58-70.
Vermes I, Haanen C, and Reutelingsperger C (2000). Flow Cytometry of Apoptotic Cell Death. Journal of Immunological Methods. 243: 167-190.
Vermes I, Haanen C, Steffens-Nakken H, and Reutellingsperger C (1995). A Novel Assay for Apoptosis Flow Cytometric Detection of Phosphatidylserine Expression on Early Apoptotic Cells Using Fluorescein Labelled Annexin V. Journal of Immunological Methods. 184: 39-51.
Vivian Md, Albert E.Schmelzer, and Wiliam M.Miller (2002). Characterisation of Hybridoma Cell Responses to Elevated pCO2 and Osmolarity: Intracellular PH, Cell Size, Apoptosis, and Metabolism. Biotechnology and Bioengineering. 77: 369-380.
Waldmann TA (2003). Immunotherapy: Past, Present and Future. Nature Medicine. 9: 269-277.

255
Wang HY, Bao N, and Lu C (2008). A Microfluidic Cell Array With Individually Addressable Culture Chambers. Biosensors and Bioelectronics. 24: 613-617.
Warburg O (1930). The Metabolism of Tumours. Constable: London.
Watanabe N, Kataoka H, Yasuda T, and Takatani S (2006). Dynamic Deformation and Recovery Response of Red Blood Cells to a Cyclically Reversing Shear Flow: Effects of Frequency of Cyclically Reversing Shear Flow and Shear Stress Level. Biophysical Journal. 91: 1984-1998.
Weaver JL (1998). Estimation of Cell Viability by Flow Cytometry. Methods in Molecular Biology. 91: 77-83.
Werner RG, Noe W, Kopp K, and Schluter M (1998). Appropriate Mammalian Expression Systems for Biopharmaceuticals. Arzneimittel-Forschung-Drug Research. 48: 870-880.
Wold F (1981). In Vivo Chemical Modifications of Proteins (Prost-Translational Modification). Annual Review of Biochemistry. 50: 783-814.
Wong, Kathy Tin Kam Wong, Yih Yean Lee, Perer Nissom Morin, Chew Kiat Heng, and Miranda Gek Sim Yap (2006). Transcriptional Profiling of Apoptotic Pathways in Batch and Fed-Batch CHO Cell Cultures. Biotechnology and Bioengineering. 94: 373-382.
Wong DCF, Wong KTK, Goh LT, Heng KC, and Yap MGS (2004). Impact of Dynamic Online Fed-Batch Strategies on Metabolism, Productivity, and N-Glycosylation Quality in CHO Cell Cultures. Biotechnology and Bioengineering. 89: 164-177.
Wu J (1995). Mechanisms of Animal Cell Damage Associated With Gas Bubbles and Cell Protection by Medium Additives. Journal of Biotechnology. 43: 81-94.
Xie LZ and Wang DIC (1994). Fed-Batch Cultivation of Animal-Cells Using Different Medium Design Concepts and Feeding Strategies. Biotechnology and Bioengineering. 43: 1175-1189.
Xing ZZ, Li ZJ, Chow V, and Lee SS (2008). Identifying Inhibitory Threshold Values of Repressing Metabolites in CHO Cell Culture Using Multivariate Analysis Methods. Biotechnology Progress. 24: 675-683.
Yang M and Butler M (2000). Effects of Ammonia on CHO Cell Growth, Erythropoietin Production and Glycosylation. Biotechnology and Bioengineering. 68: 370-380.
Yarborough KA, Mockros LF, and Lewis FJ (1966). Hydrodynamic Hemolysis in Extracorporeal Machines. The Journal of Thoracic and Cardiovascular Surgery. 52: 550-557.
Yoon SK, Hong JK, and Lee GM (2004). Effect of Simultaneous Application of Stressful Culture Conditions on Specific Productivity and Heterogeneity of Erythropoietin in Chinese Hamster Ovary Cells. Biotechnology Progress. 20: 1293-1296.

256
Zabriskie DW and Arcuri EJ (1986). Factors Influencing Productivity of Fermentations Employing Recombinant Microorganisms. Enzyme and Microbial Technology. 8: 706-717.
Zamai L, Falcieri E, Marhefka G, and Vital M (1996). Supravital Exposure to Propidium Iodide Identifies Apoptotic Cells in the Absence of Nucleosomal DNA Fragmentation. Cytometry. 23: 303-311.
Zamzami N, Marchetti P, Castedo M, Decaudin D, Macho A, Hirsch T et al. (1995). Sequential Reduction of Mitochondrial Transmembrane Potential and Generation of Reactive Oxygen Species in Early Programmed Cell Death. The Journal of Experimental Medicine. 182: 367-377.
Zang Z, Al-Rubeai M, and Thomas CR (1993). Estimation of Disruption of Animal Cells by Turbulent Capillary Flow. Biotechnology and Bioengineering. 42: 987-993.
Zanghi JA, Mendoza TP, Knop RH, and Miller WM (1998). Ammonia Inhibits Neural Cell Adhesion Molecule Polysialylation in CHO and Small Cell Lung Cancer Cells. Journal of Cell Physiology. 177: 248-263.
Zbinniew Darzynkiewicz, Gloria Juan, and Xun Li (1996). Cytometry in Cell Necrobiology: Analysis of Apoptosis and Accidental Cell Death (Necrosis). Cytometry. 27: 1-20.
Zettlmeissl G, Conradt HS, Nimtz M, and Karges HE (1989). Characterization of Recombinant Human Antithrombin III Synthesized in Chinese Hamster Ovary Cells. Journal of Biological Chemistry. 264: 21153-21159.
Zhang F, Sun XM, Yi XP, and Zhang YX (2006). Metabolic Characteristics of Recombinant Chinese Hamster Ovary Cells Expressing Glutamine Synthetase in Presence and Absence of Glutamine. Cytotechnology. 51: 21-28.
Zhang YB, Howitt J, McCorkle S, Lawrence P, Springer K, and Freimuth P (2004). Protein Aggregation During Overexpression Limited by Peptide Extensions With Large Net Negative Charge. Protein Expression and Purification. 36: 207-216.
Zhang Z, Al R, and Thomas CR (1993). Comparison of the Fragilities of Several Animal Cell Lines. Biotechnology Techniques. 7: 177-182.
Zhang Z, Pan H, and Chen X (2009). Mass Spectrometry for Structural Characterisation of Therapeutic Antibodies. Mass Spectrometry Reviews. 28: 147-176.
Zhang Z and Thomas CR (1993). Modelling of Animal Cell Damage in Turbulent Flows. In: Proc. 3rd Int. Conf. on Bioreactor and Bioprocess Fluid Dynamics, (475-482). London: Mechanical Engineering Publications.
Zhou G and Kresta SM (1996). Impact of Tank Geometry on the Maximum Turbulence Energy Dissipation Rate for Impellers. American Institution of Chemical Engineers Journal. 42: 2476-2490.
Zhou W, Rehm J, and Hu WS (1995). High Viable Cell Concentration Fed-Batch Cultures of Hybridoma Cells Through on-Line Nutrient Feeding. Biotechnology and Bioengineering. 46: 579-587.

257
Zhu MM, Goyal A, Rank DL, Gupta SK, Vanden Boom T, and Lee SS (2005). Effects of Elevated pCO2 and Osmolality on Growth of CHO Cells and Production of Anibody-Fusion Protein B1: a Case Study. Biotechnology Progress. 21: 70-77.
Zuliani T, Duval R, Chantal J, Schnebert S, Andre P, Dumas M et al. (2003). Sensitive and Reliable JC-1 and TOTO-3 Double Staining to Assess Mitochondrial Transmembrane Potential and Plasma Membrane Integrity: Interest for Cell Death Investigations. Cytometry Part A. 54A: 100-108.

258
}