the effect of population aging on the aggregate labor market
TRANSCRIPT
The Effect of Population Aging on the Aggregate Labor Market
By Bruce Fallick, Charles Fleischman and Jonathan Pingle1
November 2007
Abstract
As in most industrialized economies, the average age of the population in the U.S.
is increasing. Not only is longevity rising, but the unusual population bulge known as the
baby boom is having a pronounced effect on the age distribution. Age is an important
determinant of labor market behavior, particularly any measure associated with labor
supply. In this paper we document how the shifting age distribution of the population has
influenced some major measures of the state of the labor market, and we project how
these influences are likely to evolve in the future. The aging of the baby boom has had
noticeable effects on the evolution of the unemployment rate and the labor force
participation rate, as well as less pronounced influences on measures of gross flows and
mean wages. The aging of the baby boom is likely to play an important role in the
evolution of some of these series in the years ahead.
1. The views expressed in this paper are those of the authors and do not represent the view of the Federal Reserve System or its staff. The authors wish to thank Stephanie Aaronson, Andrew Figura and William Wascher who co-authored a related paper on the decline in labor force participation. Special thanks also go to Karen Smith at the Social Security Administration for providing detailed data that underlies the agencies labor force projections, and Mitra Toosi who provided data and answered questions on the Bureau of Labor Statistics long run projections for labor supply. John Schmitt of CEPR answered questions and offered STATA code for imputing topcoded wages. In addition, we received useful input for this line of research from Daniel Aaronson, Gary Burtless, Julie Hotchkiss, Chinhui Juhn, Joseph Lupton, Lisa Lynch, Mark Schweitzer, Daniel Sullivan, Joyce Zickler and seminar participants at the Bureau of Labor Statistics. Leslie Carroll and Andrew Strauss provided expert assistance. Author contact information: Bruce Fallick, Senior Economist, Board of Governors of the Federal Reserve System, 20th and C Streets, Washington, D.C., 20551-0001, 202-452-3722, [email protected]; Charles Fleischman, Senior Economist, Board of Governors of the Federal Reserve System, 20th and C Streets, Washington, D.C., 20551-0001, 202-452-6473, [email protected]; Jonathan Pingle, Brevan Howard, 1776 Eye Street, NW, Washington, D.C., 20007, 202-835-6003, [email protected].

2
I. Introduction
In 1946 the U.S. fertility rate leapt by an astounding 19 percent. In 1947, it
jumped another 11 percent. After peaking in 1957, 40% above the World War Two
levels, the fertility rate declined. By 1973 fertility had fallen back to below World War II
rates, and indeed to well below any fertility rate since 1909 when the National Center for
Health Statistics’ published series begins.1 This rapid surge in births created an
extraordinary population bulge now known as the baby boom. Not only are there a lot of
baby boomers, but they are expected to live longer than cohort that preceded them. In
1949, a 55 year old American expected to live another 21 years. In 2002, a 55 year old
expected to live another 26 years.
The large non-linearity in fertility in turn influenced the age distribution of the
U.S. population. In the years ahead, the aging of the baby boom is expected to
dramatically increase the share of the population in older ages commonly associated with
lower levels of labor supply. Figure 1 shows history and projections of age shares of the
age 16 and over Civilian Noninstitutional Population (CNIP) taken from the Current
Population Survey (CPS), and grown out by Census Bureau projections. Around 2002,
the share of individuals age 55 and over began to grow, while at the same time the share
aged 35 to 44 was shrinking. In the past year, the share of the over age 65 age groups has
begun to rise, and this increase will accelerate until 2010 with the share growing until
around 2030. This figure highlights the pronounced aging of the U.S. population already
underway.
Population aging is changing the U.S. economy. Demographic shifts can affect
related headline measures of labor market activity because individuals’ labor market
behavior varies substantially with age. For example, labor force participation rates rise
sharply with age through the early to mid 20’s, level off at a high level through about age
50 or 55, and then decline precipitously. In the past decade, as the oldest baby boomers
turned 50, then 55, and then 60, the aging of the population began to put downward
1 Fertility data is available from the National Center for Health Statistics web site at http://www.cdc.gov/nchs/data/statab/natfinal2002.annvol1_01.pdf. Life expectancy tables can be found at http://www.cdc.gov/nchs/products/pubs/pubd/lftbls/life/1966.htm, for example. In 1945 in the U.S. there were 85.9 births per 1,000 women aged 15 to 44. In 1946 there were 101.9 and in 1947 there were 113.3. In 1957 there were 122.7 births per 1,000 women aged 15 to 44, but by 1973, the fertility rate had fallen to 68.8.
3
pressure on aggregate labor supply (Aaronson et al, 2006). This marked the start of what
is likely to be a sharp deceleration in labor input that will last another half-century. In
contrast to labor supply growth of 2% a year for much of the 1960s, 1970s, and 1980s,
the Social Security Administration (SSA) projects labor supply growth will slow to 0.5%
by 2015, and 0.3% by 2025, a remarkable deceleration.
Indeed, the maturation of the baby boomers may affect a variety of current and
future macroeconomic trends. In this paper we estimate the effect of the shifting
population age distribution on aggregate statistics commonly derived from the CPS,
including the unemployment rate, the participation rate, gross labor force flows, and
wages. Because the baby boom is slowly moving its way up the age distribution we also
provide projections for how these measures are likely to be influenced in the years ahead.
To preview, the largest effects of population shifts on the aggregate labor force
participation rate are in the future, but the effects on the unemployment rate have mostly
run their course. The baby boomers’ movement into their high-earnings age groups has
pushed up mean wages and changed the average flows though labor market states over
time.
The paper proceeds as follows: In section II we briefly review the literature on
population aging and note earlier work that has studied or grappled with the demographic
shifts caused by the baby boom aging as they entered the labor force and as they are now
expected to leave. In section III we describe the CPS data. In sections IV through VII
we consider the influence that aging has had on several major labor market statistics.
Covering each statistic in turn, we also project how the statistics are likely to evolve
going forward as the baby boom will continue to age. Section VIII concludes.
II. Literature Review
Richard Easterlin (1961) described the baby boom as an “abrupt break with
historical experience.” Although he points out that fertility can be described in terms of
Kuznet’s cycles,2 the comment reflects the uniqueness of the event in the context of US
history. In fact, without the baby boom, population growth in the US would otherwise
have been trending down through most of the twentieth century. Prior to World War
2 See Simon Kuznets (1956, 1958).
4
Two, how economies would grapple with declining population growth was an important
economic question (Hansen 1939 and Keynes 1937). But that changed with the baby
boom. Although fertility was declining, and immigration in the U.S. had slowed,
Easterlin notes the baby boom provided an extraordinary reversal of the historical trends.
However, what followed the baby boom was a large pendulum swing the other
direction—the unwinding of the cycle led to a fertility trough which only re-enforced the
uniqueness of the baby boom. Despite cycles in fertility and population growth, no
similar boom has happened since, nor would such a boom appear to be much of a
possibility in the foreseeable future.
Economists have long noted the role that population growth plays in economic
growth and measured economic statistics. Hagen (1959) and Kuznets (1956, 1958) noted
the importance of population growth to economic growth, and the related movements in
measured output. More recently population aging has become a well researched sub-field
of economics. Weil (1997) outlined a broad overview of the field, summarizing the state
of the literature on retirement, demographic change, dependency ratios and
intergenerational transfers. He notes age relates to labor supply, and that young workers
have higher unemployment rates than old. However, he stops short of considering how
an aging population puts downward pressure on labor force participation. Instead, like
the economics literature more generally, his overview of the field focuses largely on the
influence of population aging on old age programs like social security and the related
estimates of the dependency ratio, rather than the participation rate with an emphasis on
macroeconomic growth and measurement.3
Because the cohort behind the boomers is relatively small, the aging of this
population bubble has had a pronounced influence on the population distribution and thus
any labor market statistic that varies over the life cycle, sometimes hiding and
confounding more structural changes in the economy. Perry (1970) was among the first
to realize the increase in baby boom teenagers in the labor force was confounding
interesting economic measurement. He was interested in inflation, and the role the
unemployment rate played as a proxy for labor market tightness. However, increases in
3 See Axel Borsch-Supan (2001) for discussion of the labor market effects of population aging in European countries.
5
the share of teens in the labor force had increased the share of a demographic group with
relatively high unemployment rates, and this demographic shift alone put upward
pressure on the unemployment rate during the 1970s. Clearly, this made using the level
of the unemployment rate as a proxy for labor market tightness inconsistent over time.
Perry constructed a demographically adjusted unemployment rate to abstract from this
change, holding constant fixed labor force shares to remove the fluctuations in the
relative share of boomers.
Not surprisingly a long list of authors studying the unemployment rate have had
to account for the influence of the shifting population shares, notably Summers (1986)
and Flaim (1990), and more recently Shimer (1998), Shimer & Abraham (2001), and
Valletta & Hodges (2005). Below we note that more recently, the declines in the share of
teenagers in the labor force has started to put measurable downward pressure on
unemployment rates. Although these and many other authors have employed
demographically-adjusted unemployment rates in research, what was once grappling with
the baby boom as teens has now become grappling with the baby boom as retirees.
The fact that labor supply declines with age after about age 40 has been known
for a long time.4 Although we fondly think of forefathers who diligently worked all the
way up until death, participation has declined sharply with age for most of the nation’s
history and retirement has been a feature of life cycle labor supply since at least 1870, as
noted by Ransom & Sutch (1988).5 The fact that participation declines rapidly at older
ages has forced economists to account for the influence of demographics on the measured
rate to make time series comparable over long periods, or for forecasting reasons.
Durand (1948), in a seminal work on forecasting participation rates, modeled
demographic shifts and trends toward early retirement. In attempting to isolate cyclical
swings Wachter (1977) noted individual groups’ behavior could obscure measurement of
interest.
More recently, however, during the labor market downturn of 2002, the shifting
population age shares began to put noticeable downward pressure on the aggregate
4 Due to the volume and depth of research on female labor supply (see Claudia Goldin (2006) for example), we omit discussion here and focus directly on the influence that the shifting population age distribution has on labor market statistics measured from the Current Population Survey. 5 See also Nancy Brandon Tuma and Gary Sandefur (1988).
6
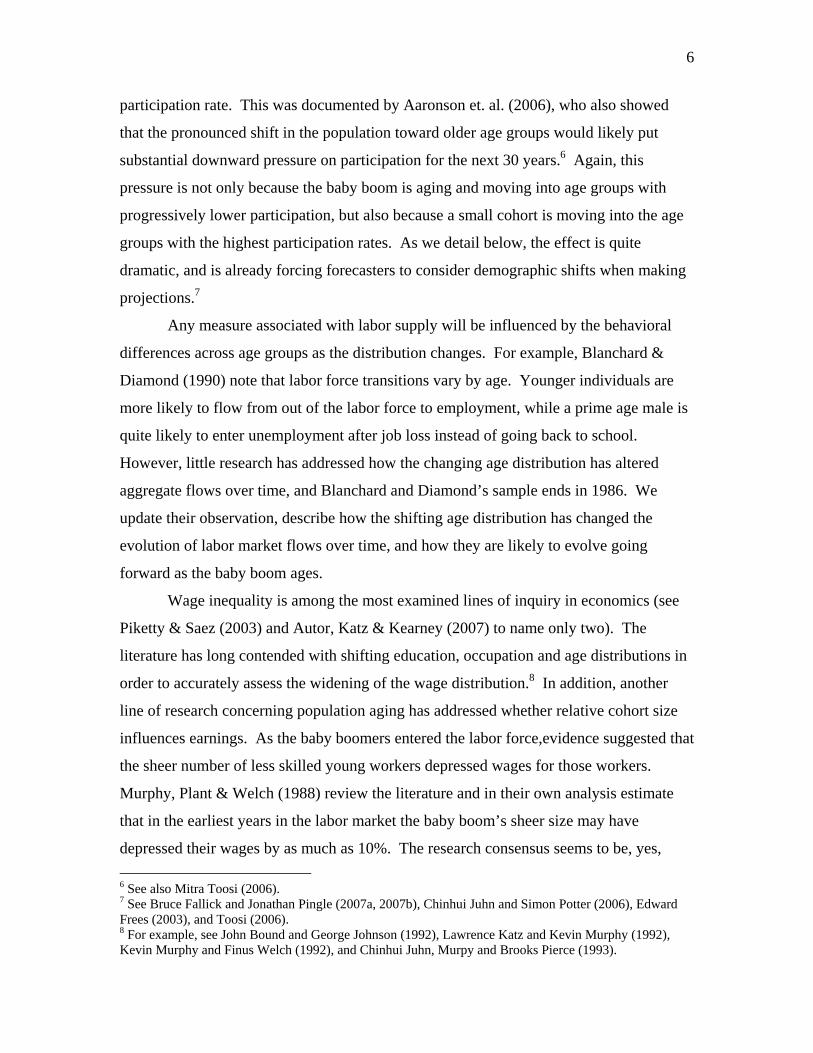
participation rate. This was documented by Aaronson et. al. (2006), who also showed
that the pronounced shift in the population toward older age groups would likely put
substantial downward pressure on participation for the next 30 years.6 Again, this
pressure is not only because the baby boom is aging and moving into age groups with
progressively lower participation, but also because a small cohort is moving into the age
groups with the highest participation rates. As we detail below, the effect is quite
dramatic, and is already forcing forecasters to consider demographic shifts when making
projections.7
Any measure associated with labor supply will be influenced by the behavioral
differences across age groups as the distribution changes. For example, Blanchard &
Diamond (1990) note that labor force transitions vary by age. Younger individuals are
more likely to flow from out of the labor force to employment, while a prime age male is
quite likely to enter unemployment after job loss instead of going back to school.
However, little research has addressed how the changing age distribution has altered
aggregate flows over time, and Blanchard and Diamond’s sample ends in 1986. We
update their observation, describe how the shifting age distribution has changed the
evolution of labor market flows over time, and how they are likely to evolve going
forward as the baby boom ages.
Wage inequality is among the most examined lines of inquiry in economics (see
Piketty & Saez (2003) and Autor, Katz & Kearney (2007) to name only two). The
literature has long contended with shifting education, occupation and age distributions in
order to accurately assess the widening of the wage distribution.8 In addition, another
line of research concerning population aging has addressed whether relative cohort size
influences earnings. As the baby boomers entered the labor force,evidence suggested that
the sheer number of less skilled young workers depressed wages for those workers.
Murphy, Plant & Welch (1988) review the literature and in their own analysis estimate
that in the earliest years in the labor market the baby boom’s sheer size may have
depressed their wages by as much as 10%. The research consensus seems to be, yes, 6 See also Mitra Toosi (2006). 7 See Bruce Fallick and Jonathan Pingle (2007a, 2007b), Chinhui Juhn and Simon Potter (2006), Edward Frees (2003), and Toosi (2006). 8 For example, see John Bound and George Johnson (1992), Lawrence Katz and Kevin Murphy (1992), Kevin Murphy and Finus Welch (1992), and Chinhui Juhn, Murpy and Brooks Pierce (1993).
7
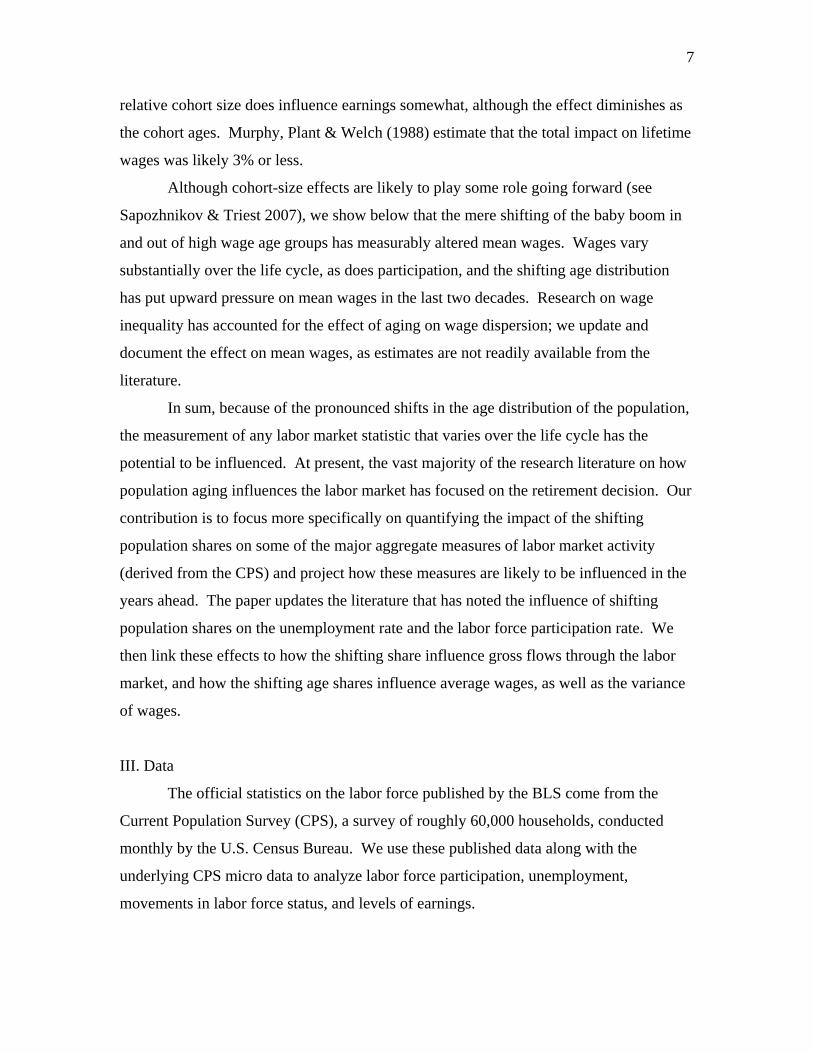
relative cohort size does influence earnings somewhat, although the effect diminishes as
the cohort ages. Murphy, Plant & Welch (1988) estimate that the total impact on lifetime
wages was likely 3% or less.
Although cohort-size effects are likely to play some role going forward (see
Sapozhnikov & Triest 2007), we show below that the mere shifting of the baby boom in
and out of high wage age groups has measurably altered mean wages. Wages vary
substantially over the life cycle, as does participation, and the shifting age distribution
has put upward pressure on mean wages in the last two decades. Research on wage
inequality has accounted for the effect of aging on wage dispersion; we update and
document the effect on mean wages, as estimates are not readily available from the
literature.
In sum, because of the pronounced shifts in the age distribution of the population,
the measurement of any labor market statistic that varies over the life cycle has the
potential to be influenced. At present, the vast majority of the research literature on how
population aging influences the labor market has focused on the retirement decision. Our
contribution is to focus more specifically on quantifying the impact of the shifting
population shares on some of the major aggregate measures of labor market activity
(derived from the CPS) and project how these measures are likely to be influenced in the
years ahead. The paper updates the literature that has noted the influence of shifting
population shares on the unemployment rate and the labor force participation rate. We
then link these effects to how the shifting share influence gross flows through the labor
market, and how the shifting age shares influence average wages, as well as the variance
of wages.
III. Data
The official statistics on the labor force published by the BLS come from the
Current Population Survey (CPS), a survey of roughly 60,000 households, conducted
monthly by the U.S. Census Bureau. We use these published data along with the
underlying CPS micro data to analyze labor force participation, unemployment,
movements in labor force status, and levels of earnings.

8
The labor force questions are asked of all civilians age 16 and over. Individuals
are in the sample for four months, get an eight month break and are then interviewed for
another four months. At the fourth and eighth interview months workers are asked about
earnings and hours of work (these are the “outgoing rotation groups”) which form the
basis of the wage measures used below. The survey includes data on the labor force
status of each individual, as well as basic demographic information that allows the
construction of labor force measures by age group. We have adjusted the data for the
effects of survey redesigns, revisions to population weights, and other inconsistencies
that would influence the interpretation of time series constructed from the microdata.
The individual observations in the CPS are weighted according to estimates of the
population provided by the U.S. Census Bureau. These estimates are real-time
assessments of the size and make-up of the U.S. population.The Census Bureau, of
course, conducts the decennial census. In between the decennial censuses, which serve as
benchmarks, the agency produces estimates that update how many people are living in
the U.S. based on a variety of sources ranging from the National Center for Health
Statistics to the Department of Defense and incorporating estimates from surveys such as
the American Community Survey. Despite their best efforts, these estimates are often
found to have missed substantially when data from the next decennial census become
available. For example, the estimate of the national population from the 2000 decennial
census was 6.8 million individuals above the previous estimates. Four million of that gap
was due to improved methodology (reduction in undercounting) which would have raised
pre-census estimates had it been applied to the 1990 census. Only 2.8 million was due to
underestimated population growth, disproportionately Hispanic, which appears to be
attributable to underestimating net international migration.9 Nevertheless, the Census
Bureau’s estimates provide the nation’s best estimate of the population over history.
In addition, the Census Bureau is one of the two primary sources of projections of
the future population of the U.S. These projections are based on the sizes of birth
cohorts, assumptions about fertility rates, estimated death rates, and assumptions for net
9 See West, Kirsten K. and J. Gregory Robinson, “Understanding Factors that Contributed to the Large Error of Closure in Census 2000, a note available online at : http://paa2005.princeton.edu/download.aspx?submissionId=51262

9
international migration. The levels of the population at each age are currently projected
out to 2050.10
The other major source of population projections is the Social Security
Administration (SSA). The SSA produces its own projections while using the Census
estimates over history. The assumptions used by these two government agencies in
making their projections overlap substantially, the primary differences being in the
assumptions for net international migration, including undocumented immigration.
Although the two agencies’ projections differ slightly different in how the population will
be distributed across age groups, each is in agreement that the distribution is shifting
markedly toward older age groups. Our analysis below relies on Census Bureau
projections, but qualitatively there would be little difference if we had used SSA
projections. In particular, the differences between the assumptions about undocumented
immigration in the two projections are not substantial enough to alter any of the
conclusions presented below.11
IV. The Labor Force Participation Rate
Of all the major labor market indicators, the labor force participation rate is likely
to be the most profoundly influenced by the aging of the population. Figure 2 shows the
aggregate participation rate since 1948. Broadly speaking, the participation rate over the
second half of the 20th century has had three regimes: a period of relative stability until
the mid-1960s, a period of steady increase between the mid-1960s and the late 1980s, and
another recent period of relative stability. This experience was dominated by movements
in women’s labor force participation, which rose sharply over the 25 years following
1965, and leveled off after about 1990. As noted above, the aging of the population 10 The Census population estimates are updated annually while the Census projections are updated about twice a decade. Therefore, the Census projections for population levels may not be consistent with the Census’s best current estimate of the historical population. This highlights where some projection risks may lie. For example, the age distribution in the population estimates reflected in the 2005 CPS population shares imply more downward pressure from aging on aggregate labor force participation than does the age distribution in the projections that the estimates have superseded. Similarly, revisions to population estimates in January of 2006 prompted revisions to the weights in the Current Population Survey, from which participation is officially measured. The resulting new population estimates, taken alone, caused the labor force participation rate to revise down by two basis points. 11 For more details on the sensitivity of projected labor force estimates to varying assumptions concerning undocumented immigration see Fallick and Pingle (2007b).
10
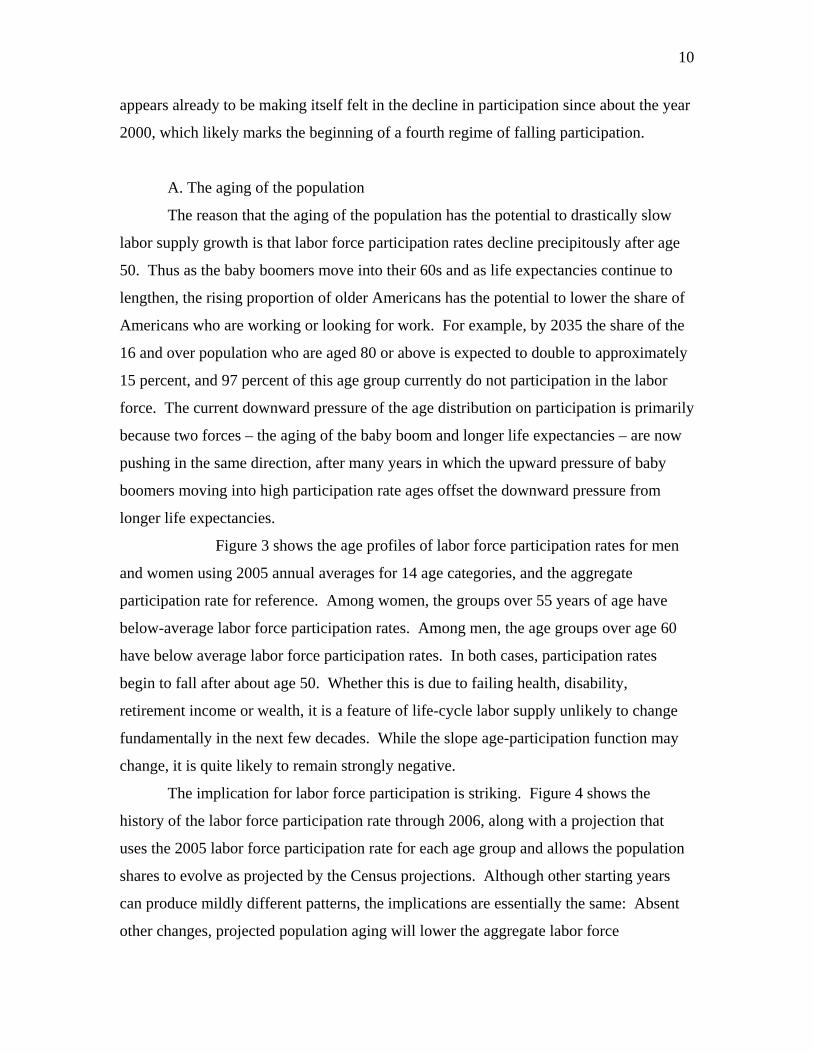
appears already to be making itself felt in the decline in participation since about the year
2000, which likely marks the beginning of a fourth regime of falling participation.
A. The aging of the population
The reason that the aging of the population has the potential to drastically slow
labor supply growth is that labor force participation rates decline precipitously after age
50. Thus as the baby boomers move into their 60s and as life expectancies continue to
lengthen, the rising proportion of older Americans has the potential to lower the share of
Americans who are working or looking for work. For example, by 2035 the share of the
16 and over population who are aged 80 or above is expected to double to approximately
15 percent, and 97 percent of this age group currently do not participation in the labor
force. The current downward pressure of the age distribution on participation is primarily
because two forces – the aging of the baby boom and longer life expectancies – are now
pushing in the same direction, after many years in which the upward pressure of baby
boomers moving into high participation rate ages offset the downward pressure from
longer life expectancies.
Figure 3 shows the age profiles of labor force participation rates for men
and women using 2005 annual averages for 14 age categories, and the aggregate
participation rate for reference. Among women, the groups over 55 years of age have
below-average labor force participation rates. Among men, the age groups over age 60
have below average labor force participation rates. In both cases, participation rates
begin to fall after about age 50. Whether this is due to failing health, disability,
retirement income or wealth, it is a feature of life-cycle labor supply unlikely to change
fundamentally in the next few decades. While the slope age-participation function may
change, it is quite likely to remain strongly negative.
The implication for labor force participation is striking. Figure 4 shows the
history of the labor force participation rate through 2006, along with a projection that
uses the 2005 labor force participation rate for each age group and allows the population
shares to evolve as projected by the Census projections. Although other starting years
can produce mildly different patterns, the implications are essentially the same: Absent
other changes, projected population aging will lower the aggregate labor force

11
participation rate by 6 full percentage points over the next 35 years. This pace of decline
dwarfs the 0.4 percentage point that shifting population shares have lowered the
aggregate rate over the past four years. In sum, the projected aging of the labor force is
likely to have a sizeable influence on participation, with the potential to completely
unwind the increases in participation attributable to the earlier entry of more women in
the workforce.
B. The aging of particular cohorts
There is another aspect of aging that has implications for the aggregate labor force
participation rate -- not changes in the age distribution, but the movement of particular
cohorts through the age distribution.
Most of the low-frequency change in the labor force participation rate in the
second half of the 20th century came from changes in participation rates within age
groups rather than changes in the age distribution of the population. For women, much of
this increase in participation appears to have resulted from the entry into the working-age
population of birth cohorts with higher average participation rates than those who
preceded them, and the progress of these higher-participation cohorts through the age
distribution. As these cohorts have aged, and earlier cohorts have left the scene, the
population of women has come to be dominated by cohorts who have proved to have
generally higher participation rates throughout their lives. A similar effect seems to have
been at work among men, but in the opposite direction, as successive cohorts of men
have had generally lower participation rates as their predecessors.
This evolution of participation rates by cohort likely reflects numerous factors --
such as evolving tastes, reproductive technology, wealth, education, social attitudes, and
retirement, welfare, and financial systems -- some of which were internalized into the
behavior of new generations more easily than into the behavior of mature cohorts who
had already made “sticky” choices, an idea that goes back at least as far as Durand
(1948).
The phenomenon is illustrated in figure 5, which shows the labor force
participation rates for three age groups of women: age 35 to 44, age 45 to 54 and age 55
to 64. Each line shows the participation rate of an age group over time. However, the

12
horizontal axis shows the birth year for the middle age of the group, rather than the year
of observation. In this way, the lines are shifted so that each birth cohort is vertically
aligned with itself at different ages. The participation rate of the 45-54 year old group
(the dashed line) appears to exhibit three rough inflections, in the vicinity of years 1960,
1975, and 1997. These correspond to the cohorts born around 1910, 1925, and 1947.
The first two of these inflections line up well with the 55 to 64 year old group (the dotted
line), meaning that the inflection points in both age groups seem to occur when the
cohorts born in 1910 and 1925 passed through those age groups. The cohort associated
with the third inflection (those born around 1947) are not quite old enough to exhibit that
inflection in the older group, but it can be seen when that cohort was 35-44 years old (the
solid line). Similarly (not shown), beginning in the mid-1960s and ending in the late
1970s, successive cohorts of 16-24 year old women had higher participation rates than
their predecessors. Participation rates of successive cohorts 25-34 year olds stopped
rising about ten years later, in the late 1980s, suggesting that the participation rate in each
of these age groups at a given time is at least partly related to which birth cohort is
passing through that age at that time.
Of course, not all inflection points in all age groups line up so well by birth year;
clearly, there have been developments in participation that are not well-represented by
the aging of birth cohorts. However, the coincidences that do exist are sufficient to
indicate that birth cohort has played a significant role in describing participation rates.
Consequently, the aging of particular birth cohorts has played an important role in the
evolution of the aggregate participation rate. In particular, the long increase in the
aggregate participation rate from the early 1970s through the late 1980s can be attributed
largely to the successively higher participation rates of cohorts born up through the
beginning of the baby boom. And the end of that long period of increase can be
attributed to the baby boom cohorts, who have roughly similar average participation
rates, coming to dominate the population as they moved through the age distribution.
Looking ahead, the same phenomenon of the aging of particular cohorts can be expected
to put downward pressure on the aggregate participation rate, as successive cohorts of
men and women appear to have generally lower propensities to participate.
13
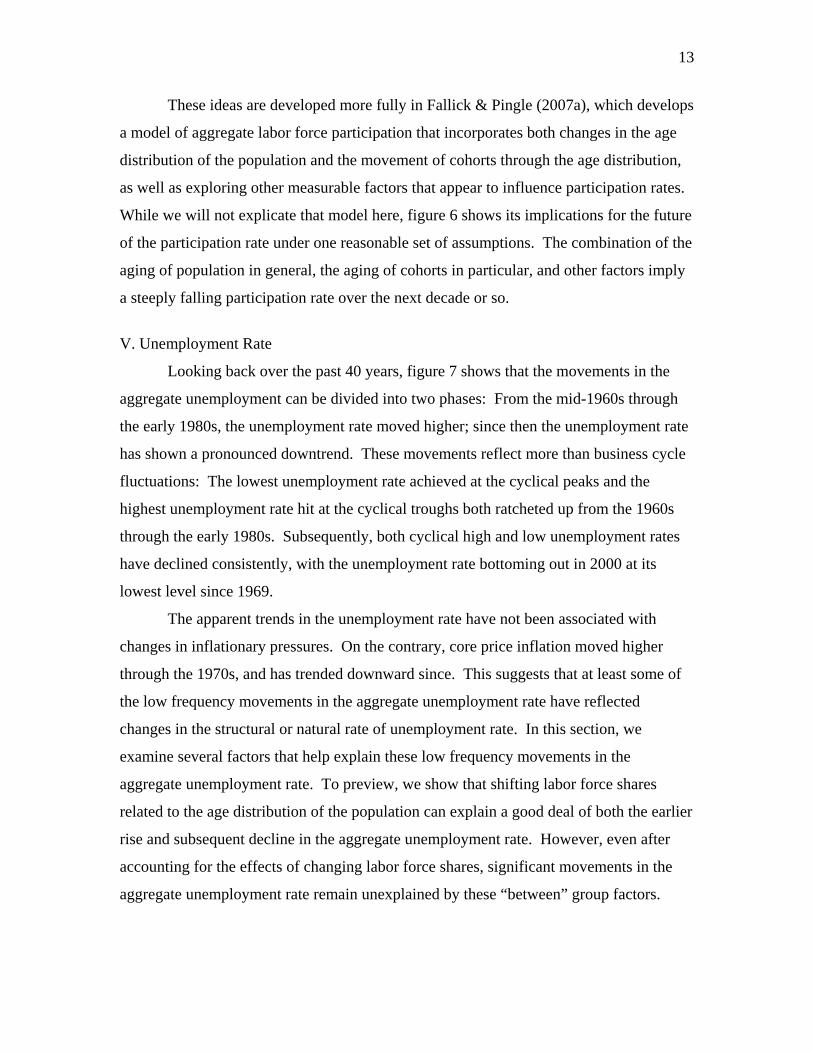
These ideas are developed more fully in Fallick & Pingle (2007a), which develops
a model of aggregate labor force participation that incorporates both changes in the age
distribution of the population and the movement of cohorts through the age distribution,
as well as exploring other measurable factors that appear to influence participation rates.
While we will not explicate that model here, figure 6 shows its implications for the future
of the participation rate under one reasonable set of assumptions. The combination of the
aging of population in general, the aging of cohorts in particular, and other factors imply
a steeply falling participation rate over the next decade or so.
V. Unemployment Rate
Looking back over the past 40 years, figure 7 shows that the movements in the
aggregate unemployment can be divided into two phases: From the mid-1960s through
the early 1980s, the unemployment rate moved higher; since then the unemployment rate
has shown a pronounced downtrend. These movements reflect more than business cycle
fluctuations: The lowest unemployment rate achieved at the cyclical peaks and the
highest unemployment rate hit at the cyclical troughs both ratcheted up from the 1960s
through the early 1980s. Subsequently, both cyclical high and low unemployment rates
have declined consistently, with the unemployment rate bottoming out in 2000 at its
lowest level since 1969.
The apparent trends in the unemployment rate have not been associated with
changes in inflationary pressures. On the contrary, core price inflation moved higher
through the 1970s, and has trended downward since. This suggests that at least some of
the low frequency movements in the aggregate unemployment rate have reflected
changes in the structural or natural rate of unemployment rate. In this section, we
examine several factors that help explain these low frequency movements in the
aggregate unemployment rate. To preview, we show that shifting labor force shares
related to the age distribution of the population can explain a good deal of both the earlier
rise and subsequent decline in the aggregate unemployment rate. However, even after
accounting for the effects of changing labor force shares, significant movements in the
aggregate unemployment rate remain unexplained by these “between” group factors.

14
A. The age distribution of the population
The most obvious way in which the aging of the population affects the aggregate
unemployment rate is simply that some age groups tend to have higher unemployment
rates than others. Figure 8 shows the average unemployment rates in 1997 for men and
women in various age groups. The variation in unemployment rates across age is
substantial but is concentrated among the younger age groups. In particular,
unemployment rates fall from the 16-17 group to the 25-29 group, then are pretty stable
from age 30 on. Thus, as population shares change, the aggregate unemployment rate
can be expected to change.
For many years it has been a common practice to adjust the unemployment rate
for such changes in the age/sex composition of the labor force. The usual method is to
recalculate the unemployment rate by weighting the unemployment rates of the various
demographic groups by their labor force shares in some base year (Perry 1970) rather
than allowing those shares to change over time.
Here we follow this practice with a couple of variations. First, most demographic
adjustments to the unemployment rate are performed using fairly broad age groups,
which may miss some subtleties in the evolution of the unemployment rate; we use
fourteen age groups. Second, we are interested in decomposing changes in the
demographic shares of the labor force into the two components of changes in population
shares and changes in relative participation rates. Therefore, to compute the contribution
to changes in the unemployment rate of the aging of the population alone, we hold group-
specific labor force participation rates and group-specific unemployment rates constant at
their 1997 average levels, and apply those rates to changing population shares to yield a
counterfactual aggregate unemployment rate. The difference between this counterfactual
unemployment rate and the actual unemployment rate in 1997 provides one measure of
the direct influence of changes in the age distribution of the population on the aggregate
unemployment rate. This difference is shown in Figure 9.
Because the differences in unemployment rates across age groups are
concentrated at younger ages, the changing age distribution of the population had its most
notable accounting influence on the aggregate unemployment rate from the 1960s
through the 1980s, when the baby boom was moving through and out of these younger
15
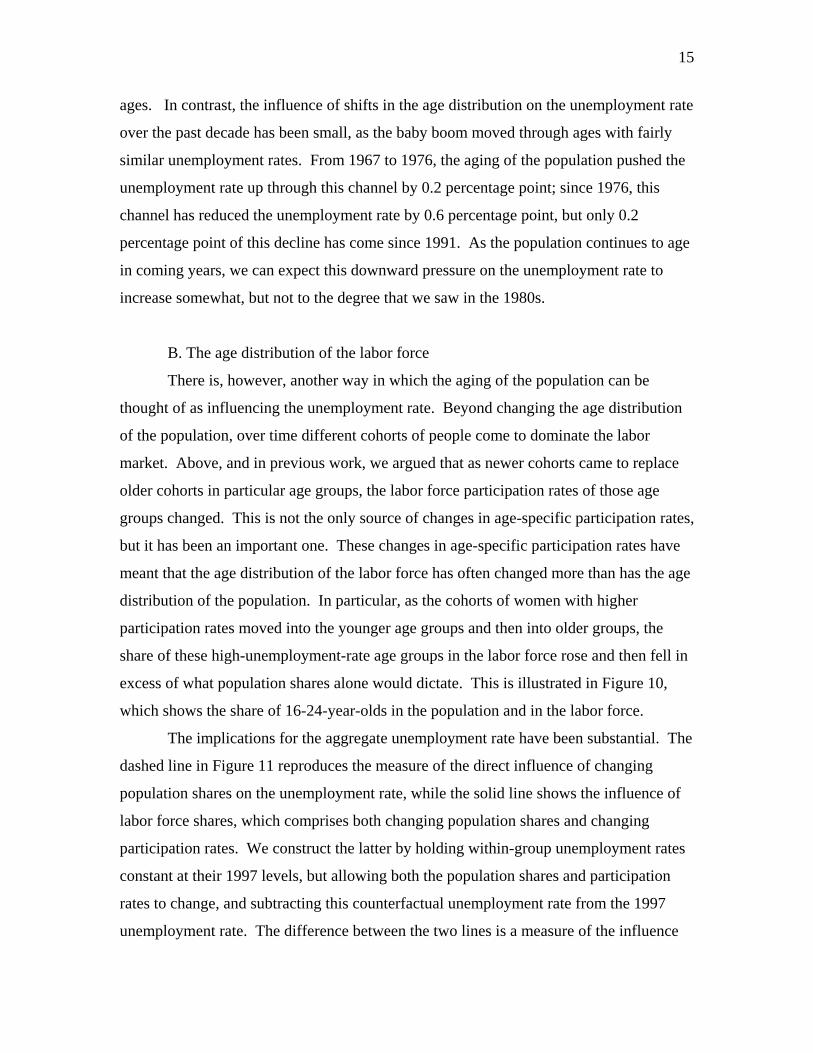
ages. In contrast, the influence of shifts in the age distribution on the unemployment rate
over the past decade has been small, as the baby boom moved through ages with fairly
similar unemployment rates. From 1967 to 1976, the aging of the population pushed the
unemployment rate up through this channel by 0.2 percentage point; since 1976, this
channel has reduced the unemployment rate by 0.6 percentage point, but only 0.2
percentage point of this decline has come since 1991. As the population continues to age
in coming years, we can expect this downward pressure on the unemployment rate to
increase somewhat, but not to the degree that we saw in the 1980s.
B. The age distribution of the labor force
There is, however, another way in which the aging of the population can be
thought of as influencing the unemployment rate. Beyond changing the age distribution
of the population, over time different cohorts of people come to dominate the labor
market. Above, and in previous work, we argued that as newer cohorts came to replace
older cohorts in particular age groups, the labor force participation rates of those age
groups changed. This is not the only source of changes in age-specific participation rates,
but it has been an important one. These changes in age-specific participation rates have
meant that the age distribution of the labor force has often changed more than has the age
distribution of the population. In particular, as the cohorts of women with higher
participation rates moved into the younger age groups and then into older groups, the
share of these high-unemployment-rate age groups in the labor force rose and then fell in
excess of what population shares alone would dictate. This is illustrated in Figure 10,
which shows the share of 16-24-year-olds in the population and in the labor force.
The implications for the aggregate unemployment rate have been substantial. The
dashed line in Figure 11 reproduces the measure of the direct influence of changing
population shares on the unemployment rate, while the solid line shows the influence of
labor force shares, which comprises both changing population shares and changing
participation rates. We construct the latter by holding within-group unemployment rates
constant at their 1997 levels, but allowing both the population shares and participation
rates to change, and subtracting this counterfactual unemployment rate from the 1997
unemployment rate. The difference between the two lines is a measure of the influence
16
of the changing participation rates. In total, changes in labor force shares raised the
unemployment rate by 0.4 percentage point from 1967 to 1977—about twice as much as
the change due only to changing population shares. Since 1977, shifts in the labor force
shares have lowered the aggregate unemployment rate by 0.9 percentage point, 0.3
percentage point of which has come since 1991. Once again, the decline is bigger than
can be accounted for by changing population shares alone, owing largely to the declining
participation rates for young men and women.
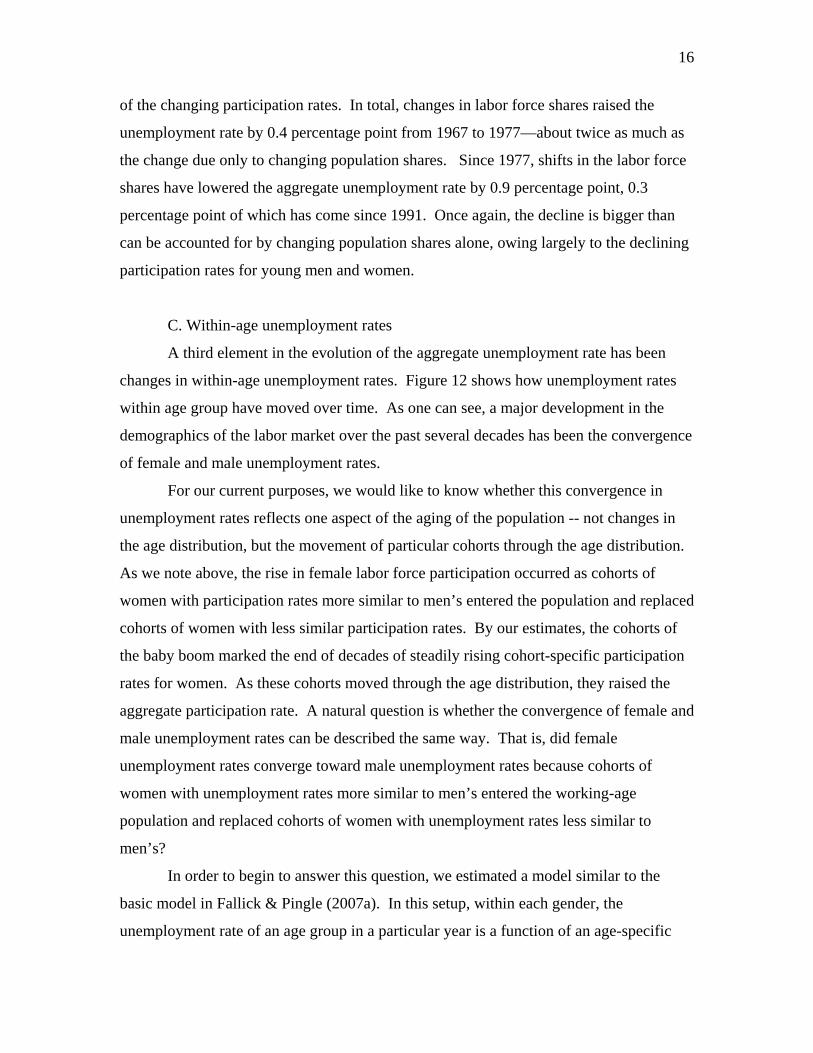
C. Within-age unemployment rates
A third element in the evolution of the aggregate unemployment rate has been
changes in within-age unemployment rates. Figure 12 shows how unemployment rates
within age group have moved over time. As one can see, a major development in the
demographics of the labor market over the past several decades has been the convergence
of female and male unemployment rates.
For our current purposes, we would like to know whether this convergence in
unemployment rates reflects one aspect of the aging of the population -- not changes in
the age distribution, but the movement of particular cohorts through the age distribution.
As we note above, the rise in female labor force participation occurred as cohorts of
women with participation rates more similar to men’s entered the population and replaced
cohorts of women with less similar participation rates. By our estimates, the cohorts of
the baby boom marked the end of decades of steadily rising cohort-specific participation
rates for women. As these cohorts moved through the age distribution, they raised the
aggregate participation rate. A natural question is whether the convergence of female and
male unemployment rates can be described the same way. That is, did female
unemployment rates converge toward male unemployment rates because cohorts of
women with unemployment rates more similar to men’s entered the working-age
population and replaced cohorts of women with unemployment rates less similar to
men’s?
In order to begin to answer this question, we estimated a model similar to the
basic model in Fallick & Pingle (2007a). In this setup, within each gender, the
unemployment rate of an age group in a particular year is a function of an age-specific

17
constant and the identity of the birth cohorts passing though those ages in that year, as
well as cyclical controls. That is,
1989
, , , ,1907
1log g t g g t g b t b g tbg
UR X Cn
α λ β ε=
= + + +∑ g = 1 to 14 (1)
where g indexes the age groups, t indexes the calendar year, and b indexes birth years.
The Cg,b,t are indicator variables that equal one if the corresponding cohort b appears in
that age group g at time t , and ng is the number of ages in age group g. Xt is a vector
of cyclical control variables, the α are age group fixed effects, and the β are birth year or
cohort fixed effects. The degree of cyclical sensitivity (λ) varies by age group, while the
cohort effects do not -- that is, the cohort effects are constrained to be the same across all
equations in which the cohort appears. The age effects (α) are constant.
In this set-up, the shape of the age-unemployment rate profile is common to all
persons of the same gender, but each birth cohort has a particular “propensity” to be
unemployed that shifts the age profile up or down.
An alternative formulation assumes that, within each gender, the unemployment
rate of an age group in a particular year is a function of an age-specific constant and a
common effect of calendar time.
, ,log g t g g t t g tUR Xα λ β ε= + + + g = 1 to 14 (2)
In this alternative, the shape of the age-unemployment profile is likewise common
to all persons of the same gender, but this age profile is shifted by conditions that change
over time but affect the unemployment rates of all ages proportionately.
Comparing the fit of these two specifications provides an indication of whether
the aging of specific cohorts can explain the evolution of the unemployment rate. In the
case of women, the evidence in favor of a cohort effect in explaining the increase in labor
force participation was so strong that we expected the evidence to favor a cohort
explanation of the evolution of unemployment rates as well. In fact, as shown in figure
13, the estimated trend from the basic cohort specification does a reasonably good job of
18
capturing the low frequency movements in women’s unemployment rates, at least since
the mid-1970s, suggesting that the decline in women’s unemployment rates over that
span can be usefully described in terms of lower-unemployment cohorts replacing higher-
unemployment cohorts. However, the specification that substitutes time effects—
modeled as a cubic time trend—for cohort effects, does a somewhat better job of
capturing the initial increase in female unemployment rates through the mid-1970s.
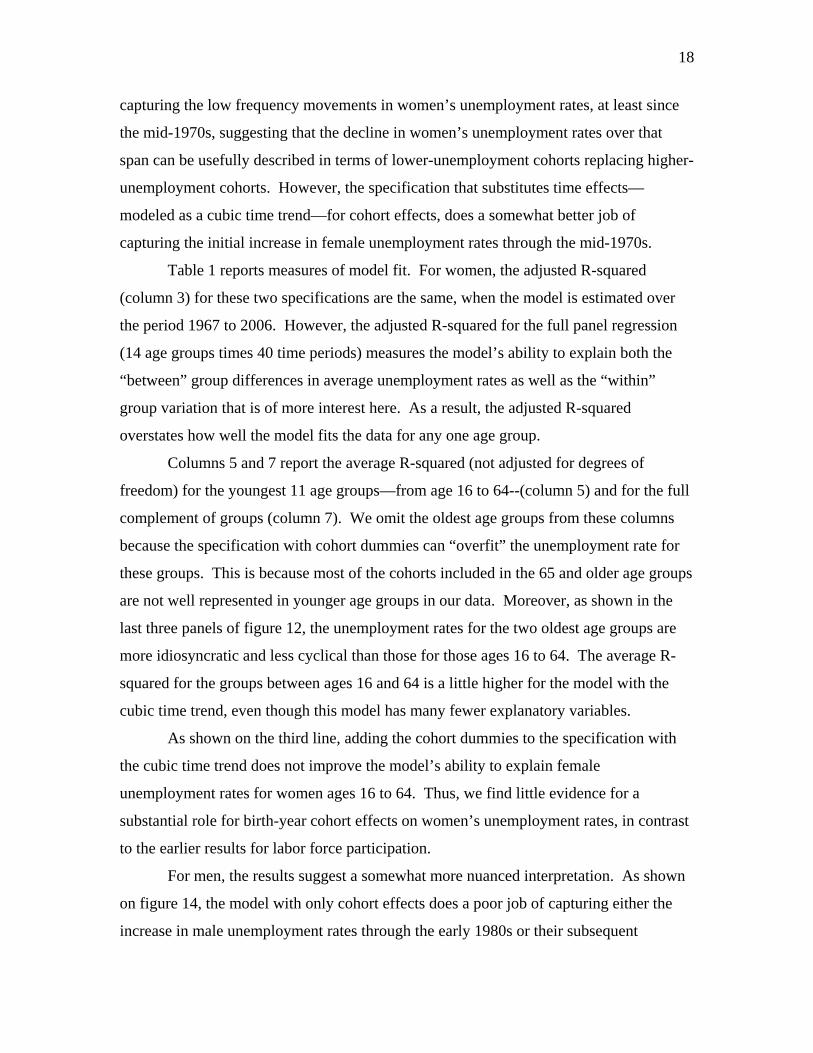
Table 1 reports measures of model fit. For women, the adjusted R-squared
(column 3) for these two specifications are the same, when the model is estimated over
the period 1967 to 2006. However, the adjusted R-squared for the full panel regression
(14 age groups times 40 time periods) measures the model’s ability to explain both the
“between” group differences in average unemployment rates as well as the “within”
group variation that is of more interest here. As a result, the adjusted R-squared
overstates how well the model fits the data for any one age group.
Columns 5 and 7 report the average R-squared (not adjusted for degrees of
freedom) for the youngest 11 age groups—from age 16 to 64--(column 5) and for the full
complement of groups (column 7). We omit the oldest age groups from these columns
because the specification with cohort dummies can “overfit” the unemployment rate for
these groups. This is because most of the cohorts included in the 65 and older age groups
are not well represented in younger age groups in our data. Moreover, as shown in the
last three panels of figure 12, the unemployment rates for the two oldest age groups are
more idiosyncratic and less cyclical than those for those ages 16 to 64. The average R-
squared for the groups between ages 16 and 64 is a little higher for the model with the
cubic time trend, even though this model has many fewer explanatory variables.
As shown on the third line, adding the cohort dummies to the specification with
the cubic time trend does not improve the model’s ability to explain female
unemployment rates for women ages 16 to 64. Thus, we find little evidence for a
substantial role for birth-year cohort effects on women’s unemployment rates, in contrast
to the earlier results for labor force participation.
For men, the results suggest a somewhat more nuanced interpretation. As shown
on figure 14, the model with only cohort effects does a poor job of capturing either the
increase in male unemployment rates through the early 1980s or their subsequent

19
decline.12 In contrast, the specification with the cubic time trend rises and falls more
closely with the actual unemployment rate. These visual impressions are borne out by the
measures of model fit. As shown in column 4 of table 1, the average R-squared for the
11 age groups aged 16 to 64 improves more notably when cohort effects are replaced by a
cubic time trend.
But, unlike the results for women, the model fit is notably improved when we
include both cohort effects and time effects. Thus, it seems that the movements of
relative unemployment rates for the different age groups are more important for men than
for women, which may in turn reflect that age plays a more significant role in how men
have responded to aggregate labor market developments.
Clearly there is much more work to be done in modeling the trends in
unemployment rates, and a discussion of the economic factors at work is beyond the
scope of the current paper. Nevertheless, we are confident that the aging of the
population per se is playing only a relatively minor role in the evolution of the aggregate
unemployment rate at present.
VI. Labor Market Flows
A. The age profile of unemployment rates
The modest size of the effects of population aging on the unemployment rate in
recent years stems from the fact that although unemployment rates fall rapidly with age
from the teenage years through the early 30s, unemployment rates are fairly stable across
ages from the early 30s into the 70s. Some of this, no doubt, reflects selection biases, as
those types of persons who would tend to have higher unemployment rates leave the
population or the labor force at different rates than those who tend to have lower
unemployment rates. But the stability is nevertheless surprising given the profundity of
the changes in labor force attachment over the life cycle. Indeed, the stability of the
unemployment rates masks large but offsetting changes in labor force behaviors that,
taken individually, might be expected to significantly affect unemployment rates.
12 The rise and subsequent decline in the trend unemployment rate from the cohort model primarily reflects the changing demographics of the labor force that we discussed above. Holding labor force shares fixed at their 1997 values, estimated trend from the cohort model is nearly flat from 1967 to 2006.

20
The most obvious of these is retirement behavior and associated withdrawal from
the labor force. Figures 15 and 16 show the average monthly hazard rates, by age, out of
the labor force from employment and from unemployment, for the period 1996-2006,
calculated from matched CPS data. Both rates rise rapidly beginning at ages in the 50s,
increases that we would associate with retirements. At least qualitatively, the changes in
these flows as persons age offset each other in terms of their implications for the
unemployment rate.
However, other labor force flows vary over the entire range of ages over which
unemployment rates are stable. Job finding rates -- the hazard rates from unemployment
to employment and from not in the labor force into employment -- both fall over the
entire range from about age 30 on (figures 17 and 18). One would expect that because of
this unemployment rates would rise with age, but over the same age range the rate at
which new entrants and re-entrants move from out of the labor force into unemployment
falls (figure 19). Meanwhile, the flow that one might associate most directly with the
unemployment rate, the hazard rate from employment to unemployment, remains fairly
stable throughout life once past the turbulent younger ages (figure 20) 13
B. Employment to Unemployment
Although the age profiles of labor force flows have relatively small implications
for the aggregate unemployment rate, some of the particular flows are interesting in their
own right. Among these is the rate of movement from employment to unemployment
(the EU flow). Changes in this rate induced by demographic shifts may have
implications for trends in prominent indicators of labor market conditions, such as claims
for unemployment insurance, as well as for the relative importance of job separations in
13 An aging population might be expected to affect the duration of unemployment in contradictory ways. As the population ages away from the high turnover young years to the more attached prime years, durations might lengthen, while as the population ages from the more attached prime years to the less attached older years, durations would shorten. We have taken a quick look at this question by approximating the expected duration of unemployment within each age group by the reciprocal of the mean hazard rate for leaving unemployment (to any destination). By this measure, aging has little influence on the expected durations, especially on the duration of unemployment. For E and N, we are looking at top differences of ½ and 1-1/2 months on levels of 32 and 48 months, respectively—for unemployment, a top difference of less than a day on levels of 60 days. However, for a more detailed analysis of the influence of the baby boomers on unemployment durations, see Shimer and Abraham (2001).
21
explaining movements in the unemployment rate, a topic that has attracted considerable
attention of late (e.g., Shimer 2007, Ramey & Fujita 2006).
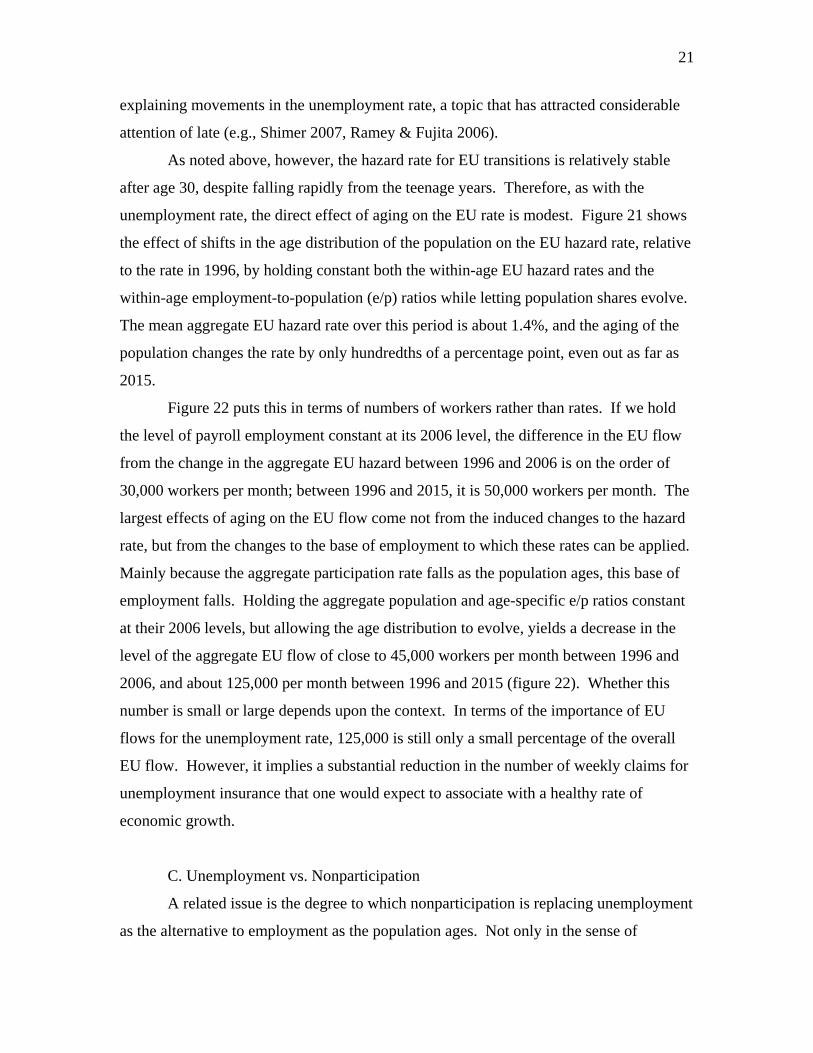
As noted above, however, the hazard rate for EU transitions is relatively stable
after age 30, despite falling rapidly from the teenage years. Therefore, as with the
unemployment rate, the direct effect of aging on the EU rate is modest. Figure 21 shows
the effect of shifts in the age distribution of the population on the EU hazard rate, relative
to the rate in 1996, by holding constant both the within-age EU hazard rates and the
within-age employment-to-population (e/p) ratios while letting population shares evolve.
The mean aggregate EU hazard rate over this period is about 1.4%, and the aging of the
population changes the rate by only hundredths of a percentage point, even out as far as
2015.
Figure 22 puts this in terms of numbers of workers rather than rates. If we hold
the level of payroll employment constant at its 2006 level, the difference in the EU flow
from the change in the aggregate EU hazard between 1996 and 2006 is on the order of
30,000 workers per month; between 1996 and 2015, it is 50,000 workers per month. The
largest effects of aging on the EU flow come not from the induced changes to the hazard
rate, but from the changes to the base of employment to which these rates can be applied.
Mainly because the aggregate participation rate falls as the population ages, this base of
employment falls. Holding the aggregate population and age-specific e/p ratios constant
at their 2006 levels, but allowing the age distribution to evolve, yields a decrease in the
level of the aggregate EU flow of close to 45,000 workers per month between 1996 and
2006, and about 125,000 per month between 1996 and 2015 (figure 22). Whether this
number is small or large depends upon the context. In terms of the importance of EU
flows for the unemployment rate, 125,000 is still only a small percentage of the overall
EU flow. However, it implies a substantial reduction in the number of weekly claims for
unemployment insurance that one would expect to associate with a healthy rate of
economic growth.
C. Unemployment vs. Nonparticipation
A related issue is the degree to which nonparticipation is replacing unemployment
as the alternative to employment as the population ages. Not only in the sense of

22
retirement, but also as the state in which potential workers reside between stints of
employment. Put another way, to what extent are movements into and out of
employment mediated by a period of unemployment? Much of the literature that models
or investigates labor market flows recognizes in the importance of movements between
employment and nonparticipation, and the importance of these flows rises as the
population ages.
Figure 23 shows the percentage of transitions into employment for which
nonparticipation, rather than unemployment, is the state of origin, that is, new entrants
and re-entrants who move into employment without a period of unemployment as
measured by the CPS. The figure also shows the percentage of transitions out of
employment for which nonparticipation, rather than unemployment, is the destination
state. These transitions may include retirements, discouraged workers, persons going
back to school, leaving work to raise families, and a number of other categories.
As the population has ages, the percentage of transitions that involve
nonparticipation rises. But the differences are not large. Between 1996 and 2015, we can
expect the shifting age distribution of the population to increase the percentage of
transitions that involve nonparticipation by about 1 point.
D. Aggregate turnover
One typically thinks of older persons as being more stable in their jobs, but the
relationship is not monotonic. Figure 24 shows average separation rates by age. These
include both transitions out of employment, and transitions from one main employer to
another, which can be measured using matched CPS data since the redesign of that
survey in 1994. (See Fallick & Fleischman 2004). Overall separation rates fall sharply
with age into the late 20s, decline further gradually through the late 40s, then rise into and
through retirement ages.
As a result, the direct effect of the shifting age distribution on the aggregate
separation rate, graphed in figure 25, is also not monotonic. Aging has mostly driven the
aggregate separation rate down since 1996 as the youngest of the baby boomers entered
the low-separation ages and the oldest of the baby boomers had not left those ages.
Beginning a few years ago, however, the oldest of the baby boomers began to enter the

23
upward-sloping part of the separation rate profile, and this began to push up the aggregate
separation rate.
Again, however, the implications for the separation rate are relatively small, in the
hundredths of a percentage point on a level of 6.8% per month. And again, the larger
effects come from the implications of aging for the level of employment, which reduce
the level of aggregate turnover (figure 26).
VII. Hourly Wages
Upward sloping age-earnings profiles have long been recognized as a feature of
the labor market and an influence on life cycle-labor supply. Human capital theory
provided an explanation for why young workers would work for low wages and as skills
and experience increase so too does marginal productivity and thus wages, as noted by
Mincer (1958) and detailed by Willis (1986). Kotlikoff (1986) further argued that
productivity rose over the life cycle, but not by as much as wages. Workers were paid
low wages at the start of their career and high wages at the end as part of contracts with
employers that provided other benefits to both parties like retention and income security.
Hourly wages generally rise with age, and then decline slightly in older age groups above
60.
We use the reported earnings from the outgoing rotation groups in the CPS,
provided by the National Bureau of Economic Research (NBER) CPS extraction file.
Earnings were converted to an hourly wage, aggregated to an annual frequency, and
deflated by the Consumer Price Index.14 Figure 27 plots the age-wage profile of men in
three different years: 1979 the earliest data for the reported wage measures in the NBER
data, 1990, and 2005, the most recent data. The profiles follow roughly the same pattern
in each year. Although, as the authors noted earlier have suggested, the sheer size of the
14 Data cleaning was kept to a minimum, to be as close to respondent tabulations as possible. However, implausibly high earnings were often the result of low reported hours combined with high weekly earnings, and thus hourly workers reporting fewer than 5 hours of work a week combined with weekly earnings over $1000 were dropped. Workers with implausibly low hourly earnings were also dropped. Workers earnings above the CPS topcodes were imputed, within each age-sex category, using a lognormal distribution. Pareto distributions proved too unstable for imputation within narrowly defined demographic categories. For discussion of the sensitivity of the imputation and trimming procedures see John Schmitt (2002), who convincingly argues in favor of using a lognormal distribution instead of a pareto distibution. John was also nice enough to provide STATA code for imputations, as well as comparable wage series over time for comparison. The details are described in his paper.
24
baby boomers’ cohort may have depressed their wages all else equal, the opposite pattern
is observed in these profiles. Teen wages have declined since the baby boomers left
those age groups and earnings of older workers have risen as the boomers have entered
those age groups. No doubt the higher levels of education of the boomers are swamping
other microeconomic effects.
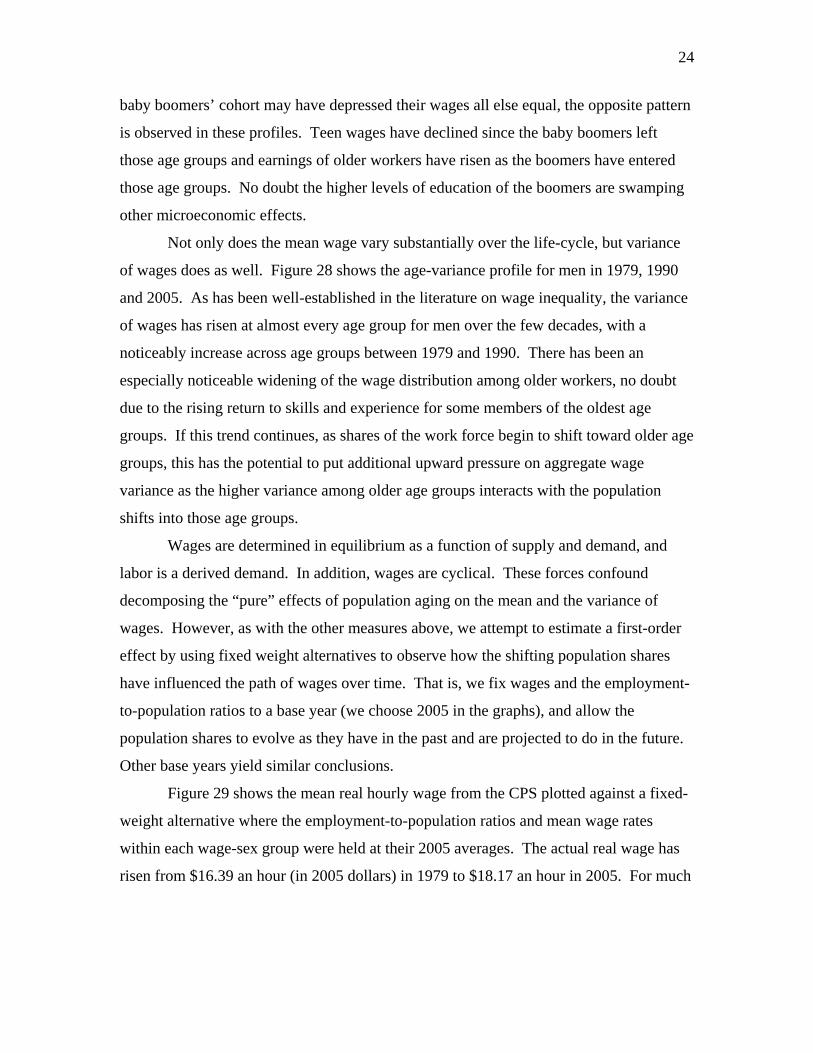
Not only does the mean wage vary substantially over the life-cycle, but variance
of wages does as well. Figure 28 shows the age-variance profile for men in 1979, 1990
and 2005. As has been well-established in the literature on wage inequality, the variance
of wages has risen at almost every age group for men over the few decades, with a
noticeably increase across age groups between 1979 and 1990. There has been an
especially noticeable widening of the wage distribution among older workers, no doubt
due to the rising return to skills and experience for some members of the oldest age
groups. If this trend continues, as shares of the work force begin to shift toward older age
groups, this has the potential to put additional upward pressure on aggregate wage
variance as the higher variance among older age groups interacts with the population
shifts into those age groups.
Wages are determined in equilibrium as a function of supply and demand, and
labor is a derived demand. In addition, wages are cyclical. These forces confound
decomposing the “pure” effects of population aging on the mean and the variance of
wages. However, as with the other measures above, we attempt to estimate a first-order
effect by using fixed weight alternatives to observe how the shifting population shares
have influenced the path of wages over time. That is, we fix wages and the employment-
to-population ratios to a base year (we choose 2005 in the graphs), and allow the
population shares to evolve as they have in the past and are projected to do in the future.
Other base years yield similar conclusions.
Figure 29 shows the mean real hourly wage from the CPS plotted against a fixed-
weight alternative where the employment-to-population ratios and mean wage rates
within each wage-sex group were held at their 2005 averages. The actual real wage has
risen from $16.39 an hour (in 2005 dollars) in 1979 to $18.17 an hour in 2005. For much

25
of the 1980s the real wage hovered around $16 an hour, before rising in the late 1990s,
and then leveling off in recent years.15
The fixed-weight alternative, where the increases in the series are due only to
shifting population shares, rises significantly as well. At face value, the fixed-weight
alternative rose by $0.89 between 1979 and 2005 while actual real wages rose by $1.78.
Thus, although the timing differs, half the increase in real wages over the period is
accounted for simply by the baby boomers moving into their high wage years. Although,
noting the sharp drop in actual real wages in 1979, the exact proportion will depend on
one’s starting point, clearly the shift in the age distribution of the population contributed
a substantial portion of the real wage gains made by workers in the last two decades.
However, as the projections in the figure show, this upward pressure on mean real wages
from aging has pretty much ended, as the baby boomers have completed their transition
into high wage age groups.
Similarly, the mere shifting of the population shares has put upward pressure on
wage variance. However, the amount of pressure has been small. The actual variance of
log wages since 1979, deflated using the CPI, is shown as the solid line in figure 30. The
variance, although volatile, shows the steep upward trend since 1979 that one would
expect to see given the long literature on wage inequality (see similar series in Schmitt
2003). The long-dashed line shows the change in variance due to shifting population
shares, holding within-group variances constant at their 2005 values and allowing the
employment to population ratios to vary.
As is readily apparent, although shifting population shares have put upward
pressure on wage variance, the effect is small relative to the secular trend since the end of
the 1970s. The effect is small partly because under the surface there have been two
offsetting effects at work. This is shown in figure 31. As one would expect, as the
population has aged it has shifted towards older age groups which have higher within-
group variances. This increase in within-group variance has worked to push the overall
15 Average hourly earnings reported by the payroll survey of establishments was $16.13 in 2005, compared to our CPS-based series of $18.17 an hour. The payroll survey excludes non-production and supervisory workers in addition to the self-employed, among other conceptual differences. The payroll survey series has a similar path as the series shown here, except for one difference: the payroll survey’s average hourly earnings shows more decline in real wages between 1979 and the early 1990s than the series we derive from the CPS.
26
variance up. However, at the same time the aging of the population has reduced the
between-age-group variance, which has largely offset the increase in average within-
group variance. In any case, even such upward pressure as there has been has pretty
much run its course, and we can expect little influence further pressure in the years
ahead.
VIII. Conclusion
Although changes in behavior within age groups may offset some of the influence
of the shifting age shares, the aging of the baby boom, increased longevity, and other
sources of change in the age distribution have been and are likely to remain important. In
the years ahead, the macroeconomic measure in the labor market likely to be affected in
the most pronounced way is the labor force participation rate, as the share of labor market
participants continues to shrink in the years ahead at even a faster pace than over the last
several years. Baby boomers are expected to remain in the labor force longer than prior
cohorts. However, labor supply declines severely with age and, even among the baby
boomers, it is unlikely that a someone born in 1950 will be nearly as likely to work at age
65 than they were at age 45. Given this feature of labor supply over the life cycle, the
shifting age distribution of the population is likely to put substantial downward pressure
on the aggregate participation rate for the next 30 years.
Economists have long noted the influence of labor force composition on
unemployment rates. In order to assess labor market slack, wage pressure, or the health
of the labor market over time, movements in the unemployment rate must be decomposed
into cyclical movements and more structural changes like an aging population.
However, in contrast to the participation rate, for which large aging-induced changes lie
ahead, the influence of the aging of the baby boom on the unemployment rate has largely
run its course. More important to the aggregate unemployment of late are other factors,
such as the decline in teenage participation that continues to shrink the share of a high
unemployment rate age group in the labor force.
The again population has also changed how individuals flow through the labor
market states, their persistence in a given state and the likelihood they drop out of the
labor force entirely. Although the projected changes are small, we anticipate the
27
transitions through nonparticipation will continue to rise in the years ahead. In addition,
the corresponding influence on the separation rate, which fell over time and has begun to
rise again has been relative modest. However small these effects might be, the influence
aging has on interpreting labor market statistics remains important. As we note above,
the analysis implies a substantial reduction in the number of weekly claims for
unemployment insurance (one of the most watched high frequency economic indicators)
that one would expect to associate with a healthy rate of economic growth.
Finally, mean earnings derived from the CPS have also been influenced by
population aging. The baby boomers moving into their high earnings years has put
upward pressure on mean wages. Although this is a partial equilibrium accounting that
does not account for such offsetting influences as how the relative supply or skill supply
might have offset the influence of population aging, the effect is still dramatic. The
upward pressure the baby boomer aging has had on mean wages has largely run its
course. Without that influence the gains in mean real wages in the 1990s likely would
not have been as great. Going forward, the shifting age distribution is no longer going to
put upward pressure on mean wages. Thus this contribution to related measures like the
aggregate wage bill will diminish in the years ahead.
None of the projections for population are set in stone. That said, the baby boom
exists and is aging. Projections of shifts in the age distribution of the population have
wide confidence intervals, but carrying forward the baby boomers from age group to age
group as they pass through each year is not as uncertain as, say, projecting undocumented
immigration. Life expectancy will lengthen, perhaps faster than projected (which would
cause the aggregate labor force participation to decline even more quickly than
projected). All in all, the population is shifting toward older age groups and, short of a
substantial shift in policy not currently on the horizon, nothing will change that feature of
population growth in the U.S. As economists continue to study economic time series,
accounting for these shifts will remain at least as important in the future as it has in the
past, if not more so. Accounting for such changes will also shed clearer light on pressing
economic issues and problems, analysis of which might otherwise be confounded by the
influence of population aging on economic measures.

28
29
References
Aaronson, Stephanie, Bruce Fallick, Andrew Figura, Jonathan Pingle, and William
Wascher. 2006. “The Recent Decline in the Labor Force Participation Rate and Its
Implications for Potential Labor Supply,” Brookings Papers on Economic
Activity, (1):69-134.
Autor, David, Lawrence Katz and Melissa Kearney, 2007. “Trends in U.S. Wage
Inequality: Revising the Revisionists,” manuscript, March, available from David
Autor’s MIT web site.
Blanchard, Olivier Jean and Peter Diamond, 1990. “The Cyclical Behavior of the Gross
Flows of U.S. Workers,” Brookings Papers on Economic Activity, No. 2, pp 85-
155.
Borsch-Supan, Axel, 2002. “Labor Market Effects of Population Aging,” MEA
University of Mannheim working paper, 11-2002, November.
Bound, John, and George Johnson, 1992. “Changes in the Structure of Wages in the
1980s: An Evaluation of Alternative Explanations,” American Economic Review,
Vol. 82, June, pp 371-92.
Easterlin, Richard. 1961 “The American Baby Boom in Historical Perspective,” The
American Economic Review, Vol. 51, No. 5, December, pp. 869-911.
Durand, John D., The Labor Force in the United States 1890-1960. New York: Social
Science Research Council, 1948.
Fallick, Bruce and Jonathan Pingle, 2007(a). “A Cohort-Based Model of Labor Force
Participation,” Finance and Economics Discussion Series Divisions of Research
& Statistics and Monetary Affairs Federal Reserve Board, Washington, D.C.,
2007-9.
Fallick, Bruce and Jonathan Pingle, 2007(b). “The Effect of Population Aging on
Aggregate Labor Supply in the U.S.,” forthcoming in Labor Supply in the New
Century, Federal Reserve Bank of Boston.
Fallick, Bruce, Charles Fleischman and Jonathan Pingle, 2006. “Demographic Shifts and
the Labor Market,” in The Economic Outlook for 2007, University of Michigan
Research Seminar in Quantitative Economics.

30
Flaim, Paul O., 1990. “Population Changes, the baby boom, and the unemployment
rate,” Monthly Labor Review, vol. 113, pp 3-10.
Goldin, Claudia. 2006. “The Quiet Revolution That Transformed Women’s Employment,
Education and Family.” American Economic Review, Papers and Proceedings
96(2):1-21.
Hagen, Everett E., 1959. “Population and Economic Growth,” The American Economic
Review, Vol. 49, No. 3, June, pp 310-327.
Hansen, Alvin H., 1939. “Economic Progress and Declining Population Growth,” The
American Economic Review, Vol. 29, No. 1, March, pp 1-15.
Juhn, Chinhui, Kevin Murphy and Brooks Pierce, 1993, “Wage Inequality and the Rise in
Returns to Skills,” Journal of Political Economy, Vol. 101, June, 410-442.
Juhn, Chinhui and Simon Potter, 2006. “Changes in Labor Force Participation in the
United States,” Journal of Economic Perspectives, vol. 20
Katz, Lawrence, and Kevin Murphy, 1992. “Changes in Relative Wages, 1963-1987:
Supply and Demand Factors,” Quarterly Journal of Economics, Vol. 107,
February, pp 35-78.
Keynes, John Maynard, 1937. “Some Economic Consequences of a Declining
Population,” Eugenics Review, Vol. 39, April, pp 13-17.
Kuznets, Simon, 1956. “Quantitative Aspects of the Economic Growth of Nations. I.
Levels and Variability of Rates of Growth,” Economic Development and Cultural
Change, Vol. 5, October, pp 1-94.
Kuznets, Simon, 1958. “Long Swings in the Growth of Population and in Related
Economic Variables,” Proceedings of the American Philosophical Society (?),
Vol. 102, No. 1, February, pp 25-52.
Mincer, Jacob, 1958. “Investment in Human Capital and Personal Income Distribution,”
Journal of Political Economy, pp 281-302.
Murphy, Kevin and Finus Welch, 1992. “The Structure of Wages,” The Quarterly
Journal of Economics, Vol. 107, February, pp 285-326.
Piketty, Thomas and Emmanuel Saez, 2003. “Income Inequality in the United States,
1913-1998,” The Quarterly Journal of Economics, Vol. 118, Issue 1, pp 1-38.
31
Summers, Lawrence, 1986. “Why is the Unemployment Rate So Very High Near Full
Employment?,” Brookings Papers on Economic Activity, Vol. 0, No. 2, pp 339-
383.
Toosi, Mitra, 2006. “A new look at long-term labor force projections to 2050,” Monthly
Labor Review, November pp. 19-39.
Wachter, Michael L. 1977. “Intermediate Swings in Labor-Force Participation,”
Brookings Papers on Economic Activity, 1977(2):545-576.
Weil, David N., 1997. “The Economics of Population Aging,” in Handbook of
Population and Family Economics, M. R. Rosenzweig and O. Stark, editors,
Elsevier Science B.V., pages 967-1014.
Willis, Robert J., 1986. “Wage Determinants: A Survey and Reinterpretation of Human
Capital Earnings Functions,” Handbook of Labor Economics, Volume 1, eds., O.
Ashenfelter, and R. Layard, Elsevier Science BV, 1986.
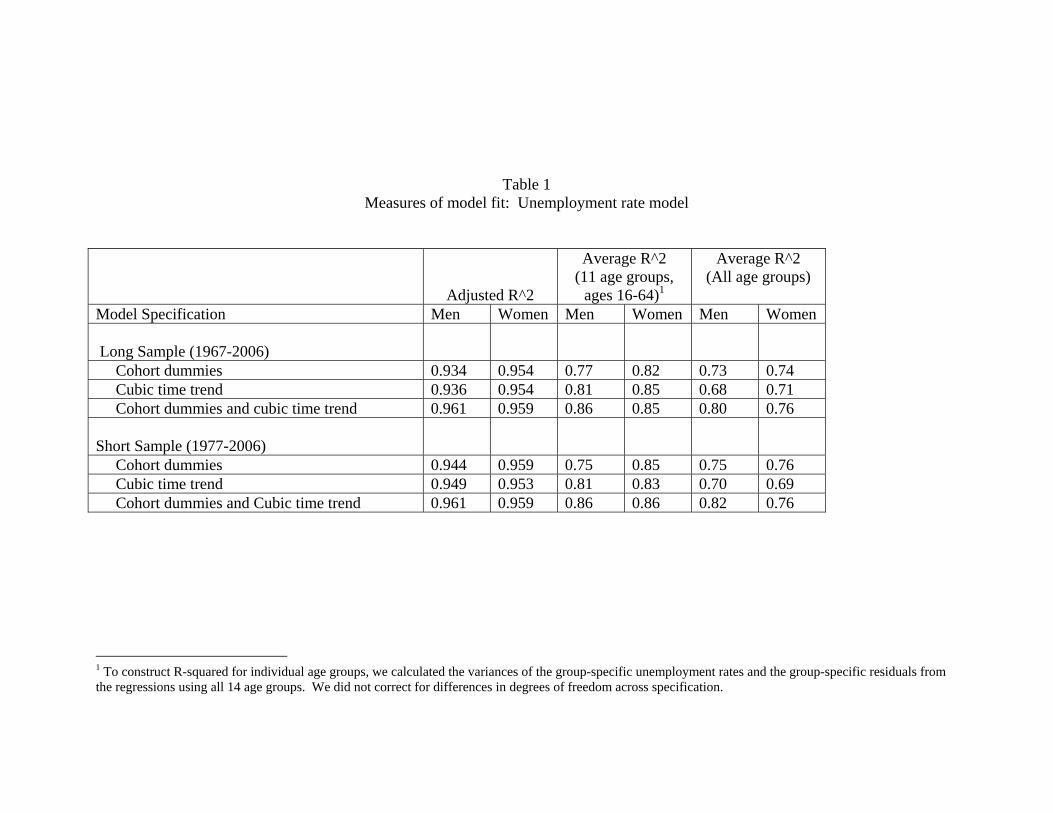
Table 1 Measures of model fit: Unemployment rate model
Adjusted R^2
Average R^2 (11 age groups,
ages 16-64)1
Average R^2 (All age groups)
Model Specification Men Women Men Women Men Women Long Sample (1967-2006)
Cohort dummies 0.934 0.954 0.77 0.82 0.73 0.74 Cubic time trend 0.936 0.954 0.81 0.85 0.68 0.71 Cohort dummies and cubic time trend 0.961 0.959 0.86 0.85 0.80 0.76 Short Sample (1977-2006)
Cohort dummies 0.944 0.959 0.75 0.85 0.75 0.76 Cubic time trend 0.949 0.953 0.81 0.83 0.70 0.69 Cohort dummies and Cubic time trend 0.961 0.959 0.86 0.86 0.82 0.76
1 To construct R-squared for individual age groups, we calculated the variances of the group-specific unemployment rates and the group-specific residuals from the regressions using all 14 age groups. We did not correct for differences in degrees of freedom across specification.
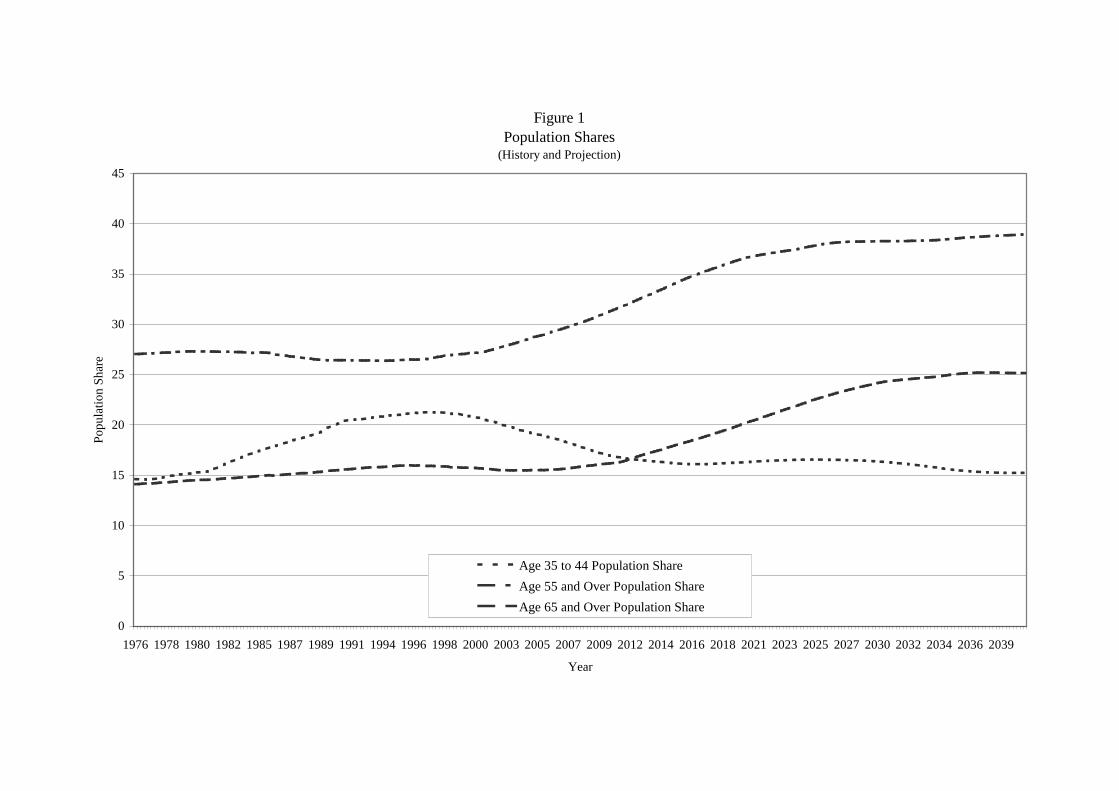
Figure 1Population Shares
(History and Projection)
0
5
10
15
20
25
30
35
40
45
1976 1978 1980 1982 1985 1987 1989 1991 1994 1996 1998 2000 2003 2005 2007 2009 2012 2014 2016 2018 2021 2023 2025 2027 2030 2032 2034 2036 2039
Year
Popu
latio
n Sh
are
Age 35 to 44 Population Share
Age 55 and Over Population Share
Age 65 and Over Population Share
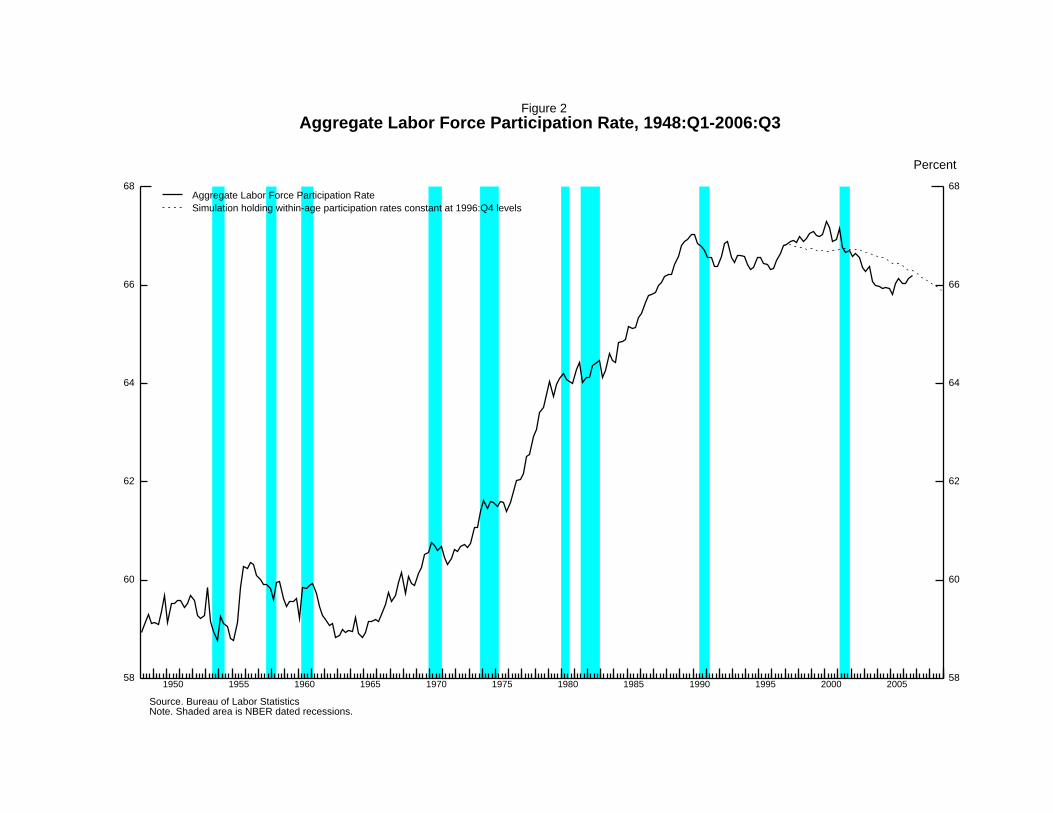
Figure 2Aggregate Labor Force Participation Rate, 1948:Q1-2006:Q3
1950 1955 1960 1965 1970 1975 1980 1985 1990 1995 2000 200558
60
62
64
66
68
58
60
62
64
66
68
Percent
Aggregate Labor Force Participation RateSimulation holding within-age participation rates constant at 1996:Q4 levels
Source. Bureau of Labor StatisticsNote. Shaded area is NBER dated recessions.
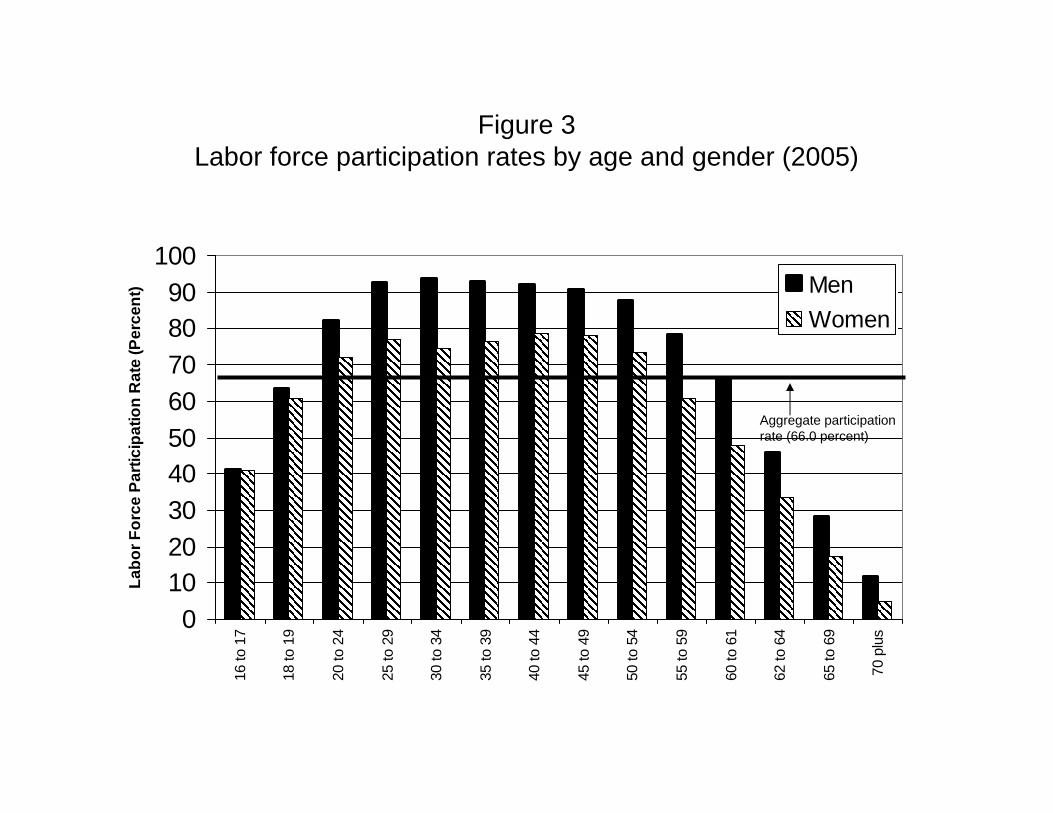
Figure 3Labor force participation rates by age and gender (2005)
0102030405060708090
10016
to 1
7
18 to
19
20 to
24
25 to
29
30 to
34
35 to
39
40 to
44
45 to
49
50 to
54
55 to
59
60 to
61
62 to
64
65 to
69
70 p
lus
Labo
r For
ce P
artic
ipat
ion
Rat
e (P
erce
nt) Men
Women
Aggregate participation rate (66.0 percent)

Figure 4An Accounting of Effect of Aging on the Labor Force Participation Rate
61
61.5
62
62.5
63
63.5
64
64.5
65
65.5
66
66.5
67
67.5
1976 1981 1986 1991 1996 2001 2006 2011 2016Year
Perc
ent
61
61.5
62
62.5
63
63.5
64
64.5
65
65.5
66
66.5
67
67.5
Published participation rate
Within-group rates constant at 2005 value
Projection
Note: Within group participation rates refer to 14 age groups for men and women

Figure 5Participation by Birth Cohort
(Actual data - not a projection)
50
55
60
65
70
75
80
1936 1937 1938 1940 1941 1942 1943 1945 1946 1947 1948 1950 1951 1952 1953 1955 1956 1957 1958 1960 1961 1962 1963 1965 1966
Birth Year (mid-point of age range)
Lab
or F
orce
Par
ticip
atio
n R
ate
Age 35 to 44
Age 45 to 54
Age 55 to64

Figure 6Projected Labor Force Participation Rate
62.0
62.5
63.0
63.5
64.0
64.5
65.0
65.5
66.0
66.5
67.0
67.5
1976 1981 1986 1991 1996 2001 2006 2011 2016
Year
Perc
ent
Cohort-based trend
Published Participation Rate
Projected
Model-based trend is from the model in Fallick and Pingle (2007a)
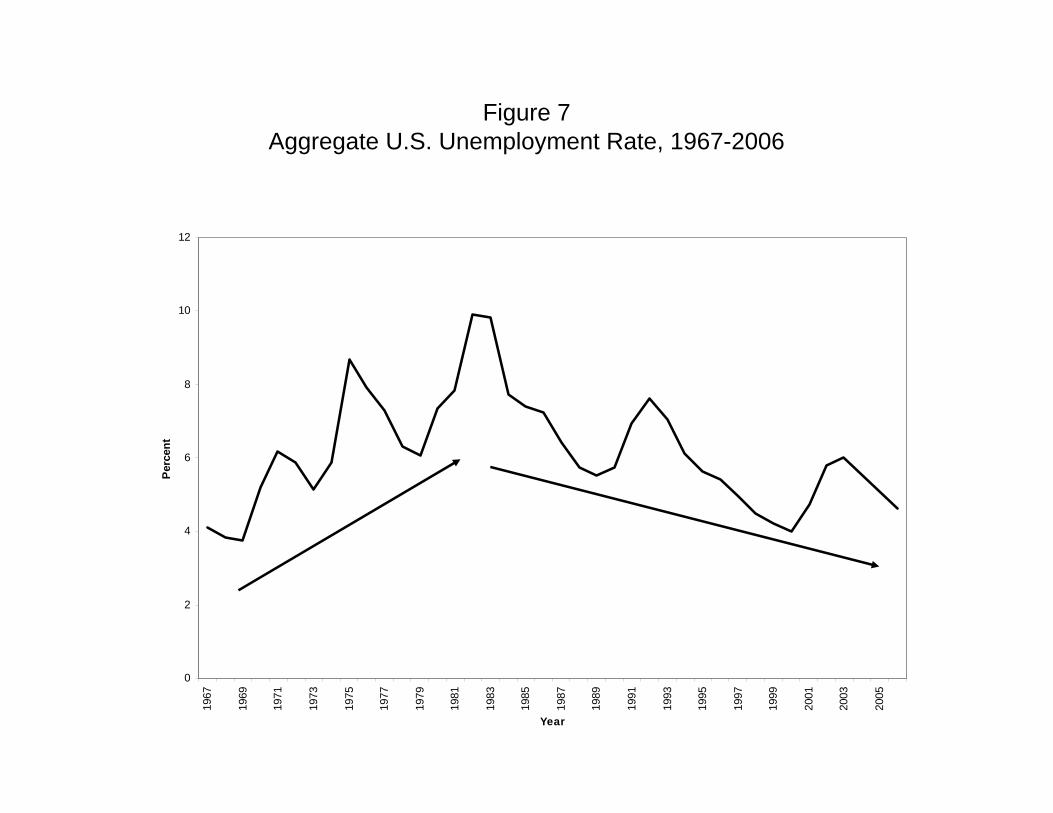
Figure 7Aggregate U.S. Unemployment Rate, 1967-2006
0
2
4
6
8
10
12
1967
1969
1971
1973
1975
1977
1979
1981
1983
1985
1987
1989
1991
1993
1995
1997
1999
2001
2003
2005
Year
Perc
ent
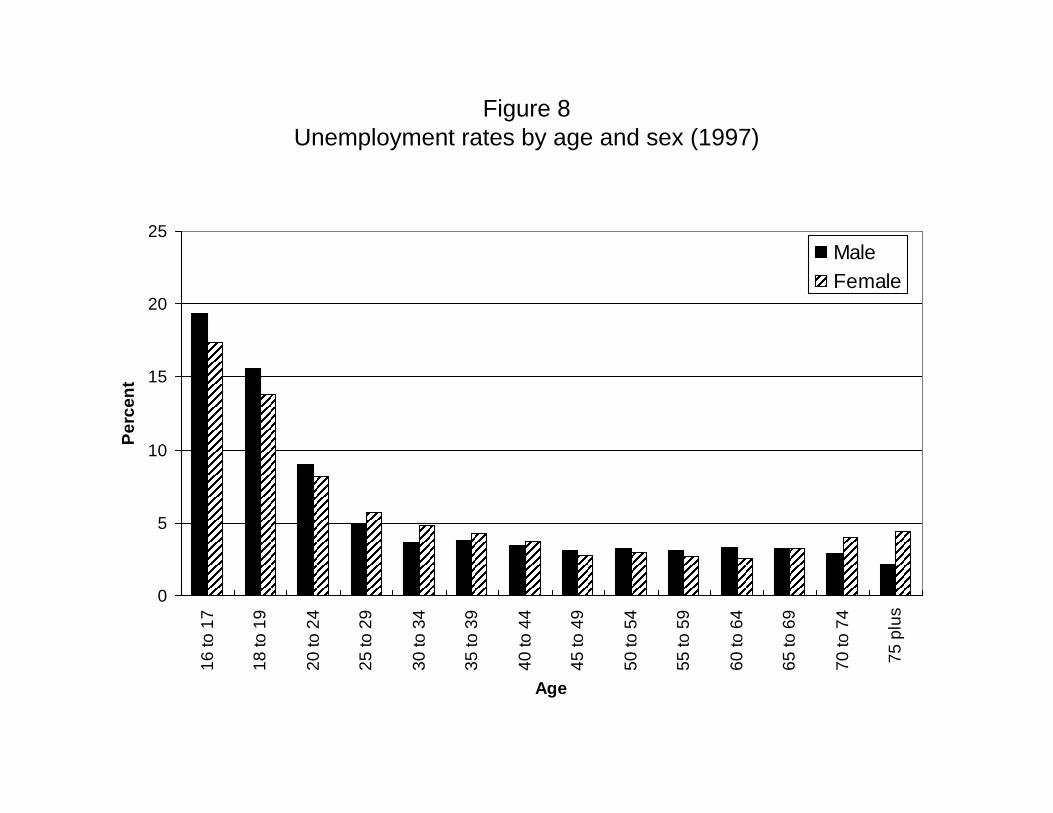
Figure 8Unemployment rates by age and sex (1997)
0
5
10
15
20
2516
to 1
7
18 to
19
20 to
24
25 to
29
30 to
34
35 to
39
40 to
44
45 to
49
50 to
54
55 to
59
60 to
64
65 to
69
70 to
74
75 p
lus
Age
Perc
ent
MaleFemale
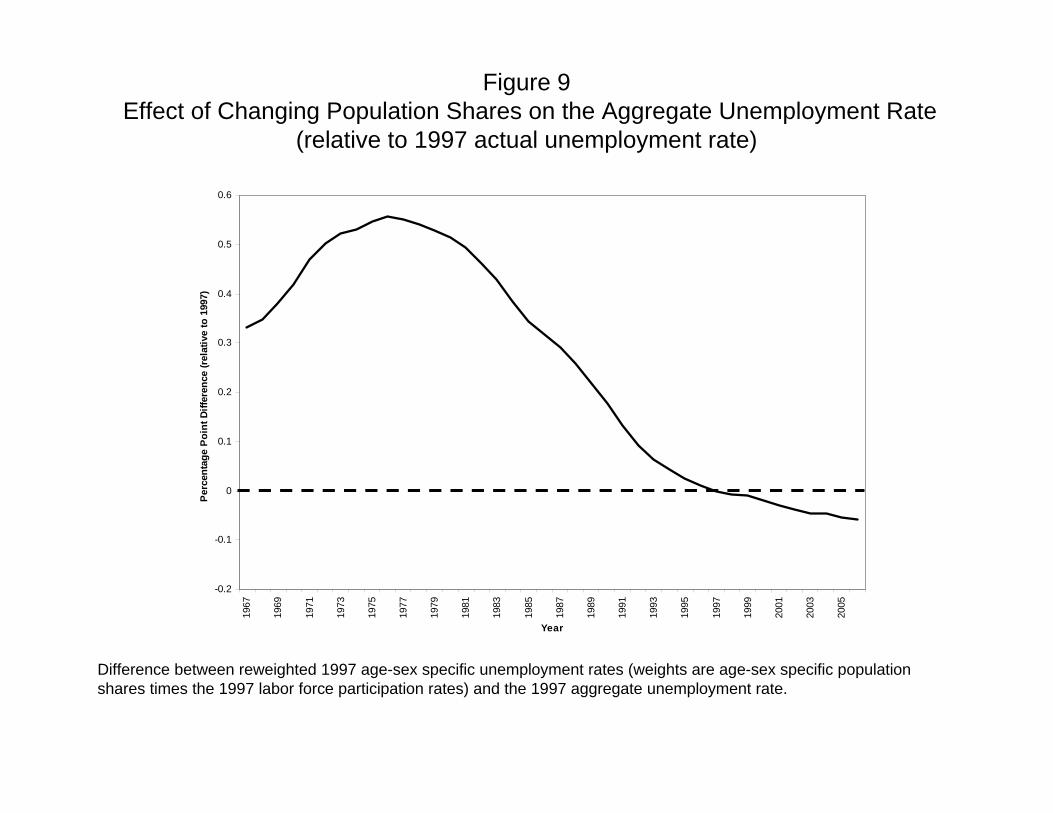
Figure 9Effect of Changing Population Shares on the Aggregate Unemployment Rate
(relative to 1997 actual unemployment rate)
-0.2
-0.1
0
0.1
0.2
0.3
0.4
0.5
0.6
1967
1969
1971
1973
1975
1977
1979
1981
1983
1985
1987
1989
1991
1993
1995
1997
1999
2001
2003
2005
Year
Per
cent
age
Poi
nt D
iffer
ence
(rel
ativ
e to
199
7)
Difference between reweighted 1997 age-sex specific unemployment rates (weights are age-sex specific population shares times the 1997 labor force participation rates) and the 1997 aggregate unemployment rate.

Figure 10Population and Labor Force Shares ages 16-24
10.0%
12.5%
15.0%
17.5%
20.0%
22.5%
25.0%
27.5%
1967
1969
1971
1973
1975
1977
1979
1981
1983
1985
1987
1989
1991
1993
1995
1997
1999
2001
2003
2005
Labor force share
Population share
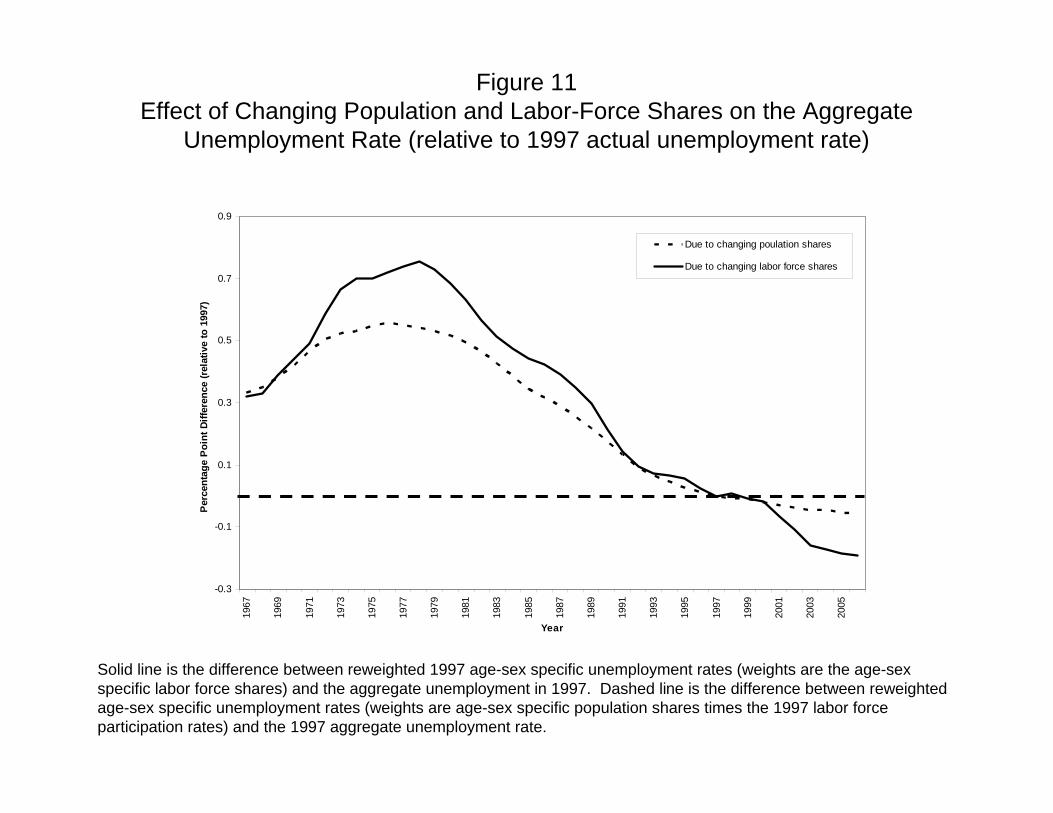
Figure 11Effect of Changing Population and Labor-Force Shares on the Aggregate
Unemployment Rate (relative to 1997 actual unemployment rate)
-0.3
-0.1
0.1
0.3
0.5
0.7
0.9
1967
1969
1971
1973
1975
1977
1979
1981
1983
1985
1987
1989
1991
1993
1995
1997
1999
2001
2003
2005
Year
Per
cent
age
Poi
nt D
iffer
ence
(rel
ativ
e to
199
7)
Due to changing poulation shares
Due to changing labor force shares
Solid line is the difference between reweighted 1997 age-sex specific unemployment rates (weights are the age-sex specific labor force shares) and the aggregate unemployment in 1997. Dashed line is the difference between reweightedage-sex specific unemployment rates (weights are age-sex specific population shares times the 1997 labor force participation rates) and the 1997 aggregate unemployment rate.
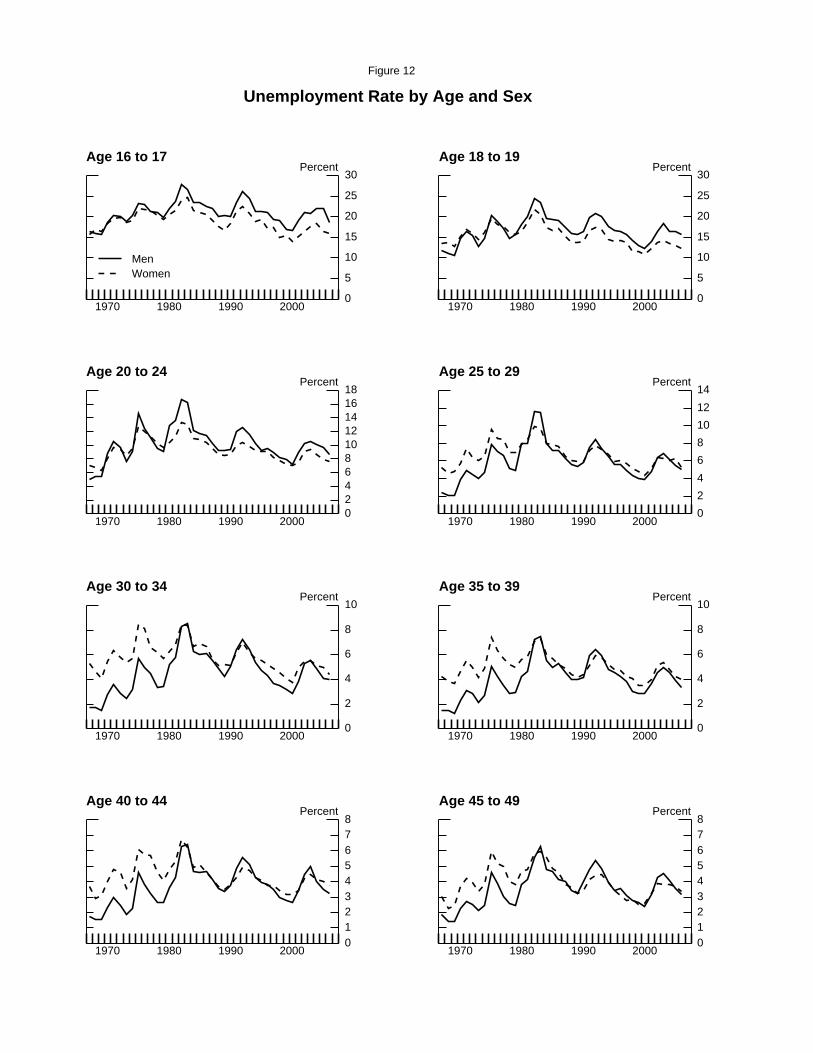
Figure 12
Unemployment Rate by Age and Sex
1970 1980 1990 20000
5
10
15
20
25
30
0
5
10
15
20
25
30Percent
Age 16 to 17
MenWomen
1970 1980 1990 20000
5
10
15
20
25
30
0
5
10
15
20
25
30Percent
Age 18 to 19
1970 1980 1990 200002468
1012141618
024681012141618
PercentAge 20 to 24
1970 1980 1990 20000
2
4
6
8
10
12
14
0
2
4
6
8
10
12
14Percent
Age 25 to 29
1970 1980 1990 20000
2
4
6
8
10
0
2
4
6
8
10Percent
Age 30 to 34
1970 1980 1990 20000
2
4
6
8
10
0
2
4
6
8
10Percent
Age 35 to 39
1970 1980 1990 2000012345678
012345678
PercentAge 40 to 44
1970 1980 1990 2000012345678
012345678
PercentAge 45 to 49
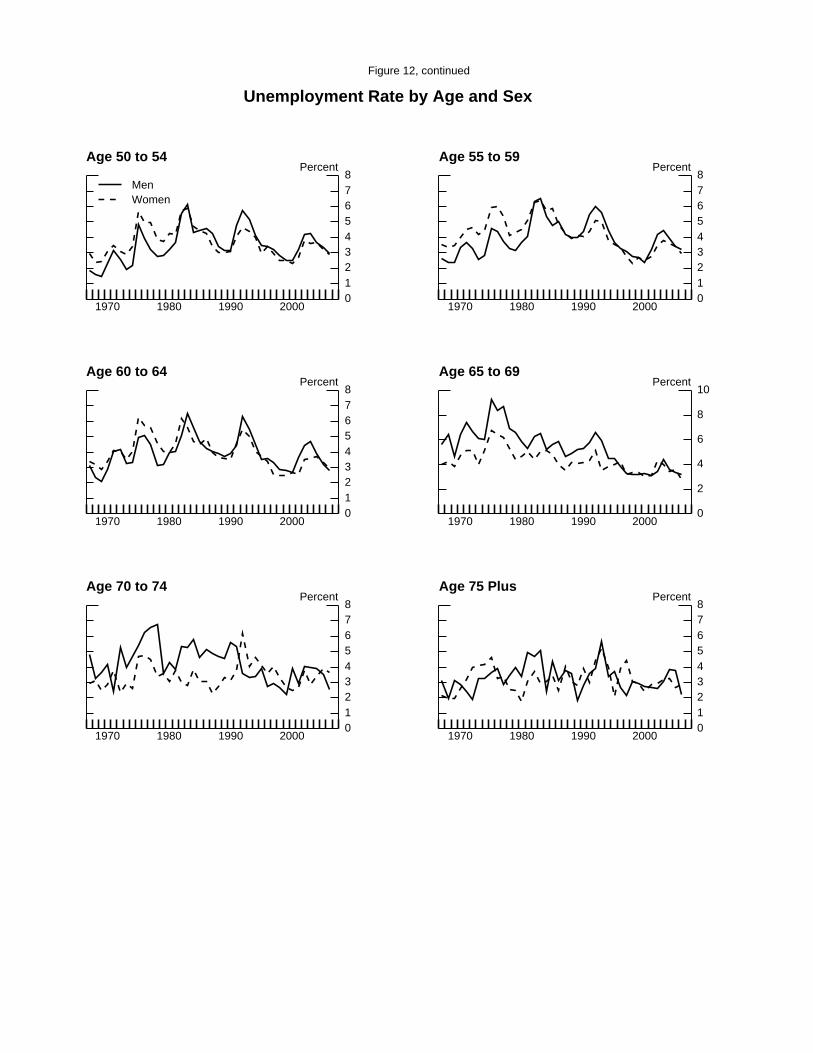
Figure 12, continued
Unemployment Rate by Age and Sex
1970 1980 1990 2000012345678
012345678
PercentAge 50 to 54
MenWomen
1970 1980 1990 2000012345678
012345678
PercentAge 55 to 59
1970 1980 1990 2000012345678
012345678
PercentAge 60 to 64
1970 1980 1990 20000
2
4
6
8
10
0
2
4
6
8
10Percent
Age 65 to 69
1970 1980 1990 2000012345678
012345678
PercentAge 70 to 74
1970 1980 1990 2000012345678
012345678
PercentAge 75 Plus
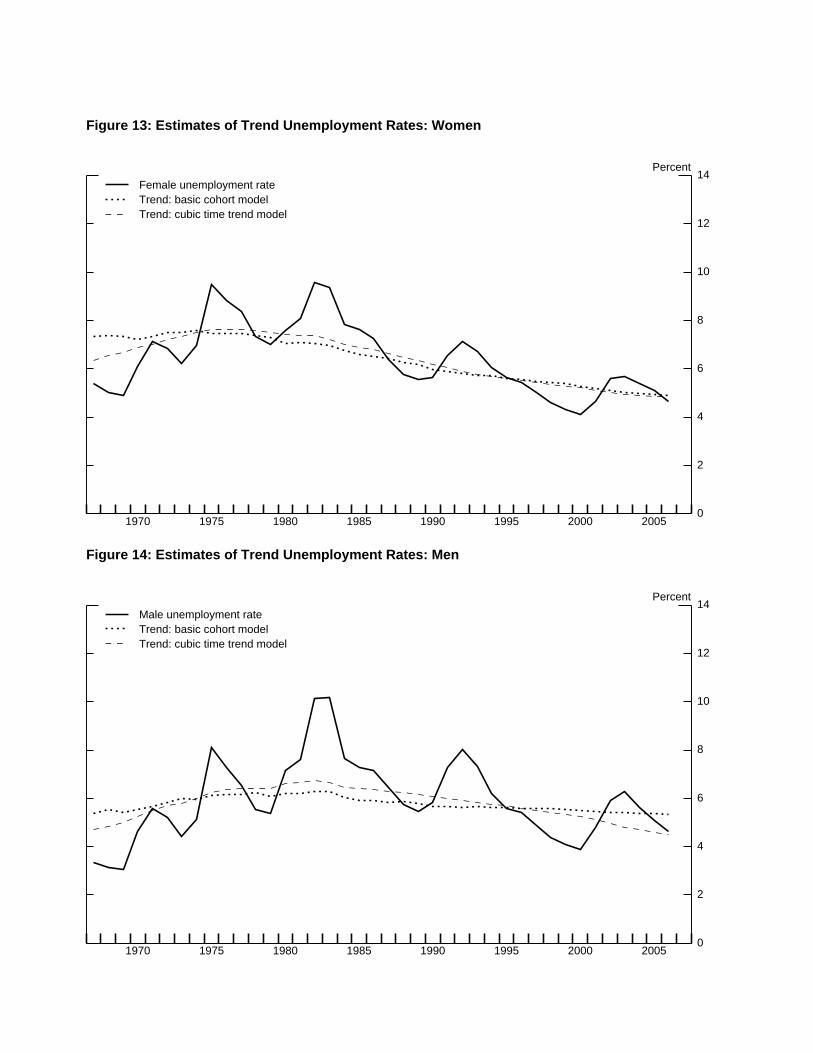
1970 1975 1980 1985 1990 1995 2000 20050
2
4
6
8
10
12
14
0
2
4
6
8
10
12
14Percent
Figure 13: Estimates of Trend Unemployment Rates: Women
Female unemployment rateTrend: basic cohort modelTrend: cubic time trend model
1970 1975 1980 1985 1990 1995 2000 20050
2
4
6
8
10
12
14
0
2
4
6
8
10
12
14Percent
Figure 14: Estimates of Trend Unemployment Rates: Men
Male unemployment rateTrend: basic cohort modelTrend: cubic time trend model
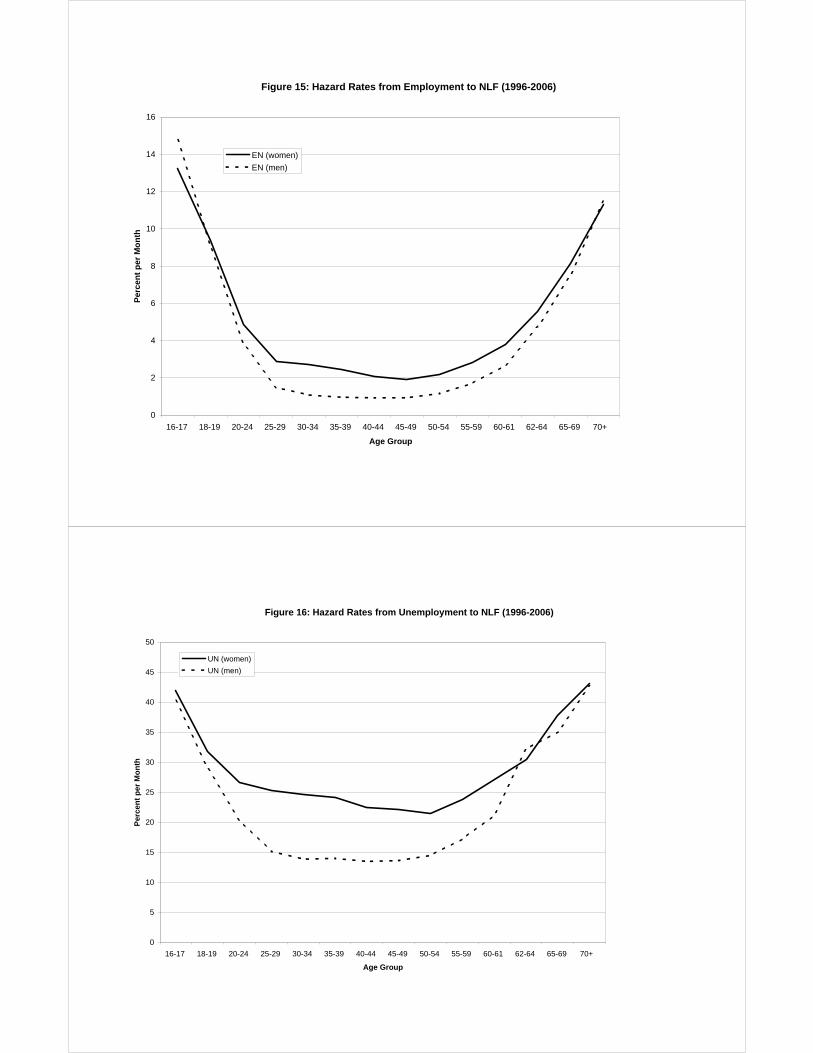
Figure 15: Hazard Rates from Employment to NLF (1996-2006)
0
2
4
6
8
10
12
14
16
16-17 18-19 20-24 25-29 30-34 35-39 40-44 45-49 50-54 55-59 60-61 62-64 65-69 70+
Age Group
Perc
ent p
er M
onth
EN (women)EN (men)
Figure 16: Hazard Rates from Unemployment to NLF (1996-2006)
0
5
10
15
20
25
30
35
40
45
50
16-17 18-19 20-24 25-29 30-34 35-39 40-44 45-49 50-54 55-59 60-61 62-64 65-69 70+
Age Group
Perc
ent p
er M
onth
UN (women)UN (men)

Figure 17: Hazard Rates from Unemployment to Employment (1996-2006)
10
15
20
25
30
35
16-17 18-19 20-24 25-29 30-34 35-39 40-44 45-49 50-54 55-59 60-61 62-64 65-69 70+
Age Groups
Perc
ent p
er M
onth
UE (women)UE (men)
Figure 18:Hazard Rates from NLF to Employment (1996-2006)
0
2
4
6
8
10
12
14
16
18
16-17 18-19 20-24 25-29 30-34 35-39 40-44 45-49 50-54 55-59 60-61 62-64 65-69 70+
Age Groups
Perc
ent p
er M
onth
NE (women)NE (men)
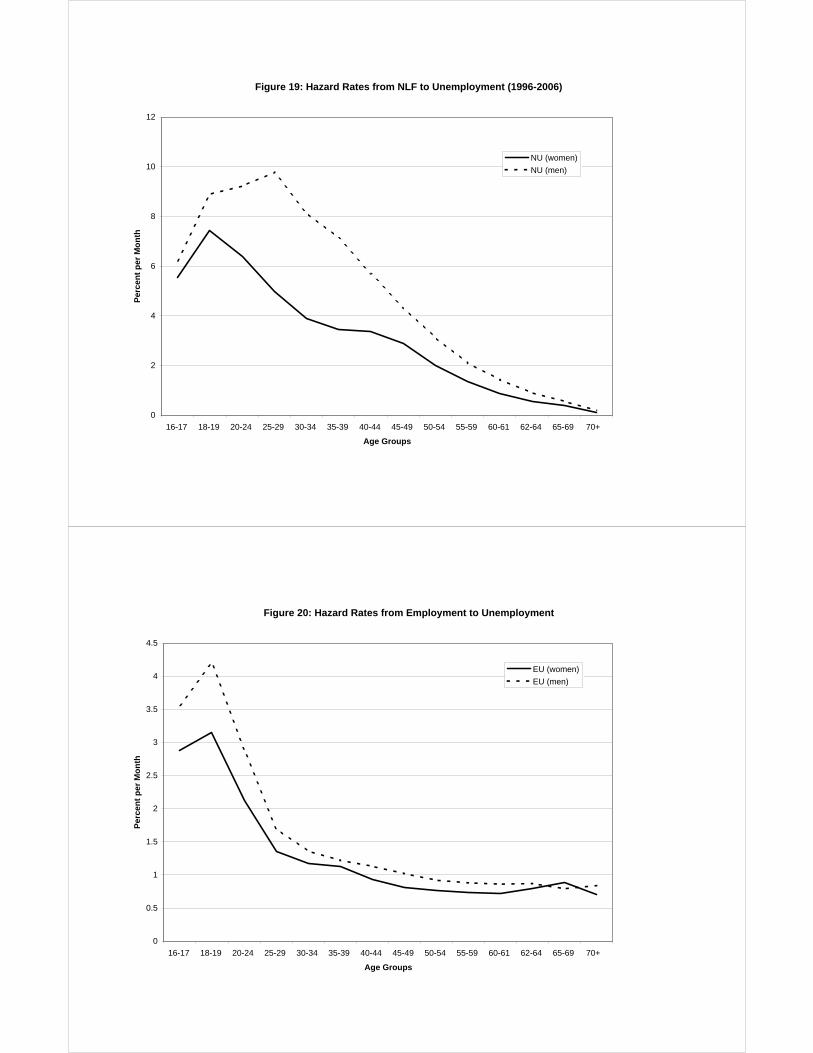
Figure 19: Hazard Rates from NLF to Unemployment (1996-2006)
0
2
4
6
8
10
12
16-17 18-19 20-24 25-29 30-34 35-39 40-44 45-49 50-54 55-59 60-61 62-64 65-69 70+
Age Groups
Perc
ent p
er M
onth
NU (women)NU (men)
Figure 20: Hazard Rates from Employment to Unemployment
0
0.5
1
1.5
2
2.5
3
3.5
4
4.5
16-17 18-19 20-24 25-29 30-34 35-39 40-44 45-49 50-54 55-59 60-61 62-64 65-69 70+
Age Groups
Perc
ent p
er M
onth
EU (women)EU (men)

Figure 21: Effect of Aging on the EU Hazard Rate (Relative to 1996)
-0.045
-0.04
-0.035
-0.03
-0.025
-0.02
-0.015
-0.01
-0.005
0
1996 2000 2004 2008 2012
Year
Perc
enta
ge P
oint
s pe
r Mon
th
Figure 22: Effect of Aging on EU Flow
-140
-120
-100
-80
-60
-40
-20
0
1996 2000 2004 2008 2012
Year
Thou
sand
s pe
r Mon
th
Population at 2006 levelEmployment at 2006 level
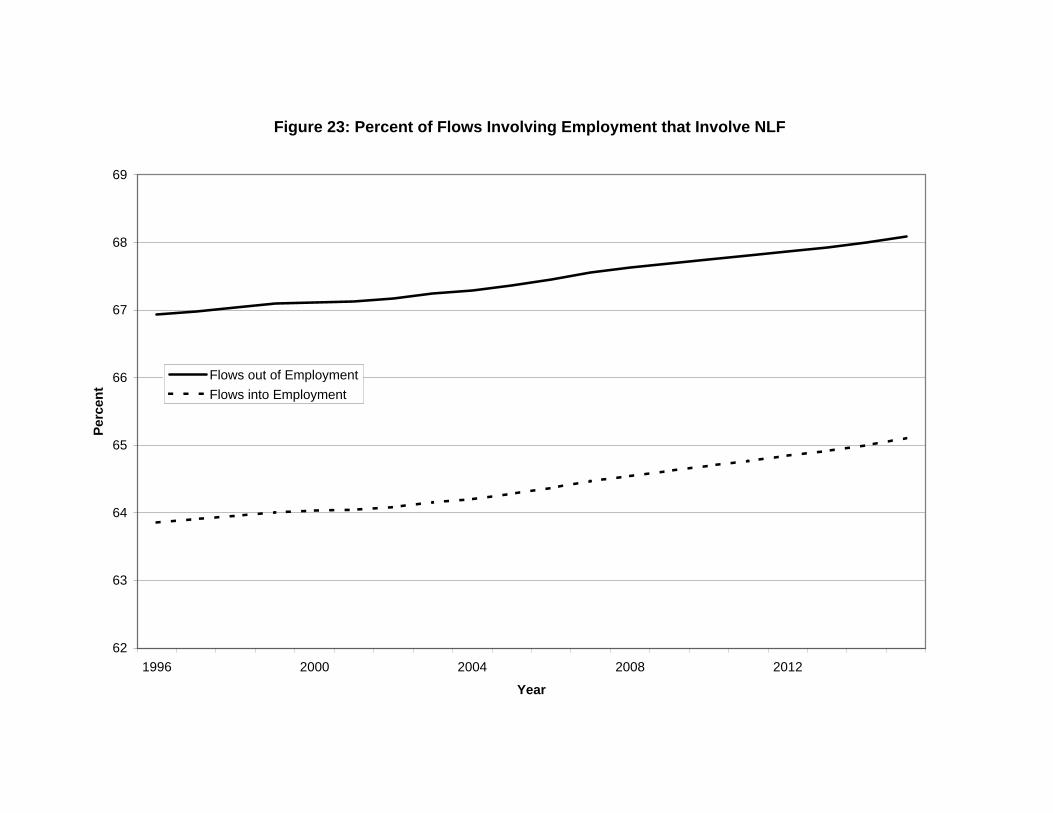
Figure 23: Percent of Flows Involving Employment that Involve NLF
62
63
64
65
66
67
68
69
1996 2000 2004 2008 2012
Year
Perc
ent
Flows out of EmploymentFlows into Employment
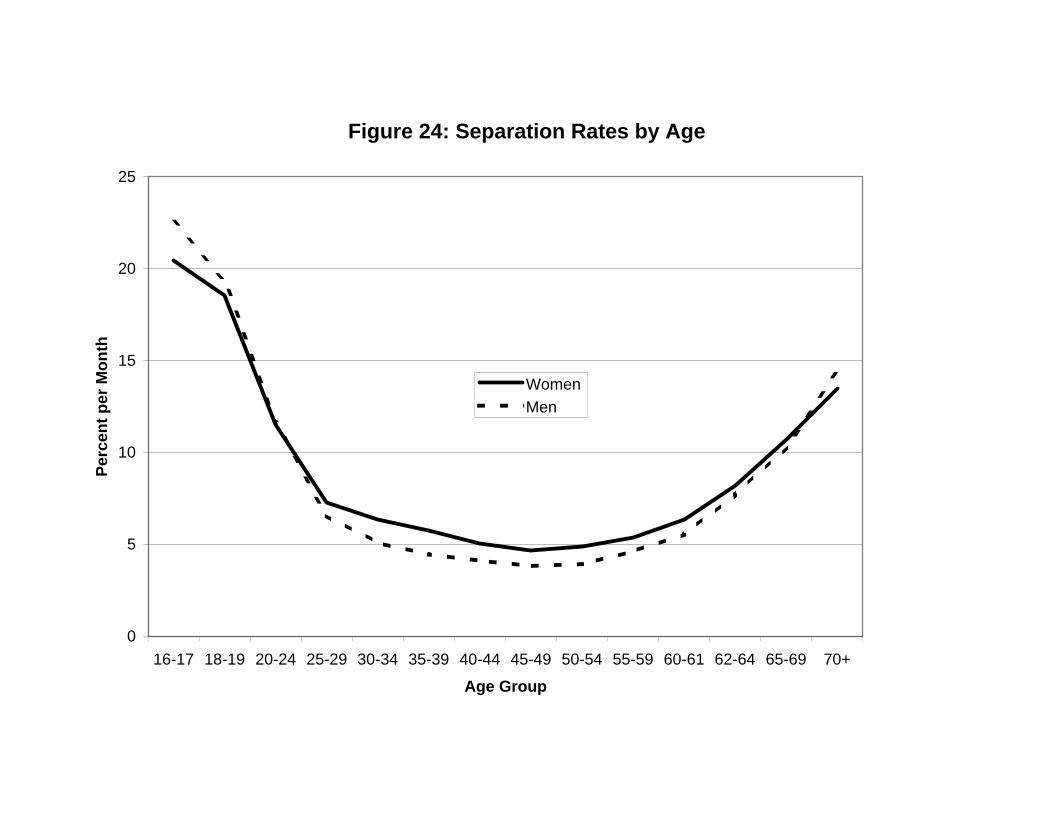
Figure 24: Separation Rates by Age
0
5
10
15
20
25
16-17 18-19 20-24 25-29 30-34 35-39 40-44 45-49 50-54 55-59 60-61 62-64 65-69 70+
Age Group
Perc
ent p
er M
onth
WomenMen

Figure 25: Effect of Aging on the Monthly Separation Rate (Relative to 1996)
-0.05
-0.045
-0.04
-0.035
-0.03
-0.025
-0.02
-0.015
-0.01
-0.005
0
1996 2000 2004 2008 2012
Year
Perc
enta
ge P
oint
s
Figure 26: Effect of Aging on Separations
-500
-400
-300
-200
-100
0
100
1996 2000 2004 2008 2012
Year
Thou
sand
s pe
r Mon
th
Employment at 2006 levelPopulation at 2006 level
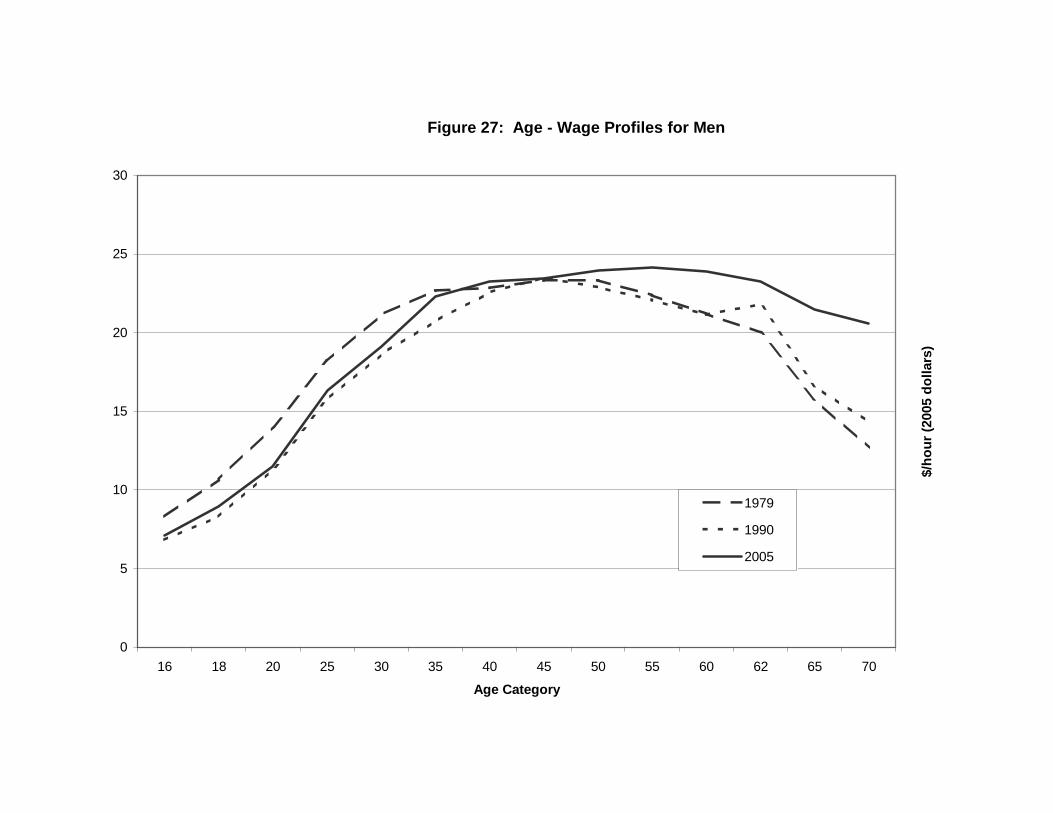
Figure 27: Age - Wage Profiles for Men
0
5
10
15
20
25
30
16 18 20 25 30 35 40 45 50 55 60 62 65 70
Age Category
$/h
ou
r (2
005
do
llars
)
1979
1990
2005
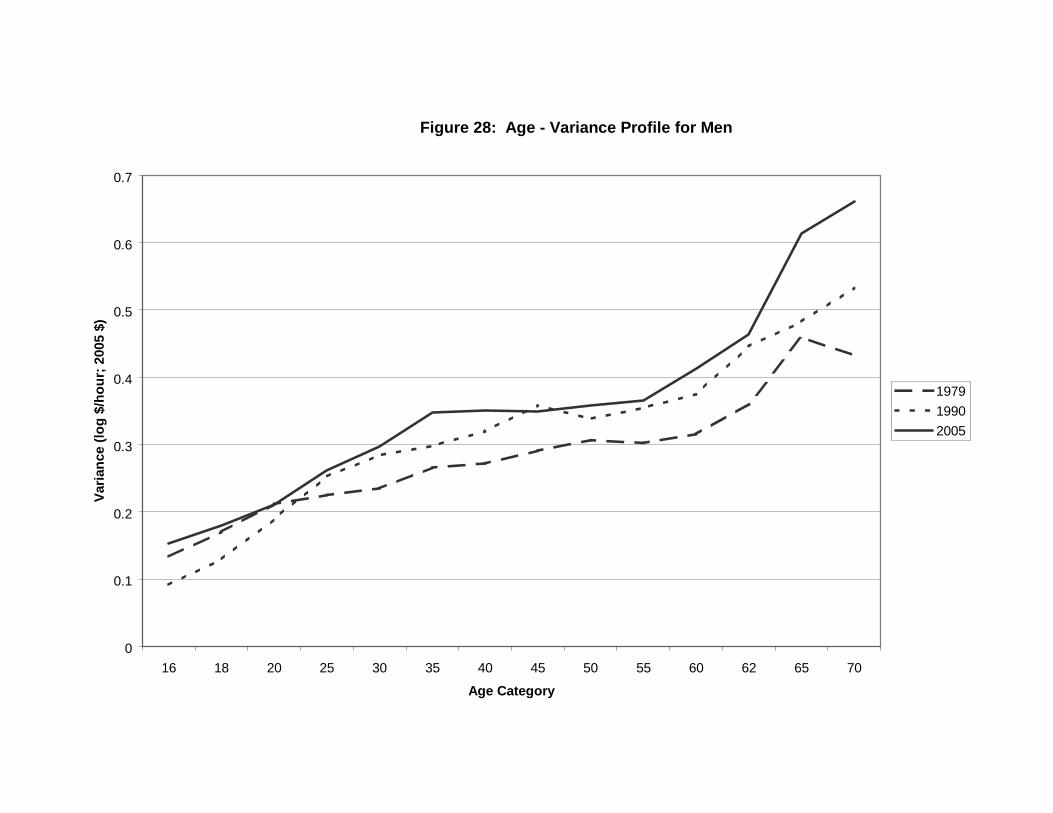
Figure 28: Age - Variance Profile for Men
0
0.1
0.2
0.3
0.4
0.5
0.6
0.7
16 18 20 25 30 35 40 45 50 55 60 62 65 70
Age Category
Var
ian
ce (
log
$/h
ou
r; 2
005
$)
1979
1990
2005

Figure 29: Mean Real Wages and Fixed - Weight Comparison
15
15.5
16
16.5
17
17.5
18
18.5
1978
1980
1982
1984
1986
1988
1990
1992
1994
1996
1998
2000
2002
2004
2006
2008
2010
2012
2014
2016
Year
$/h
ou
r (2
005
do
llars
)
Average Wage (2005 dollars)
Time Varying Population Shares
Average Wage in 2005

Figure 30: Effect of Changing Age Distribution on Wage Variance (Variance Log Real Wage; Within age/gender group variance set at 2005 values)
0.3
0.325
0.35
0.375
0.4
1978
1983
1988
1993
1998
2003
2008
2013
Period
Log
$/h
our,
200
5 $
Variance with Time-Varying Population Shares
Variance : 2005
Actual Wage Variance

Figure 31: Effect of Changing Age Distribution on Wage Variance (Variance of log(wage); Within age/gender group variance set at 2005 values)
0.35
0.375
0.4
78:1
79:2
80:3
81:4
83:1
84:2
85:3
86:4
88:1
89:2
90:3
91:4
93:1
94:2
95:3
96:4
98:1
99:2
00:3
01:4
03:1
04:2
05:3
06:4
08:1
09:2
10:3
11:4
13:1
14:2
15:3
16:4
Period
log
2005
$/H
our
.
Variance : 2005
Within-Group Contribution
Between Group Contribution