the effect of plasma treatment on flax fibres
TRANSCRIPT
THE EFFECT OF PLASMA TREATMENT
ON FLAX FIBRES
A Thesis Submitted to the College of Graduate Studies and Research
in Partial Fulfillment of the Requirements for the Degree of Master of Science
in the Department of Agricultural and Bioresource Engineering
University of Saskatchewan Saskatoon, Saskatchewan
By
Rahim Oraji
© Copyright Rahim Oraji, November 2008. All rights reserved.

PERMISSION TO USE
In presenting this thesis in partial fulfilment of the requirements for a graduate degree
from the University of Saskatchewan, I agree that the Libraries of this University may
make it freely available for inspection. I further agree that permission for copying of this
thesis in any manner, in whole or in part, for scholarly purposes may be granted by the
professor who supervised my thesis work or, in his absence, by the Head of the
Department or the Dean of the College in which my thesis work was done. It is
understood that any copying or publication or use of this thesis or parts thereof for
financial gain shall not be allowed without my written permission. It is also understood
that due recognition shall be given to me and to the University of Saskatchewan in any
scholarly use which may be made of any material in my thesis.
Requests for permission to copy or to make other use of material in this thesis in whole
or part should be addressed to:
Head of the Department of Agricultural and Bioresource Engineering
University of Saskatchewan
Saskatoon, Saskatchewan S7N 5A9
i

ABSTRACT
In recent years, interest in using composites with natural fibres as reinforcement
and/or filler has increased because of the advantages of natural fibres, such as low
density, low cost, high mechanical properties, and biodegradability. Unmodified-
hydrophilic natural fibres show poor compatibility with polymer matrix when they are
used as reinforcement in polymer composites. Several methods of modifications of
natural fibres, such as chemical and plasma modification of natural fibres have been
performed to improve the interfacial compatibility of natural fibre and matrix, and also
to decrease water absorption of fibres.
The purpose of this study was to examine the effect of plasma treatment on
Saskatchewan-grown oilseed flax fibre that can be used in biocomposites. For
comparison, the fibres have also been chemically modified using sodium hydroxide and
silane. A comparison has been made between the results from both cases.
In this thesis, both plasma and chemically modified flax fibre are characterized to
understand its crystallinity, color changes, mechanical properties, morphological
changes, and thermal properties. Techniques such as X-ray diffraction (XRD), color test,
tensile test, scanning electron microscopy (SEM), differential scanning calorimetry
(DSC), and soft X - ray spectromicroscopy are used to study the structural changes of
flax fibre after physical and chemical modifications. A fitting method with four
Gaussian functions was used to determine crystallinity of cellulose.
ii
Results showed that the crystallinity of cellulose in modified (physical or chemical)
fibres decreased. Chemical treatment did not improve the tensile strength nor the
stiffness of the fibres. Morphological studies showed that the fibre surface changes in
both treatments were significant, however, the surfaces of flax fibres exposed to the
plasma were modified in the near-surface regions. There was no trace of lignin before
and after chemical treatment except in the one-hour chemically treated fibres. The color
of the fibres became lighter after chemical treatment. Chemical bonding between resin
and fibre was observed in the untreated fibres, the one-hour chemically modified fibres
and two-hour chemically modified fibres.
Results of this research also showed that plasma treatment can be used as a
surface modifying method for flax fibres, however there were some restrictions of
utilizing the plasma modification method, e.g. sample size and non-uniformity of plasma
gas.
iii

ACKNOWLEDGEMENTS
I would like to express my sincere gratitude to all those who have directly or indirectly
contributed to this work. I would like to thank:
1) my supervisor Dr. Satya Panigrahi for his guidance, help, and for his financial
support;
2) the members of my advisory committee Dr. Lope Tabil and Dr. Trever Crowe, for
their guidance and help;
Department of Agricultural and Bioresource Engineering for financial support;
technical staff in the Department of Agricultural and Bioresource Engineering, Randy
Lorenz and Louis Roth for their help in different situations;
Department of Physics and Engineering Physics for providing facilities for doing plasma
treatment;
Biolin Research Inc. for providing flax fibres and measuring fibre thickness;
my friends Dr. Kamal Barghout and Barbara Spurr for their unlimited assistance on
different occasions; and
all my colleagues at Department of Agricultural and Bioresource Engineering.
My appreciation also goes to Thomas Bonli for his help in XRD and SEM. I in
particular thank Dr. Chithra Karunakaran for assisting and helping me at the Canadian
Light Source Inc.
I am truly grateful to my dearest friend, Majid Damircheli and his family for their
support and encouragement during this research work.
iv

DEDICATION
I dedicate this thesis to my dear friend Nasrin Sagai who tragically passed away on June
7, 2007. Nasrin was encouraging and supporting me to continue my education.
v

TABLE OF CONTENTS PERMISSION TO USE.………………………………………………....…..………….. i
ABSTRACT.…………………………………………………………….……….……... ii ACKNOWLEDGMENTS..…..………………………………………….……...…...…. iv DEDICATION….....……,…………………………………………….……….……..… v TABLE OF CONTENTS..………...…………………………..…….…..………..….… vi LIST OF TABLES..………………………………………………………...…….…..... ix LIST OF FIGURES...……..…………………………………………….….....…….….. xi NOMENCLATURE..……………………………………………….……………..… xviii 1 . INTRODUCTION AND OBJECTIVES..………………………….………..………. 1
1.1 Objectives…...………………..…………………………….……..…..…….. 4
2. LITERATURE REVIEW……………………………………………….….………… 5
2.1 The Characteristic of Flax Fibres……………………………….….……….. 5
2.1.1 Flax-fibre history…………………………..…………...…………. 5
2.1.2 Flax-fibre bundles……………………………..………......….…… 6
2.1.3 Composition and structure of flax fibre………...….…...….….….. 7
2.1.4 Chemical structure of cellulose…………………....……...…..…..10
2.1.5 Mechanical properties of flax fibres………...…...…….….…..…. 13
2.2 Surface Treatment of Flax Fibres…………..…………………….….…….. 15
2.2.1 Plasma treatment of flax fibre……………….….………....…….. 17
2.2.1.1 Degree of ionization ………..…….….………....….….. 18
2.2.1.2 Hot and cold plasma ………..……….….…...…..…….. 18
2.2.1.3 Direct current (DC) glow discharge plasma…......…….. 19
2.2.2 Chemical treatment of flax fibre……………….……….….…..... 21
vi

2.3 Summary ………………..….……………….………………..….….….…. 23
3. MATERIALS AND METHODS…….……………………………….………….…..25
3.1 Materials................................................................................................….... 25
3.2 Flax Fibre Thickness.............................................................................….... 26
3.3 Flax Fibre Density ................................................................................….... 27
3.4 Color Test.............................................................……………….……….... 27
3.5 Tensile Test..........................................................................................…..... 28
3.6 Surface Modification of Flax Fibres.....................................................….... 30
3.6.1 Chemical modification of flax fibres……………..….…..……… 30
3.6.2 Plasma modification of flax fibres...…………..……...………..... 32
3.7 X–Ray Diffraction (XRD)....................................................….............……35
3.8 Morphological Characterization......................................................….......... 40
3.9 Soft X-Ray Spectromicroscopy....................................................…............. 40
3.9.1 X–ray absorption ……………….…….…….............................… 40
3.9.2 Sample preparation ………………………..…...….….…………. 43
3.9.3 Data collection and analysis ………………………..…....……… 45
3.10 Differential Scanning Calorimetry (DSC)...........................................….... 45
4. RESULTS AND DISCUSSION……………………….…………………….……... 47
4.1 Untreated Flax Fibre..............................................................................….... 47
4.1.1 Morphological characterization………………….……..…..……. 47
4.1.2 Flax fibre crystallinity and crystallite size ..……..…...……..…... 48
4.1.3 Flax fibre thickness.…….….…….………………....….…….….. 51
4.1.4 Flax fibre density ……………………………….……....……..… 52
4.2 Chemical Modification of Flax Fibre.....................................................…... 53
vii

4.2.1 Morphological characterization…………………….....…..……... 53
4.2.2 Crystallinity…….….……………………………….…...….……. 55
4.2.3 Color analysis..…….….………………………….….……..……. 58
4.2.4 Tensile strength…….….……………………….……….….……. 59
4.2.5 Soft x-ray spectromicroscopy....…………….………..…...……... 63
4.3 Plasma Treatment of Flax Fibre.............................................................…... 71
4.3.1 Morphological characterization...……….……….……...….……. 71
4.3.2 Crystallinity………………….…….…….……..…........…..……. 73
4.4 Thermal Analysis..........................…............................................................ 76
4.5 A Comparison between Plasma and Chemical Treatments........................... 80
5. SUMMARY AND CONCLUSIONS……………..………..………………..……… 84
6. RECOMMENDATIONS…………………………….……………………….…….. 86
7. REFERENCES…………………………………..………………………….………. 88
APPENDIX A- PEAK RESOLUTION……….………………………………..……... 94
APPENDIX B- FIBRE THICKNESS PROFILES….…….……………...……….…. 100
APPENDIX C- MECHANICAL PROPERTIES OF UNTREATED/CHEMICALLY
TREATED FLAX FIBR…………………………..….……….….…106
APPENDIX D- PEAK BROADENING...…….………………………..……...…….. 109
APPENDIX E- DSC THERMOGRAMS ……..………………………….……....….. 112
viii

LIST OF TABLES
Table 2.1 Chemical composition (%) of flax straw 8
Table 2.2 Unit-cell dimensions of cellulose I (natural cellulose) derived from flax fibre
12
Table 2.3 Mechanical properties of flax and synthetic fibres
14
Table 3.1 Information about trimethylolpropane triglycidyl ether (TTE) and 4,4’ – methylenebis (MMHA) resins used in soft X- ray spectromicroscopy
26
Table 3.2 Settings used in HunterLab color analyzer
28
Table 3.3 Plasma treatment conditions for flax fibres
34
Table 4.1 Peak resolution (fitting parameters) for untreated flax fibres (F1, F2)
50
Table 4.2 Crystallite size (W), interplanar spacing (d), and crystallinity (Xc) of untreated flax fibres (F1, F2)
50
Table 4.3 Thickness measurements of untreated flax fibre
51
Table 4.4 The actual density of flax fibre
52
Table 4.5 Weight loss of the flax fibres after chemical treatment at different times
53
Table 4.6 Peak resolution (fitting parameters) for untreated and chemically treated flax fibres
57
Table 4.7 Crystallite size (W), interplanar spacing (d), and crystallinity (Xc) of untreated and chemically treated flax fibres. The crystallinity of chemically treated flax fibres decreased when the treatment time increased
57
Table 4.8 Color coordinates (L, a, and b) and RGB values of untreated and chemically treated flax fibres
58
Table 4.9 Color index (ΔE) of chemically treated flax fibres
59
Table 4.10 Mechanical properties of untreated and chemically treated flax fibres
62
ix

Table 4.11 Tensile strength (TS) of untreated/chemically treated flax
fibres
62
Table 4.12 Peak resolution (fitting parameters) for plasma treated flax fibres
75
Table 4.13 Crystallite size (W), interplanar spacing (d) and crystallinity (Xc) of untreated and plasma treated flax fibres. The crystallinity of argon plasma treated fibres decreased when the treatment time increased
75
Table 4.14 Moisture content (MC) of different samples
76
Table 4.15
A summary of testing method, treatment condition, and testing purpose used in this project.
80
x

LIST OF FIGURES
Figure 2.1 A bundle of flax fibres
6
Figure 2.2 Cross section of a fibre bundle
7
Figure 2.3 Location of nodes in a flax fibre (arrows show the locations of fibre nodes)
7
Figure 2.4 Schematic of flax fibre cell with primary and secondary walls
9
Figure 2.5 Fibril arrangement in natural cellulose fibre
9
Figure 2.6 Cellulose macro molecule
10
Figure 2.7 X-ray diffraction pattern for ramie cellulose I, II, III, and IV
11
Figure 2.8 X-ray diffraction pattern for water- retted flax fibre. The directions of Bragg’s planes are given by
)002(and),110(),101(
11
Figure 2.9 Unit-cell dimensions and space group of cellulose I derived from cotton fibre
12
Figure 2.10 Schematic of plasma gas containing neutral, positive and negative particles
17
Figure 2.11 For each type of particles inside a small volume of ΔV density and temperature are different e.g. the temperature (density) of electrons, neutral particles, and ions are shown with Te(ne), Tn(nn), and Ti(ni), respectively
18
Figure 2.12 Elastic modulus versus percentage of filler for untreated (1) and plasma treated (2) wood fibres
21
Figure 2.13 Schematic of interaction between natural fibre and silane
22
Figure 3.1 Photograph of scanned fibres
27
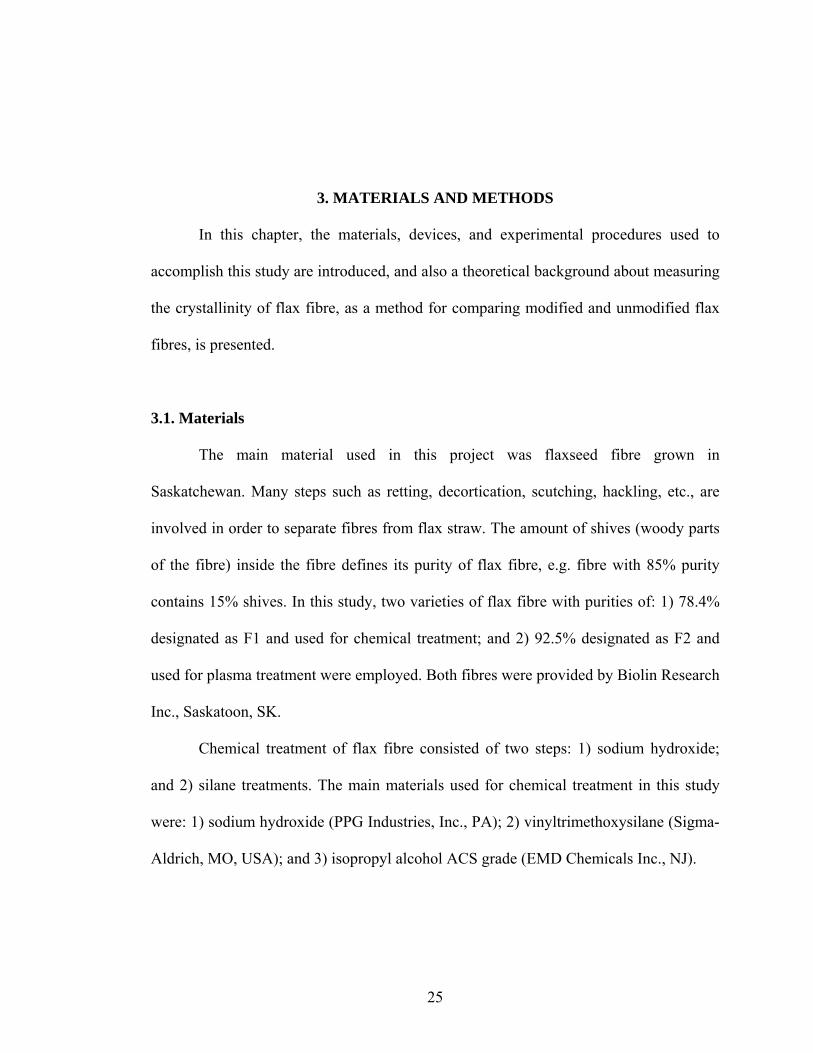
Figure 3.2 Schematic of the rectangular paper, used for tensile test. The initial length of the fibres was 20 mm
29
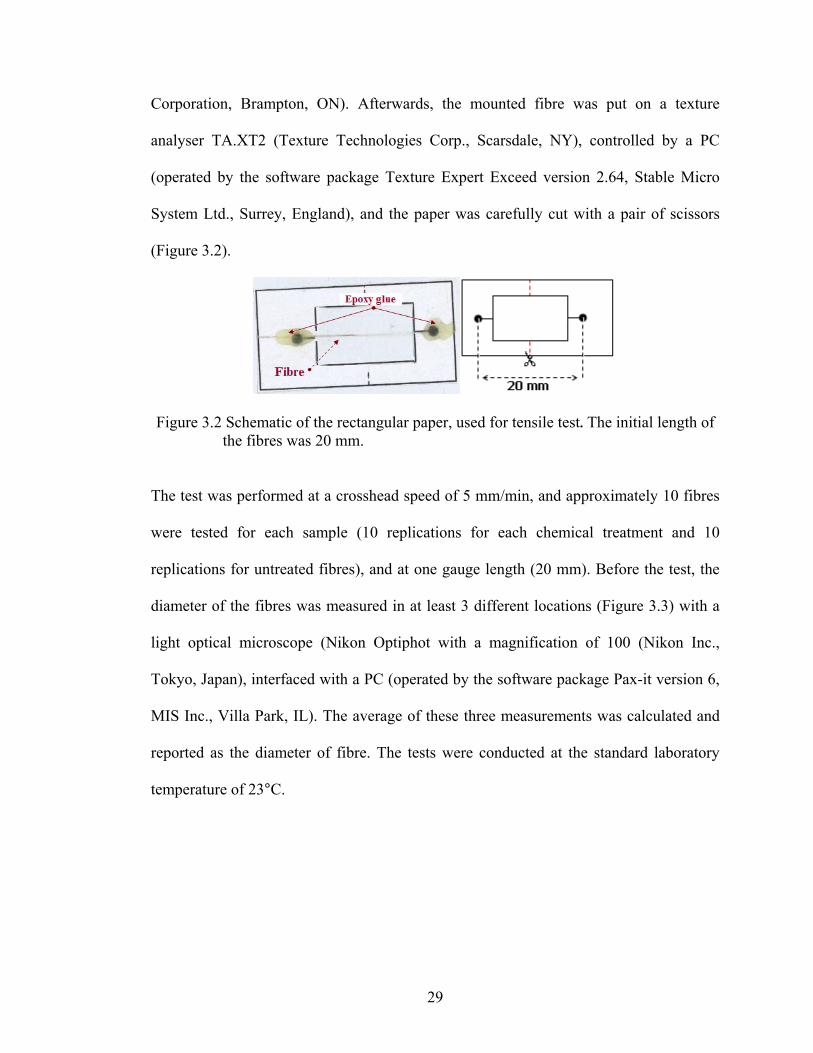
Figure 3.3 Fibre diameter was measured in at least 3 different locations (2 locations are shown)
30
xi
Figure 3.4 Schematic of the partitioned bucket used for chemical treatment of flax fibres. The fibres inside the bucket were treated four different durations: 1, 2, 3, and 4 h designated as T1, T2, T3, and T4, respectively
31
Figure 3.5 Different perspectives of the plasma reactor used in this work
32
Figure 3.6 Experimental setup for the DC glow discharge plasma reactor
33
Figure 3.7 Dimensions of the upper electrode
33
Figure 3.8 Photographs of the upper electrode showing: a) center part and b) near edge of the electrode surface
34
Figure 3.9 Peak resolution for flax fibre. Peak-1, Peak-2, and Peak-3 were considered for the cellulose and Peak-4 was assigned for the amorphous phase. A linear equation with two fitting parameters was added to the four peaks to complete the fitting function
35
Figure 3.10 A solid semicrystalline polymer is made of two phases, crystalline and amorphous regions
36
Figure 3.11 Si (i =1, 2, 3, 4) is equal to the area under the curve ( ) and the horizontal axis (α)
*iI
37
Figure 3.12 A schematic of β½. By calculating β½ from the XRD curve or from the fitted peak after fitting the crystallite size can easily be estimated
38
Figure 3.13 Schematic of the interplanar spacing and X-ray diffraction angle
39
Figure 3.14 Photograph of the samples used for XRD test
40
Figure 3.15 Schematic showing the relationship between incident and transmitted X-ray beam intensities, through a thin slab
41
Figure 3.16 Variation of mass absorption coefficient with wavelength
42
Figure 3.17 Variation of mass absorption coefficient with K and L (inner shell energy)
43
xii
Figure 3.18 Schematic showing the cross sections of samples cut (embedded in a polymer resin, the resin is not shown here) using ultramicrotome (longitudinal sections, thickness about 90 nm)
44
Figure 3.19 Ultrathin sections of samples on foamvar-coated copper grids
44
Figure 4.1 SEM micrographs of untreated fibres of 78.4% purity (F1) and 92.5% purity (F2)
47
Figure 4.2 XRD curves of untreated flax fibres (F1, F2)
48
Figure 4.3 Schematic of flax fibre thickness distribution
51
Figure 4.4 Longitudinal SEM photographs of untreated flax fibres of 78.4% purity (F1). Non-cellulosic materials can be seen on the surface of untreated flax fibres
54
Figure 4.5 Longitudinal SEM photographs of chemically treated flax fibres at different durations: 1, 2, 3, and 4 h shown as T1, T2, T3, and T4, respectively. After chemical treatments the surface of the fibres were cleaned and fibrillar units were appeared
55
Figure 4.6 Diffraction curves of untreated (F1) and chemically treated (T1, T2, T3, andT4) flax fibres. Slight changes occurred in intensity to the fibres after treatment reflected mostly on peak 3
56
Figure 4.7 Color of untreated and chemically treated flax fibres acquired from RGB values
59
Figure 4.8 Typical stress-strain curves for flax fibres showing: 1) elastic behaviour; 2) strain-hardening behaviour; and 3) composite behaviour
60
Figure 4.9 Spectra extracted from the resin region in different treatments. The dashed circle shows the presence of a shoulder in resin spectra extracted from different samples
65
xiii
Figure 4.10 NEXAFS data for untreated fibre (F1): a) optical density versus photon energy, b) scanned fibre, and c) cellulose concentrations shown with different colors. The green and brown spectra (a) show the creation of a chemical bonding between resin and fibre. The spectrum of resin was extracted from the region shown with the letter R, and in order to compare the distribution of cellulose in different fibres, R1 region was selected from F1
66
Figure 4.11 NEXAFS data for one-hour chemical treated fibre (T1): a) optical density versus photon energy, b) scanned fibre, and c) cellulose concentrations shown with different colors. The only trace of resin was observed in this sample (the dashed circle). The interaction between fibre and resin were appeared in two different regions (the green and violet spectra). The yellow areas show the penetration of resin inside the treated fibre. The spectrum of resin was extracted from the region shown with the letter R, and in order to compare the distribution of cellulose in different fibres, R1 and R2 regions were selected from T1
67
Figure 4.12 NEXAFS data for two-hour chemical treated fibre (T2): a) optical density versus photon energy, b) scanned fibre, and c) cellulose concentrations shown with different colors. The green spectrum (a) shows the existence of interfacial boding between resin and fibre. The spectrum of resin was extracted from the region shown with the letter R, and in order to compare the distribution of cellulose in different fibres, R1 region was selected from T2
68
Figure 4.13 NEXAFS data for three- hour chemical treated fibre (T3): a) optical density versus photon energy, b) scanned fibre, and c) cellulose concentrations shown with different colors. The spectrum of resin was extracted from the region shown with the letter R, and in order to compare the distribution of cellulose in different fibres, R1 and R2 regions were selected from T3
69
Figure 4.14 NEXAFS data for four-hour chemical treated fibre (T4) a) optical density versus photon energy, b) scanned fibre, and c) cellulose concentrations shown with different colors. The spectrum of resin was extracted from the region shown with the letter R and in order to compare the distribution of cellulose in different fibres, R1 and R2 regions were selected from T4
70
xiv
Figure 4.15 A comparison between the distribution of cellulose in different samples. Spectra extracted from different regions (R1, R2) in the untreated and chemically treated fibres. Some treatments only one spectrum and for others two spectra were extracted
71
Figure 4.16 Longitudinal SEM photographs of 1) untreated flax fibre (F2, 92.5% purity) and 2) 5, 10, and 15-minute plasma treated flax fibres shown as P1, P2, and P3, respectively. Etching patterns appeared after 10 min treatment (P2) and one layer of the fibre was separated after 15 min treatment (P3)
72
Figure 4.17 XRD curves of untreated (F2) and plasma treated fibres (P1, P2, and P3)
73
Figure 4.18 Degradation temperatures of untreated, plasma, and chemically treated flax fibres; a, b, and c mean that all samples with the same letter designation are not statistically different by Duncan’s multiple range test. In this experiment 1) T1, T2, T3, and T4 were compared with F1 (designated by a and b) and 2) P1, P2, and P3 were compared with F2 (designated by c).
77
Figure 4.19 First endothermic peak was not present after drying the sample. Four samples (four replications) were chosen from untreated flax fibres with a purity of 92.5% (F2) and one of them was dried
78
Figure 4.20 First endothermic peak was not present after drying the sample. Four samples (four replications) were chosen from 4-hour chemical treated flax fibres (T4) and one of them was dried
78
Figure 4.21 Three DSC thermograms (three replications) obtained from two-hour chemical treated fibres (T2) and the blue curve contains two endothermic peaks
79
Figure A.1 Peak resolution of untreated fibre (F1)
95
Figure A.2 Peak resolution of untreated fibre (F2)
95
Figure A.3 Peak resolution of chemically treated fibre (T1)
96
Figure A.4 Peak resolution of chemically treated fibre (T2) 96
xv

Figure A.5 Peak resolution of chemically treated fibre (T3)
97
Figure A.6 Peak resolution of chemically treated fibre (T4)
97
Figure A.7 Peak resolution of plasma treated fibre (P1)
98
Figure A.8 Peak resolution of plasma treated fibre (P2)
98
Figure A.9 Peak resolution of plasma treated fibre (P3)
99
Figure B.1 Schematic of flax fibre thickness distribution (sample 1)
101
Figure B.2 Schematic of flax fibre thickness distribution (sample 2)
101
Figure B.3 Schematic of flax fibre thickness distribution (sample 3)
102
Figure B.4 Schematic of flax fibre thickness distribution (sample 4)
102
Figure B.5 Schematic of flax fibre thickness distribution (sample 5)
103
Figure B.6 Schematic of flax fibre thickness distribution (sample 6)
103
Figure B.7 Schematic of flax fibre thickness distribution (sample 7)
104
Figure B.8 Schematic of flax fibre thickness distribution (sample 8)
104
Figure B.9 Schematic of flax fibre thickness distribution (sample 9)
105
Figure B.10 Schematic of flax fibre thickness distribution (sample 10)
105
Figure C.1 Elastic modulus versus the diameter for untreated (F1)/chemically treated fibres (T1, T2, T3 and T4)
107
Figure C.2 Tensile strength versus the diameter for untreated (F1)/chemically treated fibres (T1, T2, T3 and T4)
108
Figure D.1 Schematic of peak broadening for a strain free sample: a) one dimensional arrangement of unit cells and b) diffraction peak profile
110
Figure D.2 Schematic of peak broadening (left shifting) for a sample subjected to a uniform tension: a) one dimensional arrangement of unit cells and b) diffraction peak profile
110
xvi

Figure D.3 Schematic of peak broadening (right shifting) for a sample subjected to a uniform compression: a) one dimensional arrangement of unit cells and b) diffraction peak
110
Figure D.4 Schematic of peak broadening for a sample subjected to a uniform bending: a) one dimensional arrangement of unit cells b) diffraction peak profile
111
Figure D.5 The presence of point defects (vacancies) in the sample causes local increase in Bragg’s plane and also deforms the diffraction peak profile
111
Figure D6 The presence of point defects (interstitials) in the sample causes local decrease in Bragg’s plane and also deforms the diffraction peak profile
111
Figure E.1 DSC thermograms obtained from untreated fibre (F1)
113
Figure E.2 DSC thermograms obtained from untreated fibre (F2)
113
Figure E.3 DSC thermograms obtained from chemically treated fibre (T1)
114
Figure E.4 DSC thermograms obtained from chemically treated fibre (T2)
114
Figure E.5 DSC thermograms obtained from chemically treated fibre (T3)
115
Figure E.6 DSC thermograms obtained from chemically treated fibre (T4)
115
Figure E.7 DSC thermograms obtained from plasma treated fibre (P1)
116
Figure E.8 DSC thermograms obtained from plasma treated fibre (P2)
116
Figure E.9 DSC thermograms obtained from plasma treated fibre (P3)
117
xvii

NOMENCLATURE A = Flax fibre cross section area (μm )
Ao= Flax fibre cross section area (m )
C 1s = Atomic subshell of carbon (quantum numbers: n=1, l=0)
d = Interplanar spacing (Å)
DSC = Differential scanning calorimetry
DP = Degree of polymerization
D = Fibre thickness (μm)
E/ΔE = Spectral resolving power
fi = Relative frequency
F1 = Untreated flax fibre with a purity of 78.4%
F2 = Untreated flax fibre with a purity of 92.5%
Fmax = Maximum load (N)
It = Transmitted intensity (the number of transmitted soft X-ray photons or counts)
Io = Incident intensity (the number of incident soft X-ray photons or counts)
I = X-ray intensity (the number of scattered hard X-ray photons or counts)
L, a, b = Color coordinates of the samples
MC = Moisture content (%)
nα = Plasma density for each type of particles in plasma gas (cm-3), α = e (electrons), i
(ions) or n (neutral particles)
N = The number of counted fibres
Ni = The number of fibres with the thickness of Di (μm)
NEXAFS = Near-edge X-ray absorption of fine structure
xviii

OD = Optical density
P1 = Five- minute plasma treated flax fibres
P2 = Ten- minute plasma treated flax fibres
P3 = Fifteen- minute plasma treated flax fibres
R2 = Coefficient of determination
STXM = Scanning transmission X-ray microscopy
SEM = Scanning electron microscopy
SCCM = Standard cubic centimetres per minute
T1 = One-hour chemically treated flax fibres
T2 = Two- hour chemically treated flax fibres
T3 = Three- hour chemically treated flax fibres
T4 = Tour- hour chemically treated flax fibres
Te = Temperature of negative particles or electrons (eV or K)
Ti = Temperature of positive particles or ions (eV or K)
Tn = Temperature of neutral particles (eV or K)
TEM = Transmission electron microscopy
W = Crystallite thickness (Å)
XRD = X-ray diffraction
XC = Degree of crystallinity (%)
X1, X2, X3, and X4= The angular position of Bragg’s peaks (in degree or radians)
21β = The full width at half maximum of Bragg’s peak from crystalline lattice (in
radians)
λ = 1.54 Å (the wave length of hard X -ray beam)
xix

μ = Mass absorption coefficient (cm2/g)
θΒ = The angular position of Bragg’s peaks (in degree or radians)
ρ = Density of material (g/cm3)
σmax = Maximum tensile strength (Pa)
xx

1. INTRODUCTION AND OBJECTIVES
Biocomposite materials consist of natural fibres as reinforcement and
biodegradable or non-biodegradable polymers as matrix. Recently, increasing interest in
biodegradable plastics has been revived due to new technologies. Natural fibres such as
flax, hemp, jute, and wood fibres, which originate from renewable resources, are used as
reinforcement in polymer-based engineering composites. They show adequate
mechanical properties, good resistance to breakage during processing, low density, and
low cost. High level of moisture adsorption, poor wettability and adhesion between
polymers and untreated fibres favour the chemical or plasma treatment for fibres.
Plasma is an ionized gas containing negative, positive, and neutral particles.
When a sample is exposed to a plasma gas, energetic charged-particles inside the plasma
are able to interact chemically with the surface of the sample. Such interactions can
affect material properties. The effect of plasma treatment on materials might be
categorized in two types of surface and structure changes (bulk modification). Plasma
surface modification involves the use of energetic charge particles generated by an
ionized gas to modify the surface properties without affecting the desirable bulk
properties of materials e.g. plasma surface modification may affect the wettability,
dyeability, and adhesion of materials (Xu and co-researchers 2006). In general, plasma
surface treatment does not change or break the bulk materials; it does not remove or
1

deposit more than a few layers to the surface of materials; and it does not remove bulk
materials (Roth 2001).
In the biocomposite manufacturing process, the surface properties of natural
fibres play an important role. The conventional method of treatment (or chemical
treatment) produces large amounts of waste materials; therefore, a need for
environmentally friendly treatment of materials with less pollution and various
applications is growing fast.
Some studies have been done in order to understand the structure and properties
of natural fibres (Bledzki and Gassan 1999; Bledzki et al. 1996) and on the other hand,
by ignoring what really happens to the fibre structure, a macroscopic approach has been
developed. In the latter choice, properties such as heat conductivity, elastic modulus,
elongation, and hardness of composites made of flax fibres, have been at the center of
studies by Hornsby and co-workers (1997), Baiardo and co-workers (2004), and Olaru
and co-workers (2005).
Using plasma treatment in different areas has been studied by many researchers
and the treatment sometimes has shown promising results, e.g. an improvement in the
dyeability and wettability of bamboo fibres after argon plasma treatment has been
reported by Xu and co-researchers (2006). Marais and co-workers (2005) have studied
the mechanical properties of unsaturated polyester composites reinforced with helium
plasma treated flax fibres. They have reported an improvement in fibre/matrix adhesion
after exposing the flax fibres to helium plasma treatment. The effect of oxygen plasma
treatment on bombyx mori silk fibres has been studied by Chen and co-workers (2004).
Their results showed that the crystallinity of the fibres was decreased.
2

No studies involving modification of natural fibre have been done at the
University of Saskatchewan using plasma as a modification method. This research was
aimed at using plasma as a treatment method for natural fibres, particularly flax fibre.
The main goal of this study was to investigate the capability and the limitations of
utilizing the plasma treatment technique for modifying flax fibres. To approach this
goal, it was necessary to study about both the chemical and plasma modifications of
natural fibres done by other researchers.
This project is divided into two parts.
1. Plasma treatment, which is a treatment with an electric gas discharge, can change the
surface characteristics of fibres. Plasma treatment changes structural and surface
properties of the fibres. Mechanical bonding between fibres and polymer such as
thermoplastic and thermoset resins can be influenced by the time of exposure and the
nature of the gas used (argon, nitrogen, and oxygen). A variety of plasma treatments
can be achieved by changing the processing time and gas flow rate.
2. Chemical treatment which is based on the following rule: a third component as a
coupling agent is used in improving the compatibility of two materials which
originally are incompatible.
In this project, both treatment methods (chemical and plasma) have been used
and the results have been compared by using the following test methods: 1) X-ray
diffraction (XRD) for measuring the percentages of crystallinity of flax fibres; 2)
scanning electron microscopy (SEM) for investigating morphological changes of flax-
fibre surface before and after treatment; 3) soft X-ray spectromicroscopy for
compositional analysis of flax fibres; 4) color test; 5) density test; and 6) mechanical
properties test including tensile strength measurements.
3

1.1 Objectives
The main goal of this project was to study the effect of plasma and chemical
treatments on the structure of flax fibre, including mechanical properties, crystallinity,
color change, and surface alteration. In particular, the specific objectives of this study
were:
1. to evaluate the effect of plasma treatment on the microscopic structure of flax fibre;
2. to investigate also the effect of chemical treatment on the microscopic structure of
flax fibre;
3. to compare the results obtained from part 1 and 2; and
4. to study the advantages and disadvantages of using plasma/chemical modification of
flax fibres.
The objectives of this study are discussed in Chapter 1. A literature review about
flax fibre and fibre modification is given in Chapter 2. Chapter 3 is devoted to the
materials and methods used in this project, including testing methods and how the
related properties were measured. Results and discussion are provided in Chapter 4.
Conclusion, a list of suggestions for future research, and references are in Chapter 5,
Chapter 6, and Chapter 7, respectively. Supporting data are located in the Appendices.
4

2. LITERATURE REVIEW
To use natural fibres as reinforcement, a good basic understanding of its structure
and properties would be of assistance, because any changes in its structure may
significantly affect its properties. This chapter summarizes previous works done
concerning the composition of flax fibre and the effect of both plasma and chemical
treatments on the structure of flax fibre.
2.1 The Characteristic of Flax Fibres
In this chapter, flax fibre history, flax-fibre bundles, composition and structure of
flax fibre, chemical structure of cellulose, and mechanical properties of flax fibres are
discussed.
2.1.1 Flax-fibre history
The oldest agricultural plant known to man is perhaps flax. Flaxseeds and fishing
nets made of flax have been found dating back to 7000 B.C. (Sharma and van Sumere
1992). There are two different groups of varieties of Linum usitatissimum, called flax
and linseed (or seed flax). Flax or, in other words, flax fibre is grown for production of
short and long fibres. The process of retting and environmental conditions can affect the
quality of the fibres. Both the seeds and the stem of the flax plant can be used for
industrial and non-industrial applications. Long fibres are used for linens, rugs, and
strong threads. Linseed oil is extracted from crushed linseeds and this oil can be
5

used in oil paints, varnishes, and linoleum. Today, Canada is one of the major flaxseed
producer and exporter to other countries. Tow (short fibre) can be produced from linseed
straw.
2.1.2 Flax-fibre bundles
A bundle of flax fibre usually is made of 10-40 fibres, and bound as one by
pectin and lignin (Baley 2002) as shown in Figure 2.1. Each fibre has a polygon-shaped
cross section with 5-7 sides (Figure 2.2) and the transverse (thickness) and the
longitudinal dimensions of fibre, reported by Baley (2002), lie in the range of 5-76 μm
and 4-77 mm, respectively. The presence of fibre nodes (Figure 2.3) in the longitudinal
direction influence fibre properties. One hundred to 500 fibre nodes in a single fibre, 2-5
cm long were reported by Khalili and co-workers (2002).
Figure 2.1 A bundle of flax fibres.
6

Figure 2.2 Cross section of a fibre bundle (reproduced from Baley 2002).
Figure 2.3 Location of nodes in a flax fibre (arrows show the locations of fibre nodes).
2.1.3 Composition and structure of flax fibre
The chemical components of flax fibre can be categorized into two separate
groups: cellulosic (cellulose) and non-cellulosic substances (hemicellulose, lignin,
waxes, water soluble substances, pectin, and water). In other words, flax fibre is a
composite material in which pectin, lignin, and hemicellulose hold the individual cells
together and act as bonding agents.
7
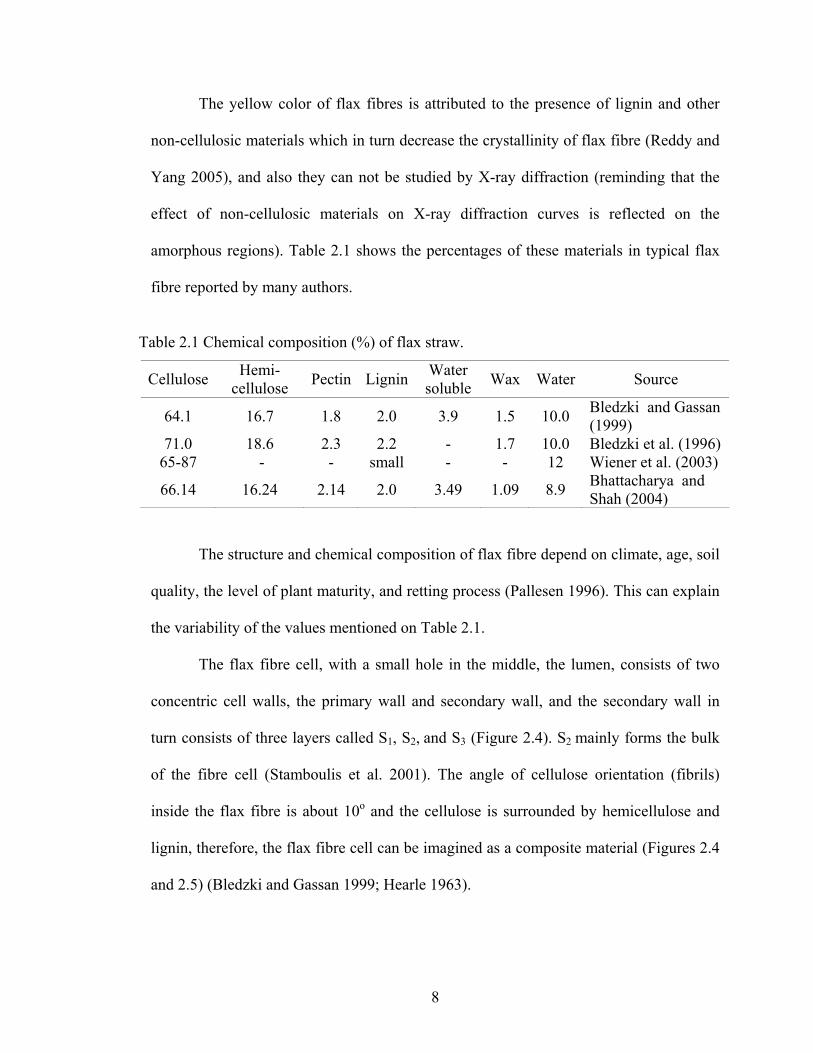
The yellow color of flax fibres is attributed to the presence of lignin and other
non-cellulosic materials which in turn decrease the crystallinity of flax fibre (Reddy and
Yang 2005), and also they can not be studied by X-ray diffraction (reminding that the
effect of non-cellulosic materials on X-ray diffraction curves is reflected on the
amorphous regions). Table 2.1 shows the percentages of these materials in typical flax
fibre reported by many authors.
Table 2.1 Chemical composition (%) of flax straw.
Cellulose Hemi- cellulose Pectin Lignin Water
soluble Wax Water Source
64.1 16.7 1.8 2.0 3.9 1.5 10.0 Bledzki and Gassan (1999)
71.0 18.6 2.3 2.2 - 1.7 10.0 Bledzki et al. (1996) 65-87 - - small - - 12 Wiener et al. (2003)
66.14 16.24 2.14 2.0 3.49 1.09 8.9 Bhattacharya and Shah (2004)
The structure and chemical composition of flax fibre depend on climate, age, soil
quality, the level of plant maturity, and retting process (Pallesen 1996). This can explain
the variability of the values mentioned on Table 2.1.
The flax fibre cell, with a small hole in the middle, the lumen, consists of two
concentric cell walls, the primary wall and secondary wall, and the secondary wall in
turn consists of three layers called S1, S2, and S3 (Figure 2.4). S2 mainly forms the bulk
of the fibre cell (Stamboulis et al. 2001). The angle of cellulose orientation (fibrils)
inside the flax fibre is about 10o and the cellulose is surrounded by hemicellulose and
lignin, therefore, the flax fibre cell can be imagined as a composite material (Figures 2.4
and 2.5) (Bledzki and Gassan 1999; Hearle 1963).
8

Figure 2.4 Schematic of flax fibre cell with primary and secondary walls (reproduced from Baley 2002).
Figure 2.5 Fibril arrangement in natural cellulose fibre (reproduced from Hearle 1963).
9

2.1.4 Chemical structure of cellulose
Cellulose is the main component of vegetable fibres. The repeating unit
(monomer) is called anhydro-d-glucose (Figure 2.6). Three alcohol hydroxyls (-OH),
which are attached to the monomer unit, play an important role in chemical interaction
(hydrogen bonds) between the cellulose molecules and other molecules (Bledzki et al.
1996).
Figure 2.6 Cellulose macro molecule (reproduced from Bledzki et al. 1996).
The four different forms of cellulose, having different molecular structures are: cellulose
I, II, III, and IV. The native form of cellulose is cellulose I. Cellulose II can be obtained
by mercerization of cellulose I. Cellulose III and IV are derived from cellulose I and II
(called cellulose IIII, IVI, IIIII, and IVII) (Ishikawa et al. 1997). The X-ray diffraction
curve for each cellulose form is different from each other (Figure 2.7). Converting
cellulose I to cellulose II in pine wood has been studied by Borysiak and Doczekalska
(2005). They used a sodium hydroxide (NaOH) treatment with different concentrations
and different treatment times. Their results showed that the amount of cellulose II
increased when both the concentration of the sodium hydroxide (NaOH) solution and
treatment time increased. They also reported an overall decrease in crystallinity of the
pine wood after it was subjected to the mercerization process. The diffraction curves
10
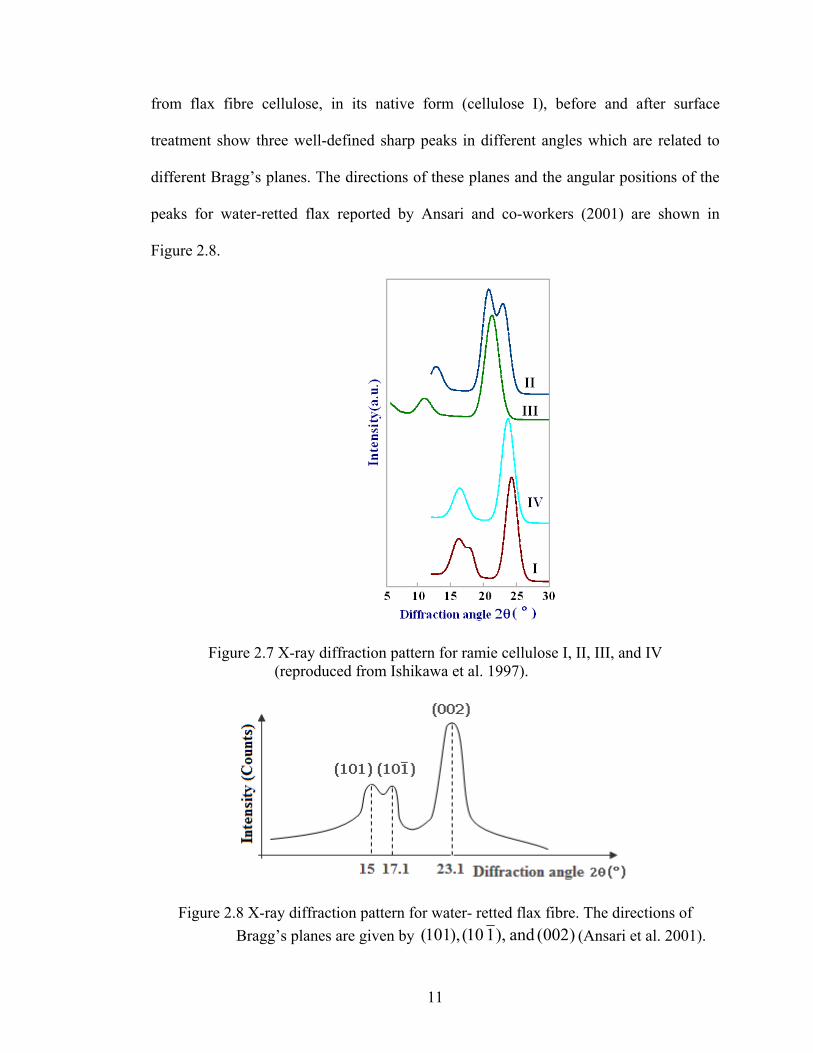
from flax fibre cellulose, in its native form (cellulose I), before and after surface
treatment show three well-defined sharp peaks in different angles which are related to
different Bragg’s planes. The directions of these planes and the angular positions of the
peaks for water-retted flax reported by Ansari and co-workers (2001) are shown in
Figure 2.8.
Figure 2.7 X-ray diffraction pattern for ramie cellulose I, II, III, and IV (reproduced from Ishikawa et al. 1997).
Figure 2.8 X-ray diffraction pattern for water- retted flax fibre. The directions of Bragg’s planes are given by )002(and),110(),101( (Ansari et al. 2001).
11
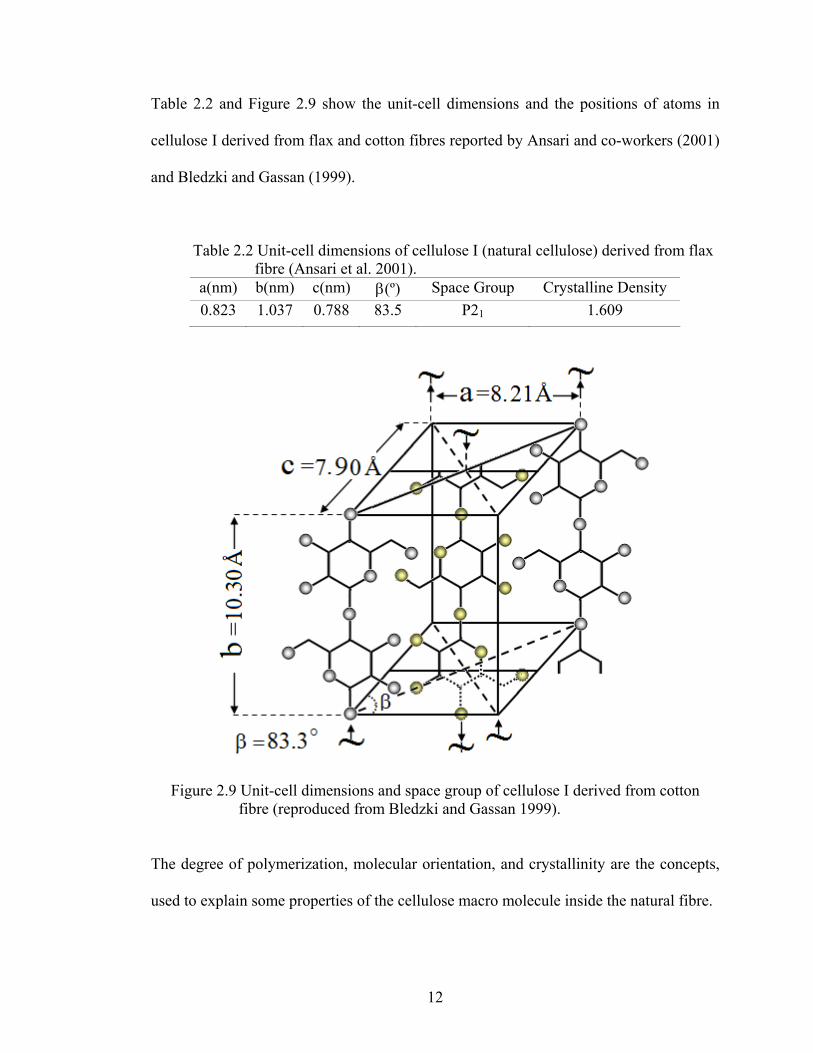
Table 2.2 and Figure 2.9 show the unit-cell dimensions and the positions of atoms in
cellulose I derived from flax and cotton fibres reported by Ansari and co-workers (2001)
and Bledzki and Gassan (1999).
Table 2.2 Unit-cell dimensions of cellulose I (natural cellulose) derived from flax fibre (Ansari et al. 2001).
a(nm) b(nm) c(nm) β(º) Space Group Crystalline Density 0.823 1.037 0.788 83.5 P21 1.609
Figure 2.9 Unit-cell dimensions and space group of cellulose I derived from cotton fibre (reproduced from Bledzki and Gassan 1999).
The degree of polymerization, molecular orientation, and crystallinity are the concepts,
used to explain some properties of the cellulose macro molecule inside the natural fibre.
12

13
In this work, the last concept has been used. In general, both molecular
orientation and crystallinity play an important role in the mechanical properties of macro
molecules. It is well known that cellulose macro molecules in flax fibres exist in both
amorphous and crystalline forms, and it is important to know the orientation of
crystallites and the percentage of cellulose in the fibre in achieving high stiffness and
strength (Ward 1962; Hearle 1963).
2.1.5 Mechanical properties of flax fibres
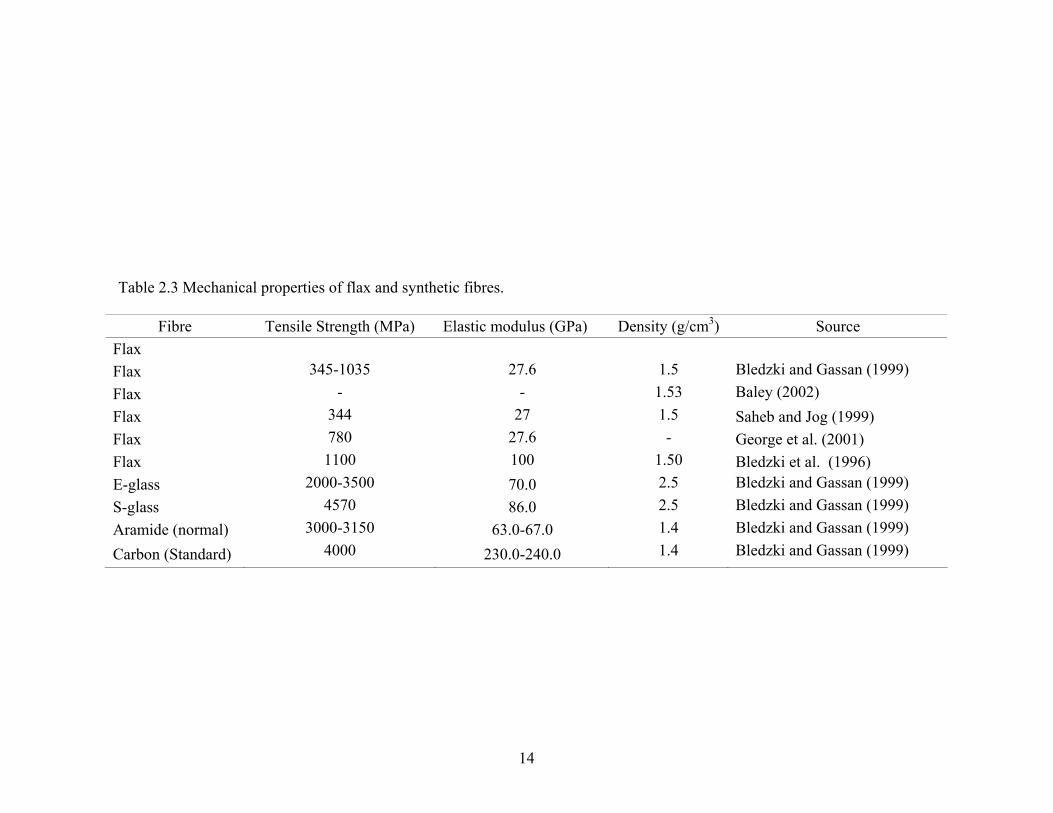
The density of flax and man-made fibres quoted by different researchers is listed
in Table 2.3. The density of flax fibre is about 1.5 g/cm3 (the density for carbon and
aramide is 1.4 g/cm3) and, as a result, shows a comparable specific strength in
comparison to the synthetic fibres (Table 2.3).
Fibre Tensile Strength (MPa) Elastic modulus (GPa) Density (g/cm3) Source Flax Flax 345-1035 27.6 1.5 Bledzki and Gassan (1999) Flax - - 1.53 Baley (2002) Flax 344 27 1.5 Saheb and Jog (1999) Flax 780 27.6 - George et al. (2001) Flax 1100 100 1.50 Bledzki et al. (1996) E-glass 2000-3500 70.0 2.5 Bledzki and Gassan (1999) S-glass 4570 86.0 2.5 Bledzki and Gassan (1999) Aramide (normal) 3000-3150 63.0-67.0 1.4 Bledzki and Gassan (1999)
Carbon (Standard) 4000 230.0-240.0 1.4 Bledzki and Gassan (1999)
14
Table 2.3 Mechanical properties of flax and synthetic fibres.
As previously stated, the structure of flax fibres depends on climate and
therefore, the mechanical properties of flax fibres are mainly determined by their
structure. In general, the mechanical properties of flax fibres are dependent on the
following factors:
1. Environmental conditions - The fibre structure is affected by environmental
conditions and in turn a change in the structure causes a change in mechanical
properties.
2. Hydrophilic nature of flax fibre - The ability of flax fibre to absorb water mainly
hinges on the content of the non-cellulosic part (mainly hemicelluloses) and the
porous content of the fibre (Bledzki and Gassan 1999) which is related to the fibre
structure and composition.
3. The initial size of flax fibre - Shorter fibres are more uniform than longer ones e.g.
the number of fibre nodes in long fibres is more than short ones.
4. Temperature - Temperature can change both the degree of polymerization (DP) and
crystallinity of cellulose in flax fibre. Gassan and Bledzki (2001) reported an
insignificant decrease in both tenacity and DP of untreated flax fibre at a temperature
less than 170°C. They also mentioned that when the temperature increased above
170°C, the DP and tenacity dropped off quickly. The fibres in both cases were
thermally treated for 120 min.
Other factors such as defects, fibre nodes, moisture content, and non-uniform chemical
composition in flax fibres also determine the characteristic values of the fibres.
2.2 Surface Treatment of Flax Fibres
The reasons for offering a surface treatment of flax fibres are as follows:
15

a) Hydrophilic nature of flax fibres - High water absorbability of natural fibre causes
the swelling of fibres and, therefore, results in the production of micro cracks in
composites and degradation of mechanical properties. A proper method of treatment
might help decrease the ability of fibres to absorb moisture, e.g. chemical treatment
decreases the amount of pectic substances and hemicelluloses (having a relatively
high water absorption) in fibre, and it also can change the structure of the cellulosic
component.
b) Poor adhesion between matrix and fibres - High-performance light-weight
thermoplastics like polyethylene and polypropylene are inert materials, and
composites made of these materials and natural fibres do not show sufficient
strength. Surface modification of natural fibres may enhance their adhesion to
polymer matrices.
Chemical treatment which consumes a large amount of energy leaves large amounts
of unwanted and waste material behind; therefore, the need for environmentally friendly
treatment of materials is necessary. Plasma surface treatment might be a good candidate
for environmentally friendly treatment of material for the following reasons:
1. The capability of plasma to create free radicals and active groups for improving the
interfacial adhesion (Lieberman and Lichtenberg 2005);
2. Plasma treatment produces less environmental contaminants than chemical ones; and
3. Plasma treatment might be used in order to remove organic surface contamination
from fibre.
16

2.2.1 Plasma treatment of flax fibre
The word plasma comes from the Greek language and it means something
molded. In physics, plasma or the fourth state of matter is a partially hot ionized gas
containing positive and negative charges which shows collective behaviour (Figure
2.10). The motion of each particle inside the plasma gas is controlled by electromagnetic
fields produced by other particles and external sources (Lieberman and Lichtenberg
2005).
Figure 2.10 Schematic of plasma gas containing neutral, positive, and negative particles.
Two characteristics of a plasma gas are:
1. Temperature - Plasma temperature is measured in electron volts (eV) or Kelvin (K)
and a specific temperature is devoted to each type of particles e.g. the temperature of
neutral particles (Tn), the temperature of negative particles or electrons (Te), and the
temperature of positive particles or ions (Ti).
2. Density - Plasma density for each type of particles is defined as the ratio of the
number of species to its volume (Figure 2.11), expressed in units of particles per
cubic centimetre and given by
V)numberParticle(
Volume)numberParticle(ndensityPlasma
Δ=== αα
α , (2.1)
17

where: α = n (neutral particles), e (negative particles or electrons) or i (positive
particles or ions), and
ΔV = the volume of particles (cm3).
Figure 2.11 For each type of particles inside a small volume of ΔV, density and temperature are different e.g. the temperature (density) of electrons, neutral particles, and ions are shown with Te(ne), Tn(nn), and Ti(ni), respectively.
2.2.1.1 Degree of ionization
The degree of ionization in plasma is defined by
Degree of ionizationni
i
nnn+
= , (2.2)
where: ni = the density of positive particles or ions (particles per cubic centimetre), and
nn = the density of neutral particles (particles per cubic centimetre).
2.2.1.2 Hot and cold plasma
In hot plasma, the degree of ionization is high or almost 100%, while this value
in cold plasma is less than 3%. In hot plasma, the temperature of electrons is really high
(e.g. 106 K), whereas this value in cold plasma is low (e.g. 103 K).
18
2.2.1.3 Direct current (DC) glow discharge plasma
In a DC glow discharge plasma reactor, the plasma is formed by applying a DC
potential between two electrodes. The electrodes are located inside a glass container
under vacuum. Plasma-forming gas is employed after vacuum has been applied. The
interaction of a cosmic ray or a photon with a molecule or an atom of plasma gas
releases an electron and creates an ion. Collision between the electron and other
molecules or atoms of plasma gas occurs while accelerating the electron toward the
positive electrode. This collision produces more ions and free electrons inside the gas
and results in the production of plasma. In the same way, a high energy ion can help
generate more ions and electrons in plasma gas.
Electric discharge (cold plasma) is one of the methods used for changing the
chemical structure as well as the topography of the surface of a material. When a sample
is exposed to plasma, ionized atoms and molecules are able to react chemically with
exposed surfaces. Different effects are often observed including etching, modification of
the material surface, and surface oxidation (Lieberman and Lichtenberg 2005).
Depending on type, nature of the gases used, treatment time, gas flow rate, and
applied voltage between two plates, a variety of surface modification could be achieved.
The effect of plasma treatment on natural fibre might be categorized in two types of
surface and structure changes (bulk modification), however, cold plasma does not affect
the bulk properties of materials.
Wong and co-workers (2000) used radio frequency plasma (RF) with a radio
frequency of 13.56 MHz for treating flax fibres. In this experiment, the samples were
exposed to argon and oxygen gases with different treatment times. They reported
formation of cracks and voids on the surface of flax fibres due to the plasma erosion.
19
They also noticed that as the treatment time increased, the depth of voids (micropores)
etched by the plasma increased with pore width.
Xu and co-researchers (2006) observed the appearance of some cracks on the
surface of bamboo fibres after 1 min of argon plasma treatment, and they also remarked
upon an improvement in its dyeability and wettability after plasma treatment. They
realized that as the treatment time was increased, the change on the fibre surface became
more obvious and the fibre surface became rougher. In comparison to bamboo fibres, it
seems that helium plasma treatment does not affect water sorption of flax fibres after
treatment, because Gouanve and co-workers (2006) reported no change in the surface
modification of flax fibres after treatment.
The effect of plasma treatment on the mechanical properties of natural fibre-
based composites has been studied by many researchers. Olaru and co-researchers
(2005) used cold high-frequency methane plasma for treating wood fibres. It was
observed that the values of elastic modulus and strength of the composites (polyethylene
as a matrix) were promoted or the plasma treatment of the wood fibres improved the
compatibility between fibre and polymer matrix (Figure 2.12).
20

Figure 2.12 Elastic modulus versus percentage of filler for untreated (1) and plasma treated (2) wood fibres (reproduced from Olaru et al. 2005).
High-frequency capacitive discharge plasma (HFC) with air as a plasma-forming
gas has been used by Khammatova (2005) to determine the effect of plasma treatment
on the strength (breaking load) of textile thread made of flax fibres. The results showed
an increase in strength by 64%.
It is well known that cellulose, one of the flax fibre components, can be in both
crystalline and amorphous states. The effect of plasma treatment on flax fibre structure
is reflected on the peaks obtained from X-ray diffraction (XRD) curves. By analysing
these peaks, the crystallinity of flax fibre before and after treatment, and the size of the
coherent scattering regions can easily be determined. Khammatova (2005) reported a
significant increase in both crystallinity and the regions of coherent scattering of flax
fibres (peak number 3) treated by HFC discharge plasma.
2.2.2 Chemical treatment of flax fibre
As cited earlier, there are many reasons that make flax fibres incompatible with
polymers in composites. In order to improve the mechanical properties of
21

biocomposites, chemical treatment (surface modification) of flax fibre will be necessary.
For instance, chemical treatment may help to obtain a strong adhesion between the
reinforcing fibres and the matrix for the purpose of having an efficient transfer of stress
and load distribution throughout the interface. Chemical treatment is based on the
following rule:
It is often possible to improve compatibility between two incompatible materials (in this
case polymers and natural fibres) by bringing in a third material (coupling agents).
In silane treatment of natural fibre, silane as a coupling agent acts as a link
between the matrix (polymer) and the cellulose by creating a chemical bond with both
the cellulose and the polymer (George et al. 2001). The linkage between cellulose and
silane occurs through a siloxane bridge whereas, the organofunctional group of silane
attaches to the polymer (George et al. 2001) (Figure 2.13).
Figure 2.13 Schematic of interaction between natural fibre and silane (Sreekala et al. 2000).
A variety of fibre surface modifications, such as mercerization, peroxide
treatment, silane treatment, isocyanate treatment, and graft copolymerization can be
22

applied in the reduction of hydrophilicity and enhancing interfacial adhesion between
the matrix and fibre (George et al. 2001).
Sharma and van Sumere (1992) reported a decrease of moisture regain in boiled
flax fibres (2% NaOH). In their report, this reduction was attributed to the removal of
non-cellulosic material such as hemicellulose and pectic substances from fibres.
Wang (2004) applied three different treatments: silane, benzoylation, and
peroxide on flax fibres and observed a reduction in water absorption. She also reported a
higher tensile strength in the silane- and peroxide-treated fibres than that of the untreated
fibres. In her report, lower tensile strength was observed in benzoylation treated fibres.
Chemical treatments on natural fibres affect structural characteristics of untreated
fibres. Gassan and Bledzki (2001) reported a reduction in the degree of polymerization
(DP) of both jute and flax fibres after alkali treatment, and their results also showed a
reduction in the crystallinity of flax and jute fibres after modification. The flax fibres
were treated for 20 min at a temperature of 20°C with a solution of sodium hydroxide.
2.3 Summary
This chapter was devoted to a review about flax fibre history, composition,
mechanical properties, chemical structure, and surface modification. Only few studies in
literature were related to the effect of plasma treatment on the microscopic structure of
flax fibres and also some properties of flax fibres such as crystallinity, tenacity, and the
size of coherent scattering region were calculated. The results of these studies were
limited by testing conditions, e.g. treatment time, gas, and pressure. In fact, plasma
surface modification of flax fibres is affected by many factors for instance, plasma gas,
23

gas flow rate, pressure, and plasma reactor type; therefore, more studies need to be done
in order to find the best plasma treatment conditions for flax fibres.
One part of this chapter was also dedicated to previous studies related to the
effect of chemical treatment on the microscopic structure of flax fibres and flax fibre
properties for example; crystallinity, water absorption, and tensile strength in this section
were discussed.
This study was aimed to develop and study the plasma/chemical treatment of flax
fibres by using different treatment times and soft X-ray spectromicroscopy was
introduced as a new method to analyse the flax fibre structure and fibre-matrix
interfacial properties. Thermal properties of untreated/treated flax fibres were measured
using the differential scanning calorimetry.
24
3. MATERIALS AND METHODS
In this chapter, the materials, devices, and experimental procedures used to
accomplish this study are introduced, and also a theoretical background about measuring
the crystallinity of flax fibre, as a method for comparing modified and unmodified flax
fibres, is presented.
3.1. Materials
The main material used in this project was flaxseed fibre grown in
Saskatchewan. Many steps such as retting, decortication, scutching, hackling, etc., are
involved in order to separate fibres from flax straw. The amount of shives (woody parts
of the fibre) inside the fibre defines its purity of flax fibre, e.g. fibre with 85% purity
contains 15% shives. In this study, two varieties of flax fibre with purities of: 1) 78.4%
designated as F1 and used for chemical treatment; and 2) 92.5% designated as F2 and
used for plasma treatment were employed. Both fibres were provided by Biolin Research
Inc., Saskatoon, SK.
Chemical treatment of flax fibre consisted of two steps: 1) sodium hydroxide;
and 2) silane treatments. The main materials used for chemical treatment in this study
were: 1) sodium hydroxide (PPG Industries, Inc., PA); 2) vinyltrimethoxysilane (Sigma-
Aldrich, MO, USA); and 3) isopropyl alcohol ACS grade (EMD Chemicals Inc., NJ).
25

The general steps in sample preparation of soft X-ray spectromicroscopy are:
fixation, dehydration, infiltration, embedding, and sectioning. Flax fibres are flexible
and soft materials, and need to be embedded in a polymer resin named
trimethylolpropane triglycidyl ether (TTE) amine resin, in order to be easily sectioned.
TTE amine resin with a molecular formula of C30H56O6N2 (Sigma-Aldrich, Inc., MO) is
a 1:1 ratio of TTE to 4,4’– methylenebis (MMHA). Information about TTE and MMHA
is given in Table 3.1.
Table 3.1 Information about trimethylolpropane triglycidyl ether (TTE) and 4,4’ – methylenebis (MMHA) resins used in soft X- ray spectromicroscopy.
Polymer Density (g/ml) at 25 ºC Molecular Formula TTE* 1.157 C15H26O6
MMHA** 0.94 CH2 [C6H9 (CH3) NH2]2
* Trimethylolpropane triglycidyl ether ** 4,4’ – Methylenebis (2- methylcyclohexylamine)
3.2 Flax Fibre Thickness
The thickness of untreated fibres (F1) was measured in Biolin Research Inc.,
Saskatoon, SK, Canada. The fibres were first spread on the glassy part (surface) of a
scanner (Epson Photo Smart, Epson, Tokyo, Japan) and then were scanned (Figure 3.1).
Data analysis was done using a special software called Fibreshape version 4.3 (IST-
Innovative Sintering Technologies Ltd, Vilters, Switzerland). The thickness of 10
different samples was measured. The author was not involved in using the software for
measuring the fibre thickness and therefore, more information about the method used for
fibre thickness measurement can be found in software users manual.
26

Figure 3.1 Photograph of scanned fibres.
3.3 Flax Fibre Density
The density of a body is defined as the ratio of its mass to its volume. The mass
of samples (untreated flax fibres) was measured using a Galaxy 160D weighing scale
(OHAUS Scale Corporation, Florham Park, NJ) and the volume of the samples was
measured using a gas-operated pycnometer (Quantachrome Corporation, Boynton
Beach, FL) at room temperature (about 23°C). Pressure was 101.6 kPa. In order to
calculate the density, three samples (with average mass of 4.61 g) were chosen and then
the density of each was measured. At the end, the average of these three measurements
was calculated and reported as actual density of flax fibre expressed in g/cm3.
3.4 Color Test
The color of chemically treated and untreated flax fibres (F1) was determined
using the HunterLab Color Analyzer – LabScan System (Hunter Associates Laboratory,
27

Inc., Reston, VA) (the setting is given in Table 3.2). The values of a (-a=green to
+a=red), b (-b=blue to +b=yellow) and L (0=black to 100=white) were measured and
converted to RGB system (red, green and blue, using OpenRGB software version
2.01.80406 (Logicol Company, Trieste, Italy) with the aim of visualizing color changes.
A further examination of color changes in flax fibre was done by calculating the index
ΔE as given by:
2base
2base
2base )bb()aa()LL(E −+−+−=Δ , (3.1)
where: L, a, b = color coordinates of the treated fibre samples, and
Lbase, abase, bbase = color coordinates of untreated fibre samples (F1).
Table 3.2 Settings used in HunterLab color analyzer.
Area view Port size Illuminant Observer 12.7 mm(0.50 in) 25.4 mm(1 in) D65 10°
Three specimens of treated/untreated fibres, with average weight of 4.40 g each,
were taken and put inside a plastic petri dish. Sufficient amounts of fibres were used to
prevent the transmission of light through the fibres inside the petri dish (the incident
light was reflected from the sample surface without passing through the sample). The
color measurement was done for each sample which produced 4 times reading and at the
end, the average of L, a, and b values was calculated.
3.5 Tensile Test
Flax fibres were extracted by hand from untreated/chemically treated fibres (F1)
and then mounted on a rectangular paper and glued with epoxy (Henkel Canada
28
Corporation, Brampton, ON). Afterwards, the mounted fibre was put on a texture
analyser TA.XT2 (Texture Technologies Corp., Scarsdale, NY), controlled by a PC
(operated by the software package Texture Expert Exceed version 2.64, Stable Micro
System Ltd., Surrey, England), and the paper was carefully cut with a pair of scissors
(Figure 3.2).
Figure 3.2 Schematic of the rectangular paper, used for tensile test. The initial length of the fibres was 20 mm.
The test was performed at a crosshead speed of 5 mm/min, and approximately 10 fibres
were tested for each sample (10 replications for each chemical treatment and 10
replications for untreated fibres), and at one gauge length (20 mm). Before the test, the
diameter of the fibres was measured in at least 3 different locations (Figure 3.3) with a
light optical microscope (Nikon Optiphot with a magnification of 100 (Nikon Inc.,
Tokyo, Japan), interfaced with a PC (operated by the software package Pax-it version 6,
MIS Inc., Villa Park, IL). The average of these three measurements was calculated and
reported as the diameter of fibre. The tests were conducted at the standard laboratory
temperature of 23°C.
29
Figure 3.3 Fibre diameter was measured in at least 3 different locations (2 locations are shown).
The texture analyser was set up to display the force-displacement curve. For
reasons of simplicity, the fibres were assumed to be round. The maximum strength
(tensile strength) as defined by:
o
maxmax A
F=σ , (3.2)
where: Fmax = maximum load (N), and
Ao = fibre cross section area (m ),
and elastic modulus of the fibres were calculated from the tensile test results using a
linear fitting method.
3.6 Surface Modification of Flax Fibres
In this study, both chemical and plasma treatments were used in order to modify
the surface of flax fibres. The treatment methods are explained below.
3.6.1 Chemical modification of flax fibres
Untreated flax fibres (F1) were dried in an oven (Despatch LDB-1-67, Despatch
Industries, Minneapolis, MN) for about 48 h at 70ºC and then were weighed using a
30

balance (Adventurer Pro AV812, OHAUS Scale Corporation, Pine Brook, NJ). The flax
fibres were treated in four different durations: 1, 2, 3, and 4 h, designated as T1, T2, T3,
and T4, respectively. In order to provide similar conditions for the fibres (temperature,
pressure, and sodium hydroxide concentration), an empty bucket was used, and then the
bucket was partitioned into four equal parts using two plastic blades (Figure 3.4). The
fibres were soaked in a 5% sodium hydroxide (NaOH) solution in distilled water for
different times.
Figure 3.4 Schematic of the partitioned bucket used for chemical treatment of flax fibres. The fibres inside the bucket were treated four different durations: 1, 2, 3, and 4 h designated as T1, T2, T3, and T4, respectively.
The pre-treated fibres were dipped in an alcohol water mixture (60:40)
containing vinyltrimethoxysilane (1%) and the pH of the solution was maintained
between 3.5 and 4.0 using pH indicator strips. When the chemical treatment was done,
all fibres were washed and rinsed in distilled water at least 5 times and were dried again
in the oven for 24 h at 70 ±1ºC. The fibres were weighed again after drying in order to
measure the weight loss after the chemical treatment.
31
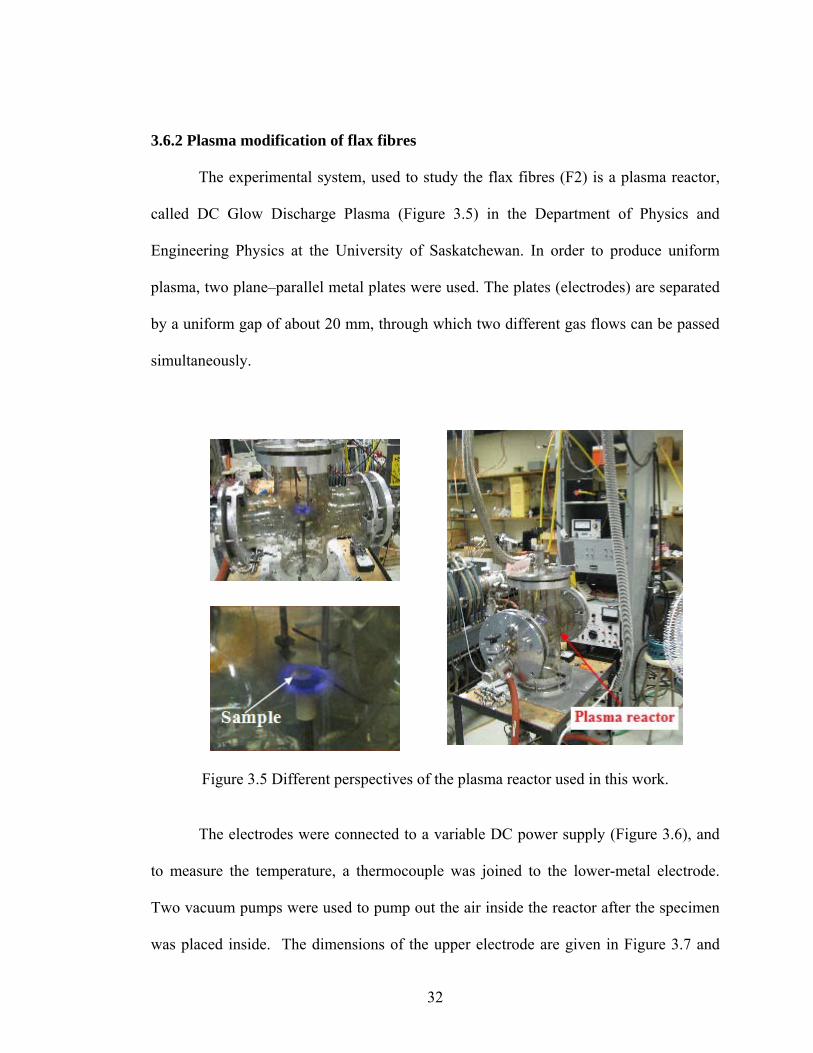
3.6.2 Plasma modification of flax fibres
The experimental system, used to study the flax fibres (F2) is a plasma reactor,
called DC Glow Discharge Plasma (Figure 3.5) in the Department of Physics and
Engineering Physics at the University of Saskatchewan. In order to produce uniform
plasma, two plane–parallel metal plates were used. The plates (electrodes) are separated
by a uniform gap of about 20 mm, through which two different gas flows can be passed
simultaneously.
Figure 3.5 Different perspectives of the plasma reactor used in this work.
The electrodes were connected to a variable DC power supply (Figure 3.6), and
to measure the temperature, a thermocouple was joined to the lower-metal electrode.
Two vacuum pumps were used to pump out the air inside the reactor after the specimen
was placed inside. The dimensions of the upper electrode are given in Figure 3.7 and
32
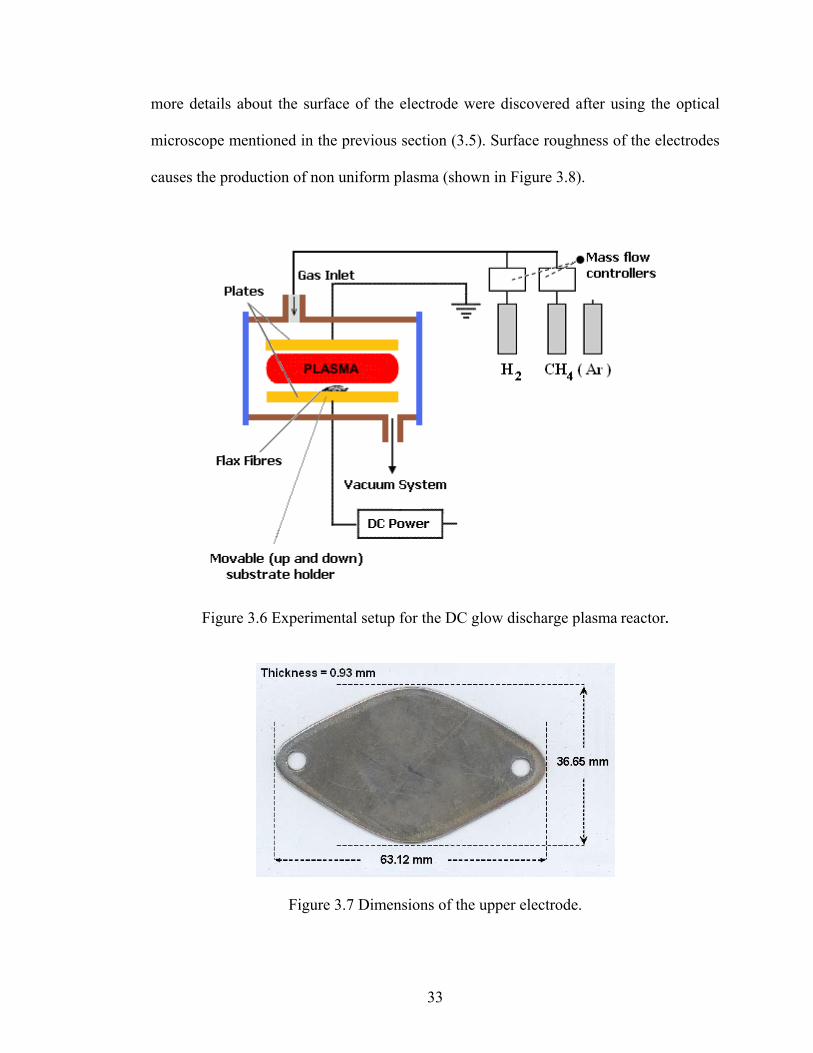
more details about the surface of the electrode were discovered after using the optical
microscope mentioned in the previous section (3.5). Surface roughness of the electrodes
causes the production of non uniform plasma (shown in Figure 3.8).
Figure 3.6 Experimental setup for the DC glow discharge plasma reactor.
Figure 3.7 Dimensions of the upper electrode.
33

Figure 3.8 Photographs of the upper electrode showing: a) center part and b) near edge of the electrode surface.
The average sample mass used in this experiment was about 64.39 mg, and in
order to treat the flax fibres uniformly and prevent the fibres from being sucked into the
vacuum pump, the flax fibre was squeezed first (for this the reason, the finer fibres (F2)
were used) and put inside the reactor at the center of the lower plate. Then the reactor
was evacuated to a final pressure of 0.013 Pa (10-4 torr) and argon gas was introduced in
a controlled flow around 2 SCCM (standard cubic centimetres per minute, referring to
cubic centimetres per minute at 0°C and 1 atmospheric pressure). The minimum required
voltage range when the argon gas started to glow (at this stage, the plasma was
produced) was between 380 and 400 V. The fibres were treated for three different
treatment times: 5, 10, and 15 min, designated as P1, P2, and P3, respectively. Plasma
treatment conditions are listed in Table 3.3.
Table 3.3 Plasma treatment conditions for flax fibres.
T (min) Temp (ºC) Gas Pressure (Pa) Gas rate (SCCM*) Voltage (V) P1 5 39 Ar 119.99-133.32 2.0 380P2 10 51 Ar 26.66 1.9 400P3 15 51 Ar 133.32-399.97 1.9 400
Note:SCCM=standard cubic centimetres per minute; P1, P2, and P3= 5, 10 and 15-minute argon plasma treated flax fibres, respectively.
34

3.7 X–Ray Diffraction (XRD)
X-ray diffraction was used in order to calculate the crystalline interplanar
distances, the crystallinity, and crystallite size of flax fibre. The degree of crystallinity
can be determined via XRD using X-ray diffraction intensity curves (Vonk 1973;
Hindeleh and Johnson 1972 and 1974). Crystallinity measurement calculations require
the separation of peaks from crystalline structure and the amorphous part; therefore,
using a fitting method is required.
In the case of flax fibre, 4 peaks and a linear function (with two parameters) were
considered; the three peaks (1, 2, and 3) were reserved for the cellulose and the fourth
peak was devoted to the amorphous phase of the flax fibre (Figure 3.9). The functional
form of the fitting equation is given by:
Figure 3.9 Peak resolution for flax fibre. Peak-1, Peak-2, and Peak-3 were considered for the cellulose and Peak-4 was assigned for the amorphous phase. A linear equation with two fitting parameters was added to the four peaks to complete the fitting function.
35
4342143421434214342143421partLinearPeak
)H
XX(
Peak
)F
XX(
Peak
)D
XX(
Peak
)B
XX(XGeEeCeAe)X(I βα +++++=
−
−−
−
−−
−
−−
−
−−
4321
24232221
, (3.3)
{ { { { 43421partLinearPeakPeakPeakPeak
XIIII)X(I βα +++++=−−−− 4
43
32
21
1 , (3.4)
where: I(X) = intensity (the number of scattered X-ray photons or counts),
A, B, C, D, E, F, G, H, α, and β = fitting parameters, and
X1, X2, X3, and X4 = the location of the four peaks, respectively (°).
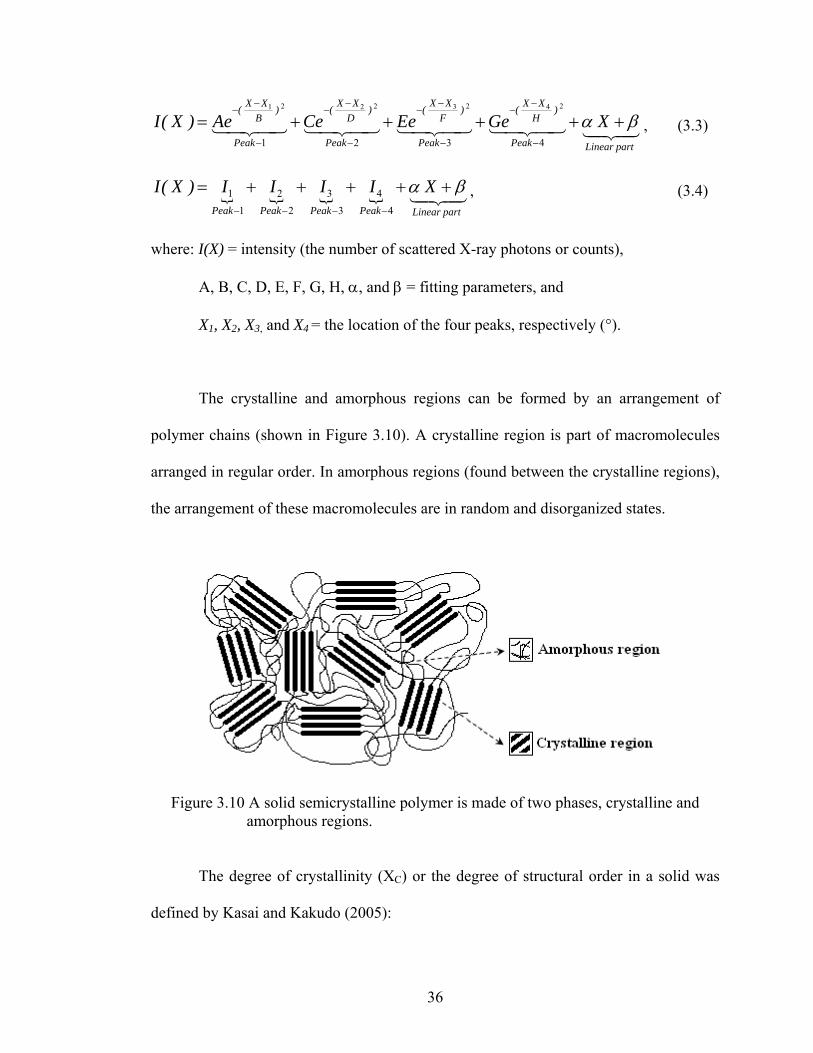
The crystalline and amorphous regions can be formed by an arrangement of
polymer chains (shown in Figure 3.10). A crystalline region is part of macromolecules
arranged in regular order. In amorphous regions (found between the crystalline regions),
the arrangement of these macromolecules are in random and disorganized states.
Figure 3.10 A solid semicrystalline polymer is made of two phases, crystalline and amorphous regions.
The degree of crystallinity (XC) or the degree of structural order in a solid was
defined by Kasai and Kakudo (2005):
36
100×=massTotal
regionsecrystallinofmassTheXc 100×=Total
partseCrystallin
SS
, (3.5)
where: 321 SSSS parts eCrystallin ++= ,
)partsAmorphous(SSS parts eCrystallinTotal 4+= ,
ds)s(IsSpS
Sii ∫=
0
2, λ
θ )sin(s 2= ,
,2,d
I
)(I)(sin)cos(1ds)s(IsS50
3i2
22
S
Si
2i
p
0
*i
p
0
θαααλ
α
α
αα =∫=∫==
= 4444 34444 21
4,3,2,1i,d)(IS50
3
*ii
p
0
=∫==
=αα
α
α, and
λ = 1.54 Å (the wave length of X -ray beam).
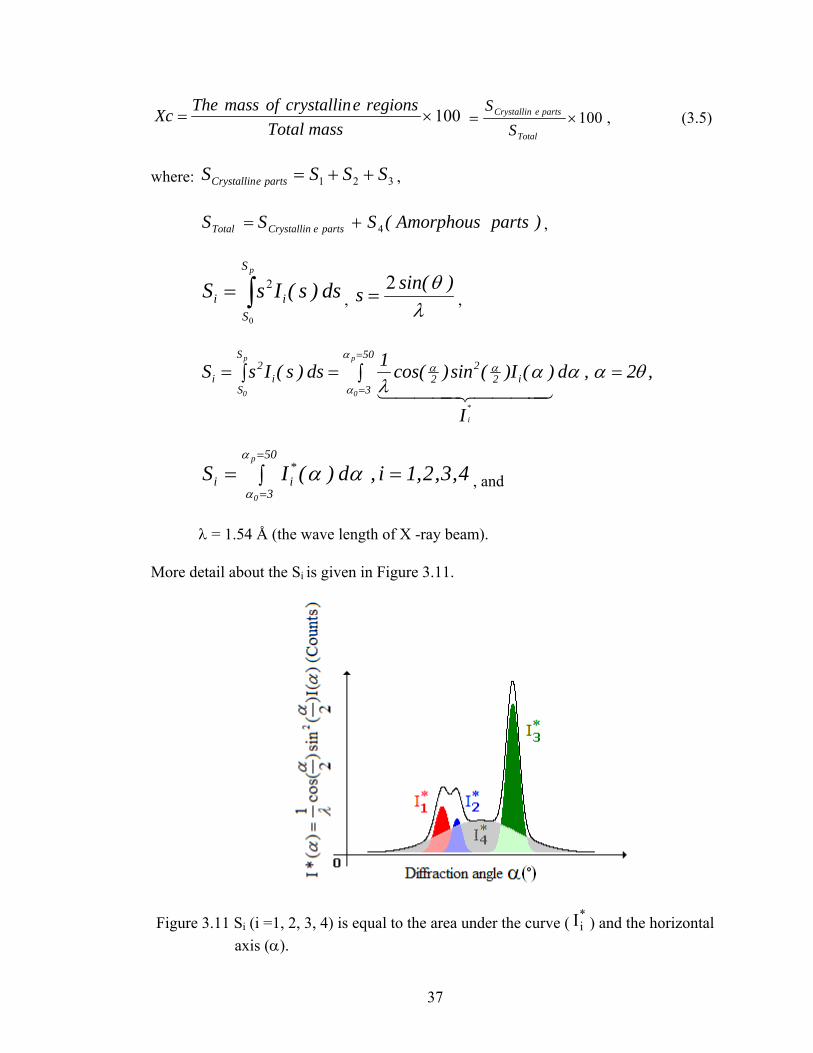
More detail about the Si is given in Figure 3.11.
Figure 3.11 Si (i =1, 2, 3, 4) is equal to the area under the curve ( ) and the horizontal *iI
axis (α).
37
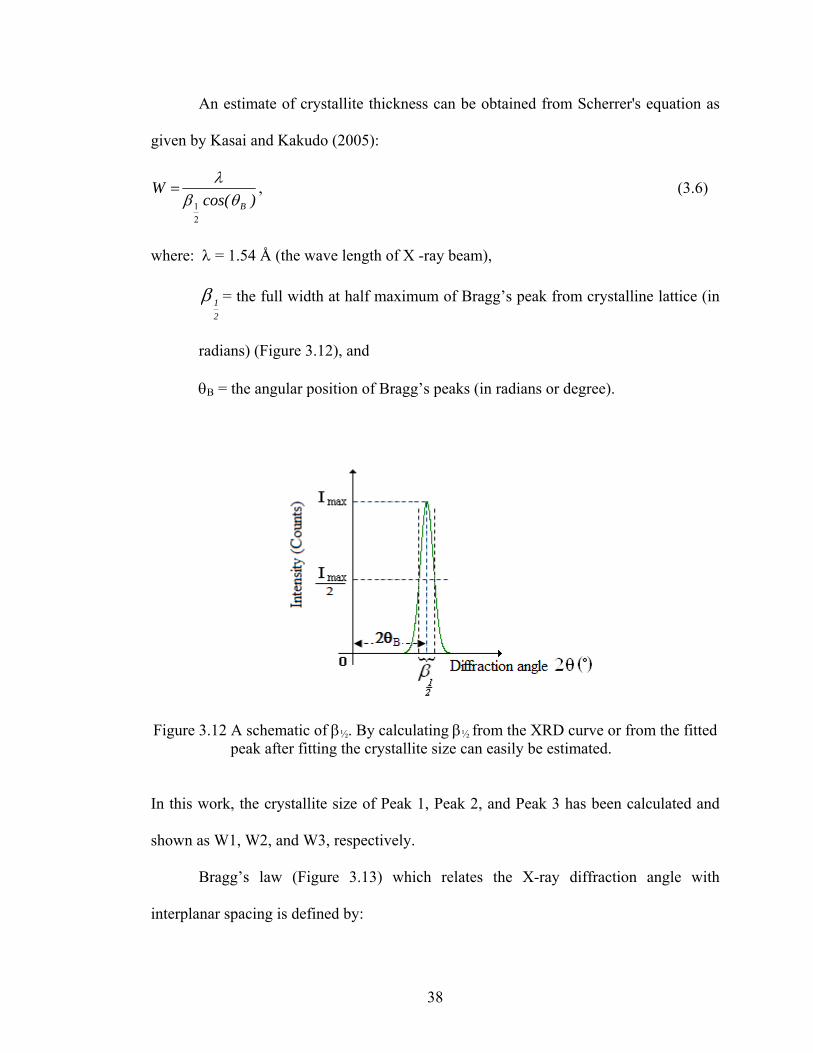
An estimate of crystallite thickness can be obtained from Scherrer's equation as
given by Kasai and Kakudo (2005):
)cos(W
Bθβλ
21
= , (3.6)
where: λ = 1.54 Å (the wave length of X -ray beam),
21β = the full width at half maximum of Bragg’s peak from crystalline lattice (in
radians) (Figure 3.12), and
θΒ = the angular position of Bragg’s peaks (in radians or degree).
Figure 3.12 A schematic of β½. By calculating β½ from the XRD curve or from the fitted peak after fitting the crystallite size can easily be estimated.
In this work, the crystallite size of Peak 1, Peak 2, and Peak 3 has been calculated and
shown as W1, W2, and W3, respectively.
Bragg’s law (Figure 3.13) which relates the X-ray diffraction angle with
interplanar spacing is defined by:
38

....3,2,1n,)(sin2
ndB
==θ
λ , (3.7)
where: λ (Å) = 1.54 (the wavelength of X - ray beam),
d = the interplanar spacing of the crystal (Å), and
θΒ = the angular position of Bragg’s peaks (in radians or degree).
Figure 3.13 Schematic of the interplanar spacing and X-ray diffraction angle.
The spacing was calculated for the three peaks 1, 2, and 3 (designated as called d1, d2,
and d3, respectively). The calculation was carried out for the first order (n=1).
The untreated and chemically/plasma treated fibres were analyzed with an X-ray
diffractometer RICAKU 200R rotating copper anode with graphite monochromator,
(RICAKU Co., Tokyo, Japan) and the wavelength was 1.54 Å (Kα). In this experiment,
the samples were scanned from 2θ =3° to 2θ =50°. TableCurve version 5.01 (Systat
Software Inc., Chicago, IL) was used for the purpose of fitting the experimental XRD
curves, and the integration limits for calculating crystallinity(Xc) were S0=0.03Å-1
(2θ =3°) and SP= 0.55Å-1 (2θ =50°). The samples were exposed to X-ray radiation at
39
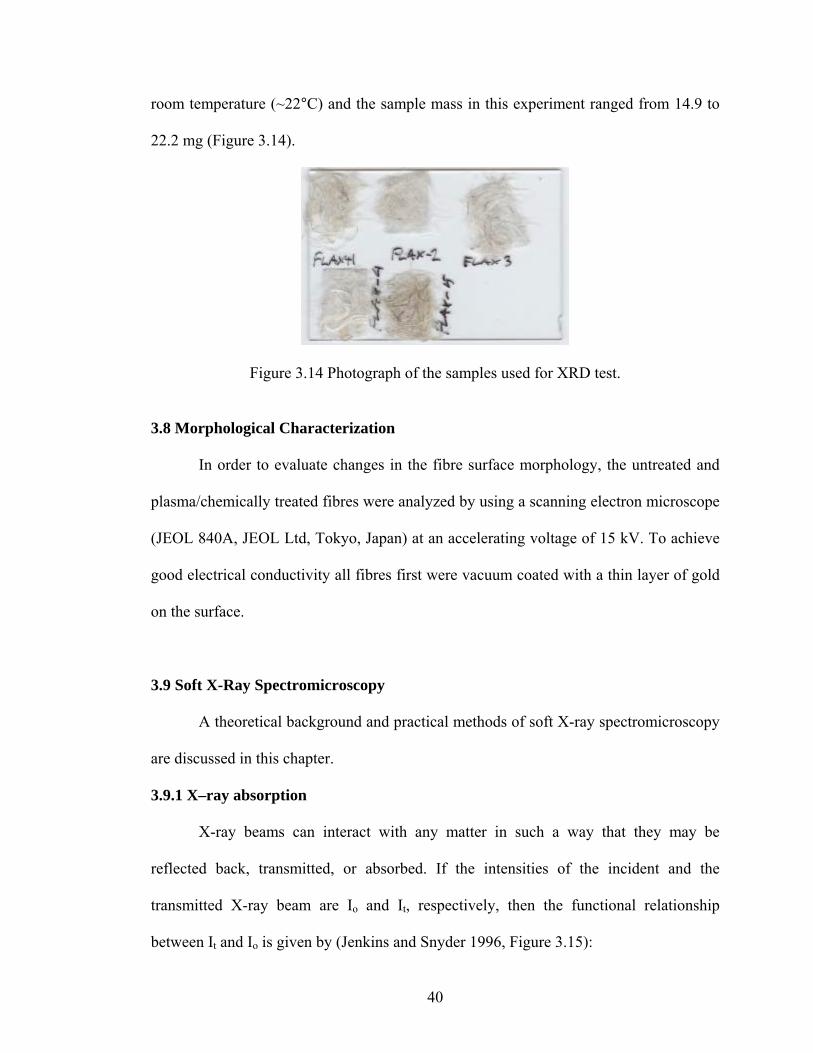
room temperature (~22°C) and the sample mass in this experiment ranged from 14.9 to
22.2 mg (Figure 3.14).
Figure 3.14 Photograph of the samples used for XRD test.
3.8 Morphological Characterization
In order to evaluate changes in the fibre surface morphology, the untreated and
plasma/chemically treated fibres were analyzed by using a scanning electron microscope
(JEOL 840A, JEOL Ltd, Tokyo, Japan) at an accelerating voltage of 15 kV. To achieve
good electrical conductivity all fibres first were vacuum coated with a thin layer of gold
on the surface.
3.9 Soft X-Ray Spectromicroscopy
A theoretical background and practical methods of soft X-ray spectromicroscopy
are discussed in this chapter.
3.9.1 X–ray absorption
X-ray beams can interact with any matter in such a way that they may be
reflected back, transmitted, or absorbed. If the intensities of the incident and the
transmitted X-ray beam are Io and It, respectively, then the functional relationship
between It and Io is given by (Jenkins and Snyder 1996, Figure 3.15):
40

Figure 3.15 Schematic showing the relationship between incident and transmitted X-ray beam intensities, through a thin slab.
x)E(ot eI)E(I ρμ−= , (3.8)
where: It(E) = transmitted X-ray intensity (the number of transmitted soft X-ray photons
or counts),
Io = incident intensity at the other side of the slab (the number of incident soft
X-ray photons or counts),
μ(Ε) = mass absorption coefficient (cm2/g),
ρ = density of material (g/cm3), and
x = the thickness of the slab exposed to the X-ray (cm).
For a sample containing many non-interacting components equation 3.8 can be written
as:
∑=
=
=
−nj
1jjjj x)E(
ot eI)E(Iρμ
(3.9)
For quantitative image analysis in soft X - ray spectromicroscopy it is common to use
optical density (OD) defined by ln(Io/It) (equation 3.10). OD and μ are defined as a
function of the energy of the X-ray beam E, in electron volts (eV).
41
∑===
=
nj
1jjjj
t
0 x)E()II
ln()E(OD ρμ (3.10)
When X-ray radiation is incident on a material, the absorbed photons can cause
excitation of the inner shell electrons of the atoms in the material (or sometimes can
ionize the atoms). Experimental work has shown that as the wavelength of the incident
X-ray increases, the value of μ also increases.
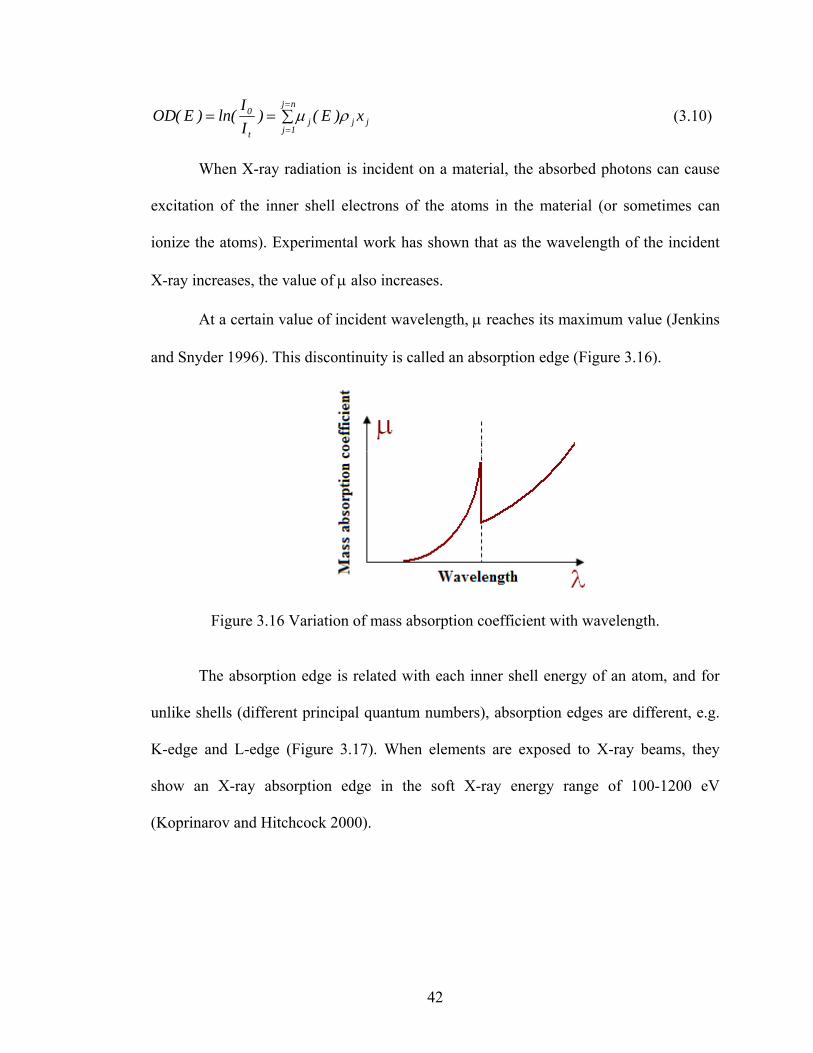
At a certain value of incident wavelength, μ reaches its maximum value (Jenkins
and Snyder 1996). This discontinuity is called an absorption edge (Figure 3.16).
Figure 3.16 Variation of mass absorption coefficient with wavelength.
The absorption edge is related with each inner shell energy of an atom, and for
unlike shells (different principal quantum numbers), absorption edges are different, e.g.
K-edge and L-edge (Figure 3.17). When elements are exposed to X-ray beams, they
show an X-ray absorption edge in the soft X-ray energy range of 100-1200 eV
(Koprinarov and Hitchcock 2000).
42
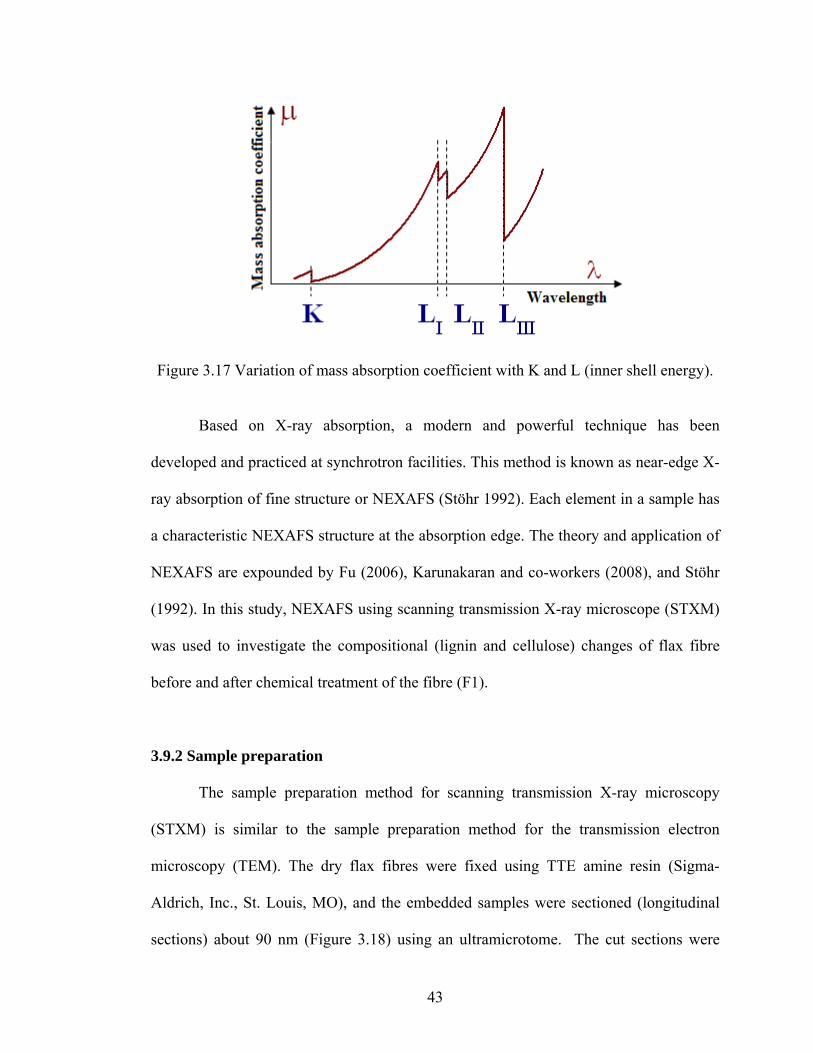
Figure 3.17 Variation of mass absorption coefficient with K and L (inner shell energy).
Based on X-ray absorption, a modern and powerful technique has been
developed and practiced at synchrotron facilities. This method is known as near-edge X-
ray absorption of fine structure or NEXAFS (Stöhr 1992). Each element in a sample has
a characteristic NEXAFS structure at the absorption edge. The theory and application of
NEXAFS are expounded by Fu (2006), Karunakaran and co-workers (2008), and Stöhr
(1992). In this study, NEXAFS using scanning transmission X-ray microscope (STXM)
was used to investigate the compositional (lignin and cellulose) changes of flax fibre
before and after chemical treatment of the fibre (F1).
3.9.2 Sample preparation
The sample preparation method for scanning transmission X-ray microscopy
(STXM) is similar to the sample preparation method for the transmission electron
microscopy (TEM). The dry flax fibres were fixed using TTE amine resin (Sigma-
Aldrich, Inc., St. Louis, MO), and the embedded samples were sectioned (longitudinal
sections) about 90 nm (Figure 3.18) using an ultramicrotome. The cut sections were
43

mounted on foamvar-coated copper grids commonly used for TEM, shown in Figure
3.19 (the optimal thickness of samples for C 1s (atomic subshell of carbon)
measurements in the transmission mode is about 100 nm). In this study, the samples
were prepared at the Microscopy Centre of McMaster University (Hamilton, ON).
Figure 3.18 Schematic showing the cross sections of samples cut (embedded in a polymer resin, the resin is not shown here) using ultramicrotome (longitudinal sections, thickness about 90 nm).
Figure 3.19 Ultrathin sections of samples on foamvar-coated copper grids.
44
In this work, the main goal was to trace the changes of both cellulose and lignin
on untreated and chemically treated flax fibres. To minimize absorption of X-rays by air
and to reduce radiation damage of the sample, the chamber containing the sample was
filled with dry helium during data collection (Karunakaran et al. 2008). One section
from each type of sample was selected for data collection in STXM.
3.9.3 Data collection and analysis
The data were collected using the STXM at the Canadian Light Source (CLS,
beamline 10ID-1) and Advanced Light Source (ALS, beamline 5.3.2) soft X-ray
spectromicroscopy beamlines. Transmitted X-ray photon was measured by single photon
counting, and counting periods (dwell times) for a point scan or a line scan were about
800 ms and 8 to 10 ms, respectively. The spectral resolving power was 3000 (E/ΔE) in
the C 1s region by controlling beamline slit sizes (Karunakaran et al. 2008).
3.10 Differential Scanning Calorimetry (DSC)
DSC measurements were completed using a differential scanning calorimeter
(DSC Q 2000, TA Instruments, New Castle, DE). The DSC system was operated in
dynamic mode with a heating temperature of 10 to 400ºC at a heating rate of 10ºC/min.
Three samples from each fibre (untreated, chemically treated, and plasma treated fibres)
were chosen, prepared, and tested (the total number of tested samples were 27). The
sample weight ranged from 5 to 10 mg and during testing, heat flow was measured as a
function of temperature or time. The moisture of the samples was measured before
testing, using a moisture determination balance (OHAUS MB200, OHAUS Scale Corp.,
45

Florham Park, NJ). The fibres were previously dried for 25 min at 85±1°C. Three
replications from each fibre were chosen and then the moisture of each was measured.
At the end, the average of these three measurements was calculated and reported as the
moisture content of the sample. The degradation temperature of each fibre sample was
obtained from second endothermic peak in the DSC thermogram. Since three
measurements were done for each sample, the degradation temperature read from the
DSC thermogram was averaged. Degradation temperatures were analyzed using analysis
of variance (ANOVA) with Duncan’s multiple range test (DMRT) to find out if the
difference between the degradation temperatures of different flax fibre samples were
statistically significant at p=0.05.
46

4. RESULTS AND DISCUSSION
This chapter discusses the effect of plasma and chemical treatments on flax
fibres. The results of tests conducted to characterize structural changes in flax fibres
before and after plasma/chemical treatment are discussed in this chapter.
4.1 Untreated Flax Fibre
Morphological characterization, fibre crystallinity and crystallite size, fibre
thickness, and fibre density for untreated flax fibres are discussed in this section.
4.1.1 Morphological characterization
SEM images of untreated fibres (F1, F2) are shown in Figure 4.1. From this
figure, it can be observed that the surface of F1 and F2 is contaminated after they have
been extracted from the plant (Shamolina et al. 2003). Single fibres in both cases are
joined with glue-like materials which hold these fibres together, and generating a fibre
bundle. The presence of these materials might increase the strength of the fibre bundle.
Figure 4.1 SEM micrographs of untreated fibres of 78.4% purity (F1) and 92.5% purity (F2).
47

4.1.2 Flax fibre crystallinity and crystallite size
As stated in part 4.1.1 two different flax fibres with different purities (F1, F2)
were used. The X-ray diffraction curves (XRD) are shown in Figure 4.2. The figure
shows both XRD curves are similar, and it does not depend on the purity of the fibres.
One may assume that high purity results in high crystallinity; however, this assumption
is not true in general. Referring to Figure 4.2, it can be observed that F1 has less
intensity than the F2 at about 19.6° (amorphous region), and therefore resulting in high
crystallinity (Table 4.2). This shows that purification of the fibre (using physical
methods) has probably increased the size of the amorphous phase, keeping in mind that
stress, compression, bending and point defects in materials change the position or the
shape of the peaks in the XRD curve (Appendix D).
Figure 4.2 XRD curves of untreated flax fibres (F1, F2).
48
49
XRD results showed that the cellulose present in all untreated flax fibres is of the
cellulose I structure (Figure 4.2).
The following discussions are made from Table 4.1 and 4.2:
1. The purification process of flax fibres did not change the interplanar spacing (d) of
cellulose (d1, d2, and d3 have similar values for both F1 and F2). In other words, the
structure of cellulose present in flax fibres before and after the purification process has
not been altered.
2. The purification process of flax fibres might affect slightly the mechanical properties
of flax fibres. By referring to Table 4.2, it can be observed that the crystallinity of F2
(with a high purity value in comparison to F1) is less than F1, indicating that the
stiffness of natural fibre depends on the content of the crystalline parts (cellulose) in the
fibre (Bledzki and Gassan 1999).

50
Table 4.1 Peak resolution (fitting parameters) for untreated flax fibres (F1, F2).
A B X1(°) C D X2(°) E F X3(°) G H X4(°) β α R2
F1 258.63 1.03 15.10 217.54 0.79 16.85 929.76 1.03 23.05 190.50 6.03 19.15 82.39 -0.19 0.99 F2 246.72 0.96 15.10 199.25 0.79 16.85 889.18 1.06 23.05 210.76 5.93 18.85 78.74 -0.09 0.99
Note: F1= untreated flax fibres with a purity of 78.4%; F2= untreated flax fibres with a purity of 92.5%; R2= coefficient of determination; A, B, C, D, E, F, G, H, α, and β = fitting parameters; X1, X2, and X3= the angular position of Bragg’s peaks; X4= the angular position of amorphous peak.
Table 4.2 Crystallite size (W), interplanar spacing (d), and crystallinity (Xc) of untreated flax fibres (F1, F2).
W1(Å) W2(Å) W3(Å) d1(Å) d2(Å) d3(Å) XC (%) F1 51.90 67.81 52.51 5.86 5.26 3.85 58.27 F2 55.68 67.81 51.02 5.86 5.26 3.85 56.21
Note: F1= untreated flax fibre with a purity of 78.4%; F2= untreated flax fibre with a purity of 92.5%.

4.1.3 Flax fibre thickness
Results showed that the average thickness of 10 samples ( d ) ranged from 30.94
to 33.16 μm and was concentrated around 32.15 μm. The functional form of the
thickness distribution for each sample was almost bell shaped (Figure 4.3) (Appendix
B). The minimum thickness (dmin) for each sample was between 10 to 11 μm, whereas
the maximum thickness (dmax) for each thickness measurement showed more variation
starting from 89.8 to 126.2 μm. More details about these measurements are provided in
Table 4.3. Flax fibre thickness has been reported to be 5 to 76 μm by Baley (2002).
Table 4.3 Thickness measurements of untreated flax fibre.
Sample 1 2 3 4 5 6 7 8 9 10 d (μm) 32.32 30.94 31.25 32.7 32.81 32.75 32.09 31.99 31.53 33.16 Std (μm) 11.89 10.84 10.79 12.1 11.59 12.58 11.45 11.27 10.61 12.29 dmax (μm) 104.2 89.8 105.5 104.8 124.8 126.2 97.4 90.4 113.6 101.7
dmin (μm) 10.5 11.0 10.7 10.5 10.7 10.4 11.2 10.6 10.8 10.8
NCF 7329 8547 10032 8478 11487 8289 6418 7665 9627 8433
Note: NCF= number of counted fibres; =d average thickness, dmin= minimum thickness; dmax= maximum thickness; Std= standard deviation.
Figure 4.3 Schematic of flax fibre thickness distribution.
51

The cross sectional area of the fibre can easily be calculated using Figure 4.3. A value
to fibre cross sectional area(A) can be assigned by:
ii
ii
ii
ii
i
fDNND
N
NDDDA ∑∑
∑===><
><= 22
2
22
,4
π , (4.3)
where: N = number of counted fibres,
Ni = the number of fibres with the thickness of Di (μm), and
fi = relative frequency.
This number might be helpful in predicting the mechanical behaviour of composites
with flax fibres (Homayonifar and Zebarjad 2007).
4.1.4 Flax fibre density
There are many problems involved in attaining a reliable value for fibre density,
for instance, the porous nature and the purity of the fibres, moisture content, and non-
uniform chemical composition in flax fibres. The actual density of flax fibres has been
measured by many researchers. Baley (2002) has used a volumetric method to measure
the density for flax fibres. He has reported 1.53 (g/cm3) for fibre density. Siaotong
(2006) has reported 1.618 (g/cm3) for the actual density of ground flax fibre. In this
work, 1.39 (g/cm3) was obtained for the actual density of fibre using a gas-operated
pycnometer (Table 4.4)
Table 4.4 The actual density of flax fibre.
Actual density (g/cm3)+ Std*
1.39 0.06 * standard deviation
+ average of 3 measurements
52
4.2 Chemical Modification of Flax Fibre
Chemical treatment caused many changes in the untreated flax fibres with a
purity of 78.4% (F1). These changes were:
1. removal of non-cellulosic materials resulting in weight loss (Table 4.5);
2. improvement of the fineness of the fibres so that they could easily be separated
resulting in a decrease of fibre bundle tensile strength;
3. change in structure, e.g. crystallinity; and
4. change in color.
The weight loss values of the fibres after chemical treatment is shown in Table 4.5.
From Table 4.5, it can be concluded that there were no significant changes in weight loss
after 1, 2, 3, and 4 h of chemical treatment.
Table 4.5 Weight loss of the flax fibres after chemical treatment at different times.
Sample T1 T2 T3 T4
Weight loss (%db) 10.70 9.03 10.79 11.35
Note: T1, T2, T3, and T4 = 1, 2, 3, and 4-hour chemically treated flax fibres, respectively.
4.2.1 Morphological characterization
Figure 4.4 shows three images of untreated flax fibres with a purity of 78.4% (F1).
It can be seen that some other materials (glue-like) adhered to the fibres. These materials
may cause weak interfacing with polymer in the case of biocomposites.
53

Figure 4.4 Longitudinal SEM photographs of untreated flax fibres of 78.4% purity (F1). Non-cellulosic materials can be seen on the surface of untreated flax fibres.
Figure 4.5 shows images of chemically treated fibres at different treatment times. The
surface of all fibres are cleaned; glue-like materials or non-cellulosic materials are
removed from the cracks present on the fibre surface and between fibres (Figure 4.5 (T1)
and 4.4 (1)). Cleaning cracks causes good mechanical bonding between fibre and the
matrix in biocomposites Morphological and structural changes of flax fibres have been
studied by a number of researchers, e.g. a fibre bundle splitting and fibre surface
cleaning in flax fibres after exposing to both alcohol and chemical treatments have been
reported by Shamolina and co-workers (2003). Referring to Figure 4.5, it can be
observed that fibrillar units have appeared clearly on the surface of fibres after chemical
treatment.
54

Figure 4.5 Longitudinal SEM photographs of chemically treated flax fibres at different durations: 1, 2, 3, and 4 h shown as T1, T2, T3, and T4, respectively. After chemical treatments the surface of the fibres were cleaned and fibrillar units were appeared.
4.2.2 Crystallinity
The diffraction curves of untreated/chemically treated fibres are shown in Figure
4.6; peak resolution, crystallite size, interplanar spacing, and crystallinity are reported in
Table 4.6, Table 4.7, and Appendix A. As can be observed from Figure 4.6, slight
changes in intensity have occurred to the fibres after treatment are reflected mostly on
peak 3. From this figure, it can be concluded that the cellulose present in treated flax
fibres is of the cellulose I structure, and it means that chemical treatment has not
changed the structure of the cellulose. Mercerization can change the structure of
cellulose from cellulose I to cellulose II, e.g. a gradual change from cellulose I to
cellulose II in the structure of chemically treated flax fibres after increasing the
concentration of sodium hydroxide have been reported by Sharma and van Sumere
(1992).
55
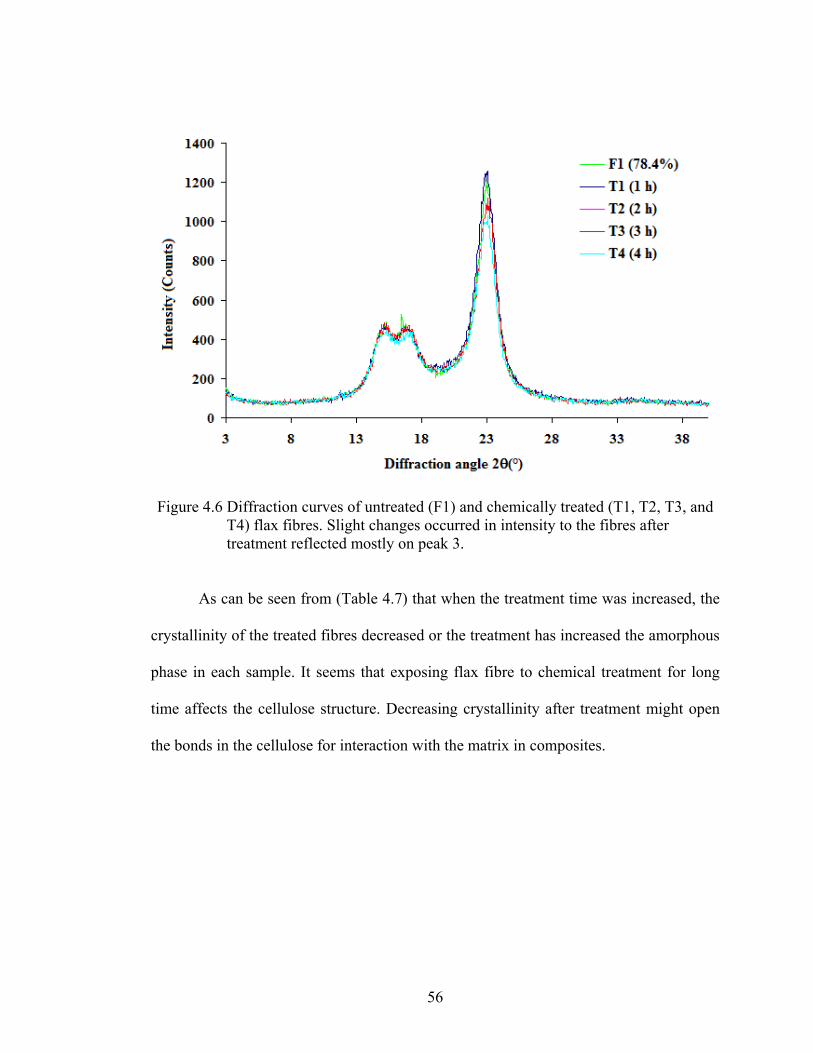
56
Figure 4.6 Diffraction curves of untreated (F1) and chemically treated (T1, T2, T3, and T4) flax fibres. Slight changes occurred in intensity to the fibres after treatment reflected mostly on peak 3.
As can be seen from (Table 4.7) that when the treatment time was increased, the
crystallinity of the treated fibres decreased or the treatment has increased the amorphous
phase in each sample. It seems that exposing flax fibre to chemical treatment for long
time affects the cellulose structure. Decreasing crystallinity after treatment might open
the bonds in the cellulose for interaction with the matrix in composites.

57
Table 4.6 Peak resolution (fitting parameters) for untreated and chemically treated flax fibres.
A B X1(°) C D X2(°) E F X3(°) G X4(°) H β α R2
F1 258.63 1.03 15.10 217.54 0.79 16.85 929.76 1.03 23.05 190.50 19.15 6.03 82.39 -0.19 0.99 T1 246.26 1.11 15.20 180.30 0.73 16.85 961.44 1.03 23.05 217.41 19.40 5.8 81.78 -0.12 0.99 T2 258.70 1.05 15.2 197.98 0.79 16.85 842.80 1.02 23.05 201.04 19.40 5.95 82.47 -0.29 0.99 T3 258.22 1.08 15.15 193.02 0.81 16.85 900.76 1.03 23.15 212.75 19.55 5.55 75.86 -0.09 0.99 T4 248.25 1.11 15.15 166.71 0.78 16.85 739.19 1.04 23.15 205.7 19.55 5.27 89.13 -0.40 0.98
Note: R2= coefficient of determination; F1= untreated flax fibres with a purity of 78.4%; T1, T2, T3, and T4 = 1, 2, 3, and 4-hour chemically treated flax fibres, respectively; A, B, C, D, E, F, G, H, α, and β = fitting parameters; X1, X2, and X3= the angular position of Bragg’s peaks; X4= the angular position of amorphous peak.
Table 4.7 Crystallite size (W), interplanar spacing (d), and crystallinity (Xc) of untreated and chemically treated flax fibres. The crystallinity of chemically treated flax fibres decreased when the treatment time increased.
W1(Å) W2(Å) W3(Å) d1(Å) d2(Å) d3(Å) XC (%) F1 51.90 67.81 52.51 5.86 5.26 3.85 58.27 T1 48.16 73.38 52.51 5.82 5.26 3.85 55.81 T2 50.91 67.81 53.02 5.82 5.26 3.85 54.47 T3 49.50 66.13 52.52 5.84 5.26 3.84 56.31 T4 48.16 68.68 52.01 5.84 5.26 3.84 54.38
Note: F1= untreated flax fibres with a purity of 78.4%; T1, T2, T3, and T4 = 1, 2, 3, and 4-hour chemically treated flax fibres, respectively.

4.2.3 Color analysis
Experimental results for the response variable ΔE (color index) at different
treatment times and for untreated flax fibres with a purity of 78.4% (F1) are presented in
Table 4.7. HunterLab values L, a, and b are averages of twelve values (three replications
with four readings for each replication). The last three columns in Table 4.8 are devoted
to RGB values, obtained from HunterLab values L, a, and b. The color test results (Table
4.8 and Table 4.9) showed that after treatment, the fibres became lighter, and the lightest
color belonged to fibres which were chemically treated for two hours (ΔE=9). In other
words, when the treatment time increased, the color of the fibres became darker again
(ΔE ). The real color of each fibre detected by the spectrocolorimeter is shown in Figure
4.7, keeping in mind that any RGB value corresponds to a color, and again by looking
carefully at these colors, one can observe that T2 has the lightest color. The yellow color
of flax fibres is attributed to the presence of non-cellulosic materials in flax fibres and
therefore, the fibres become lighter when the chemical treatment of fibres removes these
materials (Reddy and Yang 2005).
Table 4.8 Color coordinates (L, a, and b) and RGB values of untreated and chemically treated flax fibres.
L a b Sample Mean Std Mean Std Mean Std
R G B
F1 54.65 1.29 2.49 0.23 10.81 0.36 167 144 130 T1 62.15 1.28 1.09 0.13 8.41 0.28 181 164 156 T2 63.69 0.89 1.15 0.12 8.78 0.23 185 167 159 T3 61.35 1.45 1.15 0.14 8.41 0.18 179 162 154 T4 61.31 2.25 1.22 0.20 8.42 0.40 179 161 154
Note: Std= standard deviation; F1= untreated flax fibre of 78.4% purity; T1, T2, T3, and T4 = 1, 2, 3, and 4-hour chemically treated flax fibres, respectively; R= red; G= green; B= blue.
58

Table 4.9 Color index (ΔE) of chemically treated flax fibres.
Sample ΔΕ T1 7.99 T2 9.36 T3 7.24 T4 7.19
Note: T1, T2, T3, and T4 = 1, 2, 3, and 4-hour chemically treated flax fibres, respectively.
F1 T1 T2 T3 T4
Figure 4.7 Color of untreated and chemically treated flax fibres acquired from RGB
values.
4.2.4 Tensile strength
Three different stress-strain curves for flax fibres (observed in this experiment
for untreated and chemically treated fibres with different diameters) loaded to the point
of breaking are given in Figure 4.8. Figure 4.8 (1) shows a stress-strain curve of flax
fibre with almost elastic behaviour (Hookean behaviour). Stress-strain curves for many
samples showed a positive and increasing slope (Figure 4.8(2)). One possible
explanation for this behaviour is that in the unstrained fibre, microfibrils present in the
cell walls are not aligned in the axial direction and after applying the load, they
progressively become realigned in the axis of tension and resulted in increased fibre
stiffening (Hornsby et al. 1997). In Figure 4.8(3), the fibre gave four failure peaks before
total failure (E1>E2>E3>E4). Two suggestions for this phenomenon are: 1) the sample
is not a single fibre because it is actually a fibre bundle made of many tiny fibres; and 2)
this shows the structure of flax fibre is a layered wall; in fact, the fibre is assumed to be
a composite material (Hornsby et al. 1997).
59
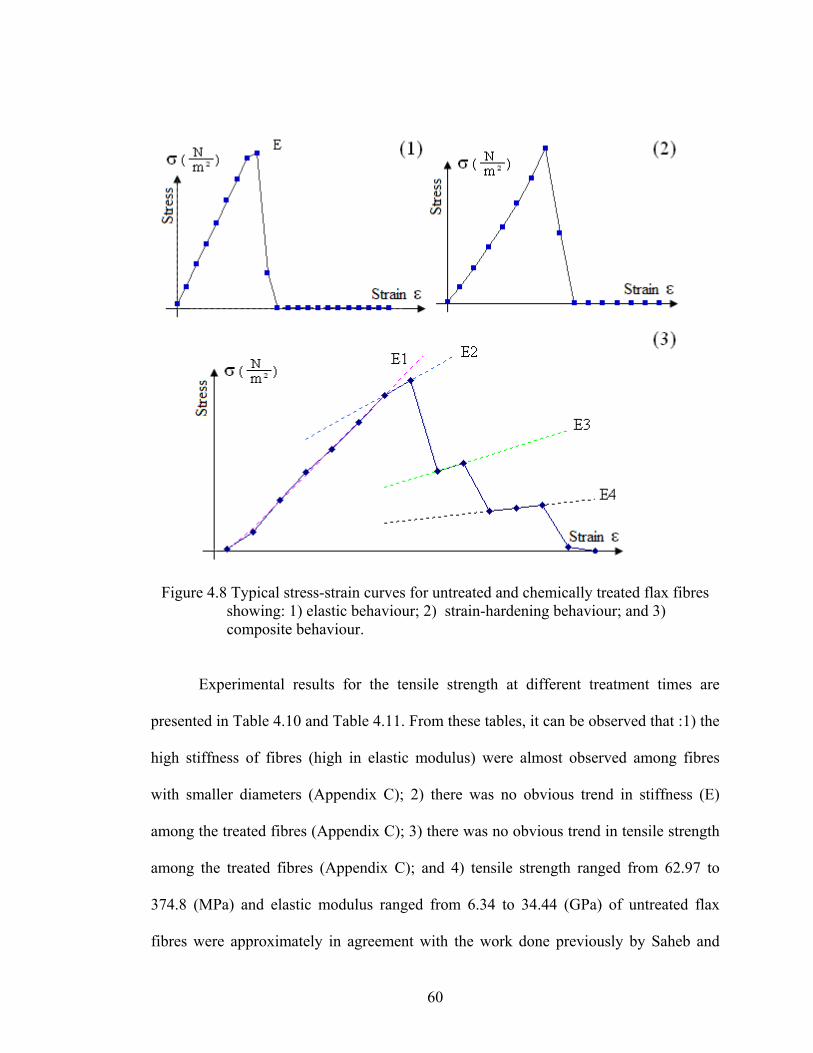
Figure 4.8 Typical stress-strain curves for untreated and chemically treated flax fibres showing: 1) elastic behaviour; 2) strain-hardening behaviour; and 3) composite behaviour.
Experimental results for the tensile strength at different treatment times are
presented in Table 4.10 and Table 4.11. From these tables, it can be observed that :1) the
high stiffness of fibres (high in elastic modulus) were almost observed among fibres
with smaller diameters (Appendix C); 2) there was no obvious trend in stiffness (E)
among the treated fibres (Appendix C); 3) there was no obvious trend in tensile strength
among the treated fibres (Appendix C); and 4) tensile strength ranged from 62.97 to
374.8 (MPa) and elastic modulus ranged from 6.34 to 34.44 (GPa) of untreated flax
fibres were approximately in agreement with the work done previously by Saheb and
60

61
Jog (1999), e.g. 344 (MPa) and 27 (GPa), for tensile strength and elastic modulus,
respectively.
Fibre fineness of chemically treated flax fibres increased (they could easily be
separated). In general, a bundle of single fibres is made of short and long fibres which
are stuck to each other with glue-like materials especially pectin and lignin, and
removing these materials from a bundle might decrease its strength.

62
Table 4.10 Mechanical properties of untreated and chemically treated flax fibres.
Sample Fibre diameter (μm) Elastic modulus(GPa) Min Max Mean Std Min Max Mean Std
F1 67 211.11 122.96 38.85 6.34 34.44 16.55 8.85T1 57.11 212.56 121.03 44.56 4.15 20.18 11.88 5.33 T2 109.33 225.78 154.26 31.71 7.55 16.48 11.30 3.18 T3 86.67 161.17 124.98 27.70 4.84 29.88 13.08 7.91 T4 96 186.33 133.07 30.12 8.08 18.05 12.69 3.02
Note: Std = standard deviation; F1= untreated flax fibre with a purity of 78.4%; T1, T2, T3, and T4 = 1, 2, 3, and 4-hour chemically treated flax fibres, respectively; E = elastic modulus; D = the diameter of fibre.
Table 4.11 Tensile strength (TS) of untreated/chemically treated flax fibres.
Sample Tensile strength (MPa) Min Max Mean Std
F1 62.97 374.8 161.57 87.43 T1 23.75 340.94 105.16 88.39 T2 70.55 179.13 113.61 31.71 T3 53.97 453.08 142.79 125.41T4 55.33 182.69 126.88 39.48
Note: Std= standard deviation; F1= untreated flax fibre with a purity of 78.4%; T1, T2, T3, and T4 = 1, 2, 3, and 4-hour chemically treated flax fibres, respectively.

4.2.5 Soft x - ray spectromicroscopy
Soft x-ray spectromicroscopy was used to investigate the chemical components
and structure of untreated/chemically treated flax fibres. This method was also applied in
studying the interfacial compatibility of untreated/chemically treated flax fibres (F1, T1,
T2, T3, and T4) and resin.
The resin spectra extracted from the samples (shown with a small circle and the
letter R, e.g. in Figure 4.10b the circle has a red color) are given in Figure 4.9. Three
different images for each fibre (F1 (untreated), T1, T2, T3, and T4) are obtained from X-
ray absorption near edge structure (NEXAFS) data. The first figure (a) (e.g. Figure
4.10a) shows the spectra extracted from each sample (optical density versus photon
energy) and any spectrum is presented with a color relating to the concentration of
cellulose inside the sample (keeping in mind that higher cellulose concentration causes
higher optical density). The spectrum of the resin is included in this figure as well (e.g.
the yellow spectrum in Figure 4.10a). The second figure (b) (e.g. Figure 4.10b) shows a
picture of the scanned sample. The distribution of cellulose inside the scanned sample is
exhibited with different colors in the third figure (c) (e.g. Figure 4.10c). When
comparing the spectra of resin and cellulose, it can be observed that the resin spectra
show a small shoulder before the first peak e.g. in Figure 4.9 the shoulder is located
between 285 and 290 eV (the dashed circle). The appearance of a small peak around 285
eV in the cellulose spectrum can be attributed to the existence of aromatic compounds
such as lignin and β-glucan (lignin and β-glucan show a strong absorption peak at 285.2
eV). The only trace of lignin was observed in the sample chemically treated for one hour
63
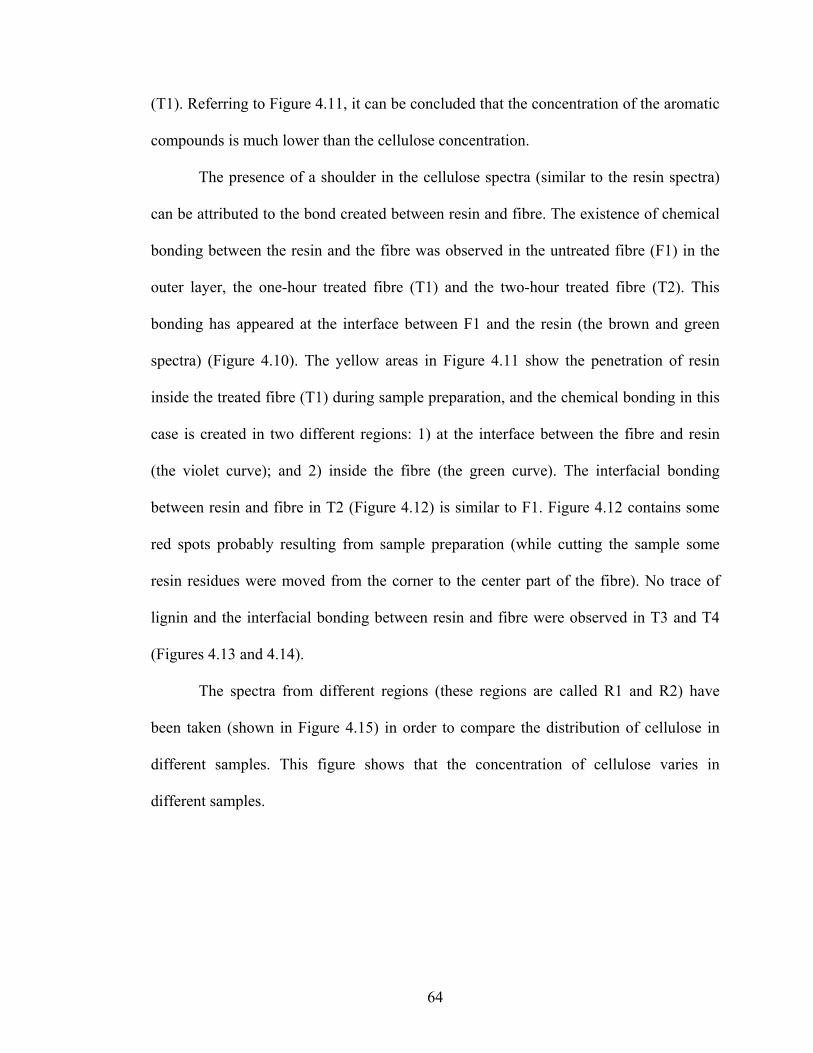
(T1). Referring to Figure 4.11, it can be concluded that the concentration of the aromatic
compounds is much lower than the cellulose concentration.
The presence of a shoulder in the cellulose spectra (similar to the resin spectra)
can be attributed to the bond created between resin and fibre. The existence of chemical
bonding between the resin and the fibre was observed in the untreated fibre (F1) in the
outer layer, the one-hour treated fibre (T1) and the two-hour treated fibre (T2). This
bonding has appeared at the interface between F1 and the resin (the brown and green
spectra) (Figure 4.10). The yellow areas in Figure 4.11 show the penetration of resin
inside the treated fibre (T1) during sample preparation, and the chemical bonding in this
case is created in two different regions: 1) at the interface between the fibre and resin
(the violet curve); and 2) inside the fibre (the green curve). The interfacial bonding
between resin and fibre in T2 (Figure 4.12) is similar to F1. Figure 4.12 contains some
red spots probably resulting from sample preparation (while cutting the sample some
resin residues were moved from the corner to the center part of the fibre). No trace of
lignin and the interfacial bonding between resin and fibre were observed in T3 and T4
(Figures 4.13 and 4.14).
The spectra from different regions (these regions are called R1 and R2) have
been taken (shown in Figure 4.15) in order to compare the distribution of cellulose in
different samples. This figure shows that the concentration of cellulose varies in
different samples.
64

65
Figure 4.9 Spectra extracted from the resin region in different treatments. The dashed
circle shows the presence of a shoulder in resin spectra extracted from different samples.
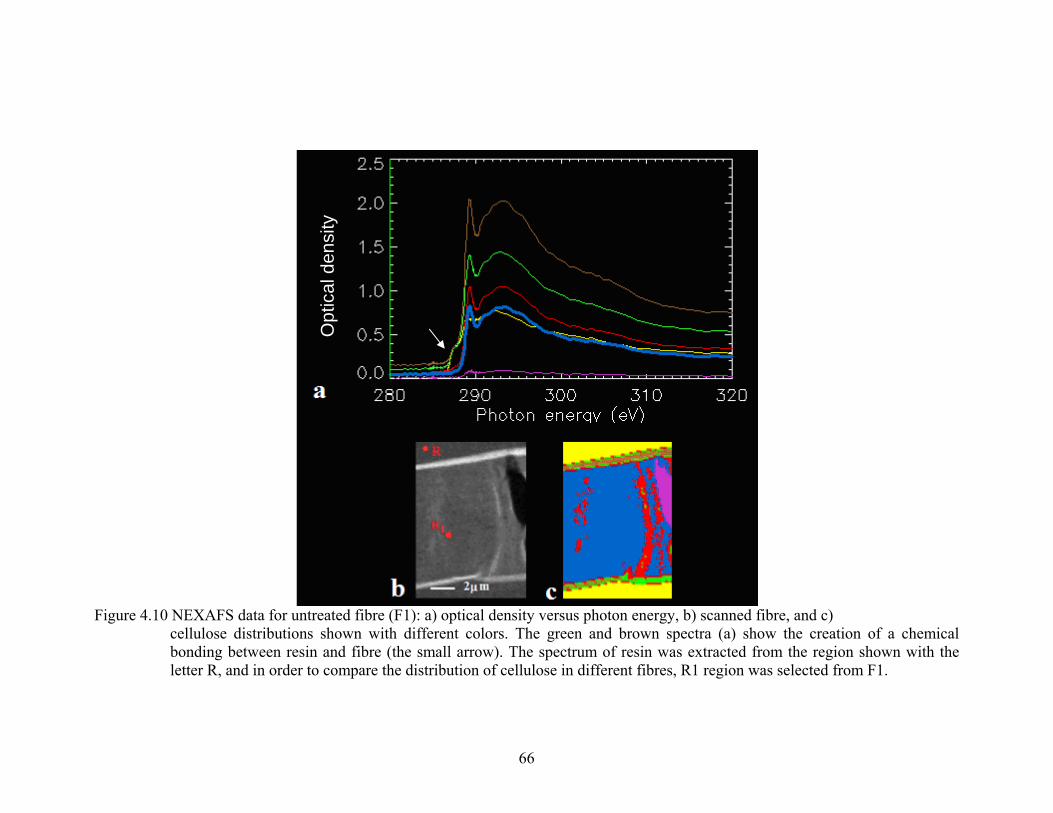
Opt
ical
den
sity
Figure 4.10 NEXAFS data for untreated fibre (F1): a) optical density versus photon energy, b) scanned fibre, and c) cellulose distributions shown with different colors. The green and brown spectra (a) show the creation of a chemical bonding between resin and fibre (the small arrow). The spectrum of resin was extracted from the region shown with the letter R, and in order to compare the distribution of cellulose in different fibres, R1 region was selected from F1.
66

Opt
ical
den
sity
Figure 4.11 NEXAFS data for one-hour chemical treated fibre (T1): a) optical density versus photon energy, b) scanned fibre, and c) cellulose distributions shown with different colors. The only trace of resin was observed in this sample (the dashed circle). The interaction between fibre and resin were appeared in two different regions (the green and violet spectra). The yellow areas show the penetration of resin inside the treated fibre. The spectrum of resin was extracted from the region shown with the letter R, and in order to compare the distribution of cellulose in different fibres, R1 and R2 regions were selected from T1.
67

Opt
ical
den
sity
Figure 4.12 NEXAFS data for two-hour chemical treated fibre (T2): a) optical density versus photon energy, b) scanned fibre, and c) cellulose distributions shown with different colors. The green spectrum (a) shows the existence of interfacial boding between resin and fibre. The spectrum of resin was extracted from the region shown with the letter R, and in order to compare the distribution of cellulose in different fibres, R1 region was selected from T2.
68
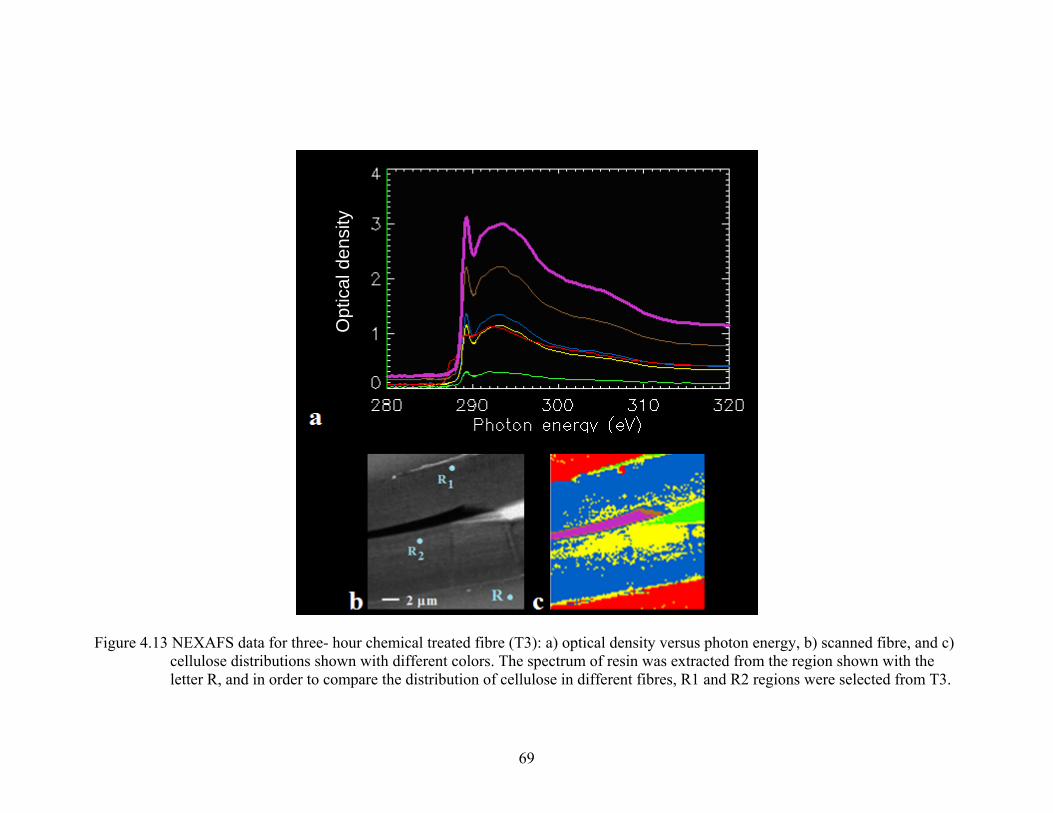
Opt
ical
den
sity
Figure 4.13 NEXAFS data for three- hour chemical treated fibre (T3): a) optical density versus photon energy, b) scanned fibre, and c) cellulose distributions shown with different colors. The spectrum of resin was extracted from the region shown with the letter R, and in order to compare the distribution of cellulose in different fibres, R1 and R2 regions were selected from T3.
69
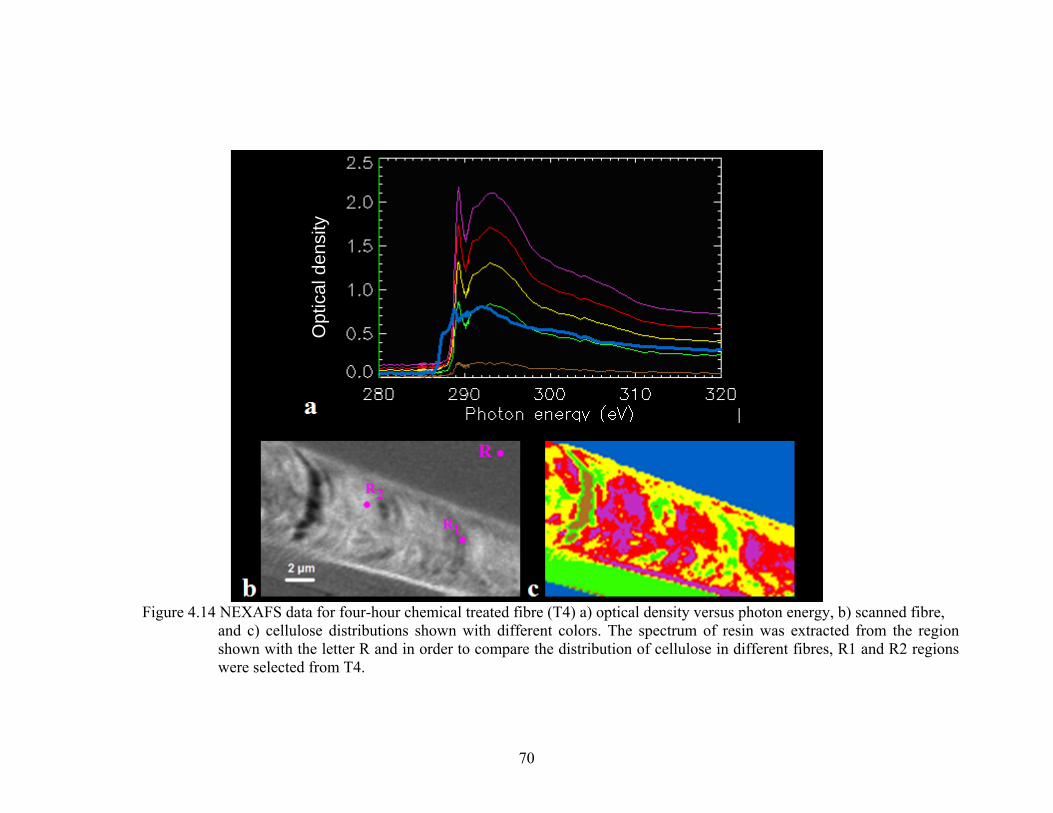
70
Figure 4.14 NEXAFS data for four-hour chemical treated fibre (T4) a) optical density versus photon energy, b) scanned fibre,
and c) cellulose distributions shown with different colors. The spectrum of resin was extracted from the region shown with the letter R and in order to compare the distribution of cellulose in different fibres, R1 and R2 regions were selected from T4.
Opt
ical
den
sity

Figure 4.15 A comparison between the distribution of cellulose in different samples. Spectra extracted from different regions (R1, R2) in the untreated and chemically treated fibres. Some treatments only one spectrum and for others two spectra were extracted.
4.3 Plasma Treatment of Flax Fibre
In this chapter, the structural changes of flax fibres after exposure to argon
plasma treatment are studied using scanning electron microscopy (SEM) and X-ray
diffraction methods.
4.3.1 Morphological characterization
SEM images of argon plasma treated flax fibres (Figure 4.16) illustrate a
progressive change of the surface morphology as a function of time. For a 5-min
71

treatment, the change is not distinguishable from the untreated sample (Figure 4.16, P1
and F2) but some changes (etching patterns) begin to appear on the surface after plasma
treatment for 10 or more than 10 min (Figure 4.16, P2 and P3), and after 15 min of
treatment, almost one layer of the fibre has separated.
Figure 4.16 Longitudinal SEM photographs of 1) untreated flax fibre (F2, 92.5% purity) and 2) 5, 10, and 15-minute plasma treated flax fibres shown as P1, P2, and P3, respectively. Etching patterns appeared after 10 min treatment (P2) and one layer of the fibre was separated after 15 min treatment (P3).
Changes in the morphology of the flax fibres after being exposed to oxygen and
argon plasma treatment have been studied by Wong and co-workers (2000). They
reported the formation of cracks and voids on the surface of flax fibre due to the plasma
erosion. They also reported that as the treatment time increased, the depth of voids
etched by the plasma increased with pore width.
72

4.3.2 Crystallinity
The diffraction pictures of untreated/plasma treated fibres and other information
such as peak resolution, crystallite size, interplanar spacing, and crystallinity are
reported in Figure 4.17, Table 4.12, and Table 4.13, respectively. The effect of plasma
treatment on fibres can clearly be observed from the diffraction pictures, and especially
the changes on the amorphous region are very significant. The angular position of the
peaks at different treatment times was encountered with little variation. The crystallinity
of the fibres decreased, but the structure of the cellulose was untouched (cellulose I
structure).
Figure 4.17 XRD curves of untreated (F2) and plasma treated fibres (P1, P2, and P3).
73
74
Studies of plasma treatment effects on the crystallinity of natural fibre have been
reported by various researchers. Khammatova (2005) reported a significant increase in
both crystallinity and the regions of coherent scattering of flax fibres treated by high-
frequency capacitive discharge plasma (HFC) with air as a plasma-forming gas. The
fibres were treated for around 180 to 720 s. The effect of oxygen plasma treatment on
bombyx mori silk fibres has been studied by Chen and co-workers (2004). The fibres
were treated at times of 10 and 30 min. Their result showed that the crystallinity of the
fibres decreased in both cases.

75
Table 4.12 Peak resolution (fitting parameters) for plasma treated flax fibres.
A B X1(°) C D X2(°) E F X3(°) G X4(°) H β α R2
F2 246.72 0.96 15.10 199.25 0.79 16.85 889.18 1.06 23.05 210.76 18.85 5.93 78.70 -0.09 0.99 P1 304.06 1.18 15.20 179.13 0.66 16.85 901.22 1.14 22.95 301.23 19.1 5.24 122.30 0.14 0.98 P2 363.17 1.22 15.20 230.08 0.74 16.95 909.85 1.06 23.1 355.42 19.1 5.61 180.31 -1.67 0.99 P3 161.45 1.03 15.20 109.67 0.69 16.95 587.01 1.17 23 268.95 19.1 5.42 123.77 0.04 0.98 Note: R2= coefficient of determination; F2= untreated flax fibres with a purity of 92.5%; P1, P2, and P3= 5, 10 and 15-minute argon plasma treated flax fibres, respectively; A, B, C, D, E, F, G, H, α, and β = fitting parameters; X1, X2, and X3= the angular position of Bragg’s peaks; X4= the angular position of amorphous peak.
Table 4.13 Crystallite size (W), interplanar spacing (d) and crystallinity (Xc) of untreated and plasma treated flax fibres. The crystallinity of argon plasma treated fibres decreased when the treatment time increased.
W1(Å) W2(Å) W3(Å) d1(Å) d2(Å) d3(Å) XC (%) F2 55.68 67.81 51.02 5.86 5.26 3.85 56.21 P1 45.31 81.17 47.43 5.82 5.26 3.87 52.35 P2 43.82 72.40 51.02 5.82 5.22 3.85 46.73 P3 51.90 77.65 46.22 5.82 5.22 3.86 43.31
Note: F2= untreated flax fibres with a purity of 92.5%; P1, P2, and P3= 5, 10 and 15-minute argon plasma treated flax fibres, respectively.
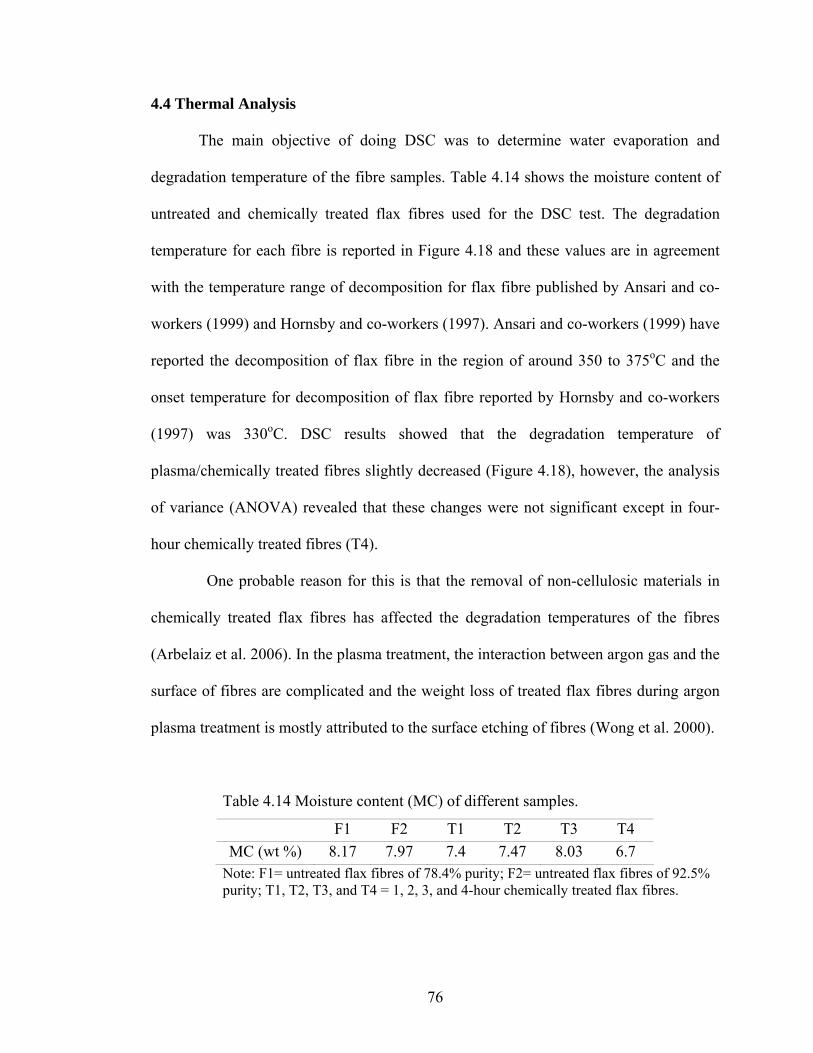
4.4 Thermal Analysis
The main objective of doing DSC was to determine water evaporation and
degradation temperature of the fibre samples. Table 4.14 shows the moisture content of
untreated and chemically treated flax fibres used for the DSC test. The degradation
temperature for each fibre is reported in Figure 4.18 and these values are in agreement
with the temperature range of decomposition for flax fibre published by Ansari and co-
workers (1999) and Hornsby and co-workers (1997). Ansari and co-workers (1999) have
reported the decomposition of flax fibre in the region of around 350 to 375oC and the
onset temperature for decomposition of flax fibre reported by Hornsby and co-workers
(1997) was 330oC. DSC results showed that the degradation temperature of
plasma/chemically treated fibres slightly decreased (Figure 4.18), however, the analysis
of variance (ANOVA) revealed that these changes were not significant except in four-
hour chemically treated fibres (T4).
One probable reason for this is that the removal of non-cellulosic materials in
chemically treated flax fibres has affected the degradation temperatures of the fibres
(Arbelaiz et al. 2006). In the plasma treatment, the interaction between argon gas and the
surface of fibres are complicated and the weight loss of treated flax fibres during argon
plasma treatment is mostly attributed to the surface etching of fibres (Wong et al. 2000).
Table 4.14 Moisture content (MC) of different samples.
F1 F2 T1 T2 T3 T4 MC (wt %) 8.17 7.97 7.4 7.47 8.03 6.7
Note: F1= untreated flax fibres of 78.4% purity; F2= untreated flax fibres of 92.5% purity; T1, T2, T3, and T4 = 1, 2, 3, and 4-hour chemically treated flax fibres.
76

Figure 4.18 Degradation temperatures of untreated, plasma, and chemically treated flax fibres; a, b, and c mean that all samples with the same letter designation are not statistically different by Duncan’s multiple range test. In this experiment 1) T1, T2, T3, and T4 were compared with F1 (designated by a and b) and 2) P1, P2, and P3 were compared with F2 (designated by c).
Water evaporation temperature measurements from the DSC thermogram
presented conflicting values for each sample (Appendix E). It seems that the first
endothermic peak belongs to water evaporation temperature (Ansari et al. 1999) and this
temperature for flax fibres reported by Ansari and co-workers (1999) was below 71oC.
In Figure 4.19 and 4.20, the aquamarine curves (labelled as a dried fibre) show the DSC
thermograms of the dried untreated flax fibres of 92.5% purity (F2) and four-hour
chemical treated flax fibres. It can be seen that in both samples (F2 and T4), the first
endothermic peak has disappeared after the drying process.
77
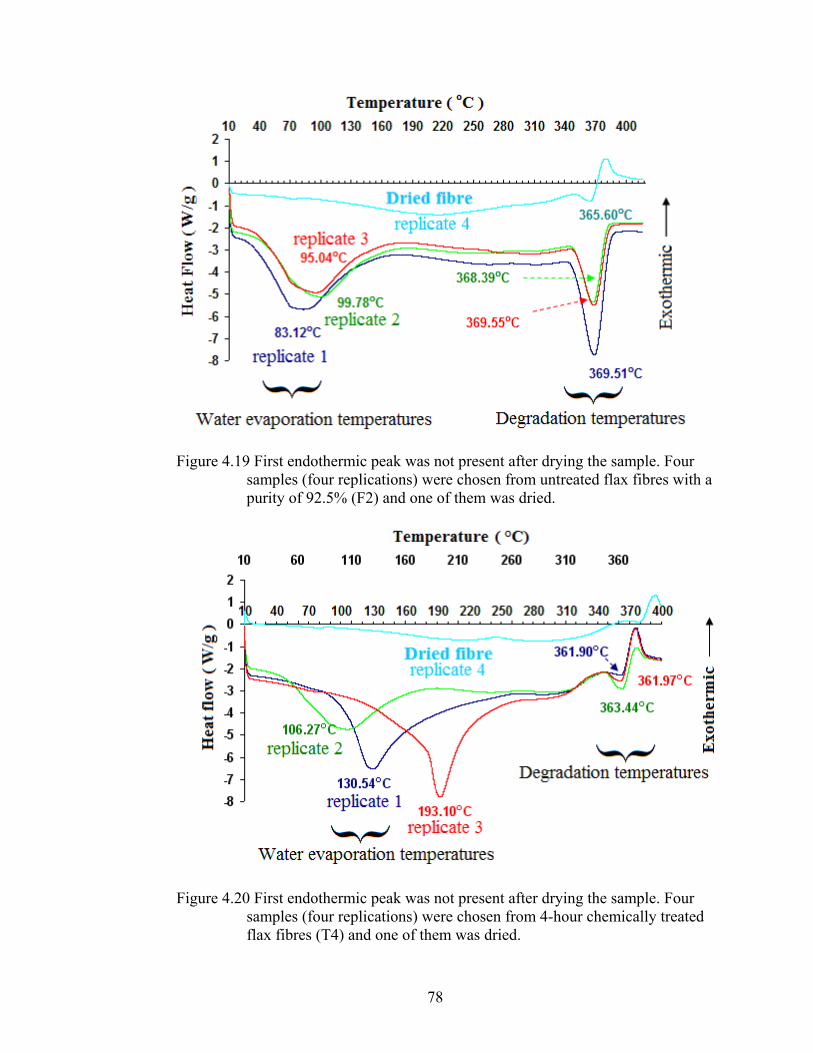
Figure 4.19 First endothermic peak was not present after drying the sample. Four samples (four replications) were chosen from untreated flax fibres with a purity of 92.5% (F2) and one of them was dried.
Figure 4.20 First endothermic peak was not present after drying the sample. Four samples (four replications) were chosen from 4-hour chemically treated flax fibres (T4) and one of them was dried.
78
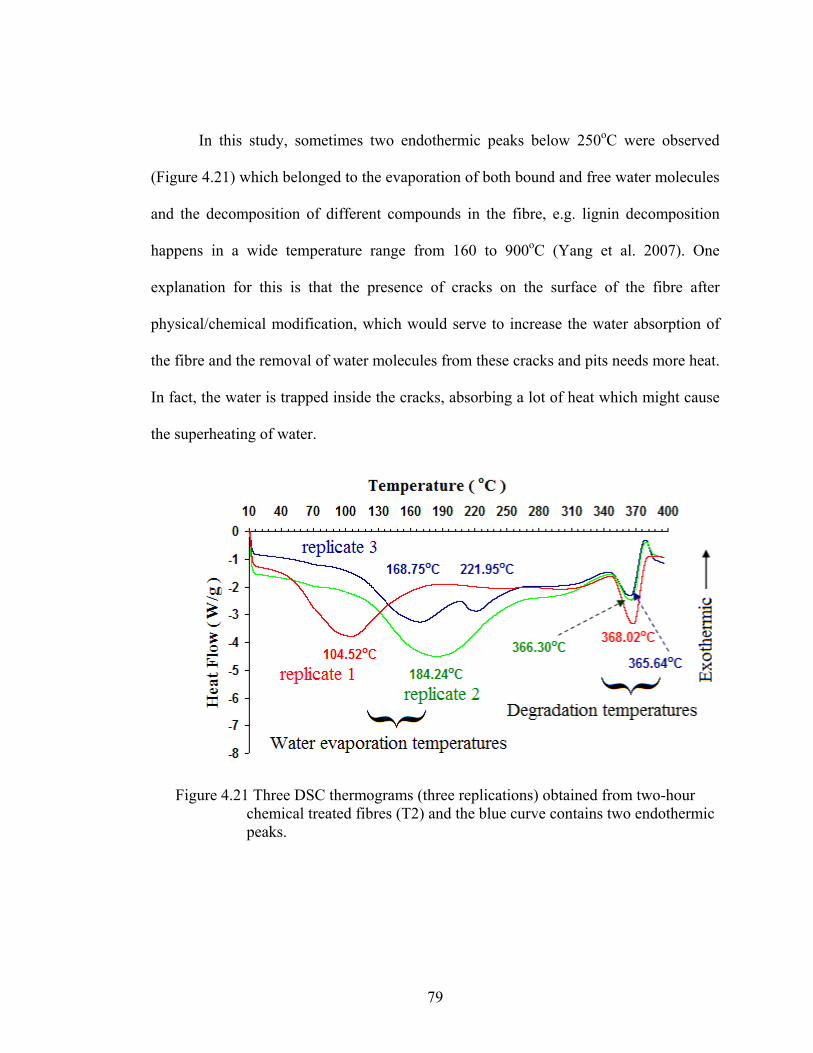
In this study, sometimes two endothermic peaks below 250oC were observed
(Figure 4.21) which belonged to the evaporation of both bound and free water molecules
and the decomposition of different compounds in the fibre, e.g. lignin decomposition
happens in a wide temperature range from 160 to 900oC (Yang et al. 2007). One
explanation for this is that the presence of cracks on the surface of the fibre after
physical/chemical modification, which would serve to increase the water absorption of
the fibre and the removal of water molecules from these cracks and pits needs more heat.
In fact, the water is trapped inside the cracks, absorbing a lot of heat which might cause
the superheating of water.
Figure 4.21 Three DSC thermograms (three replications) obtained from two-hour chemical treated fibres (T2) and the blue curve contains two endothermic peaks.
79
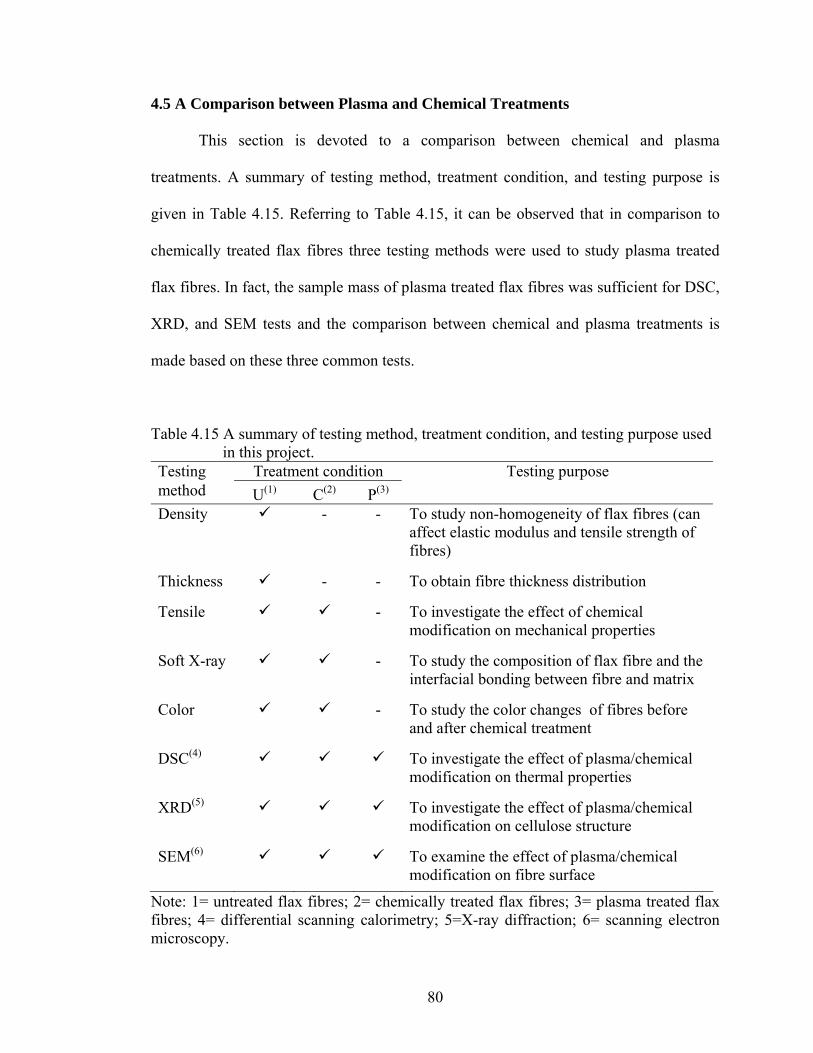
4.5 A Comparison between Plasma and Chemical Treatments
This section is devoted to a comparison between chemical and plasma
treatments. A summary of testing method, treatment condition, and testing purpose is
given in Table 4.15. Referring to Table 4.15, it can be observed that in comparison to
chemically treated flax fibres three testing methods were used to study plasma treated
flax fibres. In fact, the sample mass of plasma treated flax fibres was sufficient for DSC,
XRD, and SEM tests and the comparison between chemical and plasma treatments is
made based on these three common tests.
Table 4.15 A summary of testing method, treatment condition, and testing purpose used in this project.
Testing Treatment condition Testing purpose method
U(1)
C(2)
PP
(3) Density - - To study non-homogeneity of flax fibres (can
affect elastic modulus and tensile strength of fibres)
Thickness - - To obtain fibre thickness distribution
Tensile - To investigate the effect of chemical modification on mechanical properties
Soft X-ray - To study the composition of flax fibre and the interfacial bonding between fibre and matrix
Color - To study the color changes of fibres before and after chemical treatment
DSC(4) To investigate the effect of plasma/chemical modification on thermal properties
XRD(5) To investigate the effect of plasma/chemical modification on cellulose structure
SEM(6) To examine the effect of plasma/chemical modification on fibre surface
Note: 1= untreated flax fibres; 2= chemically treated flax fibres; 3= plasma treated flax fibres; 4= differential scanning calorimetry; 5=X-ray diffraction; 6= scanning electron microscopy.
80
In both plasma and chemically treated flax fibres, the degradation temperatures
of samples were slightly decreased and water evaporation temperatures showed a
variation among samples.
X-ray diffraction results showed that the crystallinity of chemically/plasma
treated flax fibres significantly decreased, but the structure of the cellulose was
unchanged (native form or cellulose I structure). It appears that fibres with high
crystallinity absorb less water (Ansari et al. 1999), therefore, an increase in the water
absorption of plasma and chemically treated flax fibres would be expected from the
obtained results in this study. As stated earlier, the mechanical properties of flax fibres
depend strongly on their structures. Decreasing or increasing the crystallinity of flax
fibre can affect mechanical properties of the fibre (Bledzki and Gassan 1999). Arbelaiz
and co-workers (2005) have reported a decrease in mechanical properties of flax fibres,
treated in a 20 wt% aqueous solution of sodium hydroxide for 1h. In this project, no
improvement was observed in mechanical properties of chemically treated flax fibres
and this implies that decreasing crystallinity in chemically treated flax fibres and also
probably in plasma treated fibres might cause a reduction in mechanical properties of
fibres.
SEM results revealed that the surface of untreated flax fibres was significantly
affected by both chemical and plasma treatments in different manners. Chemical
modification removed non-cellulosic materials from the cracks and pits present on fibre
surface, whereas, the plasma modification affected the fibre surface mostly as plasma
etching resulting in separation of thin layers from the fibre surface. Surface modification
of flax fibres can influence interfacial properties of fibres and polymer matrix in
81
biocomposites. Marais and co-workers (2005) have studied the mechanical properties of
unsaturated polyester composites reinforced with helium plasma treated flax fibres. An
increase in the elastic modulus (improving fibre/matrix adhesion) and a decrease in the
breaking strength (weakening fibres by plasma treatments) of biocomposites have been
reported in their results. Arbelaiz and co-workers (2005) have found an enhancement in
interfacial strength values (using pull out test) for alkali modified single flax fibre. In
their studies, a single flax fibre was immersed in a molten polypropylene droplet. Based
on attained SEM results in this study, an improvement of fibre/matrix adhesion would be
expected in composites reinforced with plasma/chemically treated flax fibres.
As a result, both chemical and plasma modifications exhibited a good potential in
modifying flax fibres. Advantages and disadvantages of using plasma/chemical
treatment in this study are discussed in the following paragraphs.
The advantages and disadvantages of using chemical treatment in this thesis were:
1. ease of use;
2. no restriction on the amount of fibres for the purpose of treating;
3. a different variety of surface modification could be achieved altering temperature,
the concentration of sodium hydroxide (NaOH), and treatment time;
4. many stages such as washing and drying were involved after chemical treatment; and
5. large amounts of chemical residues were produced.
The advantages and disadvantages of using plasma in this thesis were:
1. contained a clean process using an inert- ionized gas;
2. the treatment modified the surface of fibre without touching the bulk properties;
82

3. a different variety of surface modification could be reached by varying the gas, gas
rate, treatment time and pressure;
4. short treatment time (about 15 min);
5. difficult to produce a uniform plasma; and
6. each time a very small amount of fibre (around 64 mg) could be treated.
83

5. SUMMARY AND CONCLUSIONS
In this chapter, the conclusions based on results extracted from the experiments
are discussed. The focus of this thesis was to develop and study the plasma treatment as
an alternative to the other surface treatments of flax fibres by using different treatment
conditions. In this work, soft X-ray spectromicroscopy was introduced as a new method
in analysing the flax fibre structure and fibre-matrix interfacial properties.
The following conclusions are made based on the results extracted from
plasma/chemical treatment of flax fibres:
1. Both treatment methods, plasma and chemical treatments, exhibited a significant
capability in changing the surface characteristics of flax fibres. The results from
scanning electron microscopy showed that plasma treatment modified the fibre
surface in less time (15 min) than chemical treatment (4 h). Chemical modification
removed non-cellulosic materials from the cracks and pits present on fibre surface,
whereas, the plasma modification affected the fibre surface in a different manner
mostly as plasma etching and separating thin layers from the fibre surface.
2. X-ray diffraction results showed that the structure of plasma treated fibres in a short
time (15 min) was significantly changed (e.g. crystallinity) in comparison to the
chemically treated fibres (4 h). In other words, the process of plasma modification
seems to be completed in about 15 min while in chemical treatment many stages
such as washing and drying are involved after chemical treatment consuming a large
84

amount of time and energy. In commercial biocomposite production, saving time
and energy play an important role in the fibre process.
3. The degradation temperatures of plasma/chemical treated fibres were slightly
decreased. In chemically treated flax fibres, decreasing the degradation temperature
was attributed to the removal of non-cellulosic materials, whereas this weight loss in
plasma treatment is mostly attributed to the surface etching of fibres. Decreasing the
degradation temperature of flax fibre after plasma/chemical treatment implies that in
biocomposite manufacturing process, the processing temperature should be lower
than this temperature to avoid the degradation of flax fibres and their discoloration
due to excessive heating.
The results from this study showed that plasma modification can be used as an
effective method for surface modification of flax fibres. The advantages of using plasma
treatment in this study were: 1) the surface modification of the flax fibres occurred in a
short period; 2) surface modification of the flax fibres could easily be controlled by
changing applied voltage, gas flow rate, pressure, and gas type; 3) unwanted waste
products were not produced after treatment; 4) hazardous materials were not used in
treating the fibres (an inert gas was used as plasma-forming gas); and 5) the near-surface
region of flax fibres was modified. Thus plasma treatment would be an environmentally
wiser choice of treating flax fibre than chemical treatment.
85

6. RECOMMENDATIONS
The following list of suggestions is introduced for future research.
1. The results from fibre thickness measurement showed that the thickness distribution
of flax fibres was almost bell shaped. Additional studies by using a fitting method
will give some information about flax fibre thickness which can be useful in
predicting the mechanical behaviour of composites based on flax fibre.
2. More work (using soft x-ray absorption) is needed to understand the effectiveness of
chemical/plasma treatment on the improvement of the interfacial bonding between
fibre and matrix.
3. A study (using soft x-ray absorption) is recommended to estimate the distribution of
pectin and hemicellulos in flax fibre after exposure to plasma/chemical treatment.
4. There is a chance of having sodium residues after washing process which may affect
the water absorption of flax fibres. Soft x-ray absorption would be useful in
identifying the existence of sodium residues on the alkaline treated flax fibres.
5. Supplementary chemical treatment studies are required at different times and on
different concentrations of sodium hydroxide (NaOH) e.g. using a high
concentration of sodium hydroxide (NaOH) changes the structure of the cellulose.
86
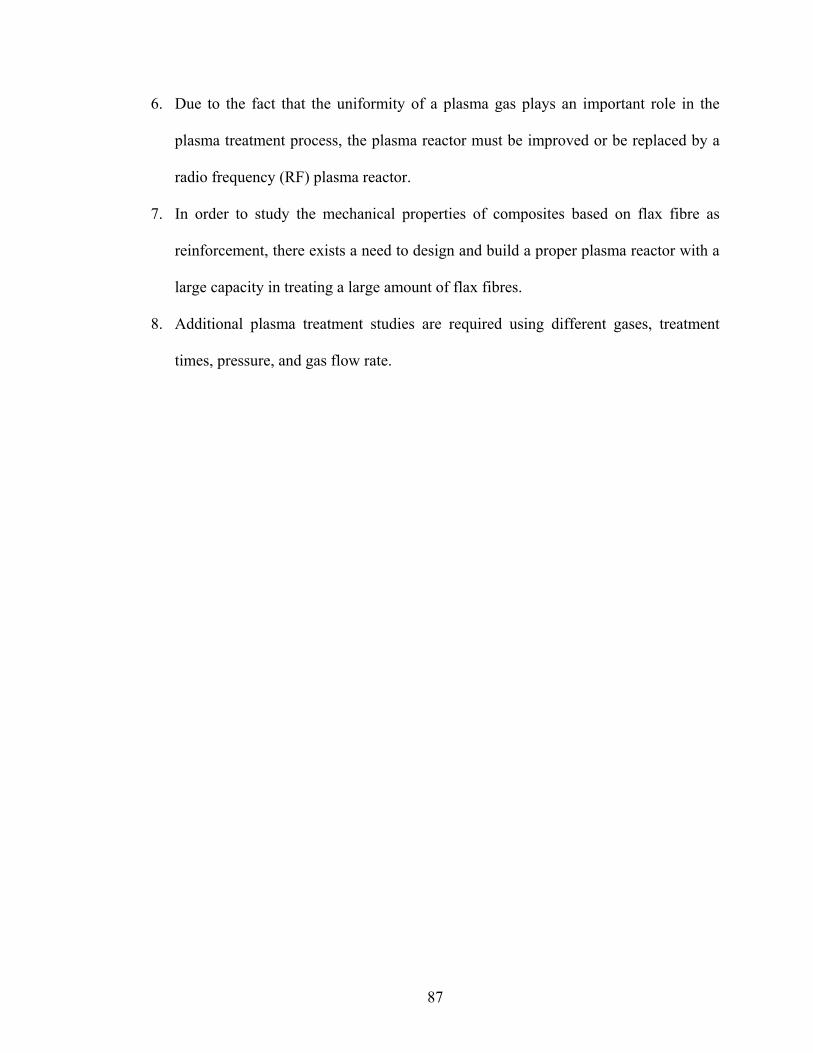
6. Due to the fact that the uniformity of a plasma gas plays an important role in the
plasma treatment process, the plasma reactor must be improved or be replaced by a
radio frequency (RF) plasma reactor.
7. In order to study the mechanical properties of composites based on flax fibre as
reinforcement, there exists a need to design and build a proper plasma reactor with a
large capacity in treating a large amount of flax fibres.
8. Additional plasma treatment studies are required using different gases, treatment
times, pressure, and gas flow rate.
87

7. REFERENCES
Arbelaiz, A., B. Fernandez, J.A. Ramos and I. Mondragon. 2006. Thermal and
crystallization studies of short flax fibre reinforced polypropylene matrix composites: Effect of treatments. Thermochimica Acta 440: 111-121.
Arbelaiz, A., G. Cantero, B. Fernández, I. Mondragon, P. Gañán and J.M. Kenny. 2005. Flax fiber surface modifications: Effects on fiber physico mechanical and flax/polypropylene interface properties. Polymer Composites 26: 324-332.
Ansari, I.A., G.C. East. and D.J. Johnson. 1999. Structure-property relationships in natural cellulosic fibres. Part 1: Characterisation. Textile Institute 90(4): 469-480.
Ansari, I.A., G.C. East. and D.J. Johnson. 2001. Structure-property relationships in natural cellulosic fibres. Part 2: Fine structure and tensile strength. Textile Institute 92(4): 331-348.
Baley, C. 2002. Analysis of the flax fibres tensile behaviour and analysis of the tensile stiffness increase. Composites Part A: Applied Science and Manufacturing 33: 939-948.
Baiardo, M., E. Zini and M. Scandola. 2004. Flax fibre-polyester composites. Composites Part A: Applied Science and Manufacturing 35 :703-710.
Bledzki, A.K., S. Reihmane. and J. Gassan. 1996. Proerties and modification methods for vegetable fibers for natural fiber composites. Journal of Applied Polymer Science 59: 1329-1336.
Bledzki, A.K. and J. Gassan. 1999. Composites reinforced with cellulose based fibres. Progress in Polymer Science 24: 221-274.
88

Bhattacharya, S.D. and J.N. Shah. 2004. Enzymatic treatments of flax fabric. Textile Research Journal 74(7):622-628.
Borysiak, S. and B. Doczekalska. 2005. X-ray Diffraction Study of Pine Wood Treated with NaOH. Fibres & Textiles in Eastern Europe 13:87-89.
Chen, Y.Y., H. Lin, Y. Ren, H.W. Wang and L.J. Zhu. 2004. Study on bombyx mori silk treated by oxygen plasma. Journal of Zhejiang University Science 5(8):918-922.
Fu, J. 2006. Linear dichroism in the NEXAFS spectroscopy of N-Alkane thin films. Unpublished Ph.D. thesis. Saskatoon, Saskatchewan: Department of Chemistry, University of Saskatchewan.
Gassan, J. and A.K. Bledzki. 2001. Thermal degradation of flax and Jute fibers. Journal of Applied Polymer Science 82: 1417-1422.
George, J., M.S. Sreekala and S. Thomas. 2001. A review on interface modification and characterization of natural fiber reinforced plastic composites. Polymer Engineering and Science 41(9):1471-1485.
Gouanve, F., S. Marais, A. Bessadok, D. Langevin, C. Morvan and M. Metayer, 2006. Study of water sorption in modified flax fibres. Journal of Applied Polymer Science 101: 4281-4289.
Hearle, J.W.S. 1963. The fine structure of fibers and crystalline polymers. III. interpretation of the mechanical properties of fibers. Journal of Applied Polymer Science 7:1207-1223.
Hindeleh, A.M. and D.J. Johnson. 1972. Crystallinity and crystallite size measurement in cellulose fibres: 1. ramie and fortisan. Polymer 13:423-430.
Hindeleh, A.M. and D.J. Johnson. 1974. Crystallinity and crystallite size measurement in cellulose fibres: 2. viscose rayon. Polymer 15:697-705.
89

Homayonifar, M. and S.M. Zebarjad. 2007. Investigation of the effect of matrix volume fraction on fiber stress distribution in polypropylene fiber composite using a simulation method. Material and Design 28:1386-1392.
Hornsby, P.R., E. Hinrichsen and K. Tarverdi. 1997. Preparation and properties of polypropylene composites reinforced with wheat and flax straw fibres. Part I fibre characterization. Journal of Materials Science 32:443-449.
Ishikawa, A., T. Okano and J. Sugiyama. 1997. Fine structure and tensile properties of ramie fibers in the crystalline form of cellulose I, II, IIII and IVI. Polymer 38(2): 463-468.
IST Ltd. 2003. Users manual. Vilters, Switzerland: IST-Innovative Sintering Technologies Ltd.
Jenkins, R. and R. Snyder. 1996. Introduction to X-ray Powder Diffractometry. New York, NY: Wiley.
Karunakaran, C., C.R. Christensen. S.S. Miller, and A.P. Hitchcock. 2008. Soft X-ray Spectromicroscopy – An advanced technique for plant polysaccharides research (Manuscript in preparation). CLS-AUM2008 meeting.
Kasai, N. and M. Kakudo. 2005. X-ray Diffraction by Macromolecules. Berlin, Germany: Kodansha Ltd. and Springer-Verlag.
Khalili, S., D.E. Akin, B. Pettersson and G. Henriksson. 2002. Fibernodes in flax and other bast fibers. Journal of Applied Botany – Agnewandte Botanik 76: 133-138.
Khammatova, V.V. 2005. Effect of high-frequency capacitive discharge plasma on the structure and properties of flax and lavsan materials. Fibre Chemistry 37(4):293-296.
Koprinarov, I. and A.P. Hitchcock.2000. X-ray Spectromicroscopy of Polymers - An introduction for the non-specialist.http://unicorn.mcmaster.ca/stxm-intro/polystxmintro-all.pdf (2008/06/01).
90

Lagerlöf, P. 2008. EMSE 312 - Diffraction Principles (Lectures). http://dmseg5.mse.cwru.edu/Classes/EMSE312/(2008/01/01).
Logicol. 2008. The color data company. http://www.logicol.com/ (2008/06/01).
Lieberman, M.A. and A.J. Lichtenberg. 2005. Principles of Plasma Discharges and Materials Processing. 2nd edition. Hoboken, NJ: John Wiley & Sons.
Marais, S., F. Gouanve, A. Bonnesoeur, J. Grenet, F. Poncin-Epaillard, C. Morvan and M. Metayer. 2005. Unsaturated polyester composites reinforced with flax fibers: effect of cold plasma and autoclave treatments on mechanical and permeation properties. Composites Part A: Applied Science and Manufacturing: 36:975-986.
Olaru, N., L. Olaru and GH. Cobiliac. 2005. Plasma-modified wood fibers as fillers in polymeric materials. Romanian Journal of Physics 50:1095-1101.
Pallesen, B.E. 1996. The quality of combine-harvested fibre flax for industrials purposes depends on the degree of retting. Industrial Crops and Products 5:65-78.
Reddy, N. and Y. Yang. 2005. Long natural cellulosic fibers from cornhusks: structure and properties. AATCC Review: 5(7):24-27.
Roth, J.R. 2001. Industrial Plasma Engineering Volume 2: Application to Nonthermal Plasma Processing. Bristol, UK: Institute of Physics Publishing.
Saheb, D.N. and J.P. Jog. 1999. Natural fiber polymer composites: a review. Advances in Polymer Technology. 18(4): 351–363.
Sharma, H.S.S. and C.F. Van Sumere. 1992. The biology and Processing of Flax. Belfast, Northern Ireland: M Publications.
Shamolina, I.I., A.M. Bochek, N.M. Zabivalova, D.A. Medvedeva and S.A. Grishanov. 2003. An Investigation of structural changes in short flax fibres in chemical treatment. Fibres & Textiles in Eastern Europe 11:33-36.
91

Siaotong, B.A. 2006. Effects of fiber content and extrusion parameters on the properties of flax fiber-polyethylene composites. Unpublished M.Sc. thesis. Saskatoon, SK: Department of Agricultural and Bioresource Engineering, University of Saskatchewan.
Sreekala, M.S., M.G. Kumaran, S. Joseph, M. Jacob and S. Thomas. 2000. Oil palm fiber reinforced phenol formaldehyde composites: influence of fiber surface modifications on the mechanical performance. Applied Composite Materials
7:295-329.
Stamboulis, A., C. A. Baillie and T. Peijs. 2001. Effects of environmental conditions on mechanical and physical properties of flax fibers. Composites Part A: Applied Science and Manufacturing 32:1105-1115.
Stöhr, J.1992. NEXAFS Spectroscopy. 1st edition. Berlin, Germany: Springer-Verlag.
Vonk, C.G. 1973. Computerization of Ruland’s x-ray method for determination of the crystallinity in polymers. Journal of Applied Crystallography 6:148-152.
Wiener, J., V. Kovačič and P. Dejlová. 2003. Differences between flax and hemp. AUTEX Research Journal 3(2): 58-63.
Ward, I.M. 1962. Optical and mechanical anisotropy in crystalline polymers. Proceeding of the Physical Society 80:1176-1188.
Wang, B. 2004. Pretreatment of flax fibers for use in rotationally molded composites. Unpublished M.Sc. thesis. Saskatoon, SK: Department of Agricultural and Bioresource Engineering, University of Saskatchewan.
Wong, K.K., X.M. Tao, C.W.M. Yuen and K.W. Yeung. 2000. Topographical study of low temperature plasma treated flax fibers. Textile Research Journal 70(10):886-893.
92

Xu, X., Y. Wang, X. Zhang, G. Jing, D. Yu and S. Wang. 2006. Effects on surface properties of natural bamboo fibers treated with atmospheric pressure argon plasma. Surface and Interface Analysis 38: 1211-1217.
Yang, H., R. Yan, H. Chen, D.H. lee and C. Zheng. 2007. Characteristics of hemicellulose, cellulose and lignin pyrolysis. Fuel 86: 1781-1788.
93

APPENDIX A- PEAK RESOLUTION
94

Figure A.1 Peak resolution of untreated fibre (F1).
Figure A.2 Peak resolution of untreated fibre (F2).
95
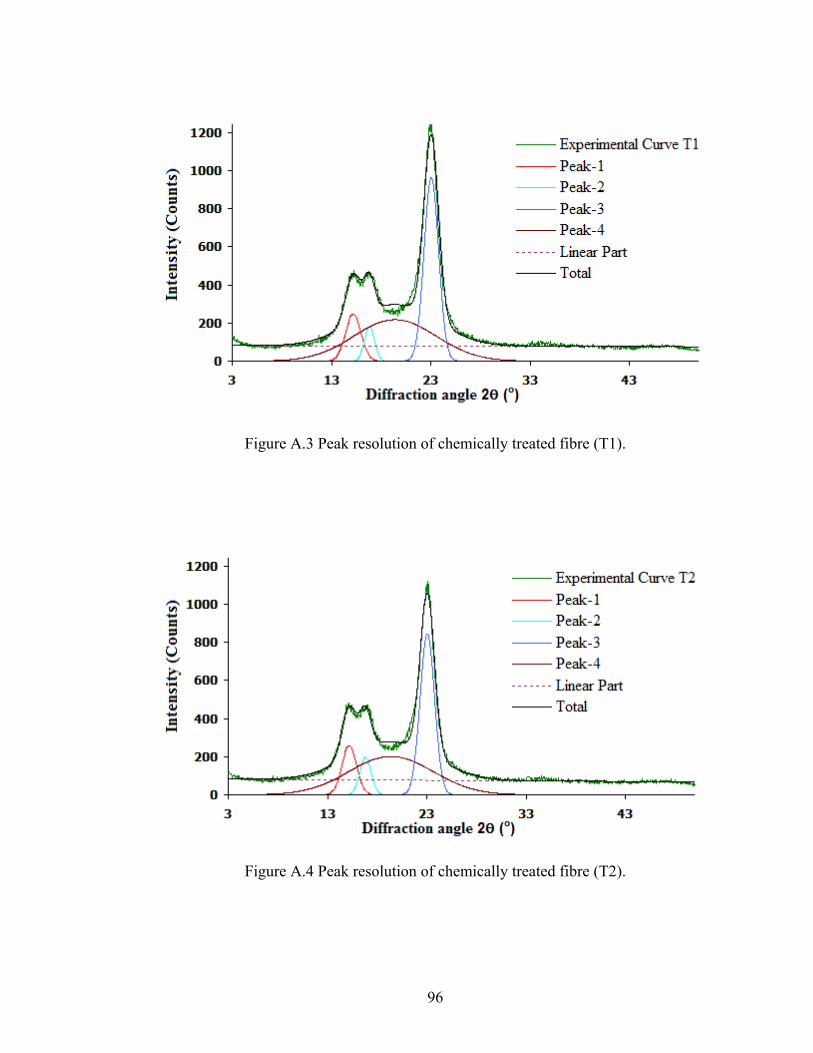
Figure A.3 Peak resolution of chemically treated fibre (T1).
Figure A.4 Peak resolution of chemically treated fibre (T2).
96
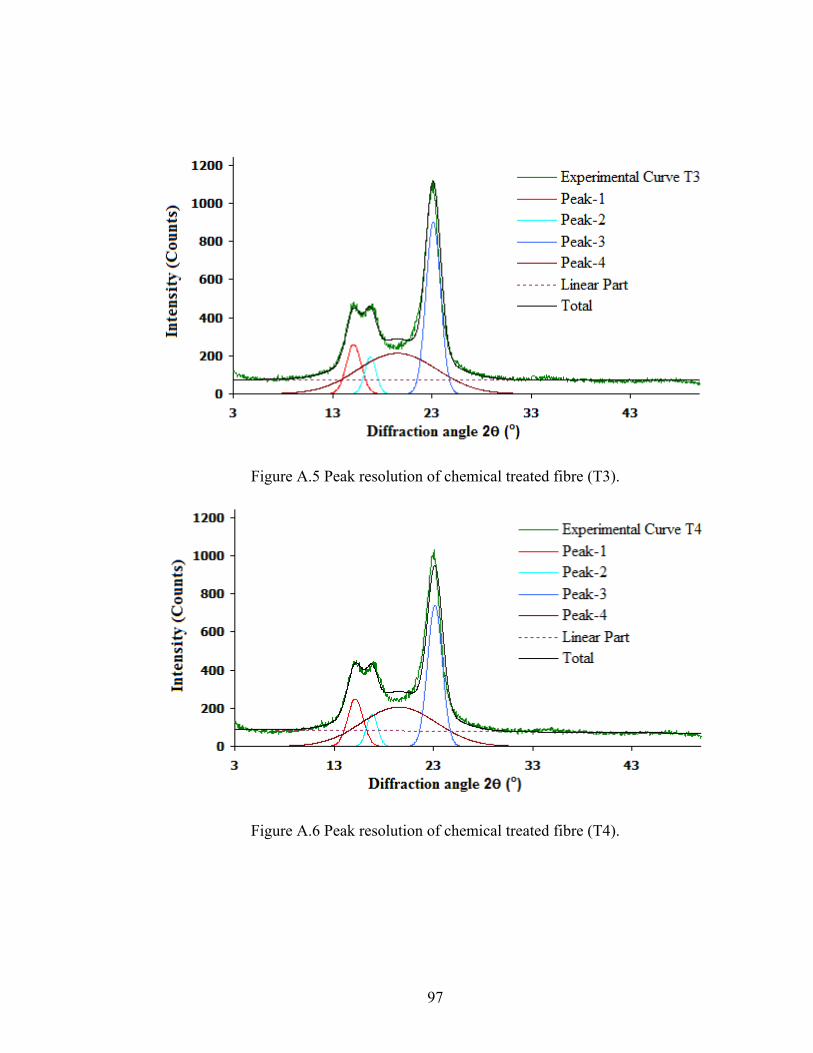
Figure A.5 Peak resolution of chemical treated fibre (T3).
Figure A.6 Peak resolution of chemical treated fibre (T4).
97
Figure A.7 Peak resolution of plasma treated fibre (P1).
Figure A.8 Peak resolution of plasma treated fibre (P2).
98

Figure A.9 Peak resolution of plasma treated fibre (P3).
99

APPENDIX B- FIBRE THICKNESS PROFILES
100

Figure B.1 Schematic of flax fibre thickness distribution (sample 1).
Figure B.2 Schematic of flax fibre thickness distribution (sample 2).
101

Figure B.3 Fibre thickness distributions profile of sample 3.
Figure B.4 Fibre thickness distributions profile of sample 4.
102

Figure B.5 Fibre thickness distributions profile of sample 5.
Figure B.6 Fibre thickness distributions profile of sample 6.
103

Figure B.7 Fibre thickness distributions profile of sample 7.
Figure B.8 Fibre thickness distributions profile of sample 8.
104
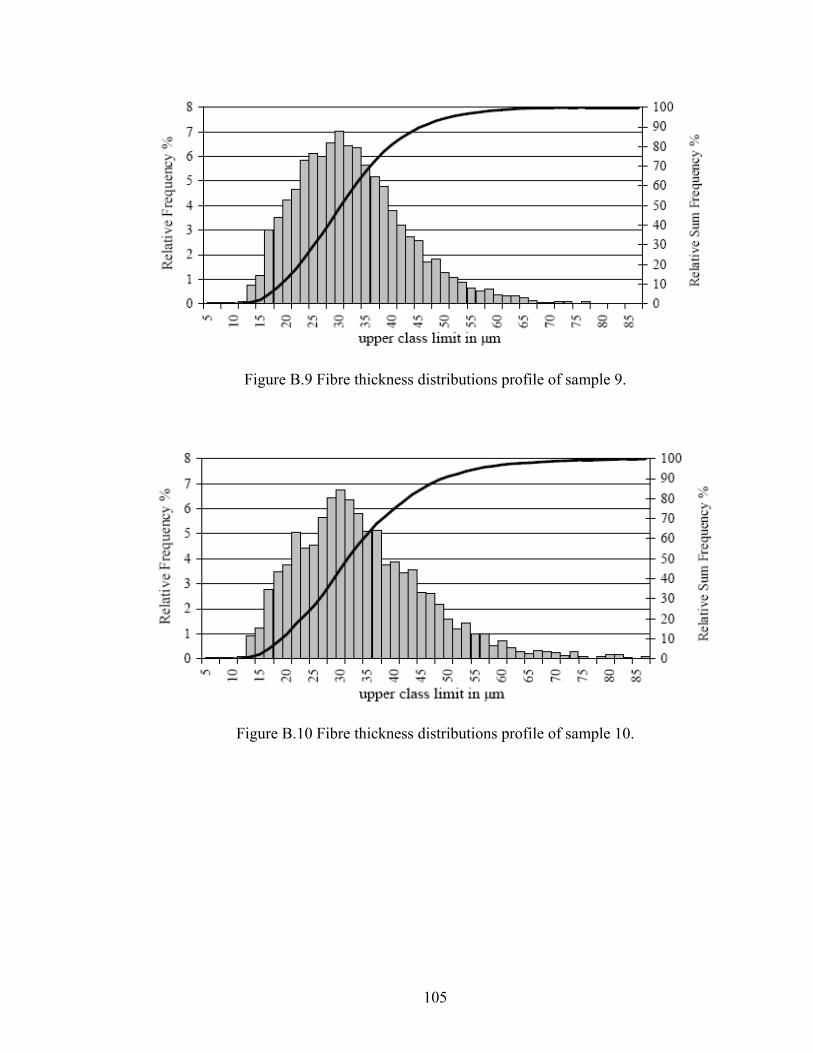
Figure B.9 Fibre thickness distributions profile of sample 9.
Figure B.10 Fibre thickness distributions profile of sample 10.
105
106
APPENDIX C- MECHANICAL PROPERTIES OF UNTREATED/CHEMICALLY
TREATED FLAX FIBRE

Figure C.1 Elastic modulus versus the diameter for untreated (F1)/chemically treated fibres (T1, T2, T3 and T4).
107
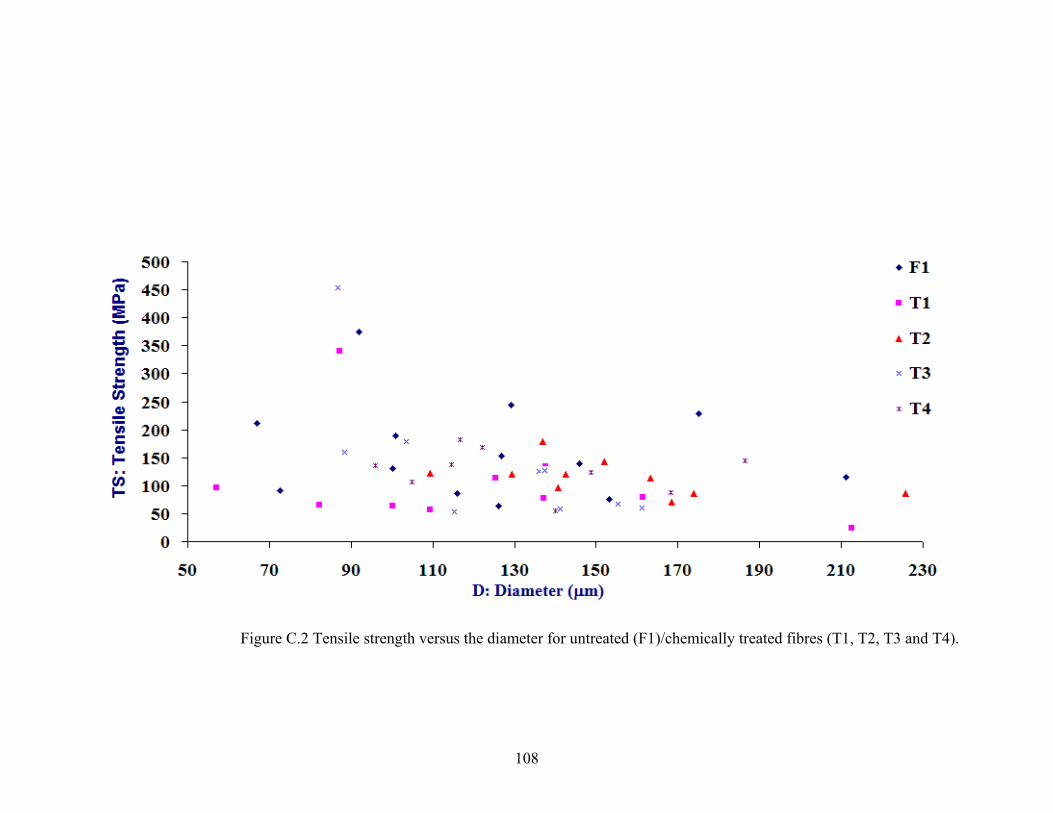
Figure C.2 Tensile strength versus the diameter for untreated (F1)/chemically treated fibres (T1, T2, T3 and T4).
108

APPENDIX D- PEAK BROADENING
109

Many factors can cause a peak broadening in X-ray diffraction profiles. In the
following figures theses factors are discussed. All figures are reproduced from Lagerlöf
(2008).
a) b)
Figure D.1 Schematic of peak broadening for a strain free sample: a) one dimensional arrangement of unit cells and b) diffraction peak profile.
a) b)
Figure D.2 Schematic of peak broadening (left shifting) for a sample subjected to a uniform tension: a) one dimensional arrangement of unit cells and
b) diffraction peak profile.
a) b)
Figure D.3 Schematic of peak broadening (right shifting) for a sample subjected to a uniform compression: a) one dimensional arrangement of unit cells and b) diffraction peak profile.
110
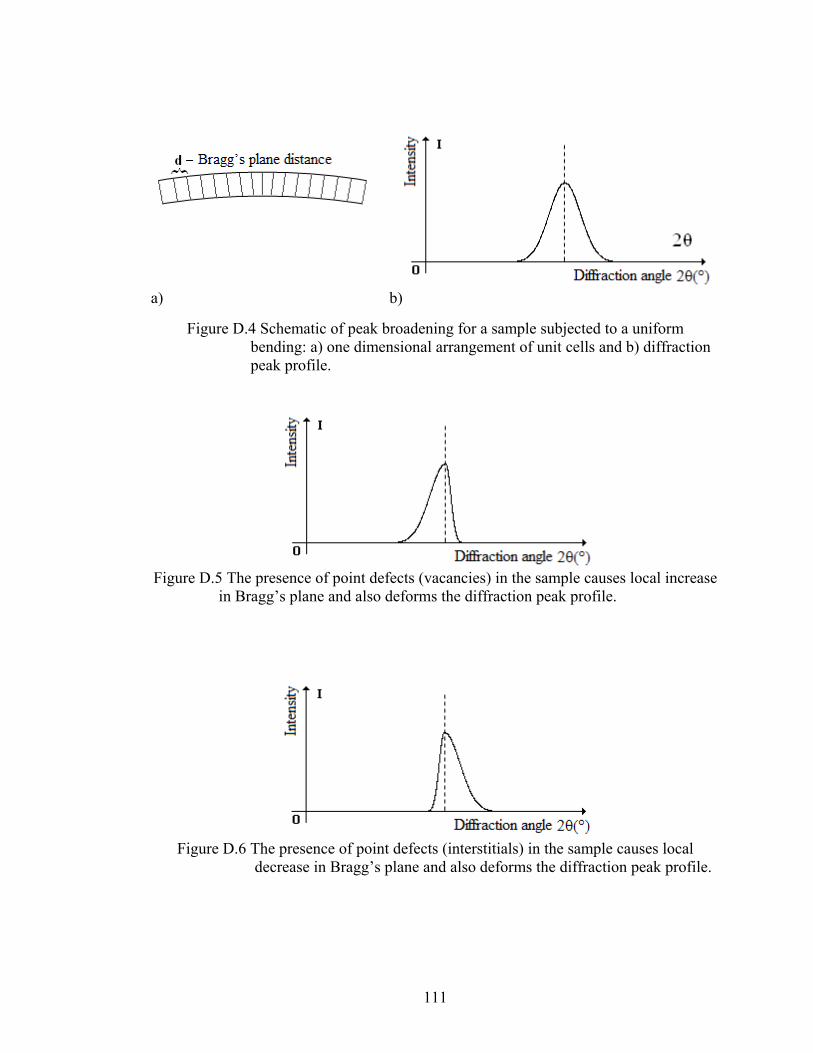
a) b)
Figure D.4 Schematic of peak broadening for a sample subjected to a uniform bending: a) one dimensional arrangement of unit cells and b) diffraction peak profile.
Figure D.5 The presence of point defects (vacancies) in the sample causes local increase in Bragg’s plane and also deforms the diffraction peak profile.
Figure D.6 The presence of point defects (interstitials) in the sample causes local
decrease in Bragg’s plane and also deforms the diffraction peak profile.
111

APPENDIX E- DSC THERMOGRAMS
112

Figure E.1 DSC thermograms obtained from untreated fibre (F1).
Figure E.2 DSC thermograms obtained from untreated fibre (F2).
113

Figure E.3 DSC thermograms obtained from chemically treated fibre (T1).
Figure E.4 DSC thermograms obtained from chemically treated fibre (T2).
114
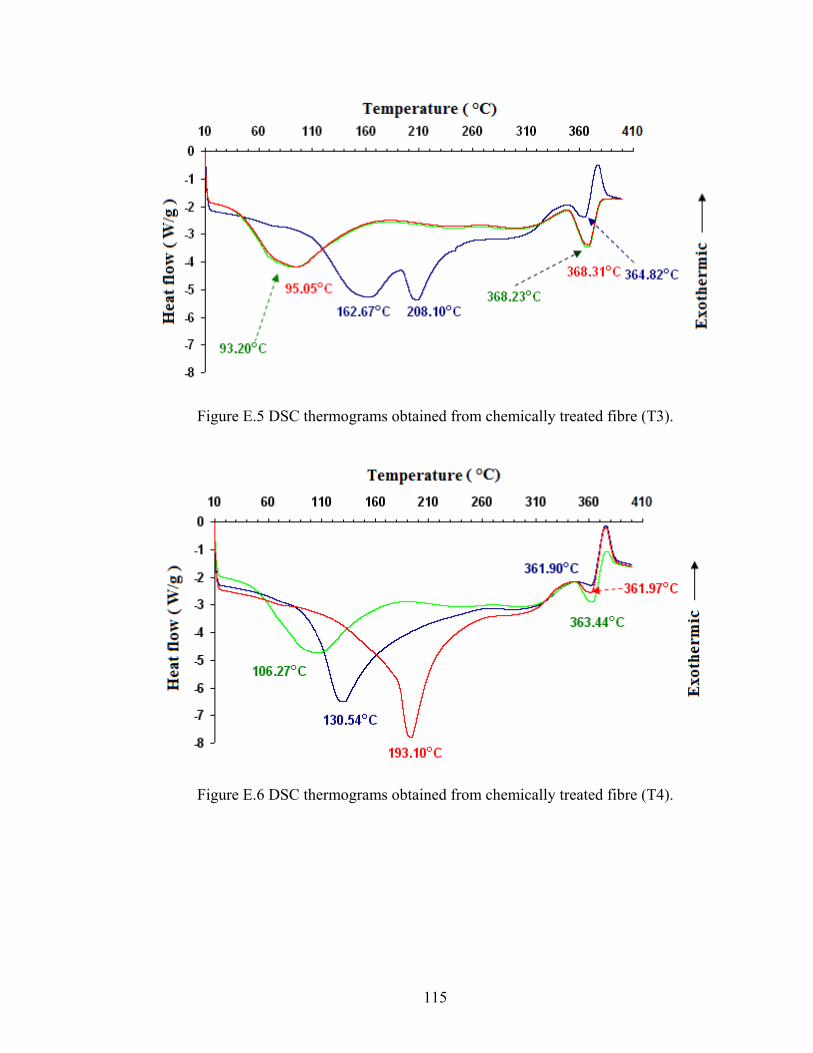
Figure E.5 DSC thermograms obtained from chemically treated fibre (T3).
Figure E.6 DSC thermograms obtained from chemically treated fibre (T4).
115

Figure E.7 DSC thermograms obtained from plasma treated fibre (P1).
Figure E.8 DSC thermograms obtained from plasma treated fibre (P2).
116
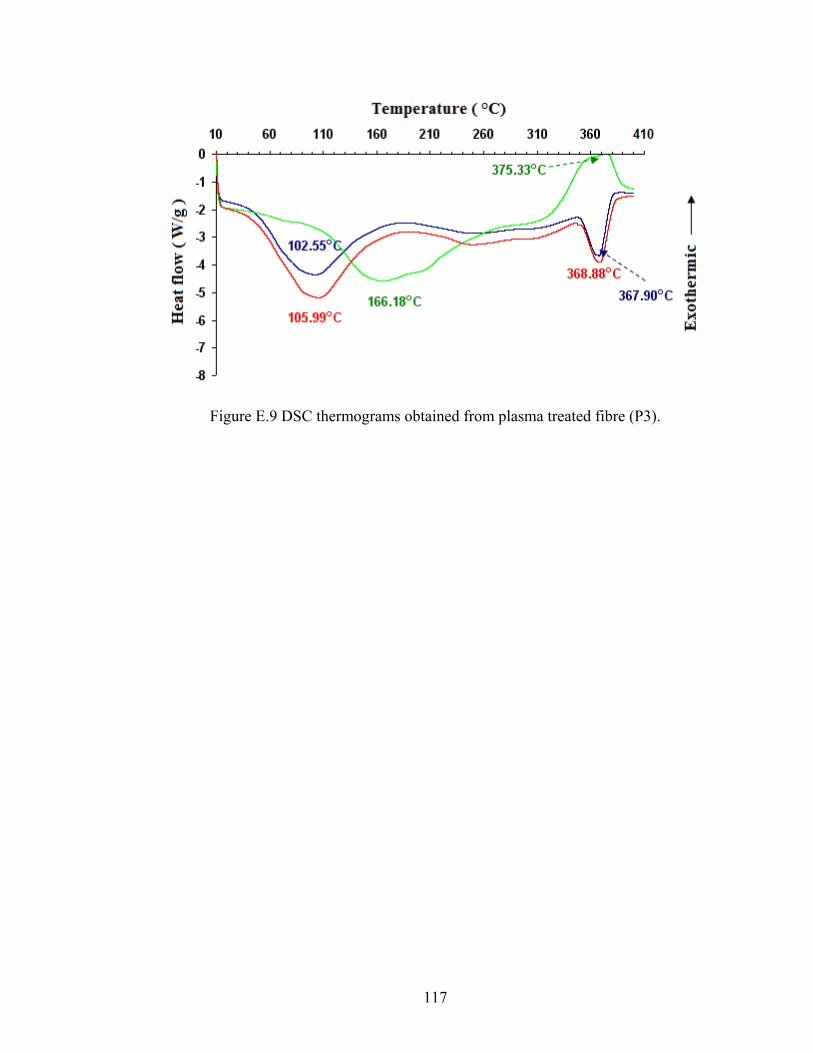
Figure E.9 DSC thermograms obtained from plasma treated fibre (P3).
117