the effect of patent litigation on firm performance
TRANSCRIPT
Dis cus si on Paper No. 13-015
The Effect of Patent Litigation on Firm Performance –
Evidence for Germany
Paula Schliessler
Dis cus si on Paper No. 13-015
The Effect of Patent Litigation on Firm Performance –
Evidence for Germany
Paula Schliessler
Download this ZEW Discussion Paper from our ftp server:
http://ftp.zew.de/pub/zew-docs/dp/dp13015.pdf
Die Dis cus si on Pape rs die nen einer mög lichst schnel len Ver brei tung von neue ren For schungs arbei ten des ZEW. Die Bei trä ge lie gen in allei ni ger Ver ant wor tung
der Auto ren und stel len nicht not wen di ger wei se die Mei nung des ZEW dar.
Dis cus si on Papers are inten ded to make results of ZEW research prompt ly avai la ble to other eco no mists in order to encou ra ge dis cus si on and sug gesti ons for revi si ons. The aut hors are sole ly
respon si ble for the con tents which do not neces sa ri ly repre sent the opi ni on of the ZEW.

Non-technical Summary While the benefits of patents for society as well as for patentees have extensively been studied in the theoretical and empirical economics of innovation literature, re-searchers in recent years have more and more concentrated on potential negative effects of patents. These negative effects can arise if the estimated costs of the patent system to an innovator exceed the estimated benefits (Bessen and Meurer 2008). This can for example be the case if the costs of defending a patent right ex-ceed the profits of owning it. If there is a negative impact of patent litigation for patentees or inadvertent infringers an ex-post tax is imposed on the innovative ef-fort which results in an ex-ante reduction of innovation incentives (Bessen Meurer 2008). Against this background the contribution at hand considers the costs and benefits of patents by analyzing how patent litigation affects the firm value of the disputing firms. Making use of the fact that patents involved in patent infringement litigation consti-tute highly valuable intangible assets I expect decisions about the infringement of these highly valuable patents to be reflected in the value of the firms involved in litigation. This paper has two main objectives. The first objective is to model, in a stylized way, the impact of patent litigation and its outcome on the firm value of the plaintiff and the defendant, taking into account the particularities of the German patent litigation system. The second objective is to empirically test the hypotheses derived from this stylized model by using changes in credit rating for German firms as a proxy for changes in firm value. I find evidence that patent litigation is indeed reflected by changes in the firm value of plaintiffs and defendants. Defendants are negatively affected by a loss in trial or a settlement deal, while a victory leaves their firm value unchanged. I further show that small and inexperienced defendants are at a disadvantage compared to larger and more experienced firms, indicating that they are affected more severely by busi-ness disruption and financial distress. By contrast I find a positive treatment effect of litigation on the plaintiffs, independent of the outcome of the case. The results match theoretical considerations on the functioning of the bifurcated patent litiga-tion system in Germany: The temporal separation of decisions on patent infringe-ment claims and corresponding patent invalidity (counter) claims provides a strate-gic advantage to the plaintiff. The delayed decision of invalidity counterclaims (tem-porarily) shifts a large share of the bargaining power to the plaintiffs as they have little to lose from the infringement trial. This may lead to defendants being forced into unfavorable settlement agreements.
Das Wichtigste in Kürze Während der private und gesellschaftliche Nutzen von Patenten in der theoretischen und empirischen Innovationsökonomik bereits ausgiebig erforscht wurde, mehren sich in den letzten Jahren zunehmend Studien, die potentielle negative Effekte von Pa-tenten aufgreifen. Diese entstehen, wenn die für einen Innovator durch das Patent-system entstehenden Kosten den Nutzen übersteigen (Bessen und Meurer 2008). Wenn zum Beispiel Patentstreitigkeiten einen rechtmäßigen Patentinhaber oder einen versehentlichen Verletzer eines Patentes schädigen, gleicht dies einer ex-post Steuer auf den Innovationsaufwand und führt zu einer ex-ante Reduktion von Innovationsan-reizen (Bessen und Meurer 2008). Vor diesem Hintergrund untersucht diese Studie wie Patentverletzungsverfahren den Firmenwert des Klägers (Patentinhabers) und des Beklagten beeinflussen. Aufgrund der Tatsache, dass in Patentprozesse involvierte Patente besonders wertvoll sind, erwarte ich, dass sich Entscheidungen über die Verletzung dieser Patente im Firmen-wert widerspiegeln. Diese Studie hat zwei Ziele. Zum einen wird der Einfluss von Patentverletzungspro-zessen und deren Ausgang auf Kläger und Beklagten in einem stilisierten Modell dar-gestellt. Hier wird insbesondere auf die Eigenheiten des deutschen Rechtssystems eingegangen. In einem zweiten Schritt werden die aus dem Modell abgeleiteten Hypo-thesen empirisch getestet, indem Veränderung im Bonitätsindex einer Firma als Indi-kator für Veränderungen im Firmenwert genutzt werden. Die Ergebnisse zeigen, dass sich Patentverletzungsprozesse tatsächlich im Firmen-wert widerspiegeln. Für die Beklagten ist der Einfluss negativ, wenn sie verlieren oder einem Vergleich zustimmen, während sich bei einem Sieg keine Veränderung zeigt. Des Weiteren wird deutlich, dass kleine und unerfahrene Beklagte im Vergleich zu großen und erfahreneren Firmen im Nachteil sind, sobald sie in einen Prozess invol-viert werden. Dies deutet darauf hin, dass sie stärker von durch Unsicherheit ausge-lösten wirtschaftlichen und finanziellen Schwierigkeiten betroffen sind. Im Gegensatz dazu zeigt sich ein durchgängig positiver Effekt von Verletzungsver-fahren auf den Kläger (Patentinhaber), unabhängig vom Prozessausgang. Die Ergebnisse stimmen mit den theoretischen Überlegungen zur Praxis des deut-schen Patentverletzungssystems überein. Die zeitliche und örtliche Trennung von Patentverletzungsklagen und den zugehörigen, als Verteidigung der Beklagten ge-nutzten, Patentnichtigkeitsklagen, bringt dem Patentinhaber einen strategischen Vorteil. Da Nichtigkeitsklagen meist erst nach dem Urteil zur Patentverletzung ent-schieden werden, liegt ein Großteil der Verhandlungsmacht beim Kläger, der nur indi-rekt vom Verlust seines Patents bedroht ist. Dies erhöht seinen Verhandlungsspiel-raum im Patentverletzungsprozess und ermöglicht einen vorteilhaften Vergleich. .

The Eect of Patent Litigation on Firm
Performance - Evidence for Germany ?
Paula Schliesslera
January 2013
aCentre for European Economic Research (ZEW) & KU Leuven
Abstract
I analyse how patent litigation outcome in Germany aects the performance of
the disputing rms by interpreting changes in a rm's credit rating as a proxy
for changes in rm performance. The results match theoretical considerations on
the functioning of the bifurcated German patent litigation system: The separation
of litigation and invalidity decisions, resulting in invalidity decisions taking much
longer than decisions on infringement, provides patent holders with a window of
opportunity to enforce patents that may later be invalidated. This shifts a major
share of the immediate risk to the defendant and allocates bargaining power to
the plainti. The estimation results provide support for this incongruity. Plaintis
on average prot from litigation while defendants agreeing upon a settlement deal
lose as much as defendants losing in trial. I further show that small, inexperienced
defendant rms are at a disadvantage when dealing with litigation.
Key words: Patent, Patent Litigation, Credit Rating, Firm Value
JEL: O34, K41
? I am grateful for the funding of this research project by the Centre for Euro-
pean Economic Research (ZEW) within the Research program "Strengthening Ef-
ciency and Competitiveness in the European Knowledge Economies" (SEEK) and
by the Thyssen Foundation. I thank Dirk Czarnitzki, Antonio Della Malva, Rein-
hilde Veugelers, Daniel Höwer, Katrin Cremers, Bart Leten, Jörg Claussen, Bettina
Peters for helpful comments.
1
1 Introduction
The benets of patents for society as well as for patentees have extensively
been studied in the theoretical and empirical economics of innovation litera-
ture (Nordhaus 1962, Jae and Traitenberg 2002, Scotchmer 2004). Private
benets arise from innovation returns to the patented technology that exceed
the patent's R&D costs. These materialize through an increased market share,
a price premium for high quality products, the reduction of production costs
or from licensing revenues (Greenhalgh and Rogers 2007). Many contributions
have shown that patents and patent quality as measured by forward citations
in general have a positive eect on rm value that goes beyond the R&D ex-
penditures of the rm (Hall 2000, Hall, Jae and Trajtenberg 2005, Czarnitzki
and Kraft 2004).
In recent years however, with the increased focus on the notion of probabilistic
patents (Lemley and Shapiro 2005), researchers have more and more stressed
potential negative eects of patents. These negative eects can arise if the
estimated costs of the patent system to an innovator exceed the estimated
benets (Bessen and Meurer 2008a). This is the case if the prot an innovat-
ing rm receives from owning its own patents is smaller than the cost it has to
incur to hold o allegations of patent infringement (Collins 2009, p.1). These
costs may for example be related to the validity decision of the patent. Farrell
and Shapiro (2008) demonstrate that in case of uncertain property rights de-
termining patent validity prior to licensing (as a measure to avoid litigation)
is socially benecial as weak patents can still yield high licensing royalties
because "challenging the patent is a public good for the downstream rms"
(Farrell and Shapiro 2008, p. 1362). And Shapiro (2010) shows that for weak
patents, covering a minor feature of a high-margin product that takes time to
redesign, a large fraction of royalties negotiated during patent litigation can
be attributable to hold-up and not to the value of the patented technology as
such.
If there is a negative impact of patent litigation for patentees or inadvertent
infringers an ex-post tax is imposed on the innovation (Bessen and Meurer
2008b, p. 3) which can result in an ex-ante reduction of innovation incentives
(Bessen and Meurer 2008b, p.26).
Against this background the contribution at hand considers the costs and ben-
2

ets of patents by analysing how patent litigation aects the performance of
the disputing rms. Making use of the fact that patents involved in patent
infringement litigation are generally located the very top of the patent value
distribution (Lanjouw Schankermann 2001, 2004, Cremers 2004) and thus con-
stitute highly valuable intangible assets I expect decisions about the infringe-
ment of these highly valuable patents to be reected in the performance of the
rms involved in litigation.
This paper has two main objectives. The rst objective is to model, in a styl-
ized way, the impact of patent litigation and its outcome on the rm value of
the plainti and the defendant, taking into account the particularities of the
German patent litigation system. The second objective is to empirically test
the hypotheses derived from this stylized model by using changes in credit
rating for German rms as a proxy for changes in rm performance. A condi-
tional dierence-in-dierence approach can be applied to evaluate the eect of
patent litigation on the performance of both plainti and defendant, which is
then analyzed with respect to dierences between trial outcome, trial-specic
characteristics as well as rm characteristics.
I nd evidence that defendants are negatively aected by a loss in trial or a set-
tlement deal, while a victory leaves their rating unchanged. I further show that
small and inexperienced defendants are at a disadvantage compared to larger
and more experienced rms, indicating that they are aected more severely
by business disruption and nancial distress. By contrast I nd a positive
treatment eect of litigation on the plaintis, independent of the outcome
of the case. The results match theoretical considerations on the functioning
of the bifurcated patent litigation system in Germany: The temporal sepa-
ration of decisions on patent infringement claims and corresponding patent
invalidity (counter) claims provides a strategic advantage to the plainti. The
delayed decision of invalidity counterclaims (temporarily) shifts a large share
of the bargaining power to the plaintis as they have little to lose from the
infringement trial. This may lead to defendants being forced into unfavorable
settlement agreements.
This paper builds on the existing literature on the impact of litigation on rm
value, but to my knowledge is the rst to disentagle the eect with respect to
the dierent trial outcomes and the rst to consider the particularities of the
German system.
The remainder of this paper is organized as follows: Section 2 summarizes
3
existing studies on the eect of litigation on rm value. Section 3 presents a
stylized model of the eect of litigation on plaintis and defendants. I derive
several hypotheses on the impact of litigation on rm performance. Section 4
contains the empirical analysis, starting with an argument for credit rating as
a measure for rm performance, followed by the the estimation approach, a
data description and the descriptive analysis. I then present the matching pro-
cedure and terminate with the estimation results and some robustness checks.
Section 5 summarizes the main ndings and concludes.
2 Previous Empirical Literature
Most empirical contributions focusing on the private costs of patent litigation
make use of stock market data and apply event study methods. The basic
concept of the event study methodology in the context of patent infringe-
ment suits is that new information contained in the beginning or termination
of patent infringement litigation leads the market to update its expectations
about future prots and to accordingly adjust the stock market value of the
rm. Abnormal stock returns are then attributed to the litigation eect and
used to quantify the eect of litigation on the market value of the rm.
Bessen and Meurer (2008b) estimate the expected private costs of patent lit-
igation ling by using the event study methodology. Their sample obtained
from Derwent' s LitAlert database covers most patent lawsuits led against
US public rms from 1984 to 1999. They nd that the cumulative abnormal
returns around the ling date of the cases show a loss of 0.62% of the stock
market value for alleged infringers. The eect for patentee litigants is -0.38%.
The expected joint loss to the litigating parties is therefore negative. Consider-
ing factors inuencing the abnormal returns, Bessen and Meurer nd patentee
litigants with high liabilities relative to assets to have more negative returns.
They further nd that belonging to dierent industries increases the loss in
stock market value for the alleged infringer, that small infringers suer larger
losses, and that being sued by a new public rm litigant makes alleged in-
fringers better o. They nd some limited evidence that R&D intensive rms
are aected by more negative returns.
Using a small sample of 65 pairs of plaintis and defendants involved in lit-
4
igation in the information technology industry Raghu et al. (2008) estimate
that the ling of patent infringement litigation has negative eects for the
stock market of the defendant rm, but positive eects for plainti rms. The
combined abnormal returns for the plainti and defendant rms are found to
be negative.
Using a small sample of 108 Taiwanese patent litigation suits in the electronic
industry Wang et al. (2010) nd that patent litigation negatively aects the
prices of the defendants' underlying stocks. Marco (2005) compares market re-
sponses to patent litigation ruling in 475 US patent litigation cases to market
responses to the particular patent's grant und nds that the resolution about
invalidity or infringement is worth as much as the initial patent grant.
Using data on 355 corporate lawsuit ling and settlement announcements in
the Wall Street Journal 1981 to 1983, including patent litigation, Bhagat et al.
(1994) estimate the stock-market reactions to inter-rm litigation. The mar-
ket reaction to the ling of the 20 patent infringement cases included in their
database shows that in the 2-day window ending on the day the case appears
in the Wall Street Journal, the combined market value of the plainti and
defendant falls on average -3.1 percent.
Focusing on US biotech rms between 1980 and 1992 Lerner (1995) nds for
the 26 litigation cases occuring within that period that in the same 2-day
window the combined market-adjusted change in market value of plainti and
defendant falls by two percent.
The major dierence of these contributions to my approach is the fact that
they use stock market data instead of credit rating information. In addition
to this they mostly look at the eect of litigation ling while I dierentiate
between the eect of the dierent outcomes of trial.
3 Theoretical considerations and hypotheses
In order to understand how patent litigation may aect the involved plaintis
and defendants I start by summarizing the main features and specicities of
the German patent litigation system. As the outcome of the trial case is the
most crucial factor for the eect of litigation on the value of a rm, aecting
the market shares and economic freedom of the plainti and defendant, I then
present a simple scheme of the basic eects of dierent trial outcomes on the
5
involved plaintis and defendants. In the subsequent section I relax some of
the assumptions of the model and discuss how further factors may aect the
reaction of the litigator's performance to litigation.
3.1 The German Patent Litigation System
A granted patent, coming from a German patent application or from a Germany-
designated European Patent Oce (EPO) application, becomes national law.
If the patentee or one of his licensors suspects the infringement of the patent
by another rm or an individual, he can send an ocial warning to the in-
fringer (caution), asking him to stop infringing the patented invention and
to provide a legally binding "cease and desist" declaration. If the defendant
does not react, the plainti may le a suit that is aimed at declaring and
prohibiting the infringement as well as dening the damages to be paid to
the patentee/licensee. The defendant may be required to destroy produced
goods that use the disputed technology. The major dierence of the German
system compared to most other systems is the practice of bifurcation, the
separation of nullity and infringement decisions. While patent infringement
cases are dealt with by the district courts, decisions about the nullity of a
patent are dealt with at the German Federal Patent Court. In an infringe-
ment suit the patent is generally assumed to be valid and the decision made
concerns only the infringement action. The threat of a nullication of the dis-
puted patent is thus less prevalent than in most other countries such as the
US. It is however possible and common practice for the defendant to le a
nullity suit at the Federal Patent Court as a defense to the infringement suit.
In this case, given that the nullity suit has some chance of success, the district
courts will sometimes defer their decision until the nullity suit has been de-
cided. Usually however, the invalidity suit is not decided yet when a decision
about infringement is rendered. The delayed decision of invalidity trials at the
German Patent Court connected to infringement trials at the district courts
is frequently referred to as injunction gap or injunction trap, hinting at the
temporal incongruities of these interconnected trials. A visalization of this can
be found in Appendix 7.2. Given that an additional trial with new costs risks
has to be opened by the defendant the hurdle to le a nullity claim is much
higher than in systems without bifurcation. The risk for the patent owner of
6
losing the monopoly rights thus still exists, but only through an indirect link.
The losing party is obliged to pay the attorney fees of the winning party and
the court costs. The attorney and court fees are being calculated according to
a formula based on the estimated value of the dispute. For a detailed overview
on the infringement proceedings in Germany please refer to European Patent
Oce (2010), Busche et al. (2010), Pitz (2010) and Stauder (1989).
3.2 A Simple Model of the Eect of Litigation on Plainti and Defendant
The following scheme depicts in a stylized way the pre- and post-trial payos
from using the patented technology for the plainti and defendant. I suppose
that there are only two rms producing a similar product with the technology,
which is claimed to be patent protected by the patentee. Prior to litigation the
market is split between the two rms, such that both obtain a payo of 1/2V ,
the prot to be obtained from that particular product in the German market.
V denotes the overall prot to be obtained from the market, D denotes the
damages to be paid by the defendant in case of losing and C denotes the trial
costs. P stands for the expected probability of the plainti prevailing in trial.
I assume the decision by the court to be rendered immediately such that there
are no costs of delay or business disruption and I assume that no decision
about the validity of the patent will be involved.
7
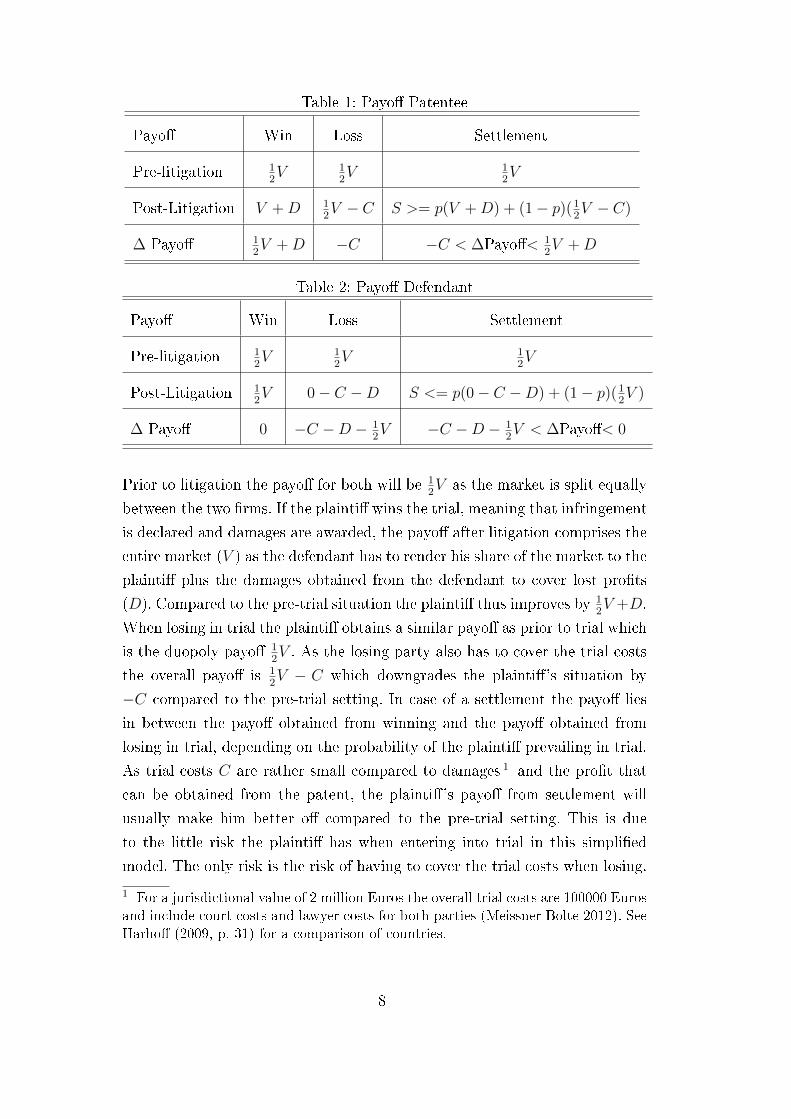
Table 1: Payo Patentee
Payo Win Loss Settlement
Pre-litigation 12V 1
2V 1
2V
Post-Litigation V +D 12V − C S >= p(V +D) + (1− p)(1
2V − C)
∆ Payo 12V +D −C −C < ∆Payo< 1
2V +D
Table 2: Payo Defendant
Payo Win Loss Settlement
Pre-litigation 12V 1
2V 1
2V
Post-Litigation 12V 0− C −D S <= p(0− C −D) + (1− p)(1
2V )
∆ Payo 0 −C −D − 12V −C −D − 1
2V < ∆Payo< 0
Prior to litigation the payo for both will be 12V as the market is split equally
between the two rms. If the plainti wins the trial, meaning that infringement
is declared and damages are awarded, the payo after litigation comprises the
entire market (V ) as the defendant has to render his share of the market to the
plainti plus the damages obtained from the defendant to cover lost prots
(D). Compared to the pre-trial situation the plainti thus improves by 12V +D.
When losing in trial the plainti obtains a similar payo as prior to trial which
is the duopoly payo 12V . As the losing party also has to cover the trial costs
the overall payo is 12V − C which downgrades the plainti's situation by
−C compared to the pre-trial setting. In case of a settlement the payo lies
in between the payo obtained from winning and the payo obtained from
losing in trial, depending on the probability of the plainti prevailing in trial.
As trial costs C are rather small compared to damages 1 and the prot that
can be obtained from the patent, the plainti's payo from settlement will
usually make him better o compared to the pre-trial setting. This is due
to the little risk the plainti has when entering into trial in this simplied
model. The only risk is the risk of having to cover the trial costs when losing.
1 For a jurisdictional value of 2 million Euros the overall trial costs are 100000 Euros
and include court costs and lawyer costs for both parties (Meissner Bolte 2012). See
Harho (2009, p. 31) for a comparison of countries.
8
Given that trial costs are rather negligible compared to the other costs such
as damages, it becomes clear that the average eect of litigation on plaintis
should be positive.
The situation for the defendant is dierent. If he wins the pre-trial situation
is unchanged as the two rms keep sharing the market. If, however, he loses in
trial he has to give up his share of the market, pay damages and cover the trial
costs, which makes him denitely worse o. In case of a settlement deal the
best case would be a payo as in case of a victory which leaves the pre-trial
situation unchanged. All other possible settlement deals make the defendant
worse o compared to the pre-trial setting.
This very simplistic setting demonstrates that the plainti is generally at an
advantage as he has far less to lose from trial than the defendant. In two out
of three possible outcomes (win and settle) the plainti is likely to improve
his situation, whereas a loss will only result in comparatively little costs. The
defendant on the contrary is likely to worsen in two out of three possible
outcomes (loss and settle) and to not experience any change in case of winning.
This leads to the following hypotheses:
Hypothesis 1: The average eect of litigation on defendants is expected to
be negative, while the average eect on plaintis is expected to be positive.
Hypothesis 2: A loss or a settlement outcome negatively aects the rm
value of the defendant while winning keeps his rm value unchanged. A loss
is expected to have a more severe impact than a settlement outcome.
Hypothesis 3: A victory or a settlement outcome positively aects the rm
value of the plainti while losing keeps the rm value unchanged.
3.3 The Role of Uncertainty
The above model abstracts from some important features of patent litigation
reality to stress the main eects expected from the dierent outcomes of lit-
igation. I will now consider additional factors aecting rm value that come
into play when relaxing two of the model assumptions. The rst assumption
9
that needs to be relaxed is that the court immediately renders a decision. This
assumption implies that there are no costs of delay or business disruption and
that the business partners of the involved rms do not take notice of the trial.
In reality the average patent litigation trial however takes almost 1 year. Dur-
ing this period the involved rms and their business partners face uncertainty
about outcome and costs of the trial. This may lead to interrupted business
activities; taking out a loan may become more dicult and the distraction of
management may result in inecient investments (Bhagat et al. 1994). The
empirical literature on nancial distress suggests that these costs are sub-
stantial 2 . A rm's ability to deal with business disruption and nancial or
economic distress depends on its overall size, experience and diversication of
risk. As suggested by previous literature on patent litigation I expect small
rms to be aected more severely by litigation than larger rms due to less
nancial exibility. I expect this eect to be more pronounced for defendants
as these are the ones that may be faced with a preliminary injunction and the
risk of no longer being able to use a technology, which may alter their busi-
ness partner's willingness to sign business contracts. I further expect rms
with prior experience in IP disputes to be able to deal with uncertainty and
distress more easily which should be reected in repeat litigators being bet-
ter o from litigation than rst-time litigators. Regarding the diversication
of risk I expect the impact of uncertainty costs to be more pronounced if a
patent is particularly important to the business of the patentee or infringer.
The stakes in the case will be measured in three dierent ways. The rst mea-
sure diers for plaintis and defendants: For defendants it is dummy variable
indicating whether the defendant is a trader rather than a producer of goods
using the patented technology. It is supposed to capture whether the defen-
dants production facility depends on the disputed technology and may have
to pause during trial or may have to be changed when losing the case. For the
plaintis I build a similar measure that indicates whether the plainti is a sim-
ple licensee compared to being the patentee himself or the exclusive licensee.
The stakes for patentees or exclusive licensees are expected to be much higher
than for a rm that is a licensee among numerous other licensees. The second
2 In their case study Cutler and Summers (1988) examine capital-market reactions
to dierent events in the lawsuit Pennzoil vs. Texaco and show that for every dollar
Texaco lost, Pennzoil gained only 17 cents. They attribute this to the nancial
distress imposed on Texaco by the lawsuit (Bhagat et al. 1994).
10
measure relates the value at stake to the overall turnover of the rm. If the
relative importance is small, the eect of litigation is expected to be small as
well, whereas a rm that highly relies on the disputed technology should be
aected more severely. The third measure of the involved stakes is the number
of fellow plaintis or defendants. These considerations lead to the next three
hypotheses.
Hypothesis 4: The eect of litigation is more severe for small rms.
Hypothesis 5: Repeat litigants have an advantage in coping with litigation
compared to rst time litigants.
Hypothesis 6: Parties with lower stakes are aected less severely by litigation
than parties with high stakes in the case.
3.4 The Role of Nullity Suits
The second model assumption that needs to be relaxed is that no decision
about the validity of the patent will be involved, such that the plaintis over-
all risk in the case is rather small. The bifurcation system in Germany is
characterized by an indirect link of infringement and nullity trials. Though in-
fringement trials generally assume the disputed patent to be valid it is possible
for the defendant to le an invalidity suit at the German Patent Court as an
act of defense to the accusation of infringement (Again see Appendix 7.2 for a
owchart of the process). The possibility of ling a nullity suit shifts some of
the risk to the plainti that suddenly may be faced by the threat of losing his
monopoly right. The nullity suit led at the German Patent Court can either
be allowed or rejected. If rejected the defendant faces the court costs for this
additional trial, and the infringement trial continues as before. If the nullity
suit is accepted there are two options: Either the infringement trial continues
as usual and the decision about validity is delivered ex post or, in high doubt
of the validity of the patent, the infringement trial is put on hold until the
validity question has been resolved. In the rst case the infringement trial
is not disturbed by the validity decision and the rm value of the rms will
not yet be aected by any validity decisions, but only by the outcome of the
infringement trial. If the infringement trial is delayed until the decision about
11
the validity of the patent and the patent is declared invalid the infringement
suit will be dropped. In this case the plainti loses his monopoly right and has
to cover the trial costs. Interviews with lawyers and anecdotal evidence sug-
gests that putting a case on hold for the nullity proceedings rarely happens.
This implies that in most cases the nullity suit should not have an immediate
impact on the rm value of the plainti. If however a patent is (partially)
invalidated while the infringement trial is put on hold this should negatively
aect the rm value of the plainti. The plainti then has to cover the trial
costs and accept the loss of his monopoly right. As I am able to match the
litigated patents to a database from the German Patent Oce, containing all
invalidity trials at the German Patent Court, I am able to identify whether a
patent has been partially or entirely invalidated during the infringement trial.
As expected this rarely happens. For thirty percent of the cases a nullity suit
is led, which results in a (partial) invalidation in 20 percent of the nullity
suits (6 percent of all cases) 3 . However, I observe an invalidation that is de-
cided upon during the proccedings of the infringement suit for only 13 of our
observations, which is less than 1 percent of all cases. I expect the rare event
of nullication during trial to signicantly aect the rm value of the plainti.
Hypothesis 7a: If a nullity suit comes up during trial and the patent is
(partially) invalidated while the infringement case is put on hold the rm
value of the plainti is negatively aected.
Hypothesis 7b: On the contrary I expect a positive eect for the defendant
that will prot in form of a win in trial or a very favorable settlement deal if
the patent is invalidated during trial.
3 All other nullity suits are either abandoned because of a settlement deal or the
patent has been upheld. The data provided by the German Patent Oce unfortu-
nately does not distinguish between these 2 options.
12
4 Empirical Analysis
4.1 Credit Rating as Approach to Measure the Private Value of Intellectual
Property
Empirical studies so far have estimated the impact of litigation by using the
market value approach. The classical market value approach introduced into
the innovation literature by Griliches (1981) and put forward extensively by
Hall(2000) and Hall et al. (2005) is based on the idea that the private returns
to innovative activity can be measured via the market value of that rm 4 .
The advantage of the market value approach is that data is available on a
daily basis and changes can thus be identied precisely using the event study
methodology. The most severe drawback is that it is only feasible for rms
listed in the stock market which reduced the size of the sample. For Germany
where only a small share of all rms is listed in the stock market, such a
sample would not be representative for the entire economy.
To address this shortcoming I follow Czarnitzki and Kraft (2004, 2007) who
have rst used credit rating data for German rms to analyze the impact of
innovation activities on rm value. Credit rating information is available for
almost every rm looking for bank loans or supplier credits and thus covers a
much broader range of companies. While stock market data is associated with
the market's expectation of future prots and may well be aected by short-
term uctuation in shareholder condence, credit rating information is based
on the evaluation of default risk by a rating agency that rates basically all
German rms. The German credit rating agency Creditreform provides credit
rating data calculated based on business and nancial risks, such as industry
characteristics, competitive position, management, productivity, protability,
liquidity as well as nancial policy and exibility. "Thus a rating reects both
currently observable rm characteristics and expectations regarding future
developments"(Czarnitzki and Kraft 2004, p. 378), which makes it suitable as
a proxy for changes in rm value or performance. The index takes values from
100 to 600, with 100 being the best possible rating and 600 denoting default
and insolvency procedures.
4 For papers that have analyzed the market value of patent applications and grants
see for example Austin (1993) and Darby et al. (2004)
13
4.2 Estimation Approach
Given the theoretical considerations and the advantages of using changes in
credit rating data as a proxy for changes in rm performance, the idea of the
empirical approach is to analyze the impact of being involved in patent litiga-
tion on the credit rating of the rm. This is the dierence between the rating of
a rm having been involved in litigation and the rating of that rm in case of
not having been involved in litigation. The main challenge for this empirical
methodology is the estimation of the so-called counterfactual situation, the
rating of the rm had it not been involved in litigation. As factors aecting
the litigation probability are at the same time aecting the future rm perfor-
mance, the treatment (being involved in litigation) is an endogenous variable
in the estimation of rm performance. The econometric literature on treat-
ment eects suggests a number of methods that can be applied to control for
this endogeneity problem (Blundell and Costa-Dias 2009). I will apply the con-
ditional dierence-in-dierence estimator, a mixture of the matching method
and the dierence in dierence estimator, in this paper. The DiD estimator is
estimated as the dierence between the outcome of the treated rm after the
treatment and the outcome of the treated rm prior to its treatment. In order
to control for general macroeconomic changes a second dierence is calculated
between the outcome of a non-treated control sample observed for the same
time period that matches with respect to a set of observable characteristics
that aect the selection into treatment. The dierence in rating between the
treatment group and the matched group of twin rms can then be attributed
to the litigation eect. A detailed description of this estimator can be found
in the Appendix.
4.3 Data
This paper is based on rm-level patent litigation data of German rms. The
underlying patent litigation database comprises litigation court records cov-
ering about 80% of all patent litigation cases led in Germany between 2000
and 2008. As no centralized register exists this comprehensive database has
been collected manually by going into the archives of the three major patent
litigation courts in Germany. For this analysis the most relevant information
14

available in this database is the identity of plaintis and defendants, the patent
number of the litigated patents, the start and end date and the outcome of
trial. I further use information on the value of the court case and the relation-
ship of the involved plaintis and defendants to the disputed patent.
The litigation trials handle disputes about the infringement of German patents
that can arise between German and foreign rms active in the German mar-
ket. I restrict the analysis to German rms involved in litigation as plaintis
or defendants as rm level data and credit rating information is available for
Germany only.
These rms have been matched to the Mannheim Enterprise Panel, a biannual
panel data set of rms located in Germany maintained at ZEW in cooperation
with Creditreform, the largest business information service in Germany. The
Mannheim Enterprise Panel contains detailed rm data, amongst others, on
employment, sales, legal form, founding date, sectors, bankruptcy events and
the credit rating. The Mannheim Enterprise Panel has been matched to patent
applications at the European Patent oce such that I can construct a patent
stock variable for each rm as well as the distribution of the patent stock
across six broad technology areas. In addition to providing rm information
for rms involved in litigation the Mannheim Enterprise Panel is also used as
basis for the control group.
4.4 Descriptives
The unit of analysis is a rm-trial case observation, a rm involved in a par-
ticular court case as either plainti or defendant. After dropping those cases
starting prior to 2001, where no rating information was available yet, I obtain
4243 rm-trial observations for the period 2001 to 2008. These observations
involve 2406 rms. Before starting a detailed description of the database used
I have to pay close attention to the possibility that a rm may be involved
in dierent trials that overlap with respect to the time frame of the trials. A
rm can obviously be involved in several trials at the same time that either
start or end in the same year or just overlap for some of the trial time. If
this is the case changes in rating cannot unambiguously be attributed to one
particular trial case and its outcome. 538 out of the 2406 rms involved in
litigation are involved in multiple overlapping trials at once. I chose to ex-
15
clude those overlapping rm-trial observations from the database in order to
reduce the blurring eect of confounding parallel trials 5 . I need to keep in
mind that by doing so I exclude the very litigious rms that are constantly
involved in patent litigation trials and thereby no longer analyse the entire
population of litigation cases. This restriction reduces the database to 2171
rm-trial observations. For 1558 of those observations I observe the change in
credit rating from half a year prior to trial to half a year after the end of trial.
This database then contains 1432 dierent rms and 1244 court cases, indi-
cating that rms can appear multiple (non-overlapping) times and one trial
case can appear in combination with dierent rms, which can be dierent
plaintis or defendants.
The dependent variable of interest is the change in credit rating half a year
after trial compared to half a year prior to trial. This variable compares the
valid credit rating of a rm shortly after trial has ended to the last valid pre-
trial rating that is observed within the 6 month prior to trial. As credit rating
is dened on a scale from 100 to 600, with 100 indicating the best and 600 the
worst possible rating, a positive delta can be interpreted as a worsening of the
rating while a negative delta indicates an improvement of the rating 6 . Table
3 summarizes the change in rating for all rm-trial observations and distin-
guishes between plaintis and defendants as well as the dierent outcomes of
trial. I see that on average the rating increases by 9.6 rating points, which
indicates a worsening of the rating. Looking at plaintis and defendants sep-
arately I nd that the change in rating diers signicantly between plaintis
and defendants. The rating for defendants increases by 12.2 points while the
rating for plaintis increases by only 5.4 points. This dierence is statistically
signicant at a 5% signicance level. When taking into account the outcome
of trial, which can be a victory, a loss, a settlement or a partial victory/loss,
I nd that the change in rating varies with respect to the outcome of trial.
While the dierences across outcomes are not signicant in the group of plain-
tis there are highly signicant dierences between winning and losing in the
5 This excludes 22% of the rms involved in litigation.6 The rating is available to us on a half-yearly basis, such that we obtain the most
recent rating every 6 months. If there is no change in rating the previous rating is
reported as it does not lose validity. The rating of a rm is updated upon request
and adapted every time one of the input values (such as expected turnover, order
situation) changes. Larger rms are also researched without request on a regular
basis.
16
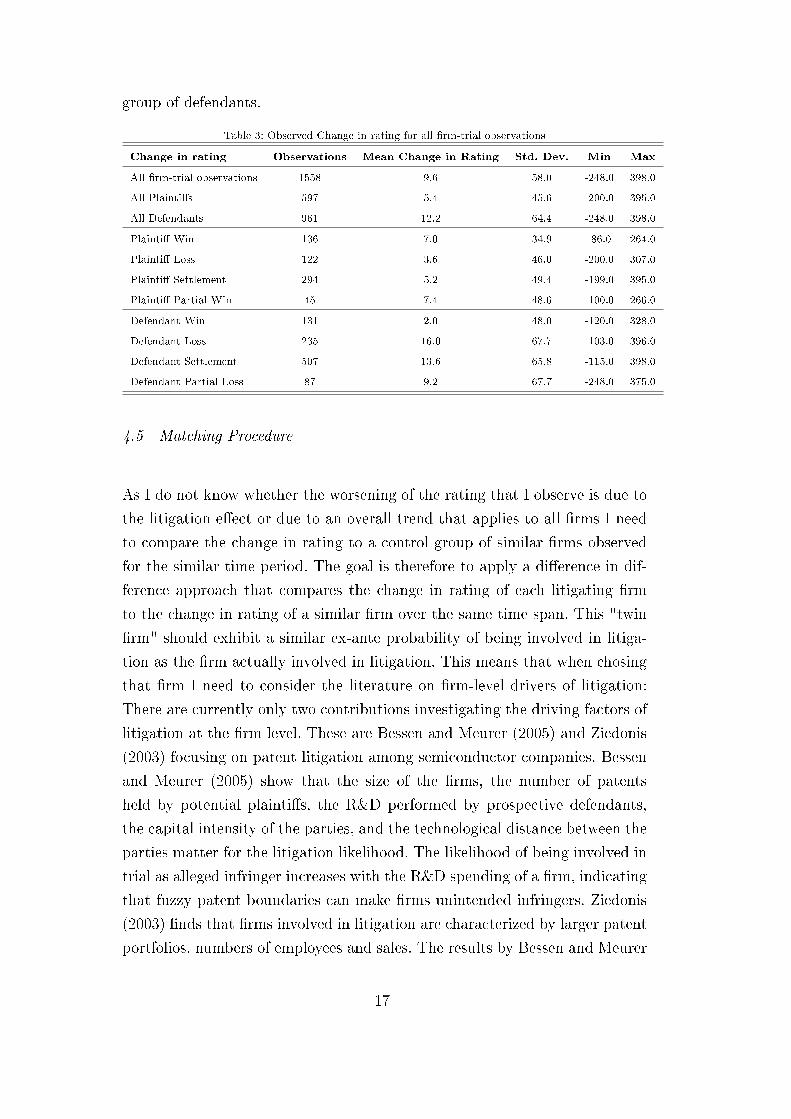
group of defendants.
Table 3: Observed Change in rating for all rm-trial observations
Change in rating Observations Mean Change in Rating Std. Dev. Min Max
All rm-trial observations 1558 9.6 58.0 -248.0 398.0
All Plaintis 597 5.4 45.6 -200.0 395.0
All Defendants 961 12.2 64.4 -248.0 398.0
Plainti Win 136 7.0 34.9 -86.0 264.0
Plainti Loss 122 3.6 46.0 -200.0 307.0
Plainti Settlement 294 5.2 49.4 -199.0 395.0
Plainti Partial Win 45 7.4 48.6 -100.0 266.0
Defendant Win 131 2.0 48.0 -120.0 328.0
Defendant Loss 235 16.0 67.7 -103.0 396.0
Defendant Settlement 507 13.6 65.8 -115.0 398.0
Defendant Partial Loss 87 9.2 67.7 -248.0 375.0
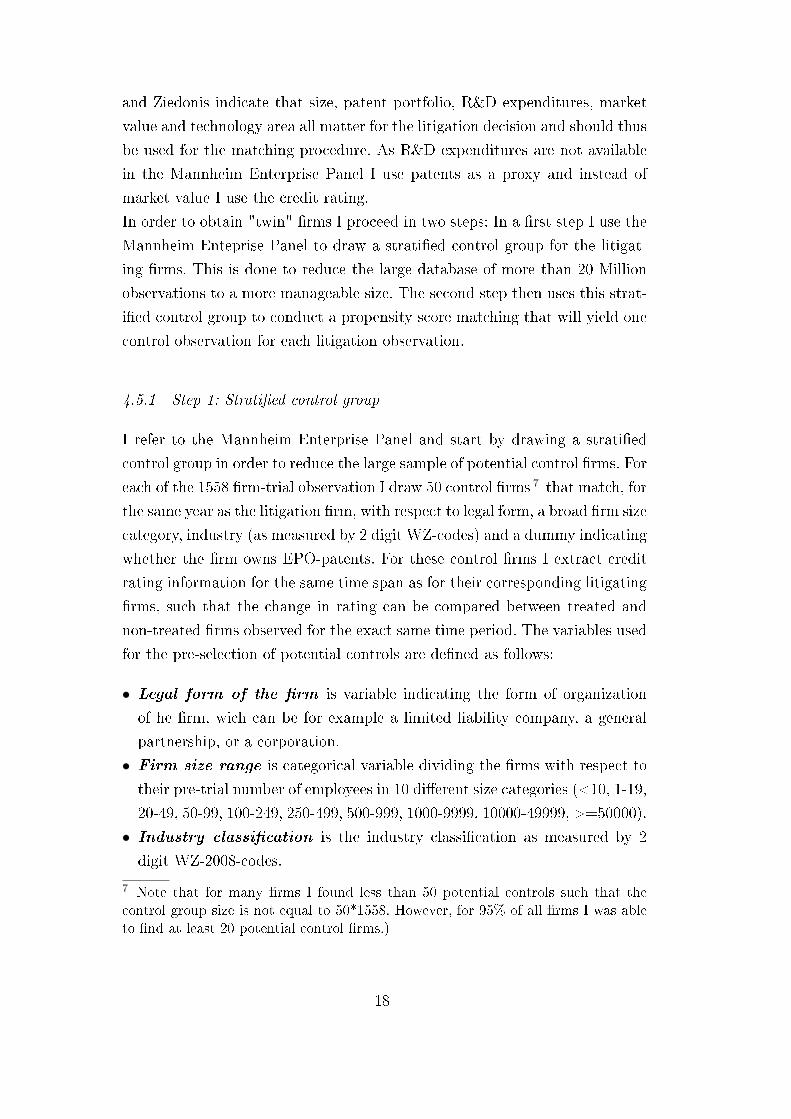
4.5 Matching Procedure
As I do not know whether the worsening of the rating that I observe is due to
the litigation eect or due to an overall trend that applies to all rms I need
to compare the change in rating to a control group of similar rms observed
for the similar time period. The goal is therefore to apply a dierence in dif-
ference approach that compares the change in rating of each litigating rm
to the change in rating of a similar rm over the same time span. This "twin
rm" should exhibit a similar ex-ante probability of being involved in litiga-
tion as the rm actually involved in litigation. This means that when chosing
that rm I need to consider the literature on rm-level drivers of litigation:
There are currently only two contributions investigating the driving factors of
litigation at the rm level. These are Bessen and Meurer (2005) and Ziedonis
(2003) focusing on patent litigation among semiconductor companies. Bessen
and Meurer (2005) show that the size of the rms, the number of patents
held by potential plaintis, the R&D performed by prospective defendants,
the capital intensity of the parties, and the technological distance between the
parties matter for the litigation likelihood. The likelihood of being involved in
trial as alleged infringer increases with the R&D spending of a rm, indicating
that fuzzy patent boundaries can make rms unintended infringers. Ziedonis
(2003) nds that rms involved in litigation are characterized by larger patent
portfolios, numbers of employees and sales. The results by Bessen and Meurer
17
and Ziedonis indicate that size, patent portfolio, R&D expenditures, market
value and technology area all matter for the litigation decision and should thus
be used for the matching procedure. As R&D expenditures are not available
in the Mannheim Enterprise Panel I use patents as a proxy and instead of
market value I use the credit rating.
In order to obtain "twin" rms I proceed in two steps: In a rst step I use the
Mannheim Enteprise Panel to draw a stratied control group for the litigat-
ing rms. This is done to reduce the large database of more than 20 Million
observations to a more manageable size. The second step then uses this strat-
ied control group to conduct a propensity score matching that will yield one
control observation for each litigation observation.
4.5.1 Step 1: Stratied control group
I refer to the Mannheim Enterprise Panel and start by drawing a stratied
control group in order to reduce the large sample of potential control rms. For
each of the 1558 rm-trial observation I draw 50 control rms 7 that match, for
the same year as the litigation rm, with respect to legal form, a broad rm size
category, industry (as measured by 2 digit WZ-codes) and a dummy indicating
whether the rm owns EPO-patents. For these control rms I extract credit
rating information for the same time span as for their corresponding litigating
rms, such that the change in rating can be compared between treated and
non-treated rms observed for the exact same time period. The variables used
for the pre-selection of potential controls are dened as follows:
• Legal form of the rm is variable indicating the form of organization
of he rm, wich can be for example a limited liability company, a general
partnership, or a corporation.
• Firm size range is categorical variable dividing the rms with respect to
their pre-trial number of employees in 10 dierent size categories (<10, 1-19,
20-49, 50-99, 100-249, 250-499, 500-999, 1000-9999, 10000-49999, >=50000).
• Industry classication is the industry classication as measured by 2
digit WZ-2008-codes.
7 Note that for many rms I found less than 50 potential controls such that the
control group size is not equal to 50*1558. However, for 95% of all rms I was able
to nd at least 20 potential control rms.)
18
• EP Dummy is a dummy indicating whether the rm owns EPO-patents.
Table 4 and 5 compare the litigating rms, distinguishing between plaintis
and defendants, to their samples of potential control rms with respect to the
observed change in credit rating, the pre-trial rating, the size as measured by
employees, and the technology distribution of the rm's patent stock. While
there is obviously no signicant dierence with respect to the set of variables
used for stratifying the group of potential controls (not reported) I nd that
the average patent stock, the size of the companies and particularly the pre-
trial rating dier signicantly. When conducting a matching to obtain a more
similar control sample the most important factor will be matching on the pre-
trial rating as the treatment group, both for plaintis and defendants, exhibits
an about 15 rating points better rating than the control group.
The variable of interest, the change in rating, diers between the plainti
and defendants and their respective potential control groups. The dierence is
only signicant for the group of plaintis compared to their potential control
group. While the rating increases by 8.9 points for the potential control group
it only increases by 5.4 points for the plaintis, indicating that plaintis on
average prot from litigation. At this point of the analysis I nd a signicant
treatment eect of being involved in litigation as plainti, but no eect for
defendants.
19
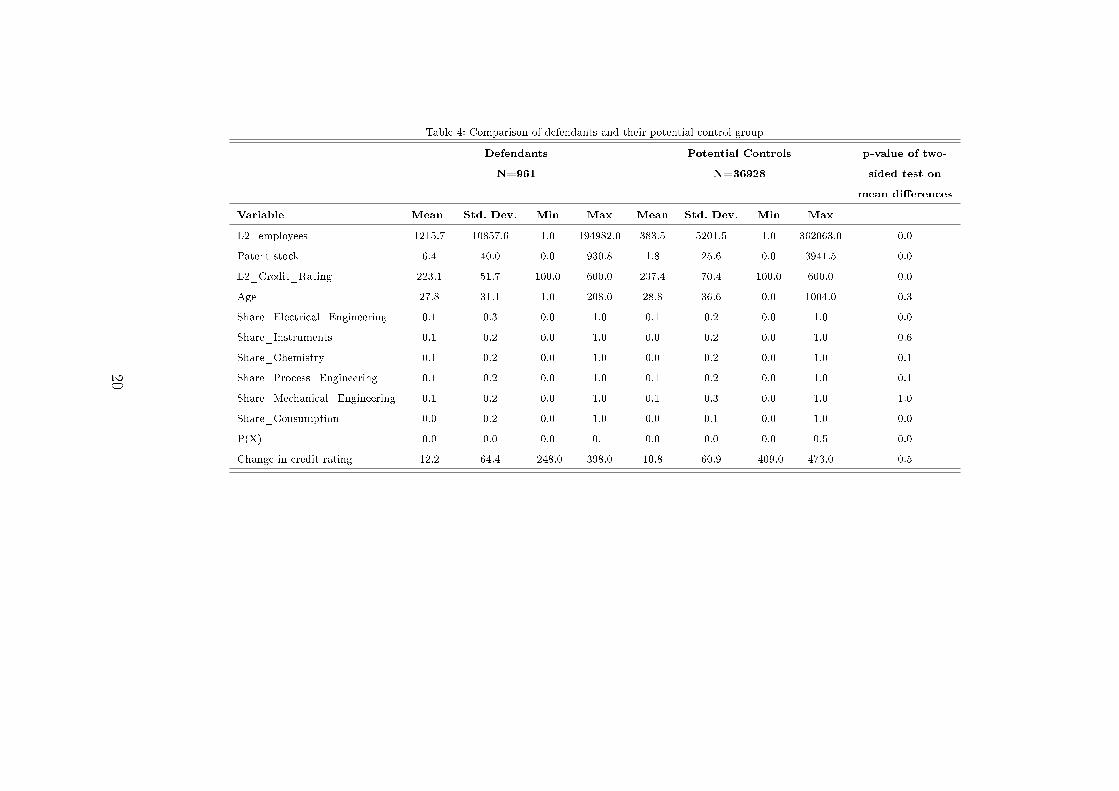
Table 4: Comparison of defendants and their potential control group
Defendants Potential Controls p-value of two-
N=961 N=36928 sided test on
mean dierences
Variable Mean Std. Dev. Min Max Mean Std. Dev. Min Max
L2_employees 1215.7 10857.6 1.0 194982.0 383.5 5201.5 1.0 362063.0 0.0
Patent stock 6.4 40.0 0.0 930.8 1.8 25.6 0.0 3941.5 0.0
L2_Credit_Rating 223.1 51.7 100.0 600.0 237.4 70.4 100.0 600.0 0.0
Age 27.8 31.1 1.0 208.0 28.8 36.6 0.0 1004.0 0.3
Share_Electrical_Engineering 0.1 0.3 0.0 1.0 0.1 0.2 0.0 1.0 0.0
Share_Instruments 0.1 0.2 0.0 1.0 0.0 0.2 0.0 1.0 0.6
Share_Chemistry 0.1 0.2 0.0 1.0 0.0 0.2 0.0 1.0 0.1
Share_Process_Engineering 0.1 0.2 0.0 1.0 0.1 0.2 0.0 1.0 0.1
Share_Mechanical_Engineering 0.1 0.2 0.0 1.0 0.1 0.3 0.0 1.0 1.0
Share_Consumption 0.0 0.2 0.0 1.0 0.0 0.1 0.0 1.0 0.0
P(X) 0.0 0.0 0.0 0.1 0.0 0.0 0.0 0.5 0.0
Change in credit rating 12.2 64.4 -248.0 398.0 10.8 60.9 -409.0 473.0 0.5
20
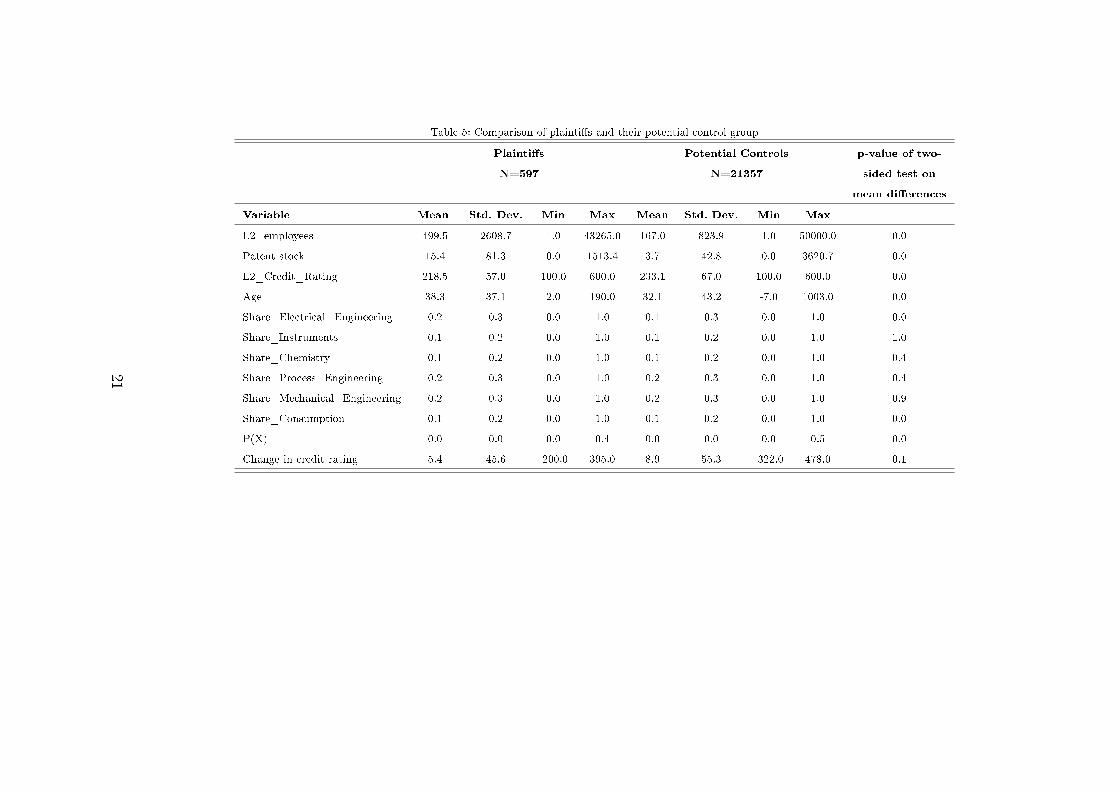
Table 5: Comparison of plaintis and their potential control group
Plaintis Potential Controls p-value of two-
N=597 N=21357 sided test on
mean dierences
Variable Mean Std. Dev. Min Max Mean Std. Dev. Min Max
L2_employees 499.5 2608.7 1.0 43265.0 167.0 823.9 1.0 50000.0 0.0
Patent stock 15.4 81.3 0.0 1513.4 3.7 42.8 0.0 3620.7 0.0
L2_Credit_Rating 218.5 57.0 100.0 600.0 233.1 67.0 100.0 600.0 0.0
Age 38.3 37.1 2.0 190.0 32.1 43.2 -7.0 1003.0 0.0
Share_Electrical_Engineering 0.2 0.3 0.0 1.0 0.1 0.3 0.0 1.0 0.0
Share_Instruments 0.1 0.2 0.0 1.0 0.1 0.2 0.0 1.0 1.0
Share_Chemistry 0.1 0.2 0.0 1.0 0.1 0.2 0.0 1.0 0.4
Share_Process_Engineering 0.2 0.3 0.0 1.0 0.2 0.3 0.0 1.0 0.4
Share_Mechanical_Engineering 0.2 0.3 0.0 1.0 0.2 0.3 0.0 1.0 0.9
Share_Consumption 0.1 0.2 0.0 1.0 0.1 0.2 0.0 1.0 0.0
P(X) 0.0 0.0 0.0 0.4 0.0 0.0 0.0 0.5 0.0
Change in credit rating 5.4 45.6 -200.0 395.0 8.9 55.3 -322.0 478.0 0.1
21

4.5.2 Step 2: Propensity Score Matching
In order to make sure that the control rms also match with respect to the
pre-trial date rating, the exact size, and the structure and size of their patent
portfolio I chose to follow a propensity score matching approach. This should
yield a control group that does no longer dier to the treatment group with
respect to these observables. Using the large sample of control rms already
stratied by sector, size, legal form and a patent dummy I conduct two propen-
sity score matchings, one for the plaintis and one for the defendants. I do so
by estimating two separate probit models for the treatments "plainti" and
"defendant" as theoretical considerations as well as existing empirical evidence
suggests that being involved as plainti or defendant is driven by dierent fac-
tors and that plaintis and defendants are aected dierently by litigation.
The variables used to conduct the matching in order to obtain an even more
similar control group are dened as follows:
• L2.Credit_Rating measures the rating of the rm prior to the ling date
of the court case.
• L2.Employees measures the number of employees prior to the ling date
of the court case.
• Age measures the age of the rm in years at the beginning of trial.
• Patent stock measures the rm's patent stock at the time of trial. It is
measured by calculation the stock of EPO patent applications of the rm
starting from 1978 and by applying a depreciation rate of 15%.
• Technology distribution measures the the technology distribution of the
rm's patent stock over the 6 technology classes Electrical Engineering,
Instruments, Chemistry, Process Engineering, Mechanical Engineering and
Consumption.
22
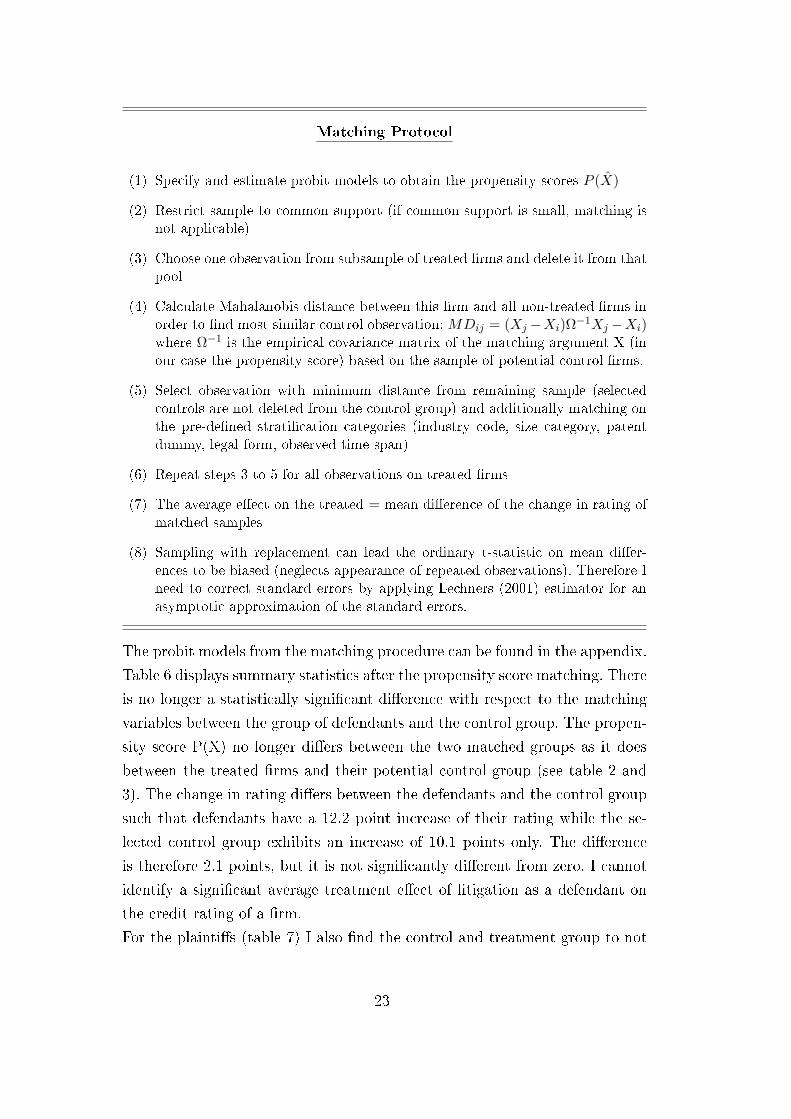
Matching Protocol
(1) Specify and estimate probit models to obtain the propensity scores P (X)
(2) Restrict sample to common support (if common support is small, matching is
not applicable)
(3) Choose one observation from subsample of treated rms and delete it from that
pool
(4) Calculate Mahalanobis distance between this rm and all non-treated rms in
order to nd most similar control observation: MDij = (Xj −Xi)Ω−1Xj −Xi)
where Ω−1 is the empirical covariance matrix of the matching argument X (in
our case the propensity score) based on the sample of potential control rms.
(5) Select observation with minimum distance from remaining sample (selected
controls are not deleted from the control group) and additionally matching on
the pre-dened stratication categories (industry code, size category, patent
dummy, legal form, observed time span)
(6) Repeat steps 3 to 5 for all observations on treated rms
(7) The average eect on the treated = mean dierence of the change in rating of
matched samples
(8) Sampling with replacement can lead the ordinary t-statistic on mean dier-
ences to be biased (neglects appearance of repeated observations). Therefore I
need to correct standard errors by applying Lechners (2001) estimator for an
asymptotic approximation of the standard errors.
The probit models from the matching procedure can be found in the appendix.
Table 6 displays summary statistics after the propensity score matching. There
is no longer a statistically signicant dierence with respect to the matching
variables between the group of defendants and the control group. The propen-
sity score P(X) no longer diers between the two matched groups as it does
between the treated rms and their potential control group (see table 2 and
3). The change in rating diers between the defendants and the control group
such that defendants have a 12.2 point increase of their rating while the se-
lected control group exhibits an increase of 10.1 points only. The dierence
is therefore 2.1 points, but it is not signicantly dierent from zero. I cannot
identify a signicant average treatment eect of litigation as a defendant on
the credit rating of a rm.
For the plaintis (table 7) I also nd the control and treatment group to not
23

dier signicantly with respect to the matching variables, indicating that the
matching was successful. The increase in rating however is 8.6 rating points
higher for the selected control group compared to the plaintis. I therefore
nd a positive treatment eect for plaintis 8 .
Table 6: Comparison of defendants and their selected control group
Defendants Selected Controls p-value of two-
N=961 N=961 sided test on
mean dierences
Variable Mean Std. Dev. Mean Std. Dev.
L2_employees 1215.68 10857.55 1525.21 16020.20 0.62
Patent stock 6.38 40.03 4.45 41.25 0.299
L2_Credit_Rating 223.13 51.65 221.05 52.41 0.381
Age 27.81 31.0568 29.14 32.26 0.355
Share_Electrical_Engineering_Patents 0.10 0.26 0.09 0.26 0.794
Share_Instruments_Patents 0.05 0.19 0.05 0.20 0.692
Share_Chemistry_Patents 0.05 0.19 0.05 0.19 0.703
Share_Process_Engineering_Patents 0.09 0.24 0.09 0.25 0.968
Share_Mechanical_Engineering_Patents 0.09 0.24 0.09 0.25 0.703
Share_Consumption_Patents 0.04 0.16 0.04 0.17 0.561
P(X) 0.03 0.03 0.03 0.01 0.538
Change in credit rating 12.20 64.35 10.13 54.53 0.447
8 Note that for plaintis, defendants as well as their matched control groups there
is no change in rating for about 40 percent of the observations.
24
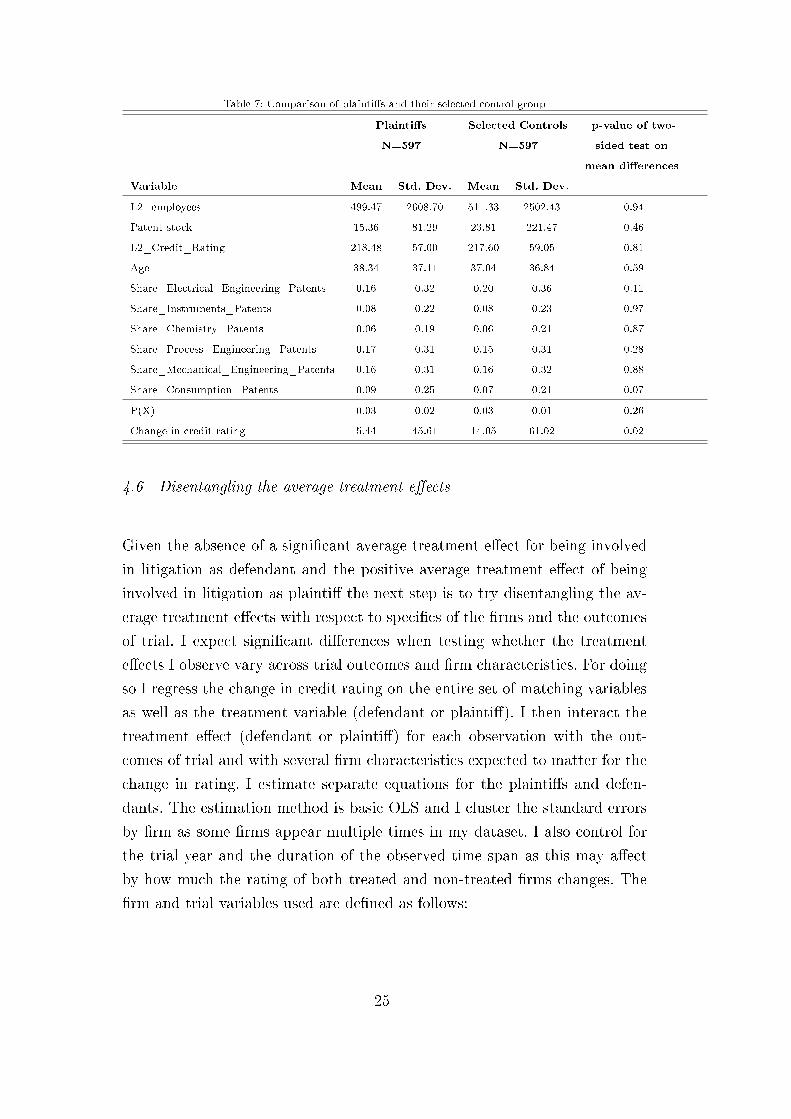
Table 7: Comparison of plaintis and their selected control group
Plaintis Selected Controls p-value of two-
N=597 N=597 sided test on
mean dierences
Variable Mean Std. Dev. Mean Std. Dev.
L2_employees 499.47 2608.70 511.33 2502.43 0.94
Patent stock 15.36 81.29 23.81 221.47 0.46
L2_Credit_Rating 218.48 57.00 217.60 59.05 0.81
Age 38.34 37.11 37.04 36.84 0.59
Share_Electrical_Engineering_Patents 0.16 0.32 0.20 0.36 0.11
Share_Instruments_Patents 0.08 0.22 0.08 0.23 0.97
Share_Chemistry_Patents 0.06 0.19 0.06 0.21 0.87
Share_Process_Engineering_Patents 0.17 0.31 0.15 0.31 0.28
Share_Mechanical_Engineering_Patents 0.16 0.31 0.16 0.32 0.88
Share_Consumption_Patents 0.09 0.25 0.07 0.21 0.07
P(X) 0.03 0.02 0.03 0.01 0.26
Change in credit rating 5.44 45.61 14.05 61.02 0.02
4.6 Disentangling the average treatment eects
Given the absence of a signicant average treatment eect for being involved
in litigation as defendant and the positive average treatment eect of being
involved in litigation as plainti the next step is to try disentangling the av-
erage treatment eects with respect to specics of the rms and the outcomes
of trial. I expect signicant dierences when testing whether the treatment
eects I observe vary across trial outcomes and rm characteristics. For doing
so I regress the change in credit rating on the entire set of matching variables
as well as the treatment variable (defendant or plainti). I then interact the
treatment eect (defendant or plainti) for each observation with the out-
comes of trial and with several rm characteristics expected to matter for the
change in rating. I estimate separate equations for the plaintis and defen-
dants. The estimation method is basic OLS and I cluster the standard errors
by rm as some rms appear multiple times in my dataset. I also control for
the trial year and the duration of the observed time span as this may aect
by how much the rating of both treated and non-treated rms changes. The
rm and trial variables used are dened as follows:
25
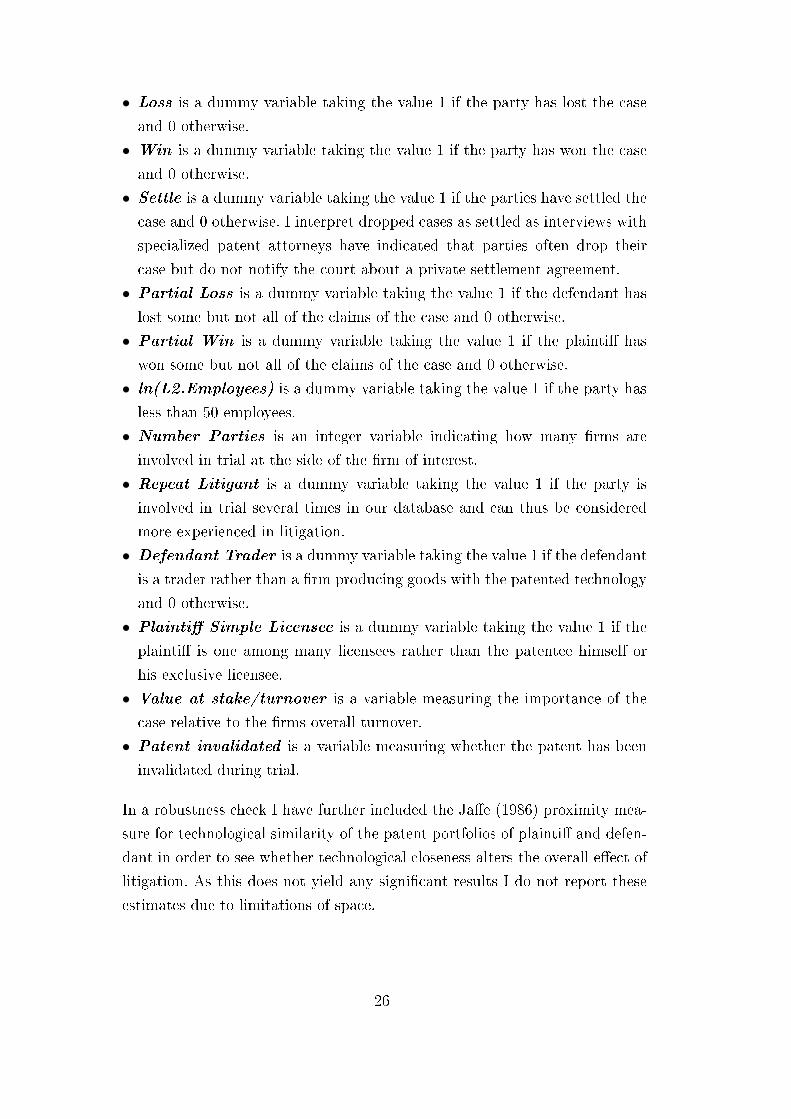
• Loss is a dummy variable taking the value 1 if the party has lost the case
and 0 otherwise.
• Win is a dummy variable taking the value 1 if the party has won the case
and 0 otherwise.
• Settle is a dummy variable taking the value 1 if the parties have settled the
case and 0 otherwise. I interpret dropped cases as settled as interviews with
specialized patent attorneys have indicated that parties often drop their
case but do not notify the court about a private settlement agreement.
• Partial Loss is a dummy variable taking the value 1 if the defendant has
lost some but not all of the claims of the case and 0 otherwise.
• Partial Win is a dummy variable taking the value 1 if the plainti has
won some but not all of the claims of the case and 0 otherwise.
• ln(L2.Employees) is a dummy variable taking the value 1 if the party has
less than 50 employees.
• Number Parties is an integer variable indicating how many rms are
involved in trial at the side of the rm of interest.
• Repeat Litigant is a dummy variable taking the value 1 if the party is
involved in trial several times in our database and can thus be considered
more experienced in litigation.
• Defendant Trader is a dummy variable taking the value 1 if the defendantis a trader rather than a rm producing goods with the patented technology
and 0 otherwise.
• Plainti Simple Licensee is a dummy variable taking the value 1 if the
plainti is one among many licensees rather than the patentee himself or
his exclusive licensee.
• Value at stake/turnover is a variable measuring the importance of the
case relative to the rms overall turnover.
• Patent invalidated is a variable measuring whether the patent has been
invalidated during trial.
In a robustness check I have further included the Jae (1986) proximity mea-
sure for technological similarity of the patent portfolios of plainti and defen-
dant in order to see whether technological closeness alters the overall eect of
litigation. As this does not yield any signicant results I do not report these
estimates due to limitations of space.
26
4.6.1 Defendants
Table 8 displays the regression results for the defendants. Specication (1)
includes the simple treatment variable "defendant", indicating whether the
rm was involved in litigation as a defendant or whether it is a control rm.
As seen before there is no treatment eect of being involved in litigation as a
defendant as such. Specication (2) interacts the defendant dummy with the
dierent possible outcomes of trial, using a victory in trial as baseline cate-
gory. I nd that a loss and a settlement outcome both signicantly increase the
credit rating of the defendant compared to a win in trial, which corresponds
to a worsening of the rating. I nd no dierence for the outcome partial loss,
which may be due to the large degree of heterogeneity in this outcome cate-
gory. Specication (3) interacts the treatment dummy with the outcomes and
ve other variables that are expected to have an eect on how a rm's rating
reacts to litigation. I again nd that a loss and a settlement outcome both
signicantly increase the credit rating of the defendant compared to a win
in trial. While dierences across outcomes are already interesting as such, a
more meaningful result is a comparison of being involved in litigation with a
particular outcome to not being involved in litigation at all. In order to nd
the overall eect of being involved as a defendant and losing, the coecients
for defendant and loss have to be summed up. The overall eect is 21.9 and an
F-test indicates that this diers signicantly from zero at the 10% signicance
level. Similarly the eect of being involved as a defendant and agreeing upon
a settlement deal is 20.4 and also signicantly dierent from zero. I further
nd that the eect of losing and settling does not dier signicantly. When
switching the baseline category for the outcomes to loss such that I can obtain
a coecient for a win in trial I nd that winning makes defendants signi-
cantly better o than losing (as seen before), but I also nd that the overall
treatment eect of being a defendant and winning compared to not being in
litigation is not signicantly dierent from zero. I do nd support for hypothe-
sis 2, stating that a loss and a settlement deal negatively aect the defendant.
I do however not nd a signicant dierence between a loss and a settlement
deal.
The interaction with the number of employees shows that small defendants
are at a disadvantage when involved in litigation. I nd the rating of repeat
litigants to drop by 7.1 points compared to the rating of rst-time litigants
27
when being involved in litigation, supporting our hypothesis that repeat liti-
gants are at an advantage in coping with alleged infringement. I further nd
evidence for hypothesis 6 that focuses on the eect of stake size on the impact
of litigation: All three specications of stake size show the expected eect.
Regarding the number of fellow parties accused of infringement in trial I nd
more parties to coincide with an improvement of the rating, indicating that
sharing the risk in trial makes defendants better o. Defendants being traders
experience a drop of 7.8 rating points when involved in litigation compared to
a producers of goods produced with the patented technology. As production
goes along with costly facilities that might be shut down during trial or may
become obsolete when losing in trial stakes are generally higher for producers
compared to traders. The eect of the relative importance of the case for the
litigant as measured by the relation of the value at stake to the rm's overall
turnover also supports hypothesis 6. I further nd that a (partial) invalidation
of the patent during trial makes the defendant signicantly better o, which
can be attributed to the defendant proting from a favorable settlement deal
with the plainti or a dropping of the case.
28
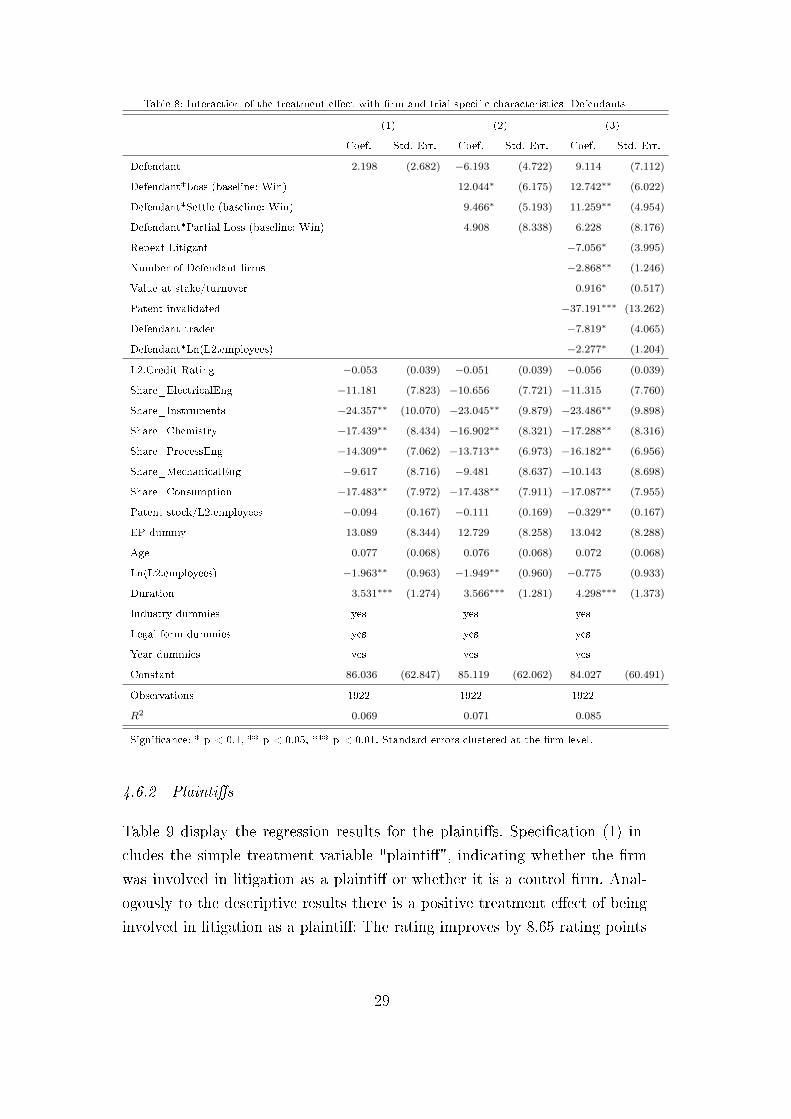
Table 8: Interaction of the treatment eect with rm and trial-specic characteristics- Defendants
(1) (2) (3)
Coef. Std. Err. Coef. Std. Err. Coef. Std. Err.
Defendant 2.198 (2.682) −6.193 (4.722) 9.114 (7.112)
Defendant*Loss (baseline: Win) 12.044∗ (6.175) 12.742∗∗ (6.022)
Defendant*Settle (baseline: Win) 9.466∗ (5.193) 11.259∗∗ (4.954)
Defendant*Partial Loss (baseline: Win) 4.908 (8.338) 6.228 (8.176)
Repeat Litigant −7.056∗ (3.995)
Number of Defendant rms −2.868∗∗ (1.246)
Value at stake/turnover 0.916∗ (0.517)
Patent invalidated −37.191∗∗∗ (13.262)
Defendant trader −7.819∗ (4.065)
Defendant*Ln(L2.employees) −2.277∗ (1.204)
L2.Credit Rating −0.053 (0.039) −0.051 (0.039) −0.056 (0.039)
Share_ElectricalEng −11.181 (7.823) −10.656 (7.721) −11.315 (7.760)
Share_Instruments −24.357∗∗ (10.070) −23.045∗∗ (9.879) −23.486∗∗ (9.898)
Share_Chemistry −17.439∗∗ (8.434) −16.902∗∗ (8.321) −17.288∗∗ (8.316)
Share_ProcessEng −14.309∗∗ (7.062) −13.713∗∗ (6.973) −16.182∗∗ (6.956)
Share_MechanicalEng −9.617 (8.716) −9.481 (8.637) −10.143 (8.698)
Share_Consumption −17.483∗∗ (7.972) −17.438∗∗ (7.911) −17.087∗∗ (7.955)
Patent stock/L2.employees −0.094 (0.167) −0.111 (0.169) −0.329∗∗ (0.167)
EP dummy 13.089 (8.344) 12.729 (8.258) 13.042 (8.288)
Age 0.077 (0.068) 0.076 (0.068) 0.072 (0.068)
Ln(L2.employees) −1.963∗∗ (0.963) −1.949∗∗ (0.960) −0.775 (0.933)
Duration 3.531∗∗∗ (1.274) 3.566∗∗∗ (1.281) 4.298∗∗∗ (1.373)
Industry dummies yes yes yes
Legal form dummies yes yes yes
Year dummies yes yes yes
Constant 86.036 (62.847) 85.119 (62.062) 84.027 (60.491)
Observations 1922 1922 1922
R2 0.069 0.071 0.085
Signicance: * p < 0.1, ** p < 0.05, *** p < 0.01. Standard errors clustered at the rm level.
4.6.2 Plaintis
Table 9 display the regression results for the plaintis. Specication (1) in-
cludes the simple treatment variable "plainti", indicating whether the rm
was involved in litigation as a plainti or whether it is a control rm. Anal-
ogously to the descriptive results there is a positive treatment eect of being
involved in litigation as a plainti: The rating improves by 8.65 rating points
29
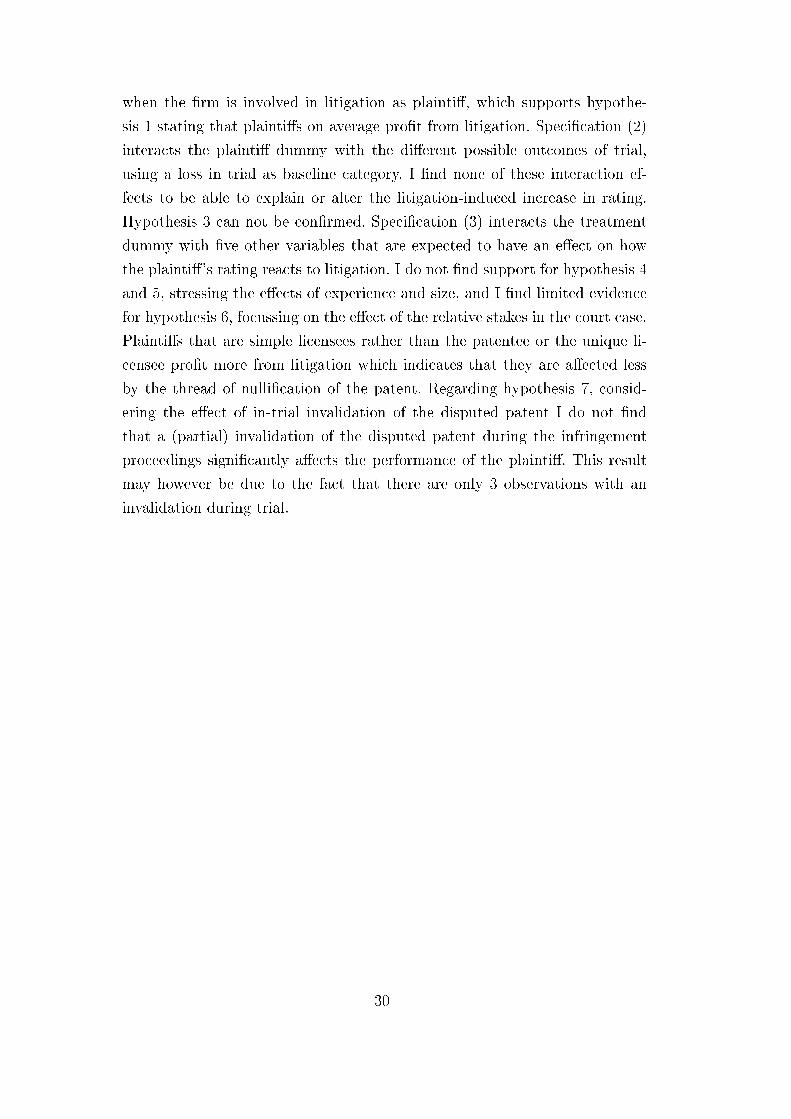
when the rm is involved in litigation as plainti, which supports hypothe-
sis 1 stating that plaintis on average prot from litigation. Specication (2)
interacts the plainti dummy with the dierent possible outcomes of trial,
using a loss in trial as baseline category. I nd none of these interaction ef-
fects to be able to explain or alter the litigation-induced increase in rating.
Hypothesis 3 can not be conrmed. Specication (3) interacts the treatment
dummy with ve other variables that are expected to have an eect on how
the plainti's rating reacts to litigation. I do not nd support for hypothesis 4
and 5, stressing the eects of experience and size, and I nd limited evidence
for hypothesis 6, focussing on the eect of the relative stakes in the court case.
Plaintis that are simple licensees rather than the patentee or the unique li-
censee prot more from litigation which indicates that they are aected less
by the thread of nullication of the patent. Regarding hypothesis 7, consid-
ering the eect of in-trial invalidation of the disputed patent I do not nd
that a (partial) invalidation of the disputed patent during the infringement
proceedings signicantly aects the performance of the plainti. This result
may however be due to the fact that there are only 3 observations with an
invalidation during trial.
30

Table 9: Interaction of the treatment eect with rm and trial-specic characteristics- Plaintis
(1) (2) (3)
Coef. Std. Err. Coef. Std. Err. Coef. Std. Err.
Plainti −8.650∗∗∗ (3.057) −10.316∗∗ (5.001) −28.212∗ (14.506)
Plainti*Settle (baseline: Loss) 0.199 (5.248) −0.021 (5.260)
Plainti*Win (baseline: Loss) 4.395 (5.694) 3.776 (5.595)
Plainti*Partial Win (baseline: Loss) 7.238 (8.554) 7.870 (8.820)
Repeat litigant 1.225 (5.236)
Number of Plainti rms 13.823 (11.998)
Plainti simple licensee −10.704∗∗ (4.863)
Value at stake/turnover −0.043 (0.160)
Patent invalidated 24.260 (28.342)
Plainti*Ln(L2.employees) 1.022 (1.351)
Ln(L2.employees) −0.771 (1.173) −0.744 (1.175) −1.391 (1.530)
Patent stock/L2.employees 0.082 (0.081) 0.088 (0.082) 0.087 (0.088)
L2.Credit rating −0.048 (0.048) −0.049 (0.049) −0.048 (0.048)
EP dummy −10.466 (12.113) −11.089 (12.204) −10.801 (12.290)
Share_ElectricalEng 13.283 (13.037) 13.651 (13.086) 13.565 (13.060)
Share_Instruments 1.451 (11.945) 1.951 (12.002) 1.280 (11.925)
Share_Chemistry −3.273 (12.723) −3.198 (12.760) −2.880 (12.716)
Share_ProcessEng 5.336 (10.326) 6.124 (10.405) 6.041 (10.362)
Share_MechanicalEng −2.095 (11.134) −1.984 (11.166) −2.206 (11.085)
Share_Consumption 11.854 (10.357) 12.444 (10.482) 12.134 (10.392)
Age 0.082 (0.052) 0.082 (0.051) 0.078 (0.051)
Duration 6.993∗∗∗ (2.335) 7.010∗∗∗ (2.339) 6.851∗∗∗ (2.421)
Industry dummies yes yes yes
Legal form dummies yes yes yes
Year dummies yes yes yes
Constant 22.482 (16.185) 21.748 (16.411) 22.781 (16.855)
Constant 22.482 (1.39) 21.748 (1.33) 22.781 (1.35)
Observations 1194 1194 1194
R2 0.118 0.118 0.122
Signicance: * p < 0.1, ** p < 0.05, *** p < 0.01. Standard errors clustered at the rm level.
4.7 Robustness Checks
Though the observed change of the credit rating is a clear signal of or a positive
a negative impact of litigation, it is rather dicult to grasp how severe the
eect really is and to which degree rms are hurt or prot from litigation.
Therefore I now apply a dierent measure to capture the eect of litigation.
31
I dene a bankruptcy event as the rm going bancrupt sometime in between
the ling of the court case and at the latest 1 year after the end of trial.
This measure is based on the exit information in the Creditreform data that
indicates whether and when a rm exits for bankruptcy reasons. Using the
dummy variable bankruptcy event as dependent variable I estimate two probit
models of bankruptcy. I use the same structure as above and again cluster the
standard errors at the rm level. The results are displayed as average marginal
eects.
4.7.1 Defendants
The probabiliy of bankruptcy within the period of trial plus 1 year after the
end of trial is 3.9 percent for the control group and 4.2 percent for the defen-
dants. This dierence is not signicantly dierent from zero. Table 10 displays
the estimation results for the defendants 9 . Overall the eects reect the pre-
vious results obtained when using the change in rating as dependent variable.
The average eect of being defendant in litigation is not signicantly dierent
from zero, but the bankruptcy probability signicantly increases with the de-
fendant losing or settling in trial compared to winning. Additionally, smaller
litigants and those with a high value at stake relatively to their turnover are
more likely to experience bankruptcy from trial. The bankruptcy probabil-
ity decreases with multiple defendants involved in trial. These results suggest
that litigation does have visible eects on the involved defendants that can go
beyond the (maybe rarely visible) change in credit rating.
4.7.2 Plaintis
The probabiliy of bankruptcy within the period of trial plus 1 year after the
end of trial is 4.4 percent for the control group and 2.3 percent for the plain-
tis. This dierence is signicantly dierent from zero, indicating that, again,
the treatment eect of litigation on plaintis is on average positive. Table 11
displays the estimation results for plaintis. I nd that plaintis on average
prot from litigation as indicated by a lower bankruptcy probability. This
eect increases even more if the plainti wins in trial or agress upon a set-
9 The number of observations reduces as bankruptcy is a rather rare event and does
not happen in each of the industry classes.
32
tlement deal compared to losing. This is the rst time I can actually identify
an eect of the outcome of trial for the plaintis. The direction of the eect
is as expected. Similar to the defendants I also nd small rms involved in
litigation be be more likely to go bankrupt than larger litigants. The eects
of the number of fellow plaintis, the plaintis relation to the disputed patent
and the relative value of the case to the plainti are opposite to what I would
expect. The bankruptcy probability signicantly increases with the number of
plaintis and the plainti being a licensee rather than the patentowner. At the
same time the bankruptcy probability signicantly reduces with an increase
of the relative value of the case to the plainti. One explanation for this might
be that these parties take more caution because they are particularly aware of
potential negative eects from invalidation. The eect of an invalidation of the
disputed patent during trial cannot be analyzed as none of the invalidations
leads to a bankruptcy event such that the variable has to be ommited in the
estimation 10 .
10Note that the variable partial win is also ommited as none of the plaintis with a
partial win go bancrupt
33
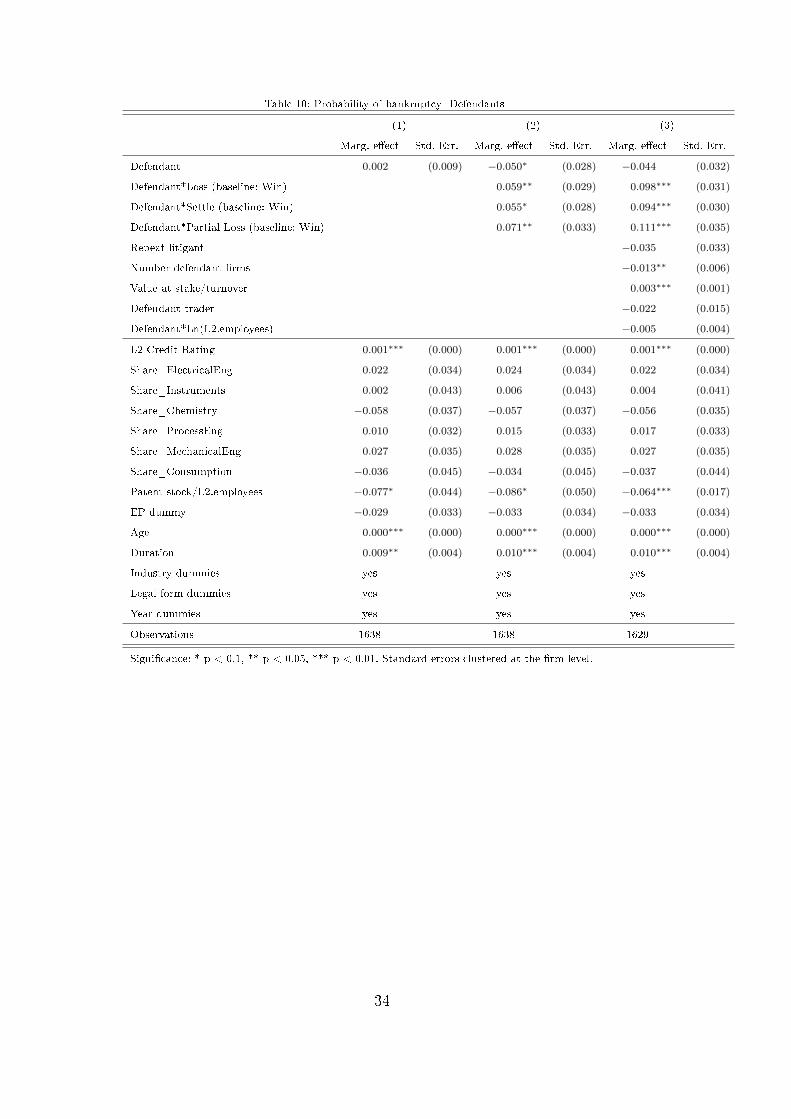
Table 10: Probability of bankruptcy- Defendants
(1) (2) (3)
Marg. eect Std. Err. Marg. eect Std. Err. Marg. eect Std. Err.
Defendant 0.002 (0.009) −0.050∗ (0.028) −0.044 (0.032)
Defendant*Loss (baseline: Win) 0.059∗∗ (0.029) 0.098∗∗∗ (0.031)
Defendant*Settle (baseline: Win) 0.055∗ (0.028) 0.094∗∗∗ (0.030)
Defendant*Partial Loss (baseline: Win) 0.071∗∗ (0.033) 0.111∗∗∗ (0.035)
Repeat litigant −0.035 (0.033)
Number defendant rms −0.013∗∗ (0.006)
Value at stake/turnover 0.003∗∗∗ (0.001)
Defendant trader −0.022 (0.015)
Defendant*Ln(L2.employees) −0.005 (0.004)
L2 Credit Rating 0.001∗∗∗ (0.000) 0.001∗∗∗ (0.000) 0.001∗∗∗ (0.000)
Share_ElectricalEng 0.022 (0.034) 0.024 (0.034) 0.022 (0.034)
Share_Instruments 0.002 (0.043) 0.006 (0.043) 0.004 (0.041)
Share_Chemistry −0.058 (0.037) −0.057 (0.037) −0.056 (0.035)
Share_ProcessEng 0.010 (0.032) 0.015 (0.033) 0.017 (0.033)
Share_MechanicalEng 0.027 (0.035) 0.028 (0.035) 0.027 (0.035)
Share_Consumption −0.036 (0.045) −0.034 (0.045) −0.037 (0.044)
Patent stock/L2.employees −0.077∗ (0.044) −0.086∗ (0.050) −0.064∗∗∗ (0.017)
EP dummy −0.029 (0.033) −0.033 (0.034) −0.033 (0.034)
Age 0.000∗∗∗ (0.000) 0.000∗∗∗ (0.000) 0.000∗∗∗ (0.000)
Duration 0.009∗∗ (0.004) 0.010∗∗∗ (0.004) 0.010∗∗∗ (0.004)
Industry dummies yes yes yes
Legal form dummies yes yes yes
Year dummies yes yes yes
Observations 1638 1638 1629
Signicance: * p < 0.1, ** p < 0.05, *** p < 0.01. Standard errors clustered at the rm level.
34
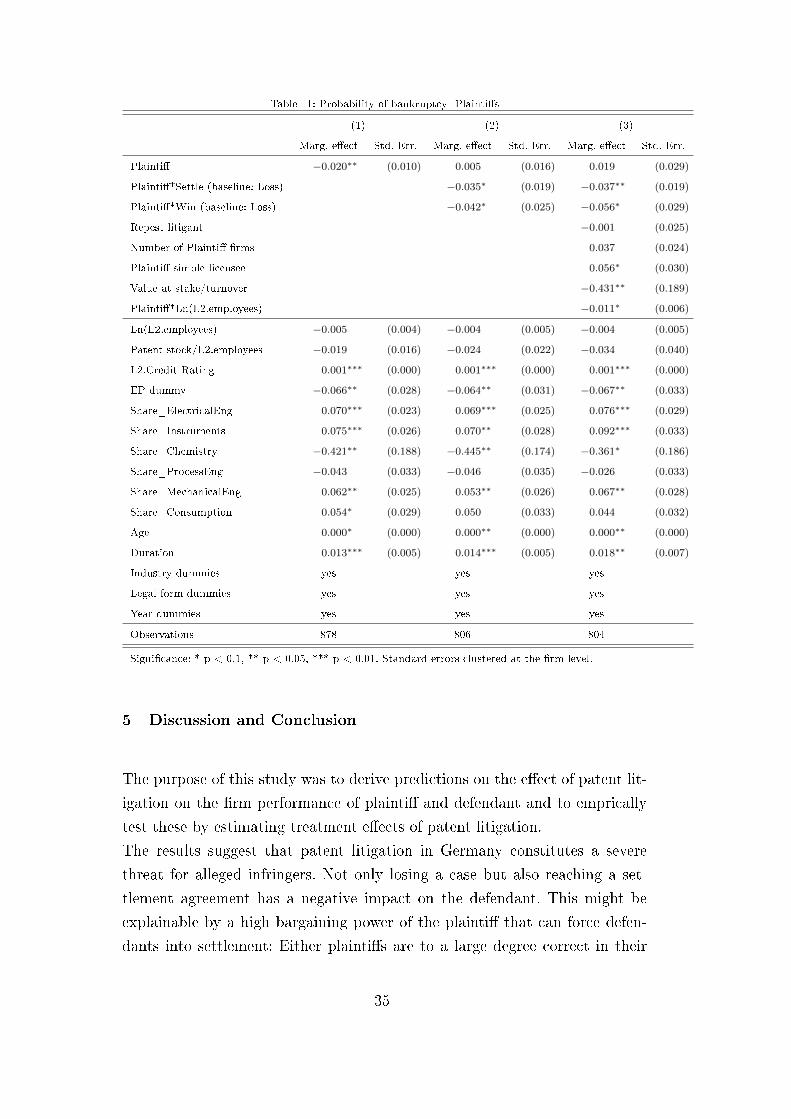
Table 11: Probability of bankruptcy- Plaintis
(1) (2) (3)
Marg. eect Std. Err. Marg. eect Std. Err. Marg. eect Std. Err.
Plainti −0.020∗∗ (0.010) 0.005 (0.016) 0.019 (0.029)
Plainti*Settle (baseline: Loss) −0.035∗ (0.019) −0.037∗∗ (0.019)
Plainti*Win (baseline: Loss) −0.042∗ (0.025) −0.056∗ (0.029)
Repest litigant −0.001 (0.025)
Number of Plainti rms 0.037 (0.024)
Plainti simple licensee 0.056∗ (0.030)
Value at stake/turnover −0.431∗∗ (0.189)
Plainti*Ln(L2.employees) −0.011∗ (0.006)
Ln(L2.employees) −0.005 (0.004) −0.004 (0.005) −0.004 (0.005)
Patent stock/L2.employees −0.019 (0.016) −0.024 (0.022) −0.034 (0.040)
L2.Credit Rating 0.001∗∗∗ (0.000) 0.001∗∗∗ (0.000) 0.001∗∗∗ (0.000)
EP dummy −0.066∗∗ (0.028) −0.064∗∗ (0.031) −0.067∗∗ (0.033)
Share_ElectricalEng 0.070∗∗∗ (0.023) 0.069∗∗∗ (0.025) 0.076∗∗∗ (0.029)
Share_Instruments 0.075∗∗∗ (0.026) 0.070∗∗ (0.028) 0.092∗∗∗ (0.033)
Share_Chemistry −0.421∗∗ (0.188) −0.445∗∗ (0.174) −0.361∗ (0.186)
Share_ProcessEng −0.043 (0.033) −0.046 (0.035) −0.026 (0.033)
Share_MechanicalEng 0.062∗∗ (0.025) 0.053∗∗ (0.026) 0.067∗∗ (0.028)
Share_Consumption 0.054∗ (0.029) 0.050 (0.033) 0.044 (0.032)
Age 0.000∗ (0.000) 0.000∗∗ (0.000) 0.000∗∗ (0.000)
Duration 0.013∗∗∗ (0.005) 0.014∗∗∗ (0.005) 0.018∗∗ (0.007)
Industry dummies yes yes yes
Legal form dummies yes yes yes
Year dummies yes yes yes
Observations 878 806 804
Signicance: * p < 0.1, ** p < 0.05, *** p < 0.01. Standard errors clustered at the rm level.
5 Discussion and Conclusion
The purpose of this study was to derive predictions on the eect of patent lit-
igation on the rm performance of plainti and defendant and to emprically
test these by estimating treatment eects of patent litigation.
The results suggest that patent litigation in Germany constitutes a severe
threat for alleged infringers. Not only losing a case but also reaching a set-
tlement agreement has a negative impact on the defendant. This might be
explainable by a high bargaining power of the plainti that can force defen-
dants into settlement: Either plaintis are to a large degree correct in their
35
presumption of infringement and can demand high settlement amounts to
avoid an unfavorable judgment for the defendant or they have a systematic
strategic advantage over the defendants. The fact that small, rst time de-
fendants are aected more severely by litigation than other rms implies that
they have more diculties in coping with litigation, which can be attributed
to their ability to deal with economic and nancial distress. With respect to
the plaintis I show that there seems to be no tax on innovation for the paten-
tee himself: Plaintis generally prot from litigation in terms of their credit
rating, independent of the outcome of trial.
In a robustness check I then estimate the probability of a bankruptcy event
in between the ling date of trial and one year after its closing date. The
eects remain robust for the defendants. The estimation for plaintis reveals,
as before, that plaintis on average prot from litigation. It does however ad-
ditionally show that a victory or a settlement deal has a positive eect for the
plainti compared to losing in trial, which could not be shown in the prior
analysis, but which matches the theoretical considerations.
The fact that I am only able to identify moderating and intensifying factors
for the group of plaintis in the robustness check using the bankruptcy event
rather than the credit rating as dependent variable may be due to several
reasons: One reason may be the positive signalling eect of litigation. Being
known to sue another rm for infringement can discourage others from enter-
ing into the market and improve the rm's position. Given that the rating of
a rm is only updated upon request it is possible that the rating increases in
expectation of a positive litigation outcome. A negative outcome has a com-
paratively little eect for plaintis as it does not involve the nullication of
the patent, this may then not be enough for a request for a new investigation
of the rm and a subsequent worsening of the rating. A bankruptcy event
however, the most severe consequence for the plainti, is in any case reported
in the data independent of a request and can thus be related to the trial out-
come according to my expectations.
Taking together the study highlights two aspects: Small and inexperienced
rms are at a disadvantage when trying to deal with alleged infringement.If
litigation is mainly the result of unintended infringement, as suggested by
Bessen and Meuer (2008) or plaintis' strategies of "being infringed" rather
than willful infringement policy makers may think about mechanisms of sup-
porting rms, particularly small and inexperienced rms, in avoiding litiga-
36
tion. The so-called ex-post tax on innovation on these small rms is partic-
ularly severe as the innovativeness of SMEs is particularly important for the
performance of any economy. Suering from litigation may hamper this inno-
vativeness both through immediate eects from business interruption as well
as impaired access to nance.
The second aspect concerns the bifurcated litigation proceedures in Germany.
My results nicely reveal the spatial and temporal separation of invalidity and
infringement decisions. This split is generally seen to favour plaintis/patentees
in an infringement action as they are not faced with the direct thread of an
invalidation of their patent. With nullity suits frequently being a defendant's
most important defense, but taking much longer than an infringement trial,
the patentee can expect to win the infringement trial prior to the ruling of the
nullity trial. This puts him in a strong position to negotiate a favorable settle-
ment deal. This can also explain the dierences in results when comparing this
study to studies on the US system: Studies like Bessen and Meurer (2008b)
show the expected eect of litigation for plaintis to be negative, reecting
the risk that the disputed patents gets invalidated during the infringement
proceedings, while I identify a positive realized eect of litigation, reecting
the fact that in Germany patents rarely get invalidated during infringement
trials. Infringement judgments may of course later have to be reversed due
to invalidation. This produces lots of transaction and opportunity costs and
given that innovations are produced and marketed at a very high speed the
economic damage resulting from wrong judgments can be immense. A simulta-
neous decision of both validity and infringement would solve this incongruity
and deliver immediate and reliable judgments. This would of course be at the
cost of a longer overall duration of the trial. At this point patent quality comes
into play. The higher the quality of the patents issued by the patent oce the
less likely an invalidation of the patent and the less needed an invalidation
suit in parallel to an infringement suit.
Of course there are also several shortcomings. Compared to stock market stud-
ies that can track developments in rm value for the exact ling date the in-
terval of 6 months in between the publishing of the updated ratings leads to
rather rough estimates of the impact of litigation. Also it is not possible to dis-
tinguish between wilful infringement, unintended infringement and plaintis'
strategies of being infringed.
37
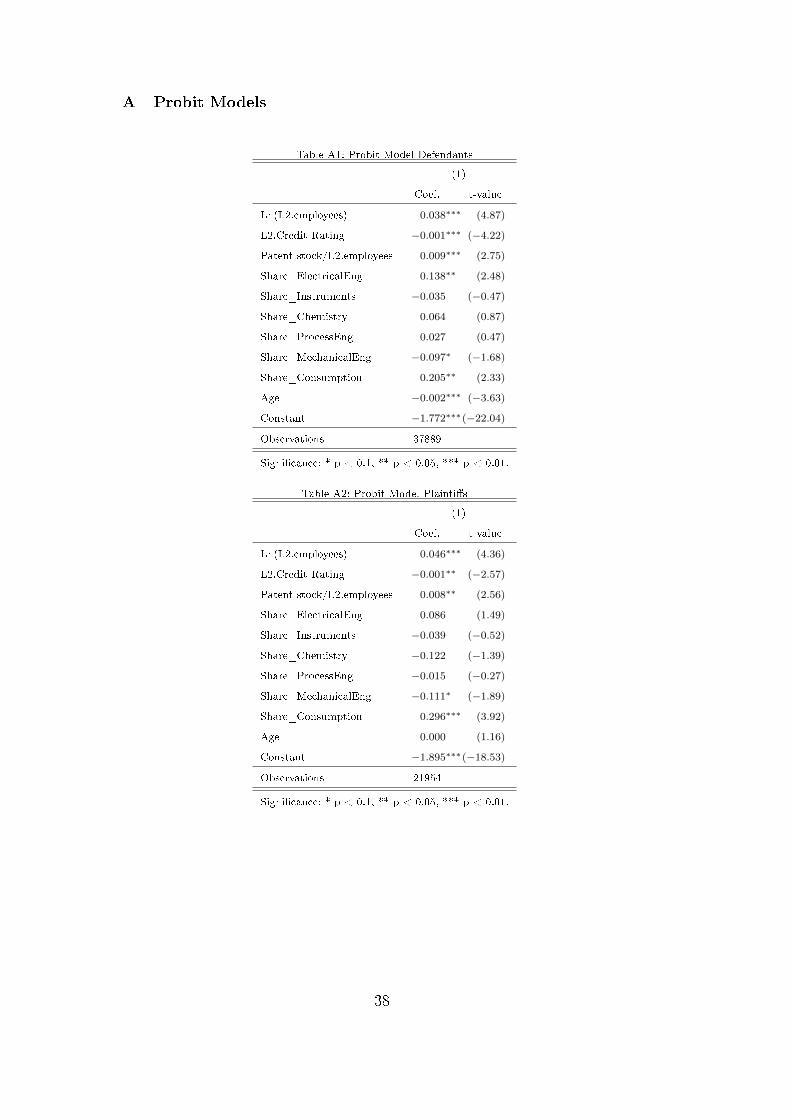
A Probit Models
Table A1: Probit Model Defendants
(1)
Coef. t-value
Ln(L2.employees) 0.038∗∗∗ (4.87)
L2.Credit Rating −0.001∗∗∗ (−4.22)
Patent stock/L2.employees 0.009∗∗∗ (2.75)
Share_ElectricalEng 0.138∗∗ (2.48)
Share_Instruments −0.035 (−0.47)
Share_Chemistry 0.064 (0.87)
Share_ProcessEng 0.027 (0.47)
Share_MechanicalEng −0.097∗ (−1.68)
Share_Consumption 0.205∗∗ (2.33)
Age −0.002∗∗∗ (−3.63)
Constant −1.772∗∗∗(−22.04)
Observations 37889
Signicance: * p < 0.1, ** p < 0.05, *** p < 0.01.
Table A2: Probit Model Plaintis
(1)
Coef. t-value
Ln(L2.employees) 0.046∗∗∗ (4.36)
L2.Credit Rating −0.001∗∗ (−2.57)
Patent stock/L2.employees 0.008∗∗ (2.56)
Share_ElectricalEng 0.086 (1.49)
Share_Instruments −0.039 (−0.52)
Share_Chemistry −0.122 (−1.39)
Share_ProcessEng −0.015 (−0.27)
Share_MechanicalEng −0.111∗ (−1.89)
Share_Consumption 0.296∗∗∗ (3.92)
Age 0.000 (1.16)
Constant −1.895∗∗∗(−18.53)
Observations 21954
Signicance: * p < 0.1, ** p < 0.05, *** p < 0.01.
38

B Flowchart Proceedings
39
C An Example of a Litigation Case
As an example of a litigation suit consider the case heard at the district
court of Düsseldorf with case number 4b O 479/03. The case has been led
by BSH Bosch Siemens Hausgeräte GmbH on January 5th 2004 against the
Italy-based rm Merloni Elettrodomestici regarding the Patent EP 92113435
titled "Refrigeration apparatus, especially refrigerator or freezer". Merloni
Elettrodomestici sells refrigerators in Germany through its German subsidiary.
BSH Bosch Siemens Hausgeräte accuses the defendant of the infringement of
its patent on refrigerators and les for omission of infringement as well as
damages. The defendant les for the dismissal of the case and parallely les a
nullity suit at the Federal Patent Court in Munich on May 10th 2004. It re-
quests a stay of the proceedings until a decision on validity has been rendered.
Based on a low probability of success of the invalidity suit the Düsseldorf court
refuses a stay of proceedings and judges on September 16th 2004 that infringe-
ment took place. The defendant is ordered to omit further infringement, to
disclose exact numbers on produced refrigerators based on the disputed patent
and to pay damages according to these numbers. The value at stake in this
case was 500000 Euros resulting in a cost risk (court plus lawyer costs) of
about 40000 Euros. The decision on validity is rendered only on the 3rd of
May 2005, almost 9 months after the judgment on infringement: The court
does not invalidate the patent 11 .
D Empirical Methodology
Given the theoretical considerations and the advantages of using changes in
credit rating data as a proxy for changes in rm value, the idea of the empirical
approach is to analyze the impact of being involved in patent litigation on the
credit rating of the rm. The impact of being involved in litigation on the
rating of a rm can be calculated as follows:
αTT = E(Y T |L = 1
)− E
(Y C |L = 1
), (D.1)
11 Source: Own data collected at Düsseldorf court
40
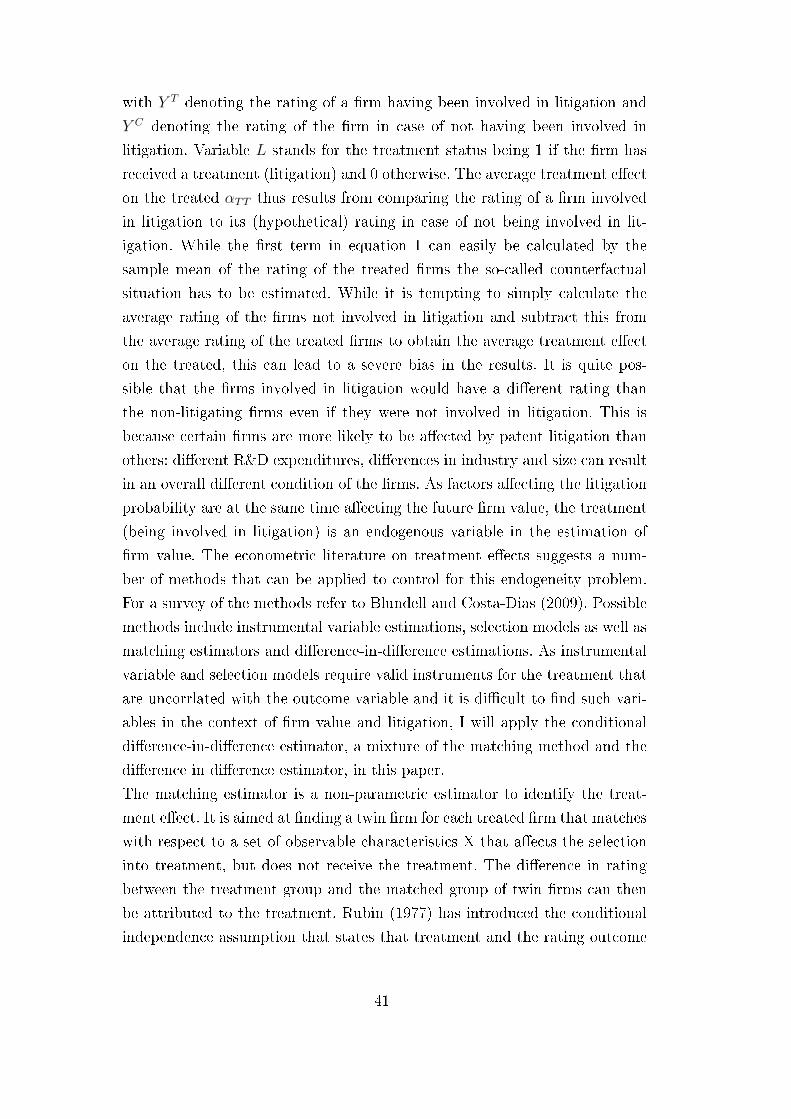
with Y T denoting the rating of a rm having been involved in litigation and
Y C denoting the rating of the rm in case of not having been involved in
litigation. Variable L stands for the treatment status being 1 if the rm has
received a treatment (litigation) and 0 otherwise. The average treatment eect
on the treated αTT thus results from comparing the rating of a rm involved
in litigation to its (hypothetical) rating in case of not being involved in lit-
igation. While the rst term in equation 1 can easily be calculated by the
sample mean of the rating of the treated rms the so-called counterfactual
situation has to be estimated. While it is tempting to simply calculate the
average rating of the rms not involved in litigation and subtract this from
the average rating of the treated rms to obtain the average treatment eect
on the treated, this can lead to a severe bias in the results. It is quite pos-
sible that the rms involved in litigation would have a dierent rating than
the non-litigating rms even if they were not involved in litigation. This is
because certain rms are more likely to be aected by patent litigation than
others: dierent R&D expenditures, dierences in industry and size can result
in an overall dierent condition of the rms. As factors aecting the litigation
probability are at the same time aecting the future rm value, the treatment
(being involved in litigation) is an endogenous variable in the estimation of
rm value. The econometric literature on treatment eects suggests a num-
ber of methods that can be applied to control for this endogeneity problem.
For a survey of the methods refer to Blundell and Costa-Dias (2009). Possible
methods include instrumental variable estimations, selection models as well as
matching estimators and dierence-in-dierence estimations. As instrumental
variable and selection models require valid instruments for the treatment that
are uncorrlated with the outcome variable and it is dicult to nd such vari-
ables in the context of rm value and litigation, I will apply the conditional
dierence-in-dierence estimator, a mixture of the matching method and the
dierence in dierence estimator, in this paper.
The matching estimator is a non-parametric estimator to identify the treat-
ment eect. It is aimed at nding a twin rm for each treated rm that matches
with respect to a set of observable characteristics X that aects the selection
into treatment, but does not receive the treatment. The dierence in rating
between the treatment group and the matched group of twin rms can then
be attributed to the treatment. Rubin (1977) has introduced the conditional
independence assumption that states that treatment and the rating outcome
41
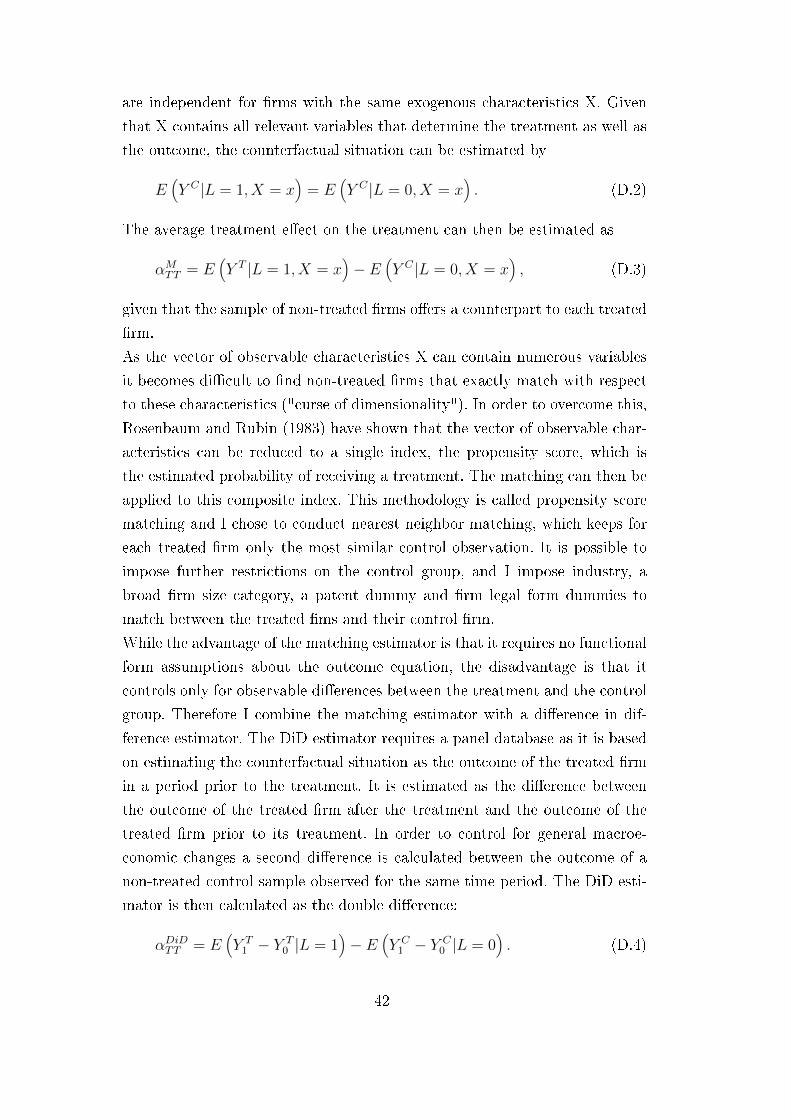
are independent for rms with the same exogenous characteristics X. Given
that X contains all relevant variables that determine the treatment as well as
the outcome, the counterfactual situation can be estimated by
E(Y C |L = 1, X = x
)= E
(Y C |L = 0, X = x
). (D.2)
The average treatment eect on the treatment can then be estimated as
αMTT = E
(Y T |L = 1, X = x
)− E
(Y C |L = 0, X = x
), (D.3)
given that the sample of non-treated rms oers a counterpart to each treated
rm.
As the vector of observable characteristics X can contain numerous variables
it becomes dicult to nd non-treated rms that exactly match with respect
to these characteristics ("curse of dimensionality"). In order to overcome this,
Rosenbaum and Rubin (1983) have shown that the vector of observable char-
acteristics can be reduced to a single index, the propensity score, which is
the estimated probability of receiving a treatment. The matching can then be
applied to this composite index. This methodology is called propensity score
matching and I chose to conduct nearest neighbor matching, which keeps for
each treated rm only the most similar control observation. It is possible to
impose further restrictions on the control group, and I impose industry, a
broad rm size category, a patent dummy and rm legal form dummies to
match between the treated ms and their control rm.
While the advantage of the matching estimator is that it requires no functional
form assumptions about the outcome equation, the disadvantage is that it
controls only for observable dierences between the treatment and the control
group. Therefore I combine the matching estimator with a dierence in dif-
ference estimator. The DiD estimator requires a panel database as it is based
on estimating the counterfactual situation as the outcome of the treated rm
in a period prior to the treatment. It is estimated as the dierence between
the outcome of the treated rm after the treatment and the outcome of the
treated rm prior to its treatment. In order to control for general macroe-
conomic changes a second dierence is calculated between the outcome of a
non-treated control sample observed for the same time period. The DiD esti-
mator is then calculated as the double dierence:
αDiDTT = E
(Y T1 − Y T
0 |L = 1)− E
(Y C1 − Y C
0 |L = 0). (D.4)
42
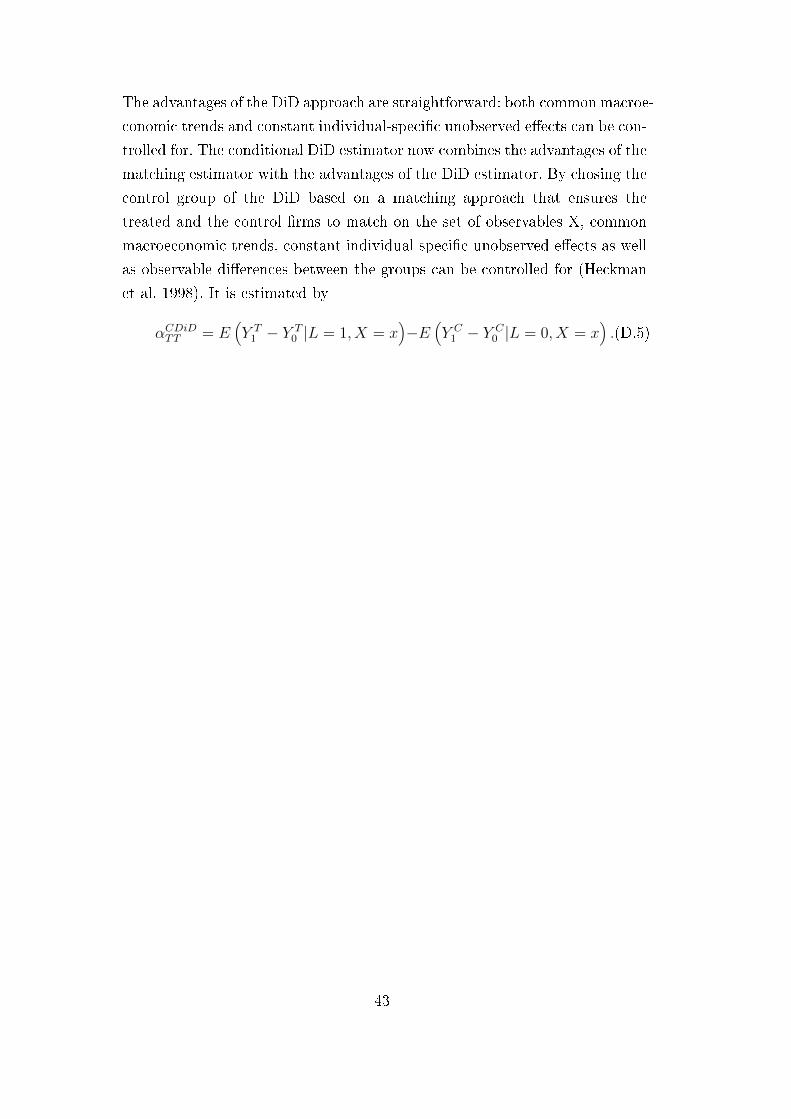
The advantages of the DiD approach are straightforward: both common macroe-
conomic trends and constant individual-specic unobserved eects can be con-
trolled for. The conditional DiD estimator now combines the advantages of the
matching estimator with the advantages of the DiD estimator. By chosing the
control group of the DiD based on a matching approach that ensures the
treated and the control rms to match on the set of observables X, common
macroeconomic trends, constant individual-specic unobserved eects as well
as observable dierences between the groups can be controlled for (Heckman
et al. 1998). It is estimated by
αCDiDTT = E
(Y T1 − Y T
0 |L = 1, X = x)−E
(Y C1 − Y C
0 |L = 0, X = x).(D.5)
43
References
Bessen, J. and Meurer, M. (2008a). Patent Failure. How Judges, Bureaucrats,
and Lawyers Put Innovators at Risk. Princeton University Press.
Bessen, J. and Meurer, M. (2008b). The Private Costs of Patent Litigation.
Boston University School of Law Working Paper Series. Law and Economics
Working Paper No. 07-08.
Bessen, J. and Meurer, M. (2005). The Patent Litigation Explosion. Boston
University School of Law Working Paper Series. Law and Economics Working
Paper No. 05-18.
Bhagat, S., Brickley, J. and Coles, J. (1994). The Cost of Inecient Bar-
gaining and Financial Distress. Evidence from Corporate Lawsuits. Journal of
Financial Economics 35(22), p. l-247.
Blundell, R. and Costa Dias, M. (2009). Alternative Approaches to Evaluation
in Empirical Microeconomics. The Journal of Human Resources 44(3), p. 565-
640.
Busche, J., Fabry, B. and Trimborn, M. (2010). Patent Infringement World-
wide. Claim Interpretation-Infringement-Damages. Heymanns Intellectual Prop-
erty. Carl Heymanns Verlag, Cologne.
Collins, K. E. (2009). Patent Failure: A Tragedy of Property. mimeo.
Czarnitzki, D. and Kraft, K. (2004). Innovation Indicators and Corporate
Credit Ratings: Evidence from German Firms. Economics Letters 82, p. 377-
384.
Czarnitzki, D. and Kraft, K. (2007). Are Credit Ratings Valuable Information?
Applied Financial Economics 17(13), p. 1061-1070.
European Patent Oce (2010). Patent Litigation in Europe. An Overview
of the National Patent Litigation Systems in Europe. 2nd edition November
2010.
Farrell, J. and Shapiro, C. (2008). How Strong Are Weak Patents? The Amer-
44

ican Economic Review 98(4), p. 41347-69.
Greenhalgh, C. and Rogers, M. (2007). The Value of Intellectual Property
Rights to Firms and Society. Oxford Review of Economic Policy 23(4), p.
541-567.
Hall, B.H. (2000). Innovation and Market Value. In: Barrell, R., Mason, G.,
O'Mahony, M. (Eds.), Productivity, Innovation and Economic Performance.
Cambridge University Press, Cambridge.
Hall, B.H., A.B. Jae and Trajtenberg, M. (2005). Market Value and Patent
Citations, Rand Journal of Economics 36(1), p. 16-38.
Harho, D. (2009). Economic Cost-Benet Analysis of a Unied and Inte-
grated European Patent Litigation System. European Comission. Final Report
Tender No. MARKT/2008/06/D.
Heckman, J.J., Ichimura, H. and Todd, P. (1998). Matching as an Econometric
Evaluation Estimator. Review of Economic Studies 65(2), p. 261-294.
Jae, A. B. (1986). Technological Opportunity and Spillovers of R&D: Evi-
dence from Firms' Patents, Prots, and Market Value. American Economic
Review, 76(5), p. 984-1001.
Lemley, M. A. and Shapiro, C. (2005). Probabilistic Patents. Journal of Eco-
nomic Perspectives 19(2), p. 75-98.
Lerner, J. (1995). Patenting in the Shadow of Competitors. Journal of Law
and Economics 38(2), p. 463-495.
Lechner, M. (2001). Identication and Estimation of Causal Eects of Multi-
ple Treatments under the Conditional Independence Assumption. In: M. Lech-
ner and F. Pfeier (eds.), Econometric Evaluation of Labour Market Policies,
Physica, Heidelberg, 43-58.
Marco, A. (2005). The Value of Certainty in Intellectual Property Rights.
Stock Market Reactions to Patent Litigation. Vassar College Economics Work-
ing Paper 82.
Meissner Bolte (2012). IP-Litigation in Germany in a nutshell: Why Litigate
45
IP in Germany? Meissner Bolte, German and European Patent, Trademark
and Design Attorneys Attorneys at Law. Retrieved December 16th 2012 from:
http://www.mbp.de/leadmin/user_upload/pdf/broschueren/IP-Litigation_
in_Germany-Webversion.pdf.
Nordhaus, W.D. (1962). Invention, Growth, and Welfare. A Theoretical Treat-
ment of Technological Change. MIT Press, Cambridge, MA.
Pitz, J. (2010). Patentverletzungsverfahren. Grundlagen-Praxis-Strategie. Ver-
lag C.H. Beck oHG, München.
Raghu, T.S., Woo, W. , Mohan, S.B. and Raghav Rao,R. (2008). Market
Reaction to Patent Infringement Litigations in the Information Technology
Industry. Information Systems Frontiers 10, p. 61-75.
Rosenbaum, P. R. and Rubin, D. B. (1983). The Central Role of the Propensity
Score in Observational Studies for Causal Eects. Biometrica 70(1), p. 41-55.
Rubin, D. B. (1977). Assignment to Treatment Group on the Basis of a Co-
variate. Journal of Educational and Behavioral Statistics 2(1), p. 1-26.
Scotchmer, S. (2004) Innovation and Incentives, MIT Press, 2004.
Shapiro, C. (2010). Injunctions, Hold-Up, and Patent Royalties. American Law
and Economics Review 12(2), p. 280-318.
Stauder, D. (1989). Patent-und Gebrauchsmusterverletzungsverfahren in der
Bundesrepublik Deutschland, Großbritannien, Frankreich und Italien. Max-
Planck-Institut für für ausländisches und internationales Patent-, Urheber-
und Wettbewerbsrecht. Schriftenreihe zum gewerblichen Rechtschutz Band
79. Carl Heymanns Verlag KG, Köln , Berlin, Bonn, München.
Traitenberg, M. and Jae, A. (2002). Patents, Citations and Innovations: A
Window on the Knowledge Economy. MIT Press, 2002.
Wang, Y., Shih, K. and Chuang, Y. (2010). Market Behavior of Patent In-
fringement Litigations. African Journal of Business Management 4(4), p. 390-
395.
Ziedonis, R.H. (2003). Patent Litigation in the Semiconductor Industry. In:
46

Patents in the Knowledge-Based Economy, ed. W. Cohen and S. Merrill (Na-
tional Academy Press: Washington DC), p. 180-215.
47