the effect of mergers and acquisitions on the …
TRANSCRIPT

THE EFFECT OF MERGERS AND ACQUISITIONS ON THE
FINANCIAL PERFORMANCE OF COMMERCIAL BANKS IN
KENYA
WINFRED ATIENO KAOL
UNITED STATES INTERNATIONAL
UNIVERSITY-AFRICA
FALL 2017


THE EFFECT OF MERGERS AND ACQUISITIONS ON THE
FINANCIAL PERFORMANCE OF COMMERCIAL BANKS IN
KENYA
BY
WINFRED ATIENO KAOL
A Research ProjectReport Submitted to Chandaria School of Business
in Partial Fulfillment of the Requirement for the Degree of Masters in
Business Administration (MBA)
UNITED STATES INTERNATIONAL UNIVERSITY-AFRICA
FALL 2017

i
STUDENT’S DECLARATION
I, the undersigned, declare that this is my original work and has not been submitted to any
other college, institution or university other than United States International University -
Africa for academic credit.
Signed: ______________________________ Date: ___________________________
Winfred Kaol (ID 624050)
This project has been presented for examination with my approval as the appointed
supervisor.
Signed: _______________________ _______Date: ___________________________
Prof. George Achoki
Signed: ______________________________Date: ___________________________
Dean, Chandaria School of Business

ii
COPYRIGHT
This work is the product of the author; hence no part of this paper shall be reproduced or
transmitted electronically, or mechanically including photocopying, reprinting or
redesigning without the prior permission of the author.
© 2017 by Winfred Kaol

iii
ABSTRACT
Increased globalization and competition has led to the rise of mergers and acquisitions for
firms seeking competitive advantage in their respective industries. Competitive advantage
means that, the firms can extend their margins and market share worldwide. The general
objective of this study was to determine the effects of mergers and acquisitions on the
financial performance of commercial banks in Kenya. The specific objectives were: to
determine the effect of asset management on financial performance; to establish the effect
of shareholder’s equity on financial performance and to investigate the effect of financial
stability on financial performance.
The study was focused on commercial banks that had merged or undergone acquisition
between the period 2008 and 2016in Kenya. The study adopted a descriptive research
designto determine the relationship between the variables within a population. The
population of the study consisted of financial institutions in Kenya that had either merged
or undergone acquisitions from 1989 to 2017 as approved by the Central Bank of
Kenya.The sample was selected using the purposive method which involved studying ten
commercial banks that had merged between the years 2008 to 2016. Secondary data, three
years before and three years after the event was calculated from the banks’ audited
financial statements, bank supervision annual reports published by Central Bank of
Kenya, and the respective bank websites. Data analysis method included descriptive
statistic, correlation and regression analysis methods. Statistical Package for Social
Sciences(SPSS) version 21 was used as the data analysis tool.
The findings oncorrelation analysis between performance and return on assets indicated a
positive significant relationship (r = 0.007,< p = 0.05). This indicated that, return on
assets as a determinant of performance of Kenyan commercial banks positively
influenced mergers and acquisitions. The more the merged institutions acquired assets,
the better they performed. Regression results of post-merger ANOVA indicated an R2 of
0.287, indicating that28.7% of the variations in performance were explained by return on
assets after the merger or acquisition event.Results also showeda slight rise in the mean
values for return on assets after the merger.
Findings on the effect of shareholder’s equity on financial performance revealed a
positive correlation relationship between return on equity and performance (r = 0.041,< p
iv
= 0.05). This implied that institutions that had either merged or undergone acquisition
with higher shareholder’s value had a higher financial performance hence higher market
share. The study findings on regression analysis indicated that most of the sampled banks
had an increase in return on equity after the merger or acquisition with a variation of only
0.4% explaining performance.
Results on the effect of financial stability on financial performance indicated a significant
negative correlation (r = 0.405,> p =0.05). Meaning that, the higher the capital adequacy
ratio an institution has, the lower the financial performance of the institution. The results
also indicated that some of the sampled banks posted an increase in the capital adequacy
ratio while others posted a decrease after the merger event. Regression results indicated
that only 3.2 % of the variations in performance were explained by capital adequacy ratio
after the merger or acquisition.
The study concluded that there was a significant relationship between financial
performance and return on assets, there was no significant relationship between financial
performance and return on equity and there was also no significant relationship between
financial performance and financial stability of institutions that had either merged or
undergone through acquisition.
The study recommended that the banking institutions work on raising their return on
assets, return on equity and capital adequacy ratios. To raisereturn on equity it was
recommended that management should work on reducing the company’s operational
costs and sell off fixed assets that are not being used. To increase return on equity, the
study recommended increasing the overall profit generated and the amount of debt capital
and reduce the excess cash on the balance sheet by paying out dividends to its
shareholders. The study proposed that capital adequacy ratio be increased by issuing new
equity through rights issue to existing shareholders and by replacing riskier or more
expensive loans with safer ones such asgovernment securities. The study also
recommended that further studies be carried out on the effect of mergers and acquisition
on financial performance from time to time to establish trends for longer periods and to
capture new opportunities that have recently emerged in Kenya.

v
ACKNOWLEDGEMENTS
Firstly, I would like to thank God for the gift of life and for seeing me through the
program. Secondly, I would like to thank my supervisor Dr. George Achoki for taking his
time to guide me accordingly. Thirdly, I would like to thank my family for their immense
support that they have shown me throughout the project and the entire course work,
especially my dad; Dr. K’Aol, my mom Sarah and my husband Victor.

vi
DEDICATION
This research project is dedicated to my family for their unconditional love and support.

vii
TABLE OF CONTENTS
STUDENT’S DECLARATION ...................................................................................................... i
ABSTRACT ................................................................................................................................... iii
ACKNOWLEDGEMENTS ........................................................................................................... v
DEDICATION ............................................................................................................................... vi
TABLE OF CONTENTS ............................................................................................................. vii
LIST OF ABBREVIATIONS ....................................................................................................... ix
CHAPTER ONE ............................................................................................................................. x
1.0 INTRODUCTION .............................................................................................................. 1
1.1. Background of the Study .................................................................................................. 1
1.2. Statement of the Problem ................................................................................................. 4
1.3. General Objective of the Study ........................................................................................ 5
1.4. Specific Objectives of the Study ...................................................................................... 5
1.5. Importance of the Study ................................................................................................... 6
1.6. Scope of the Study ............................................................................................................ 6
1.7. Definition of Terms .......................................................................................................... 7
1.8. Chapters Summary ........................................................................................................... 8
CHAPTER TWO ............................................................................................................................ 9
2.0. LITERATURE REVIEW .................................................................................................. 9
2.1. Introduction ...................................................................................................................... 9
2.2. Effects of Asset Management on Financial Performance................................................. 9
2.3. Effects of Shareholder’s Equity on Financial Performance ........................................... 13
2.4. Effect of Financial Stability on Financial Performance ................................................. 16
2.5. Chapter Summary ........................................................................................................... 20
CHAPTER THREE ..................................................................................................................... 21
3.0. RESEARCH METHODOLOGY .................................................................................... 21
3.1. Introduction .................................................................................................................... 21
3.2. Research Design ............................................................................................................. 21
3.3. Population and Sampling Design ................................................................................... 21
3.4. Data Collection Method ................................................................................................. 22
3.5. Research Procedure ........................................................................................................ 23
3.6. Data Analysis Methods................................................................................................... 24
3.7. Chapter Summary ........................................................................................................... 24
4.0. RESULTS AND FINDINGS ............................................................................................ 25
4.1. Introduction .................................................................................................................... 25

viii
4.2. General Information ....................................................................................................... 25
4.3. Effect of Asset Management on Financial Performance of Merged Commercial Banks
in Kenya ......................................................................................................................... 30
4.4. Effect of Shareholder’s Equity on Financial Performance of Merged Commercial Banks
in Kenya ......................................................................................................................... 33
4.5. Effect of Financial Stability on Financial Performance of Merged Commercial Banks in
Kenya ............................................................................................................................. 36
4.6. Chapter Summary ........................................................................................................... 39
5.0. DISCUSSION, CONCLUSIONS AND RECOMMENDATIONS ............................... 40
5.1. Introduction .................................................................................................................... 40
5.2. Summary ........................................................................................................................ 40
5.3. Discussion ...................................................................................................................... 41
5.4. Conclusion ...................................................................................................................... 44
5.5. Recommendations .......................................................................................................... 45
REFERENCES ............................................................................................................................. 46
APPENDICES .............................................................................................................................. 57
APPENDIX I: Secondary Data Collection Template ........................................................... 57
A. Effect of Asset Management on Financial Performance of Merged Commercial Banks
in Kenya ......................................................................................................................... 57
B. Effect of Shareholder’s Equity on Financial Performance of Merged Commercial Banks
in Kenya Template ......................................................................................................... 58
C. Effect of Financial Stability on Financial Performance of Merged Commercial Banks in
Kenya Template ............................................................................................................. 58
APPENDIX II: List of Commercial Bank Mergers and acquisitions in Kenya from 2008 –
2016 ................................................................................................................................ 59

ix
LIST OF ABBREVIATIONS
CAR
CBK
Capital Adequacy Ratio
Central Bank of Kenya
GE General Electric Company
HSBC Hong Kong and Shanghai Banking Corporation
IBM International Business Machines
J&J
KPMG
MSI
Johnson & Johnson
Lynell Peat Marwick Goerdeler
Market Share Index
M&A Merger and Acquisition
NSE
NXP
Nairobi Stock Exchange
Next Experience
P&G Proctar and Gamble
ROA Return on Assets
ROE
SBM
Return on Equity
State Bank of Mauritius
SPSS Statistical Package for Social Sciences

x
LIST OF TABLES
Table 4.1: KCB and Savings and Loan Ltd Merger .......................................................... 25
Table 4.2: Prime Bank Merger in 2008 ............................................................................. 26
Table 4.3: CFC Bank Ltd and Stanbic Bank Ltd Merger .................................................. 27
Table 4.4: City Finance Bank (Jamii Bora Bank) Merger ................................................. 27
Table 4.5: Equatorial Commercial Bank and Southern Credit Banking Corporation
Merger ................................................................................................................................ 28
Table 4.6: K-Rep Acquisition ............................................................................................ 29
Table 4.7: Fina Bank Acquisition ...................................................................................... 29
Table 4.8: Ecobank and EABS Acquisition ....................................................................... 30
Table 4.9: Descriptive statistics on ROA ........................................................................... 30
Table 4.10: Correlation results of ROA ............................................................................. 31
Table 4.11: Pre-Merger ANOVA results of ROA ............................................................. 31
Table 4.12: Post-Merger ANOVA results of ROA ............................................................ 32
Table 4.13: Descriptive Statistics of Return on Equity...................................................... 33
Table 4.14: Correlation results of ROE ............................................................................. 34
Table 4.15: Pre-Merger ANOVA results of ROE .............................................................. 34
Table 4.16: Post-Merger ANOVA results of ROE ............................................................ 35
Table 4.17: Descriptive Statistics of Capital Adequacy Ratio ........................................... 36
Table 4.18: Correlation results of CAR ............................................................................. 37
Table 4.19: Pre-Merger ANOVA results of CAR ............................................................. 37
Table 4.20: Post-Merger ANOVA results of CAR ............................................................ 38

1
CHAPTER ONE
1.0 INTRODUCTION
1.1. Background of the Study
Mergers and Acquisitions (M&A) have become popular in Kenya for firms who wish to
gain a competitive advantage in their various industries such as banking, insurance, oil,
gas, electricity among others (Kemal, 2011). Mergers and Acquisitions are increasing
worldwide because they encourage competition among industry firms, they also reduce
business risk and increase market share of the firms. Mergers and Acquisitions are types
of strategic decisions made by top most management which affect the long-term
performance of the business. Such decisions carry higher levels of risk and if effectively
implemented, they can reward highly (Buono, 2003). M&A are alsocorporate strategies
used by firms to promote future growth and create sustainable value (Wang & Xie, 2008).
From a legal perspective, mergers can be defined as a combination of two or more firms,
often comparable in size, in which all but one ceases to exist legally. An acquisition on
the other hand occurs when a company takes a controlling interest in another company, a
legal subsidiary of another firm, or selected assets of another firm (DePamphillis, 2014).
A direct or statutory merger is one which the acquiring company assumes the assets and
the liabilities of the company being acquired according government policies in that
country. A subsidiary merger involves the target company becoming a subsidiary of the
parent company. A statutory consolidation consists of two or more companies joining to
form a new company (Cassim, 2008). There are three major types of mergers and
acquisitions; horizontal, vertical and conglomerate mergers. Horizontal merger occurs
when two or more competing firms producing and selling the same product merge. Since
their products are considered as the same by their buyers, their cross elasticity of demand
and supply is usually high. The second type of merger is the vertical merger. It occurs
between firms that operate at different stages of production and have a successive
functional link for final product. The third type of merger is the conglomerate merger,
whichoccurs between firms that run unrelated business activities (Galpin & Herndon,
2014).
The global performance of M&A market has been adversely affected by ongoing political
and regulatory changes worldwide. Despite this, acquirers across the globe have
leveraged strategic combinations to expand their geographic reach and innovation

2
capabilities, such as Qualcomm’s acquisition of NXP (Next Experience) Semiconductors,
Chem China’s acquisition of Syngenta, London Stock Exchange’s merger with Deutsche
Boerse Group and American Telephone & Telegraph (AT&T) acquisition of Time
Warner (Morgan, 2016). Other global companies like Proctar and Gamble (P&G),
Johnson & Johnson (J&J), International Business Machines(IBM), General Electric
Company (GE), Pfizer, Cisco, Tata & Sons, Mahindra & Mahindra, Haier, Lenovo, and
Hong Kong and Shanghai Banking Corporation (HSBC) among others, have all adopted a
M&A strategy. According to researchers, such organizations rely on three mechanisms to
achieve growth: organic growth, alliances, and mergers and acquisitions (Rosinski, 2011).
Cross-border M&A continue to be an important feature of the market, accounting for 36%
of total volume versus 31% in 2015. A surge in China’s foreign business contributed to
overall cross-border M&A growth, as Chinese companies sought attractive opportunities
abroad (Morgan, 2016).
The African M&A market has been trending upwards over the past few years, although it
is quite small compared to other M&A markets worldwide. This has been mainly due to
the high economic growth in energy, mining and utilities sectors. It has been noted that
most cross-border mergers take place among firms in developed countries and that firms
with high levels of intangible assets or research and development (R&D) intensity are
natural candidates for cross-border mergers (Sonenshine &Reynolds, 2014). This is due
to the following; the combined firm needs to spread the high fixed cost of R&D
expenditures and knowledge asset attainment over large foreign markets. Global Law
firm Baker McKenzie’s latest quarterly Cross-border M&A Index shows that South
Africa was the top target country for inbound deals by volume and value, accounting for
29% of total deal count and USD 422 million or 54% of total value in Africa. The report
also showed that Nigeria had an upward trending on M&A trend followed by Kenya.
Examples of major African M&A deals in Africa include: Algeria’s Orascome Telecom
Algerie (OTA) acquisition by Egypt’s Global Telecom Holding and South Africa’s
Neotel acquisition by Vodacom; a subsidiary of telecommunications giant Vodafone.
At the time of the study, there were a total of 42 commercial banks, 12 microfinance
banks and 1 mortgage finance institution in Kenya. All these banks are regulated by the
Central Bank of Kenya, with additional oversight from the Capital Markets Authority
(CMA). All the listed banks are required to adhere to certain regulations such as

3
minimum liquidity ratios and cash reserve ratios with the Central Bank (Cytonn
Investments Report, 2015). Central Bank of Kenya (CBK) is tasked with formulating and
implementation of monetary and fiscal policies and is the lender of last resort in Kenya
and is the banker to all other banks. It ensures proper functioning of the Kenyan financial
system, the liquidity in the county and the solvency of the Kenya shilling. To address
issues that affect the Banking industry in Kenya, local banks came together and formed a
forum under the Kenya Bankers Association in 1962.
Commercial banks in Kenya have the following functions (Ongeri, 2013): they keep the
money deposited and valuable items in safe custody and make it accessible to customers
when they need it, they facilitate the transfer of funds from one account to another within
the same bank or to a different bank, they offer lending services to customers who need
the money at an interest, they offer foreign exchange services and assist, they offer
advisory services on financial matters relating to loans and taxation matters. The banks
also offer their customers investment services such as selling shares on behalf of
investors. They can also sell their own shares to the customers thus offering them
investment opportunities. Lastly, commercial banks act as trustees.
The major issues facing the Kenyan banks include: Implementation of new regulations
that were passed after adopting the new constitution. According to the Kenya National
Bureau of Statistics (KNBS) 2016 report, the amendment of the Banking Act in August
2016 to cap the lending rates to a maximum of 4% above the Central Bank Rate (CBR)
resulted in a substantial decline in the interest rates during September 2015 from a
percentage of 16.75% to 13.84% in the same month. The Global crisis has also affected
the banking industry in Kenya and more so the mobilization of deposits and trade
reduction. The Interest margins declines have also affected the banking industry in
Kenya.
The Banking industry in Kenya is governed by the Banking Act, the Companies Act, the
Central Bank of Kenya Act and the various guidelines issued by the Central Bank of
Kenya (Central Bank of Kenya 2014 annual report). Mergers and acquisition trends in
Kenya suggest a growth in the financial services sector in recent years, whereas sectors
such as manufacturing, tourism and healthcare have not seen a significant deal activity
(KPMG Annual Report, 2016). Kenyan Banks have realized a tremendous growth on

4
financial performance in the last five years and have expanded to the east African region.
This has led to automation as a way of moving from the traditional banking to meet the
growing complex needs of their customer and globalization challenges. Another factor
that has led to financial performance growth in the banking industry in Kenya includes:
Banks responding to the needs of the Kenyan market for convenience and efficiency
through alternative banking channels such as mobile, internet and agency banking.
Industry-wide branch networking expansion strategies in the East African community
region is another factor that has also led to growth (Cytonn Investment Report, 2015).
The banking industry in Kenya has experienced an unprecedented level of consolidation
especially since the 1990s due to economic growth. Between the years 2000 to 2015, a
total of 20 companies have engaged in either a mergers or acquisitions (Gathuku &Njeru,
2015). Some of the financial institutions that have merged with other firms include;
Kenya Commercial Bank Ltd, CFC Stanbic, Paramount Universal Bank, Citibank NA,
Southern Credit Banking Corp. Ltd., Co-operative Bank of Kenya ltd, Investment &
Mortgage Bank Ltd., Prime Bank Ltd., Commercial Bank of Africa ltd, EABS Bank ltd.,
Kenya Commercial Bank Limited, Jamii Bora Bank Ltd., Equatorial Commercial Bank
Ltd. and Dubai Bank Ltd. Other companies that have acquired others include; Bank of
Africa Bank Ltd., Eco bank, Guaranty Trust Bank (Kenya) Ltd, K-Rep Bank Ltd and
Equatorial. Recent merger/acquisition deals that have taken place as indicated on 2017
annual report for Central Bank of Kenya include Fidelity Commercial Bank acquisition
by SBM (State Bank of Mauritius) Kenya Ltd, Habib Bank Kenya acquisition by SBM
Bank Kenya Ltd and Habib Bank Kenya Ltd acquisition by Diamond Trust Bank Kenya
Ltd.
1.2. Statement of the Problem
Before the standardization of interest rates, Kenyan banks were making huge profits as
seen on their financial statements (Kenya & Konya, 2015). Despite the upward trend,
they still faced a few challenges such as; ATM card skimming where banks are making
losses compensating customers who are being ripped off their money by fraudsters, there
has also been a lot of theft cases in the banking industry from their own employees, their
security providers, and other external individuals (Cabric, 2015). Local mobile money
transfer services such as Mpesa, Airtel and currently introduced Equitel money have
brought in a lot of competition to banks. Many of their customers are making savings on

5
their phones as opposed to traditional banking (Cytonn Investment report, 2015).
Mugambi (2014) did a research on a similar study; ‘The impact of mergers and
acquisitions on the financial performance of commercial banks in Kenya’. The population
of his study consisted of fourteen banks that had merged in the period 1998 to 2013 in
Kenya. Results indicated that there was improvement in financial performance of
commercial banks after a merger or acquisition. This was due to an increase in return on
assets, return on equity and reduction in cost to income ratio after the merger. Different
studies on mergers show conflicting results on the financial implication of mergers and
acquisitions in the banking industry in Kenya.
With increasing competition and the economy heading towards globalization, the trend
on mergers and acquisitions are expected to rise at a much larger scale with the aim of
achieving a competitive edge in the industry (Mender, 2014). There are few
considerations that a company should consider before getting into a merger or
acquisition; the company should be willing to take the risk and make investments to
benefit fully from the merger as the competitors and the industry take heed quickly
(Bryman & Bell, 2015). To reduce and diversify risk, multiple decisions must be made to
narrow down to the one that will succeed. Management of the acquiring firm must also
learn to be patient and be able to adapt to the change (Cameron & Green, 2015). Previous
studies have mainly looked at return on equity and return on assets as measurable
independent variables to measure performance while leaving out financial stability as a
measure. This study, therefore investigated the effects of mergers and acquisitions on
financial performance of commercial banks in Kenya between the years 2008 to 2014
where financial performance was measured using three variables; shareholders’ value,
asset management and financial stability. An analysis of three years before and three
years after their mergers or acquisition was done.
1.3. General Objective of the Study
The general objective of this study was to establish the effect of mergers and acquisitions
on the financial performance of commercial banks in Kenya.
1.4. Specific Objectives of the Study
The following specific objectives were used to guide the study:

6
1.4.1. To determine the effect of shareholder’s equity on financial performance of
acquisitions or merged commercial banks in Kenya.
1.4.2. To determine the effect of asset management on financial performance of
acquisition or merged commercial banks in Kenya.
1.4.3. To investigate the effect of financial stability on financial performance of
acquisition or merged commercial banks in Kenya.
1.5. Importance of the Study
1.5.1. Commercial Banks
This study is important for commercial banks that have merged and wish to improve on
their financial performance.
1.5.2. Investors and Institutions
This study is important to investors and institutions who wish to make decisions
concerning mergers or acquisitions.
1.5.3. Policy Makers
This study will help policy makers to maximize on the value of the concerned
stakeholders based on the merger and acquisition strategy implemented by the
organization.
1.5.4. Scholars and Researchers
The study will also benefit scholars and researchers who wish to understand the
relationship between mergers/acquisitions and the performance of commercial banks.
1.6. Scope of the Study
The population of the study consisted of financial institutions in Kenya that had either
merged or undergone acquisitions from the period 2008 to 2016 as approved by the
Central Bank of Kenya. The study focused on ten commercial banks located in Nairobi.
The study was limited to the financial sector only because it focused on mergers and
acquisitions of banks and financial institutions that took place between theperiods 2008 to
2016.

7
1.7. Definition of Terms
1.7.1. Mergers and Acquisitions (M&A)
Merger is the activity by which two or more companies decide to come together and
function as one to achieve strategic objectives or goals like resource sharing, resource
utilization, economies of scale or cost minimization or any other operational or financial
advantage for both the companies (Salim, 2011).The term “acquisition” is used to refer to
any takeover by one company of the share capital of another in exchange of cash,
ordinary shares, or loan stock (Halpern, 1983).
1.7.2. Commercial Banks
A commercial bank is a financial institution that provides various financial services, such
as accepting deposits and issuing loans (Mbwaya, 2012).
1.7.3. Shareholders Value
This is the value delivered to shareholders because of management's ability to grow sales,
earnings and free cash flow over time (Fernandez, 2015)
1.7.4. Efficiency
This relates to how well an organization transforms inputs into outputs. To measure
efficiency, it is necessary to compare actual organizational production to some standard
or benchmark that, if achieved, is considered efficient (Reda, 2013).
1.7.5. Performance
This is the process of quantifying the efficiency and effectiveness of an action.
Organizational performance can be achieved by comparing the value that an organization
creates using its productive assets with the value that owners of these assets expect to
obtain (Armstrong &Baron, 2005).
1.7.6. Financial Performance
The level of performance of a business over a specified period of time, expressed in terms
of overall profits and losses during that time. Evaluating the financial performance of a
business allows decision-makers to judge the results of business strategies and activities
in objective monetary terms (Ang, 2014)

8
1.8. Chapters Summary
This chapter introduced thestudy on the effect of mergers and acquisitions on financial
performance of commercial banks in Kenya. The background discusses global trends and
what is happening in Africa regarding M&A. A summary of the banking industry in
Kenya has also been discussed to show the M&A trends locally. Thestatement of the
problem has been explored with an aim of developing the general objective of the study.
Specific research objectives, the significance and scope of the study were also included.
Chapter two discusses literature review from different authors related to mergers and
acquisitions. Chapter three discusses the methodology used, while chapter four discusses
the results and findings of the study. Finally, chapter five discusses the results,
conclusions and recommendations of the study.

9
CHAPTER TWO
2.0. LITERATURE REVIEW
2.1. Introduction
This chapter presents a review of literature on the effects of mergers and acquisitions in
the performance of financial institutions. It presents literature on the effects of
shareholder’s equity on financial performance, effect of asset management on financial
performance and effects of financial stability on financial performance.
2.2. Effects of Asset Management on Financial Performance
2.2.1. Asset Management and financial performance
Asset management is defined as the way in which the acquisition, use and disposal of the
assets of an individual or a company are managed in order to maximize profits (Ang,
2014). It is also concerned with the efficient utilization of the organization’s investment
in both physical and human asset to guarantee profit maximization objective of the firm
(Moynihan & Pandey, 2010). Empirical studies suggest that asset management in
commercial banks is determined by the ability of the banks to balance the capital
structure by retaining capital, absorbing loan losses, supporting future growth of assets
and providing return to investors (Makau & Memba, 2014). Giandomenico(2012) did a
study on asset liability management in banks for the period2004 - 2011 using a panel of
over 30 banks across Europe. The study concluded that to be effective in banking, the
management of assets and liabilities must take into consideration the earnings, liquidity,
profit and the level of loans & deposits.
Suzuki (2011) focused on financial reforms, ownership and performance in the banking
industry: the case of Indian Commercial Banks. The study was undertaken to investigate
the performance of commercial banks after the implementation of significant financial
reforms. The results generated by regression models indicated that foreign ownership
hadappositivesignificant impact on bank performance. He found that private ownership
has favorable impact on income efficiency, return on assets and non-performing loans.
The same had a negative impact on cost efficiency. Nazir and Afza (2009)studied the
impact of different types of working capital management policies on financial
performance of firms in different sectors in Pakistan. Their study used a sample of 263
non-financial firms belonging to 17 different sectors listed at the Pakistan stock exchange
from1998 to 2003. Secondary data was collected from the financial reports of the selected

10
companies and from the publications of State Bank of Pakistan. For the measurement of
the degree of aggressiveness they used current liabilities to total assets ratio and current
assets to total assets ratios. To investigate the impact of policies on the performance of
firms, they used return on equity and return on assets. Using regression analysis, results
confirmed an inverse relationship between degree of aggressiveness of the policies and
profitability.
Afza and Nazir (2008) conducted another study on working capital approaches and firm’s
returns. Their results showed a negative relationship between the profitability measures of
the firm and the degree of aggressiveness of working capital management. Their study
consisted of Pakistani firms listed under sixteen industrial groups in the Karachi Stock
Exchange (KSE) for the period (1998-2005). Findings indicated that firms with more
aggressive working capital policieswere not be able to generate more profit, proving the
negative relationship of working capital management and profitability.
2.2.2. Modigliani & Miller (M&M) theorem
The irrelevance theory of capital structure (1958) introduced by Merton Miller and
Franco Modigliani (M&M) was the first breakthrough in relation to the subject of capital
structure and its effect on firm performance. They first hypothesized that if markets are
perfectly competitive, firm performance will not be related to capital structure, therefore
suggesting no significant relationship between a firm’s capital structure and its
performance. The value of the firm is similarly unaffected by its financial structure. Their
assumptions of a perfectly competitive market excluded the impact of tax, inflation and
transaction costs associated with raising money. In addition, they also assumed that
disclosure of all information is credible, thus there is no information asymmetry
(Hamada, 1969; Rothschild &Stiglitz, 1974). There were various criticisms, which
encouraged M&M to issue an alteration to their first theory, which was referred to as
MM2. In their revised proposition, they incorporated tax benefit as a determinant of
capital structure.
The vital characteristic of taxation is the acknowledgement of interest as a tax-deductible
expenditure. According to M&M a company that respects its tax obligations, benefits
from partially offsetting interest, namely the tax shield, in the form of paying lower taxes.
The M&M theory indicated that companies could maximize their value by employing

11
more debt due to the tax shield benefits. Hence, firms benefit from taking on more
leverage. M&M show that firm value and firm performance is an increasing function of
leverage due to the tax deductibility of interest payments at the corporate level
(Modigliani & Miller, 1963). In reality markets are inefficient due to taxes, information
asymmetry, transaction costs, bankruptcy costs, agency conflicts and any other imperfect
elements. When taking these elements into consideration, the M&M theorem tends to lose
most of its explaining power. Even though the theory was heavily criticized of some
weaknesses and its irrelevant assumptions of the real world, this theory still provides the
foundation for many other theories suggested by other researches.
2.2.3. Static trade-off theory
According to Kraus and Litzenberger (1973), the Static Trade-off theory assumes that a
firm will tradeoff the benefits, costs of debt and equity financing to find an optimal
capital structure after accounting for the market imperfections. Such include taxes,
bankruptcy costs and agency costs. The theory also states that there is a benefit to
financing with debt, specifically the tax benefit. However, there is also a cost of financing
with the debt, namely the indirect bankruptcy cost. There is a maximum point where the
marginal benefit of further increase in debt declines as debt increases, whereas the
marginal cost increases. Hence, this static trade-off theory of capital structure states that
optimal capital structure is obtained where the net tax advantage of debt financing
balances leverages related costs such as financial distress and bankruptcy, holding a
firm’s assets and investment decisions constant.
Baxter (1967) and Altman (1968) in view of this theory claim that issuing equity means
moving away from the optimum and therefore should be considered bad news. According
to Myers (1984), firms adopting this theory could be regarded as setting a target of debt-
to-value ratio with gradual attempt to achieve it. However, managers will be reluctant to
issue equity if they feel it is undervalued in the market. The consequence of this is that;
investors will perceive equity issues to only occur when equity is either priced or
overpriced. Leverage is able to enhance a firm’s performance by limiting conflicts
between shareholders and managers because of having excess cash. El-Sayed Ebaid
(2009) argued that leverage mitigates lower agency costs, since the firm’s reputation and
the managers’ wages are at stake. On the other hand, higher leverage could also mean
that the firm has higher commitment to fulfill its future obligations, in terms of principal

12
and interest payments. Furthermore, higher leverage ratios also lead to higher costs
relating to financial distress.
Miller (1977) documented that the cost related to financial distress is not material
compared to the benefits of higher leverage ratios. Moreover, the trade-off theory
suggests that those firms with higher levels of retained earnings, i.e. profitable firms, tend
to have higher debt levels because they can more effectively use the tax shields on
interest. Since these companies have higher operating profits, the probability and costs of
financial distress for them is lower. Consequently, the trade-off theory expects a positive
association between firms’ leverage ratios and their financial performance (Chakraborty,
2010). Wippern (1996) investigated the relationship between financial leverage and a
firm’s performance. In his study he used debt to equity ratio as financial leverage
indicator and earnings to market value of common stock as performance indicator. His
results indicated that leverage had a positive effect on firm performance. Capon et al.
(1990) conducted a meta-analysis from 320 published studies related to financial
performance; they found a positive relationship between usage of leverage levels and
financial performance.
Roden and Lewellen (1995) analyzed the impact of capital structure on performance for
48 US based firms with a leveraged buyout during the period 1981 - 1990, using
multinomial logit models. Their results indicated a positive relationship between firm
performance and its leverage policy based on tax considerations. Their findings therefore
are consistent with the trade-off theory. Moreover, there is a positive relationship
between financial leverage and expected performance (Dessi & Robertson, 2003). They
argued that low growth firms attempt to depend on borrowing to exploit the expected
growth opportunities by investing the borrowed money in profitable projects which
results to an increase in the firm’s performance. Aburime (2005) carried out regression
analyses to analyze the impact of leverage ratio on firm performance between Ghanaian
listed firms over the period 1998 to 2002. Throughout his analysis, he compared the
capital structures of publicly quoted firms, large unquoted firms and small and medium
enterprises. He based his models on three measures of leverage, namely, short-term debt
over total assets, long-term debt over total assets and total debt over total assets. His
results indicated that there existed a significantly positive relationship between the short-
term and total debt and return on equity.

13
All the previously mentioned mechanisms suggested that the pecking order theory claims
a negative relationship between capital structure and firm performance, since more
profitable firms opt to use internal financing over debt (El-Sayed Ebaid, 2009).
2.3. Effects of Shareholder’s Equity on Financial Performance
This section looks at what is shareholder equity and relevant theories on shareholders’
equity. Shareholder wealth maximization has also been included in this section.
Empirical studies suggest that mergers tend to increase shareholders’ equity but decrease
efficiency for the target firm (Li, 2016). Oladipupo and Okafor (2011) explain that
increasing shareholders’ wealth is the fundamental purpose of mergers and acquisitions,
although different banks have different motives for participating in mergers. For
example, due to unforeseen political and economic circumstances in Kenya in 2007, it
was a strategic move for banks to merge so that smaller banks could operate within the
foreseeable future and avoid bank runs (Sharma, 2011). Synergy is another motive and
the most common reason for mergers whereby, the value of two firms combined is
greater than one. Synergy amalgamates duplicate costs by replacing identical processes
acquired from the target firm and can be considered that the merged organization could
exceed the profits of the original company by reducing costs or increasing the average
income (Shaver, 2006).
Tax benefits are another motive where companies can reduce taxes when merged. Tax
benefits can accrue at both the corporate and at shareholder levels (Dennis, 2016). For
example, acquiring firms can claim back their earnings when used to offset against the
taxable profits. A target firm and shareholders can benefit by receiving profits when
selling their shares during the process of the merger (Ghosh, 2004). Costs saving motives
also drive the merger activity, for example having a diversified production strategy will
reduce operational costs. This diversification will lead to new sources of cash flow
because the merger will increase and enhance the range of bank products and services
available to customers as new markets are entered (Badik, 2007).
2.3.1. Shareholders’ Equity and financial performance
Shareholders' equity also known as net worth or stockholders’ equity represents the net
value of an organization. It is the amount that would be returned to shareholders if all the
company's assets were to be liquidated and all its debts repaid. Shareholders' equity can

14
be either negative or positive (Moctar & Xiaofang, 2014). A positive figure means that
the company has more than enough assets to cover its liabilities while a negative figure
means that the company’s debts outweigh its assets. On the other hand, shareholders’
wealth is the present value of the expected future returns to the shareholders of the firm
(Brigham 2014).
Rani, Yadav, and Jain (2011) conducted a study on the impact of Mergers and
Acquisitions on Shareholders’ Wealth in the Short Run: An Event Study Approach and
came with the following findings; the earlier the investor sells, the more he gains, and
issuance of stock isn’t always the best decision for an investor. Hypothetically, an
investor can earn substantial returns if the shares of the acquiring company are purchased
two days before the announcement day and oversubscribed two days after the
announcement day. The announcement of cross-border acquisitions provides abundant
higher returns than that for domestic acquisitions. Additionally, the accumulative
abnormal returns within the case of cross-border acquisitions are known to be permanent,
whereas within the case of domestic acquisitions they're temporary. The announcement
of complete acquisitions of the target firm as a wholly-owned subsidiary provides higher
returns than that for partial/majority management acquisitions. Finally, the announcement
of acquisitions financed with cash payment provides substantial returns. Weston and
Weaver (2001) suggested that the shareholders of the acquiring firms gain from
efficiency enhancing mergers. Moeller, Schlingemann, and Stultz (2004) report that small
acquirers experience significantly higher capital/asset ratio around M&A announcements
than large acquirers.
Financial and economic studies typically employ event studies, which aim at
understanding how the share prices (stock returns) of the firms concerned react to the
merger or acquisition announcement. The results of these studies suggest that mergers
and acquisitions lead to significant positive abnormal returns to shareholders of the target
firm while resulting in negative abnormal returns to shareholders of the bidder firms
(Bild & Guest, 2002). The studies also demonstrate that despite the negative abnormal
returns to acquiring shareholders, these shareholders eventually benefit from overall
significant gains in the future. These results have led some authors to argue that the
results obtained tend to be sensitive to the methodology employed thereby leaving one to

15
continue doubting whether the results reflect reality or whether they simply reflect the
authors’ beliefs about mergers and acquisitions (Brigham 2014).
2.3.2. Shareholders Wealth Maximization Theory
Shareholder Wealth Maximization model (SWM), proposes that the single goal of the
firm should be to maximize the return to shareholders for a given level of risk, or
conversely, minimize the risk to shareholders for a given rate of return (Jensen &Ruback,
1983). With this in place, the firm will be able to increase its financial performance. This
theory assumes that the shareholders can eliminate all random type risks, except the risk
of overall stock market movements, through portfolio diversification. International
portfolio diversification is the ultimate method of this type of risk reduction (Ansong,
2015). The SWM model assumes the traditional belief that the stock market is efficient
(Jensen, 1978). This market efficiency assumes that the equity share price is always
correct because it captures all the new information on return and risk as perceived by
investors, and quickly incorporates this new information into the share price. Share prices
are in turn, the best allocators of capital in the macro economy (Shah & Arora 2014).
Shareholder’s contract with management is to maximize shareholders wealth (Bambale,
2016).
Shareholder wealth maximization is a norm of corporate governance that encourages a
firm’s board of directors to implement all major decisions such as compensation policy,
new investments, dividend policy, strategic direction, and corporate strategy with only
the interests of shareholders in mind (Migitha, 2016). There is a strong support for the
idea that shareholder wealth maximization should be the primary norm underlying the
governance of profitable corporations with objective of increasing their financial
performance (Diz, 2014). Managers who strive to maximize their own interests rather
than the firm’s profits are likely to be replaced by the shareholders of the firm.
2.3.3. Advantages and Disadvantages of Shareholders’ Wealth Maximization
Firstly, wealth maximization is based on cash flows and not profits. Unlike the profits,
cash flows are exact and definite and therefore avoid any ambiguity associated with the
accounting profits. Secondly, profit maximization is short-term while wealth
maximization is a long term goal. Thirdly, wealth maximization considers time value of
money (Migitha, 2016) while profit maximization does not. A dollar today and a dollar

16
one-year later do not have the same value. In wealth maximization, the future cash flows
are discounted at an appropriate discounted rate to represent their present value. Fourthly,
the wealth-maximization criterion considers the risk and uncertainty factor while
considering the discounting rate. The discounting rate reflects both time and risk. The
higher the uncertainty an organization experiences, the higher the discounting rate and
vice-versa. Pursuing a profit maximization strategy comes with the obvious risk that the
company may be so entrenched in the singular strategy meant to maximize its profits that
it loses everything if the market takes a sudden turn (Shah & Arora, 2014).
A company focused on maximizing its profit may miss out on opportunities for
investment and expansion. If a company pursues a profit maximization strategy, it creates
an environment where the price is given a priorityand therefore cutting costs becomes the
primary goal of the organization. This in turn,could lead to a loss of goodwill with
customers and suppliers. It also creates an expectation for shareholders to see immediate
gains, rather than realizing profits over time (Migitha, 2016). When maximizing profit is
the primary goal, investments, reinvestments and expansions are typically put aside. The
company simply utilizes what it has. This can create a more cost-efficient environment.
In the meantime, the profits keep building, producing a healthy bottom line and increase
the firm’s financial performance. Sometimes profit maximization is used entirely to
create an influx of cash so the firm can reduce its debt or save up for expansion. Some
degree of profit maximization is always present. Moreover, investors and financiers in the
company may require a certain level of profits to secure funds for expansion.
Furthermore, a company must perform well for its shareholders because they expect a
return on their investments.
2.4. Effect of Financial Stability on Financial Performance
A financially stable organization is one that is capable of efficiently allocating its
resources, being able to assess and manage its financial risks. Systematic loss is one way
which can be used to measure financial stability. It combines three key elements: each
individual institution’s probability of default, the size of loss given default, and the nature
of defaults across the institutions due to their interconnections (Sherraden & Ansong,
2016). Other indicators of financial stability include the ratio of regulatory capital to risk-
weighted assets and the ratio of non-performing loans to total gross loans. Risk-weighted
assets (RWA) has become one of the banking’s most important yardsticks. Lowering a

17
bank’s RWAs means less equity is required, which translates to higher returns and better
financial performance.
2.4.1. Capital Requirements and Financial Stability
Rationale for capital requirements regulation is motivated by the concern that a bank may
hold less capital than is socially optimal relative to its riskiness. In theory, the stabilizing
effects of capital requirements are supported by models based on the option-pricing
model (Galai & Masulis, 1976). In this framework, an unregulated bank will take
excessive portfolio and leverage risk to maximize its shareholder value at the expense of
the deposit insurance (Keeley & Furlong, 1990). Capital requirements can reduce these
moral hazard incentives by forcing bank shareholders to absorb a larger part of the losses,
thereby reducing the value of the deposit insurance put option. With more capital and less
risk-taking, the effect is clearly a decrease in the bank’s default probability.
The ability of capital requirements to strengthen the stability of the banking system has
been challenged in models based on the mean-variance framework. Sherraden and
Ansong (2016) found that if capital is relatively expensive, the forced reduction in
leverage diminishes the bank’s expected returns and hence reduces performance.
Consequently, the bank’s owners may choose a higher point on the efficiency frontier,
with a higher return and a higher risk. In some cases, the increase in the bank’s risk over
compensates the increase in capital and leads to a higher default probability. The
introduction of risk-based capital standards can be considered as an attempt to eliminate
the possible perverse effects of capital requirements. Unfortunately, empirical evidence
indicates that current capital requirements do not reflect banks’ risk-taking accurately.
Avery and Berger (1991), for example, find that the Basle risk-weighting framework
explains only about 5% of banks’ loan performance. If there are flaws in the risk-
weightings, risk-based capital standards may have destabilizing effects. Banks
constrained by the capital requirements can improve their capital ratio by decreasing risk
in terms of the official standards while business risk is increased. In the absence of
adjustment costs in the capital ratio, banks would never hold more capital than required
by the regulators or by the market. In practice, however, adjusting the capital ratio may
be costly. Equity issues may, in the case of information asymmetries, convey negative
information to the market on the bank’s economic value. Moreover, shareholders may be

18
reluctant to contribute new capital if the bank is undercapitalized. This would mean that
most of the benefits would accrue to creditors. In the presence of these adjustments costs,
banks falling under the legal capital requirements are not be able to react instantaneously
(Thompson, 1990). They may then be subject to repeated regulatory penalties or even get
closed. Consequently,banks may prefer to hold a “buffer” of excess capital to reduce the
probability of falling under the legal capital requirements, especially if their capital ratio
is very volatile. There are other papers that try to assess the costs and benefits of higher
capital requirements. One example is Miles et al. (2013) who derive the optimal capital
ratio for UK banks. They calculate costs using a two-step approach (first, estimate the
impact of higher capital on lending spreads; next, estimate the impact of higher lending
spreads on output). The key results indicated that a 1 percentage point increase in capital
requirements caused theoutput to fall by 0.02%, compared with 0.09% in a study done by
Angelini, Neri and Panetta (2014). In the long term, the increase in lending spreads by 1
point in the capital requirement and is equal to 0.8 basis point, which is smaller by a
factor of 16 compared the estimate done by King and Baker (2010) of 13 basis points.
Given these costs and considering that higher capital also reduces the probability of a
banking crisis, the welfare analysis suggested that the optimal bank capital should be
around 20% of the risk-weighted assets. Benes and Kumhof (2011) use a theoretical
model to analyze the impact of prudential rules and a countercyclical capital buffer
requirement. When risk weights are low, they give an impression that banks are
sufficiently capitalized and in sound financial health. Overoptimistic assessment of risk
weights has led to large-scale extension of credit and hence a decline in lending
standards. The reduction of risk weights could be particularly strong in a period in which
interest rates are low. A reduction in the policy rate boosts asset and collateral values,
which in turn can modify bank estimates of probabilities of default, loss given default and
volatilities.
2.4.2. Buffer Theory of Capital Adequacy
Consequently, banks may prefer to hold a ‘buffer’ of excess capital to reduce the
probability of falling under the legal capital requirements, especially if their capital
adequacy ratio is very volatile. For example, capital requirements constitute the main
banking supervisory instrument in Nigeria. The Central Bank of Nigeria intervenes little
in banks’ activities but does direct on-site examinations and at times delegates this task to

19
external auditors. By contrast, a breach of the capital requirements is considered a major
infringement of banking legislation and is not tolerated by the Central Bank of Nigeria
(Soludo, 2004). Banks remaining undercapitalized for prolonged periods are usually
closed. The withdrawal of some banking license at the expiration of the recent
capitalization of banks in Nigeria in 2005 is a pointer to this fact. Banks will require more
capital if deposits are not fully mobilized from the public. Capital is more reliable,
dependable and can be used for long term planning. Ability of banks to mobilize enough
deposits obviates the capital base from being eroded (Adegbaju & Olokoyo, 2008).
The buffer theory of Calem and Rob (1996) predicts that a bank approaching the
regulatory minimum capital ratio may have an incentive to boost capital and reduce risk
to avoid the regulatory costs triggered by a breach of the capital requirements. However,
poorly capitalized banks may also be tempted to take more risk in the hope that higher
expected returns will help them to increase their capital. This is one of the ways risks
relating to lower capital adequacy affects banking operations. In the event of bankruptcy
of a bank, the risks are absorbed by the bank, customers and Insurance Corporation
(NDIC). A study by Ikpefan (2013) on the impact of bank capital adequacy ratios,
management and performance in the Nigerian commercial bank between the period1986 -
2006. The study showed that shareholders fund /total Assets ratio which measures capital
adequacy of banks (risk of default) had a negative impact on return on assets. The
efficiency of management measured by operating expenses indices is negatively related
to return on capital.
Berger and Udell (2006) investigated whether the 8% capital backing for loans to private
enterprises required by the 1988 Basle Accord, encouraged banks to reallocate their
assets from such loans to government securities. Apart from Berger and Udell, other
authors found evidence that the risk-based capital requirement set by the Basle Accord
significantly contributed to the credit crunch. No matter the definition adopted, a bank’s
capital is widely used to analyze the status of its financial strength (Bobakova, 2003).
Positive correlation between returns and capital has been demonstrated by Naceur (2003)
and Eisenbeis and Kwan (2005) among other researchers. While investigating the
determinants of Tunisia banks’ performances during the period 1980 to 1995, Naceur and
Goaied (2001) indicated that the best performing banks are those who have struggled to
improve labor and capital productivity and those who have been able to reinforce equity.

20
Bourke (1989) and Naceur (2003) agree that well capitalized banks face lower need to
external funding and lower bankruptcy and funding costs. These advantages translate into
profitability and hence increased financial performance. This means that the more capital
a bank has, the more resistant it will be to failure (Uche, 1998). Capital requirements can
reduce these moral hazard incentives by forcing bank shareholders to absorb a larger part
of the losses, thereby reducing the value of the deposit insurance put option. With more
capital and less risk taking, the effect is clearly a decrease in the bank’s default
probability.
2.5. Chapter Summary
In this chapter, theories on how financial performance is affected by asset management,
shareholders’ equity and financial stability have been discussed. A review of relevant
literature has been used to show different views and results in respect to the objectives of
the study from related studies from different researchers. The next chapter three discusses
the methodology used in this study, the data collection technique and the methods that
were applied in analyzing the data.

21
CHAPTER THREE
3.0. RESEARCH METHODOLOGY
3.1. Introduction
This chapter presents the research methodology. The research method consists of how the
researcher collects, analyzes, and interprets the data in the study (Creswell, 2009). This
chapter discusses the research design, population, sampling design, data collection
methods, research procedure, data analysis methods and the chapter summary.
3.2. Research Design
A Research design is a master plan that specifies the methods and procedures for
collecting and analyzing the needed information i.e. it provides a framework or plan of
action for the research (Zikmund et al., 2013). The study adopted a descriptive research
design which was focused on determining the relationship between financial performance
and mergers or acquisitions of commercial banks in Kenya. Descriptive studies report on
summary data such as measures of central tendency including the mean, median, mode,
deviance from the mean, variation, percentage, and correlation between variables
(Knupfer& McLellan, 2001). An event study methodology was used to determine the
effect of mergers and acquisitions on the performance of merged financial institutions.
There was the period before the study known as the pre-merger period and the period
after the merger known as the post-merger period. Correlation and regression methods
were then used to analyze the secondary data collected from audited financial statements,
bank supervision annual reports published by Central Bank of Kenya, and the bank
websites that had either merged or undergone acquisitions.
3.3. Population and Sampling Design
3.3.1. Population
Population is a group of individuals, objects or items from which samples are taken for
measurement and have at least one thing in common (Kombo &Tromp, 2011). Mugenda
O. and Mugenda A. (2013), state that a population is a group of individuals or objects
with a common observable characteristic. The population of this study was comprised of
all licensed commercial banks in Kenya that had either merged or undergone
acquisitions. The focus was on mergers and acquisitions that took place in the industry
between 2008 and 2016.

22
3.3.2. Sample Design
Sampling design can be defined as a procedure or plan drawn up before any data is
collected to obtain a representative from a given population. It is also known as sampling
plan or survey design (Saunders, Lewis &Thornhill, 2016). The sampling frame,
sampling technique and sample size, all make up the sample design.
3.3.2.1. Sampling Frame
A sampling frame is a list of elements from which a sample can be drawn (Zikmund et
al., 2013). The study’s sampling frame for the secondary data was the list of all merged
financial institutions approved by the Central Bank of Kenya. At the time of the study,
there were 33 mergers and 9 acquisitions from the period 1989 to 2016.
3.3.2.2. Sampling Technique
Sampling technique is the process of selecting several individuals for a study in such a
way that they represent the large group from which they were selected from (Kothari,
2004). The study adopted a purposive quantitative sampling method. The main goal of
purposive sampling is to focus on characteristics of a population that are of interest,
which then guides the researcher to answer the study’s research objectives.
3.3.2.3. Sample Size
A sample refers to a small representative unit or group that is derived from the study
population (Mugenda A. & Mugenda O., 2013). The sample of this study was all
commercial banks that head either merged or undergone acquisitions between 2008 and
2016 as shown on appendix II. This period was chosen as the sampling period because
there were many merger activities that had taken place after the country had recovered
from the 2007 Kenyan general elections.
3.4. Data Collection Method
Data collection refers to the process of gathering raw and unprocessed information that
can be processed into meaningful information (Christensen, Johnson, Turner, &
Christensen, 2011). A secondary data collection template was used to collect the data
used in the study.
23
3.4.1. Secondary Data Collection Template
A secondary data collection template was used to collect data on ROA, ROE, CAR and
MSI for the commercial banks that had merged or undergone acquisitions between 2008
and 2016 in Kenya as shown on appendix I. This data was then used to come up with a
checklist that was used to measure each specific objective as shown on appendix I A, B
and C. This information was obtained from the audited financial statements of the merged
financial institutions. In the data collection checklist, the ratio of net income to total
assets was used as a proxy for asset management, the ratio of net income to equity was
used as a proxy for shareholders’ equity, the ratio of capital to risk weighted assets was
used as a proxy for financial stability and finally the market share index was used as a
proxy for financial performance.
3.5. Research Procedure
This is a step-by-step sequence of activities or course of action (with definite start and
end) that must be followed in the same order to correctly perform a task (Kombo &
Tromp, 2011). The research study was conducted by first developing the research
objectives, secondly by identifying the sample data, and thirdly by analyzing the data and
making recommendations on the study.
3.5.1. Development of the research objectives
The general objective of the study was to determine the effects of mergers and
acquisitions on the financial performance of commercial banks in Kenya. The study was
guided by three specific objectives namely: to determine the effect of asset management
on financial performance; to determine the effect of shareholder’s equity on financial
performance and to investigate the effect of financial stability on financial performance.
3.5.2. Identification of the sample data
To come up with a sample, one needs to determine the purpose of the data collection and
what type of information is necessary to collect to meet that purpose (Creswell, 2009). To
help achieve this, the study considered data sources that were reliable, accessible,
relevant, suitable, adequate and recent. The sample of this study was all commercial
banks that head either merged or undergone acquisitions between 2008 and 2016 as
shown on appendix II. This period was chosen as the sampling period because of its
relevancy as there were several merger activities that had taken place after the country

24
had recovered from the 2007 general elections in Kenya. Relevant permission was then
obtained to conduct the study at the selected financial institutions.
3.6. Data Analysis Methods
Secondary data, three years before and three years after the event was retrieved from
audited financial statements, annual reports published by Central Bank of Kenya and the
respective bank websites. Financial ratios: return on assets (ROA), return on equity
(ROE), capital asset ratio (CAR) and market share index (MSI) were then obtained from
the statements and annual reports of commercial banks under study. Descriptive,
correlation and regression analysis were then used to establish the effect of the mergers
and acquisitions on financial performance of commercial banks in Kenya. The dependent
performance indicators were ROA, ROE and CAR while the independent variable was
the MSI. These were used to answer the specific research objectives: to investigate effects
of Mergers or Acquisitions on shareholder’s value of commercial banks in Kenya; to
determine the effect of shareholder’s equity on financial performance of acquisitions or
merged commercial banks in Kenya; to determine the effect of asset management on
financial performance of acquisition or merged commercial banks in Kenya; to
investigate effect of financial stability on financial performance of acquisition or merged
commercial banks in Kenya. Statistical Package for Social Science (SPSS) version 21
software was then used to perform regression and correlation tests on the data collected.
3.7. Chapter Summary
This chapter is a presentation of the research design used in the study. It describes the
population, the sampling procedure and the data collection methods that were used in the
study. The main instruments of research in the study were the audited financial
statements from the sampled institutions. The data collected was then analyzed using
Statistical Package for Social Sciences (SPSS) version 21 software. The analyzed data
was then used to obtain the descriptive, correlation and regression analysis to establish
the effect of the mergers and acquisitions on financial performance of commercial banks
in Kenya. The findings as well as results are presented in the next chapter.
25
CHAPTER 4
4.0. RESULTS AND FINDINGS
4.1. Introduction
The general objective of this study was to determine the effects of mergers and
acquisitions on the financial performance of commercial banks in Kenya. This chapter
discusses the findings of the data collected in chapter three for the individual institutions
under study. The chapter gives a summary results of all the institution, then discusses
results of each specific objective as follows: effect of shareholder’s value on financial
performance of merged commercial banks; effect of asset management on financial
performance of merged commercial banks in Kenya and effect of asset management on
financial performance of merged commercial banks in Kenya
4.2. General Information
This section contains the Mean (M) of return on equity (ROE), return on assets (ROA),
capital asset ratio (CAR) and market share index (MSI)for each of the sampled bank in
the study.
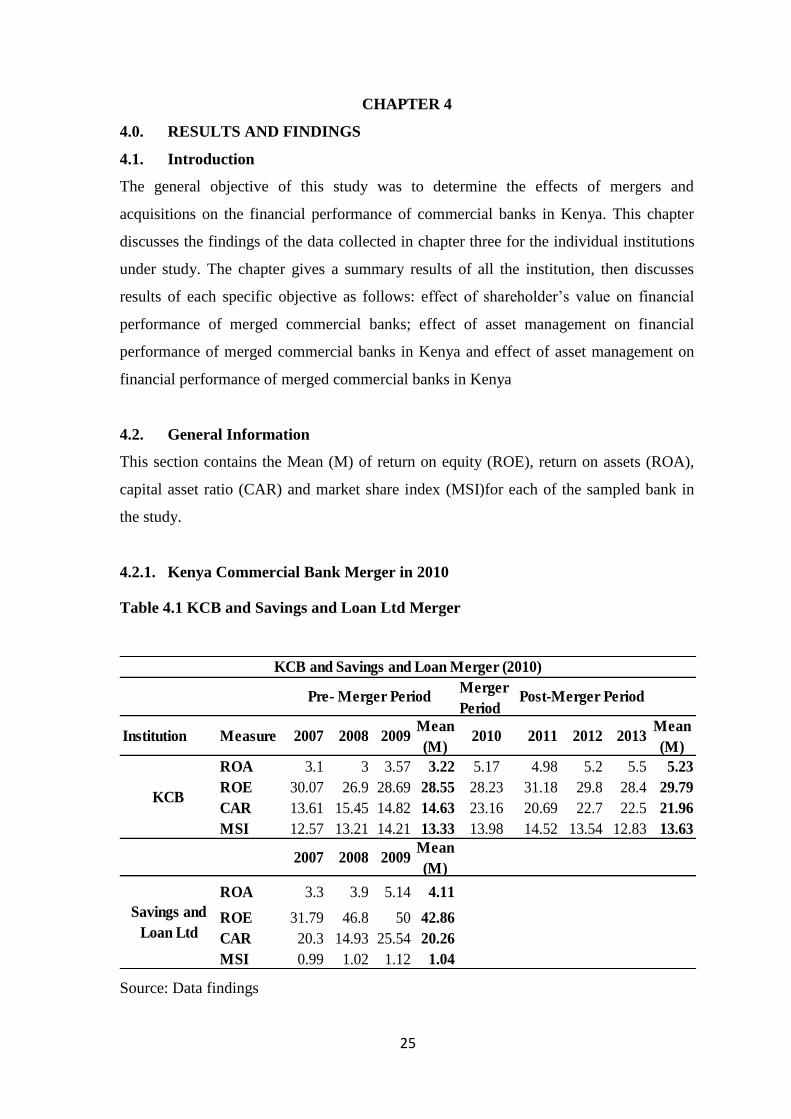
4.2.1. Kenya Commercial Bank Merger in 2010
Table 4.1 KCB and Savings and Loan Ltd Merger
Source: Data findings
Merger
Period
Institution Measure 2007 2008 2009Mean
(M)2010 2011 2012 2013
Mean
(M)
ROA 3.1 3 3.57 3.22 5.17 4.98 5.2 5.5 5.23
ROE 30.07 26.9 28.69 28.55 28.23 31.18 29.8 28.4 29.79
CAR 13.61 15.45 14.82 14.63 23.16 20.69 22.7 22.5 21.96
MSI 12.57 13.21 14.21 13.33 13.98 14.52 13.54 12.83 13.63
2007 2008 2009Mean
(M)
ROA 3.3 3.9 5.14 4.11
ROE 31.79 46.8 50 42.86
CAR 20.3 14.93 25.54 20.26
MSI 0.99 1.02 1.12 1.04
KCB and Savings and Loan Merger (2010)
KCB
Pre- Merger Period Post-Merger Period
Savings and
Loan Ltd

26
Pre-merger ROA mean for KCB was 3.22 while Savings and Loan Ltd was 4.11, after the
merger this rose to a mean of 5.23. ROE mean for KCB before the merger was 28.55
while that of Savings and Loan Ltd was 42.86, after the merger the mean ROE was at
29.79. CAR for KCB before the merger was 14.63 while Savings and Loan Ltd was
20.26, this rose to mean of 21.96. Pre-merger mean MSI index for KCB was 13.33 while
Savings and Loan Ltd was 1.04. After the merger the value rose to 13.63 as shown on
table 4.1.
4.2.2. Prime Bank Ltd Merger in 2008
Prime Bank pre-merger ROA mean was 1.70, this rose to a mean of 2.59 after the merger.
Pre-merger ROE mean was at 16.09, which rose to a post-merger mean of 22.24. CAR
had a mean of 14.51 before the merger which rose to mean of 15.34. MSI had a pre-
merger mean of 1.97 that rose to 1.95 after the merger as shown on table 4.2 below.
Table 4.2: Prime Bank Merger in 2008
Source: Data findings
4.2.3. CFC Stanbic Bank Ltd merger in 2008
The ROA mean for CFC Bank Limited before its merger with Stanbic Bank was 2.25 for
CFC bank and 2.93 for Stanbic bank, these values were higher that the ROA mean after
the merger which was at 1.85. Pre-merger ROE mean for CFC Bank was 21.88 and that
of Stanbic Bank Kenya was 30.23. After the merger the value was at 22.69. CAR mean
was 19.30 and 15.99 for CFC Bank and Stanbic Bank respectively, after the merger the
mean value was 17.09. MSI pre-merger mean for CFC Bank was 3.64 and that of Stanbic
bank was 3.54. After the merger the MSI mean rose to a mean of 5.49 as shown on table
4.3.
Merger
Period
Instituion Measure 2005 2006 2007Mean
(M)2008 2009 2010 2011
Mean
(M)
ROA 1.4 1.5 2.2 1.7 2.3 2.33 2.37 3.07 2.59
ROE 17.32 14.51 16.45 16.09 15 18.09 19.74 28.88 22.24
CAR 15.59 13 14.94 14.51 16.05 15.74 13.76 16.51 15.34
MSI 1.71 2.24 1.96 1.97 2.31 2.41 1.8 1.64 1.95
Credit Ltd.
Pre-Merger Period Post-Merger Period
Credit Limited and Prime Bank Merger

27
Table 4.3: CFC Bank Ltd and Stanbic Bank Ltd Merger
Source: Data findings
4.2.4. Jamii Bora Bank acquisition in 2010
Table 4.4 City Finance Bank (Jamii Bora Bank) Merger
Source: Data findings
Before the acquisition in 2010 City Finance Bank Ltd, currently known as Jamii Bora
Bank had a mean ROA of -1.62, this slightly rose to a mean of 0.34 after the acquisition.
The ROE means before the acquisition was -3.22, which rose to 1.36 after the acquisition.
The CAR mean was 83.49 which fell to 73.29 after the acquisition. MSI pre-merger mean
was 0.52 which slightly fell to a mean of 0.28 after the merger as shown on table 4.4.
above.
Merger
Period
Institution Measure 2005 2006 2007Mean
(M)2008 2009 2010 2011
Mean
(M)
ROA 1.54 2.1 3.1 2.25 1.5 1.35 1.96 2.23 1.85
ROE 15.36 22.7 27.59 21.88 18.4 16.3 20.96 30.82 22.69
CAR 20.48 18.29 19.13 19.30 14.65 16.04 16.2 19.04 17.09
MSI 3.81 3.69 3.43 3.64 7.62 6.05 5.31 5.10 5.49
2005 2006 2007Mean
(M)
ROA 2.5 2.9 3.4 2.93
ROE 21.64 33.48 35.57 30.23
CAR 16.31 17.63 14.03 15.99
MSI 3.01 3.90 3.70 3.54
CFC Bank Ltd and Stanbic Bank (2008)
Pre- Merger Period Post-Merger Period
CFC Bank Ltd
Stanbic Bank
Merger
Period
Instituion Measure 2007 2008 2009Mean
(M)2010 2011 2012 2013
Mean
(M)
ROA -3.1 -0.5 -1.26 -1.62 -4.85 -1.79 1.5 1.3 0.34
ROE -8.74 -0.9 -0.02 -3.22 -8.19 -2.43 2.5 4 1.36
CAR 77.93 78.27 94.28 83.49 35.69 110.5 83.6 25.8 73.29
MSI 0.53 0.52 0.52 0.52 0.21 0.24 0.27 0.32 0.28
City Finance
Bank
Jamii Bora Bank Acquisition in 2010
Pre-Merger Period Post-Merger Period
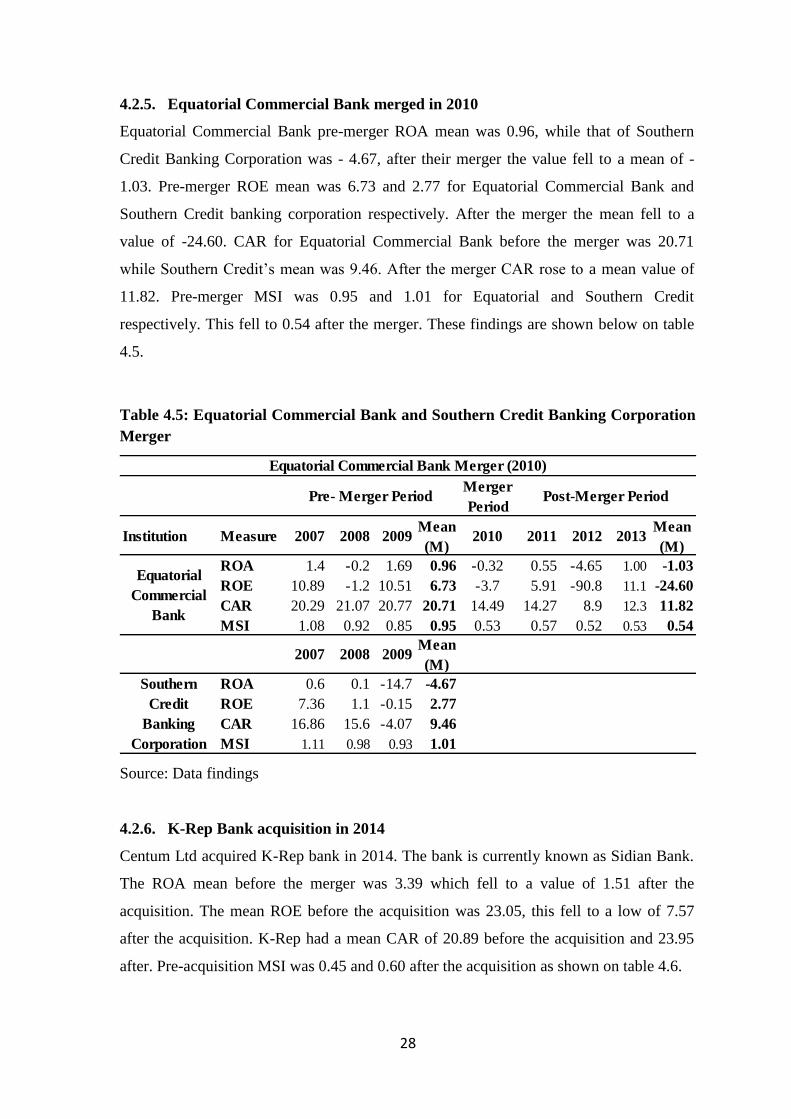
28
4.2.5. Equatorial Commercial Bank merged in 2010
Equatorial Commercial Bank pre-merger ROA mean was 0.96, while that of Southern
Credit Banking Corporation was - 4.67, after their merger the value fell to a mean of -
1.03. Pre-merger ROE mean was 6.73 and 2.77 for Equatorial Commercial Bank and
Southern Credit banking corporation respectively. After the merger the mean fell to a
value of -24.60. CAR for Equatorial Commercial Bank before the merger was 20.71
while Southern Credit’s mean was 9.46. After the merger CAR rose to a mean value of
11.82. Pre-merger MSI was 0.95 and 1.01 for Equatorial and Southern Credit
respectively. This fell to 0.54 after the merger. These findings are shown below on table
4.5.
Table 4.5: Equatorial Commercial Bank and Southern Credit Banking Corporation
Merger
Source: Data findings
4.2.6. K-Rep Bank acquisition in 2014
Centum Ltd acquired K-Rep bank in 2014. The bank is currently known as Sidian Bank.
The ROA mean before the merger was 3.39 which fell to a value of 1.51 after the
acquisition. The mean ROE before the acquisition was 23.05, this fell to a low of 7.57
after the acquisition. K-Rep had a mean CAR of 20.89 before the acquisition and 23.95
after. Pre-acquisition MSI was 0.45 and 0.60 after the acquisition as shown on table 4.6.
Merger
Period
Institution Measure 2007 2008 2009Mean
(M)2010 2011 2012 2013
Mean
(M)
ROA 1.4 -0.2 1.69 0.96 -0.32 0.55 -4.65 1.00 -1.03
ROE 10.89 -1.2 10.51 6.73 -3.7 5.91 -90.8 11.1 -24.60
CAR 20.29 21.07 20.77 20.71 14.49 14.27 8.9 12.3 11.82
MSI 1.08 0.92 0.85 0.95 0.53 0.57 0.52 0.53 0.54
2007 2008 2009Mean
(M)
ROA 0.6 0.1 -14.7 -4.67
ROE 7.36 1.1 -0.15 2.77
CAR 16.86 15.6 -4.07 9.46
MSI 1.11 0.98 0.93 1.01
Equatorial Commercial Bank Merger (2010)
Pre- Merger Period Post-Merger Period
Equatorial
Commercial
Bank
Southern
Credit
Banking
Corporation

29
Table 4.6: K-Rep Acquisition
Source: Data findings
4.2.7. Fina Bank acquisition in 2013
Fina Bank Limited was acquired by Guaranty Trust Bank Plc in 2013. The ROA mean
before the acquisition was 1.73 which fell to a value of 1.49 after the acquisition. The
mean ROE before the acquisition was 15.15, this fell to 6.98 after the acquisition. The
mean CAR was 17.66 before the acquisition and 27.03 after the acquisition. Pre-
acquisition MSI was 0.73 and 0.98 after the acquisition as shown on table 4.7.
Table 4.7: Fina Bank Acquisition
Source: Data findings
4.2.8. Eco Bank acquisition in 2013
Kenya's East African Building Society (EABS) Bank was acquired by Ecobank
Transnational Incorporated (ETI) in 2008. The ROA mean for EABS bank before the
acquisition was 0.49 which fell to -1.99 after the acquisition. The mean ROE before the
acquisition was 3.50, this fell to a value of 3.42 after the acquisition. The mean CAR
Merger
Period
Instituion Measure 2011 2012 2013Mean
(M)2014 2015 2016
Mean
(M)
ROA 2.75 3.21 4.22 3.39 4.61 2.72 0.30 1.51
ROE 19.23 20.1 29.81 23.05 29.98 13.54 1.60 7.57
CAR 19.78 21.5 21.4 20.89 20.6 24.7 23.20 23.95
MSI 0.47 0.42 0.47 0.45 0.51 0.60 0.60 0.6
K-Rep Bank
K-Rep Bank Merger in 2014
Pre-Merger Period Post-Merger Period
Merger
Period
Instituion Measure 2010 2011 2012Mean
(M)2013 2014 2015 2016
Mean
(M)
ROA 1.07 2.12 2.00 1.73 0.69 1.17 1.07 2.23 1.49
ROE 11.32 20.22 13.9 15.15 4.06 7.43 5.6 7.90 6.98
CAR 17.06 19.01 16.9 17.66 33.80 25.90 27.7 27.50 27.03
MSI 0.76 0.69 0.74 0.73 1.09 1.07 0.97 0.90 0.98
Pre-Merger Period
FINA Bank
Post-Merger Period
FINA Bank merger in 2013

30
was18.58before the acquisition and 20.19 after the acquisition. Pre-acquisition MSI was
1.60 and 1.40 after the acquisition as shown on table 4.8.
Table 4.8: Ecobank and EABS Acquisition
Source: Data findings
4.3. Effect of Asset Management on Financial Performance of Merged
Commercial Banks in Kenya
Return on assets before and after the merger period was used to measure how the banks
under study were managing their assets.
4.3.1. Descriptive statistics on Return on Assets
From the findings illustrated on table 4.9 there was a slight rise in the Mean (M) for
return on assets from 1.3188 before merger to 1.3758 after merger. The Standard
Deviation (SD) slightly fell from 3.34190 to 2.84065 after the merger. The variance (V)
for return on assets also fell from 11.168 before merger to 8.069 after merger for the
sampled banks.
Table 4.9 Descriptive statistics on ROA
Mean (M)
Std.
Deviation
(SD)
Variance
(V)
Skewness
(S)
Kurtosis
(K)
Statistic Std.
Error Statistic Statistic Statistic Statistic
Pre-Merger 1.3188 0.58175 3.3419 11.168 -3.627 16.868
Post-Merger 1.3758 0.57985 2.84065 8.069 -1.348 3.027
Merger
Period
Instituion Measure 2005 2006 2007Mean
(M)2008 2009 2010 2011
Mean
(M)
ROA 0.07 0.40 1.00 0.49 0.5 -7.13 0.7 0.45 -1.99
ROE 0.56 3.01 6.94 3.50 3.8 -0.54 3.76 7.03 3.42
CAR 16.97 20.55 18.23 18.58 15.52 15.67 19.33 25.58 20.19
MSI 1.93 1.71 1.16 1.60 1.47 1.58 1.59 1.02 1.40
Ecobank Kenya Ltd merger in 2008
Pre-Merger Period Post-Merger Period
EABS Bank

31
4.3.2. Correlation Analysis Results of Return on Asset on financial performance
Results of the correlation analysis between performance and return on assets are
illustrated in table 4.10. The results showed that there is a positive significant relationship
between return on assets and performance r (24) = .536, p < 0.01.
Table 4.10 Correlation results of ROA
ROA Performance
ROA
Pearson Correlation 1 .536**
Sig. (2-tailed)
.007
N 24 24
Performance
Pearson Correlation .536** 1
Sig. (2-tailed) .007
N 24 24
**. Correlation is significant at the 0.01 level (2-tailed)
4.3.3. Regression analysis on the effect of ROA on financial performance
Table 4.11 Pre-Merger ANOVA results of ROA
Model Summary
Model R R Square Adjusted R
Square Std. Error of the Estimate
1 .026a 0.001 -0.032 20.37043
a. Predictors: (Constant), ROA
Pre-Merger ANOVA
Model Sum of
Squares df Mean Square F Sig.
1
Regression 8.531 1 8.531 0.021 .887b
Residual 12863.59 31 414.955
Total 12872.121 32
a. Dependent Variable: Financial Performance
b. Predictors: (Constant), ROA
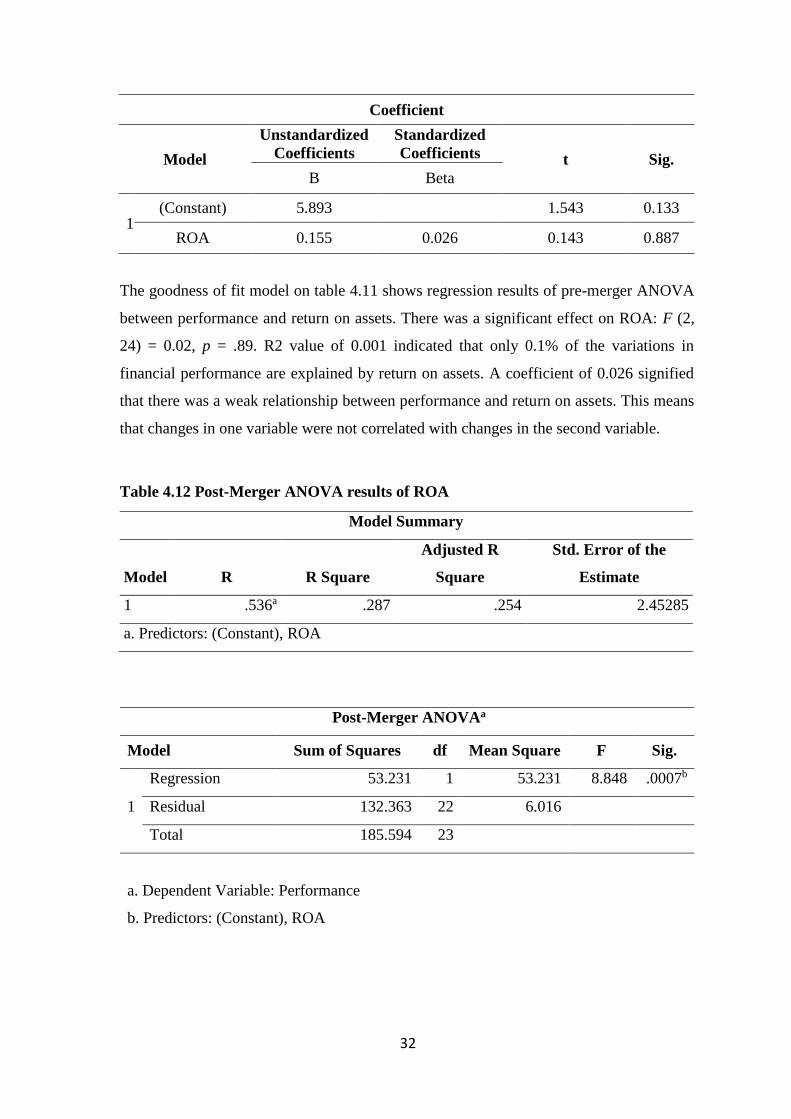
32
Coefficient
Model
Unstandardized
Coefficients
Standardized
Coefficients t Sig.
B Beta
1 (Constant) 5.893
1.543 0.133
ROA 0.155 0.026 0.143 0.887
The goodness of fit model on table 4.11 shows regression results of pre-merger ANOVA
between performance and return on assets. There was a significant effect on ROA: F (2,
24) = 0.02, p = .89. R2 value of 0.001 indicated that only 0.1% of the variations in
financial performance are explained by return on assets. A coefficient of 0.026 signified
that there was a weak relationship between performance and return on assets. This means
that changes in one variable were not correlated with changes in the second variable.
Table 4.12 Post-Merger ANOVA results of ROA
Model Summary
Model R R Square
Adjusted R
Square
Std. Error of the
Estimate
1 .536a .287 .254 2.45285
a. Predictors: (Constant), ROA
Post-Merger ANOVAa
Model Sum of Squares df Mean Square F Sig.
1
Regression 53.231 1 53.231 8.848 .0007b
Residual 132.363 22 6.016
Total 185.594 23
a. Dependent Variable: Performance
b. Predictors: (Constant), ROA

33
Coefficient
Model
Unstandardized
Coefficients
Standardized
Coefficients t Sig.
B Std. Error Beta
1 (Constant) 0.298 0.618
0.482 0.635
ROA 0.347 0.117 0.536 2.974 0.007
a. Dependent Variable: Financial Performance
Regression results of post-merger ANOVA indicated a significance of F (2, 24) = 8.48, p
= 0.01. An R2 of 0.287 indicated that28.7% of the variations in performance are
explained by return on assets after the merger or acquisition event. The overall model is
shown on table 4.12
4.4. Effect of Shareholder’s Equity on Financial Performance of Merged
Commercial Banks in Kenya
4.4.1. Descriptive Statistics on Shareholders’ equity
Return on equity was used to measure shareholder’s equity. Descriptive statistics were
used to describe the pre-merger and post-merger values to determine if there were any
changes and how this affected the performance of banks that had either merged or
undergone acquisitions. There was a fall in the mean values for the return on equity from
17.0548 before merger to 9.6146 after merger. The standard deviation rose from
14.26795 to 24.12155 after the merger. The variance for return on assets also rose from
203.574 before merger to 581.849 after merger for the sampled banks as illustrated on
table 4.13
Table4.13 Descriptive Statistics of Return on Equity
Mean (M)
Std.
Deviation
(SD)
Variance
(V)
Skewness
(S)
Kurtosis
(K)
Statistic Std.
Error Statistic Statistic Statistic Statistic
Pre - Merger 17.0548 2.48373 14.26795 203.574 0.358 -0.276
Post - Merger 9.6146 4.92379 24.12155 581.849 -3.255 13.704

34
4.4.2. Correlation Analysis Results of Return on Equity on financial performance
Table 4.14 below shows the results of the correlation analysis between performance and
return on equity. The results show that there is a positive significant relationship between
return on equity and performance, r (24) = .041, p<0.05.
Table 4.14 Correlation results of ROE
ROE Performance
ROE Pearson Correlation 1 .419*
Sig. (2-tailed) 0.041
N 24 24
Performance Pearson Correlation .419* 1
Sig. (2-tailed) 0.041
N 24 24
* Correlation is significant at the 0.05 level (2-tailed).
4.4.3. Regression analysis on the effect of ROE on financial performance
Regression results of pre-merger ANOVA indicated that performance and return on
equity had a significance F (2, 24) = 0.133, p= 0.718. An R2 of 0.004 indicates that only
0.4% of the variations in performance are explained by return on equity. The overall
model significance is presented in Table 4.15.
Table 4.15 Pre-Merger ANOVA results of ROE
Model Summary
Model R R Square Adjusted R
Square
Std. Error of the
Estimate
1 .065a 0.004 -0.028 20.33377
a. Predictors: (Constant), ROE
Pre-Merger ANOVAa
Model Sum of Squares df Mean Square F
1
Regression 54.79 1 54.79 0.133
Residual 12817.331 31 413.462
Total 12872.121 32

35
a. Dependent Variable: Financial Performance
b. Predictors: (Constant), ROE
Coefficient
Model
Unstandardized
Coefficients
Standardized
Coefficients t Sig.
B Beta
1 (Constant) 7.661 1.376 0.179
ROE -0.092 -0.065 -0.364 0.718
Regression results of post-merger ANOVA indicated a significance of F (2, 24) = 4.69, p
= 0.041. An R2 of 0.176 indicated that 17.6 % of the variations in performance were
explained by return on equity after the merger or acquisition event. The overall model is
shown below on table 4.16. A coefficient of - 0.065 signified a negative correlation,
meaning that an increase in performance resulted to a decrease on return on equity.
Table 4.16 Post-Merger ANOVA results of ROE
Model Summary
Model R R Square
Adjusted R
Square
Std. Error of the
Estimate
1 .419a .176 .138 4.06562
a. Predictors: (Constant), ROE
ROE Post-Merger ANOVAa
Model Sum of Squares df Mean Square F Sig.
1 Regression 77.524 1 77.524 4.690 .041b
Residual 363.644 22 16.529
Total 441.169 23
a. Dependent Variable: Performance
b. Predictors: (Constant), ROE

36
Coefficient
Model
Unstandardized
Coefficients
Standardized
Coefficients t Sig.
B Std. Error Beta
1 (Constant) 2.372 .896 2.647 .015
ROE .076 .035 .419 2.166 .041
a. Dependent Variable: Post-Merger
4.5. Effect of Financial Stability on Financial Performance of Merged
Commercial Banks in Kenya
Capital adequacy ratio before and after the merger period was used to measure financial
stability of banks under the study.
4.5.1. Descriptive statistics on Capital Adequacy Ratio
Table 4.17 Descriptive Statistics of Capital Adequacy Ratio
Mean (M) Std. Deviation
(SD)
Variance
(V)
Skewness
(S)
Statistic Std. Error Statistic Statistic Statistic
Pre - Merger 23.2258 3.49101 20.05432 402.176 2.726
Post - Merger 26.1963 4.64439 22.75275 517.688 3.101
Source: Data findings
Findings illustrated on table 4.17 show that there was a rise in the mean values for the
capital adequacy ratio from 23.2258 to 26.1963 after merger. The standard deviation also
rose from 20.05432 to 22.75275 after the merger. The variance also rose from 402.176
before merger to 517.688 after merger.
4.5.2. Correlation analysis results of Capital Adequacy Ratio on financial
performance
Results of the correlation analysis between performance and capital adequacy ratio are
illustrated in table 4.18. The results showed that there was a significant negative
correlation between capital adequacy ratio and performance, r (24) =-0.178, p<0.01).

37
Table 4.18 Correlation results of CAR
CAR Performance
CAR Pearson Correlation 1 -.178
Sig. (2-tailed)
.405
N 24 24
Performance Pearson Correlation -.178 1
Sig. (2-tailed) .405
N 24 24
**. Correlation is significant at the 0.01 level (2-tailed).
4.5.3. Regression analysis on the effect of CAR on financial performance
Table 4.19 Pre-Merger ANOVA results of CAR
Model Summary
Model R R Square Adjusted R
Square
Std. Error of the
Estimate
1 .085a 0.007 -0.025 20.3043
a. Predictors: (Constant), CAR
Pre-Merger ANOVAa
Model Sum of Squares df Mean Square F
1
Regression 91.917 1 91.917 0.233
Residual 12780.205 31 412.265
Total 12872.121 32
a. Dependent Variable: Financial Performance
b.Predictors: (Constant), CAR
Coefficients
Model
Unstandardized
Coefficients
Standardized
Coefficients t Sig.
B Beta
1 (Constant) 8.06 1.477 0.15
CAR -0.085 -0.085 -0.472 0.64
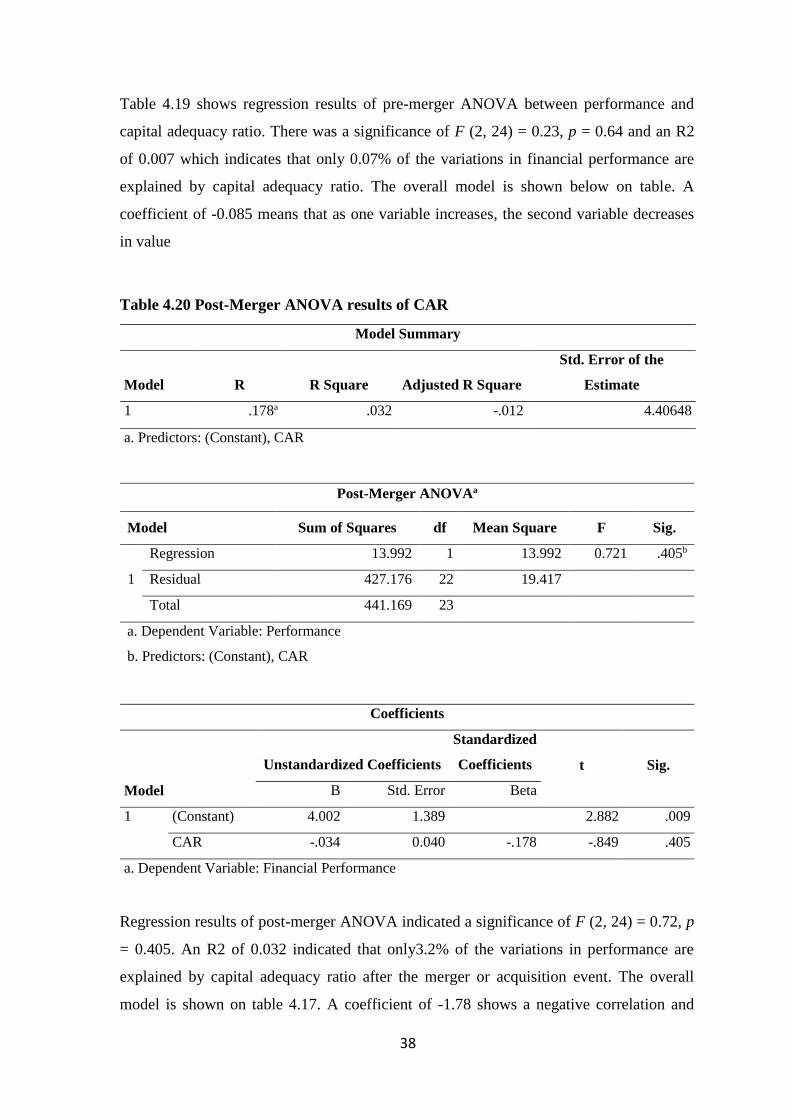
38
Table 4.19 shows regression results of pre-merger ANOVA between performance and
capital adequacy ratio. There was a significance of F (2, 24) = 0.23, p = 0.64 and an R2
of 0.007 which indicates that only 0.07% of the variations in financial performance are
explained by capital adequacy ratio. The overall model is shown below on table. A
coefficient of -0.085 means that as one variable increases, the second variable decreases
in value
Table 4.20 Post-Merger ANOVA results of CAR
Model Summary
Model R R Square Adjusted R Square
Std. Error of the
Estimate
1 .178a .032 -.012 4.40648
a. Predictors: (Constant), CAR
Post-Merger ANOVAa
Model Sum of Squares df Mean Square F Sig.
1
Regression 13.992 1 13.992 0.721 .405b
Residual 427.176 22 19.417
Total 441.169 23
a. Dependent Variable: Performance
b. Predictors: (Constant), CAR
Coefficients
Model
Unstandardized Coefficients
Standardized
Coefficients t Sig.
B Std. Error Beta
1 (Constant) 4.002 1.389 2.882 .009
CAR -.034 0.040 -.178 -.849 .405
a. Dependent Variable: Financial Performance
Regression results of post-merger ANOVA indicated a significance of F (2, 24) = 0.72, p
= 0.405. An R2 of 0.032 indicated that only3.2% of the variations in performance are
explained by capital adequacy ratio after the merger or acquisition event. The overall
model is shown on table 4.17. A coefficient of -1.78 shows a negative correlation and

39
implies that when there is an increase in performance then there is a decrease in capital
adequacy ratio
4.6. Chapter Summary
Return on assets in this study was used to measure asset management of commercial
banks in Kenya. The results revealed a positive relationship between return on assets and
performance r (24) =.536, p < 0.01. Regression results indicated that ROA explained
0.1% of the variance (R2=.01, F (2, 24) = 0.02, p< 0.01). This indicated that return on
assets as a determinant of performance of Kenyan commercial banks positively
influenced mergers and acquisitions. The more the mergers or acquisition institutions
acquire assets, the better they perform.
Return on equity was used to measure the effects of mergers and acquisitions on
shareholder’s value of commercial banks in Kenya. The findingsrevealed a positive
relationship between return on equity and performance, r (24) = .041, p<0.05. Results of
the regression indicated that ROE is explained by 0.04% of the variance (R2 = .004, F (2,
24) = 0.133, p<.05). This implied that institutions that had either merged or undergone
acquisition with higher shareholder’s value also had a higher financial performance and
hence a higher market share.
Capital adequacy ratio was used to measure the effect of mergers and acquisitions on
financial stability of commercial banks in Kenya. There were inconsistent results
regarding this variable. Findings showed a significant negative correlation of r (24) =-
0.178, p<0.01). Regression results indicated that CAR was explained by only 0.07% of
the variance (R2=.007, F (2, 24) = 0.23, p<0.01). This means that the higher the capital
adequacy ratio the institution has the lower the lower the financial performance of the
institution.

40
CHAPTER 5
5.0. DISCUSSION, CONCLUSIONS AND RECOMMENDATIONS
5.1. Introduction
This chapter presents the summary of the study, discussion of the results and makes
conclusions from the findings. Recommendations for improvement and further studies
have also been discussed.
5.2. Summary
The general objective of this study was to determine the effects of mergers and
acquisitions on the financial performance of commercial banks in Kenya. The study was
guided by the following specific objectives: to determine the effect of shareholder’s value
on financial performance of merged commercial banks in Kenya, to determine the effect
of asset management on financial performance of merged commercial banks in Kenya
and to investigate effect of financial stability on financial performance of merged
commercial banks in Kenya. The study adopted a descriptive research design which
focused on determining the relationship between mergers and acquisitions and the
financial performance of the commercial banks between 2008 and 2016.The population of
the study consisted of financial institutions in Kenya that had either merged or undergone
acquisitions from 2000 to 2016 as approved by the Central Bank of Kenya. The sample
was selected using the purposive method which involved studying ten commercial banks
that had merged between the years 2008 to 2016. Secondary data, three years before and
three years after the event was retrieved from audited financial statements, annual reports
published by Central Bank of Kenya and the respective bank websites. An analysis of the
data was performed through use of the Statistical Package for Social Sciences (SPSS)
version 21 software. Descriptive, correlation and regression analysis methods were used
to establish the effect of the mergers and acquisitions on financial performance of
commercial banks in Kenya.
Return on Assets in this study was used to measure asset management of commercial
banks in Kenya. The results revealed a positive relationship between return on assets and
performance r (24) =.536, p < 0.01. This meant that return on assets as a determinant of
performance of Kenyan commercial banks positively influenced mergers and
acquisitions. The more the mergers or acquisition institutions acquire assets, the better
they perform. Return on Equity was used to measure the effects of mergers and

41
acquisitions on shareholder’s equity of commercial banks in Kenya. The findings also
revealed a positive relationship between return on equity and performance, r (24) = .041,
p<0.05. This implied that institutions that had either merged or undergone acquisition
with higher shareholder’s value also had a higher financial performance and hence, a
higher market share. Capital Adequacy Ratio was used to measure the effect of mergers
and acquisitions on financial stability of commercial banks in Kenya. There were
inconsistent results regarding this variable. Findings showed a significant negative
correlation of r (24) =-0.178, p<0.01. Meaning that the higher the capital adequacy ratio
the institution has, the lower the lower the financial performance of the institution.
5.3. Discussion
5.3.1. Effect of Asset Management on Financial Performance of Merged
Commercial Banks in Kenya
Five out of the ten banks under study had a decrease in return on assets after the merger
or acquisition event. The banks included CFC Stanbic Bank, Equatorial Commercial
Bank, K-Rep Bank, Fina Bank and Ecobank. This could be an indication of failure by
management to use its resources efficiently of the sampled banks. Descriptive results also
indicated a slight rise in the mean values for return on assets from 1.3188 before merger
to 1.3758 after merger. This signified that the companies were able to earn higher profits
in relation to their overall resources after the merger or acquisition. Akenga and Olang
(2017) presented a similar study on the effects of asset growth on financial performance
of commercial banks. They tested the hypothesis that asset growth had no significant
effect on financial performance using a t-test analysis. Asset growth was measured using
change in value of assets which resulted to a significant value of 0.002 which was below
the 0.05 significance level. The results led to the rejection of the null hypothesis that asset
growth had no significant effect on financial performance of commercial banks
Results of the correlation analysis illustrated a positive significant relationship between
return on assets and performance (r (24) =.536, p < 0.01). This meant that an increase in
return from assets led to an increase in market share and consequently an increase on
financial performance. Regression results of post-merger ANOVA (R2=.28, F (2, 24) =
8.48, p<0.01) indicated a P value of 0.007 which was less than the significant level of
0.05. A coefficient is said to be statistically significant only when its p-value is smaller
than0.05. An R2 of 0.287 indicated that28.7 % of the variations in performance were

42
explained by return on assets after the merger or acquisition event. This value can be seen
to be higher than that of ROE in relation to performance of this study. The coefficient of
ROA though not statistical significant shows that as financial performance increases, the
return on assets also increases.
Mugambi (2014) also conducted a similar study on the effect of mergers and acquisition
on financial performance of commercial banks in Kenya. His study also found an
increase in the mean return on assets after merger. This depicts that the post-merger
period had higher performance than pre-merger period. Ndung’u (2010) also had similar
results on the same study. His study resulted in an increase in the return on equity which
was found to be statistically significant with a value of 0.000 which was less than P value
of 0.05. From the findings on the t-test for the data on return on assets before and after
merger, it was found that there was an increase in t value which indicated an increase in
the return on assets as well.
5.3.2. Effect of Shareholder’s Equity on Financial Performance of Merged
Commercial Banks in Kenya
The findings indicated that the banks under study achieved a higher mean return on
shareholder’s equity after the event except for Equatorial Commercial Bank and K-Rep
Bank. Descriptive results however indicated that there was a fall in the mean values for
the return on equity from 17.0548 before the merger to 9.6146 after merger owing to the
two banks whereby, one recorded a negative result, while the other had a decrease in the
mean value after the merger. Similar studies have resulted into contradicting results for
example Mugambi (2014) whose findings indicated an increase in mean return on equity
after merger or acquisition depicted by an increase in the mean from 2.079 on pre-merger
period to 3.965 on the post-merger period. The P value for ROE after the merger was
0.041, which was lower than the significant level of 0.05providing evidence that, the
merger or acquisition was significant on the financial performance of commercial banks.
The direction of the relationship was positive which signified that an increase in return on
equity resulted to an increase on market share. Regression results of post-merger
ANOVA indicated that regression between financial performance and return on equity
was statistically significant with a P value of 0.41 being less than 0.05. An R2 of 0.004
indicated that only 0.4% of the variations in performance were explained by return on

43
equity. Mailany (2014) carried out a similar study to establish the effect of mergers and
acquisition on the financial performance of oil companies in Kenya. The study findings
indicated that return on equity (ROE) mean decreased after the merger/acquisition. The
study findings also observed that; the merger or acquisition processes in the oil industry
in Kenya had affected the capital structure of the new companies by having additional
shareholding which led to an increase in share equity of the merged/acquired firm thus
reducing the return on equity. Regression results indicated that the null hypothesis was
rejected since the calculated p value (0.007) was less than the critical P value of 0.05.
Akenga and Olang (2017) conducted a similar study where they tested the hypothesis that
shareholders value had no significant effect on financial performance using a t-test. The
study had a significant value of 0.04 which was below the 5% significance level.
5.3.3. Effect of Financial Stability on Financial Performance of Merged
Commercial banks in Kenya.
CFC Bank, Jamii Bora Bank and Equatorial Bank all recorded a decrease in their capital
adequacy ratios after the merger or acquisition. Descriptive statistics show a rise in the
capital adequacy ratio from 23.2258 to 26.1963 after merger or acquisition. Generally, a
bank with a high capital adequacy ratio is safe and likely to meet its financial obligations.
Ndung’u (2010) also found similar results on a similar study regarding mergers. His
results revealed a statically significant relationship with an increase in the t value for
capital adequacy ratio from 19.064 to 21.764. This was an indication that there was
notable increase in financial leverage of the companies under study.
Correlation results between performance and capital adequacy ratio illustrated a
significant negative relationship with a P value of -0.178. According to this study, this
signified that a higher capital adequacy ratio would result to a lower financial
performance of the institution. Regression results of post-merger ANOVA indicated a
significance of 0.405. An R2 of 0.032 indicated that only 3.2 % of the variations in
performance explained capital adequacy ratio after the merger or acquisition event.
Marembo (2012) also confirmed mixed reactions from a similar study that analyzed the
effect of mergers and acquisitions on the capital adequacy ratio. The results indicated that
some banks posted an increase in the capital adequacy ratio while others posted a
decrease in the capital adequacy ratio for five years after the merger. An increase in the
capital adequacy ratio confirmed that the banks were able to meet their liabilities and

44
other obligations when they were due, while a decrease in the capital adequacy ratio
confirmed that the respective banks were not able meet their liabilities and other
obligations when they were due.
5.4. Conclusion
5.4.1. Effect of Asset Management on Financial Performance of Merged
Commercial Banks in Kenya
Regression results on return on assets had the highest variation explaining performance at
28.7 % after the merger event. Despite this, the banks under study had mixed results some
recording an increase while others recording a decrease in return on assets after the
merger or acquisition. Correlation results showed that there was a positive significant
relationship between return on equity and performanceof institutions that had either
merged or undergone through acquisitions.
5.4.2. Effect of Shareholder’s Equity on Financial Performance of Merged
Commercial Banks in Kenya
The findings on regression results showed that most of the sampled banks had an increase
in return on equity after the merger or acquisition with a variation of only 0.4%
explaining performance. Correlation results showed a significant relationship between
financial performance and return on equity of institutions that had either merged or
undergone through acquisitions.
5.4.3. Effect of Financial Stability on Financial Performance of Merged
Commercial Banks in Kenya.
Descriptive results indicated that some banks posted an increase in the capital adequacy
ratio while others posted a decrease in the capital adequacy ratio. Regression results
indicated that only 3.2 % of the variations in performance explained capital adequacy
ratio after the merger or acquisition event in the study. Correlation results showed no
significant relationship between financial stability and financial performance of merged
institutions.

45
5.5. Recommendations
5.5.1. Recommendations for improvement
5.5.1.1. Effect of Asset Management on Financial Performance of Merged
Commercial Banks in Kenya
A low return on assets signifies that a company is not making adequate profits or is
overinvested in assets that are not profitable. Management can work on reducing the
bank’s operational cost by downsizing facilities and by relocating to affordable premises.
They can also sell off fixed assets that are not being used.
5.5.1.2. Effect of Shareholder’s Equity on Financial Performance of Merged
Commercial Banks in Kenya
Management should strive to efficiently utilize the shareholders’ funds at their disposal.
This will encourage the shareholder to invest more in the banks. The banks can increase
return on equity by increasing the amount of debt capital relative to its equity capital,
increase the overall bank’s profit relative to its equity and reduce the excess cash on the
balance sheet by paying out dividends it to its shareholders.
5.5.1.3. Effect of Financial Stability on Financial Performance of Merged
Commercial Banks in Kenya.
An increase in the capital adequacy ratio confirms that a bank can meet its liabilities and
other obligations as and when they are due and be able to absorb more losses in case of
default loans bycustomers. To raise the capital adequacy ratio, banks can consider
reducing the share of its profit by paying out in dividends, by issuing new equity such as
through a rights issue to existing shareholders and finally by replacing riskier or more
expensive loans with safer ones or government securities.
5.5.2. Recommendations for Further Studies
Further studies should be carried out on the effect of mergers and acquisitions on
financial performance from time to time to establish trends for longer periods and to
capture new opportunities that have recently emerged in Kenya. Since the study can use
various variables to measure performance, both quantitative and qualitative variables
should be included in the studies to come up with more comprehensive conclusions.

46
REFERENCES
Aburime, U. (2005) Determinants of Bank Profitability: Company-Level Evidence from
Nigeria.University of Nigeria, Enugu Campus.
Adegbaju, A. A., & Olokoyo, F. O. (2008). Recapitalization and banks’ performance: A
case study of Nigerian banks. African Economic and Business Review.
Afza, T., & Nazir, M. S. (2008). Working capital approaches and firm’s returns. Pakistan
Journal of Commerce and Social Sciences.
Agoraki, M. E., Delis, M., & Pasiouras, F. (2011).Regulations, competition and bank
risk-taking in transition countries. Retrieved on retrieved on 17.03.2017
http://mpra.ub.uni-muenchen.de/16495/
Akenga, Grace Melissa and Olang’, Margaret Akinyi, (2017).Effect of Mergers and
Acquisitions on Financial Performance of Commercial Banks in Kenya.Journal of
Business and Management (IOSR-JBM) Volume 19, Issue 8. Ver. III.
Al-Tamimi, H., Hassan, A. (2010) Factors Influencing Performance of the UAE Islamic
and Conventional National Banks. Department of Accounting, Finance and
Economics, College of Business Administration, University of Sharjah.
Altman, E. I. (1968). Financial ratios, discriminant analysis and the prediction of
corporate bankruptcy.The Journal of Finance.
Andrews, L., Higgins, A., Andrews, M. W., &Lalor, J. G. (2012). Classic grounded
theory to analyze secondary data: Reality and reflections. The Grounded Theory
Review
Ang, Andrew (2014). Asset Management: A Systematic Approach to Factor Investing
Financial Management Association Survey and Synthesis. Oxford University
Press
Angelini, P., Neri, S., & Panetta, F. (2014). The interaction between capital requirements
and monetary policy.Journal of Money, Credit and Banking.
Ansoff, I.H. (1965). Corporate Strategy. New York: McGraw-Hill.
Ansong, A. (2015). Board Size, Intensity of Board Activity, and Financial Performance
of SMEs: Examining the Mediating Roles of Access to Capital and Firm
Reputation.
Armstrong, M. & Baron, A. (2005) Managing performance: performance management in
action. London, UK: CIPD
47
Athanasoglou, P.P., Sophocles, N.B., Matthaios, D.D. (2005) Bank-specific, industry-
specific and macroeconomic determinants of bank profitability.Working paper,
Bank of Greece.
Avery, R. B., & Berger, A. N. (1991). Risk-based capital and deposit insurance
reform. Journal of Banking & Finance.
Ayadi, R., & Pujas, G. (2005).Banking mergers and acquisitions in the EU: Overview,
assessment and prospects, chapters in SUERF studies. The European Money and
Finance Forum; Vienna
Badík, M. (2007).Motives and reasons of the bank mergers in the EU. In 11th
International Conference on Finance and Banking: Future of the European
Monetary Integration.
Bambale, A. J. A. (2016). Mediating Effect of Liquidity on Firm Performance and
Dividend Payout of Listed Manufacturing Companies in Nigeria.Journal of
Economic Development, Management, IT, Finance, and Marketing.
Baxter, N. D. (1967). Leverage, risk of ruin and the cost of capital.The Journal of
Finance.
Benes, J., & Kumhof, M. M. (2011). Risky bank lending and optimal capital adequacy
regulation (No. 11-130).International Monetary Fund.
Barclay, M. J., & Holderness, C. G. (1989).Private benefits from control of public
corporations.Journal of financial Economics.
Berger, A.N.& Humphrey, D.B. (1994).Bank Scale Economies, Mergers, Concentration,
and Efficiency: The U.S. Experience, Research paper. Financial Institutions
Center, Wharton School, University of Pennsylvania.
Berger, A. N., & Udell, G. F. (2006).A more complete conceptual framework for SME
finance. Journal of Banking & Finance.
Bild, M. &Guest, P. (2002). “Do Takeovers Create Value? A Residual Income Approach
on U.K Data, ESRC Centre for Business Research, University of Cambridge
Working Paper No. 252
Bobáková, I. V. (2003). Raising the profitability of commercial banks. Biatec.
Bourke, P. (1989). Concentration and other determinants of bank profitability in Europe,
North America and Australia. Journal of Banking & Finance.
Bradley, M., A. Desai, and E. H. Kim, (1988).Synergistic gains from corporate
acquisitions and their division between the stockholders of target and acquiring
firms, Journal of Financial Economics 21, 3-40.
48
Brigham, E. F. (2014). Financial management theory and practice.Atlantic Publishers
&District.
Bryman, A., & Bell, E. (2015).Business research methods. Oxford University Press,
USA.
Buono, A. F., & Bowditch, J. L. (2003). The human side of mergers and acquisitions:
Managing collisions between people, cultures, and organizations. Beard Books.
Busha, C. H., & Harter, S. P. (1980).Research methods in librarianship.Academic press.
Cartwright, S., & Schoenberg, R. (2006).30 years of mergers and acquisitions research:
Recent advances and future opportunities. British journal of management.
Cabric, M. (2015). Corporate Security Management: Challenges, Risks, and
Strategies.Butterworth-Heinemann.
Calem, P. S., & Rob, R. (1996). The impact of capital-based regulation on bank risk-
taking: a dynamic model. Division of Research and Statistics, Division of
Monetary Affairs, Federal Reserve Board.
Cameron, E., & Green, M. (2015).Making sense of change management: A complete
guide to the models, tools and techniques of organizational change.Kogan Page
Publishers.
Capon, N., Farley, J. U., &Hoenig, S. (1990). Determinants of financial performance: a
meta-analysis. Management science
Cassim, M. F. (2008). The introduction of the statutory merger in South African
corporate law: majority rule offset by the appraisal right (part 1). South Africa
Mercantile Law Journal
Chakraborty, I. (2010). Capital structure in an emerging stock market: The case of India.
Research in international business and finance.
Creswell, J. W. (2009). Research design: Qualitative, quantitative, and mixed methods
approaches (3rd ed.). Thousand Oaks, CA: Sage.
Creswell, J. W., & Clark, V. L. P. (2007). Designing and conducting mixed methods
research.
Christensen, L. B., Johnson, B., Turner, L. A., & Christensen, L. B. (2011).Research
methods, design, and analysis.
Cytonn Investments Report (2015), The impact of high interest rates on the Kenyan
economy and Investments
Dang, Uyen (2011). The CAMEL Rating System in Banking Supervision: A Case Study
of Arcada University of Applied Sciences, International Business.

49
Denis, D. (2016). Corporate Governance and the Goal of the Firm: In Defense of
Shareholder Wealth Maximization. Financial Review, 51(4), 467-480.
DePamphilis, Donald, (2014). Mergers, Acquisitions, and other Restructuring Activities.
Seventh Edition, Academic Press.
Dessí, R., & Robertson, D. (2003). Debt, incentives and performance: Evidence from UK
panel data. The Economic Journal.
Diz, H. (2014). Public-Private Partnership-a Contribution Paper.Interdisciplinary Studies
Journal.
Drauz, R. (2013), In search of a Chinese internationalization theory: A study of 12
automobile manufacturers, Chinese Management Studies, vol. 7 no. 2, pp. 281-
309.
Drost, E. A. (2011).Validity and reliability in social science research.Education
Research and Perspectives.
El-Sayed Ebaid, I. (2009). The impact of capital-structure choice on firm performance:
empirical evidence from Egypt. The Journal of Risk Finance.
Eisenbeis, R. A., & Kwan, S. (2005). Bank Risk, Capitalization and Inefficiency. Paper
Retrieved on September 10, 2017.
Flammer, C. (2015). Does corporate social responsibility lead to superior financial
performance? A regression discontinuity approach. Management Science,
Fernandez, P. (2015). Shareholder Value Creation: A Definition.
Frei, F. &Harker, P. (2012). Measuring the Efficiency of Service Delivery Processes:
With Applications to Retail Banking. Working Paper No. 96-31.Wharton
Financial Institutions.
Galai, D., &Masulis, R. W. (1976).The option pricing model and the risk factor of
stock.Journal of Financial economics.
Galpin, T. J., & Herndon, M. (2014). The complete guide to mergers and acquisitions:
Process tools to support M&A integration at every level. John Wiley & Sons.
Gathuku, G. M., & Njeru, A. (2005).Effect of Mergers on Financial Performance of
Commercial Banks in Kenya. International Journal of Science and Research
(IISSN (Online): 2319-7064
Geppert, M., Dörrenbächer, C., Gammelgaard, J. and Taplin, I. (2013), “Managerial risk-
taking in international acquisitions in the brewery industry: institutional and
ownership influences compared”, British Journal of Management, vol. 24 no. 3,
pp. 316-32.

50
Ghosh, A. (2004). Increasing market share as a rationale for corporate acquisitions.
Journal of Business Finance & Accounting, 31(1‐2), 209-247.
Giandomenico, R. (2012). Asset Liability Management for Banks.
Gul, S., Faiza, I., Khalid, Z. (2011) Factors Affecting Bank Profitability in Pakistan. The
Romanian Economic Journal, 2(3), 6-9.
Hamada, R. S. (1969). Portfolio analysis, market equilibrium and corporation finance.
The Journal of Finance.
Halpern, P. (1983). Corporate acquisitions: A theory of special cases? A review of event
studies applied to acquisitions. The Journal of Finance, 38(2), 297-317.
Heminway, J. M. (2017). Shareholder Wealth Maximization as a Function of Statutes,
Decisional Law, and Organic Documents [article]. Washington And Lee Law
Review, (2), 939
Hietala, P., Kaplan, S. N., & Robinson, D. T. (2003). What is the price of hubris.Using
takeover battles to infer overpayments.
Hofstede G., Hofstede G.J., Minkov M., (2010). Cultures and Organizations: Software of
the Mind. Intercultural Cooperation and Its Importance for Survival, New York,
NY: McGraw-Hill
Hubbard, G. and D. Palia (1999).A reexamination of the conglomerate merge wave in the
1960s: An internal capital market view,” Journal of Finance 54, 1131-1152.
Ilhomovich, S.E. (2009) Factors affecting the performance of foreign banks in Malaysia.
A thesis submitted to the fulfillment of the requirements for the degree Master of
Science (Banking) College of Business (Finance and Banking).
Ikpefan, O. A. (2013). Capital adequacy ratios, management and performance in the
Nigerian commercial bank (1986-2006). African Journal of Business
Management
Janoudi, S. (2014). Banking Efficiency and Stock Performance in the EU Markets: The
Impact of the World Financial Crisis. Retrieved on 18.03.2017 from
http://ssrn.com/
Jensen, M. (1978).Some anomalous evidence regarding market efficiency.
Jensen, M. C., & Ruback, R. S. (1983). The market for corporate control: The scientific
evidence. Journal of Financial Economics.
JoashGwayaOndieki, NjangiruMungai John (2015).The Effect of Mergers and
Acquisitions on Financial Performance of Banks (A survey of Commercial Banks
in Kenya).International Journal of Innovative Research and Development.ISSN.

51
Keeley, M.C. & Furlong F.T. (1990).A reexamination of mean-variance analysis of bank
capital regulation, Journal of Banking and Finance 14 (March), 69-84.
Kemal, M.U., (2011). Post-merger Profitability. A case of Royal Bank of Scotland (RBS),
International Journal of Business and Social Science, vol 2.
Kenya, B. I., & Konya, L. N. (2015). Globalization and Strategic Alliances among
Commercial, published MBA project University of Nairobi
Khrawish, H.A. (2011) Determinants of Commercial Banks Performance: Evidence from
Jordan. International Research Journal of Finance and Economics.Zarqa
University, 5(5), 19-45
Kilelo I. E., (2013), Mergers and Acquisition Strategy in the Banking Industry,
Unpublished MBA project, University of Nairobi
King, R. S., & Baker, M. E. (2010).Considerations for analyzing ecological community
thresholds in response to anthropogenic environmental gradients. Journal of the
North American Benthological Society.
Kioko S. (2013), Mergers and Acquisition as an entry strategy by CFC Stanbic Bank in
the Kenyan Market, Unpublished MBA project, University of Nairobi
Knupfer, N. N., & McLellan, H. (2001). 41. Descriptive Research Methodologies
Kombo, D.K., & Tromp, D.L.A. (2011). Proposal and Thesis Writing: An Introduction.
Pauline’s Publications Africa, Don Bosco Printing Press, Nairobi Kenya
Kothari, C. R. (2004). Research methodology: Methods and techniques.New Age
International.
Kraft, K. (2016).Mergers and Acquisitions.Types and Motivations for a Deal.
Kraus, A., & Litzenberger, R. H. (1973).A state‐preference model of optimal financial
leverage.The journal of finance.
KPMG (2001). World Class Transactions– insights into creating shareholder value
through mergers and acquisitions. London: KPMG.
Lee, T., &Chih, S. (2013). Does financial regulation affect the profit efficiency and risk
of banks? Evidence from China’s commercial banks.North American Journal of
Economics and Finance.
Li, T. (2016, January).A study on the impact of mergers & acquisitions on shareholders'
wealth and efficiency.InSHS Web of Conferences (Vol. 25).EDP Sciences.
Mailany, Paul Mwiti (2014).Effect of Merger and Acquisition on the Performance of Oil
Companies in Kenya. University of Nairobi, Kenya.

52
Makau, N. F., & Memba, F. Influence of Asset Liability Management on Financial
Performance of Commercial Banks in Kenya: A Case Study of Diamond Trust
Bank.
Maquieira, C. P., Megginson, W. L., & Nail, L. (1998). Wealth creation versus wealth
redistributions in pure stock-for-stock mergers. Journal of Financial Economics,
48(1), 3-33.
Marembo, J. (2012). The Impact of Mergers and Acquisitions on the financial
performance of Commercial Banks in Kenya.Unpublished MBA thesis.University
of Nairobi.
Maslow, A.H. (1964). Synergy in the society and in the individual, Journal of Individual
Psychology, 20(2): 153–164.
Mbae, A. M. (2014). The effect of mergers and acquisitions on the financial performance
of commercial banks in Kenya (Doctoral dissertation, University of Nairobi).
Mbwaya, E. L. (2012). Strategic management practices at Barclays Bank of Kenya
(Unpublished MBA project). University of Nairobi.
Mender, J. (2014). The case against the global economy: and for a turn towards
localization. Routledge.
Migitha, D. (2016). Corporate governance and financial management practices in public
benefit Organizations in Kisumu county, Kenya. Doctoral dissertation, University
of Nairobi.
Miles, D., J. Yang, and G. Marcheggiano (2013).Optimal bank capital. Economic
Journal, vol. 123, pp. 1-37
Miller, M. H. (1977). Debt and taxes.The Journal of Finance.
Mitchell, M. L., & Lehn, K. (1990). Do bad bidders become good targets? Journal of
Political Economy.
Moctar, N. B., & Xiaofang, C. H. E. N. (2014). The Impact of Mergers and Acquisition
on the financial performance of West African Banks: A case study of some
selected commercial banks. International Journal of Education and
Research, 2(1).
Modigliani, F., & Miller, M. H. (1963). Corporate income taxes and the cost of capital: a
correction. The American economic review.
Moeller, S. B., Schlingemann, F. P., &Stulz, R. M. (2004).Firm size and the gains from
acquisitions. Journal of Financial Economics, 73(2), 201–228.

53
Morgan, J. P. (2017) 2017 M&A Global Outlook.Finding opportunities in a dynamic
market, J.P. Morgan Global Outlook.
Moynihan, D. P., & Pandey, S. K. (2010). The big question for performance
management: Why do managers use performance information?Journal of public
administration research and theory.
Mugambi, M. A (2014).The Effect of Mergers and Acquisitions on the financial
performance of Commercial Banks in Kenya. Nairobi University
Mugenda, Olive, & Mugenda Abel (2013). Research methods: Quantitative and
Qualitative approaches.
Myers, S. C. (1984). The capital structure puzzle.The journal of finance.
Naceur, S. B. (2003). The determinants of the Tunisian banking industry profitability:
Panel evidence. UniversiteLibre de Tunis working papers, 1-17.
Naceur, S. B., & Goaied, M. (2001). The determinants of the Tunisian deposit banks'
performance. Applied Financial Economics.
Nazir, M. S., & Afza, T. (2009).Impact of aggressive working capital management policy
on firms' profitability.IUP Journal of Applied Finance.
Ndung’u Boniface Muita (2010) Effect of Mergers and Acquisitions on the financial
performance of Commercial Banks in Kenya. Nairobi University
Oladipupo A.O. & Okafor C.O. (2011).Control of shareholders’ wealth maximization in
Nigeria, The Journal of Business Systems, Governance and Ethics.Ebschost
Business Source Premier database.
Onjala, V. N. (2012). Determinants of Financial Performance of Commercial Banks in
Kenya (Doctoral dissertation, University of Nairobi).
Ongeri Benedicto (2013). The Role of Kenya's Listed Commercial Banks in Economic
Growth - An Econometric Analysis. University of Nairobi
Ongore, V. O., &Kusa, G. B. (2013).Determinants of financial performance of
commercial banks in Kenya.International Journal of Economics and Financial
Issues.
Porter, M.E. (1987). From competitive advantage to corporate strategy, Harvard Business
Review, 65(3): 43–59.
Piety, (1998).Bank Acquisitions.Operational Guidelines for the Development and Early
Stages of Credit Union. Operations Journal

54
Rani, N., Yadav, S. S., & Jain, P. K. (2011). Impact of mergers and acquisitions on
shareholders’ wealth in short-run: an empirical study of Indian pharmaceutical
industry.
Reda, M. (2013). The effect of mergers and acquisitions on bank efficiency: evidence
from bank Consolidation in Egypt. Working paper 770
Reddy, K.S., Nangia, V.K. and Agrawal, R. (2014), Farmers Fox theory: Does a
country’s weak regulatory system benefit both the acquirer and the target firm?
Evidence from Vodafone-Hutchison deal, International Strategic Management
Review, vol. 2 no. 1
Roden, D. M., & Lewellen, W. G. (1995). Corporate capital structure decisions: evidence
from leveraged buyouts. Financial Management Journal.
Rothschild, M., & Stiglitz, J. (1978). Equilibrium in competitive insurance markets: An
essay on the economics of imperfect information. In Uncertainty in economics.
Rosinski P., (2011).Global Coaching for Organizational Development.International
Journal of Coaching in Organizations.
Richard J., Pierre &Devaney, Timothy & Yip, George & Johnson, Gerry, (2008).
Measuring Organizational Performance as a Dependent Variable: Towards
Methodological Best Practice. SSRN Electronic Journal.
Said, R.M., Mohd, H.T. (2011) Performance and Financial Ratios of Commercial Banks
in Malaysia and China.
Salim, B. (2011). A study on strategic initiatives and actions taken during a banking
merger.International Journal of Emerging Sciences,246-259.
Sangmi, M., Tabassum, N. (2010).Analyzing Financial Performance of Commercial
Banks in India: Application of CAMEL Model.Pakistan Journal Commercial
Social Sciences.
Sauders, M., Lewis, P., &Thornhill, A. (2016).Research methods for business students
7thEdition. New Jersey.
Seth, A., (1990). Value creation acquisitions: A re-examination of performance issues.
Strategic Management Journal, 99-115.
Shah, P., & Arora, P. (2014). M&A announcements and their effect on return to
shareholders: An event study. Accounting and Finance Research, 3(2), 170.
Sharma, H. (2011). Bankers' perspectives on e-banking.Global Journal of Research in
Management.

55
Shaver, J. M. (2006). A paradox of synergy: Contagion and capacity effects in mergers
and acquisitions. Academy of Management Review.
Sherraden, M. S., & Ansong, D. (2016). Financial literacy to financial capability:
Building financial stability and security. In International Handbook of Financial
Literacy.Springer, Singapore.
Sirower, M.L and Sahni, S. (2006). Avoiding the “synergy trap”: practical guidance on
M&A decisions for CEOs and boards, Journal of Applied Corporate Finance,
18(3): 83–95.
Smith, E. (2008). Using Secondary Data in Educational and Social Research. New
York, NY: McGraw-Hill Education.
Soludo, C. C. (2004, July). Consolidating the Nigerian banking industry to meet the
development challenges of the 21st century.In Being an address delivered to the
Special Meeting of the Bankers Committee, held on July (Vol. 6).
Sonenshine R., Reynolds K., (2014). Determinants of Cross-Border Merger Premia. Rev
World Econ, 150, 173−189
Stout, L. A. (2012). The shareholder value myth: how putting shareholders first harms
investors, corporations, and the public. Retrieved on 20/04/2017
https://ebookcentral.proquest.com
Suzuki, Y. (2011). How Does Ownership Affect Bank Performance?The Case of Indian
Commercial Banks. International Business & Economics Research Journal.
The Economic Times. Shareholder Value. Retrieved on
09.04.2017http://economictimes.indiatimes.com/definition/shareholder-value
Thompson, R. B. (1990). Piercing the corporate veil: an empirical study. Cornell L. Rev
Turner III, D. W. (2010). Qualitative interview design: A practical guide for novice
investigators. The qualitative report.
Uche, C. (1998). Accounting and control in Barclays Bank (DCO): the lending to
Africans episode. Accounting, Business & Financial History.
Uddin, S. S., & Suzuki, Y. (2011). Financial reform, ownership and performance in
banking industry: The case of Bangladesh. International Journal of Business and
Management.
Urio, H.N. (2014). The Impact of Mergers and Acquisitions on Bank Efficiency in
Europe. Unpublished PhD Thesis. Coventry: Coventry University.
Wang, C., & Xie, F. (2008). Corporate governance transfer and synergistic gains from
mergers and acquisitions. The Review of Financial Studies

56
Wagner III, J. A., & Hollenbeck, J. R. (2014). Organizational behavior: Securing
competitive advantage.Routledge.
Wen, W. (2010) Ownership Structure and Banking Performance: New Evidence in
China. UniversitatAutònoma de Barcelona DepartamentD’economia de
L’empresa.
Weston, J. F., & Weaver, S. C. (2001). Mergers and acquisitions. New York: McGraw-
Hill.
Wippern, R. F. (1966). Financial Structure and the Value of the Firm. The Journal of
Finance.
Zikmund, W. G., Babin, B. J., Carr, J. C., & Griffin, M. (2013). Business research
methods. Cengage Learning.

57
APPENDICES
APPENDIX I: Secondary Data Collection Template
Period Year Financial
Institution
ROA ROE CAR MSI
Year 1
Year 2
Year 3
Merger/Acquisition
Year 1
Year 2
Year 3
A. Effect of Asset Management on Financial Performance of Merged
Commercial Banks in Kenya checklist
Financial
Institution
ROA
Year 1 Year 2 Year 3 Merger Year 1 Year 2 Year 3
KCB
S&L ltd
Prime Bank
CFC Bank
Stanbic
Jamii bora
Equatorial
Southern Credit
Sidian
Guarantee Trust
Bank
Ecobank

58
B. Effect of Shareholder’s Equity on Financial Performance of Merged
Commercial Banks in Kenya checklist
Financial
Institution
ROE
Year 1 Year 2 Year 3 Merger Year 1 Year 2 Year 3
KCB
S&L ltd
Prime Bank
CFC Bank
Stanbic
Jamii bora
Equatorial
Southern Credit
Sidian
Guarantee Trust
Bank
Ecobank
C. Effect of Financial Stability on Financial Performance of Merged
Commercial Banks in Kenya checklist
Financial
Institution
CAR
Year 1 Year 2 Year 3 Merger Year 1 Year 2 Year 3
KCB
S&L ltd
Prime Bank
CFC Bank
Stanbic
Jamii bora
Equatorial
Southern Credit
Sidian
Guarantee Trust
Bank
Ecobank

59
APPENDIX II: List of Commercial Bank Mergers and acquisitions in Kenya from
2008 – 2016
Mergers
Institution Merged with Current Name Date approved
by CBK
Prime Capital & Credit
Ltd
Prime Bank Ltd Prime Bank Ltd 01.01.2008
CFC Bank Ltd Stanbic Bank Ltd CFC Stanbic Bank
Ltd
01.06.2008
Savings and Loan (K)
Limited
Kenya Commercial
Bank Limited
Kenya Commercial
Bank Limited
01.02.2010
City Finance Bank Ltd Jamii Bora Kenya
Ltd
Jamii Bora Bank Ltd 11.02.2010
Equatorial Commercial
Bank Ltd
Southern Credit
Banking
Corporation Ltd
Equatorial
Commercial Bank
Ltd
01.06.2010
Acquisitions
Institution Acquired by Current Name Date
approved by
CBK
EABS Bank Ltd Ecobank Kenya Ltd Ecobank Ltd 16.06.2008
Fina Bank Ltd Guaranty Trust
Bank Plc
Guaranty Trust Bank
(Kenya) Ltd
08.11.2013
K-Rep Bank Ltd Centum Ltd K-Rep Bank Ltd 29.10.2014
Equatorial
Commercial Bank
Ltd
Mwalimu Sacco
Society Ltd
Equatorial Commercial
Bank Ltd
31.12.2014
Giro Commercial
Bank Ltd
I&M Bank Ltd I&M Bank Ltd 13.02.2016
Source: Central Bank of Kenya