the effect of low temperatures on banana yields
TRANSCRIPT
Int. J . Biometeor. 1970, vol. 14, number 2, pp. 155-165
155
The Effect of Low Temperatures on Banana Yields by
J. Lomas* and Y. Shashoua
INTRODUCTION
The main eentres of banana production lie approximately between 30 ° latitudes north and south with a few exceptions: New South Wales, Taiwan and Israel (Sim- mon's, 1959}. The banana plant is susceptible to cold and frost, areas of cultiva- tion are generally outside the 15°C isotherms, while the optimum temperatures are 20 ° to 25°C. Growth is much reduced at temperatures below 15°C, and is
d r o o , totally impede fo t empera tu res below 5 to 6 C (Seible, 1939; Simmon s, 1959}. F ros t swiftly kil ls the plant and one night below f reez ing has ruined many p lan ta - tions in Is rae l .
Cold attacks three stages of development: the vegetative, f lowering and frui t ing. The final effect of cold on the yield is different for the three s tages. The following br ief d iscuss ion of the effect of cold on each stage of development is helpful in un- ders tanding the relat ionship between low tempera tures and banana yie lds .
THE VEGETATIVE STAGE
This phase is completed when the sucker obtains twenty to twenty-four leaves , that is at an age of about six months of normal development, just before floral ini t iat ion takes place. The ea r l i e r pa r t of the vegetative phase is more sens i t ive to var ia t ions of minera l s and the weather, and according to Summervi l le (1944} is of crucial importance to subsequent development. According to the same author damage done at this stage cannot be undone la ter . Thus a cold winter may effect the followers and hence, affects the yield of the subsequent year . General ly , vegetative growth is much reduced in winter , fewer leaves appear and their ra te of emergence is much slowed down. In I s rae l , the emergence rate is about four to five leaves per month in summer , compared to two leaves on the average in winter (Gor et a l . , 1961).
THE FLORAL STAGE
This stage is charac ter ized by the t rans i t ion from foliage leaves to f lower -bea r - ing. The completion of this stage takes about two to three months in s u m m e r (Simmon's , 1959}, and the optimum tempera tu re for f loral ini t ia t ion is considered to be 22 ° to o 25 C; higher and lower t empera tu res having undes i red effects (Sim- mort 's , 1959}.
Summervi l le (1944} showed that c l imate during the late pa r t of this stage had a marked effect on fruit number . It is also well known in I s rae l that yield is adver -
*) Division of Agricul tura l Meteorology, I s rae l Meteorological Service , Bet Dagan, I s rae l . Received 8 April 1970

156
sely affected if ini t iat ion occurs during the winter months (Jordan Valley) or late autumn (Coastal Plain) . P re sumab ly , cold affects female flower ini t iat ion and, therefore , affects the las t hands on the bunch, which may become fruit or t r a n s i - t ional hands accord~.ng to the c i rcumstances .
THE FRUITING STAGE
Differentiation of the female flower ceases and male flowers a re produced; con- cur ren t ly with a gradual decline in leaf a rea the frui t develops. The period be- tween the ini t iat ion and opening of the flowers (Stages II and II1) is about two to three months, if ini t iat ion occurs in ear ly s u m m e r (May-June), and about six to eight months when init iat ion occurs in la te autumn (September-November) . The ef- fect of a cold winter besides the delay in shooting (flower emergence) , is to reduce the elongation of the internodes of the s tem that bea rs the bunch with the resu l t that the bunch may not be proper ly "shot" f rom the hear t of the pseudostem. This condition is called "choke" and is more severe with the Dwarf Cavendish var ie ty than with the Giant Cavendish. When frui t ing occurs in winter , t empera tu res be - low 5°C may resu l t in slow development of bunches and the frui t may never fill well enough to become marketable , because of the insufficient leaf surface and slow leaf act ivi t ies . Moreover, the quality of the frui t may suffer, therefore , wIn- t e r frui t r ipening and quality a re less sa t is factory than f ru i t harvested during the summer months (Simmon's , 1959). Ripening t ime is three to seven months ac- cording to c i rcumstances ( summer or winter) .
The general effect of low t empera tu res on the banana plant may be summar ized as follows: cold spells affect all phases of banana development. Under Is rae l 'S cl imatic conditions the effect on the f i r s t and second stage of development a re e s - pecial ly relevant . Thus, cold during the previous year , may affect the yield more than cold of the cur ren t year . A poor average yield of bananas , for example, in 1969, may be the resu l t of cold conditions: (a) at the t ime of ini t iat ion (e. g. Octo- ber , 1968) or (b) severe winter in 1969. It should, however, be emphasized that good management prac t ice can min imize the effect of a cold winter on the yield of the second year . Oppenheimer and Gottreich (1954) showed that cor rec t select ion of sucker size and planting mate r ia l is of paramount importance in affecting f lower- ing t ime following a cold winter .
M E T H O D S
GENERAL
Bananas are grown in I s rae l in two main regions , the Central Jordan Valley and the Coastal P la in . In the Central Jordan Valley crop production is concentrated around the lower par t of the Lake of Gali lee, whilst in the Coastal P la in , four a reas can be defined from north to south, Western Gali lee, Carmel Sea Shore, Central P la in and Southern Pla in . F rom each of the cl imatic regions five Kibbutzim* were selected. The select ion was made in consultat ion with the Banana Growers ' As- sociation and the Advisory Officer of the Minis t ry of Agr icul ture so as to be r e - presenta t ive of the main banana growing regions. F rom these se t t lements average yields in kg pe r 1,000 m 2 for eleven years were obtained (1955/56-1965/66}. The cl imatic records were obtained from the nea re s t s tandard meteorological stat ions which included recording ins t rument s , one represen t ing each banana growing d is - t r ic t . For one region, the Carmel Sea Shore, no continuous c l imat ic data was avai lable, and this region was, therefore , not included in the analysis .
*) Kibbutzim, communal se t t lements engaged mainly in agr icul tura l activity.
157
SPECIFICATION OF THE MODEL
A l i nea r re la t ionship was assumed between the dependent va r iab le Y (yield) and the explanatory var iab le X (cl imatic var iable) . The X ' s being measu red f rom the i r r e spec t ive means , the re fore :
Y = ~ ' + X B + u (1)
where Y is a vec to r of T observat ions . Y is a vec to r of T constants each equal to the mean of Y. X is a m a t r i x of o rder T x m, m being the number of
explanatory va r i ab les and u is a vec to r of random dis turbances , assumed to be in- dependently dis t r ibuted f rom the X var iab les and with a constant finite va r iance .
In view of (a) the l a rge number of the c l imat ic va r i ab le s (In) exceeding the num- b e r of crop yield data (T) and (b) the c l imat ic va r i ab le s being highly co r r e l a t ed , the ord inary l eas t squares method was not applicable. T he re fo r e , an adaptation of Harold Hotel l ing 's (1933) Pr inc ipa l Component Analysis was used. The m stand- a rd ized X var iab les were replaced by the i r f i r s t K pr inc ipa l components Z. The r ep lacemen t of m explanatory var iab les by the K pr inc ipa l components may not grea t ly affect the p rec i s ion of the resu l t s if the other excluded pr inc ipa l compo- nents have smal l var iabi l i ty . If for example , m = 20, and only f ive pr inc ipa l c o m - ponents have apprec iable va r i ance , say 90%, then the co r re l a t ion ma t r ix R of the explanatory va r i ab les is ve ry nea r a m a t r i x of rank f ive. We could then aim at es t imat ing re la t ions involving more than five va r i ab les only if the sample were l a rge .
z = x s -1 H (2)
where Z is a m a t r i x of o rde r T x K pr inc ipa l components , S is a diagonal m a t r i x of s tandard deviat ions of the X ' s of o rde r m x m and H is a t r ans format ion m a t r i x of m rows cor responding to the m explanatory va r i ab les and of K columns which can be shown to be the orthogonal cha r ac t e r i s t i c s vec to r s cor responding to the f i r s t K c h a r a c t e r i s t i c roots of the cor re la t ion m a t r i x R (Kendall, 1957). The coeff icient a in the ordinary l eas t squares r e g r e s s i o n of Y on the Z ' s a r e then de termined:
Y = ~ + Z~ + u (3)
Since the Z ' s a r e l inea r combinations of the X ' s and the X ' s were assumed to be independently dis t r ibuted f rom the u ' s the Z va r i ab les will a lso be independently dis t r ibuted f rom the u ' s . Thus the coeff icient a will enjoy the "BLUE" p rope r t i e s . The final step is to obtain the $ coeff ic ients .
Equating 1 and 3 and using 2 for the definition of Z we obtain:
Hence ~ = S -1 H : (4)
(where ~ and 5 a re the es t imated values of ~ and a respect ively} and
Var (~) = S - IH (Var ~ ) H' S - I (5)
The above technique was used in a s i m i l a r way by Stone (1947) (see Kental l , 1957, pp. 71). The technique gives the final r e su l t s in t e r m s of the or iginal explanatory var iab les and not in t e r m s of some index numbers . This is des i r ab le whenever there exis ts a p rob lem of mul t ico l l inear i ty among the explanatory va r i ab les .
Af t e r a f i r s t a t tempt to analyse the data in this way fo r each region separa te ly , all the regional data were pooled into one m a s t e r r e g r e s s i o n assuming equal s lopes for all regions but different in te rcep ts , and it was cons t ruc ted by pooling all the explanatory va r i ab les , measured as deviat ions f rom the i r regional means , thus
158
yielding 44 observat ions. Component analysis of the pooled explanatory var iables suggested the inclusion of eleven pr incipal components explaining 94% of their to- tal var iance . Equations 3 and 4 were then used. The effect of different intercepts was allowed for equation by the technique of Dummy var iab les (Tomek, 1963). The hypothesis of common slopes was then tested by the F - t e s t s ta t is t ic (Chaw, 1960) and accepted at the 5% significance level .
APPLICATION OF THE MODEL TO BANANA YIELDS
This model was applied to test the effect of low t empera tu res (November-March) on the annual yield of bananas . The c l imat ic var iab les considered were the average monthly min imum t empera tu re s , the monthly "quantity of cold" below 5°C of the p resen t and previous year , compr i s ing twenty cl imatic var iab les .
The quantity of cold in a cer ta in month below 5°C is derived by mult iplying those hours of cold at a given t empera tu re below 5°C by the difference of this t empera - ture from 5°C. Thus one hour at 5 ° = zero quantity of cold, at 4°C = one unit quantity of cold and so on.
During the l l - y e a r per iod agrotechnical p rog res s was made. A l inear t rend was assumed for each region and the yields adjusted accordingly. This p r io r adjust- ment does not affect the analysis s ince there is no dependence between the t ime var iable and the cold var iab les .
R E S U L T S
The f i r s t five Pr inc ipa l components explained 87%, 89%, 87% and 86% of the to- tal vgr iance of the explanatory var iab les in each of the four regions respect ively. The 8 coefficients and their s tandard e r ro r s (see 4 and 5) a re given in Table 1.
The adjusted coefficient of determinat ion (~2) is fa i r ly high for all regions ex- cept for Western Galilee. About half the number of the coefficients are not s ignif- icant , most of these appeared in the var iables of the min imum tempera tu res of the previous year and the quantity of cold below 5°C for the cu r ren t yea r with the exception of the southern region where all the coefficients a re significant.
The es t imated coefficients have re la t ively large s tandard e r r o r s with the ex- ception of the Southern Region. This might be due to the paucity of yield data, and i t was, therefore , decided to pool all the regional data into one mas t e r regress ion .
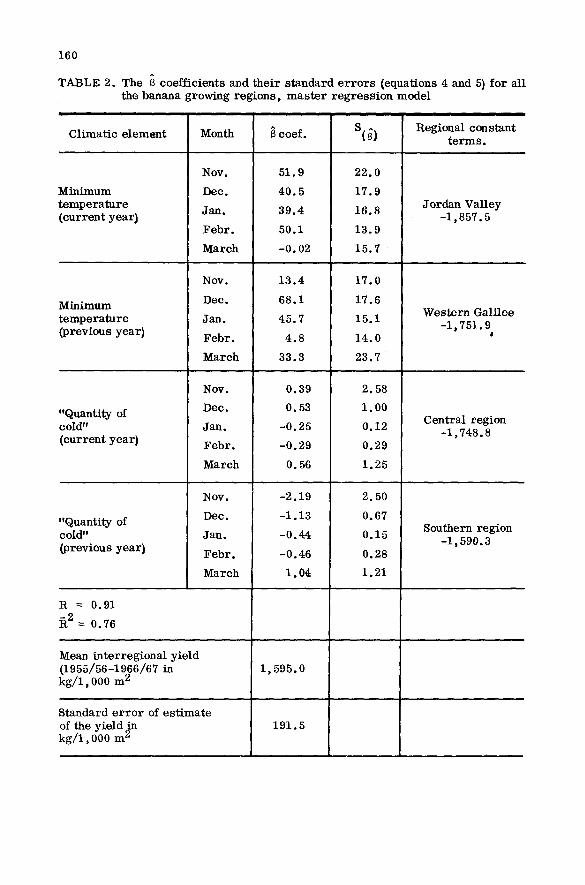
The f i r s t eleven pr incipal components explained 94% of the total var iance of the explanatory var iab les . The ~ coefficients and their s tandard e r r o r s (see 4 and 5} for the m a s t e r r egress ion a re given in Table 2.
The adjusted coefficient of de terminat ion of this model is fa i r ly high (~t 2) ex- ceeding the respect ive values for 3 of the individual regions , but being much lower than that for the southern region. No significant difference was found to exist be- tween the constant t e rms of the four regions, while differences in crop yields were significant.
The mean actual crop yields (not adjusted for agrotechnical progress) and their standard deviation, the mean min imum seasonal t empera tu re and quantity of cold and the i r s tandard deviations are presented in Table 3.
In the Jordan Valley, enjoying the mildes t winter c l imate , the mean yield of ba- nanas is the highest for the four regions , while in the Southern Region, the lowest mean yields coincide also with the coldest winter season. Throughout the four regions there is a decrease in banana yield as the winter season becomes colder.

159
TABLE 1. The B coeff ic ients and the i r s t andard e r r o r s {equations 4 and 5) of the four banana growing reg ions
Jordan
Cl imat ic Val ley Month I e l emen t coef .S(~)
Minimum t e m p e r a t u r e {current yea r )
Nov. 3 8 . 1 12.7
Dec. 4 7 . 0 13.9
Jan . 20.2 12.5
F e b r . 26.2 16.5
March - 6 . 9 14.3
Minimum t e m p e r a t u r e (previous year}
Nov. - 1 . 6 14.3
Dec. 63.9 20.6
Jan . 48.4 13.4
F e b r . 11.3 15.1
March 4 .2 13.2
"Quanti ty of co l~ ' ( cu r ren t yeaD
Nov. 53.50 34.5
Dec. -1 .15 1.50
Jan . -0 .21 0.28
F e b r . -0 .44 0.48
March 2.42 3.73
"Quanti ty of cold" (previous year}
Nov. 58.64 21.83
Dec. -6 .18 1.57
Jan . -1 .05 0.29
F e b r . -0 .68 0.84
M a r c h 1.81 3.18
Constant t e r m
R
~t 2.
-750.5
0.90
0.68
Mean yield** 1 ,943 .4
Standard e r r o r e s t i m a t e o f ~ i e l d 212.3 k g / 1 , 0 0 0 m -
Wes te rn Gal i lee
II ~ooef S(~)
38.8 15.4
25.2 12.3
4.7 9.7
17.7 8.8
-13.6 16.7
- 1.9 19.9
14.5 12.1
8.9 10.3
8.3 10.5
22.5 13.5
-16.10 8.80
0.85 1.08
- 0.13 0.14
- 0.22 0.26
- 0.35 0.63
- 3.57 17.63
- 1.81 i~31
- 0.14 0.16
- 0 . 33 0.20
- 0.84 0.72
487.9
0.78
0.35
1,728.3
Centra l Region
HI ~coef.s(~)
34.0 16.6
34.4 17.1
20.4 15.5
48.9 16.7
17.0 19.5
8.8 16.7
58.7 20.1
20.67 14.1
11.3 14.7
-7.2 15.2
3.34 1.85
-0.71 0.52
-0.13 0.15
-0.43 0.20
0.78 0.54
2.34 1.131
- i . 37 0.53
-0.26 0.16
-0.23 0.20
0.47 0.31
-854.6
0.86
0.57
1,373 .5
Southern Region
IV coa.s(~)
25.5
86.1
6 .2
32.8
-15 .6
25.0
24.3
36.5
39.7
-7.0
-1.55
-0.78
-0.17
0.40
-0.94
170.0 214.4
-1 .40
-0 .98
-0 .36
-1 .46
0.84
2.3
4.4
3.7
2 . 6
4.8
3.6
4 .3
2 .8
2 .6
2 .8
0.15
0.08
0.04
0.07
Q~12
0.20
0.07
0.03
0.08
0.18
-679.6
0.99
0.98
1 , 3 3 4 . 7
40 .5
, ~2 = 1- (1-R 2) (T- l ) where K = the number of explana tory v a r i a b l e s (Goldber - T - K g e t , 1964}
** Mean y ie ld (adjusted for agro technica l p rogress} in kg /1 ,000 m 2 (1955/56-1966/67}.
160
TABLE 2. The B coeff ic ients and the i r s t andard e r r o r s (equations 4 and 5) for a l l the banana growing r e g i o n s , m a s t e r r e g r e s s i o n model
Cl imat ic e l emen t
Minimum t e m p e r a t u r e ( cu r ren t yea r )
Minimum t e m p e r a t u r e (previous year}
"Quanti ty of cold" ( cu r ren t year )
"Quanti ty of cold" (previous year )
Month
N o v .
Dec.
Jan .
F e b r .
March
I~OV.
Dec.
Jan.
F e b r .
March
Nov.
Dec.
Jan .
F e b r .
March
Nov.
Dec.
Jan .
F e b r .
March
R = 0.91
~2 = 0.76
Mean in t e r r eg iona l y ie ld (1955/56-1966/67 in kg /1 ,000 m 2
Standard e r r o r of e s t i m a t e of the y ie ld ~n kg /1 ,000 m ~
coef.
51.9
40 .5
39.4
50.1
- 0 . 0 2
13.4
68.1
45.7
4 .8
33.3
0.39
0.53
- 0 . 2 5
-0 .29
0.56
-2 .19
- 1 . 1 3
- 0 . 4 4
- 0 . 4 6
1 . 0 4
1 ,595 .0
191.5
s(~)
22.0
17.9
16.8
13.9
15.7
17.0
17.6
15.1
14.0
23.7
2.58
1 .00
0.12
0.29
1.25
2.50
0.67
0.15
0.28
1.21
Regional constant t e r m s .
Jo rdan Val ley -1~ 857.5
Wes te rn Gal i lee -1~751.9
$
Cent ra l region -1 ,748 .8
Southern region - l j 5 9 0 . 3
161
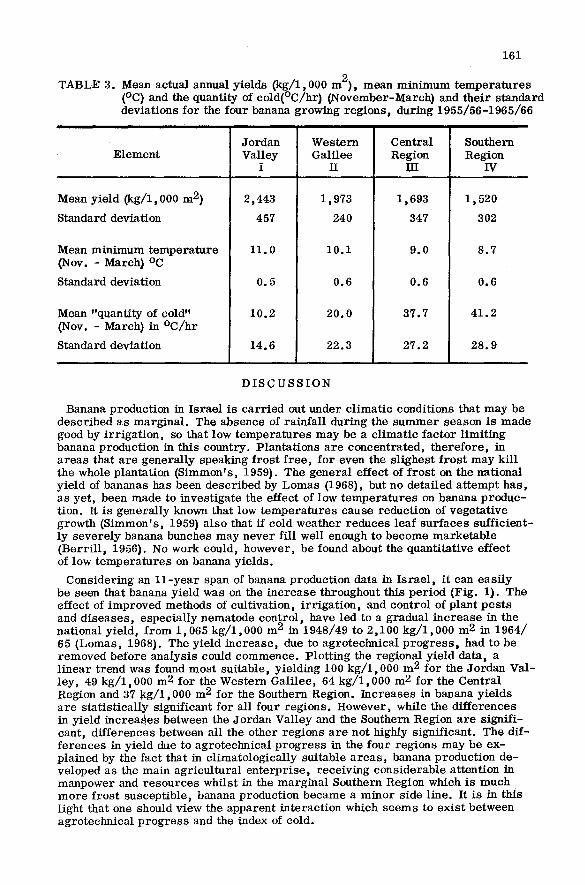
TABLE 3. Mean actual annual yields (kg/1,000 m21, mean mi n i mum t empera tu re s (oc) and the quantity of cold(°C/hr l (November-March 1 and the i r s tandard deviat ions for the four banana growing regions , during 1955/56-1965/66
Element
Mean yield (kg/1,000 m21
Standard deviation
Mean min imum tempera ture (Nov. - March 1 °C
Standard deviation
Mean "quantity of cold" (Nov. - March) in °C/hr
Standard deviation
Jordan Valley
i
2,443
457
i i . 0
0.5
10.2
14.6
Western Gali lee
i l
1,973
240
10.1
0.6
20.0
22.3
Central Region
HI
1,693
347
9.0
0.6
37.7
27.2
Southern Region
IV
1,520
302
8.7
0.6
41.2
28.9
D I S C U S S I O N
Banana production in I s rae l is ca r r i ed out under c l imat ic conditions that may be descr ibed as marg ina l . The absence of ra infal l during the s u m m e r season is made good by i r r iga t ion , so that low t empera tu res may be a c l imat ic factor l imi t ing banana production in this country. P lanta t ions a re concentrated, therefore , in a reas that are genera l ly speaking frost f ree , for even the sl ighest f ros t may kil l the whole plantat ion (Simmon's , 1959). The general effect of f ros t on the nat ional yield of bananas has been descr ibed by Lomas (1968), but no detailed at tempt has , as yet , been made to invest igate the effect of low t empera tu res on banana p roduc- tion. It is genera l ly known that low t empera tu res cause reduction of vegetat ive growth (Simmon's , 1959) also that ff cold weather reduces leaf sur faces suff ic ient- ly severe ly banana bunches may never fi l l well enough to become marke tab le (Berr i l l , 19561. No work could, however, be found about the quanti tat ive effect of low t empera tu res on banana yields.
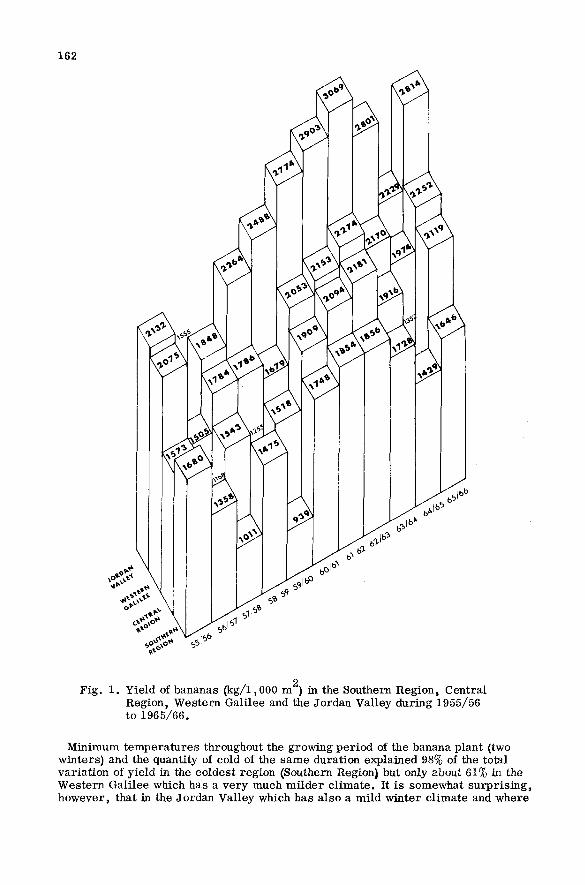
Considering an l l - y e a r span of banana production data in I s rae l , i t can eas i ly be seen that banana yield was on the inc rease throughout this per iod (Fig. 11 . The effect of improved methods of cult ivation, i r r iga t ion , and control of plant pes t s and d i seases , especial ly nematode control , have led to a gradual i nc rease in the nat ional yield, f rom 1,065 kg/1 ,000 m 2 in 1948/49 to 2,100 kg/1 ,000 m2 in 1964/ 65 (Lomas, 19681. The yield inc rease , due to agrotechnical p r o g r e s s , had to be removed before analys is could commence. Plot t ing the regional yield data, a l i nea r t rend was found most sui table, yielding 100 kg/1 ,000 m 2 for the Jordan Val- ley, 49 kg/1,000 m 2 for the Western Gali lee, 64 kg/1,000 m2 for the Cent ra l Region and 37 kg/1,000 m 2 for the Southern Region. Increases in banana yie lds
• " ~ . . . . . . n are s ta t l s tmal ly mgnifmant for all four regions . However, while the differe ces in yield inc reases between the Jordan Valley and the Southern Region a re s ignif i - cant, differences between all the other regions a re not highly significant . The dif- ferences in yield due to agrotechnical p rog res s in the four regions may be ex- plained by the fact that in cl imatological ly suitable a r e a s , banana product ion de- veloped as the main agr icul tura l en te rp r i se , receiving considerable at tention in manpower and resources whilst in the marg ina l Southern Region which is much more f rost susceptible, banana production became a minor side l ine. It is in this light that one should view the apparent in terac t ion which seems to exis t between agrotechnical p rog res s and the index of cold.
162
4~ ,s~'
oP
Fig. 1. Yield of bananas (kg/1,000 m 2) in the Southern Region, Central Region, Western Galilee and the Jordan Valley during 1955/56 to 1965/66.
Minimum tempera tures throughout the growing period of the banana plant (two winters} and the quantity of cold of the same duration explained 98% of the total var ia t ion of yield in the coldest region (Southern Region} but only about 61% in the Western Galilee which has a very much mi lder c l imate , It is somewhat su rpr i s ing , however, that in the Jordan Valley which has also a mild winter c l imate and where

163
bananas a re the main agr icu l tura l crop, such a high mult iple co r re la t ion coeff i - cient should have been obtained. With this one exception, there s eems excel lent ag reemen t between the cor re la t ion coeff ic ient and the regional winter c l imate , provided that t empe ra tu r e conditions r emain within the range of the four regions d i scussed and that actual f ros t is not common. In the coldest Southern region all the coeff ic ients a r e significant , whilst in the w a r m e r regions most of the s ignif i - cant coeff ic ients a re to be found at the beginning of the winter season. As the ba- nana yield is ha rves ted f rom September onwards, i t s eems reasonable to a s sume that low t e m p e r a t u r e s , ear ly in the season, may cause cons iderable m o r e damage to crop yie lds than s i m i l a r t empera tu re s l a t e r in the season. In addition, as the winter season p r o g r e s s e d the banana plant may undergo a "hardening" p r o c e s s s i m i l a r to that known in other agr icu l tura l plants . In some case s , however , the numer ica l values of the coeff icients for the month of November , a r e low, which may also be due to the fact that during the month of November mean min imum t e m p e r a t u r e s a r e re la t ive ly high causing no damage except in a v e r y few ex t r eme cases . Most of the coeff icients have the c o r r e c t sign. Some have a cont rad ic tory sign, espec ia l ly in the l as t month (March}. This might be due to hot spr ing wea- ther which has adve r se effect on yield. In 1968, for example , i t was es t imated that 30% of the yield in the Central Coastal Region was los t due to hot and dry weather during March.
The Jordan Valley and the Western Gal i lee a r e the main banana producing regions in this country. High crop yields due to r e l a t ive ly mild winter t e m p e r a t u r e s , which have been known to exis t , have been conf i rmed (see Table 3}. In the other two reg ions , the Southern and Central Region banana production has been on the de- cl ine mainly due to unfavourable min imum t e m p e r a t u r e s . It s eems that a mean min imum winter t empera tu re of about 10°C may be the ecological l imi t for c o m - m e r c i a l banana product ion. As minimum t e m p e r a t u r e s a re , however , ve ry much influenced by topography (Lomas, Shashoua and Cohen, 1969} espec ia l ly during c r i t i ca l nights when radiat ional cooling is at i ts max imum, the actual s i t ing of banana plantat ions in c l imat ica l ly marg ina l a r ea s is of g rea t e s t impor tance . With this in mind, detai led agrotopocl imatologica l su rveys have been undertaken in o r - de r to s i te banana plantat ions on re la t ive ly favourable local spots.
C O N C L U S I O N S
The success of banana growing in I s rae l depends to a l a rge extent on the t e m - p e r a t u r e conditions during the winter season (November - March). Mean min imum t e m p e r a t u r e s and the quantity of cold ( ° C / h r below 5°C) of the p rev ious and p r e - sent y e a r can account for some 83% of the var ia t ion of the total annual yield of all the banana growing regions . There a re , however , cons iderable var ia t ions as to the effect of the winter c l imate on banana y ie lds in the four reg ions . Thus in the Western Gal i lee , enjoying a mild winter only, 61% of the total var ia t ion in y ie ld can be accounted for by those c l imat ic va r i ab l e s , while in the Southern Region, where low winter t empera tu re s are common 98% is so affected. Consider ing the long t e r m actual mean annual yield of the Southern and Central Regions, i ts r e l - a t ively cool winter c l imate , and the high cor re la t ion between the low t e m p e r a t u r e s and crop y ie lds , i t s eems that banana production in those two regions may be un- economica l , except on s i tes that a r e topographical ly advantageous.
Pro longed cold affects the yield of the following y e a r much more than the yield of the p r e sen t yea r . Special ca re is , t he re fo re , r ecommended when se lec t ing planting ma te r i a l following a cold winter .
The s ta t i s t ica l model used explained 98% - 61% of the var ia t ions in crop yie ld depending on winter t empera tu re conditions of the region.
164
ACKNOWLEDGE MENT
The authors a re grateful to Dr L. Shashoua for his helpful suggest ions. Also to Mr M. Shacht of the National Agr icu l tura l Advisory Service with whom numerous d iscuss ions took place during the p rocess ing of the ma te r i a l , We would like to express our special grat i tude to Mr Yehoshua of the Banana Growers Associat ion for his encouragement and for grant ing us access to the data of banana yields r e - corded by the Associa t ion .
R E F E R E N C E S
BERILL, F .W. (1956) : Banana f ru i t f i l l ing. Q d . A g r i c . J . , 82 : 311-314. CHAW, G. (1960) : Tes t s of equality between sets of coefficients in two
l inea r r eg re s s ions . 28 : 591-605. GOLDBERGER, A.S. (1964): Econometr ic Theory. John Wiley and Sons, New
York, 194-197. GUR, A . , SPEIGEL, P . , OPPENHEIMER, H. , STOLER, S. and PATT, Y. (1961) : F ru i t Growing. Kiryat Hassadeh, Tel Aviv (published
in Hebrew), 63-78. KENDALL, M.G. (1957} : A Course in Mult ivariate Analysis . Charles Griffin and
Co. , London. HOTELLING, H. (1933) : Analys is of a complex of a s ta t i s t ica l var iab le into
pr inc ipa l components. J . e d u c . P s y c h . , 24 : 417-498. LOMAS, J. (1968) : The effect of the c l imate on agr icu l tura l production in
the upper Jordan Valley. Symposium on Methods in Agroclimatology (Unesco), 7 : 261-268.
LOMAS, J . , SHASHOUA, Y. and COHEN, A. (1969): Mobile surveys in agrotopo- climatology. Me teo r .Rdsch . , 22 : 96-101.
OPPENHEIMER, C. and GOTTREICH, M. (1954): Studies on growth and develop- merit of the dwarf banana in the coastal plain of I s rae l . Ktavin Rechovot, 5 : 29-55.
SEIBLE, D. (1939) : Ein Bei t rag zur Frage der K~Utesch~den an Pflanzen bei Tempera tu ren tiber dem Gefr ierpunkt . Beitr . Biol. P f l a n z . , 26 : 289-330.
SIMMON'S, N.W. (1959) : Bananas. Longmans, Green and Co. Ltd. London, 129-145.
STONE, J. R.N. (1947) : The interdependance of blocks of t ransac t ions . J . roy. stat . Soc. suppl . , 9 : 1-14.
SUMMERVILLE, W . A . T . (1944}: Studies in nut r i t ion as qualified by development in Musa Covendish Lamber t . Q d . J . A g r i c . S c i . , 1 : 1- 127.
TOMEK, W.G. (1963) : Using zero-one var iab les with t ime se r i e s data in r e - g ress ion equations. J. F a r m Econ . , 14 : 814-822.

165
ABSTRACT.- Banana yields f rom four regions in I s rae l have been cor re la ted with low t empera tu res over a per iod of eleven yea r s . It was found that the average monthly min imum tempera tu res during the winter season affect p r i m a r i l y the yield of the cu r r en t year , while the "quanti ty of cold" i . e . a measu re of t e m p e r a - tures below 5°C affects the yield of the following year . Mild cold weather during November and March have a beneficial effect. The model used fitted the data f a i r - ly well, explaining 98% to 61% of the total var ia t ion in yield, depending on the c l imat ic region.
ZUSAMMENFASSUNG.- Bananener t r~ge yon 4 Regionen in I s rae l wurden mi t n iedr igen Tempera tu ren w~hrend e iner Per iode yon 11 Jahren ko r r e l i e r t . Es wur - de gefunden, dass die mi t t l e ren monatl ichen Min imal tempera tu ren w~hrend des Winters p r i m e r die Er t r~ge des laufenden Jah res beeinf lussen, w~hrend sieh die "K~ltemenge", das i s t die AnzaM Stunden mi t Tempera tu ren un te r 5°C, auf die Ertr~lge des folgenden Jahres auswirkt . Mildes kal tes Wetter yon November bis M~rz hat einen giinstigen Einfluss . Die benutzten mathemat ischen Modelle s t i m m - ten mit den Messwerte gut i iberein. Je nach der k l imat i schen Region l i e s sen sich damit 98% bis 61% der Gesamtvar ia t ion der Er t r~ge erk l~ren .
RESUME. - On a 6tabli la corre la t ion entre le rendement des bananera ies de quatre r~gions d ' I s ra~l d 'une par t , les basses t empera tu re s d ' au t re par t . La p~riode consid~r~e est de 11 ans. On a constat6 que les m in imums mensue l s moyens de l ' h i ve r affectent en p r e m i e r l ieu la production de l ' ann~e en cours . P a r contre , les quanti$~s cumul~es de froid, c ' e s t - ~ - d i r e le nombre d 'heures pr~sentant des t empera tu res in f~r ieures ~ 5°C, ont une r~percuss ion su r la product ion de P a n - n~e suivante. Un temps f ra i s de novembre ~ m a r s a une influence favorable su r le rendement . L 'u t i l i sa t ion de modules math~matiques p e r m e t fort bien de ca l - culer la r~colte et les va leu r s a insi obtenues correspondent aux quantit~s effec- t ivement r~colt~es. Selon les r~gions e l imat iques , le 98 ~ 61% de la var ia t ion totale des quantit~s r~colt6es peut s ' expl iquer de cette fa~on.