the effect of implant misalignment on shoulder replacement
TRANSCRIPT
1
The Effect of Implant Misalignment on
Shoulder Replacement Outcomes
By
Chamaiporn Sukjamsri
A thesis submitted for the degree of Doctor of Philosophy of Imperial College London
and the Diploma of Imperial College
Department of Mechanical Engineering
Imperial College London
May 2015

2
Statement of Originality
I declare that:
(i) The content of this thesis is original and of my own work;
(ii) All assistance received and sources of materials (data, theoretical analysis, figures,
and text) have been acknowledge; and
(iii) The work has not been submitted to any other Institution for any degree or
diploma.
Chamaiporn Sukjamsri
Department of Mechanical Engineering
Imperial College London

3
Copyright Declaration
The copyright of this thesis rests with the author and is made available under a Creative
Commons Attribution Non-Commercial No Derivatives licence. Researchers are free to copy,
distribute or transmit the thesis on the condition that they attribute it, that they do not use it
for commercial purposes and that they do not alter, transform or build upon it. For any reuse
or redistribution, researchers must make clear to others the licence terms of this work
Chamaiporn Sukjamsri
Department of Mechanical Engineering
Imperial College London
4
Abstract
Total shoulder arthroplasty is a well-established treatment to relieve pain and restore joint
function particularly in arthritis patients. The damaged shoulder joint is replaced with humeral
and glenoid components. For success, all replacement components must be aligned properly.
However, errors in glenoid component alignment particularly in version is not infrequent due
to the complexities such as limited monitoring available during the surgical procedure and
glenoid posterior wear, commonly observed in glenohumeral osteoarthritis. Glenoid
component version has been found to induce eccentric load and may result in component
loosening which is the main indicator for revision surgery.
The overall aim of this thesis is to gain the in-depth understanding of how the component
version affects the fixation loosening in both cementless and cemented shoulder arthroplasty.
Early loosening in cementless arthroplasty is associated with failed biological fixation due to
excessive micromotion at the implant-bone interface. To measure interface micromotion, this
thesis developed an in-vitro technique based on the application of digital volume correlation
(DVC) and micro-computed tomography (μCT). This technique was validated and verified
the use of the finite element (FE) method as a tool for investigating the effect of glenoid
component version on micromotion. The FE predicted micromotion during a full range of
shoulder abduction confirmed that 60° of abduction was the critical position inducting the
largest micromotion and large micromotions were shown to be related to increased
component retroversion. The condition of the bone was also found to be an important
parameter as less stiff bone caused large micromotions.

5
In cemented arthroplasty, loosening of the glenoid component was simulated by a cyclic
loading experiment. Progression of radiolucent lines, evaluated through clinical CT images,
was found to be a metric for comparing the performance of different component versions. The
results showed that increased glenoid component version induced the incidence of radiolucent
lines which may weaken the stability of fixation.

6
Acknowledgements
I would like to express my greatest respect, admiration and gratitude to my supervisor, Dr.
Ulrich Hansen, for his help, advice and continued support. I owe him for all the knowledge
and experience acquired during the past 4 years.
I would like to express my gratitude to Dr. Thomas Gregory, Professor Andrew Amis,
Proffessor Roger Emily, Dr. Jonathan Jeffers for the valuable suggestions and advices during
my study. I also wish to thank Samuel Schenk and Mathys Ltd. for providing the material and
required information during my research.
I would like to extend my appreciation to the experts for their kind assistance with my
research; Dr. Diogo Geraldes, Camilla Halewood, Philip Wilson, Dr. Farah Armed, Dan
Sykes, Rebecca Summerfield, Steve Figaro, Dr Andy Bell, Andi Jin, Dr. Sarah Junaid, Dr.
Peter Krekel.
Furthermore, I would like to thank all my colleagues from Biomechanics group and my best
friends; Pam, Jo, Ran, Ikhwan, Neve, Bidyut, Yucuf, Manida, Chi-na, Natthinee, Kanjana,
Orada, for support, friendship and keeping me entertained during my study.
I am extremely grateful to thank Royal Thai Government for the financial support that made
possible my study in the UK. Finally, I would like to thank Sarayut and Christine Hunpho and
my mother for giving me the motivation and huge support to overcome the difficult moments
and for that I am most thankful.
7
Contents
Statement of Originality .......................................................................................................... 2
Copyright Declaration ............................................................................................................. 3
Abstract ..................................................................................................................................... 4
Acknowledgements ................................................................................................................... 6
List of Figures ......................................................................................................................... 13
List of Tables ........................................................................................................................... 24
Nomenclature .......................................................................................................................... 26
CHAPTER 1 Introduction
1.1 Anatomical planes and movements .................................................................................... 28
1.2 Anatomy of the shoulder .................................................................................................... 29
1.3 Shoulder joint replacement ................................................................................................. 34
1.4 Anatomical total shoulder arthroplasty (TSA) – cemented or cementless arthroplasty ..... 36
1.5 Osteointegration in cementless fixation ............................................................................. 39
1.6 Postoperative follow-up ..................................................................................................... 40
1.7 Problems in TSA – reports from clinical studies ............................................................... 40
1.8 The mechanism and causes of glenoid loosening .............................................................. 42
1.9 Causes of glenoid component misalignment ...................................................................... 43
1.10 Review of previous studies on the effects of glenoid misalignment ................................ 47
8
1.10.1 The effect of misalignment on subluxation and impingement .................................. 47
1.10.2. The effect of misalignment on joint loads and contact parameters .................... 49
1.10.3. Biomechanical studies: effect of misalignment on fixation failure and loosening
........................................................................................................................ …50
1.11 Summary: Gaps in knowledge of the effect of misalignment on loosening .................... 51
1.12 Scope of PhD and outline of the Thesis ........................................................................... 53
CHAPTER 2 Methodology and related parameters
2.1 Experimental technique for measuring micromotion ......................................................... 56
2.1.1 Introduction of digital volume correlation .................................................................. 56
2.1.2 The novel use of DVC in this thesis: Combining digital volume correlation and micro
computed tomography to evaluate interface micromotion ................................................... 60
2.1.3 Important DVC parameters for micromotion measurements ...................................... 64
2.1.4 Effect of subvolume size and minimal fraction of valid voxel and the settings of these
parameters for this Thesis. ................................................................................................... 65
2.2 Finite element analysis for predicting micromotion .......................................................... 72
2.2.1 Introduction ................................................................................................................. 72
2.2.2 Generating the finite element model for micromotion analysis .................................. 73
2.2.3 Model parameter settings ............................................................................................ 82
CHAPTER 3 Digital volume correlation and micro-CT: an in-vitro technique for
measuring interface micromotion around cementless implants
3.1 Introduction ........................................................................................................................ 92

9
3.2 Material and methods ......................................................................................................... 94
3.2.1 DVC-CT micromotion versus ‘known’ micromotion ............................................... 94
3.2.2 DVC and micro-CT scanning protocol ....................................................................... 95
3.2.3 DVC-CT versus manual tracking and FE predicted micromotion in a clinically
realistic set-up ...................................................................................................................... 97
3.2.4 Manual tracking of micromotion at discrete points from CT scans ............................ 98
3.2.5 Finite element modelling of full-field interface micromotion .................................... 99
3.3 Results ......................................................................................................................... 103
3.3.1 Comparison of DVC-CT and known micromotion in simplified experiment ........ 103
3.3.2 Comparison of DVC-μCT and manually tracked micromotion in realistic set-up ... 104
3.3.3 Comparison of DVC-CT and FE full-field micromotion in realistic set-up ........... 104
3.4 Discussion ........................................................................................................................ 106
CHAPTER 4 The effect of misalignment on cementless glenoid prosthesis fixation
(porcine bone specimens)
4.1 Introduction ...................................................................................................................... 110
4.2 Material and methods .................................................................................................. 112
4.2.1 Specimen preparation ................................................................................................ 112
4.2.2 Scanning protocol and DVC-μCT micromotion ....................................................... 116
4.2.3 Finite element modelling ........................................................................................... 116
4.3 Results .............................................................................................................................. 116

10
4.3.1 The effect of version and implant seating (i.e. interface gap) on micromotion:
DVC-CT versus FE .......................................................................................................... 116
4.3.2 The effect of version on micromotion when isolated from effect of implant seating 120
4.4 Discussion ........................................................................................................................ 122
CHAPTER 5 The effect of misalignment on cementless glenoid prosthesis fixation and
the importance of bone quality (human bone)
5.1 Introduction ...................................................................................................................... 126
5.2 Material and methods ....................................................................................................... 128
5.2.1 FE model construction .............................................................................................. 128
5.2.2 Bone density and Young’s modulus.......................................................................... 130
5.2.3 Loading condition ..................................................................................................... 131
5.3 Results .............................................................................................................................. 132
5.3.1 Relationship between micromotion and degree of abduction ................................... 132
5.3.2 Relationship between micromotion and glenoid component alignment ................... 133
5.4 Discussion ........................................................................................................................ 137
CHAPTER 6 The effect of misalignment on cemented glenoid prosthesis fixation
6.1 Introduction ...................................................................................................................... 141
6.2 Material and methods ....................................................................................................... 143
6.2.1 Specimen preparation ................................................................................................ 143
6.2.2 Cyclic loading test ..................................................................................................... 144
6.2.3 Assessment of loosening: radiolucent line scores ..................................................... 148
11
6.3 Results .............................................................................................................................. 150
6.3.1 Initiation and progression of radiolucent lines with number of load cycles ............. 150
6.3.2 Effects of glenoid component version on radiolucent line scores ............................. 152
6.3.3 Did version affect the location of radiolucencies? .................................................... 153
6.4 Discussion ........................................................................................................................ 156
CHAPTER 7 Summary, Discussion and Conclusions
7.1 Summary .......................................................................................................................... 159
7.2 Discussion and Conclusions of findings of clinical issues: misalignment, implant seating,
bone quality ............................................................................................................................ 160
7.2.1 Misalignment: the effect of component version ........................................................ 160
7.2.2 The importance of implant seating/interface gap ...................................................... 162
7.2.3 Considerations about glenoid bone quality ............................................................... 163
7.3 Discussion and Conclusions of methodologies (DVC-CT, FE, In-Vitro experiment
including the use of radiolucent lines) ................................................................................... 164
7.3.1 The DVC-µCT technique .......................................................................................... 164
7.3.2 FE methodology for predicting micromotion in cementless arthroplasty ................. 165
7.3.3 Radiolucent lines in cemented arthroplasty .............................................................. 166
CHAPTER 8 Future work
8.1 Addressing implant seating .............................................................................................. 169
8.2 Should the glenoid implant be aligned according to the scapular blade orientation or
according to the orientation of the glenoid vault? .................................................................. 170

12
8.3 How to best reconstruct a naturally retroverted or eroded glenoid .................................. 172
8.4 Does glenoid component misalignment cause impingement? ......................................... 173
8.5 Improvement of the loading device used for the DVC-μCT technique ........................... 176
References ............................................................................................................................. 178
Appendix ............................................................................................................................... 191

13
List of Figures
Figure 1. 1 Anatomical directional reference of human body (www.blausen.com,
www.commons.wikimedia.org). ...................................................................................... 28
Figure 1. 2 Shoulder joint movement (www.acefitness.org). ................................................. 29
Figure 1. 3 Anterior view of the bones in the shoulder joint and rotator cuff (Neumann,
Kinesiology of the Musculoskeletal System, 2nd edition, 2010, Elsevier Inc.). ............... 30
Figure 1. 4 Anterior view of the shoulder joint capsule (a). Lateral view of the glenoid
showing the glenoid labrum and biceps tendon (b) (Gray, Anatomy of the Human Body,
Philadelphia, Lea&Febiger, 1918; Bartleby.com). .......................................................... 31
Figure 1. 5 The rotator cuff consisting of four muscles; the supraspinatus, the infraspinatus,
the teres minor, and the subscapularis shown in anterior view (a), posterior view (b), and
lateral view (c) of the glenohumeral joint (www.medscape.com). .................................. 32
Figure 1. 6 Anterior view of the deltoid (Gray, Anatomy of the Human Body, Philadelphia,
Lea&Febiger, 1918; Bartleby.com). ................................................................................ 33
Figure 1. 7 Diagram of bursae surrounding the shoulder joint; subacromial-subdeltoid bursa
(1), subscapular recess (2), subcoracoid bursa (3), coracoclavicular bursa (4), supra-
acromial bursa (5) and medial extension of subacromial-subdeltoid bursa (6) (Hirji et al.,
2011). ................................................................................................................................ 33
Figure 1. 8 Various designs of the glenoid and humeral component (Lazarus et al., 2002;
www.fhorthopedics.com; www.mathysmedical.com). .................................................... 37
Figure 1. 9 Rocking horse phenomenon in the glenohumeral joint (Matsen et al., 2008). ..... 43
Figure 1. 10 The plane of scapula defined by three anatomic landmarks: the centre of glenoid
fossa, scapula trigonum, and the inferior pole of scapula. Ideal glenoid component
position (neutral alignment) is defined when the component centre is placed at the centre
14
of glenoid fossa and the component plane is perpendicular to transverse and coronal
scapula plane (Lewis and Armstrong, 2011). ................................................................... 44
Figure 1. 11 An example of postoperative orientation of the glenoid component in transverse
scapular plane. The component was neutrally positioned (a). The component was placed
with a few degrees of retroversion, resulting in anterior glenoid wall perforation (2)
(Gregory, 2010). ............................................................................................................... 45
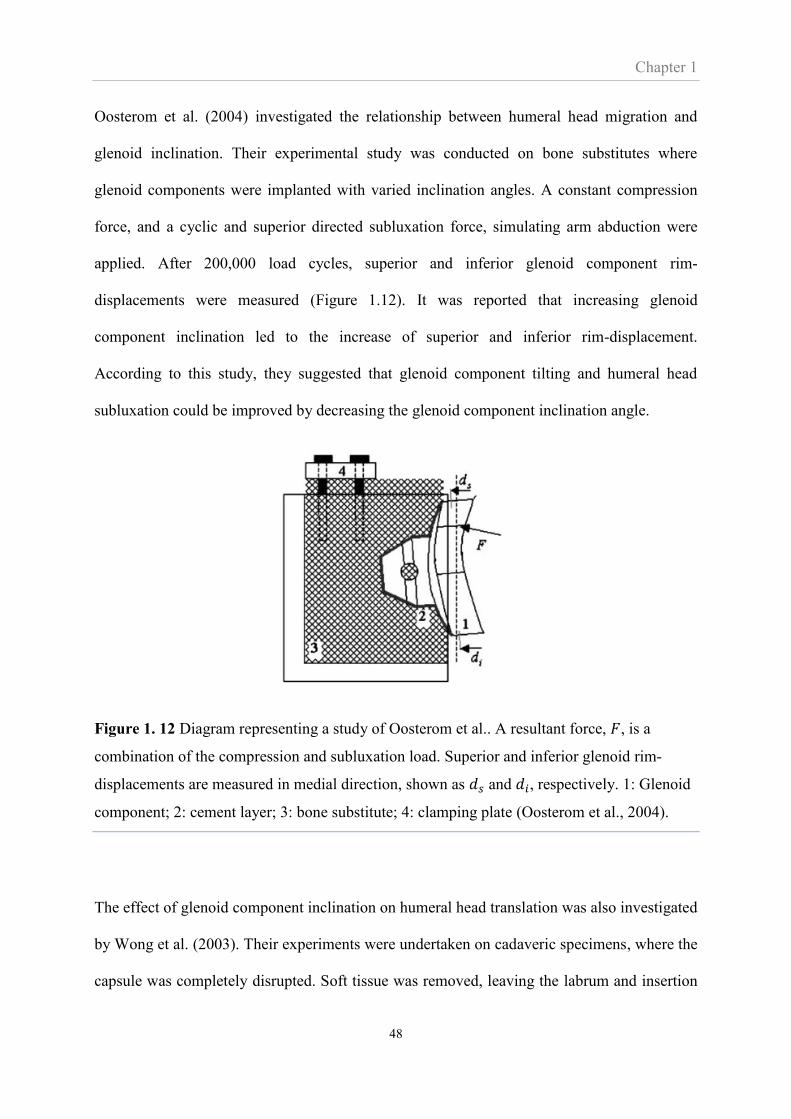
Figure 1. 12 Diagram representing a study of Oosterom et al.. A resultant force, 𝐹, is a
combination of the compression and subluxation load. Superior and inferior glenoid rim-
displacements are measured in medial direction, shown as 𝑑𝑠 and 𝑑𝑖, respectively. 1:
Glenoid component; 2: cement layer; 3: bone substitute; 4: clamping plate (Oosterom et
al., 2004). .......................................................................................................................... 48
Figure 2. 1 Concept of the mathematical algorithm used by the DVC methodology. ............ 59
Figure 2. 2 Principle of micro-CT tomography (www.nikonmetrology.com). ....................... 61
Figure 2. 3 Micro-CT image shows the trabecular structure of human and porcine glenoid. . 61
Figure 2. 4 The implant-aligned coordinate system was set prior to micromotion
measurement (a). The bone and implant displacement were evaluated separately by DVC
(b). The colour contour shows a series of subvolumes, each showing the absolute
displacement vector. ......................................................................................................... 63
Figure 2. 5 The customised Matlab script calculated the centre of the sphere associated with
the implant base plate using a sphere fitting algorithm. Also, the peg centre lines were
calculated. These quantities were used to separate the absolute micromotion into its
tangential and normal components along the base plate and pegs, respectively. ............. 63
Figure 2. 6 Displacement vectors obtained from two different settings of the minimal fraction
of valid voxel; 10% (a) and 30% (b). The actual boundary of the implant coating is

15
outlined by the red lines. Other regions apart from the coating are masked out. The black
area demonstrates the valid voxels within the subvolume. .............................................. 65
Figure 2. 7 A comparison of the final subvolume size (Step 4 in Table 2.1) for different
subvolume settings. The upper row presents the micro-CT image of the implant coating
whereas the lower row presents the trabecular bone located near the implant-bone
interface. ........................................................................................................................... 67
Figure 2. 8 Comparison of displacement errors and standard deviation obtained from different
settings of sub-volume size of the implant (a) and bone (b). The error bars represent the
maximum and minimum of displacement errors. The displacement errors presented in
the graphs were the mean value of the measurement over the entire volume of the CT
scan. .................................................................................................................................. 68
Figure 2. 9 The bone and implant in the micro-CT images with a resolution of 22 μm were
separated using a masking function in the DVC software. The implant was digitally
moved by 1 voxel in the negative x-direction whereas the bone was moved by 1 voxel in
the negative y-direction. These movements induced ideal absolute interface micromotion
of 1.4142 voxels. This number was then compared to the micromotion predicted by
DVC, in which nine different settings of the minimal fraction of the valid voxel were
evaluated. .......................................................................................................................... 70
Figure 2. 10 Comparison of micromotion errors and standard deviation obtained from various
settings of the minimal valid voxel. The error bars represent the maximum and minimum
of micromotion errors. ...................................................................................................... 71
Figure 2. 11 Overview of the process of constructing the FE model for analysing interface
micromotion in shoulder arthroplasty. ............................................................................. 75
Figure 2. 12 Linear relationship between grey scale value in Hounsfield unit and bone
apparent density. ............................................................................................................... 77
16
Figure 2. 13 Young’s modulus of cancellous bone from the human glenoid vault reported by
other studies. ..................................................................................................................... 79
Figure 2. 14 Porcine glenoid from which cores of cylindrical trabecular specimens were
harvested (a). Specimen under compressive force applied by the Instron 8874 (b). ....... 80
Figure 2. 15 Glenohumeral contact force during shoulder abduction (Terrier et al. 2008). ... 81
Figure 2. 16 Superior-inferior position of the contact point on the glenoid. Zero on the
vertical axis corresponds to the centre of the glenoid (reproduced from Terrier et al.
2008). ................................................................................................................................ 82
Figure 2. 17 A joint force of 575 N was applied at the centre of humeral head, simulating
unloaded arm abduction at 60°. ........................................................................................ 83
Figure 2. 18 Absolute micromotions extracted from 8 nodes of models with different number
of elements. ...................................................................................................................... 84
Figure 2. 19 Comparison of micromotion between the two models with different mesh
density. ............................................................................................................................. 85
Figure 2. 20 Comparison between the geometry of full and a simplified scapula model. The
displacement of both models was constrained at the coracoids process and the medial
side of the model. ............................................................................................................. 87
Figure 2. 21 Contour plots of absolute micromotion at 60° abduction of a full and simplified
(truncated) scapula model (a). Absolute micromotion extracted from the 6 nodes
indicated on (a) from the full and truncated models and simulating 60° and 150°
abduction (b). ................................................................................................................... 88
Figure 2. 22 FE model simulating the experiment by Shirazi-Adl et al., (1993). ................... 89
Figure 2. 23 FE predictions using the arctangent model with different values of the RVT
parameter simulating the frictional load and displacement of the experiment of a bone

17
cube sliding on metal plate (Figure 2.22). The data from Shirazi’s experiment are shown
by the solid drawn line. .................................................................................................... 90
Figure 3. 1 The simplified experimental setup for validating the DVC-µCT method against
imposed (‘known’) micromotion. (a) Part of CT-image at the interface of the specimen.
Dashed white square shows the size of the subvolume used in DVC analysis. (b) 1: PE
specimen coated with porous titanium (the implant) and attached to the top part of the
fixture; 2: cement block holding flat cut porcine bone, resting on base of fixture and
placed flush against PE component; 3: CT compatible acrylic frame; 4: micrometre for
moving the PE specimen in the vertical direction and measuring the imposed
displacement, i.e. the tangential micromotion. ................................................................. 95
Figure 3. 2 Clinically realistic experimental setup. (a) 1: screw for moving and applying
vertical force to the humeral head; 2: humeral head prosthesis fixed to screw; 3: glenoid
component; 4: glenoid bone; 5: cement holder to keep specimen in aligned at 60° of
shoulder abduction; 6: load cell measuring the load imposed by the screw. (b) CT image
of the specimen showing the profile of the implant and the porous titanium coating. Part
of the interfacial gap is also indicated. ............................................................................. 98
Figure 3. 3 Implant backside and profile showing the 12 discrete points where micromotions
are evaluated using manual tracking as well as with DVC-µCT. ‘S’ and ‘I’ indicate the
superior and inferior parts of the component, respectively. ............................................. 99
Figure 3. 4 FE model. ‘F’ is the glenohumeral joint force applied to the centre of the humeral
head. The dashed rectangle indicates the volume within which the nodes at the surface of
the bone have been rigidly fixed. ................................................................................... 100
Figure 3. 5 Implant backside and profile showing the points where gap height was measured.
Gap height at the points located within the loaded region, shown as a square, were
18
averaged and used in this study (a). Variation in gap height observed via micro-CT scans
(b). ‘S’ and ‘I’ indicate the superior and inferior parts of the component, respectively. 102
Figure 3. 6 DVC-µCT micromotion versus the imposed (‘true’) micromotions of 40, 100 and
150 µm. Error bars indicate the range of the DVC-µCT measurement along the interface
of the specimen. .............................................................................................................. 103
Figure 3. 7 DVC-µCT absolute micromotion versus manually tracked absolute micromotion
at the 12 discrete points shown in Figure 3.3. ................................................................ 104
Figure 3. 8 Normal, tangential and absolute (magnitude) micromotion as measured by DVC-
µCT and predicted by FE. Interfaces not in contact are shown in white. The orientation
of the glenoid is indicated by ‘S’ and ‘I’ which refer to the superior and inferior parts of
the glenoid, respectively. ................................................................................................ 105
Figure 4. 1 Determining and creating glenoid version. Neutral version shown in the yellow
dotted line is obtained when the anterior-posterior line is perpendicular to the transverse
scapula axis. The angle between the anterior-posterior line and a line perpendicular to the
transverse scapula axis defines version angle degree. An example of creating 5°
anteversion is shown in the red line. .............................................................................. 114
Figure 4. 2 Transverse scapula axis is defined as a line drawn between the glenoid centre and
the point where the cervical border and scapula spine are joined at the spinal border. This
scapula has neutral inclination since the line drawn between superior and inferior
margins is perpendicular to the transverse scapula axis. ................................................ 115
Figure 4. 3 Positioning specimen for µCT scanning. A machine-cut plastic block used for
setting specimen alignment (a). The aligned specimen coupled with the humeral head
(b). The contact point and load direction presented here simulates 60º abduction of the
shoulder joint. ................................................................................................................. 115
19
Figure 4. 4 Actual version degree, average gap height and absolute micromotion pattern
obtained from DVC-µCT and FE method during realistic experimental set-up. The
specimens used in this study were harvested randomly from both left and right shoulder.
For a reader-friendly purpose, some contour plots were mirrored to be aligned
accordingly. ‘S’, ‘I’, ‘A’, ‘P’ indicate the superior, inferior, anterior and posterior parts
of the component, respectively. ...................................................................................... 118
Figure 4. 5 DVC-µCT absolute micromotion versus FE absolute micromotion obtained from
the realistic set-up experiment conducting on seven specimens. ................................... 119
Figure 4. 6 The relationship between the average gap height at the loading area and
maximum absolute micromotion determined by DVC-µCT and FE method. ............... 119
Figure 4. 7 Distribution of absolute micromotion at the bone-implant interface of seven
different porcine glenoids predicted by the FE method. Bone material not in contact are
shown in grey. ................................................................................................................ 121
Figure 4. 8 The correlation between version degree of the component and the maximum
absolute micromotions at the inferior interface. ............................................................. 121
Figure 5. 1 The setting of glenoid prosthesis according to anatomical landmarks. (a) The
transverse axis of the scapula is defined as the line connecting the centre of the glenoid
(GC) and the most medial point of the trigonum spinae (TS). (b) The glenoid prosthesis
was set in five different versions. The version degree was defined as an angle between
the line connecting the anterior and the posterior rim of the prosthesis and the line
perpendicular to the transverse axis of the scapula. Anteversion and retroversion refers to
the alignment with a glenoid prosthesis facing anteriorly and posteriorly, respectively.
........................................................................................................................................ 129
Figure 5. 2 Variation in apparent density of the four FE models used in this study. ............ 130
20
Figure 5. 3 Young’s modulus of the human bone used in the FE models of this Chapter and
of the porcine bone of Chapters 3 and 4. Box plots contain median value and the
interquartile (IQR) range between 25 and 75 percentiles. ............................................. 131
Figure 5. 4 FE model with a truncated scapula used in this study. A joint load was applied at
the centre of the humeral head to simulate different degrees of arm abduction.
Displacement of the nodes with blue arrows was constrained to prevent rigid body
movement. ...................................................................................................................... 132
Figure 5. 5 Variation of maximum micromotion with abduction at (a) the whole interface, (b)
the base plate, (c) the superior peg, and (d) the inferior peg. The bottom and top of the
box are the first and third quartiles. A point inside the box is the median while the upper
and lower ends of the vertical line are the maximum and minimum value, respectively.
Models with any prosthesis alignments were taken into account. ................................. 133
Figure 5. 6 Maximum micromotion predicted during abduction in response to version of the
glenoid prosthesis. The analysis was focused on specific regions (a) whole interface, (b)
base plate, (c) superior peg, and (d) inferior peg. .......................................................... 134
Figure 5. 7 Contour plot of absolute micromotion at 60⁰ abduction at the backside of glenoid
component implanted in four different human glenoid models. The orientation of the
glenoid indicated by ‘S’, ‘I’, ‘A’, ‘P’ refers to superior, inferior, anterior and posterior
parts of the component, respectively. Non-contact regions at the pegs are shown in white.
The regions with absolute micromotion above 100 µm are shown in grey. .................. 136
Figure 5. 8 Bar chart represents the average percentage of contact area with micromotions
lower than 20, 50 and 100 µm. The thin line shows the data range including the
maximum and minimum values. .................................................................................... 137
Figure 6. 1 Glenoid prosthesis with curved-back and two pegs was used in this study (a). The
implanted bone substitute was secured into PMMA block (b). ..................................... 144

21
Figure 6. 2 Loading setup in the experiment. The humeral head was moved vertically by the
Instron. The farthest point was set at 90% of subluxation distance in both superior and
inferior directions. The glenoid component was compressed against the humeral head by
a load of 750 N exerted by a pneumatic actuator compresses. ...................................... 145
Figure 6. 3 Version degree of glenoid component was simulated by rotating the specimen
holder. The translation of humeral head due to glenoid component version was achieved
by sliding the specimen holder in anterior-posterior direction while maintaining the
version angle of the glenoid component. The holder was secured in place when the
humeral head touched the deepest point of the glenoid curvature. The different setup of
groups of 0º and 20º version is shown. (a) The contact point (red circle) was set at the
anterior-posterior centre line (red dashed line) for the group of 0º. (b) The contact point
was posteriorly translated from the anterior-posterior centre line for the group with 20º of
retroversion. .................................................................................................................... 146
Figure 6. 4 Vertical load plotted against vertical distance of the humeral head for subluxation
test of the specimens with 0°, 10°, and 20° version. Each specimen was tested for two
consecutive cycles. The subluxation distance where the peak vertical load occurred for
all specimens was found to be approximately 4 mm in both superior and inferior
directions. As a result, a distance of ±3.6 mm (90% of subluxation distance) was
employed for the cyclic loading test. ............................................................................. 148
Figure 6. 5 Glenoid cemented prosthesis used in this study with definitions of zone 1-3 on the
posterior cross-section, zone 4-8 on the centre line cross-section, and zone 9-11 on the
anterior cross-section. ..................................................................................................... 149
Figure 6. 6 A series of CT image, taken before and during the test, demonstrates the
progression of radiolucent lines at the cement-bone interface which is clearly noticeable
at the 1700 cycle assessment point. An illustrative example of radiolucent line
22
assessment is shown in the last CT image. The width of radiolucent line inside the circle,
corresponding to zone 4 and 5 of Figure 6.5, was found to lie between 1-1.5 mm. As a
result, zone 4 and 5 were scored 3 points. ...................................................................... 151
Figure 6. 7 The radiolucency scores of the three groups of version at increasing number of
load cycles. ..................................................................................................................... 152
Figure 6. 8 The effect of version on regional distribution of radiolucencies. The zones 1 to 11
on the abscissa are defined in Figure 6.5. ...................................................................... 154
Figure 6. 9 The effect of version on the mean radiolucency scores in the (a) superior and
inferior regions, and (b) anterior and posterior regions at 2400 load cycles. Bars indicate
standard deviations. ........................................................................................................ 155
Figure 8. 1 The yellow line indicates the orientation of the scapular blade (a line joining the
most medial point of the scapular blade with the centre point of the glenoid articular
surface). The schematic implant (red) in the left part of the figure indicates the current
standard of aligning the glenoid component according to the scapular blade. The implant
in the right part of the figure indicates the positioning of an implant according to the
orientation of the glenoid vault. ..................................................................................... 171
Figure 8. 2 The left part of figure indicates a prosthesis implanted according to the eroded
geometry of the glenoid articulating surface (i.e. not correction of alignment is carried
out). The right part of the figure indicates the alignment of an implant after the eroded
glenoid has been reamed to obtain neutral alignment according to the orientation of the
scapular blade. ................................................................................................................ 172
Figure 8. 3 Preparation of 3D model for studying range of motion and impingement on the
replaced shoulder joint. Glenoid implant component is virtually aligned based on the
original alignment observed from the CT dataset (a). 3D model consisting of humeral
head, glenoid, and glenoid component prepared for motion analysis (b). ..................... 174
23
Figure 8. 4 The Articulis shows envelope profile representing the maximum degree of
elevation at various elevation planes, e.g., abduction, flexion. ...................................... 175
Figure 8. 5 Effect of retroversion on maximum degree of elevation before impingement. The
abscissa indicates in which plane the arm is lifted while the ordinate indicates how high
it was possible to flex the arm before impingement. Elevation plane at 0o corresponds to
forward flexion (sagittal plane) and 270° to abduction.in the coronal plane. ................ 176
Figure A 1 Example of stress-strain curve; Young’s modulus is defined as the slope of the red
line. ................................................................................................................................. 191
Figure B 1 The pressure exerted by pneumatic cylinder was adjusted by an actuator. To
obtain a compressive load of 750 N, the pneumatic actuator was set at 4.4 bars. ......... 193

24
List of Tables
Table 2. 1 The different subvolume size settings evaluated in this study. Each subvolume was
set to be 50% overlap, meaning displacement vectors were obtained at a spacing half of
the voxel size. ................................................................................................................... 66
Table 2. 2 Displacement and standard deviation obtained from different settings of
subvolume size of the implant and bone. The ideal displacement for all settings is 0.5
voxel. ................................................................................................................................ 67
Table 2. 3 Parameters for the FE analysis. Values obtained from previous work (Galetz et al.,
2010; Pruitt, 2005; Shirazi-Adl et al., 1993). ................................................................... 75
Table 2. 4 Four different settings of mesh density. ................................................................. 83
Table 3. 1 DVC input parameters. ........................................................................................... 96
Table 3. 2 Comparison of DVC-µCT and FE predictions. .................................................... 106
Table 5. 1 CT images specification of the four scapulae used in this study. ......................... 128
Table 5. 2 Applied loads. ....................................................................................................... 131
Table 6. 1 The radiolucency scoring system used in this study. ........................................... 150
Table 6. 2 The number of specimens categorised according to the largest (width) radiolucent
line present in the specimen at 2400 cycle. “*” indicates that the width of radiolucent line
shown in the table is found in all 6 specimens of the group but not the largest width. . 153
Table A 1 Young’s modulus of different specimens harvested from five different porcine
glenoids. ......................................................................................................................... 192
Table C 1 Reliability of repeated measurement determined on the glenoid centre line of six
specimens. ...................................................................................................................... 194
Table C 2 Radiolucency score classified by zone of specimens completing 1000 cycles of
loading test. .................................................................................................................... 195

25
Table C 3 Radiolucency score classified by zone of specimens completing 1700 cycles of
loading test. .................................................................................................................... 196
Table C 4 Radiolucency score classified by zone of specimens completing 2400 cycles of
loading test. .................................................................................................................... 197
26
Nomenclature
AC Acromioclavicular
CPU Central Processing Unit
CC Cross-correlation
CT Computed Tomography
DIC Digital Image Correlation
DOF Degree of Freedom
DVC Digital Volume Correlation
FE Finite Element
FEA Finite Element Analysis
FFT Fast Fourier Transform
GH Glenohumeral
HU Hounsfield Unit
LVDT Linear Variable Differential Transformer
MRI Magnetic Resonance Image
Micro-CT, μCT Micro-Computed Tomography
NCC Normalised Cross-correlation
OA Osteoarthritis
OCT Optical Coherence Tomography
PE Polyethylene
PMMA Polymethylmethacrylate
RA Rheumatoid Arthritis
ROM Range of Motion

27
RSA Reverse Shoulder Arthroplasty
RVT Relative Velocity Threshold
SC Sternoclavicular
SSC Sum of Square Correlation
TSA Total Shoulder Arthroplasty
Chapter 1
28
CHAPTER 1
Introduction
In this chapter, total shoulder arthroplasty and its complications, particularly, glenoid
component loosening are introduced. A short review of studies in glenoid component
misalignment is also included. At the end of this chapter, the objectives and scope of the
thesis are described.
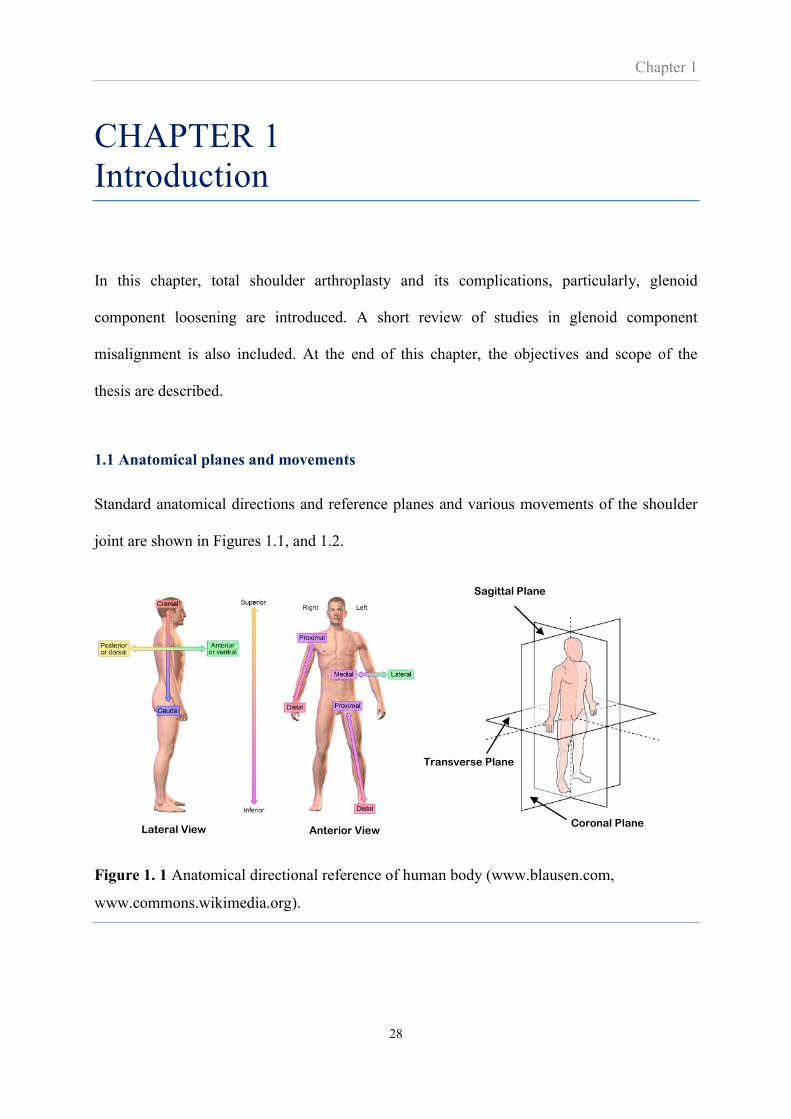
1.1 Anatomical planes and movements
Standard anatomical directions and reference planes and various movements of the shoulder
joint are shown in Figures 1.1, and 1.2.
Figure 1. 1 Anatomical directional reference of human body (www.blausen.com,
www.commons.wikimedia.org).
Transverse Plane
Sagittal Plane
Coronal Plane Lateral View Anterior View
Chapter 1
29
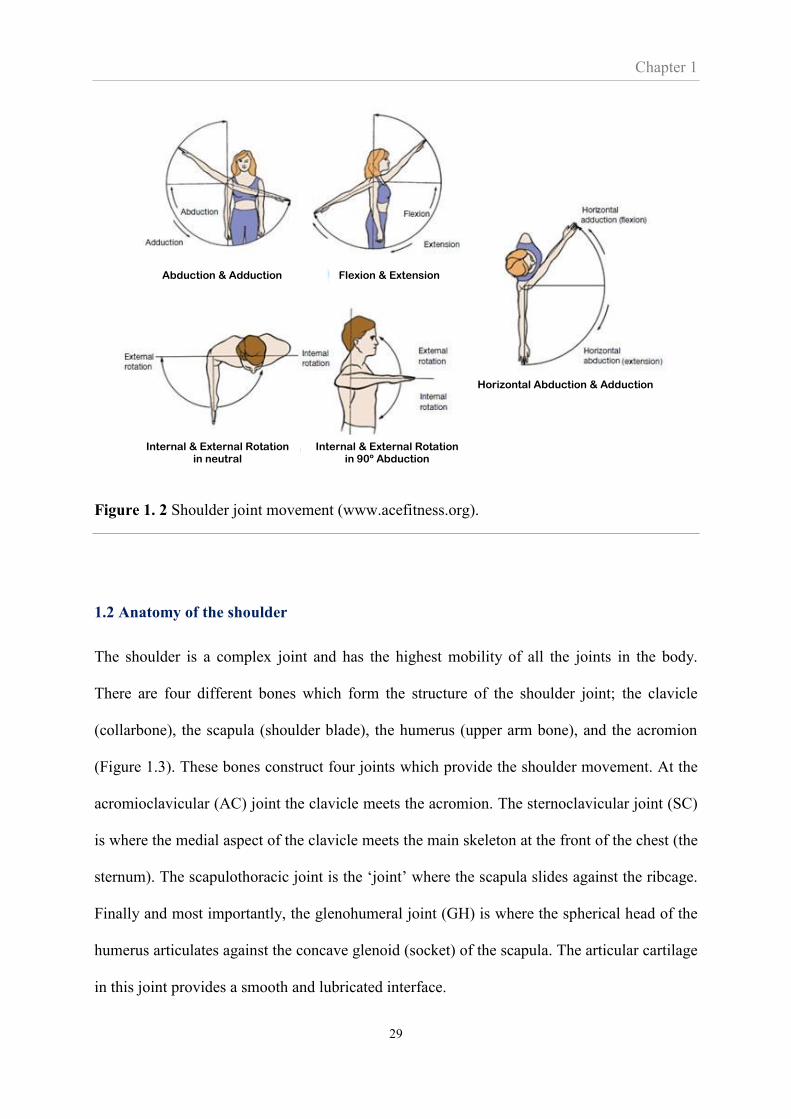
Figure 1. 2 Shoulder joint movement (www.acefitness.org).
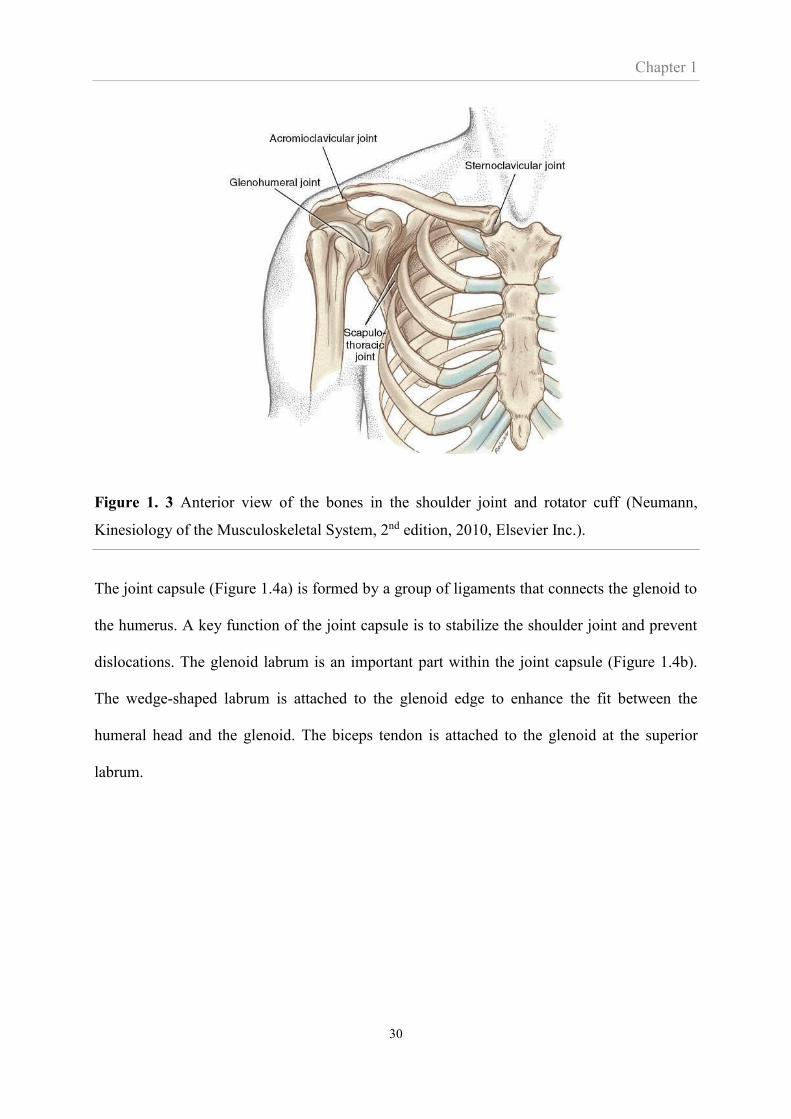
1.2 Anatomy of the shoulder
The shoulder is a complex joint and has the highest mobility of all the joints in the body.
There are four different bones which form the structure of the shoulder joint; the clavicle
(collarbone), the scapula (shoulder blade), the humerus (upper arm bone), and the acromion
(Figure 1.3). These bones construct four joints which provide the shoulder movement. At the
acromioclavicular (AC) joint the clavicle meets the acromion. The sternoclavicular joint (SC)
is where the medial aspect of the clavicle meets the main skeleton at the front of the chest (the
sternum). The scapulothoracic joint is the ‘joint’ where the scapula slides against the ribcage.
Finally and most importantly, the glenohumeral joint (GH) is where the spherical head of the
humerus articulates against the concave glenoid (socket) of the scapula. The articular cartilage
in this joint provides a smooth and lubricated interface.
Abduction & Adduction Flexion & Extension
Internal & External Rotation in 90º Abduction
Horizontal Abduction & Adduction
Internal & External Rotation in neutral
Chapter 1
30
Figure 1. 3 Anterior view of the bones in the shoulder joint and rotator cuff (Neumann,
Kinesiology of the Musculoskeletal System, 2nd edition, 2010, Elsevier Inc.).
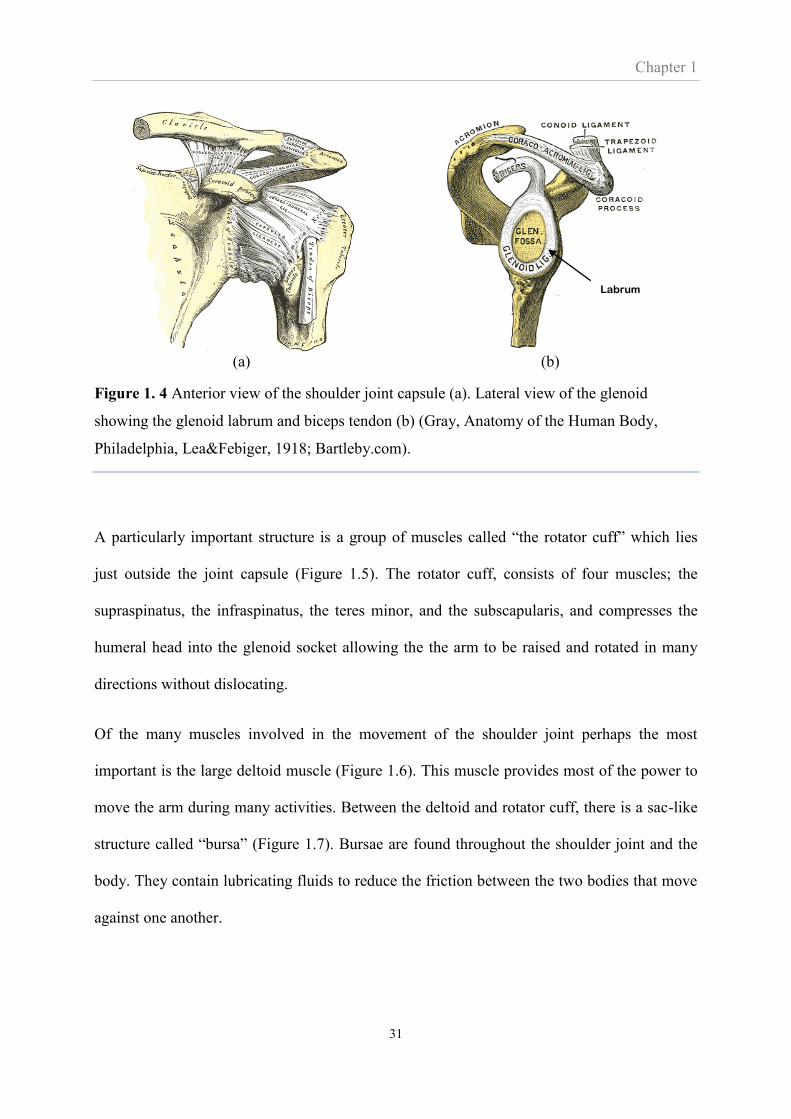
The joint capsule (Figure 1.4a) is formed by a group of ligaments that connects the glenoid to
the humerus. A key function of the joint capsule is to stabilize the shoulder joint and prevent
dislocations. The glenoid labrum is an important part within the joint capsule (Figure 1.4b).
The wedge-shaped labrum is attached to the glenoid edge to enhance the fit between the
humeral head and the glenoid. The biceps tendon is attached to the glenoid at the superior
labrum.
Chapter 1
31
(a) (b)
Figure 1. 4 Anterior view of the shoulder joint capsule (a). Lateral view of the glenoid
showing the glenoid labrum and biceps tendon (b) (Gray, Anatomy of the Human Body,
Philadelphia, Lea&Febiger, 1918; Bartleby.com).
A particularly important structure is a group of muscles called “the rotator cuff” which lies
just outside the joint capsule (Figure 1.5). The rotator cuff, consists of four muscles; the
supraspinatus, the infraspinatus, the teres minor, and the subscapularis, and compresses the
humeral head into the glenoid socket allowing the the arm to be raised and rotated in many
directions without dislocating.
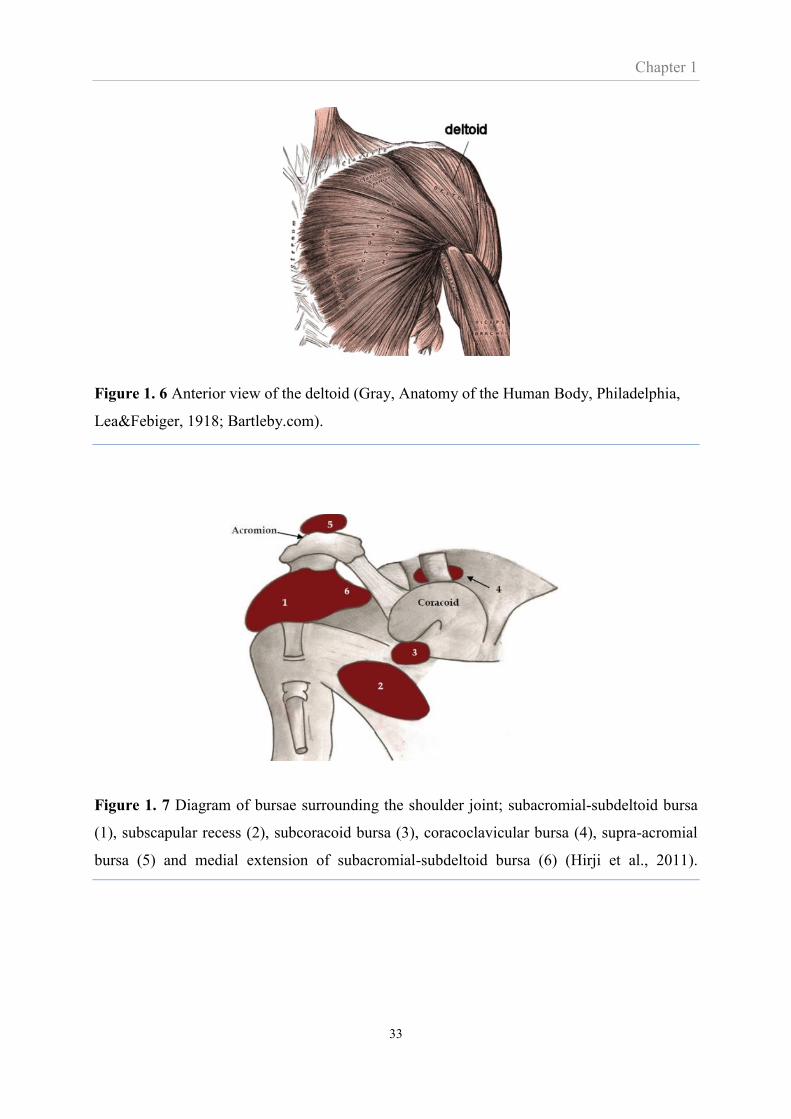
Of the many muscles involved in the movement of the shoulder joint perhaps the most
important is the large deltoid muscle (Figure 1.6). This muscle provides most of the power to
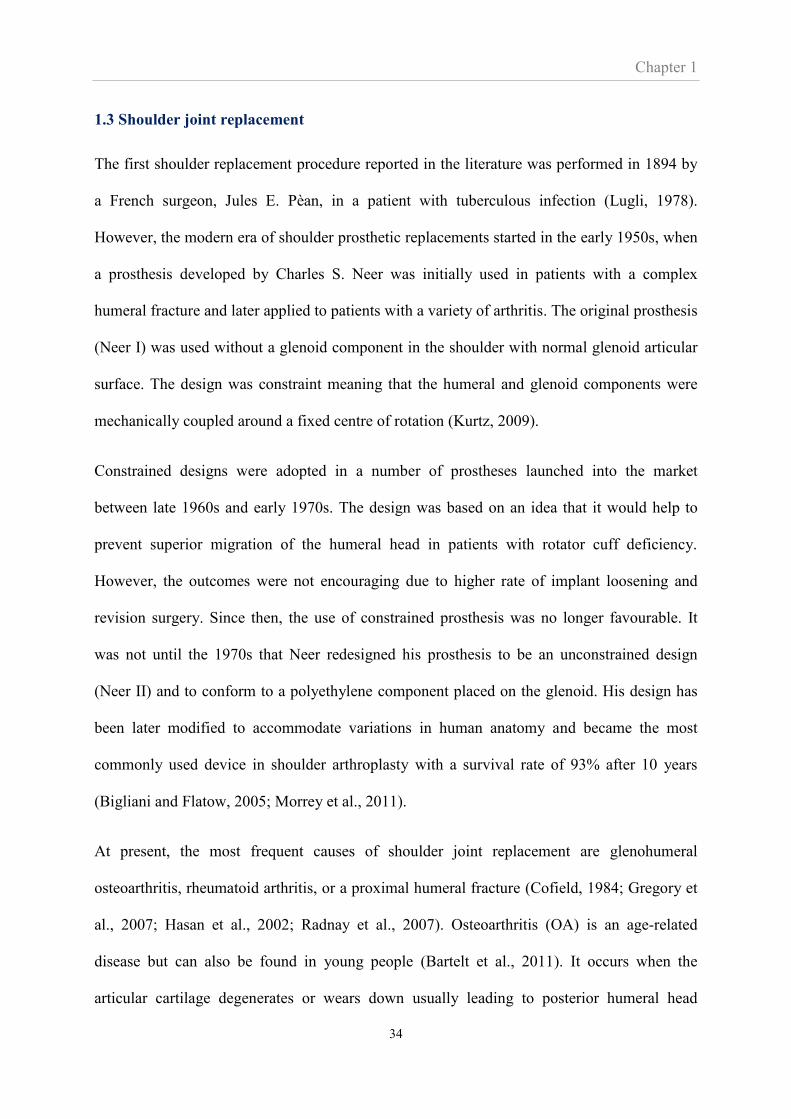
move the arm during many activities. Between the deltoid and rotator cuff, there is a sac-like
structure called “bursa” (Figure 1.7). Bursae are found throughout the shoulder joint and the
body. They contain lubricating fluids to reduce the friction between the two bodies that move
against one another.
Labrum

Chapter 1
32
(a) (b)
(c)
Figure 1. 5 The rotator cuff consisting of four muscles; the supraspinatus, the infraspinatus,
the teres minor, and the subscapularis shown in anterior view (a), posterior view (b), and
lateral view (c) of the glenohumeral joint (www.medscape.com).
Chapter 1
33
Figure 1. 6 Anterior view of the deltoid (Gray, Anatomy of the Human Body, Philadelphia,
Lea&Febiger, 1918; Bartleby.com).
Figure 1. 7 Diagram of bursae surrounding the shoulder joint; subacromial-subdeltoid bursa
(1), subscapular recess (2), subcoracoid bursa (3), coracoclavicular bursa (4), supra-acromial
bursa (5) and medial extension of subacromial-subdeltoid bursa (6) (Hirji et al., 2011).
Chapter 1
34
1.3 Shoulder joint replacement
The first shoulder replacement procedure reported in the literature was performed in 1894 by
a French surgeon, Jules E. Pèan, in a patient with tuberculous infection (Lugli, 1978).
However, the modern era of shoulder prosthetic replacements started in the early 1950s, when
a prosthesis developed by Charles S. Neer was initially used in patients with a complex
humeral fracture and later applied to patients with a variety of arthritis. The original prosthesis
(Neer I) was used without a glenoid component in the shoulder with normal glenoid articular
surface. The design was constraint meaning that the humeral and glenoid components were
mechanically coupled around a fixed centre of rotation (Kurtz, 2009).
Constrained designs were adopted in a number of prostheses launched into the market
between late 1960s and early 1970s. The design was based on an idea that it would help to
prevent superior migration of the humeral head in patients with rotator cuff deficiency.
However, the outcomes were not encouraging due to higher rate of implant loosening and
revision surgery. Since then, the use of constrained prosthesis was no longer favourable. It
was not until the 1970s that Neer redesigned his prosthesis to be an unconstrained design
(Neer II) and to conform to a polyethylene component placed on the glenoid. His design has
been later modified to accommodate variations in human anatomy and became the most
commonly used device in shoulder arthroplasty with a survival rate of 93% after 10 years
(Bigliani and Flatow, 2005; Morrey et al., 2011).
At present, the most frequent causes of shoulder joint replacement are glenohumeral
osteoarthritis, rheumatoid arthritis, or a proximal humeral fracture (Cofield, 1984; Gregory et
al., 2007; Hasan et al., 2002; Radnay et al., 2007). Osteoarthritis (OA) is an age-related
disease but can also be found in young people (Bartelt et al., 2011). It occurs when the
articular cartilage degenerates or wears down usually leading to posterior humeral head

Chapter 1
35
subluxation caused by asymmetric posterior wear (Neer, 1974). Rheumatoid arthritis (RA) is
an autoimmune disease associated with deterioration of the bone and surrounding soft tissues,
often involving rotator cuff tears. Shoulder replacement surgery in such cases is complicated.
In addition, posterior and anterior glenoid wear are found in this type of arthritis (Mullaji et
al., 1994; Strauss et al., 2009).
Shoulder joint replacement is generally performed after unsuccessful treatment by medication
and physical therapy. The indications of the need for shoulder replacement mainly associate
with pain, decreased range of motion, and decreased shoulder function. These indications
must be carefully diagnosed so that an appropriate surgical plan is made. Diagnosing shoulder
problems begins with an assessment of medical history. Patients may be asked about pain
experience and previous treatment. The next important assessment involves physical
examinations, for example, range of motion (ROM), the strength of rotator cuff and deltoid,
and the function of nerves. It is also important to perform imaging tests to examine the
structure inside the joint. The typical imaging test is X-ray radiograph, used for evaluating
bone spur, fracture, and joint space which is associated with the severity of cartilage loss.
Computed tomography (CT) scan may be used if there is any fracture or questionable
pathology that is not clearly seen on the traditional radiograph. In some cases, magnetic
resonance imaging (MRI) is performed for diagnosing problems with soft tissues, especially,
cartilage injury and rotator cuff tear. Blood and joint fluid test are often required to confirm
the diagnosis of particular conditions, such as rheumatoid and infection.
There are several types of shoulder joint replacement; anatomical total shoulder arthroplasty
(TSA) (the replacement of both the humeral head and the glenoid), hemiarthroplasty (the
replacement of only the humeral head), reverse shoulder arthroplasty (RSA) (the replacement
of the humeral head by a socket and the glenoid socket by a half-sphere). The optimal choice
Chapter 1
36
depends on the individual patient case. Hemiarthroplasty and RSA provide improved
functional outcomes for patients with proximal humeral head fracture (Garrigues et al., 2012).
RSA is appropriate for patients with a dysfunctional rotator cuff but a functional deltoid
muscle (Matsen et al., 2007). For the treatment in patients with a functional rotator cuff, TSA
and hemiarthroplasty are appropriate (Gregory et al., 2007). The choice between
hemiantroplasty and TSA remains controversial. A review found hemiarthroplasty to be
superior to TSA when the glenoid surface was normal or severely damaged (Zadeh and
Calvert, 1998). However, in patients with early stage bone erosion of the glenoid TSA
induced better pain relief, greater range of motion, patient satisfaction, and lower revision rate
compared to hemiarthroplasty (Radnay et al., 2007; Skirving, 1999).
A recent report from the national joint registry indicated that, in 2013, approximately 3,900
primary shoulder replacements were performed in the UK, while OA was the main cause of
replacement (58%). RSA was found to be the procedure type mostly performed (35%)
corresponding to a large number of patients with rotator cuff deficiency (23%). In patients
with normal rotator cuff, TSA was found to be the most common procedure (29%) compared
to hemiarthrplasty (19%) and it is this type of replacement which was investigated in this
Thesis.
1.4 Anatomical total shoulder arthroplasty (TSA) – cemented or cementless arthroplasty
The TSA consists of a humeral and a glenoid component. The humeral component is
implanted into the humeral bone and is most often made of cobalt chrome or stainless steel
(Zadeh and Calvert, 1998). All humeral component designs today are modular providing a
greater choice of head radius, height, offset, and version. The designs of humeral component
stem are different, varying from short to long stem length. The glenoid component is placed
Chapter 1
37
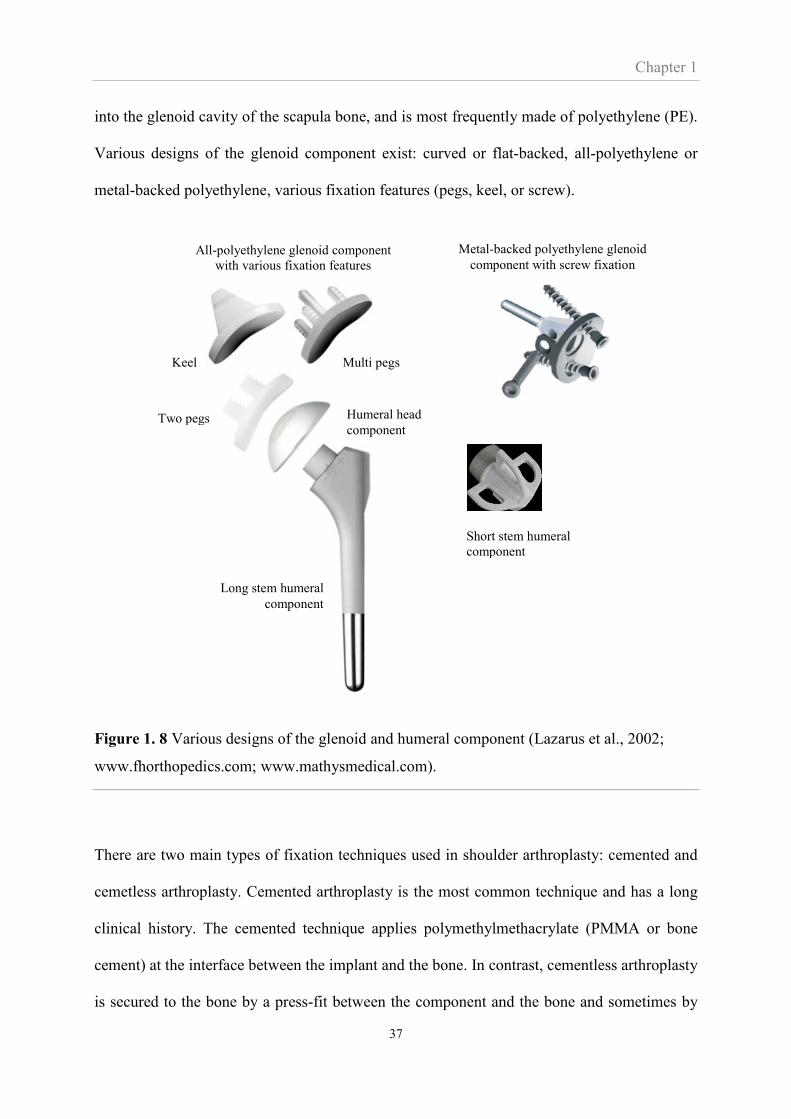
into the glenoid cavity of the scapula bone, and is most frequently made of polyethylene (PE).
Various designs of the glenoid component exist: curved or flat-backed, all-polyethylene or
metal-backed polyethylene, various fixation features (pegs, keel, or screw).
Figure 1. 8 Various designs of the glenoid and humeral component (Lazarus et al., 2002;
www.fhorthopedics.com; www.mathysmedical.com).
There are two main types of fixation techniques used in shoulder arthroplasty: cemented and
cemetless arthroplasty. Cemented arthroplasty is the most common technique and has a long
clinical history. The cemented technique applies polymethylmethacrylate (PMMA or bone
cement) at the interface between the implant and the bone. In contrast, cementless arthroplasty
is secured to the bone by a press-fit between the component and the bone and sometimes by
Short stem humeral
component
Long stem humeral
component
All-polyethylene glenoid component
with various fixation features
Metal-backed polyethylene glenoid
component with screw fixation
Keel
Two pegs
Multi pegs
Humeral head
component
Chapter 1
38
the use of screws. Furthermore, cementless arthroplasty relies on a subsequent biological
response resulting in the bone attaching to the surface of the implant. This secondary fixation
process is called bone ingrowth or osteointegration.
Cemented arthroplasty has a history of relatively good short and mid-term survival. However,
long term revision rates and evidence of high levels of mid-term radiographic loosening are a
cause of concern (Boileau et al., 2002). It has also been reported that bone cement may
degrade to form debris, which could lead to osteolysis and wear at the joint surface (Matsen et
al., 2008). Moreover, the optimal thickness of the cement layer has not yet been confirmed
(Gregory et al., 2007). In addition, fixation with thin cement layer of less than 1 mm. was
found to associate with a lack resistance of fatigue load since stress at the cement mantle
become higher than yield strength (Terrier et al., 2005). These problems have all been
associated with the use of cement. With an increasingly elderly population and an increasing
demand from younger patients the relatively poor long-term performance of cemented
arthroplasty is perceived as a serious problem. Therefore, in the past decades cementless
arthroplasty has received increased attention in the hope that it may provide better long-term
performance.
However, cementless arthroplasty does not have the same long clinical history and, as of yet,
its short-term performance is not as good as cemented arthroplasty. Several studies have
reported poor initial fixation stability and evidence of relatively poor short-term survival
(Boileau et al., 2002; Strauss et al., 2009; Wallace et al., 1999). Furthermore as yet, the bone
ingrowth process, the change of bone-implant interface and long-term results are not fully
understood.
Both fixation types were investigated in this Thesis. Cementless arthroplasty was investigated
because of its promise of eventually delivering better performance both in the short and long

Chapter 1
39
term. Cemented arthroplasty was investigated as it is still the most widely used fixation
technique and it is, as of yet, still the ‘safe’ option.
1.5 Osteointegration in cementless fixation
Osteointegration or bone ingrowth is essential in cementless arthroplasty and its concept was
first described by Branemark in 1950s when living rabbit bone was found to integrate with a
titanium implant (Branemark, 1959). In general, the process of bone ingrowth starts soon after
implantation, when the implant surface structures are invaded by blood cells and the protein
matrix acting as a scaffold is formed (Mavrogenis et al., 2009). By one month post-
implantation, the newly formed bone has a mechanically weak structure (woven bone) but
covers the implant surface, establishing biological stability of the implant (Haga et al., 2009).
At around three months post-implantation most of the woven bone remodels to lamellar bone
which is mechanically strong and has a high degree of mineralization (Mavrogenis et al.,
2009; Ramazanoglu and Oshida, 2011).The complete process of osteointegration can be more
rapid when the degree of porosity and the coating material is optimised (Kienapfel et al.,
1999).
However, osteointegration is unlikely to occur when the relative micromotion between the
implant and host bone is too large. A critical threshold for tolerated micromotion has been
found to lie between 40 and 150 μm (Bragdon et al., 1996; Jasty et al., 1997; Soballe;
Szmukler-Moncler et al., 1998). These tolerated micromotions were evaluated in several
studies, mostly conducted by inserting the implant into animal bone while oscillating the
micromotion a certain amount. Mechanical pull-out test and/or histological analysis was
performed after the animals were sacrificed at a certain time post-implantation. Apart from
micromotion, a gap between the implant surface and the host bone affects osteointegration.
Chapter 1
40
The consequence of an excessive gap includes delayed gap filling, and a reduction in fixation
strength due to insufficient quality of the newly formed bone (Clemens et al., 1997; Dalton et
al., 1995; Kienapfel et al., 1999; Mavrogenis et al., 2009).
1.6 Postoperative follow-up
Postoperative follow-up of arthroplasty patients is important for evaluating the overall status of
the arthroplasty and for predicting the longevity of the implant. The assessment involves the
function of the shoulder and radiographic results. There are several clinical scoring systems for
evaluating shoulder function: the Constant and Murley score, the American Surgeons Elbow and
Shoulder score, or patient self-assessment (Constant and Murley, 1987; Dawson et al., 1999).
They all try to capture pain, range of motion (ROM), strength, and the ability to perform daily
activities. Radiographic assessment, either plain radiographs or computed tomography (CT) is
widely used to evaluate the status of the prostheses and the physical change after surgery, such as
the glenohumeral space, acromion–humeral distance, calcium deposits or ossifications (Merolla,
2013). Progression of radiolucent lines is another main assessment from radiographs and is used
as a measure of implant loosening (radiographic loosening) although there is no consensus for the
definition of a significant degree of radiolucency (Gregory, 2010). There are several protocols
for the assessment of radiolucent lines. The differences among them are the assessment
method: grading or scoring system, and the region of interest. The choice depends on the
glenoid prosthesis type (Franklin et al., 1988; Greiner et al., 2013; Lazarus et al., 2002; Mole et
al., 1999).
1.7 Problems in TSA – reports from clinical studies
TSA is a reasonably successful treatment for patients with primary and secondary
glenohumeral joint degeneration (Bohsali et al., 2006; Ricchetti and Williams Jr, 2011).
Chapter 1
41
However, radiographic loosening and instability of the glenoid component is a common
complication in total shoulder arthroplasty, and has been found to correlate with increased
pain, lack of shoulder function and the need for revision surgery (Strauss et al., 2009). A
study of patient dissatisfaction following shoulder arthroplasty analysed demographic
information, medical history, physical examination, radiograph results, and motion test results
from 136 shoulders (Franta et al., 2007). The findings suggested that pain was the most
common complaint. Component malposition, glenoid loosening, and stiffness were noted as
the commonly occurring technical problems resulting in dissatisfaction following
arthroplasty. (Hasan et al., 2002) investigated a number of patients who were seen for follow-
up during a 5-year period each with complaints following shoulder arthroplasty. Physical tests
and radiographs showed that stiffness, glenoid loosening, and instability were the most
frequent reasons for complaint. Bohsali et al. (2006) carried out a review of TSA related
publications from 1996 to 2005 and reported that the most frequent complication was
component loosening, accounted for approximately 6% of all shoulders underwent TSA, and
that 83% of these were related to the glenoid component. Skirving (1999) stated that the long-
term problems of total shoulder arthroplasty were associated with the glenoid component
more frequently than that with the humeral component. Furthermore it was observed that
loosening was the main indication for revision surgery as it was found in 29 of 48 glenoid
revisions (Antuna et al., 2001). Summarising this section, glenoid component loosening is the
main cause for revision of TSAs.
There are other indications that also contribute to revision after primary TSA. According to
the UK joint registry, the common indications include rotator cuff insufficiency, infection,
and periprosthetic fracture. Rotator cuff insufficiency was estimated to be between 1 and 3%
of all shoulders that underwent TSA. The rupture of subscapularis is a major indication that
Chapter 1
42
links to the postoperative anterior instability. The cause of subscapularis failure is
multifactorial, including the use of oversized humeral head and tendon lengthening (Bigliani
and Flatow, 2005; Bohsali et al., 2006). Infection following TSA was reported in the
literatures between 1% and 4% (Weber et al., 2011). In most cases, infection develops as a
result of immune disorders, such as diabetes, lupus, and rheumatoid arthritis, and the major
presenting symptom is pain. (Bohsali et al., 2006; Van de Sande et al., 2006). Periprosthetic
humeral fracture is estimated to be between 1 and 3% (Kumar et al., 2004; Bohsali et al.,
2006; Franta et al., 2007). The fractures can occur at both intraoperative and postoperative
stage. Intraoperative fractures often occur from errors in surgical technique while the cause of
postoperative fractures is believed to be the increased stress at the tip of humeral stem and
poor bone healing due to the loss of blood supply (Wright and Cofield, 1995; Morrey et al.,
2011). Neutral injury, deltoid weakness, glenoid erosion and arthrosis have been found to
associate with the revision surgery, however the incidence of these complications is relatively
rare (Morrey et al., 2011).
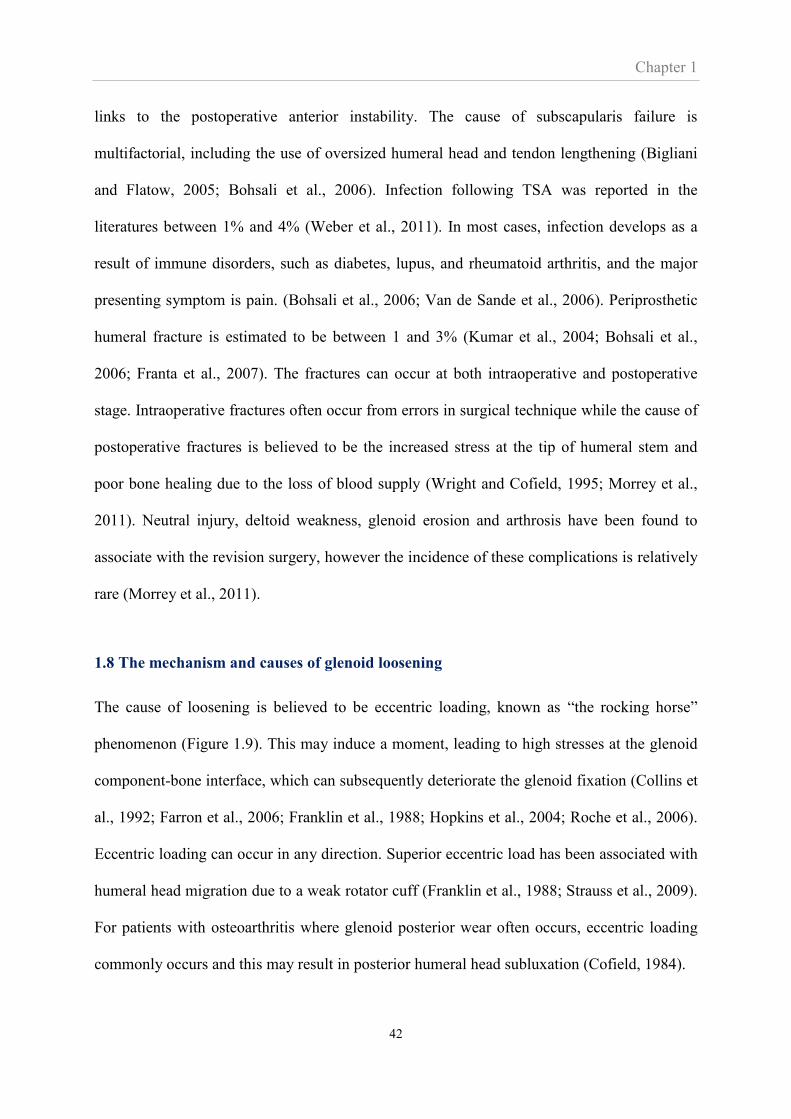
1.8 The mechanism and causes of glenoid loosening
The cause of loosening is believed to be eccentric loading, known as “the rocking horse”
phenomenon (Figure 1.9). This may induce a moment, leading to high stresses at the glenoid
component-bone interface, which can subsequently deteriorate the glenoid fixation (Collins et
al., 1992; Farron et al., 2006; Franklin et al., 1988; Hopkins et al., 2004; Roche et al., 2006).
Eccentric loading can occur in any direction. Superior eccentric load has been associated with
humeral head migration due to a weak rotator cuff (Franklin et al., 1988; Strauss et al., 2009).
For patients with osteoarthritis where glenoid posterior wear often occurs, eccentric loading
commonly occurs and this may result in posterior humeral head subluxation (Cofield, 1984).
Chapter 1
43
Figure 1. 9 Rocking horse phenomenon in the glenohumeral joint (Matsen et al., 2008).
Glenoid loosening involves multiple factors, including, wear debris, infection, immune
response, deficient bone stock or soft tissue, and limitation of glenoid preparation and fixation
(Skirving, 1999; Strauss et al., 2009). In particular, misalignment of the glenoid prosthesis has
been reported to associate with the rocking horse effect, an important cause of loosening and
instability (Hasan et al., 2002; Hopkins et al., 2004). It has also been suggested that
implanting the glenoid in a proper alignment is essential for long-term stability (Strauss et al.,
2009). In a clinical study, Gregory (2010) found that misalignment of the glenoid component
was associated unsatisfactory clinical outcomes including the presence of radiolucent lines
and a limited range of motion. Summarising this section, it is generally accepted that glenoid
component misalignment induces eccentric loading which is the mechanism leading to
glenoid loosening.
1.9 Causes of glenoid component misalignment
Intraoperatively, surgeons have to define the plane of scapula using radiographs, ream the
bone, and orientate the glenoid component. The goal of glenoid position is to place the
Chapter 1
44
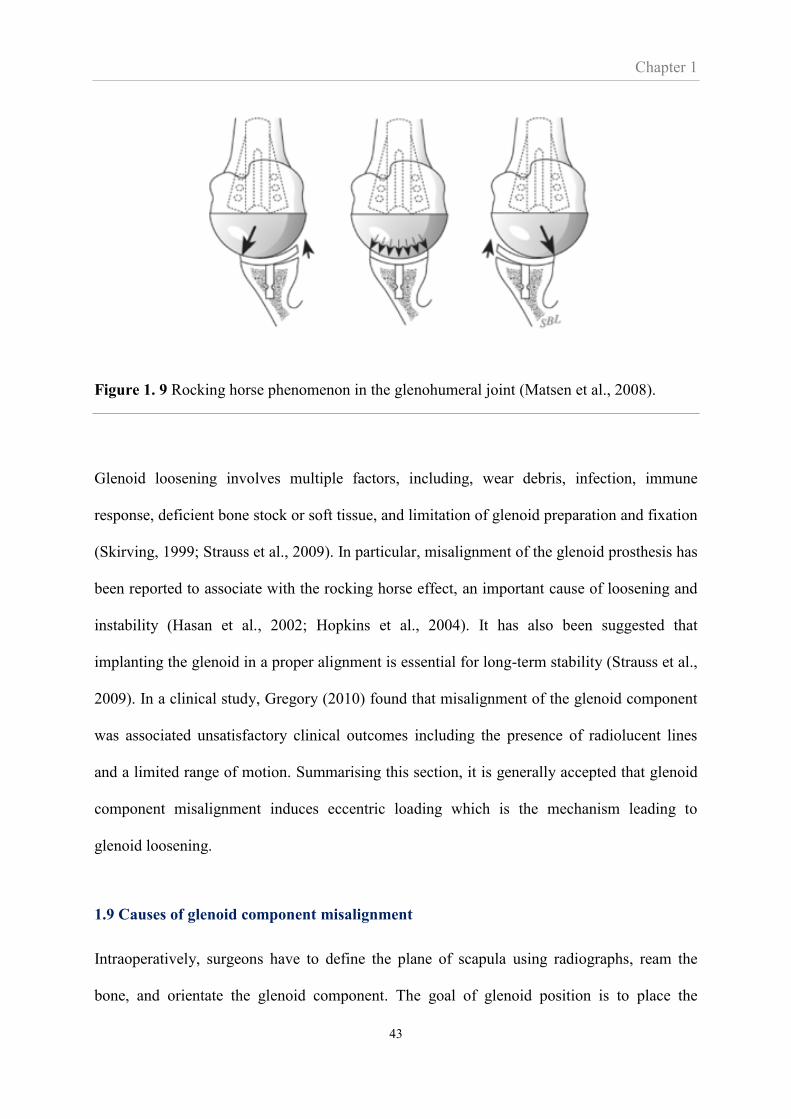
component perpendicular to the plane of scapula, shown in Figure 1.10 (Iannotti et al., 2011).
It is generally accepted that proper placement of glenoid component is complicated and
therefore the accurate positioning of the glenoid component is challenging. Most often, the
glenoid components are found to be placed with misalignment in any orientation (Figure
1.11).
Figure 1. 10 The plane of scapula defined by three anatomic landmarks: the centre of glenoid
fossa, scapula trigonum, and the inferior pole of scapula. Ideal glenoid component position
(neutral alignment) is defined when the component centre is placed at the centre of glenoid
fossa and the component plane is perpendicular to transverse and coronal scapula plane
(Lewis and Armstrong, 2011).
Chapter 1
45
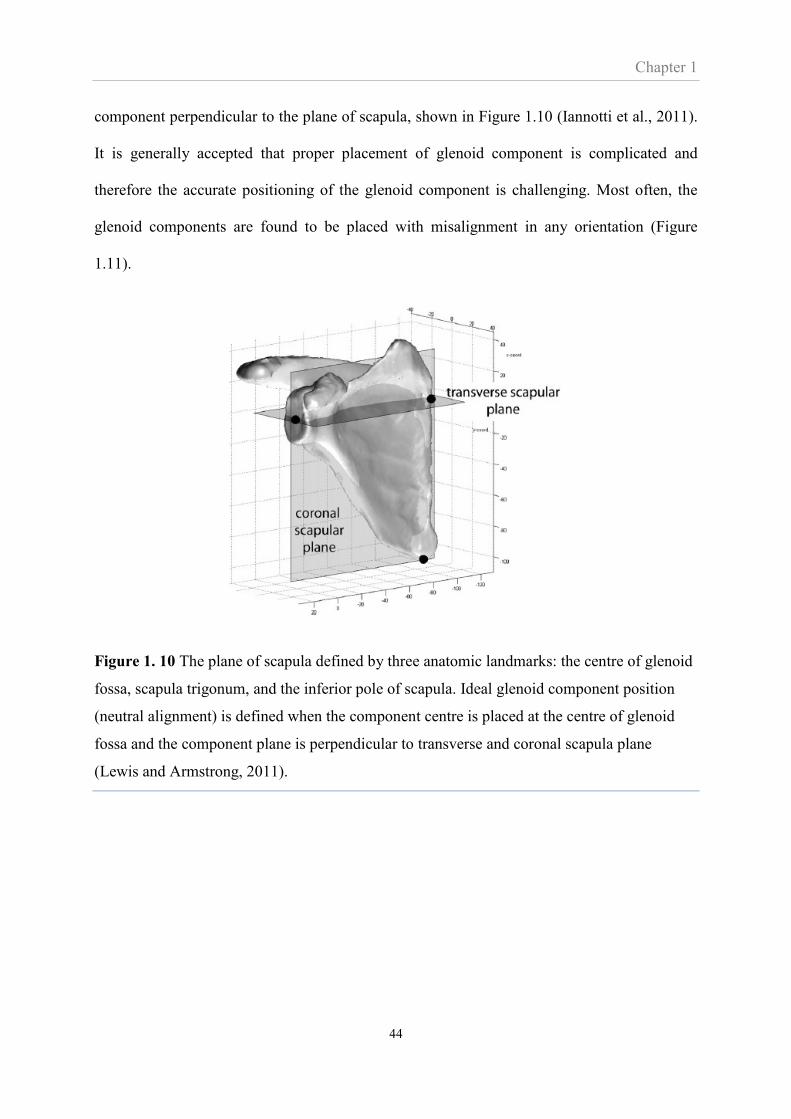
(a) (b)
Figure 1. 11 An example of postoperative orientation of the glenoid component in transverse
scapular plane. The component was neutrally positioned (a). The component was placed with
a few degrees of retroversion, resulting in anterior glenoid wall perforation (2) (Gregory,
2010).
The cause of glenoid misalignment is multifactorial and often relates the lack of bone stock in
the glenoid. The bone stock is often reduced by wear and erosion due to osteoarthritis or
rheumatoid arthritis (Cofield, 1984; Mullaji et al., 1994). The pattern of bone loss commonly
found in patients with arthritis includes central, posterior and anterior glenoid erosion. These
result in a difficulty to obtain an adequate alignment of the glenoid component, especially in a
glenoid with severe erosion since there is only a small bone volume available for fixation
(Gregory, 2010; Skirving, 1999). In case of posterior and anterior bone loss, correction can be
performed by eccentric reaming or bone grafting, however, the precise amount of bone to be
reamed or reconstructed is difficult to estimate (Kircher et al., 2009).
Secondly, it is difficult to determine reliable anatomic landmarks due to the poor exposure of
the shoulder joint during surgery (Ricchetti and Williams Jr, 2011; Skirving, 1999).
Moreover, the surgical landmarks for glenoid orientation, such as, glenoid cavity, coracoids
process, and acromion border (Kircher et al., 2009), have a huge variation in size, version, and

Chapter 1
46
inclination, and are individually unique in anatomical position, since their development is
controlled by independent genes (Churchill et al., 2001; Landau and Hoenecke, 2009). This
variation may lead to difficulty with component implantation (Poon and Ting, 2011). More
importantly, using the identified landmarks may not even ensure the determined orientation is
the proper position for the implant, especially in eroded or naturally retroverted glenoids.
Finally, it is recognised that the experience and ability of the surgeon performing the
procedure correlates with the accurate implant position and, consequently strongly influences
surgical outcome (Skirving, 1999). However to further highlight the challenge of this surgery,
it was noted that glenoid components can be poorly positioned even by very experienced
surgeons especially, when the implants were placed in glenoids with severe deformities
(Iannotti et al., 2011).
Since one of the possible causes of malalignment is poor exposure of the glenoid cavity, some
techniques have been introduced to overcome this limitation. Such techniques aim to assist
surgeons’ placement of the glenoid component into its target position with acceptable
precision. A computer assisted surgical technique providing a real time electromagnetic
tracking system for measurement of the anatomical angle of the glenoid version and
inclination was developed (Nguyen et al., 2007; Nguyen et al., 2009). Compared to traditional
methods (CT-based technique), the tracking system technique enabled glenoid implant
placement closer to the target orientation, however, several limitations such as the extra time
spent during preoperative planning and the system cost were identified.
The clinical application of a computer navigation system was evaluated (Kircher et al., 2009).
A comparison of postoperative results obtained from two groups of patients; those with and
without the navigation system showed that, in the group with the navigation system, glenoid
positioning in terms of retroversion was significantly improved, with higher values of
Chapter 1
47
correction to neutral orientation, compared to the group without use of the navigation system.
However, the validation was carried out in a small patient group and over a short follow-up
period.
In summary of this section, misalignment of the glenoid component is a clinical and common
fact. While methods, such as surgical guides or navigation aids, may be devised to reduce this
misalignment, this has not yet been achieved. Therefore, there is a need to establish whether
misalignment does cause loosening and, if so, to provide an improved understanding and a
foundation on which solutions can be devised.
1.10 Review of previous studies on the effects of glenoid misalignment
Misalignment has been reported to have several effects related to the joint mechanics of the
glenohumeral joint. Although these effects may be interrelated, in the following sections the
effects have been divided into the effects of misalignment on subluxation and impingement,
on joint loads and pressure, and finally on loosening.
1.10.1 The effect of misalignment on subluxation and impingement
Humeral head impingement and translation in the inferior-superior direction is a reported
undesirable outcome in shoulder arthroplasty. Favre et al (2008) developed a rigid 3D model
of the glenoid and humeral components to enable a study of the effects of component
alignment on humeral head impingement while inclination and version of the glenoid
component were varied. The angle of inferior and superior impingement during glenohumeral
elevation and lateral impingement during glenohumeral axial rotation were determined. It was
found that implant positioning correlated with impingement, particularly inclination which
may lead to subacromial impingement.
Chapter 1
48
Oosterom et al. (2004) investigated the relationship between humeral head migration and
glenoid inclination. Their experimental study was conducted on bone substitutes where
glenoid components were implanted with varied inclination angles. A constant compression
force, and a cyclic and superior directed subluxation force, simulating arm abduction were
applied. After 200,000 load cycles, superior and inferior glenoid component rim-
displacements were measured (Figure 1.12). It was reported that increasing glenoid
component inclination led to the increase of superior and inferior rim-displacement.
According to this study, they suggested that glenoid component tilting and humeral head
subluxation could be improved by decreasing the glenoid component inclination angle.
Figure 1. 12 Diagram representing a study of Oosterom et al.. A resultant force, 𝐹, is a
combination of the compression and subluxation load. Superior and inferior glenoid rim-
displacements are measured in medial direction, shown as 𝑑𝑠 and 𝑑𝑖, respectively. 1: Glenoid
component; 2: cement layer; 3: bone substitute; 4: clamping plate (Oosterom et al., 2004).
The effect of glenoid component inclination on humeral head translation was also investigated
by Wong et al. (2003). Their experiments were undertaken on cadaveric specimens, where the
capsule was completely disrupted. Soft tissue was removed, leaving the labrum and insertion
Chapter 1
49
site of the rotator cuff tendon at the humeral head intact. The rotator cuff tendons were
secured to ropes that were oriented according to the muscle line of action and pulled by
hanging weights to simulate rotator cuff forces. The specimens were implanted with glenoid
components. The inclination angles were varied from 0o to 15o superiorly, measured
according to scapula landmarks. While the rotator cuff forces were applied, the force required
to produce superior humeral head migration was measured. The findings suggested that
glenoid inclination is an important factor in determining the force required for superior
humeral head migration and the more upward facing the glenoid, the greater the risk of
superior humeral head translation. Moorman et al. (1994) reported that, in addition to superior
subluxation, the most common postoperative instability, anterior and posterior subluxation
were also identified. These were possibly caused by excessive version of the glenoid
component.
1.10.2. The effect of misalignment on joint loads and contact parameters
Instability and loosening due to anteroposteriorly misaligned implants were explained by
Nyffeler et al. (2006). Their experiments were undertaken on six cadaveric specimens with no
pathology, implanted with both glenoid and humeral head components and subjected to
rotator cuff and deltoid loading. Compressive and shear force were measured with strain
gauges, attached to the glenoid component. Glenoid component version was varied from
neutral orientation to anteversion, and finally retroversion. It was shown that changing
glenoid component version resulted in eccentric loading, humeral head displacement, and
joint reaction force alteration. They also suggest that these changes may contribute to
instability and loosening of the total shoulder replacement and the authors proposed that
neutral version was the best alignment since it centred the distribution of forces.
Chapter 1
50
An experimental study on the effects of glenoid misalignment, emphasising retroversion, on
stability and loosening was conducted by Shapiro et al. (2007). Eight cadaveric shoulders
were examined before and following implantation with neutral and retroverted glenoid
components. These specimens, with the rotator cuff, deltoid, pectoralis major and latissimus
dorsi loaded, were tested at several angles of humeral flexion. Joint contact pressure, contact
areas, and glenohumeral forces were measured using pressure films and load cells. The results
showed that retroversion decreased the contact area, increased the joint contact pressures and
reduced inferior and posterior glenohumeral joint forces. This study suggested that glenoid
component retroversion may lead to eccentric loading which could cause further wear and
loosening.
1.10.3. Biomechanical studies: effect of misalignment on fixation failure and loosening
The findings from the finite element by Farron et al. (2006) were consistent with the
experimental results by Shapiro et al. (2007). Faron et al. used 3D FE models of the scapula,
humeral head, total shoulder prosthesis, and three main rotator cuff muscles; supraspinatus,
infraspinatus, and subscapulais. A glenoid implant was added to each model with different
angles of retroversion, from 0o to 20o. The magnitude of forces applied on the model
represented the muscle forces of the glenohumeral joint during rotation. The effects of glenoid
component retroversion on the risk of loosening during external and internal rotation in
neutral were evaluated. The results indicated that retroversion induced a posterior
displacement of glenohumeral contact point, increased stress in the cement mantle and
glenoid bone and increased micromotion at the bone-cement interface.
Cement mantle failure was predicted to be consequence of a misaligned implant (Hopkins et
al., 2004). Hopkins et al. studied the effect of glenoid component alignment on the stress in
cement mantle. FE analyses of the scapula model with five different glenoid component
Chapter 1
51
alignments, including centrally aligned within the glenoid vault, anteverted, retroverted,
superior inclined, and inferior inclined, were performed while muscle loading of abduction
was applied. The possibility of cement mantle failure was predicted through the percentage of
the cement mantle volume that exceeded 95% of tensile stress. The results suggested that,
during abduction loading, the centrally aligned implant had the lowest potential for cement
mantle failure and the retroverted implant the highest.
Hasan et al. (2002) observed a number of patients during a 5-year follow-up with complaints
related to postoperative arthroplasty and found that component malposition and shoulder
instability, identified by examination and radiographic evidence, were highly correlated.
Misalignment in cementless glenoids was investigated by Suarez (2010). The effects of
inclination and version, with reference to the scapula plane, on micromotion were investigated
via FE analysis. This study also considered the effects of implantation depths on micromotion
and the difference of micromotion between healthy and rheumatoid bone. To simulate
rheumatoid bone properties, 10% of Young’s modulus of the healthy bone was applied. The
results indicated that misalignment strongly affected micromotion in the glenoid with deeper
depth. Anteversion and inferior inclination were the most appropriate positions, leading to the
smallest micromotion. In addition, micromotion in rheumatoid bone was larger than in the
healthy bone.
1.11 Summary: Gaps in knowledge of the effect of misalignment on loosening
Sections 1.7 and 1.8 described that several complications of shoulder arthroplasties result in
patient dissatisfaction and revision surgery and that the main cause is loosening of the glenoid
component. Sections 1.9 described that, clinically, glenoid component misalignment is
associated with glenoid loosening and that it is difficult to solve this issue since perfect
Chapter 1
52
alignment is difficult to achieve. However, the clinical studies that suggested that there is an
association between misalignment and loosening that includes many compounding factors and
it is difficult to be certain about the association, or, even if there was an association, if it was a
causal link between misalignment and loosening. The parameters are much easier to control in
biomechanical studies and these were reviewed in Section 1.10.3. These studies were all
computational studies involving many assumptions. Such studies typically provide
information on the stresses at the fixation but do not actually demonstrate failure.
As mentioned in Section 1.4 cemented arthroplasty is the most common type of fixation while
cementless arthroplasty holds great promise and both will be investigated in this Thesis. As
mentioned in Section 1.10.3 only the work by Suarez et al. (2010) addressed the effect of
misalignment on loosening in cementless arthroplasty and that was essentially a purely
computational study.
In regards to cementless arthroplasty Suarez et al. (2010) did include an experiment using
LVDTs to measure the micromotion that is associated with loosening of cementless
arthroplasties. However, they did in effect show that LVDTs are not an appropriate method
for measuring micromotion for the glenoid component application. LVDT measurements
were limited to normal-to-interface micromotions and not able to separate real micromotions
from bone deformation.
Therefore, this Thesis will fill all these gaps. The thesis includes a biomechanical, in-vitro
study of both cemented and cementless arthroplasty. Associated parameters are easy to
control and mechanical failure will be directly observed and experimentally measured, as
opposed to computationally predicted. This lack of a technology for measuring micromotion
around the cementless glenoid component is another gap that this Thesis will try to fill.

Chapter 1
53
1.12 Scope of PhD and outline of the Thesis
This Thesis was principally motivated by the work by Gregory (2010) who showed what
appeared to be an association between misalignment and loosening. Clinical studies such as
that by Gregory are difficult to interpret as there are many compounding factors. Therefore,
this Thesis, using a biomechanical approach where parameters are easier to control, was
intended to investigate the hypothesis that misalignment causes loosening.
While the work by Gregory and most other works are focussed on cemented shoulder
arthroplasty it was decided that this Thesis would investigate the effect of misalignment on
both cemented and cementless arthroplasty. The reason was that cemented shoulder
arthroplasty has a relatively poor long-term outcome while there is increasing demand for
implants with good long-term performance. Cementless arthroplasty may offer the solution.
With the intention of investigating cementless fixation came the need for a methodology for
measuring micromotion of the bone-implant interface. Reviewing previous methodologies it
was apparent that a novel methodology needed to be developed as part of the Thesis. This
methodology will be described as the DVC-CT technique and provides the ability to
measure full-field micromotion across the entire implant surface. It became clear that DVC-
CT may have application well beyond glenoid micromotion and that it provides data that no
other method offers. Thus, the development of this technique was key part of this Thesis.
This Thesis structure is as follows:
In Chapter 2 the methodologies used in the Thesis will be described in detail.
Chapters 3 to 5 investigate the effect of misalignment on cementless TSA.
- In Chapter 3 the development and validation of the DVC-CT technique for
measuring micromotion is presented.

Chapter 1
54
- In Chapter 4 the DVC-CT method is used to investigate the effect of
misalignment on cementless TSA. The finite element method for this investigation
is also validated as part of this chapter.
- The work of Chapter 4 was complicated by an issue of implant seating and also by
the use of porcine bone. To avoid these issues the validated finite element method
was used in Chapter 5 to investigate the effect of misalignment on cementless TSA
in human bone.
Chapter 6 investigates the effect of misalignment on cemented TSA
Chapter 7 discusses and concludes on the findings of the study while Chapter 8
outlines further work.

Chapter 2
55
CHAPTER 2
Methodology and related parameters
Outline of Chapter 2
This chapter describes the two methodologies adopted in this thesis for evaluating interface
micromotion. The first method involves an experimental technique and is centred around a
novel use of Digital Volume Correlation in combination with micro-computed tomography
for measuring micromotion. The second method involves the computational methodology of
finite element modelling.
These methodologies are also described in the later chapters where they are applied to
investigate various research questions (Chapters 3 to 5). Those chapters are written in a self-
contained manner to enable a more focussed message in those chapters. As such the
descriptions of the methodologies are very brief and many details omitted. This chapter is
intended to fill this gap by explaining the methodologies from ‘scratch’ and including all, or
at least most, details.
A third methodology used in this thesis involves cyclic testing and evaluation of radiolucent
lines from CT scans. This methodology is only used in Chapter 6 and is described in a self-
contained manner within that Chapter.
Chapter 2
56
2.1 Experimental technique for measuring micromotion
2.1.1 Introduction of digital volume correlation
Digital volume correlation (DVC) is a non-invasive technique that has been widely used for
analysing the mechanical behaviour of materials, particularly displacements and strain. In
concept the technique is similar to the widespread digital image correlation (DIC) technique,
only it uses 3-dimensional (3D) volume images instead of 2-dimensional photographs used by
DIC. The volume images can be obtained from various tomography sources such as X-ray
computed tomography (CT), synchrotron tomography, magnetic resonance image (MRI),
optical coherence tomography (OCT), and confocal microscopy (Forsberg et al., 2008; Franck
et al., 2007; Maire and Withers, 2014; Nahas et al., 2013). Similar to DIC, the DVC technique
requires at least two images; one image of the unloaded or reference specimen and further
images of the loaded specimen. The advantage of DVC over DIC is the ability to measure the
internal displacement and strain fields of a structure of interest.
DVC has been used in various applications including the study of wood, granular and
composite materials (Forsberg et al., 2008; Pierron et al., 2013; Sjodahl et al., 2012). The
technique was introduced to the scientific field by Bay et al. who used DVC for evaluating the
displacement field of trabecula bone (Bay et al., 1999) and has since been used by many
authors for this purpose (Bremand et al., 2008; Gillard et al., 2014; Hussein et al., 2012;
Jirousek et al., 2011; Liu and Morgan, 2007; Roberts et al., 2014; Smith and Bay, 2001). Most
of these works investigated bone deformation in response to compression. To the author’s
knowledge, there have been no studies using DVC to investigate micromotion at the bone-
implant interface.
The DVC commercial software Davis 8.1.6 (LaVision GmbH, Goettingen, Germany) was
used in this study. The software algorithm is described in Figure 2.1. The computation starts
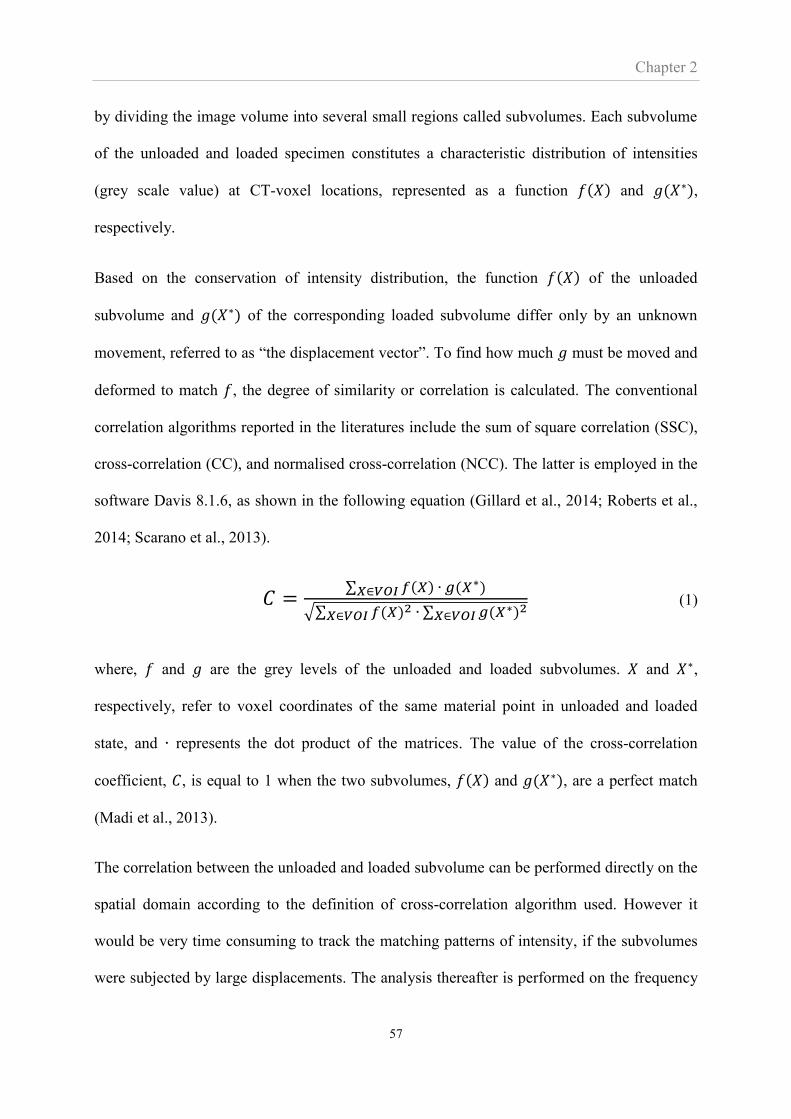
Chapter 2
57
by dividing the image volume into several small regions called subvolumes. Each subvolume
of the unloaded and loaded specimen constitutes a characteristic distribution of intensities
(grey scale value) at CT-voxel locations, represented as a function 𝑓(𝑋) and 𝑔(𝑋∗),
respectively.
Based on the conservation of intensity distribution, the function 𝑓(𝑋) of the unloaded
subvolume and 𝑔(𝑋∗) of the corresponding loaded subvolume differ only by an unknown
movement, referred to as “the displacement vector”. To find how much 𝑔 must be moved and
deformed to match 𝑓, the degree of similarity or correlation is calculated. The conventional
correlation algorithms reported in the literatures include the sum of square correlation (SSC),
cross-correlation (CC), and normalised cross-correlation (NCC). The latter is employed in the
software Davis 8.1.6, as shown in the following equation (Gillard et al., 2014; Roberts et al.,
2014; Scarano et al., 2013).
𝐶 =∑ 𝑓(𝑋) ∙ 𝑔(𝑋∗)𝑋∈𝑉𝑂𝐼
√∑ 𝑓(𝑋)2𝑋∈𝑉𝑂𝐼 ∙ ∑ 𝑔(𝑋∗)2
𝑋∈𝑉𝑂𝐼 (1)
where, 𝑓 and 𝑔 are the grey levels of the unloaded and loaded subvolumes. 𝑋 and 𝑋∗,
respectively, refer to voxel coordinates of the same material point in unloaded and loaded
state, and ∙ represents the dot product of the matrices. The value of the cross-correlation
coefficient, 𝐶, is equal to 1 when the two subvolumes, 𝑓(𝑋) and 𝑔(𝑋∗), are a perfect match
(Madi et al., 2013).
The correlation between the unloaded and loaded subvolume can be performed directly on the
spatial domain according to the definition of cross-correlation algorithm used. However it
would be very time consuming to track the matching patterns of intensity, if the subvolumes
were subjected by large displacements. The analysis thereafter is performed on the frequency
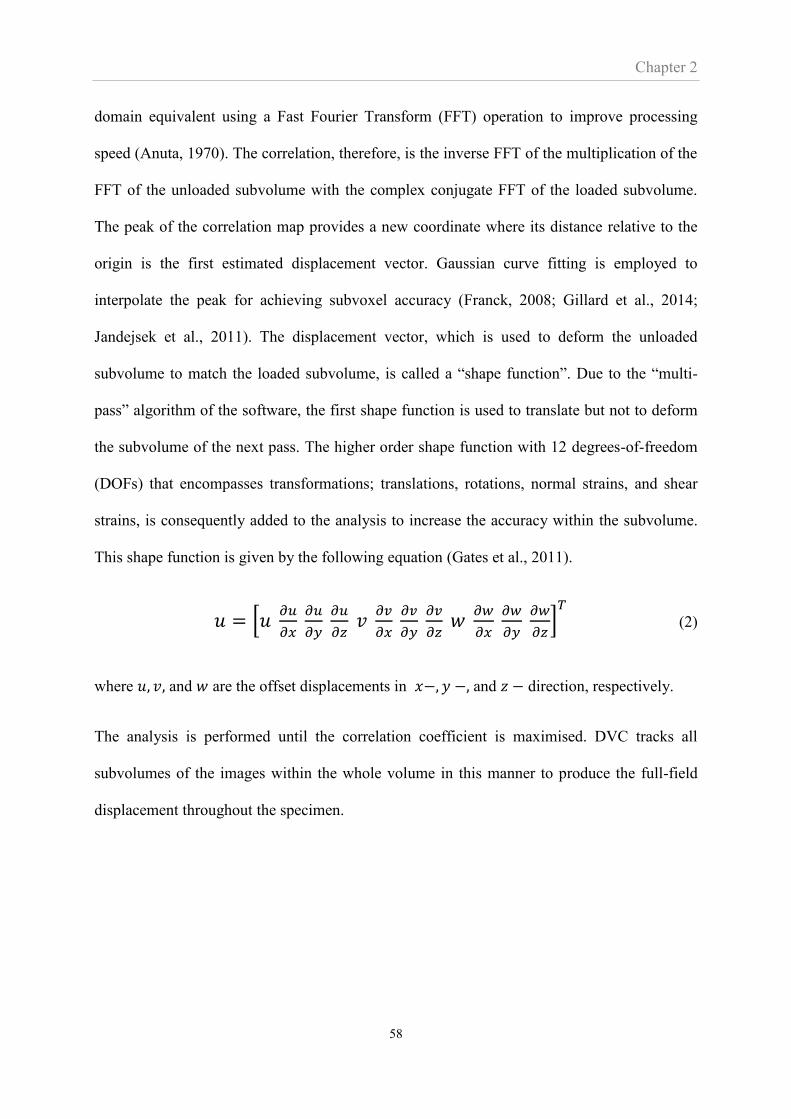
Chapter 2
58
domain equivalent using a Fast Fourier Transform (FFT) operation to improve processing
speed (Anuta, 1970). The correlation, therefore, is the inverse FFT of the multiplication of the
FFT of the unloaded subvolume with the complex conjugate FFT of the loaded subvolume.
The peak of the correlation map provides a new coordinate where its distance relative to the
origin is the first estimated displacement vector. Gaussian curve fitting is employed to
interpolate the peak for achieving subvoxel accuracy (Franck, 2008; Gillard et al., 2014;
Jandejsek et al., 2011). The displacement vector, which is used to deform the unloaded
subvolume to match the loaded subvolume, is called a “shape function”. Due to the “multi-
pass” algorithm of the software, the first shape function is used to translate but not to deform
the subvolume of the next pass. The higher order shape function with 12 degrees-of-freedom
(DOFs) that encompasses transformations; translations, rotations, normal strains, and shear
strains, is consequently added to the analysis to increase the accuracy within the subvolume.
This shape function is given by the following equation (Gates et al., 2011).
𝑢 = [𝑢 𝜕𝑢
𝜕𝑥 𝜕𝑢
𝜕𝑦 𝜕𝑢
𝜕𝑧 𝑣
𝜕𝑣
𝜕𝑥
𝜕𝑣
𝜕𝑦 𝜕𝑣
𝜕𝑧 𝑤
𝜕𝑤
𝜕𝑥 𝜕𝑤
𝜕𝑦 𝜕𝑤
𝜕𝑧]
𝑇
(2)
where 𝑢, 𝑣, and 𝑤 are the offset displacements in 𝑥−, 𝑦 −, and 𝑧 − direction, respectively.
The analysis is performed until the correlation coefficient is maximised. DVC tracks all
subvolumes of the images within the whole volume in this manner to produce the full-field
displacement throughout the specimen.

Chapter 2
59
.
Figure 2. 1 Concept of the mathematical algorithm used by the DVC methodology.
Reference volume f (X) Deformed volume g(X*)
FFT(f) FFT(g)
Cross-correlation = IFFT(FFT(f) •FFT(g))
The subvolumes are
correlated independently
The correlation performed in
frequency domain using FFT
operation
Displacement vector
dx
dy
x- displacement (voxel)
y-
dis
pla
cem
ent
(vo
xel
)
-2 -1 0 1 2
-2
-
1
0
1
2
An example of correlation map
shown in 2D.
The location of the peak value is
an estimated displacement
vector.
The functions are
converted into frequency
domain using FFT
Inverse FFT to create
the correlation map
in spatial domain
Subvolume of the next pass is
translated to the matching location
Shape function with 12 DOFs is
employed to maximise the correlation
coefficient
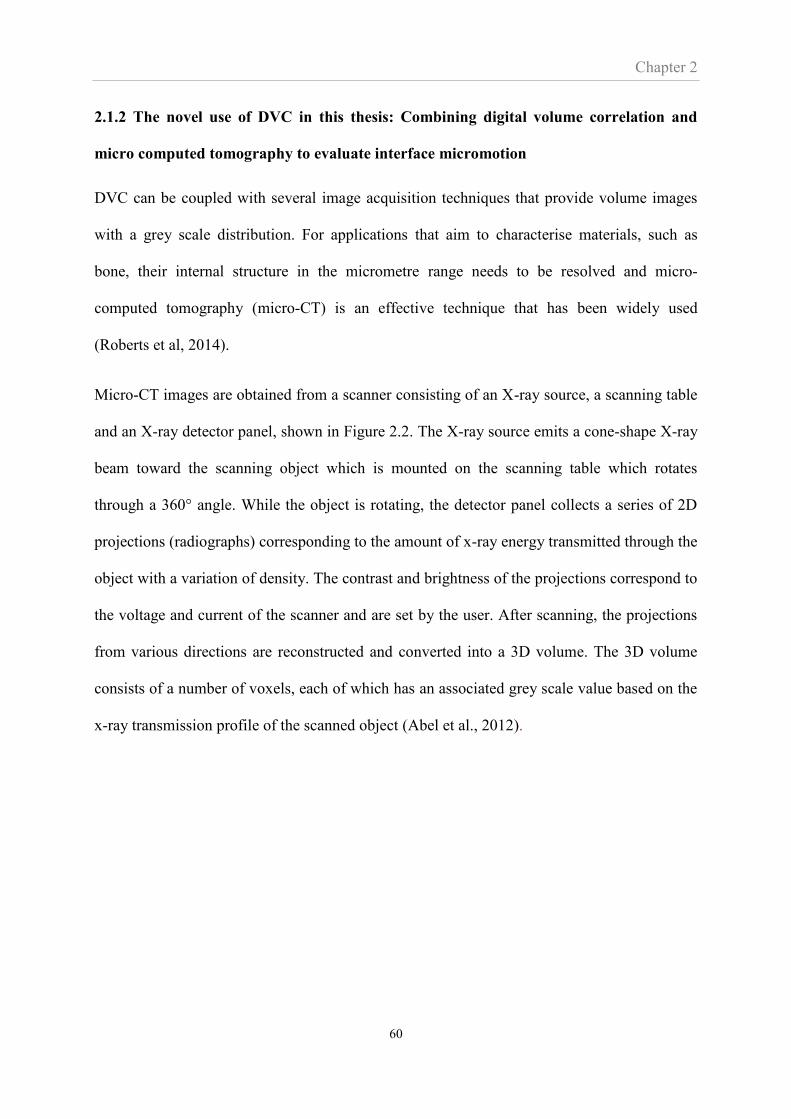
Chapter 2
60
2.1.2 The novel use of DVC in this thesis: Combining digital volume correlation and
micro computed tomography to evaluate interface micromotion
DVC can be coupled with several image acquisition techniques that provide volume images
with a grey scale distribution. For applications that aim to characterise materials, such as
bone, their internal structure in the micrometre range needs to be resolved and micro-
computed tomography (micro-CT) is an effective technique that has been widely used
(Roberts et al, 2014).
Micro-CT images are obtained from a scanner consisting of an X-ray source, a scanning table
and an X-ray detector panel, shown in Figure 2.2. The X-ray source emits a cone-shape X-ray
beam toward the scanning object which is mounted on the scanning table which rotates
through a 360° angle. While the object is rotating, the detector panel collects a series of 2D
projections (radiographs) corresponding to the amount of x-ray energy transmitted through the
object with a variation of density. The contrast and brightness of the projections correspond to
the voltage and current of the scanner and are set by the user. After scanning, the projections
from various directions are reconstructed and converted into a 3D volume. The 3D volume
consists of a number of voxels, each of which has an associated grey scale value based on the
x-ray transmission profile of the scanned object (Abel et al., 2012).
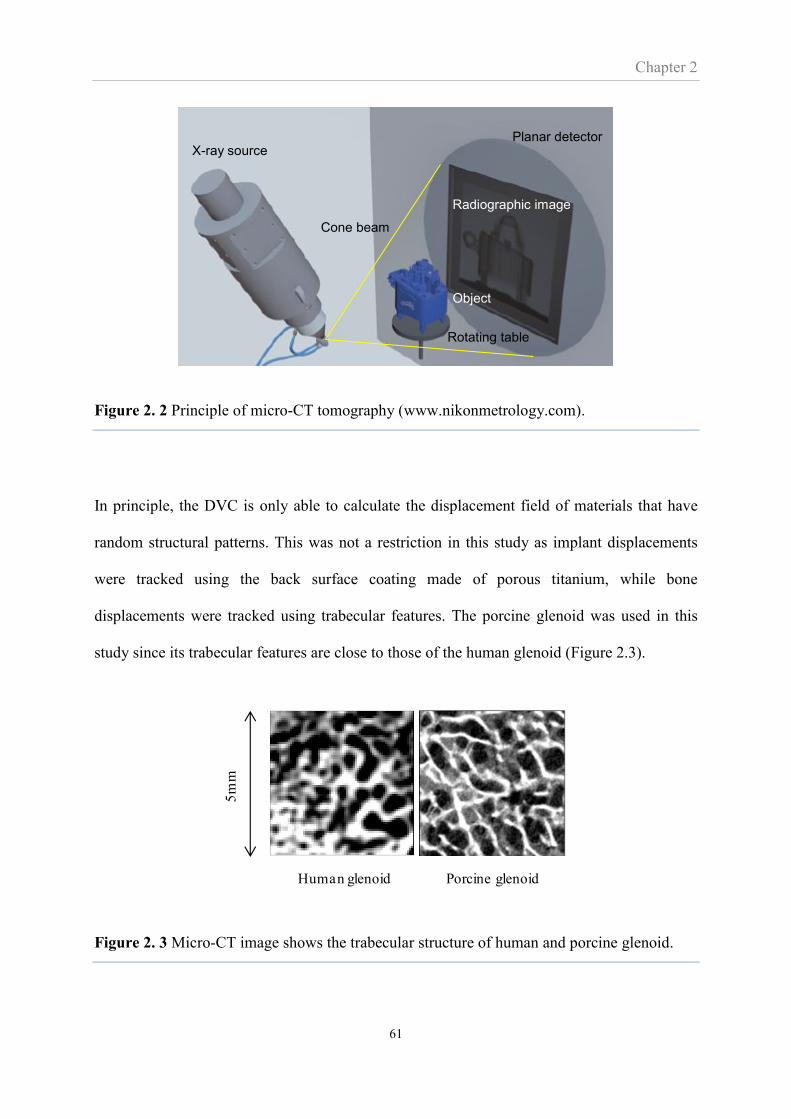
Chapter 2
61
Figure 2. 2 Principle of micro-CT tomography (www.nikonmetrology.com).
In principle, the DVC is only able to calculate the displacement field of materials that have
random structural patterns. This was not a restriction in this study as implant displacements
were tracked using the back surface coating made of porous titanium, while bone
displacements were tracked using trabecular features. The porcine glenoid was used in this
study since its trabecular features are close to those of the human glenoid (Figure 2.3).
Figure 2. 3 Micro-CT image shows the trabecular structure of human and porcine glenoid.
Human glenoid Porcine glenoid
5m
m
X-ray source
Radiographic image
Planar detector
Cone beam
Object
Rotating table
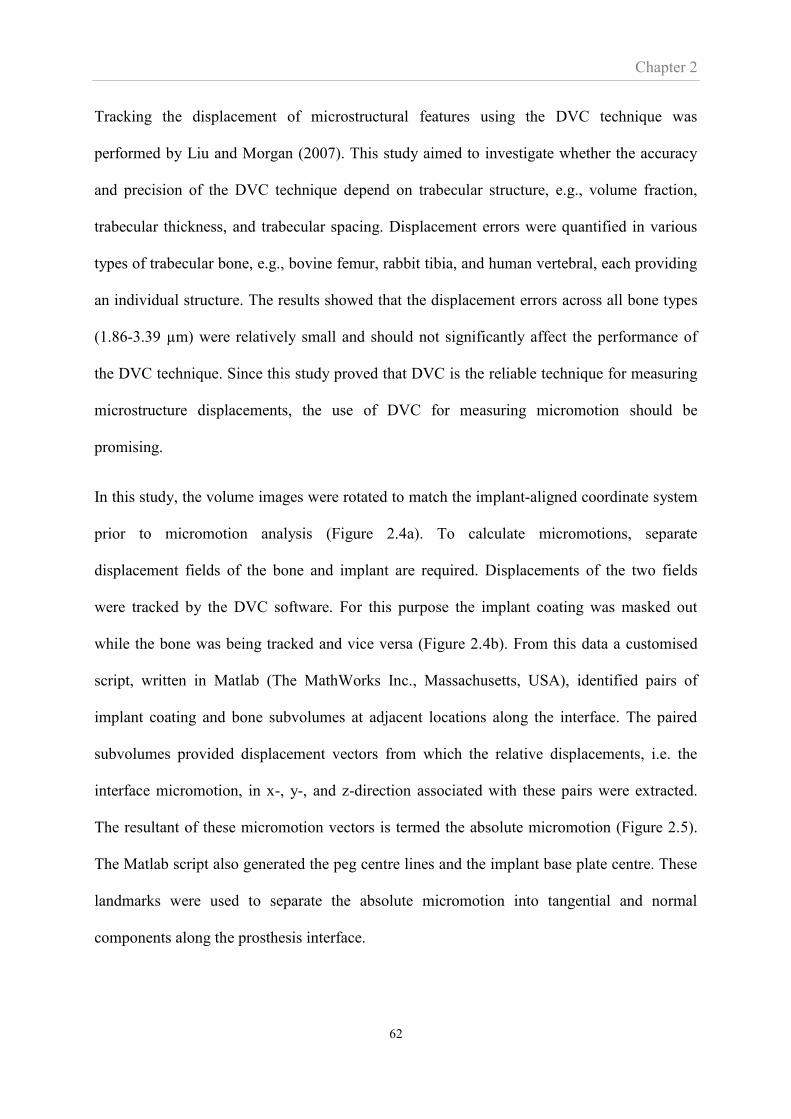
Chapter 2
62
Tracking the displacement of microstructural features using the DVC technique was
performed by Liu and Morgan (2007). This study aimed to investigate whether the accuracy
and precision of the DVC technique depend on trabecular structure, e.g., volume fraction,
trabecular thickness, and trabecular spacing. Displacement errors were quantified in various
types of trabecular bone, e.g., bovine femur, rabbit tibia, and human vertebral, each providing
an individual structure. The results showed that the displacement errors across all bone types
(1.86-3.39 µm) were relatively small and should not significantly affect the performance of
the DVC technique. Since this study proved that DVC is the reliable technique for measuring
microstructure displacements, the use of DVC for measuring micromotion should be
promising.
In this study, the volume images were rotated to match the implant-aligned coordinate system
prior to micromotion analysis (Figure 2.4a). To calculate micromotions, separate
displacement fields of the bone and implant are required. Displacements of the two fields
were tracked by the DVC software. For this purpose the implant coating was masked out
while the bone was being tracked and vice versa (Figure 2.4b). From this data a customised
script, written in Matlab (The MathWorks Inc., Massachusetts, USA), identified pairs of
implant coating and bone subvolumes at adjacent locations along the interface. The paired
subvolumes provided displacement vectors from which the relative displacements, i.e. the
interface micromotion, in x-, y-, and z-direction associated with these pairs were extracted.
The resultant of these micromotion vectors is termed the absolute micromotion (Figure 2.5).
The Matlab script also generated the peg centre lines and the implant base plate centre. These
landmarks were used to separate the absolute micromotion into tangential and normal
components along the prosthesis interface.
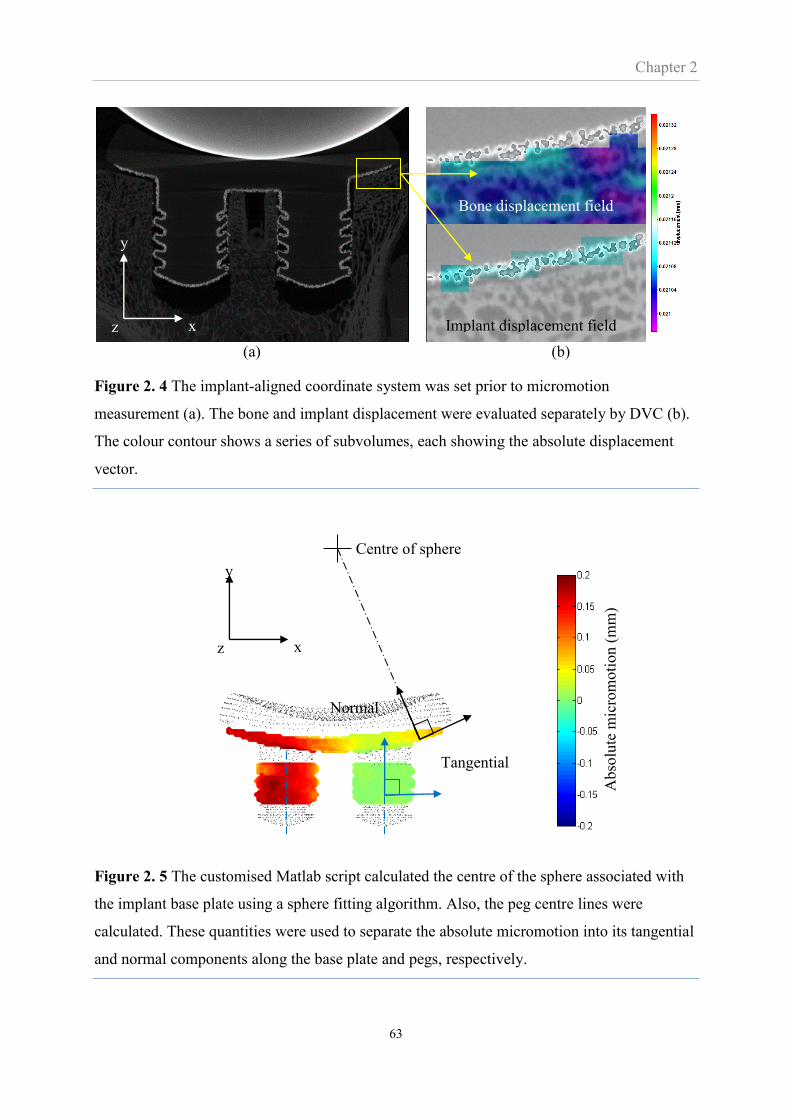
Chapter 2
63
(a) (b)
Figure 2. 4 The implant-aligned coordinate system was set prior to micromotion
measurement (a). The bone and implant displacement were evaluated separately by DVC (b).
The colour contour shows a series of subvolumes, each showing the absolute displacement
vector.
Figure 2. 5 The customised Matlab script calculated the centre of the sphere associated with
the implant base plate using a sphere fitting algorithm. Also, the peg centre lines were
calculated. These quantities were used to separate the absolute micromotion into its tangential
and normal components along the base plate and pegs, respectively.
Implant displacement field
vectot
Bone displacement field
vectot
y
x z
y
x z
Tangential
component
Normal
component
Centre of sphere
Abso
lute
mic
rom
oti
on (
mm
)

Chapter 2
64
2.1.3 Important DVC parameters for micromotion measurements
The size of the subvolume is a basic parameter of the DVC analysis and an appropriate size
needs to be determined to achieve reasonable accuracy of the measurements. It is important
that the selected subvolume size is such as to contain a unique pattern of voxel grey scale
values within it, which will allow the subvolumes to be distinguished from each other. Over
or under-sizing of the subvolume will result in an increase in measurement errors (Gillard et
al., 2014; Jandejsek et al., 2011; Roberts et al., 2014)
Calculating the micromotion involves the separate calculation of the displacement of two
objects; the implant and the bone. The part of image containing one object must be masked
out in order to determine the displacement of the other object. The accuracy of displacement
near the masked region, i.e. near the bone-implant interface, is important since it is associated
with the accuracy of micromotion. The commercial Davis DVC software includes a parameter
called ‘Minimal fraction of valid voxel’, described as the percentage of voxels in the
subvolume that must be valid for the software to calculate displacement vector. An example
of setting this parameter for the implant region is shown in Figure 2.6. When the fraction of
valid voxel is set at 10% (Figure 2.6a), the displacement vectors throughout the implant
region can be calculated. However, there are a number of calculated vectors that are located
outside the implant region. This may reduce the accuracy of implant displacement and may
further affect micromotion measurement. Setting with higher number of valid voxels, such as
30% (Figure 2.6b), results in all displacement vectors being located within the implant region.
However, the displacement vectors at the interface, which must be used for micromotion
measurement, may not be obtained.

Chapter 2
65
Minimal fraction of valid voxel = 10%
(a)
Minimal fraction of valid voxel = 30%
(b)
Figure 2. 6 Displacement vectors obtained from two different settings of the minimal fraction
of valid voxel; 10% (a) and 30% (b). The actual boundary of the implant coating is outlined
by the red lines. Other regions apart from the coating are masked out. The black area
demonstrates the valid voxels within the subvolume.
2.1.4 Effect of subvolume size and minimal fraction of valid voxel and the settings of
these parameters for this Thesis.
2.1.4.1 Subvolume size
The aim of this section was to determine the optimum subvolume size for micromotion
analysis. Micro-CT images of the bone and implant with a resolution of 22 μm were used. A
whole part of both images was uniformly displaced by 0.5 voxels (10.6 μm) in the x-direction.
This procedure produced a known displacement to compare the DVC measured displacement
to. The half voxel distance has been recommended since it was found to produce the
maximum uncertainty of the DVC technique (Germaneau et al., 2007; Madi et al., 2013; Roux
et al., 2008). The imposed displacements in respect to the original images were then measured
Bone
Implant coating
Subvolume
Displacement vector
No displacement
vector obtained
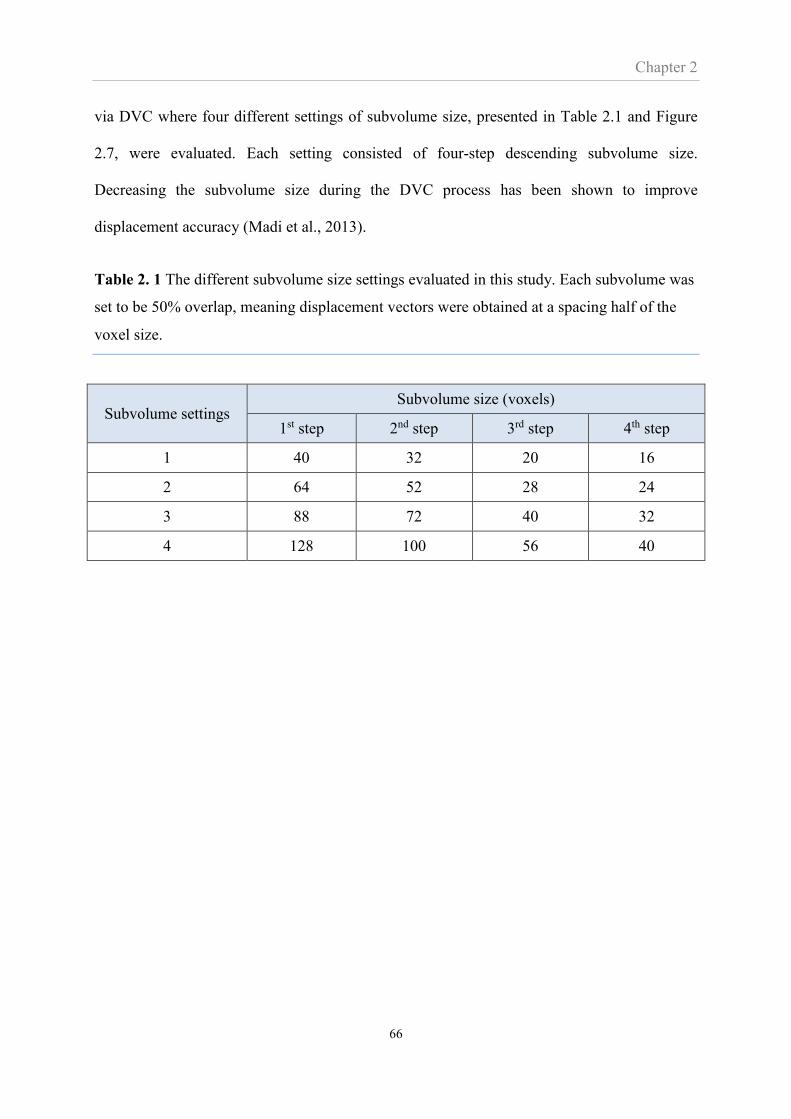
Chapter 2
66
via DVC where four different settings of subvolume size, presented in Table 2.1 and Figure
2.7, were evaluated. Each setting consisted of four-step descending subvolume size.
Decreasing the subvolume size during the DVC process has been shown to improve
displacement accuracy (Madi et al., 2013).
Table 2. 1 The different subvolume size settings evaluated in this study. Each subvolume was
set to be 50% overlap, meaning displacement vectors were obtained at a spacing half of the
voxel size.
Subvolume settings Subvolume size (voxels)
1st step 2nd step 3rd step 4th step
1 40 32 20 16
2 64 52 28 24
3 88 72 40 32
4 128 100 56 40
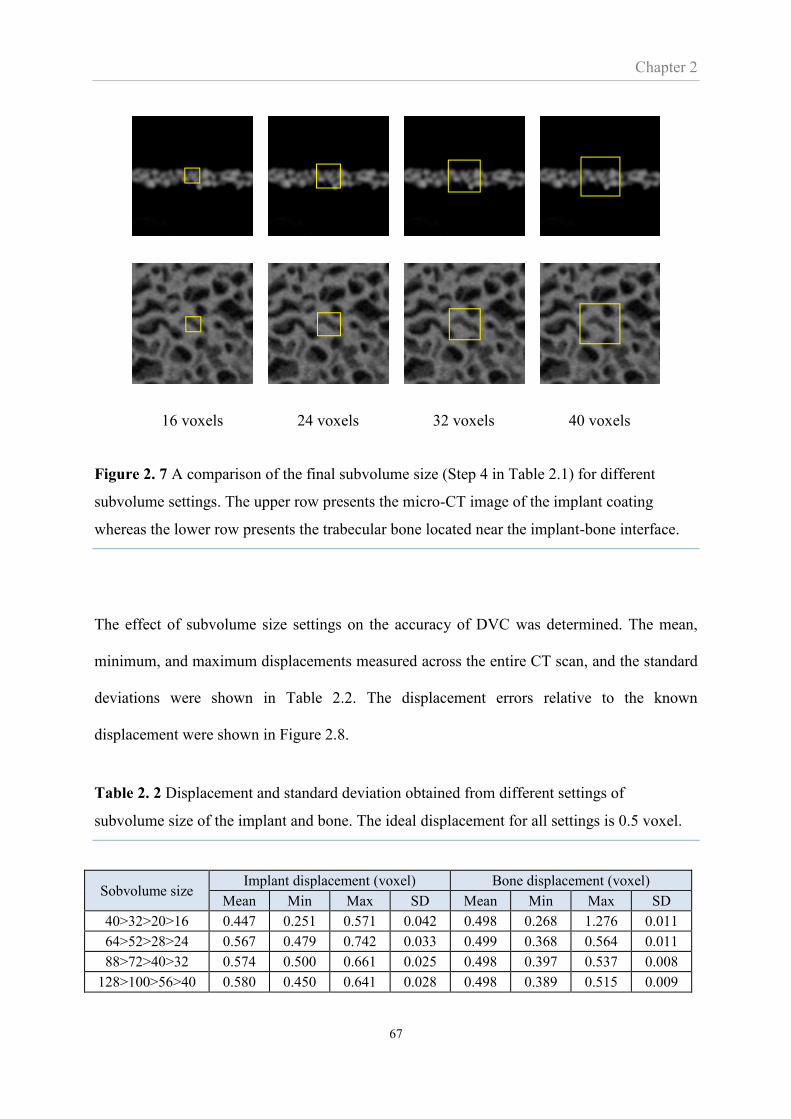
Chapter 2
67
16 voxels 24 voxels 32 voxels 40 voxels
Figure 2. 7 A comparison of the final subvolume size (Step 4 in Table 2.1) for different
subvolume settings. The upper row presents the micro-CT image of the implant coating
whereas the lower row presents the trabecular bone located near the implant-bone interface.
The effect of subvolume size settings on the accuracy of DVC was determined. The mean,
minimum, and maximum displacements measured across the entire CT scan, and the standard
deviations were shown in Table 2.2. The displacement errors relative to the known
displacement were shown in Figure 2.8.
Table 2. 2 Displacement and standard deviation obtained from different settings of
subvolume size of the implant and bone. The ideal displacement for all settings is 0.5 voxel.
Sobvolume size Implant displacement (voxel) Bone displacement (voxel)
Mean Min Max SD Mean Min Max SD
40>32>20>16 0.447 0.251 0.571 0.042 0.498 0.268 1.276 0.011
64>52>28>24 0.567 0.479 0.742 0.033 0.499 0.368 0.564 0.011
88>72>40>32 0.574 0.500 0.661 0.025 0.498 0.397 0.537 0.008
128>100>56>40 0.580 0.450 0.641 0.028 0.498 0.389 0.515 0.009
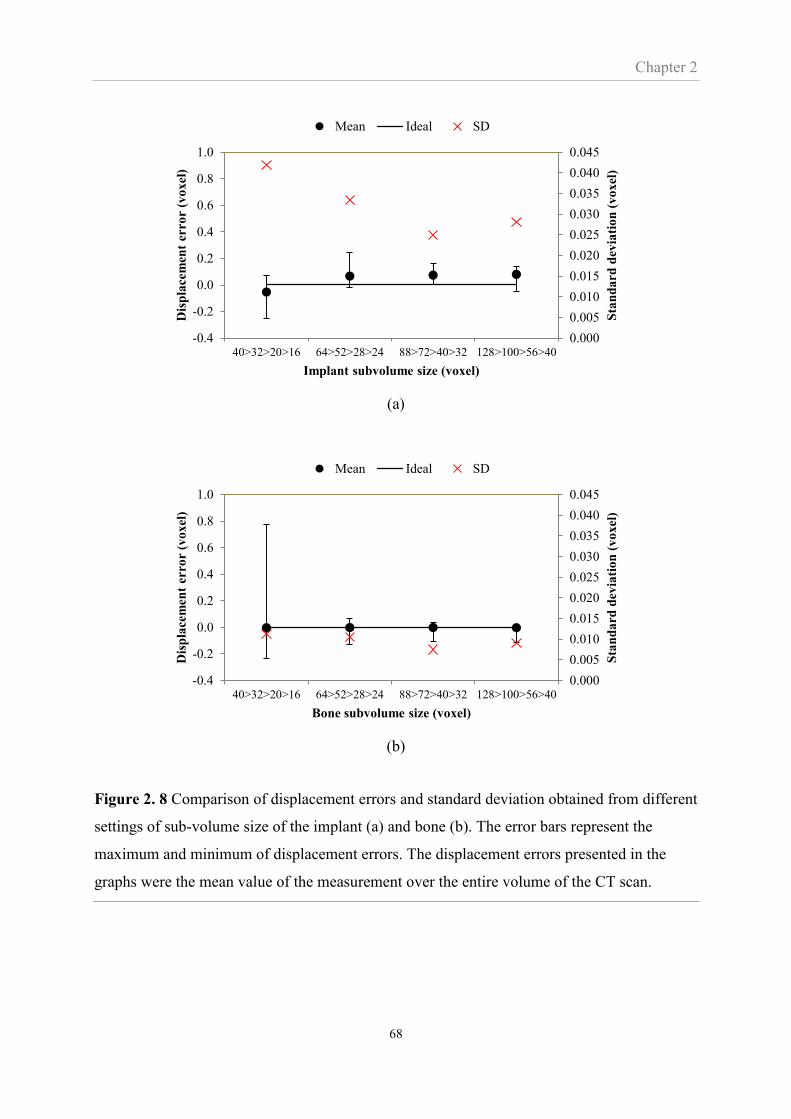
Chapter 2
68
(a)
(b)
Figure 2. 8 Comparison of displacement errors and standard deviation obtained from different
settings of sub-volume size of the implant (a) and bone (b). The error bars represent the
maximum and minimum of displacement errors. The displacement errors presented in the
graphs were the mean value of the measurement over the entire volume of the CT scan.
0.000
0.005
0.010
0.015
0.020
0.025
0.030
0.035
0.040
0.045
-0.4
-0.2
0.0
0.2
0.4
0.6
0.8
1.0
40>32>20>16 64>52>28>24 88>72>40>32 128>100>56>40
Sta
nd
ard
dev
iati
on
(v
oxel
)
Dis
pla
cem
ent
erro
r (v
oxel
)
Implant subvolume size (voxel)
Mean Ideal SD
0.000
0.005
0.010
0.015
0.020
0.025
0.030
0.035
0.040
0.045
-0.4
-0.2
0.0
0.2
0.4
0.6
0.8
1.0
40>32>20>16 64>52>28>24 88>72>40>32 128>100>56>40
Sta
nd
ard
dev
iati
on
(v
oxel
)
Dis
pla
cem
ent
erro
r (v
oxel
)
Bone subvolume size (voxel)
Mean Ideal SD

Chapter 2
69
The displacement error in Figure 2.8 is the difference between the DVC predicted
displacements and the known 0.5 voxel displacement of the digitally displaced images. The
results showed that the four different subvolume settings of the implant produced mean errors
ranging between 0.05 and 0.08 voxels (1.13 and 1.70µm) while those of the bone produced
relatively small errors as less than 0.002 voxels (0.05µm). The differences in mean error
among different settings were not distinguishable, in contrast to SD. The minimum SD was
found when the final subvolume size of 32 voxels was adopted. This setting produced
maximum errors of less than 3.39 and 2.18 µm in the implant and bone, respectively.
Therefore, a final subvolume size of 32 voxels was chosen as the most appropriate setting in
this Thesis.
2.1.4.2. Minimal fraction of valid voxel
To evaluate the ‘minimal fraction of valid voxel’ parameter, an artificial micromotion was
imposed. The bone and implant were digitally displaced by 1 voxel but in different directions
to create a displacement consisting of both tangential and normal components, shown in
Figure 2.9. The minimal fraction of valid voxel of 30% and 50% were set for the bone and
10% and 30% were set for the implant. The settings of the implant and bone were paired up
resulting in four setting conditions being evaluated. Imposed micromotions were measured by
the μCT-DVC technique where the subvolume size of the bone and implant were set
according to the optimum settings evaluated earlier.
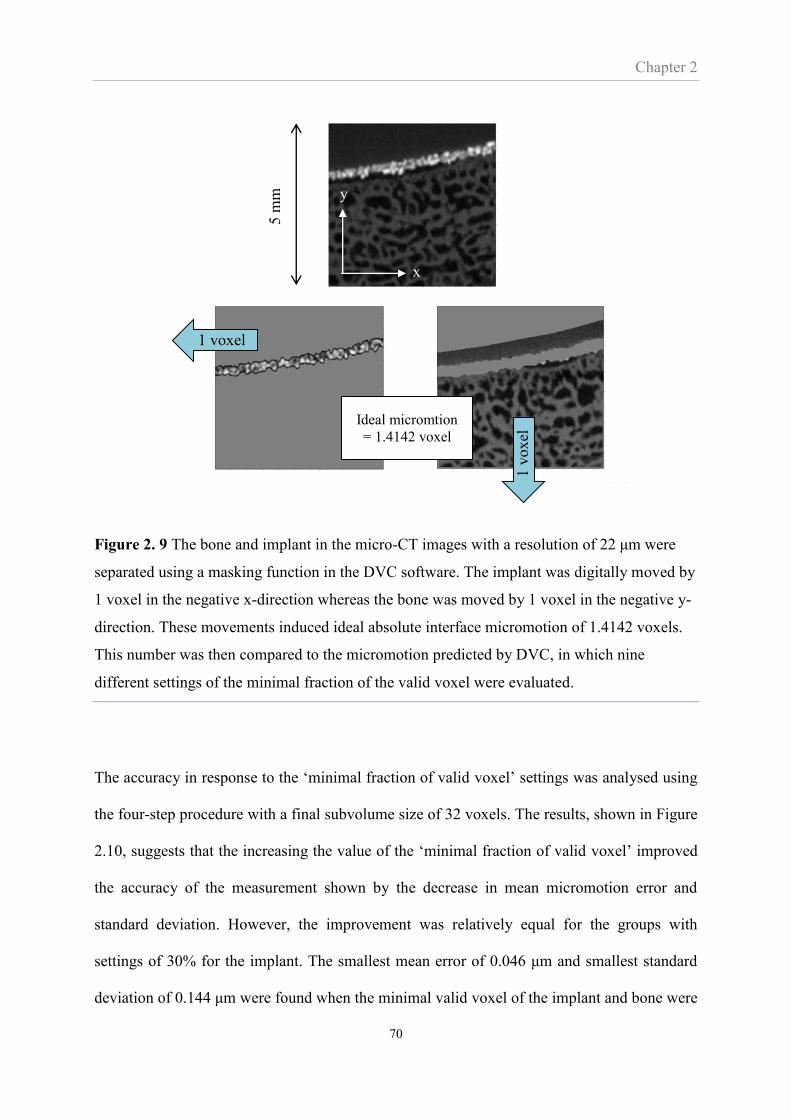
Chapter 2
70
Figure 2. 9 The bone and implant in the micro-CT images with a resolution of 22 μm were
separated using a masking function in the DVC software. The implant was digitally moved by
1 voxel in the negative x-direction whereas the bone was moved by 1 voxel in the negative y-
direction. These movements induced ideal absolute interface micromotion of 1.4142 voxels.
This number was then compared to the micromotion predicted by DVC, in which nine
different settings of the minimal fraction of the valid voxel were evaluated.
The accuracy in response to the ‘minimal fraction of valid voxel’ settings was analysed using
the four-step procedure with a final subvolume size of 32 voxels. The results, shown in Figure
2.10, suggests that the increasing the value of the ‘minimal fraction of valid voxel’ improved
the accuracy of the measurement shown by the decrease in mean micromotion error and
standard deviation. However, the improvement was relatively equal for the groups with
settings of 30% for the implant. The smallest mean error of 0.046 μm and smallest standard
deviation of 0.144 μm were found when the minimal valid voxel of the implant and bone were
1 voxel
x
y
1 v
oxel
Ideal micromtion
= 1.4142 voxel
5 m
m
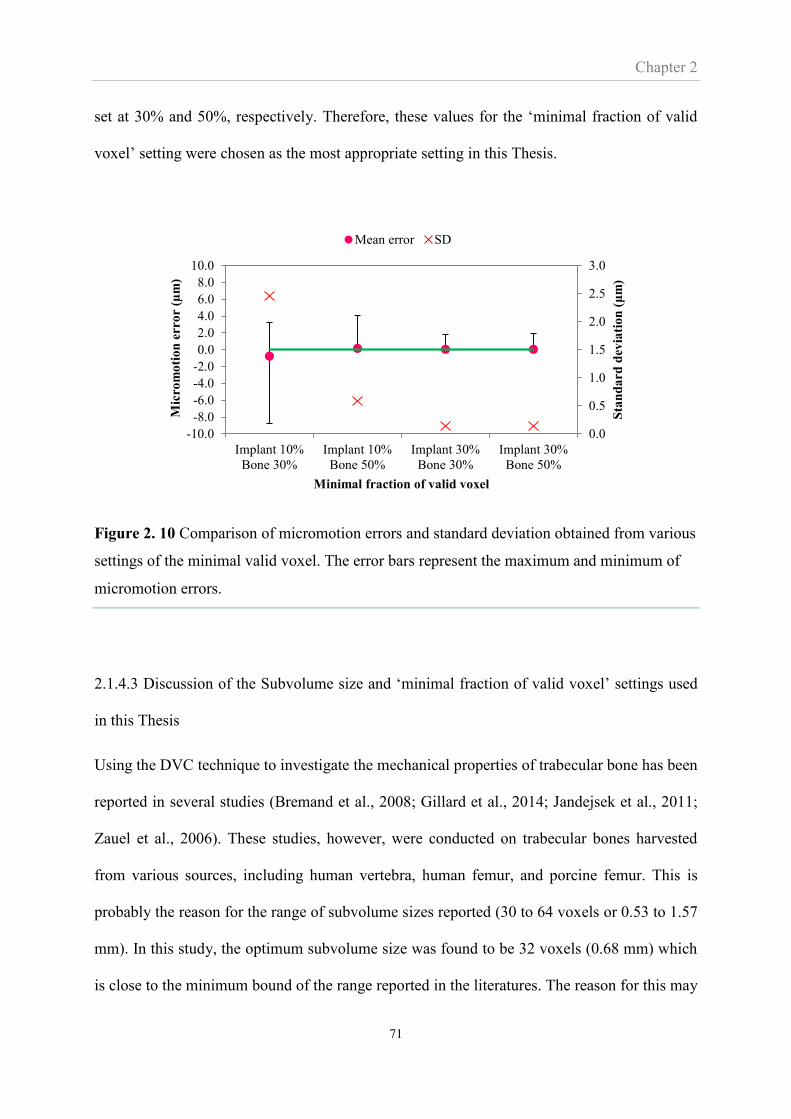
Chapter 2
71
set at 30% and 50%, respectively. Therefore, these values for the ‘minimal fraction of valid
voxel’ setting were chosen as the most appropriate setting in this Thesis.
Figure 2. 10 Comparison of micromotion errors and standard deviation obtained from various
settings of the minimal valid voxel. The error bars represent the maximum and minimum of
micromotion errors.
2.1.4.3 Discussion of the Subvolume size and ‘minimal fraction of valid voxel’ settings used
in this Thesis
Using the DVC technique to investigate the mechanical properties of trabecular bone has been
reported in several studies (Bremand et al., 2008; Gillard et al., 2014; Jandejsek et al., 2011;
Zauel et al., 2006). These studies, however, were conducted on trabecular bones harvested
from various sources, including human vertebra, human femur, and porcine femur. This is
probably the reason for the range of subvolume sizes reported (30 to 64 voxels or 0.53 to 1.57
mm). In this study, the optimum subvolume size was found to be 32 voxels (0.68 mm) which
is close to the minimum bound of the range reported in the literatures. The reason for this may
0.0
0.5
1.0
1.5
2.0
2.5
3.0
-10.0
-8.0
-6.0
-4.0
-2.0
0.0
2.0
4.0
6.0
8.0
10.0
Implant 10%
Bone 30%
Implant 10%
Bone 50%
Implant 30%
Bone 30%
Implant 30%
Bone 50%
Sta
nd
ard
dev
iati
on
(μ
m)
Mic
rom
oti
on
err
or
(µm
)
Minimal fraction of valid voxel
Mean error SD
Chapter 2
72
be that the bone investigated in this Thesis is located near the glenoid surface (subchondral
bone) and is relatively dense. It was also due to the fact that this Thesis focused only on the
displacement measurement. A study focusing on strain measurement may be compatible with
larger subvolume size.
The minimal fraction of valid voxel most appropriate for the implant and bone was found to
be 30% and 50% respectively. Although an increase in these numbers may improve the
accuracy of the measurement, there were some limitations. The fraction exceeding 30% was
unable to provide full-field displacement vectors over the implant surface due to the thin
coating of the implant (less than 300 μm). While this problem was unlikely to occur for the
bone, the fraction exceeding 50% resulted in the calculated vectors being less close to the
bone-implant surface and which may be not be suitable for determining micromotion.
In this section the displacements were induced digitally and the two images that were
compared as part of the tracking process were identical. In practical measurement where the
unloaded and loaded volume images are not identical, additional effects such as scanner noise,
rigid body movement, and inaccurate load application may increase measurement errors. The
accuracy of the method for in physical applications was evaluated in Chapter 3.
2.2 Finite element analysis for predicting micromotion
2.2.1 Introduction
Finite element (FE) analysis is a computational technique first introduced in orthopaedic
biomechanics in 1972 (Brekelmans et al., 1972). One of the key advantages of FE analysis of
orthopaedic problems is the access to the mechanical state, such as stresses and deformation,
within the bone and prosthesis, which is generally not readily accessible by any other
techniques. In addition, FE analyses may reduce the need for clinical trials and in-vitro studies
Chapter 2
73
where a number of patients, cadaveric specimens or animals are required, all of which are
associated with significant practical and ethical problems. Since its introduction, FE has been
adopted for a wide range of orthopaedic applications (Erdemir et al., 2012; Huiskes and Chao,
1983; Taylor and Prendergast, 2015)
This section will describe the specific FE modelling approach used in this Thesis for
investigating the effect of glenoid component version on interface micromotion. The
modelling of a glenoid prosthesis implanted into a human scapula will be used to describe the
FE modelling approach including the construction of bone geometry, material property
assignment, loads and boundary condition. In later chapters the FE approach will model the
glenoid prostheses implanted in both porcine and human glenoid bone, however, the
modelling approach is essentially the same. In later chapters some models are based on micro-
CT scans while others are based on clinical CT scans. How this affects the construction of the
FE model will be described in the relevant sections. At the end of this chapter the results of
numerical sensitivity tests of various FE parameters will be shown. The purpose of these tests
was also to establish various parameters needed by the FE model.
2.2.2 Generating the finite element model for micromotion analysis
The construction of the FE model for micromotion analysis can be divided into three stages;
construction of bone geometry, mapping material properties onto the finite element mesh, and
applying boundary conditions and loading. Each stage is described in detail as follow;

Chapter 2
74
Construction of the geometry
The process of geometry construction is shown schematically in figure 2.11. A 3D geometry
of a human scapula being created based on a clinical CT dataset of a cadaveric shoulder. This
set of CT images was imported into Avizo 6.1 (Visualisation Sciences Group, USA) where
the outline of the scapula bone at each slice was stacked and extracted to form a triangular
surface mesh. Using Rhinoceros 4.0 (Robert McNeel & Associates, Washington, USA), the
surface mesh of the bone was virtually drilled and reamed by Boolean subtraction. Finally the
bone was virtually implanted with a CAD model of the glenoid component (Affinis Vitamys,
Mathys Ltd., Bettlach, Switzerland). The CAD model was provided by the prosthesis
manufacturer. The surface profile of the implanted bone was converted to a FE model
consisting of solid 4-noded tetrahedron elements using ICEM CFD, a tool in Ansys 13.0
(ANSYS Inc., Canonsburg, Pennsylvania, USA). The node coordinates of the implant and
bone at the interface were assigned to be identical. The cobalt-chrome humeral prosthesis was
modelled as a rigid body sphere with a radius of 24 mm and in contact with the polyethylene
glenoid prosthesis, which in turn was in contact with the scapular bone. The contact
conditions between the humeral and glenoid prostheses as well as between the glenoid
implant and bone are shown in Table 2.3. A Coulomb’s friction model was employed and will
be discussed further in Section 2.2.3.3. The FE model was analysed using the commercial
software MARC Mentat 2010 (MSC Software Corporation, USA). Finally, interface
micromotions were determined using the FE subroutine developed by Hopkins (Hopkins,
2004). In concept, the subroutine paired up the interface nodes that shared identical positions
under unloaded condition. The coordinates of those nodes under both unloaded and loaded
condition were recorded so that the relative movement between the paired nodes, i.e.,
micromotion, were calculated. The subroutine also separated the micromotion into

Chapter 2
75
components tangential and normal to the interface and demonstrated the results through a
series of contour plots.
Figure 2. 11 Overview of the process of constructing the FE model for analysing interface
micromotion in shoulder arthroplasty.
Table 2. 3 Parameters for the FE analysis. Values obtained from previous work (Galetz et al.,
2010; Pruitt, 2005; Shirazi-Adl et al., 1993).
Glenoid bone PE glenoid prosthesis Humeral prosthesis
Coefficient of
friction
0.6
0.1
Poison’s ratio 0.3 0.45
Young’s modulus follow eq. 1-3 0.8 GPa
CT image of
human scapula3D geometry construction Preparing glenoid surface
for implantation
Meshing process
to convert surface
profile to solid
element
FE element geometry of a
scapula with glenoid and
humeral head component
Setting of bone material
properties
Micromotion
analysis
CT image of
human scapula3D geometry construction Preparing glenoid surface
for implantation
Meshing process
to convert surface
profile to solid
element
FE element geometry of a
scapula with glenoid and
humeral head component
Setting of bone material
properties
Micromotion
analysis
Meshing process to
convert surface profile
to solid element
Preparing glenoid surface for
implantation
3D geometry constructionCT image of
human scapula
Micromotion
analysis
FE element geometry of a
scapula with glenoid and
humeral head component

Chapter 2
76
Mapping material properties onto the finite element mesh
Frich et al.(1997) and Kalouche et al (2010) have reported that bone has anisotropic
properties. This means that the stiffness principal values and directions change from point to
point and during the bone modelling process (Doblare et al., 2004). Attempts have been made
to produce bone models to simulate anisotropic behaviours (Jacobs et al., 1997; Doblare and
Garcia, 2002), however, such models were constructed based on several assumptions and
have not accurately reproduced the experimental results. In fact, the orientation of the glenoid
bone is relatively isotropic at least in the articulating plane and any possible anisotropic
orientation is difficult to extract from clinical resolution data sets. As a result, the scapular
bone of this study was assumed to be a non-homogeneous material with isotropic properties
across each element. Mechanical properties of the bone were assigned according to grey scale
values commonly presented in Hounsfield units (HU) from the clinical CT images. The grey
scale value has been shown to correlate linearly with apparent density (McBroom et al.,
1985). In this study, this linear relationship was constructed based on the interpolation of two
points, shown in Figure 2.12. The first point, representing the cortical bone of the CT scan
and which had an average grey scale value of 1800 HU and associated with a bone apparent
density of 1.8 g/m3 from the literature (Gibson, 1985). The second point represented an area
with no bone on the CT scan (an area with marrow) and had an average grey scale value of -
60 HU and was associated with an apparent density of 0 g/m3.

Chapter 2
77
Figure 2. 12 Linear relationship between grey scale value in Hounsfield unit and bone
apparent density.
From these two points the following relationship between density and Houndsfield values was
established:
ρ = 0.001 HU + 0.0581 (3)
The above procedure describes the density-HU relationship when based on clinical CT scans
and was repeated for the human bone in Chapter 5. The relationship between apparent density
and grey scale of the porcine glenoid used in Chapter 3 and 4 was constructed in a similar
manner. The only difference was that the grey scale value of the two points had to be
extracted from Micro-CT images. The resolution of micro-CT scans is so high, the individual
voxels so small, that a voxel does not capture the averaged effect of the cancellous structures.
Therefore the resolution of the micro-CT images were artificially reduced when calculating
the density. More details will be provided in Chapters 3 and 4.
p = 0.001HU + 0.0581
0
0.2
0.4
0.6
0.8
1
1.2
1.4
1.6
1.8
2
-200 0 200 400 600 800 1000 1200 1400 1600 1800 2000
Bo
ne
ap
pare
nt
de
nsi
ty (
g/c
m3)
Hounsfield Unit (HU)
-60
Cortical bone
Bone marrow
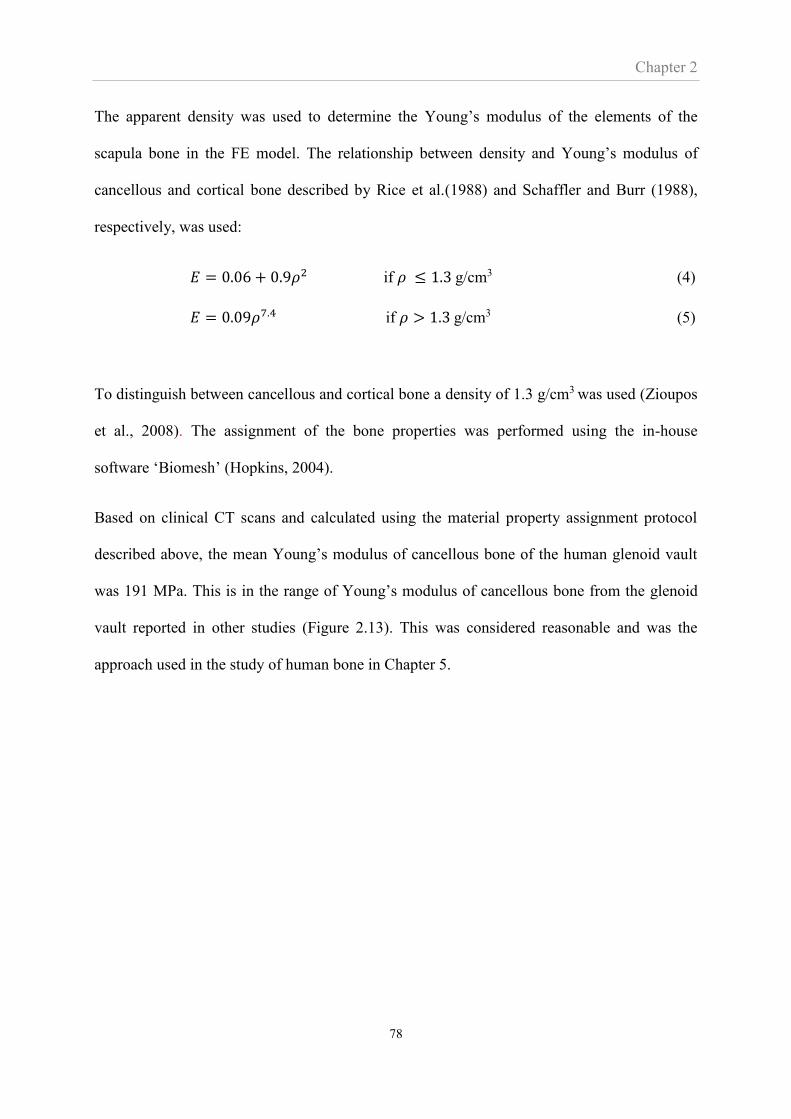
Chapter 2
78
The apparent density was used to determine the Young’s modulus of the elements of the
scapula bone in the FE model. The relationship between density and Young’s modulus of
cancellous and cortical bone described by Rice et al.(1988) and Schaffler and Burr (1988),
respectively, was used:
𝐸 = 0.06 + 0.9𝜌2 if 𝜌 ≤ 1.3 g/cm3 (4)
𝐸 = 0.09𝜌7.4 if 𝜌 > 1.3 g/cm3 (5)
To distinguish between cancellous and cortical bone a density of 1.3 g/cm3 was used (Zioupos
et al., 2008). The assignment of the bone properties was performed using the in-house
software ‘Biomesh’ (Hopkins, 2004).
Based on clinical CT scans and calculated using the material property assignment protocol
described above, the mean Young’s modulus of cancellous bone of the human glenoid vault
was 191 MPa. This is in the range of Young’s modulus of cancellous bone from the glenoid
vault reported in other studies (Figure 2.13). This was considered reasonable and was the
approach used in the study of human bone in Chapter 5.
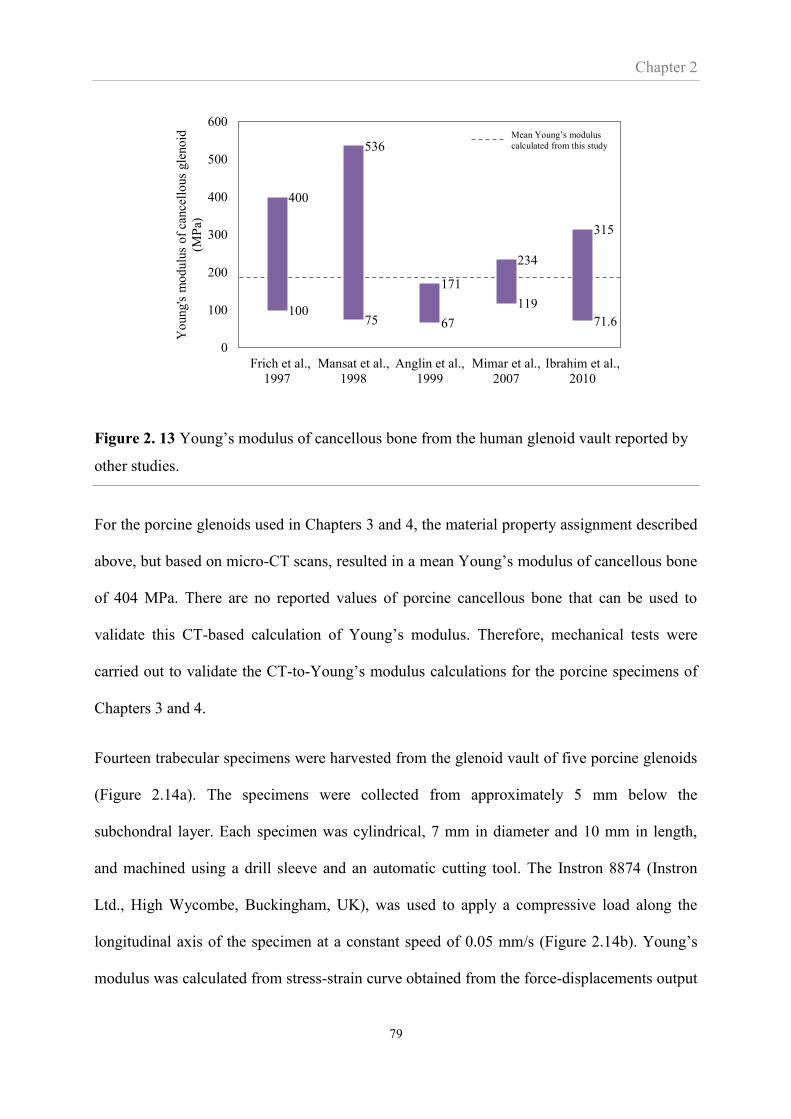
Chapter 2
79
Figure 2. 13 Young’s modulus of cancellous bone from the human glenoid vault reported by
other studies.
For the porcine glenoids used in Chapters 3 and 4, the material property assignment described
above, but based on micro-CT scans, resulted in a mean Young’s modulus of cancellous bone
of 404 MPa. There are no reported values of porcine cancellous bone that can be used to
validate this CT-based calculation of Young’s modulus. Therefore, mechanical tests were
carried out to validate the CT-to-Young’s modulus calculations for the porcine specimens of
Chapters 3 and 4.
Fourteen trabecular specimens were harvested from the glenoid vault of five porcine glenoids
(Figure 2.14a). The specimens were collected from approximately 5 mm below the
subchondral layer. Each specimen was cylindrical, 7 mm in diameter and 10 mm in length,
and machined using a drill sleeve and an automatic cutting tool. The Instron 8874 (Instron
Ltd., High Wycombe, Buckingham, UK), was used to apply a compressive load along the
longitudinal axis of the specimen at a constant speed of 0.05 mm/s (Figure 2.14b). Young’s
modulus was calculated from stress-strain curve obtained from the force-displacements output
10075 67
119
71.6
400
536
171
234
315
0
100
200
300
400
500
600
Frich et al.,
1997
Mansat et al.,
1998
Anglin et al.,
1999
Mimar et al.,
2007
Ibrahim et al.,
2010
Yo
ung's
mo
dulu
s o
f ca
nce
llo
us
gle
no
id
(MP
a)
Mean Young’s modulus
calculated from this study
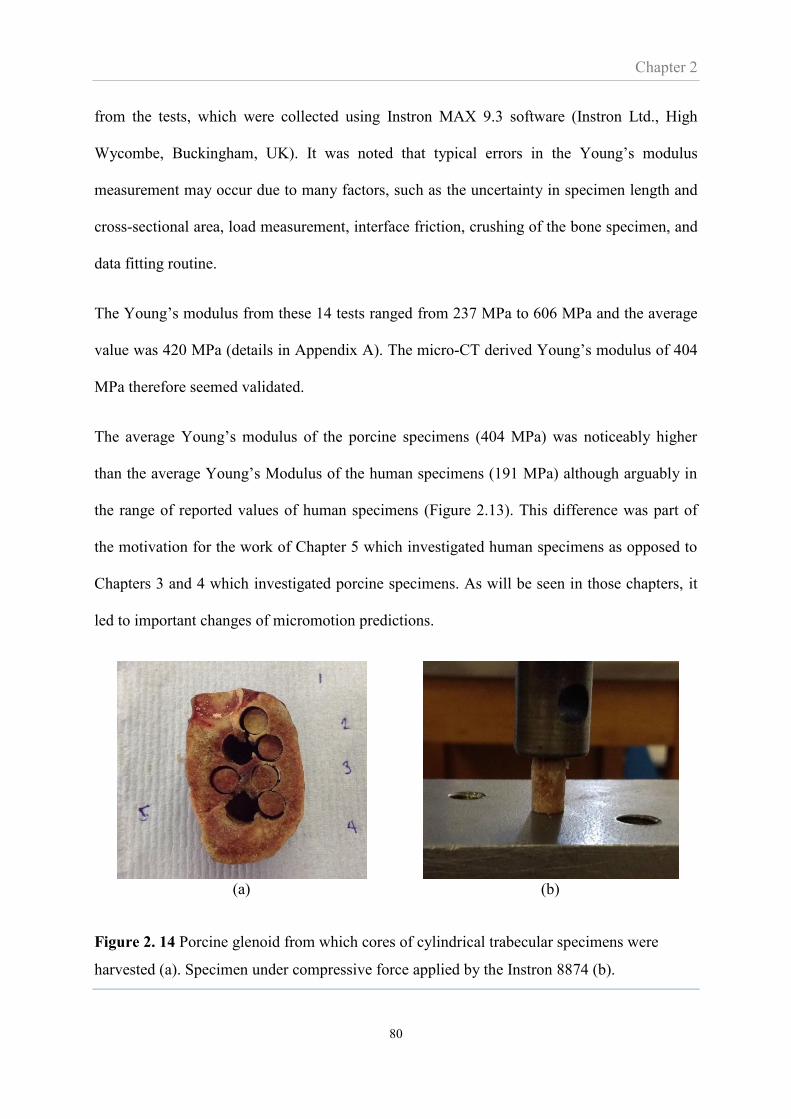
Chapter 2
80
from the tests, which were collected using Instron MAX 9.3 software (Instron Ltd., High
Wycombe, Buckingham, UK). It was noted that typical errors in the Young’s modulus
measurement may occur due to many factors, such as the uncertainty in specimen length and
cross-sectional area, load measurement, interface friction, crushing of the bone specimen, and
data fitting routine.
The Young’s modulus from these 14 tests ranged from 237 MPa to 606 MPa and the average
value was 420 MPa (details in Appendix A). The micro-CT derived Young’s modulus of 404
MPa therefore seemed validated.
The average Young’s modulus of the porcine specimens (404 MPa) was noticeably higher
than the average Young’s Modulus of the human specimens (191 MPa) although arguably in
the range of reported values of human specimens (Figure 2.13). This difference was part of
the motivation for the work of Chapter 5 which investigated human specimens as opposed to
Chapters 3 and 4 which investigated porcine specimens. As will be seen in those chapters, it
led to important changes of micromotion predictions.
(a) (b)
Figure 2. 14 Porcine glenoid from which cores of cylindrical trabecular specimens were
harvested (a). Specimen under compressive force applied by the Instron 8874 (b).
Chapter 2
81
Boundary conditions and Loading
The displacement of the medial border was constrained to prevent rigid body movement. The
coracoid process was also constrained to prevent unrealistic bending of the scapular blade
during anterior or posteriorly directed joint forces. Arm abduction was simulated in this study
as abduction has been reported to be critical in regards to loosening inducing the largest
glenohumeral joint force associated with daily living activities (Terrier et al., 2007). The
loading of the glenohumeral joint was simulated according to the study of Terrier et al. A joint
contact force, with a magnitude described in Figure 2.15, was applied to the centre of the
humeral head. The direction of the contact force was set so that the glenohumeral contact
point followed the inferior-superior movement of the humeral head on the glenoid surface as
reported by Terrier et al. (2007) and shown in Figure 2.16. Based on the cadaveric study by
Apreleva et al. (2000) the set-up simulated insignificant movement in the anterior-posterior
direction throughout the abduction cycle. This modelling approach was also applied for the
study of the effect of glenoid component misalignment in Chapters 3 and 4.
Figure 2. 15 Glenohumeral contact force during shoulder abduction (Terrier et al. 2008).
0
100
200
300
400
500
600
700
0 30 60 90 120 150 180
Fo
rce (N
)
Abduction angle (degree)
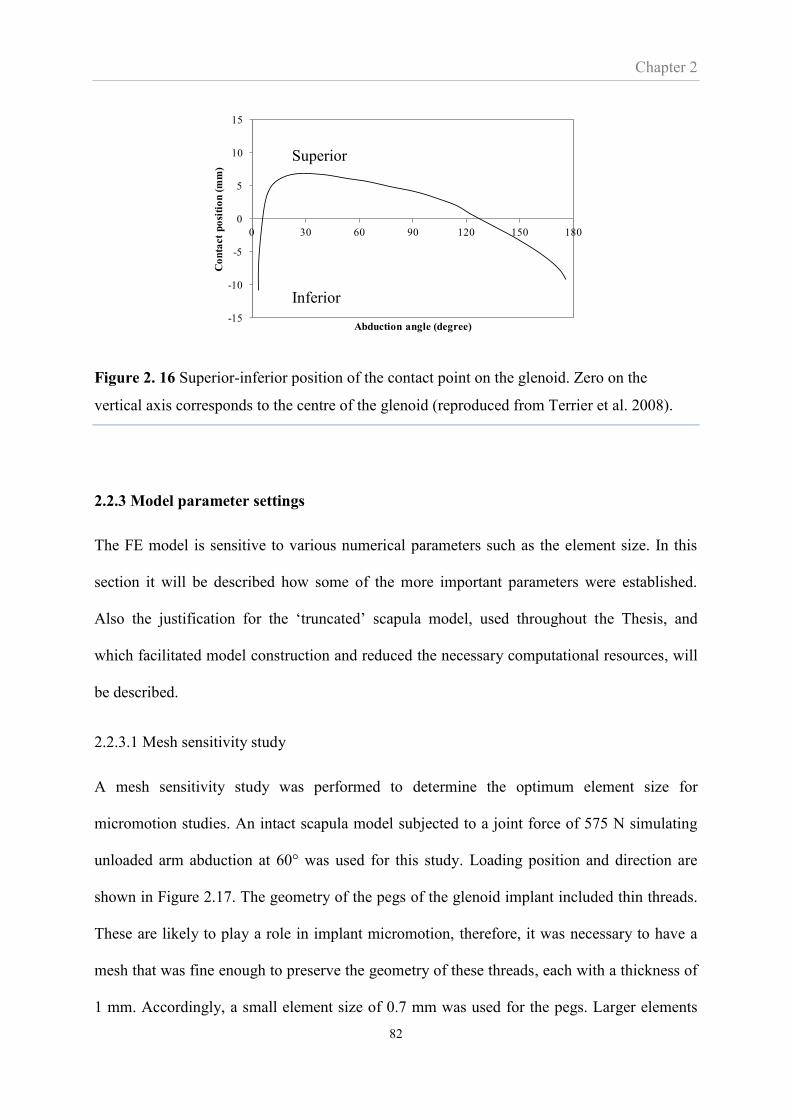
Chapter 2
82
Figure 2. 16 Superior-inferior position of the contact point on the glenoid. Zero on the
vertical axis corresponds to the centre of the glenoid (reproduced from Terrier et al. 2008).
2.2.3 Model parameter settings
The FE model is sensitive to various numerical parameters such as the element size. In this
section it will be described how some of the more important parameters were established.
Also the justification for the ‘truncated’ scapula model, used throughout the Thesis, and
which facilitated model construction and reduced the necessary computational resources, will
be described.
2.2.3.1 Mesh sensitivity study
A mesh sensitivity study was performed to determine the optimum element size for
micromotion studies. An intact scapula model subjected to a joint force of 575 N simulating
unloaded arm abduction at 60° was used for this study. Loading position and direction are
shown in Figure 2.17. The geometry of the pegs of the glenoid implant included thin threads.
These are likely to play a role in implant micromotion, therefore, it was necessary to have a
mesh that was fine enough to preserve the geometry of these threads, each with a thickness of
1 mm. Accordingly, a small element size of 0.7 mm was used for the pegs. Larger elements
-15
-10
-5
0
5
10
15
0 30 60 90 120 150 180
Co
nta
ct
po
siti
on
(m
m)
Abduction angle (degree)
Superior
Inferior
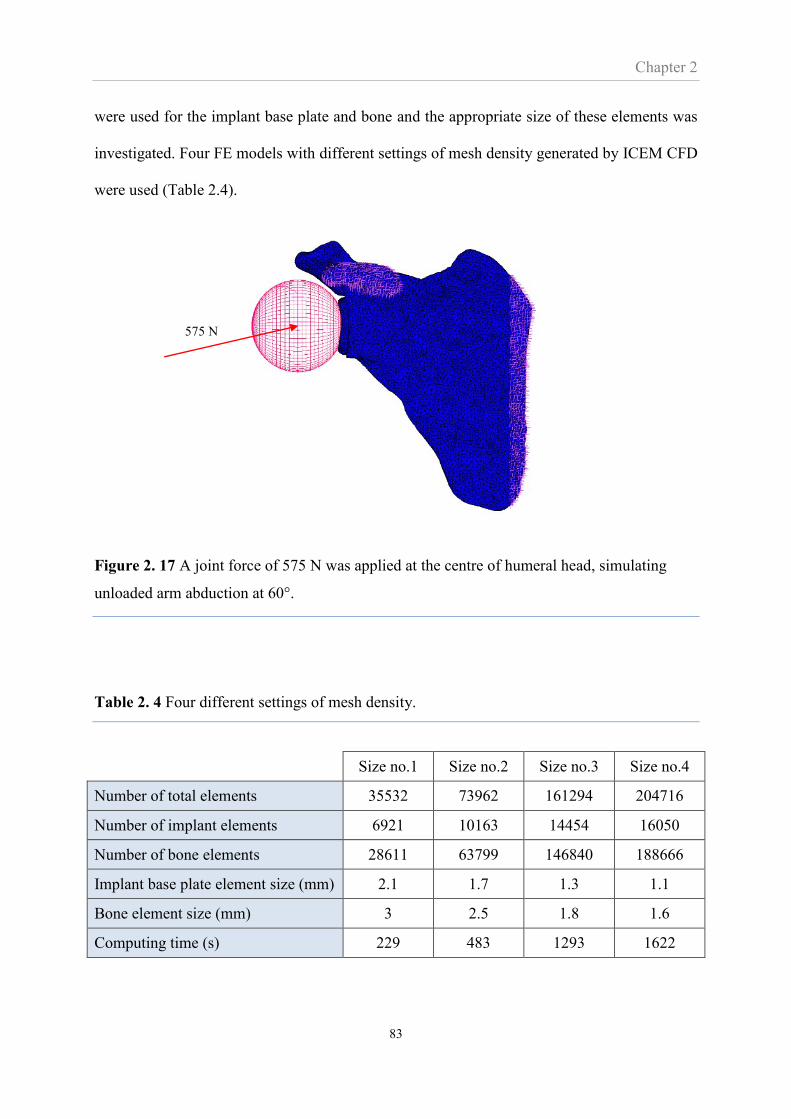
Chapter 2
83
were used for the implant base plate and bone and the appropriate size of these elements was
investigated. Four FE models with different settings of mesh density generated by ICEM CFD
were used (Table 2.4).
Figure 2. 17 A joint force of 575 N was applied at the centre of humeral head, simulating
unloaded arm abduction at 60°.
Table 2. 4 Four different settings of mesh density.
Size no.1 Size no.2 Size no.3 Size no.4
Number of total elements 35532 73962 161294 204716
Number of implant elements 6921 10163 14454 16050
Number of bone elements 28611 63799 146840 188666
Implant base plate element size (mm) 2.1 1.7 1.3 1.1
Bone element size (mm) 3 2.5 1.8 1.6
Computing time (s) 229 483 1293 1622
575 N
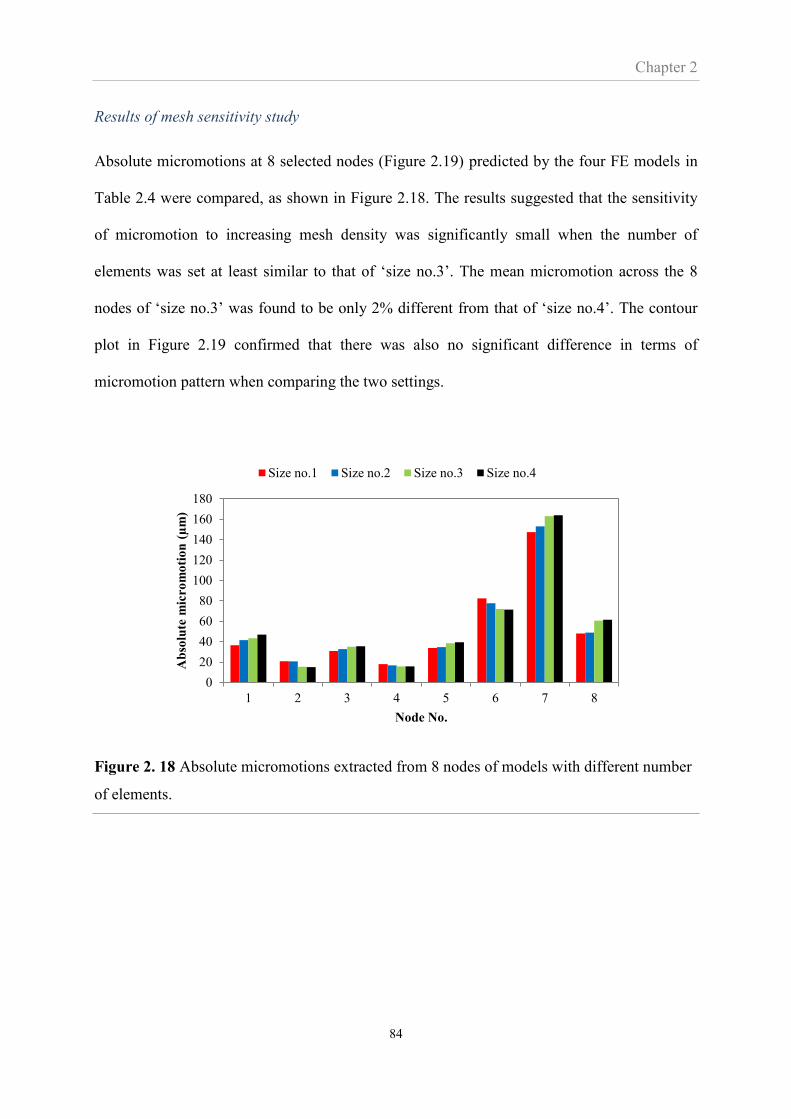
Chapter 2
84
Results of mesh sensitivity study
Absolute micromotions at 8 selected nodes (Figure 2.19) predicted by the four FE models in
Table 2.4 were compared, as shown in Figure 2.18. The results suggested that the sensitivity
of micromotion to increasing mesh density was significantly small when the number of
elements was set at least similar to that of ‘size no.3’. The mean micromotion across the 8
nodes of ‘size no.3’ was found to be only 2% different from that of ‘size no.4’. The contour
plot in Figure 2.19 confirmed that there was also no significant difference in terms of
micromotion pattern when comparing the two settings.
Figure 2. 18 Absolute micromotions extracted from 8 nodes of models with different number
of elements.
0
20
40
60
80
100
120
140
160
180
1 2 3 4 5 6 7 8
Ab
solu
te m
icro
mo
tio
n (
µm
)
Node No.
Size no.1 Size no.2 Size no.3 Size no.4
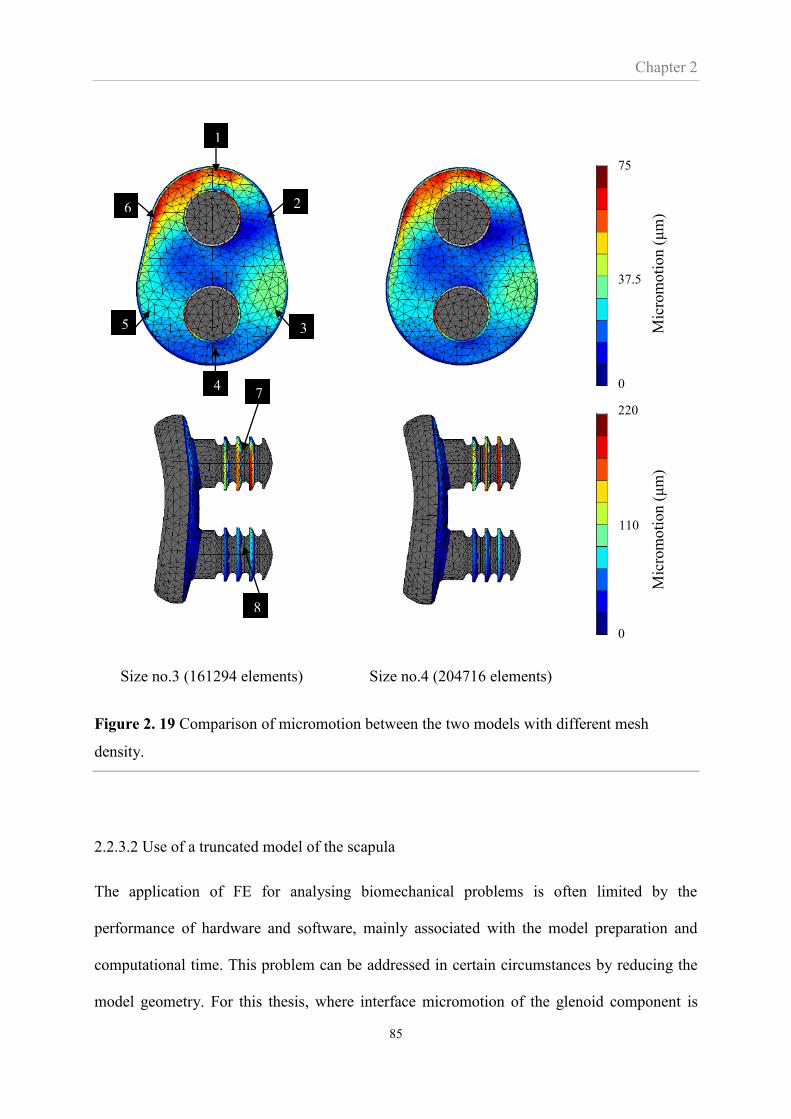
Chapter 2
85
Size no.3 (161294 elements) Size no.4 (204716 elements)
Figure 2. 19 Comparison of micromotion between the two models with different mesh
density.
2.2.3.2 Use of a truncated model of the scapula
The application of FE for analysing biomechanical problems is often limited by the
performance of hardware and software, mainly associated with the model preparation and
computational time. This problem can be addressed in certain circumstances by reducing the
model geometry. For this thesis, where interface micromotion of the glenoid component is
1
2 6
3 5
4
8
7
Mic
rom
oti
on (
μm
) M
icro
moti
on (
μm
)
75
0
37.5
220
0
110

Chapter 2
86
under investigation, the area of interest is the glenoid, and thus, the use of a complete scapula
model may be unnecessary. A study by Hopkins et al. (2005) in cemented arthroplasty
suggested that only small changes in stress distribution in the cement mantle were found when
a less comprehensive scapula model was used as opposed to a complete scapula model. It
seems likely that similar findings can be seen when micromotion is considered. However, the
effect of using a truncated scapula for micromotion analysis must be verified.
The verification study used the scapula model with mesh refinement ‘size no.4’ shown in
Table 2.4 and truncated this model by removing the medial part of the scapula (Figure 2.20).
This truncation reduced the total number of elements to 117,099. In addition to the 60°
abduction simulation, a 150° abduction position with a joint force of 300 N (Figure 2.15) and
inferior-superior movement of the contact point as described in Figure 2.16 was simulated.
Interface micromotions of both models at the 6 nodes indicated in Figure 2.21a were
compared.
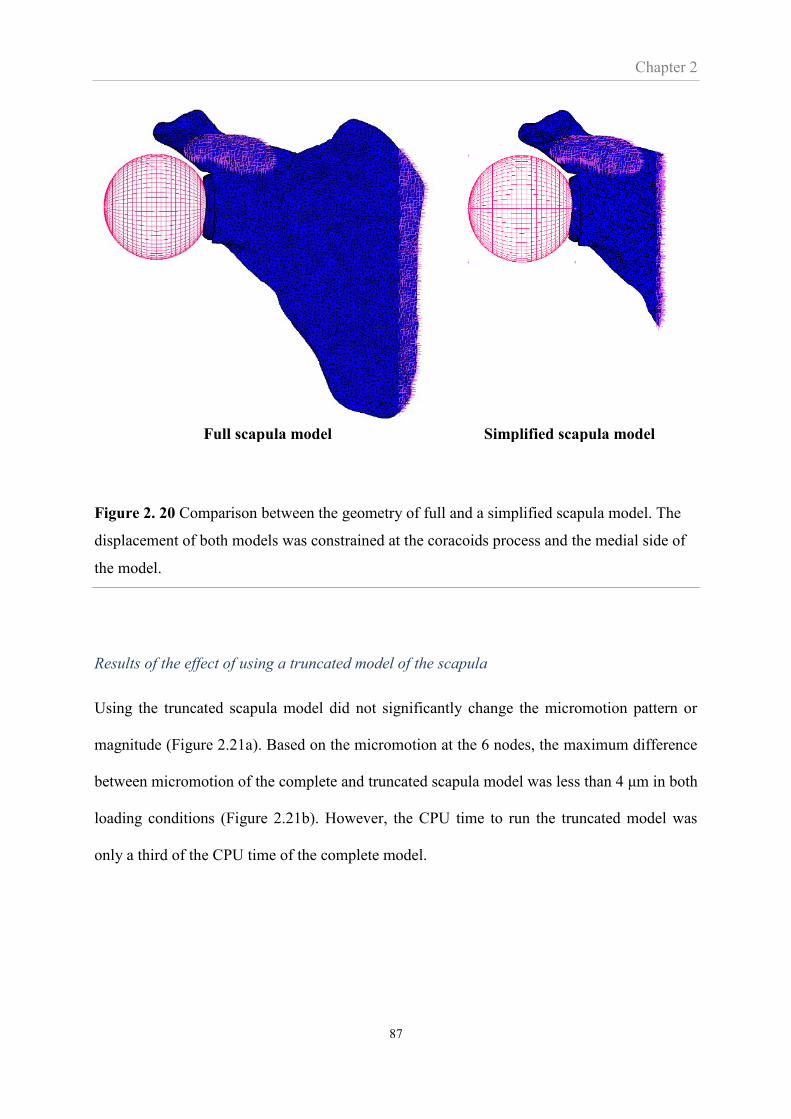
Chapter 2
87
Full scapula model Simplified scapula model
Figure 2. 20 Comparison between the geometry of full and a simplified scapula model. The
displacement of both models was constrained at the coracoids process and the medial side of
the model.
Results of the effect of using a truncated model of the scapula
Using the truncated scapula model did not significantly change the micromotion pattern or
magnitude (Figure 2.21a). Based on the micromotion at the 6 nodes, the maximum difference
between micromotion of the complete and truncated scapula model was less than 4 μm in both
loading conditions (Figure 2.21b). However, the CPU time to run the truncated model was
only a third of the CPU time of the complete model.
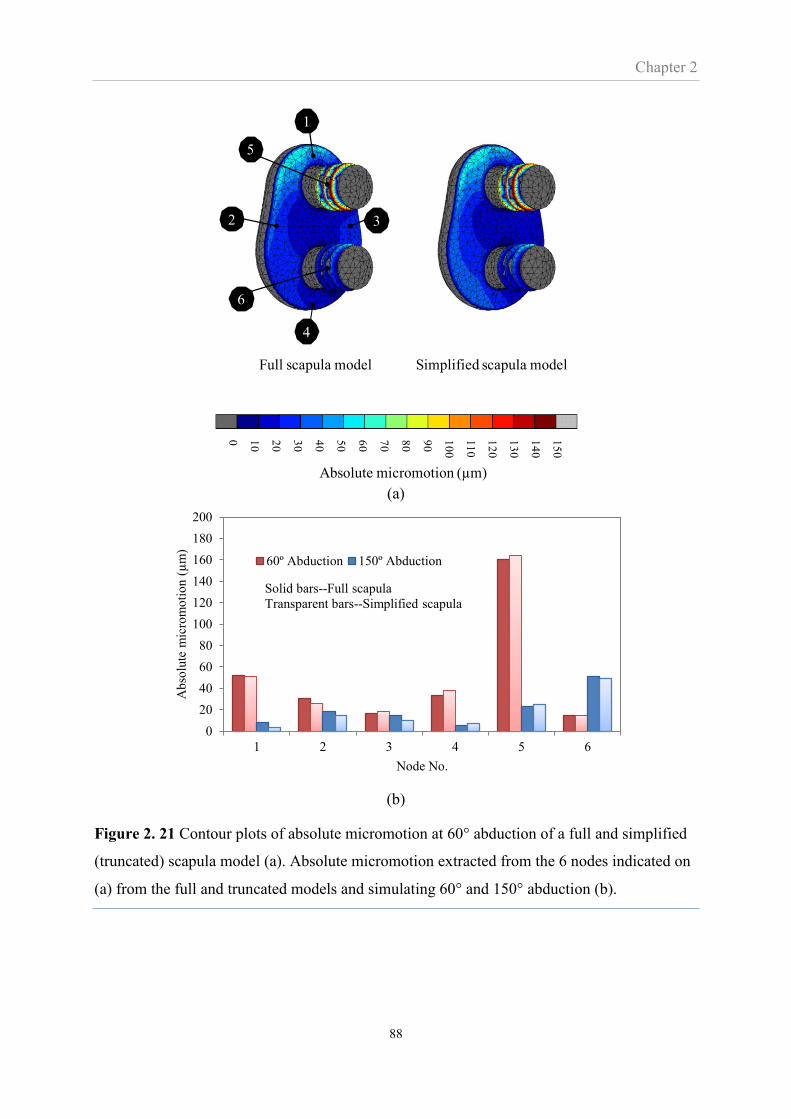
Chapter 2
88
(a)
(b)
Figure 2. 21 Contour plots of absolute micromotion at 60° abduction of a full and simplified
(truncated) scapula model (a). Absolute micromotion extracted from the 6 nodes indicated on
(a) from the full and truncated models and simulating 60° and 150° abduction (b).
Absolute micromotion (µm)
1
2 3
4
6
5
0 10
20
30
40
50
60
70
80
90
10
0
11
0
12
0
13
0
14
0
15
0
Full scapula model Simplified scapula model
0
20
40
60
80
100
120
140
160
180
200
1 2 3 4 5 6
Ab
solu
te m
icro
mo
tio
n (
µm
)
Node No.
60º Abduction 150º Abduction
Solid bars--Full scapula
Transparent bars--Simplified scapula
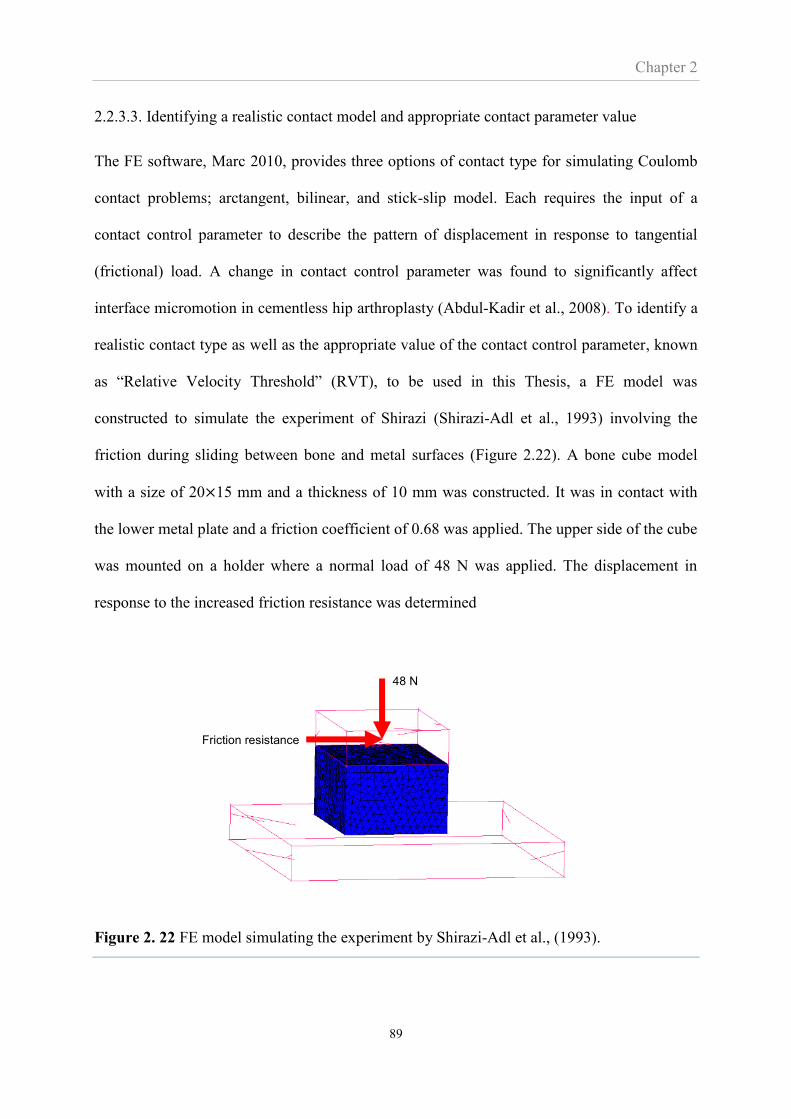
Chapter 2
89
2.2.3.3. Identifying a realistic contact model and appropriate contact parameter value
The FE software, Marc 2010, provides three options of contact type for simulating Coulomb
contact problems; arctangent, bilinear, and stick-slip model. Each requires the input of a
contact control parameter to describe the pattern of displacement in response to tangential
(frictional) load. A change in contact control parameter was found to significantly affect
interface micromotion in cementless hip arthroplasty (Abdul-Kadir et al., 2008). To identify a
realistic contact type as well as the appropriate value of the contact control parameter, known
as “Relative Velocity Threshold” (RVT), to be used in this Thesis, a FE model was
constructed to simulate the experiment of Shirazi (Shirazi-Adl et al., 1993) involving the
friction during sliding between bone and metal surfaces (Figure 2.22). A bone cube model
with a size of 20×15 mm and a thickness of 10 mm was constructed. It was in contact with
the lower metal plate and a friction coefficient of 0.68 was applied. The upper side of the cube
was mounted on a holder where a normal load of 48 N was applied. The displacement in
response to the increased friction resistance was determined
Figure 2. 22 FE model simulating the experiment by Shirazi-Adl et al., (1993).
Friction resistance
48 N
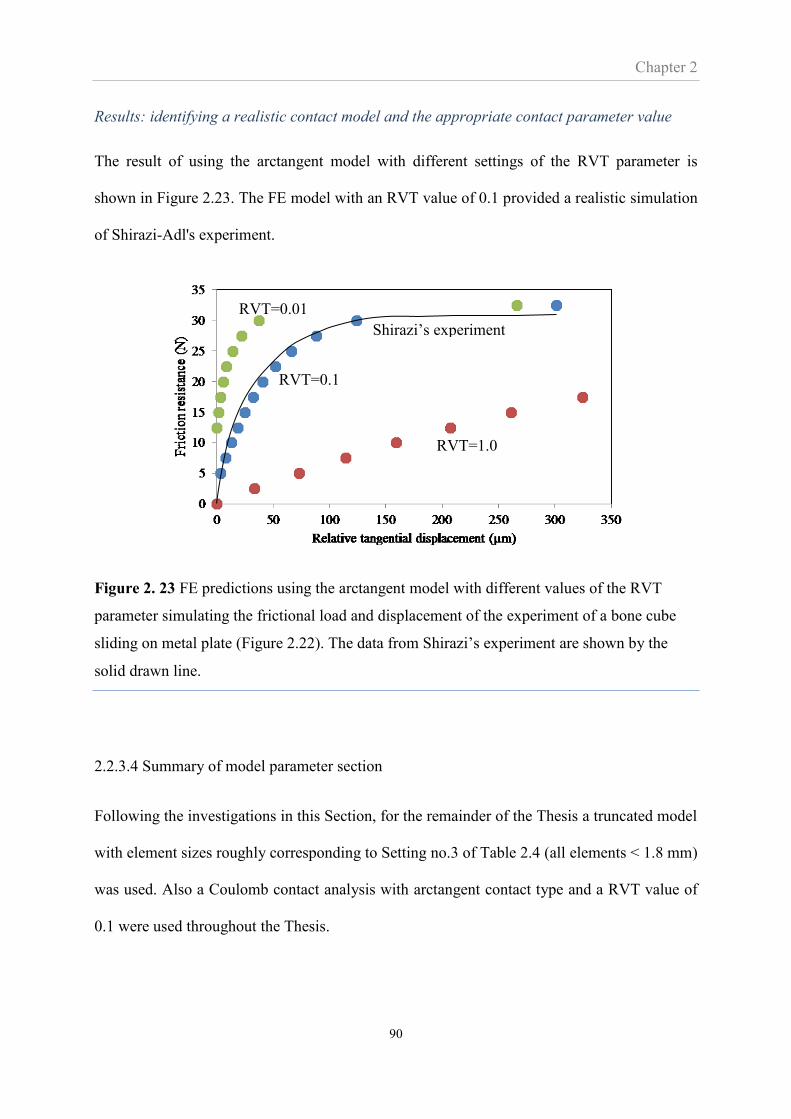
Chapter 2
90
Results: identifying a realistic contact model and the appropriate contact parameter value
The result of using the arctangent model with different settings of the RVT parameter is
shown in Figure 2.23. The FE model with an RVT value of 0.1 provided a realistic simulation
of Shirazi-Adl's experiment.
Figure 2. 23 FE predictions using the arctangent model with different values of the RVT
parameter simulating the frictional load and displacement of the experiment of a bone cube
sliding on metal plate (Figure 2.22). The data from Shirazi’s experiment are shown by the
solid drawn line.
2.2.3.4 Summary of model parameter section
Following the investigations in this Section, for the remainder of the Thesis a truncated model
with element sizes roughly corresponding to Setting no.3 of Table 2.4 (all elements < 1.8 mm)
was used. Also a Coulomb contact analysis with arctangent contact type and a RVT value of
0.1 were used throughout the Thesis.
RVT=0.1
RVT=1.0
RVT=0.01
Shirazi’s experiment
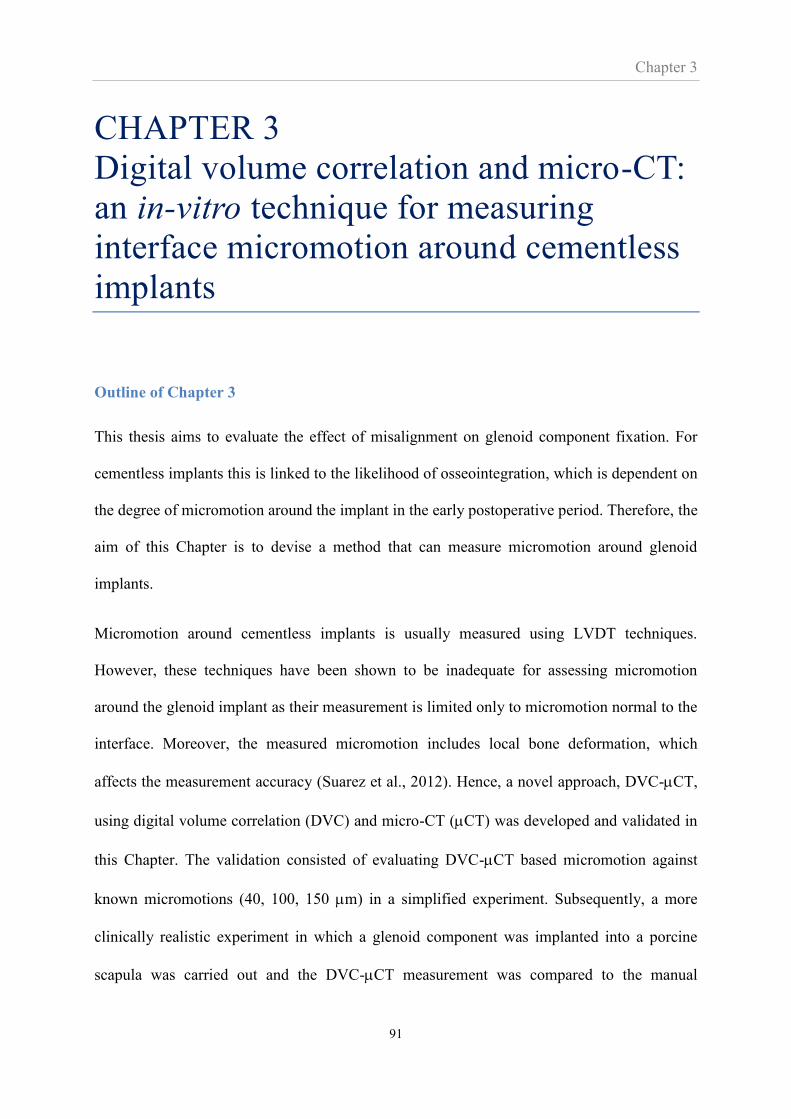
Chapter 3
91
CHAPTER 3
Digital volume correlation and micro-CT:
an in-vitro technique for measuring
interface micromotion around cementless
implants
Outline of Chapter 3
This thesis aims to evaluate the effect of misalignment on glenoid component fixation. For
cementless implants this is linked to the likelihood of osseointegration, which is dependent on
the degree of micromotion around the implant in the early postoperative period. Therefore, the
aim of this Chapter is to devise a method that can measure micromotion around glenoid
implants.
Micromotion around cementless implants is usually measured using LVDT techniques.
However, these techniques have been shown to be inadequate for assessing micromotion
around the glenoid implant as their measurement is limited only to micromotion normal to the
interface. Moreover, the measured micromotion includes local bone deformation, which
affects the measurement accuracy (Suarez et al., 2012). Hence, a novel approach, DVC-CT,
using digital volume correlation (DVC) and micro-CT (CT) was developed and validated in
this Chapter. The validation consisted of evaluating DVC-CT based micromotion against
known micromotions (40, 100, 150 m) in a simplified experiment. Subsequently, a more
clinically realistic experiment in which a glenoid component was implanted into a porcine
scapula was carried out and the DVC-CT measurement was compared to the manual
Chapter 3
92
tracking of micromotion at 12 discrete points across the implant interface. In addition, the
DVC-CT micromotion was compared to the micromotion predicted by finite element
analysis (FEA).
3.1 Introduction
Cementless arthroplasty is a common joint replacement procedure. The technique aims to
achieve biological fixation whereby bone grows into the implant surface, eliminating the need
for bone cement. The success of bone ingrowth depends significantly on micromotion, i.e.
prosthesis translation relative to the interface of the host bone (Mavrogenis et al., 2009). In-
vivo studies have shown that bone ingrowth occurs when micromotion is less than a threshold
value reported to range between 40 and 150 μm. Micromotion beyond this range may induce
fibrous tissue formation instead of bone matrix (Bragdon et al., 1996; Duyck et al., 2006;
Jasty et al., 1997; Leucht et al., 2007; Soballe; Szmukler-Moncler et al., 1998; Vandamme et
al., 2007).
As micromotion indicates the likely success of cementless fixation, investigations of
micromotion around implants are essential for prosthesis design. Many such studies have used
Linear Variable Differential Transformers (LVDTs) or customised displacement sensors to
measure micromotion (Choi et al., 2010; Cristofolinia et al., 2003; Speirs et al., 2000; Suarez
et al., 2012). These techniques are mostly restricted to measurements of just normal
micromotion at only a few discrete points on the interface. The sensors may indicate not only
normal micromotion but also bone deformation at the measuring point of the sensors.
Moreover, installing sensors will destroy the bone at the access points. A marker technique
was recently used to measure micromotion (Clarke et al., 2012; Gortchacow et al., 2012; T.
Reiner et al., 2014). This technique use a limited number of markers and, like the LVDT
Chapter 3
93
techniques, is restricted to relatively few measuring points. In summary, the information
gained from previous experimental techniques is limited in scope to just a few points and the
accuracy of the measurement is questionable.
FE analyses provide full-field predictions of micromotion across the prosthesis interface and
does not suffer from the limitations of experimental techniques. However, an in-vitro
technique, complementary to the computational FE technique, is warranted, at least for
validation (Tuncer et al., 2013).
Micro-CT facilities are increasingly available, and their resolution makes it conceptually
feasible to measure the level of micromotion relevant to bone ingrowth (40-150 m).
However, it is impractical to manually identify and track the relative movement of thousands
or even millions of CT-voxels adjacent to the interface. In a different context Digital Volume
Correlation (DVC) has been used to identify and track the voxel patterns of cancellous
structures from micro-CT images, resulting in full-field maps of bone deformation (Bay et al.,
1999). In this Chapter, DVC and micro-CT is used to track the bone and prosthesis
movement, producing micromotion maps over the entire bone-prosthesis interface. This
technique, combining DVC with micro-CT to estimate micromotion, will be referred-to as the
DVC-CT technique.
The aim of this Chapter was to develop the DVC-CT technique and establish if it is a
reliable tool for evaluating micromotion. There were three specific objectives: 1) to evaluate
the accuracy of DVC-CT micromotion in a simple experiment where the micromotion was
known; 2) to determine the correlation between DVC-CT micromotion and manually
tracked micromotion in a more realistic experiment; and 3) to compare the full-field DVC-

Chapter 3
94
CT micromotion against the full-field FE-predicted micromotion in a clinically realistic
experiment.
3.2 Material and methods
3.2.1 DVC-CT micromotion versus ‘known’ micromotion
A fresh porcine glenoid bone was cut to remove all cartilage and create a flat surface. The
bone was fixed inside a customised device using bone cement, placing the flat bone surface
against a polyethylene (PE) disc without compressing the two components. The disc, coated
with a thin (150 m) layer of porous titanium (Figure 3.1a), was moved in a tangential
(shearing) direction; the distance travelled measured using a micrometre (Moore & Wright
Ltd., Sheffield, England). This movement was a measure of the relative tangential movement
between the bone and the PE disc, and was the ‘known’ micromotion with which the DVC-
CT measurements were compared. Three ‘known’ micromotions of 40, 100 and 150 µm
were evaluated, thus covering the range of interface micromotions reported as the threshold
for bone fixation. The experimental set-up was suitable for testing within a micro-CT scanner
causing only a small amount of image artefacts (Figure 3.1b).
Chapter 3
95
(a) (b)
Figure 3. 1 The simplified experimental setup for validating the DVC-CT method against
imposed (‘known’) micromotion. (a) Part of CT-image at the interface of the specimen.
Dashed white square shows the size of the subvolume used in DVC analysis. (b) 1: PE
specimen coated with porous titanium (the implant) and attached to the top part of the fixture;
2: cement block holding flat cut porcine bone, resting on base of fixture and placed flush
against PE component; 3: CT compatible acrylic frame; 4: micrometre for moving the PE
specimen in the vertical direction and measuring the imposed displacement, i.e. the tangential
micromotion.
3.2.2 DVC and micro-CT scanning protocol
The DVC software package, Davis 8.1.6 (LaVision GmbH, Goettingen, Germany) was used
in this thesis. The subvolume size, consistent with other works on trabecular bone (Gillard et
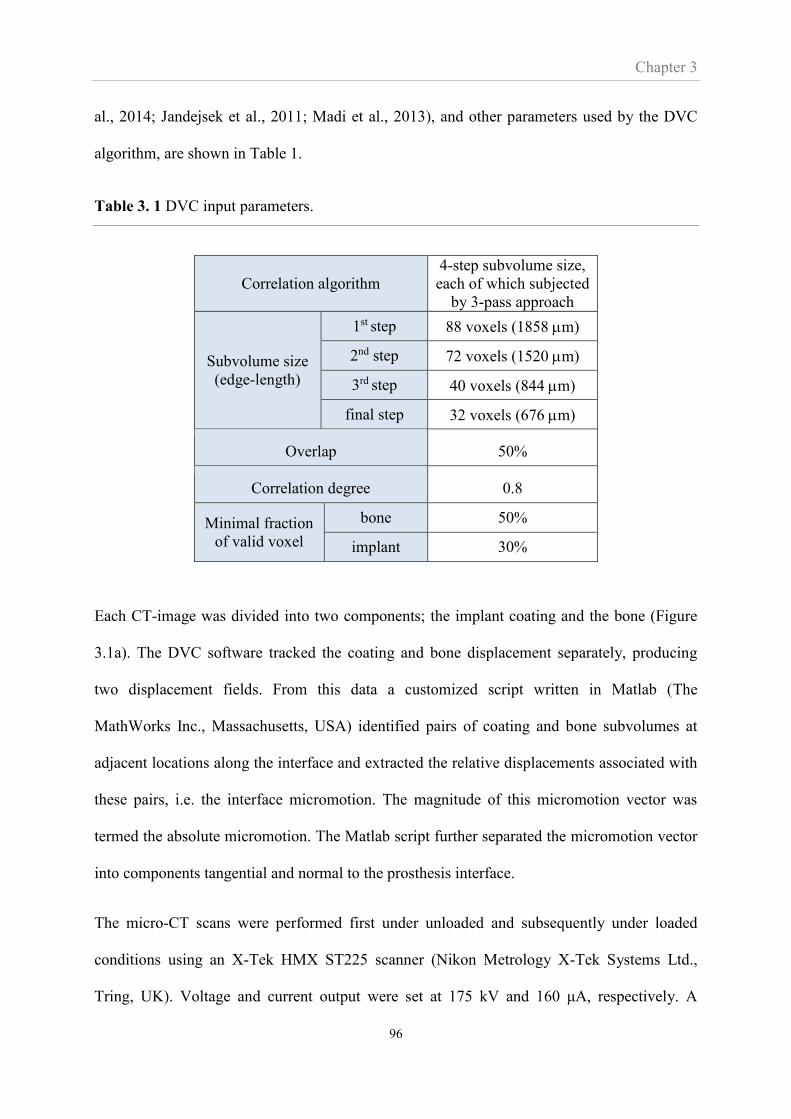
Chapter 3
96
al., 2014; Jandejsek et al., 2011; Madi et al., 2013), and other parameters used by the DVC
algorithm, are shown in Table 1.
Table 3. 1 DVC input parameters.
Correlation algorithm
4-step subvolume size,
each of which subjected
by 3-pass approach
Subvolume size
(edge-length)
1st step 88 voxels (1858 m)
2nd step 72 voxels (1520 m)
3rd step 40 voxels (844 m)
final step 32 voxels (676 m)
Overlap 50%
Correlation degree 0.8
Minimal fraction
of valid voxel
bone 50%
implant 30%
Each CT-image was divided into two components; the implant coating and the bone (Figure
3.1a). The DVC software tracked the coating and bone displacement separately, producing
two displacement fields. From this data a customized script written in Matlab (The
MathWorks Inc., Massachusetts, USA) identified pairs of coating and bone subvolumes at
adjacent locations along the interface and extracted the relative displacements associated with
these pairs, i.e. the interface micromotion. The magnitude of this micromotion vector was
termed the absolute micromotion. The Matlab script further separated the micromotion vector
into components tangential and normal to the prosthesis interface.
The micro-CT scans were performed first under unloaded and subsequently under loaded
conditions using an X-Tek HMX ST225 scanner (Nikon Metrology X-Tek Systems Ltd.,
Tring, UK). Voltage and current output were set at 175 kV and 160 μA, respectively. A

Chapter 3
97
copper filter of 0.25 mm thickness was used to reduce beam-hardening artefacts. 3148
projections were collected during the 20 minute scan process. The projections were
reconstructed using CT Pro XT 2.2 (Nikon Metrology X-Tek Systems Ltd., Tring, UK) to
obtain a 3D volume with a resolution of 22 µm. A stack of rendered CT images was created
using VGStudio Max 2.0 (Volume Graphics GmbH, Heidelberg, Germany).
3.2.3 DVC-CT versus manual tracking and FE predicted micromotion in a clinically
realistic set-up
In this investigation, a PE glenoid prosthesis with a radial curvature of 28 mm and a porous
titanium coating (Affinis Vitamys, Mathys Ltd., Bettlach, Switzerland) was employed. The
prosthesis was implanted, using the procedures specified by the manufacturer, into a fresh
porcine glenoid in which soft tissues including muscle and labrum were removed. The
implanted bone was sectioned 40 mm below the glenoid surface and placed within a micro-
CT compatible device (Figure 3.2). A humeral component with a head radius of 24 mm was
compressed into the glenoid at 60° humeral abduction and a screw was used to apply a
compressive load of 575 N. These conditions simulate clinically relevant shoulder abduction
and joint load (Terrier et al., 2007). The specimen was preconditioned by applying three load-
unload cycles to allow the prosthesis to settle into the bone bed prior to any measurements.
The specimen was wrapped in wet tissue to keep it moist throughout the test. The test was
carried out within the micro-CT scanner and analysed using the DVC and Matlab software as
described in Chapter 2 to determine DVC-CT micromotion across the interface of the
glenoid implant.

Chapter 3
98
(a) (b)
Figure 3. 2 Clinically realistic experimental setup. (a) 1: screw for moving and applying
vertical force to the humeral head; 2: humeral head prosthesis fixed to screw; 3: glenoid
component; 4: glenoid bone; 5: cement holder to keep specimen in aligned at 60° of shoulder
abduction; 6: load cell measuring the load imposed by the screw. (b) CT image of the
specimen showing the profile of the implant and the porous titanium coating. Part of the
interfacial gap is also indicated.
3.2.4 Manual tracking of micromotion at discrete points from CT scans
The profile of the implant is shown in Figure 3.3 which also indicates the 12 discrete points
where micromotion was manually tracked from the CT images using ImageJ (National
Institutes of Health, Maryland, USA). This process was labour intensive and only produced
micromotions at a few points but was carried out for the purpose of evaluating the DVC-CT
methodology. The tracking involved manually inspecting the unloaded CT images and
identifying microscopic characteristic features in both the coating and the adjacent bone
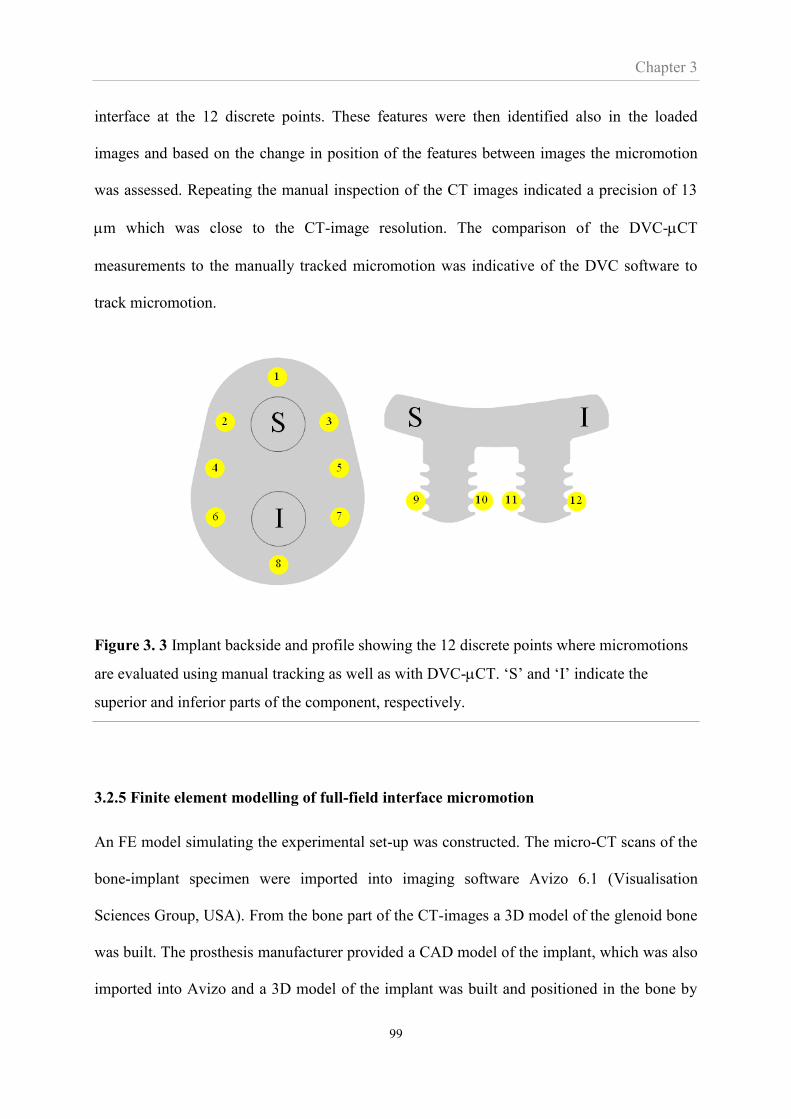
Chapter 3
99
interface at the 12 discrete points. These features were then identified also in the loaded
images and based on the change in position of the features between images the micromotion
was assessed. Repeating the manual inspection of the CT images indicated a precision of 13
m which was close to the CT-image resolution. The comparison of the DVC-CT
measurements to the manually tracked micromotion was indicative of the DVC software to
track micromotion.
Figure 3. 3 Implant backside and profile showing the 12 discrete points where micromotions
are evaluated using manual tracking as well as with DVC-CT. ‘S’ and ‘I’ indicate the
superior and inferior parts of the component, respectively.
3.2.5 Finite element modelling of full-field interface micromotion
An FE model simulating the experimental set-up was constructed. The micro-CT scans of the
bone-implant specimen were imported into imaging software Avizo 6.1 (Visualisation
Sciences Group, USA). From the bone part of the CT-images a 3D model of the glenoid bone
was built. The prosthesis manufacturer provided a CAD model of the implant, which was also
imported into Avizo and a 3D model of the implant was built and positioned in the bone by
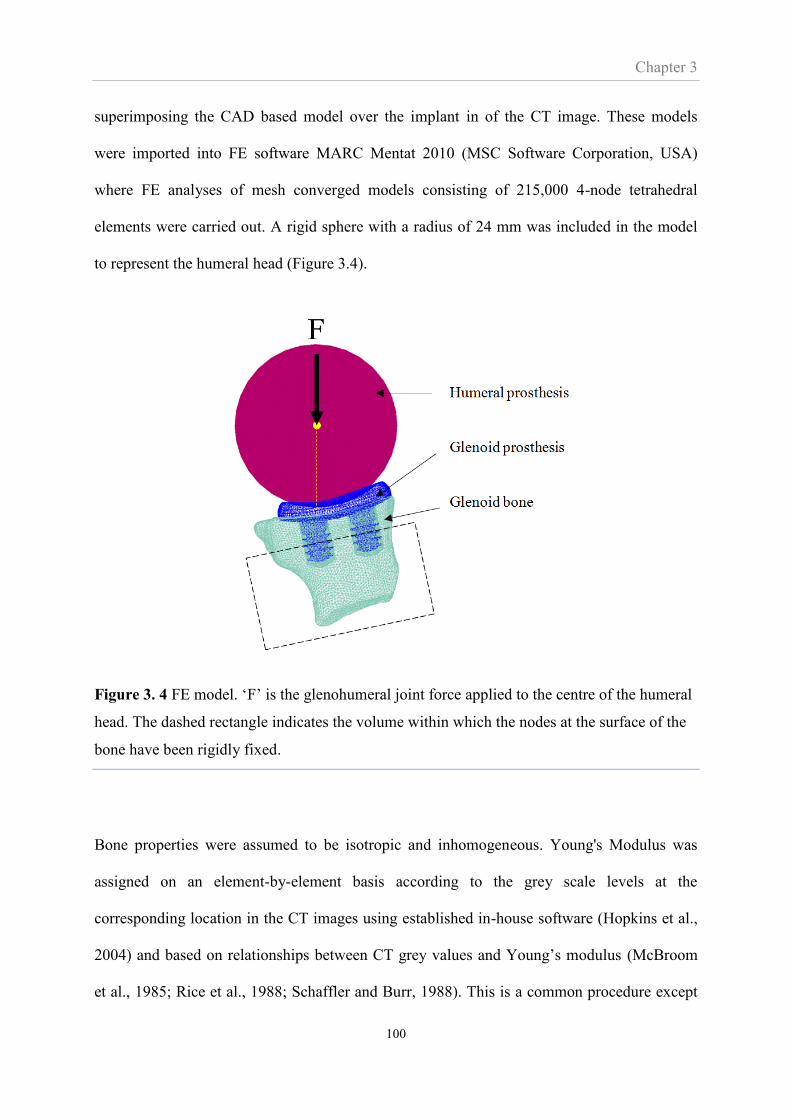
Chapter 3
100
superimposing the CAD based model over the implant in of the CT image. These models
were imported into FE software MARC Mentat 2010 (MSC Software Corporation, USA)
where FE analyses of mesh converged models consisting of 215,000 4-node tetrahedral
elements were carried out. A rigid sphere with a radius of 24 mm was included in the model
to represent the humeral head (Figure 3.4).
Figure 3. 4 FE model. ‘F’ is the glenohumeral joint force applied to the centre of the humeral
head. The dashed rectangle indicates the volume within which the nodes at the surface of the
bone have been rigidly fixed.
Bone properties were assumed to be isotropic and inhomogeneous. Young's Modulus was
assigned on an element-by-element basis according to the grey scale levels at the
corresponding location in the CT images using established in-house software (Hopkins et al.,
2004) and based on relationships between CT grey values and Young’s modulus (McBroom
et al., 1985; Rice et al., 1988; Schaffler and Burr, 1988). This is a common procedure except
Chapter 3
101
it is normally based on standard CT scans. Therefore, the resolution of the micro-CT scans
was artificially reduced to produce images resembling that of standard CT scans. The
polyethylene was modelled as an isotropic material with Young’s modulus 0.8 GPa (Pruitt,
2005).
A Coulomb’s friction model was employed to simulate the contact conditions between the
humeral and glenoid prostheses as well as between the glenoid implant and bone. Friction
coefficients of 0.1 for cobalt-chrome alloy sliding on polyethylene and 0.6 for porous titanium
sliding on trabecular bone were used (Galetz et al., 2010; Shirazi-Adl et al., 1993). A peg
diameter of 8.8 mm and an associated drill diameter of 8.7 mm generated a press-fit effect.
However, due to erosion of the bone during insertion as well as bone stress relaxation the
press-fit achieved is difficult to estimate. To simulate the press-fit a diametrical interference
fit of 100 µm was applied at the interface between the pegs and bone. Imperfect seating of
glenoid components is a common clinical observation (Karelse et al., 2014) and inspection of
the micro-CT scans revealed a narrow gap between the backside of the component and the
bone (Figure 3.2b). The gap height across the interface varied between 0 and 340 µm but the
region under load had an average height of 135 µm (Figure 3.5). The accurate variation of this
narrow gap would be simulated in the FE analysis by using a model with finer mesh density
but such model requires expensive computational time. Furthermore, the FE model with a
variation of gap height is not compatible with the available subroutine for measuring interface
micromotion. Since the gap height is a dominant mechanism affecting micromotion
magnitude, this study used a model with a gap of uniform height of 135µm between the back
of the implant and the bone.
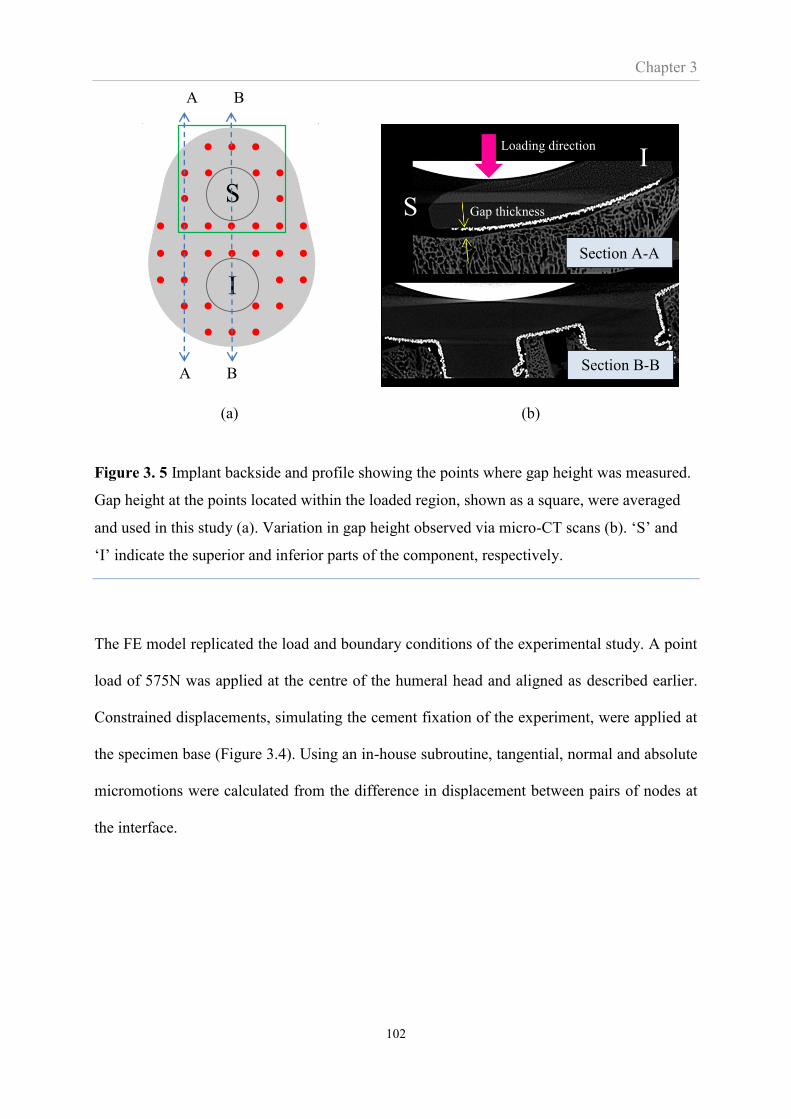
Chapter 3
102
(a) (b)
Figure 3. 5 Implant backside and profile showing the points where gap height was measured.
Gap height at the points located within the loaded region, shown as a square, were averaged
and used in this study (a). Variation in gap height observed via micro-CT scans (b). ‘S’ and
‘I’ indicate the superior and inferior parts of the component, respectively.
The FE model replicated the load and boundary conditions of the experimental study. A point
load of 575N was applied at the centre of the humeral head and aligned as described earlier.
Constrained displacements, simulating the cement fixation of the experiment, were applied at
the specimen base (Figure 3.4). Using an in-house subroutine, tangential, normal and absolute
micromotions were calculated from the difference in displacement between pairs of nodes at
the interface.
S
I
Loading direction
Gap thickness
A B
A B
Section A-A
Section B-B
S
I
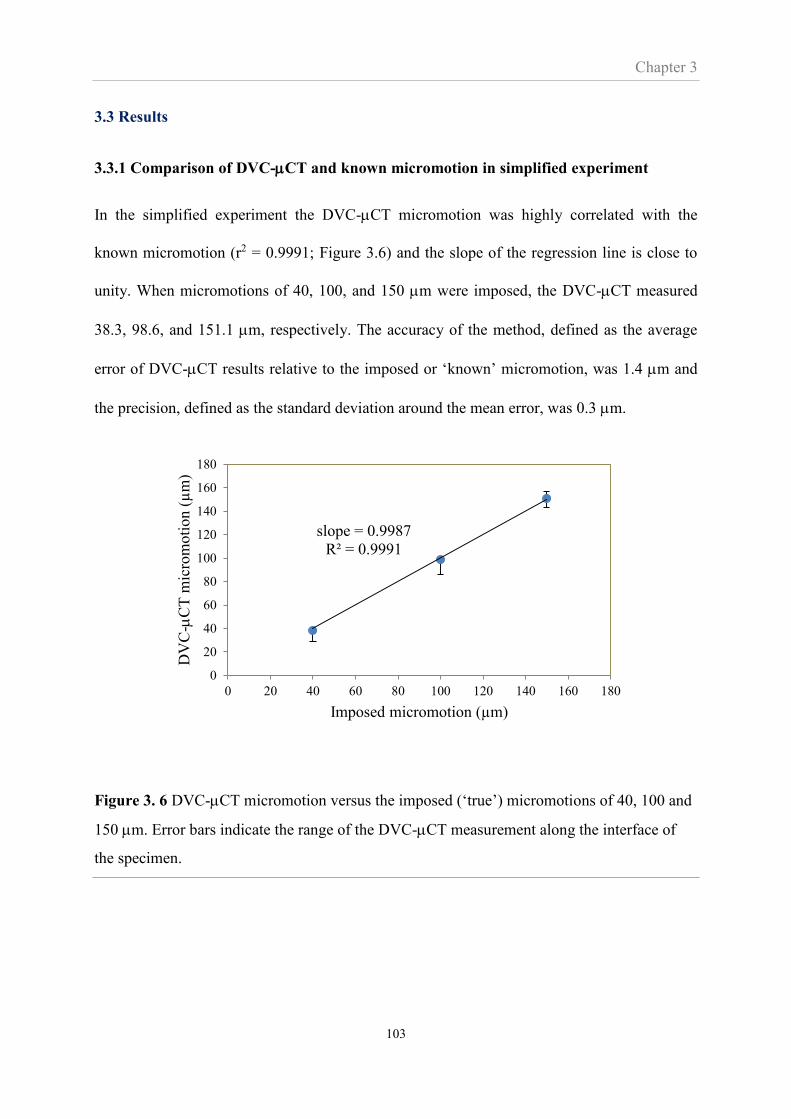
Chapter 3
103
3.3 Results
3.3.1 Comparison of DVC-CT and known micromotion in simplified experiment
In the simplified experiment the DVC-CT micromotion was highly correlated with the
known micromotion (r2 = 0.9991; Figure 3.6) and the slope of the regression line is close to
unity. When micromotions of 40, 100, and 150 m were imposed, the DVC-CT measured
38.3, 98.6, and 151.1 m, respectively. The accuracy of the method, defined as the average
error of DVC-CT results relative to the imposed or ‘known’ micromotion, was 1.4 m and
the precision, defined as the standard deviation around the mean error, was 0.3 m.
Figure 3. 6 DVC-CT micromotion versus the imposed (‘true’) micromotions of 40, 100 and
150 m. Error bars indicate the range of the DVC-CT measurement along the interface of
the specimen.
slope = 0.9987
R² = 0.9991
0
20
40
60
80
100
120
140
160
180
0 20 40 60 80 100 120 140 160 180
DV
C-
CT
mic
rom
oti
on (
µm
)
Imposed micromotion (µm)
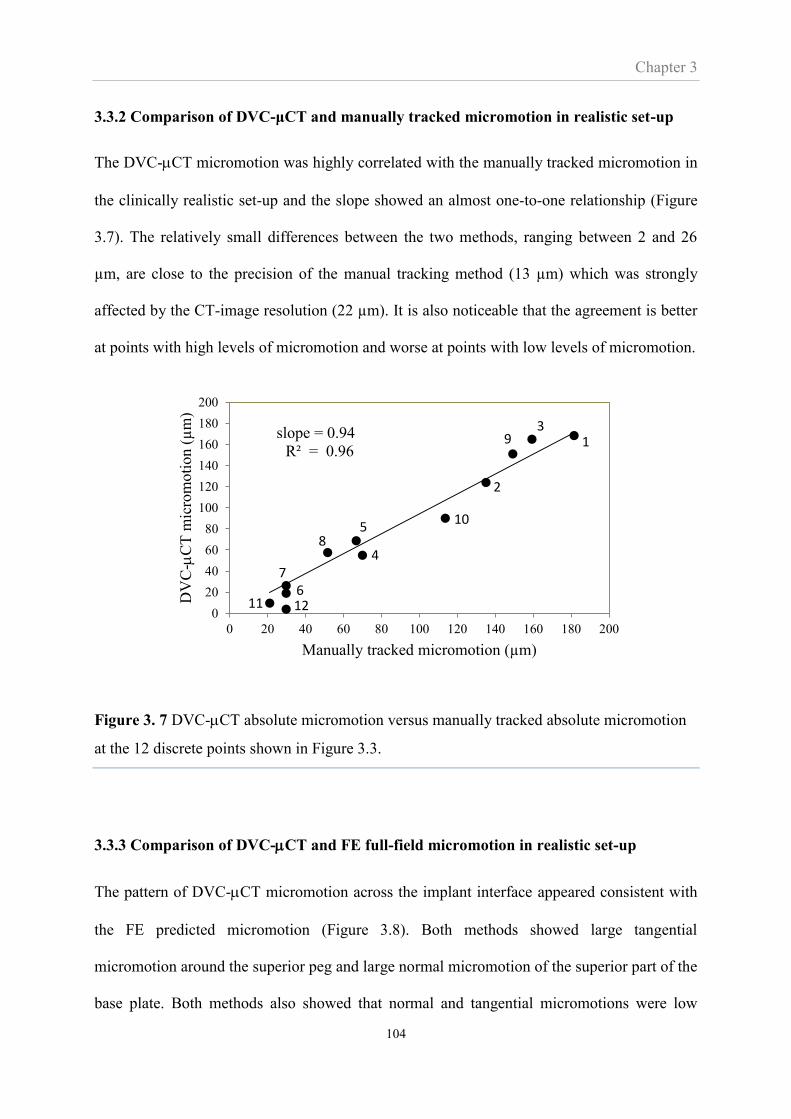
Chapter 3
104
3.3.2 Comparison of DVC-μCT and manually tracked micromotion in realistic set-up
The DVC-CT micromotion was highly correlated with the manually tracked micromotion in
the clinically realistic set-up and the slope showed an almost one-to-one relationship (Figure
3.7). The relatively small differences between the two methods, ranging between 2 and 26
µm, are close to the precision of the manual tracking method (13 µm) which was strongly
affected by the CT-image resolution (22 µm). It is also noticeable that the agreement is better
at points with high levels of micromotion and worse at points with low levels of micromotion.
Figure 3. 7 DVC-CT absolute micromotion versus manually tracked absolute micromotion
at the 12 discrete points shown in Figure 3.3.
3.3.3 Comparison of DVC-CT and FE full-field micromotion in realistic set-up
The pattern of DVC-CT micromotion across the implant interface appeared consistent with
the FE predicted micromotion (Figure 3.8). Both methods showed large tangential
micromotion around the superior peg and large normal micromotion of the superior part of the
base plate. Both methods also showed that normal and tangential micromotions were low
slope = 0.94
R² = 0.96
0
20
40
60
80
100
120
140
160
180
200
0 20 40 60 80 100 120 140 160 180 200
DV
C-
CT
mic
rom
oti
on (
µm
)
Manually tracked micromotion (µm)
1
2
39
10
4
58
11 126
7
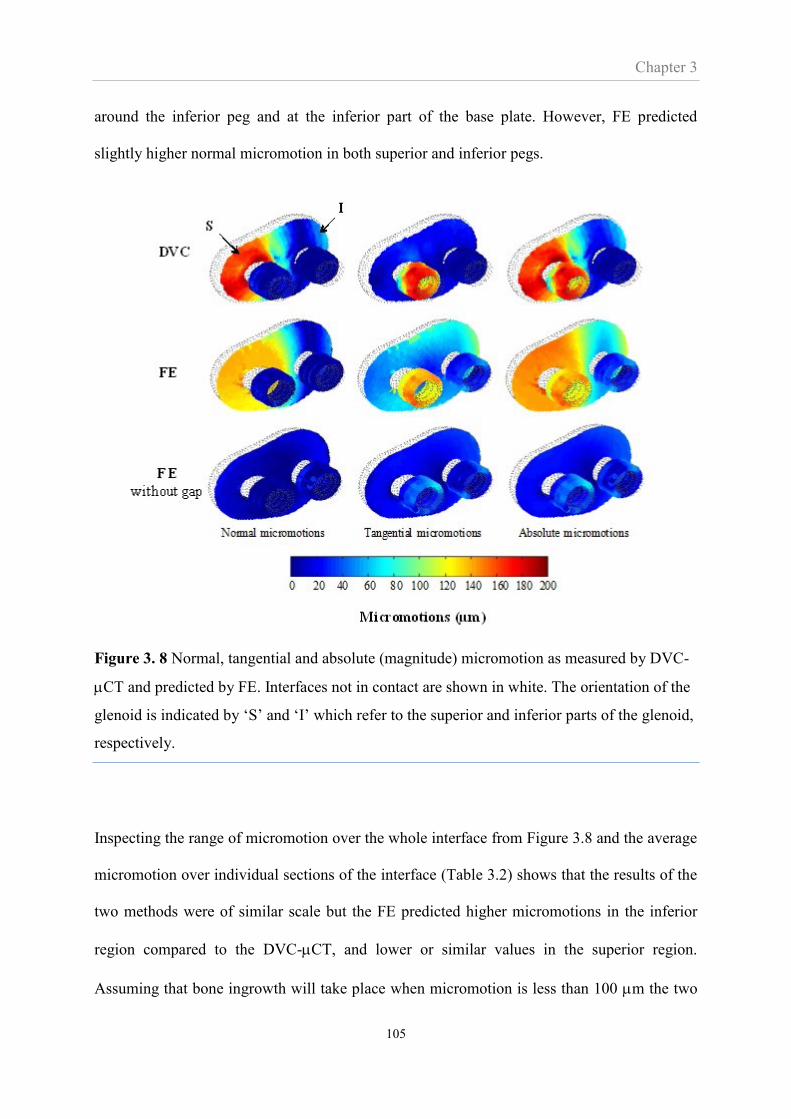
Chapter 3
105
around the inferior peg and at the inferior part of the base plate. However, FE predicted
slightly higher normal micromotion in both superior and inferior pegs.
Figure 3. 8 Normal, tangential and absolute (magnitude) micromotion as measured by DVC-
CT and predicted by FE. Interfaces not in contact are shown in white. The orientation of the
glenoid is indicated by ‘S’ and ‘I’ which refer to the superior and inferior parts of the glenoid,
respectively.
Inspecting the range of micromotion over the whole interface from Figure 3.8 and the average
micromotion over individual sections of the interface (Table 3.2) shows that the results of the
two methods were of similar scale but the FE predicted higher micromotions in the inferior
region compared to the DVC-CT, and lower or similar values in the superior region.
Assuming that bone ingrowth will take place when micromotion is less than 100 m the two
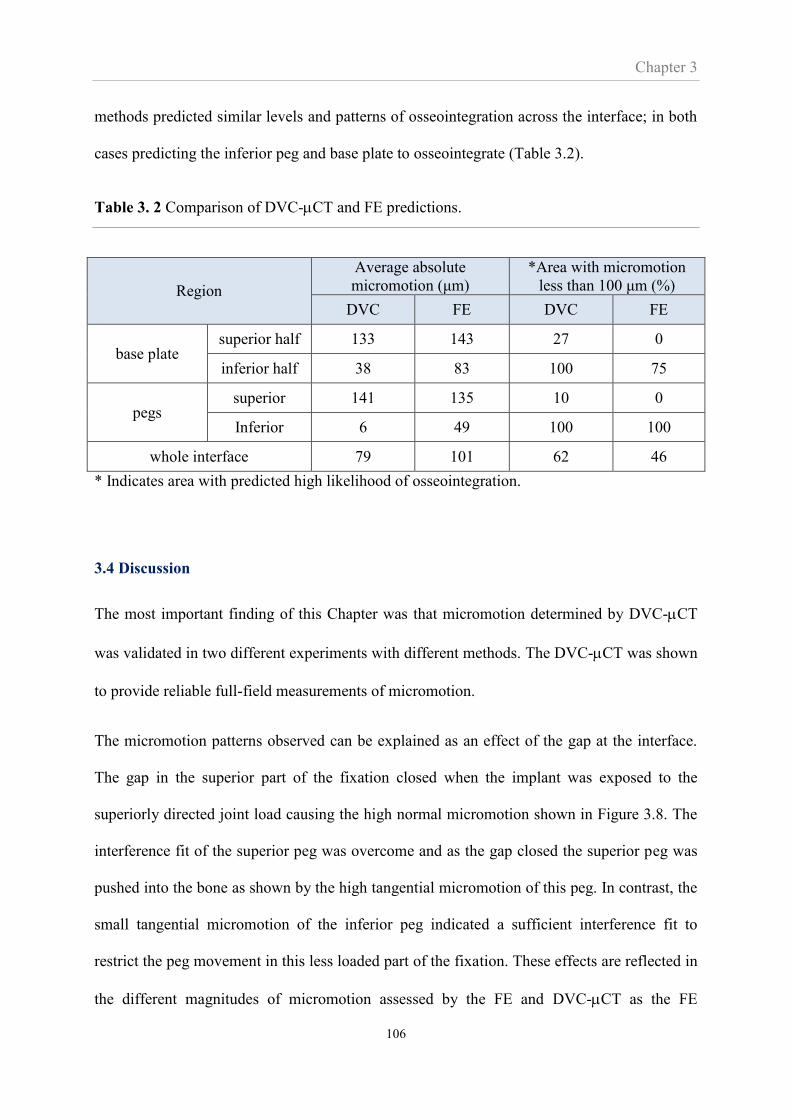
Chapter 3
106
methods predicted similar levels and patterns of osseointegration across the interface; in both
cases predicting the inferior peg and base plate to osseointegrate (Table 3.2).
Table 3. 2 Comparison of DVC-CT and FE predictions.
Region
Average absolute
micromotion (μm)
*Area with micromotion
less than 100 μm (%)
DVC FE DVC FE
base plate superior half 133 143 27 0
inferior half 38 83 100 75
pegs superior 141 135 10 0
Inferior 6 49 100 100
whole interface 79 101 62 46
* Indicates area with predicted high likelihood of osseointegration.
3.4 Discussion
The most important finding of this Chapter was that micromotion determined by DVC-CT
was validated in two different experiments with different methods. The DVC-CT was shown
to provide reliable full-field measurements of micromotion.
The micromotion patterns observed can be explained as an effect of the gap at the interface.
The gap in the superior part of the fixation closed when the implant was exposed to the
superiorly directed joint load causing the high normal micromotion shown in Figure 3.8. The
interference fit of the superior peg was overcome and as the gap closed the superior peg was
pushed into the bone as shown by the high tangential micromotion of this peg. In contrast, the
small tangential micromotion of the inferior peg indicated a sufficient interference fit to
restrict the peg movement in this less loaded part of the fixation. These effects are reflected in
the different magnitudes of micromotion assessed by the FE and DVC-CT as the FE
Chapter 3
107
prediction depends on the height of the gap and amount of interference fit modelled. As
mentioned, accurate values of these two FE input parameters were difficult to assess and some
difference in magnitude between FE and DVC-CT results is expected.
Interference fit also increases the amount of normal micromotion of the pegs predicted by the
FE. This occurred when the FE deformed the pegs and adjacent bone to simulate the
interference fit. The contact nodes were moved mostly perpendicular to the contact surface
without subjected by external load. As a result, normal micromotion at the pegs was
unintentionally produced. Although this amount of micromotion was relatively small
compared to that in other places, removing it could improve the FE accuracy.
A FE model identical to the described model but without an interference gap exhibited low
levels (< 60 m) of micromotion (Figure 3.8). Thus the inherent stability of the implant was
sufficient to indicate complete osseointegration but the surgical procedure – which created the
gap - caused the relatively high levels of micromotions shown in Figure 3.8. Proper implant
seating is a clinically critical issue (Matsen et al., 2008; Mavrogenis et al., 2009); a view
supported by this result. However, an investigation of the effect of clinically achieved levels
of implant seating was not within the scope of this Thesis.
Suarez et al. (Suarez et al., 2012) investigated the micromotion of a cementless glenoid
implant using FE models and LVDT measurements. However, their study did not include an
interface gap making a comparison difficult. Comparing the results from the FE model
without a gap mentioned above showed similar trends to Suarez et al.’s results; both studies
predicted relatively higher normal micromotion with lifting off at the glenoid rim opposite the
loaded part of the prosthesis, confirming the so-called ‘rocking horse’ effect. Suarez et al.
predicted this lift-off to be ~70 m whereas this study showed only 21 m. This difference is
likely due to Suarez et. al. applying a higher load (x1.4) and not having an interference-fit peg

Chapter 3
108
under the part of the glenoid lifting off. Suggestive of the practical difficulties of using
LVDTs, Suarez et al. provided no LVDT measurements around the pegs but only of one point
on the backside of the implant.
An important consideration when using the DVC-CT method is that it requires the implant
interface to lead to a pattern on the CT-images that can be tracked by the DVC software. In
this study the coating of titanium particles provided such a pattern; without this coating the
movement of the implant would have been difficult to track. Furthermore, a component that
includes a thick metal back, or metal screws, may result in artefacts on the CT images so
severe that tracking may be difficult. Such artefacts may be overcome by CT artefact reducing
algorithms but represent a potential limitation of the method.
The resolution of the underlying CT images represents a limitation to the accuracy of the
technique (Roberts et al., 2014). However, the accuracy is more fundamentally limited by the
inherent scale of the pattern of the cancellous bone structures. A lower threshold subvolume
edge-length of 672 m was identified in this study. Below this size subvolumes were so small
that they often represented void areas between the cancellous structures which led to
insufficient pattern information to be tracked. In contrast, if the subvolume edge-length was
larger than 840 m the thin coating of the implant often did not provide enough information
within a subvolume to track the coating. Requiring such a fine balance between the scale of
the patterns created by the implant and the bone suggests a limitation of the methodology,
however, it could probably be overcome by using subvolumes of different sizes for the bone
and the implant. A related issue is if the bone is osteoporotic which may increase the
minimum subvolume size.
In DIC strain analysis, it is common to use multiple images in order to track the pattern
undergoing large deformation. In this study, only two images were used to track micromotion
Chapter 3
109
and it seems plausible that micromotion does not lead to significant deformation of the
tracked patterns and therefore is less sensitive to this issue.
Including a ‘standard’ in-vitro LVDT technique in the study for the purposes of validating the
DVC-CT technique was considered. However, the metallic LVDT wires will create artifacts
on DVC-CT images and to gain access the LVDT technique removes the very bone at the
interface which the DVC-CT needs for tracking.
A key reason for using DVC-CT in this study is its ability to provide full-field micromotion
maps across the implant-bone interface. It was, therefore, used in the comparison with the
full-field predictions of the FE method. Conceptually, it is inappropriate to ‘validate’ real
measurements by comparing them to theoretical FE predictions. This approach was used
because the DVC-CT method is new, while the FE method has a track record in this field.
The relative strengths of the methods were clearly demonstrated, as the influential interface
gap was inherently accounted for by the DVC-CT method but only an inspection of micro-
CT images led to the gap being included in the FE model; most FE studies are based on
standard CT images (or no CT images) and would most likely have missed the gap altogether.
Still, FE methods offer the ability to vary such parameters, in this study shown by including,
as well as excluding, the gap to determine its importance.
In conclusion, the DVC-CT methodology provides micromotion measurements over the
entire interface and is able to estimate both normal and tangential components. It produces
better accuracy than previous techniques since the measurements are obtained directly from
the interface with no influence from additional motion components such as deformation of the
bone. In the following Chapter the method will be used to investigate the effect of
misalignment on micromotion around a cementless glenoid component.
Chapter 4
110
CHAPTER 4
The effect of misalignment on cementless
glenoid prosthesis fixation (porcine bone
specimens)
Outline of Chapter 4
In Chapter 3 the DVC-CT method for measuring micromotion was validated and in this
chapter the DVC-CT method, in combination with FE analyses, will be used to investigate
the effect of misalignment on glenoid fixation. In this chapter, the effect of version on glenoid
component micromotion is investigated. The investigation used seven porcine specimens
implanted with different degrees of version: 15°, 10°, 5° of retroversion and anteversion,
respectively, and one in neutral (0°) version. Consistent agreement between the DVC-CT
and FE methods was observed providing confidence in the predictions of FE method.
4.1 Introduction
Glenoid component loosening and instability correlating with component dislocation have
been reported as post-operative complications (Franta et al., 2007; Hasan et al., 2002;
Skirving, 1999) and the main indicator for revision surgery (Antuna et al., 2001). These two
complications are caused by multiple factors, one of which is the misalignment of the glenoid
(Antuna et al., 2001; Franta et al., 2007) component. The cause of component misalignment is
multifactorial involving poor exposure of the shoulder joint during intra-operative surgery,
surgeon experience (Skirving, 1999; Ricchetti and Williams Jr, 2011), and often relates to the
availability of glenoid bone stock. The glenoid bone is inherently small and is often further
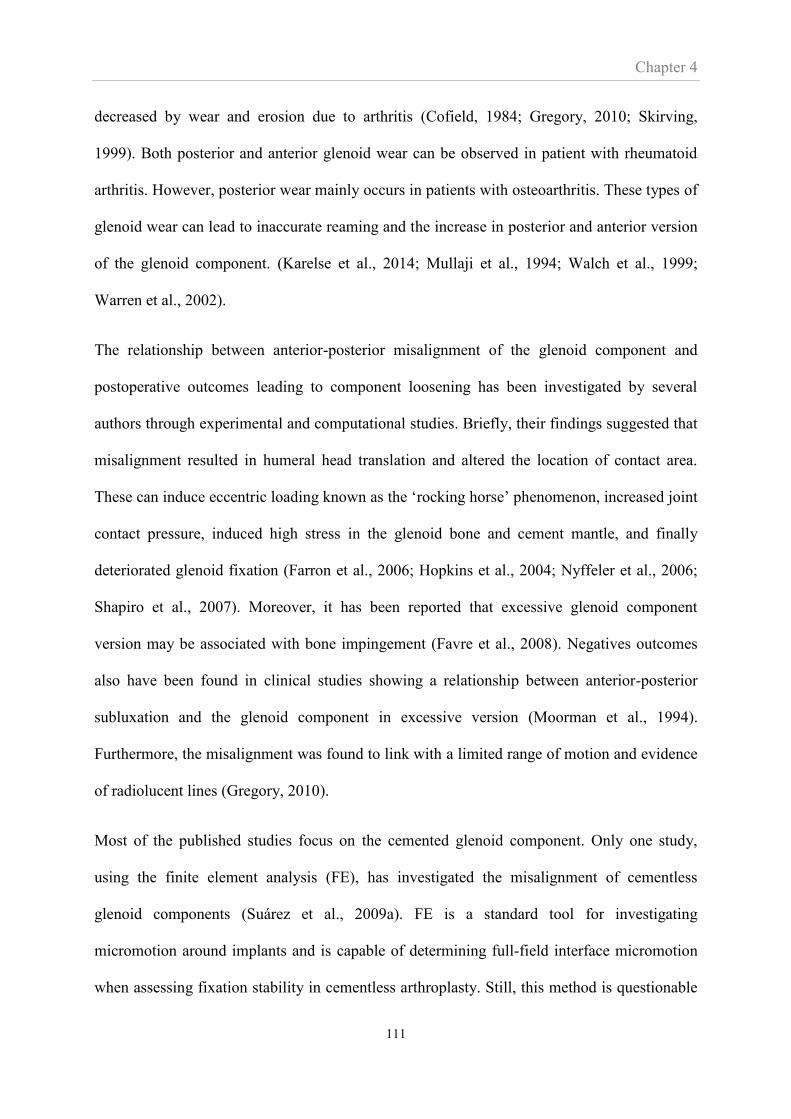
Chapter 4
111
decreased by wear and erosion due to arthritis (Cofield, 1984; Gregory, 2010; Skirving,
1999). Both posterior and anterior glenoid wear can be observed in patient with rheumatoid
arthritis. However, posterior wear mainly occurs in patients with osteoarthritis. These types of
glenoid wear can lead to inaccurate reaming and the increase in posterior and anterior version
of the glenoid component. (Karelse et al., 2014; Mullaji et al., 1994; Walch et al., 1999;
Warren et al., 2002).
The relationship between anterior-posterior misalignment of the glenoid component and
postoperative outcomes leading to component loosening has been investigated by several
authors through experimental and computational studies. Briefly, their findings suggested that
misalignment resulted in humeral head translation and altered the location of contact area.
These can induce eccentric loading known as the ‘rocking horse’ phenomenon, increased joint
contact pressure, induced high stress in the glenoid bone and cement mantle, and finally
deteriorated glenoid fixation (Farron et al., 2006; Hopkins et al., 2004; Nyffeler et al., 2006;
Shapiro et al., 2007). Moreover, it has been reported that excessive glenoid component
version may be associated with bone impingement (Favre et al., 2008). Negatives outcomes
also have been found in clinical studies showing a relationship between anterior-posterior
subluxation and the glenoid component in excessive version (Moorman et al., 1994).
Furthermore, the misalignment was found to link with a limited range of motion and evidence
of radiolucent lines (Gregory, 2010).
Most of the published studies focus on the cemented glenoid component. Only one study,
using the finite element analysis (FE), has investigated the misalignment of cementless
glenoid components (Suárez et al., 2009a). FE is a standard tool for investigating
micromotion around implants and is capable of determining full-field interface micromotion
when assessing fixation stability in cementless arthroplasty. Still, this method is questionable
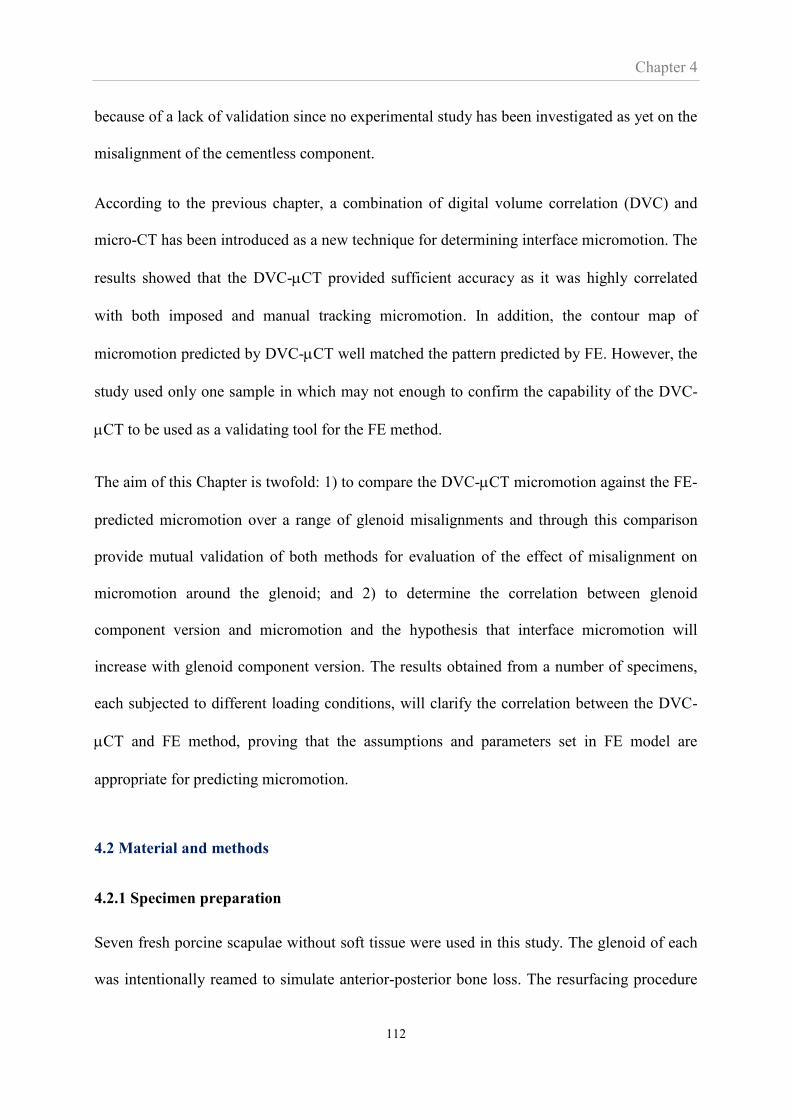
Chapter 4
112
because of a lack of validation since no experimental study has been investigated as yet on the
misalignment of the cementless component.
According to the previous chapter, a combination of digital volume correlation (DVC) and
micro-CT has been introduced as a new technique for determining interface micromotion. The
results showed that the DVC-CT provided sufficient accuracy as it was highly correlated
with both imposed and manual tracking micromotion. In addition, the contour map of
micromotion predicted by DVC-CT well matched the pattern predicted by FE. However, the
study used only one sample in which may not enough to confirm the capability of the DVC-
CT to be used as a validating tool for the FE method.
The aim of this Chapter is twofold: 1) to compare the DVC-CT micromotion against the FE-
predicted micromotion over a range of glenoid misalignments and through this comparison
provide mutual validation of both methods for evaluation of the effect of misalignment on
micromotion around the glenoid; and 2) to determine the correlation between glenoid
component version and micromotion and the hypothesis that interface micromotion will
increase with glenoid component version. The results obtained from a number of specimens,
each subjected to different loading conditions, will clarify the correlation between the DVC-
CT and FE method, proving that the assumptions and parameters set in FE model are
appropriate for predicting micromotion.
4.2 Material and methods
4.2.1 Specimen preparation
Seven fresh porcine scapulae without soft tissue were used in this study. The glenoid of each
was intentionally reamed to simulate anterior-posterior bone loss. The resurfacing procedure
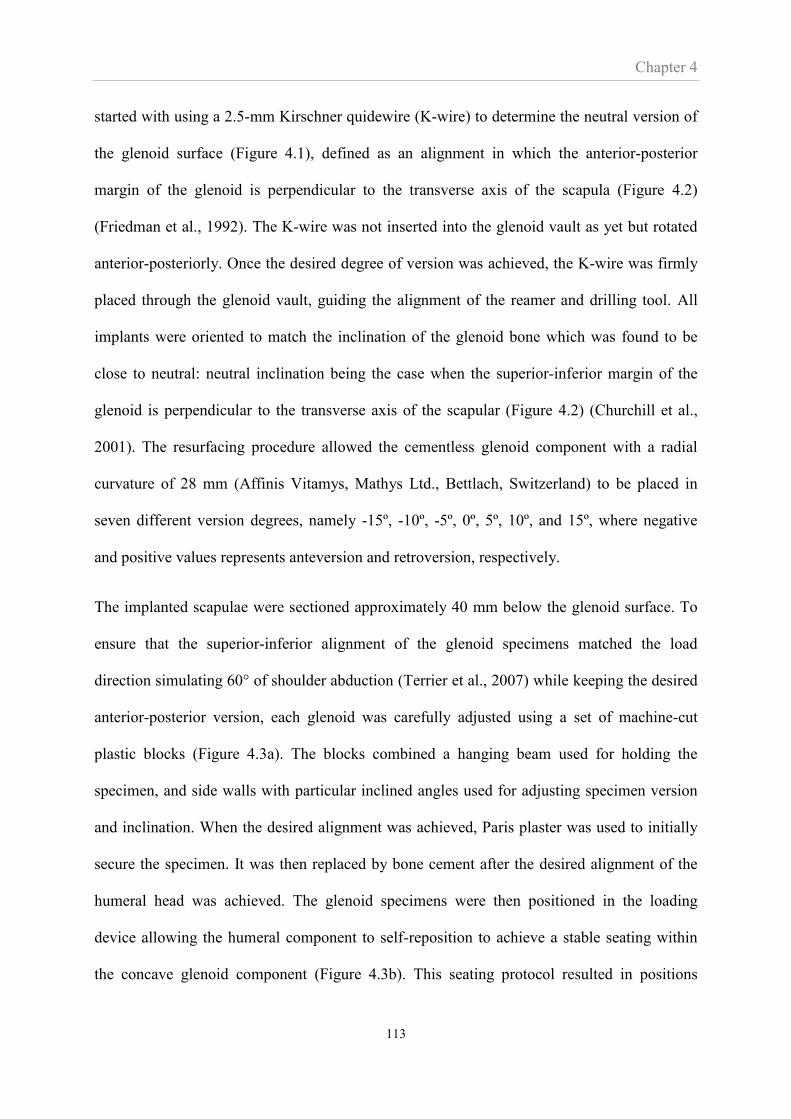
Chapter 4
113
started with using a 2.5-mm Kirschner quidewire (K-wire) to determine the neutral version of
the glenoid surface (Figure 4.1), defined as an alignment in which the anterior-posterior
margin of the glenoid is perpendicular to the transverse axis of the scapula (Figure 4.2)
(Friedman et al., 1992). The K-wire was not inserted into the glenoid vault as yet but rotated
anterior-posteriorly. Once the desired degree of version was achieved, the K-wire was firmly
placed through the glenoid vault, guiding the alignment of the reamer and drilling tool. All
implants were oriented to match the inclination of the glenoid bone which was found to be
close to neutral: neutral inclination being the case when the superior-inferior margin of the
glenoid is perpendicular to the transverse axis of the scapular (Figure 4.2) (Churchill et al.,
2001). The resurfacing procedure allowed the cementless glenoid component with a radial
curvature of 28 mm (Affinis Vitamys, Mathys Ltd., Bettlach, Switzerland) to be placed in
seven different version degrees, namely -15º, -10º, -5º, 0º, 5º, 10º, and 15º, where negative
and positive values represents anteversion and retroversion, respectively.
The implanted scapulae were sectioned approximately 40 mm below the glenoid surface. To
ensure that the superior-inferior alignment of the glenoid specimens matched the load
direction simulating 60° of shoulder abduction (Terrier et al., 2007) while keeping the desired
anterior-posterior version, each glenoid was carefully adjusted using a set of machine-cut
plastic blocks (Figure 4.3a). The blocks combined a hanging beam used for holding the
specimen, and side walls with particular inclined angles used for adjusting specimen version
and inclination. When the desired alignment was achieved, Paris plaster was used to initially
secure the specimen. It was then replaced by bone cement after the desired alignment of the
humeral head was achieved. The glenoid specimens were then positioned in the loading
device allowing the humeral component to self-reposition to achieve a stable seating within
the concave glenoid component (Figure 4.3b). This seating protocol resulted in positions
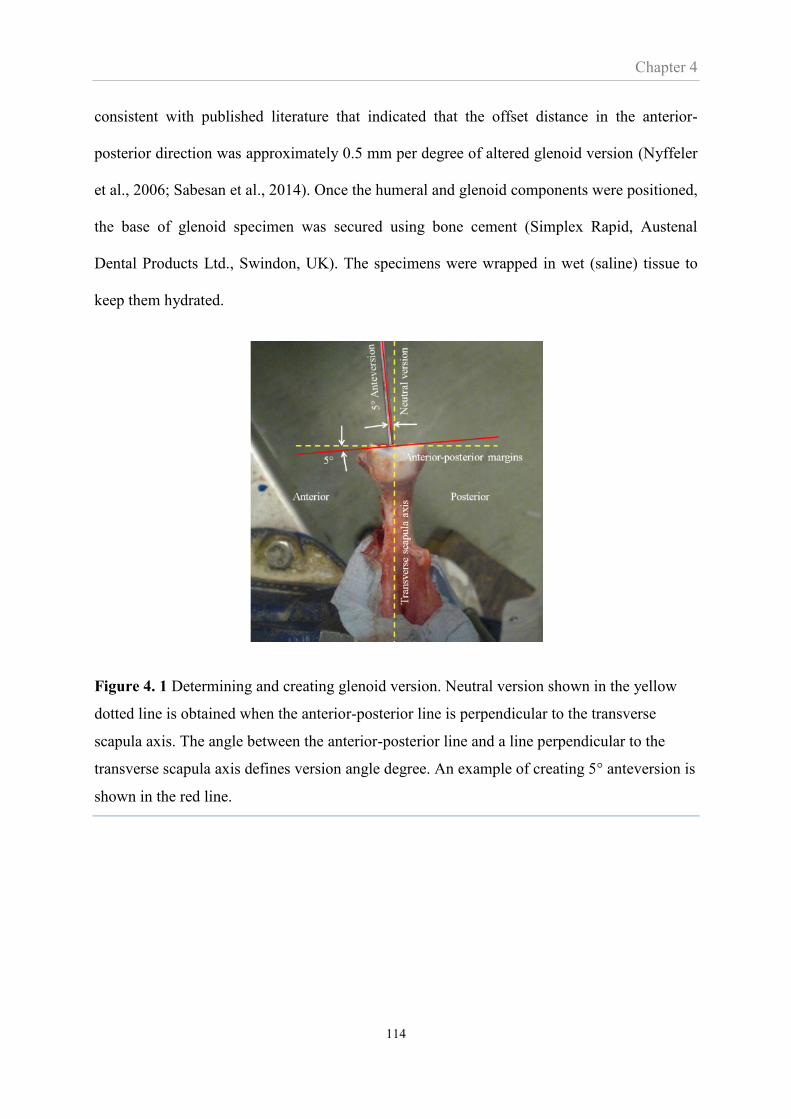
Chapter 4
114
consistent with published literature that indicated that the offset distance in the anterior-
posterior direction was approximately 0.5 mm per degree of altered glenoid version (Nyffeler
et al., 2006; Sabesan et al., 2014). Once the humeral and glenoid components were positioned,
the base of glenoid specimen was secured using bone cement (Simplex Rapid, Austenal
Dental Products Ltd., Swindon, UK). The specimens were wrapped in wet (saline) tissue to
keep them hydrated.
Figure 4. 1 Determining and creating glenoid version. Neutral version shown in the yellow
dotted line is obtained when the anterior-posterior line is perpendicular to the transverse
scapula axis. The angle between the anterior-posterior line and a line perpendicular to the
transverse scapula axis defines version angle degree. An example of creating 5° anteversion is
shown in the red line.
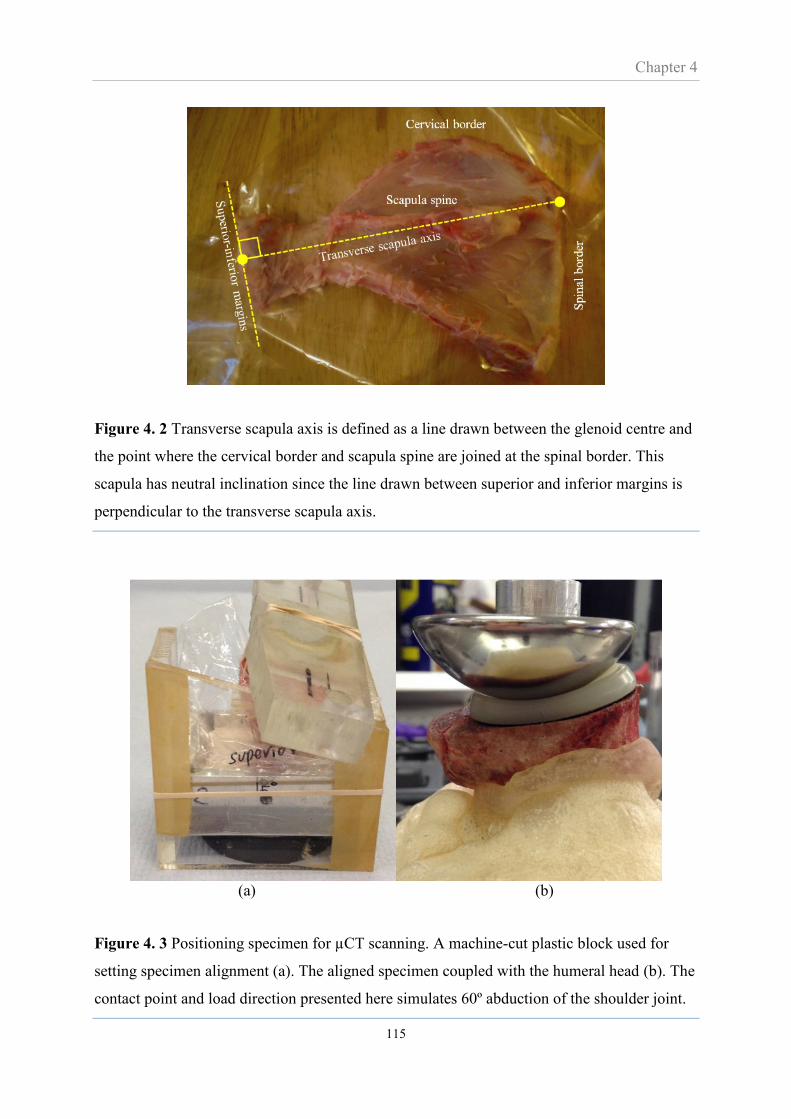
Chapter 4
115
Figure 4. 2 Transverse scapula axis is defined as a line drawn between the glenoid centre and
the point where the cervical border and scapula spine are joined at the spinal border. This
scapula has neutral inclination since the line drawn between superior and inferior margins is
perpendicular to the transverse scapula axis.
(a) (b)
Figure 4. 3 Positioning specimen for µCT scanning. A machine-cut plastic block used for
setting specimen alignment (a). The aligned specimen coupled with the humeral head (b). The
contact point and load direction presented here simulates 60º abduction of the shoulder joint.

Chapter 4
116
4.2.2 Scanning protocol and DVC-μCT micromotion
Apart from the alignment protocol described above, the experimental, micro-CT scanning and
DVC procedures and settings were identical to those described in Chapter 3.
4.2.3 Finite element modelling
Each of the seven experimental studies was simulated through a FE model, constructed based
on the corresponding micro-CT scans. As a result, seven FE models with element numbers
ranged from 140,000 to 260,000 were obtained. The work of Chapter 3 showed implant
seating (the interface gap) strongly affected micromotion. Therefore, the specimen specific
modelling included simulating the specific gap size for each specimen. The size of the gap in
each specimen was assessed as described in Section 3.2.5 of Chapter 3. Apart from these
details, the FE modelling procedures and settings in this chapter were identical to those of
Chapter 3.
For each of the seven FE models an additional model, identical except that it did not include a
gap (i.e. they were perfectly seated), was constructed. The purpose of these models was to
further assess the effect of the gap and to evaluate the effect of misalignment on micromotion
isolated from the effect of the gap.
4.3 Results
4.3.1 The effect of version and implant seating (i.e. interface gap) on micromotion:
DVC-CT versus FE
The contour maps of micromotion over the glenoid fixation interface for the various degrees
of version as measured and predicted by DVC-CT and FE respectively, are shown in Figure
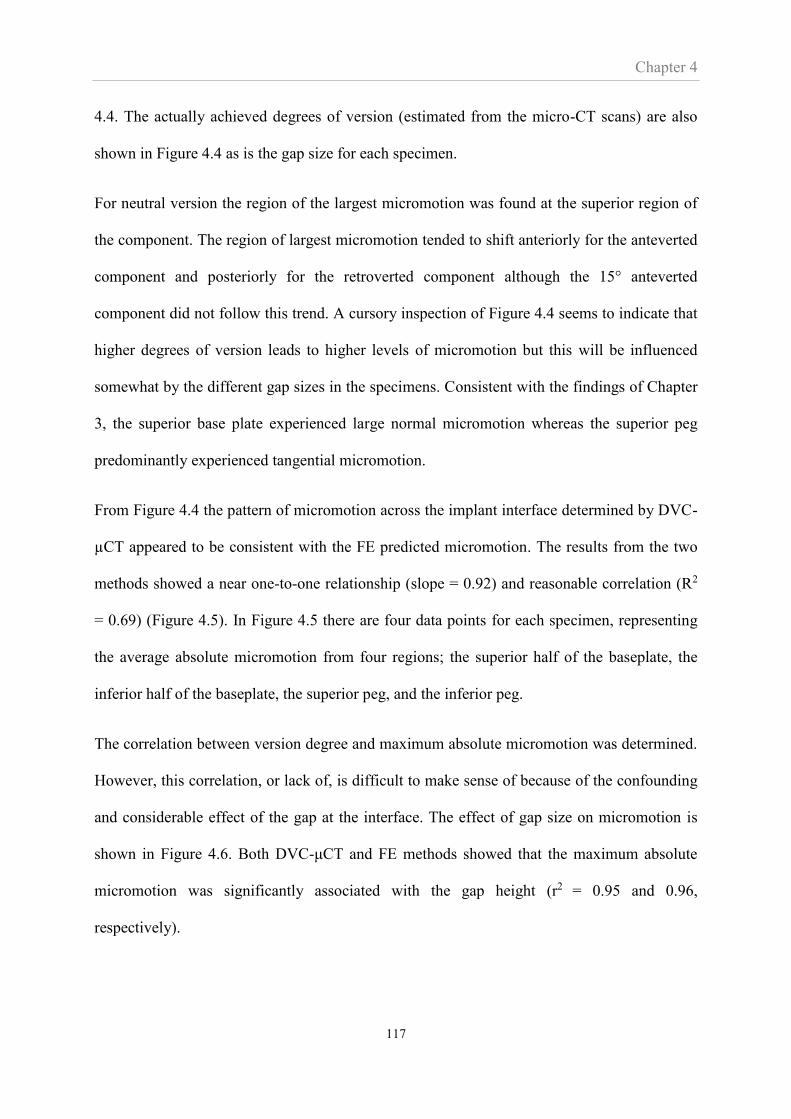
Chapter 4
117
4.4. The actually achieved degrees of version (estimated from the micro-CT scans) are also
shown in Figure 4.4 as is the gap size for each specimen.
For neutral version the region of the largest micromotion was found at the superior region of
the component. The region of largest micromotion tended to shift anteriorly for the anteverted
component and posteriorly for the retroverted component although the 15° anteverted
component did not follow this trend. A cursory inspection of Figure 4.4 seems to indicate that
higher degrees of version leads to higher levels of micromotion but this will be influenced
somewhat by the different gap sizes in the specimens. Consistent with the findings of Chapter
3, the superior base plate experienced large normal micromotion whereas the superior peg
predominantly experienced tangential micromotion.
From Figure 4.4 the pattern of micromotion across the implant interface determined by DVC-
µCT appeared to be consistent with the FE predicted micromotion. The results from the two
methods showed a near one-to-one relationship (slope = 0.92) and reasonable correlation (R2
= 0.69) (Figure 4.5). In Figure 4.5 there are four data points for each specimen, representing
the average absolute micromotion from four regions; the superior half of the baseplate, the
inferior half of the baseplate, the superior peg, and the inferior peg.
The correlation between version degree and maximum absolute micromotion was determined.
However, this correlation, or lack of, is difficult to make sense of because of the confounding
and considerable effect of the gap at the interface. The effect of gap size on micromotion is
shown in Figure 4.6. Both DVC-μCT and FE methods showed that the maximum absolute
micromotion was significantly associated with the gap height (r2 = 0.95 and 0.96,
respectively).

Chapter 4
118
Figure 4. 4 Actual version degree, average gap height and absolute micromotion pattern
obtained from DVC-µCT and FE method during realistic experimental set-up. The specimens
used in this study were harvested randomly from both left and right shoulder. For a reader-
friendly purpose, some contour plots were mirrored to be aligned accordingly. ‘S’, ‘I’, ‘A’,
‘P’ indicate the superior, inferior, anterior and posterior parts of the component, respectively.
300
250
200
150
100
50
0
Version degree Gap height
(µm) DVC FEIdeal Actual
Ante
ver
sion
-15 -13 148
-10 -12 180
-5 -7 190
Neu
tral
0 0 135
Ret
rover
sion
+5 +4 121
+10 +10 218
+15 +17 267
S
IP
A
Abso
lute
mic
rom
oti
on
(µm
)
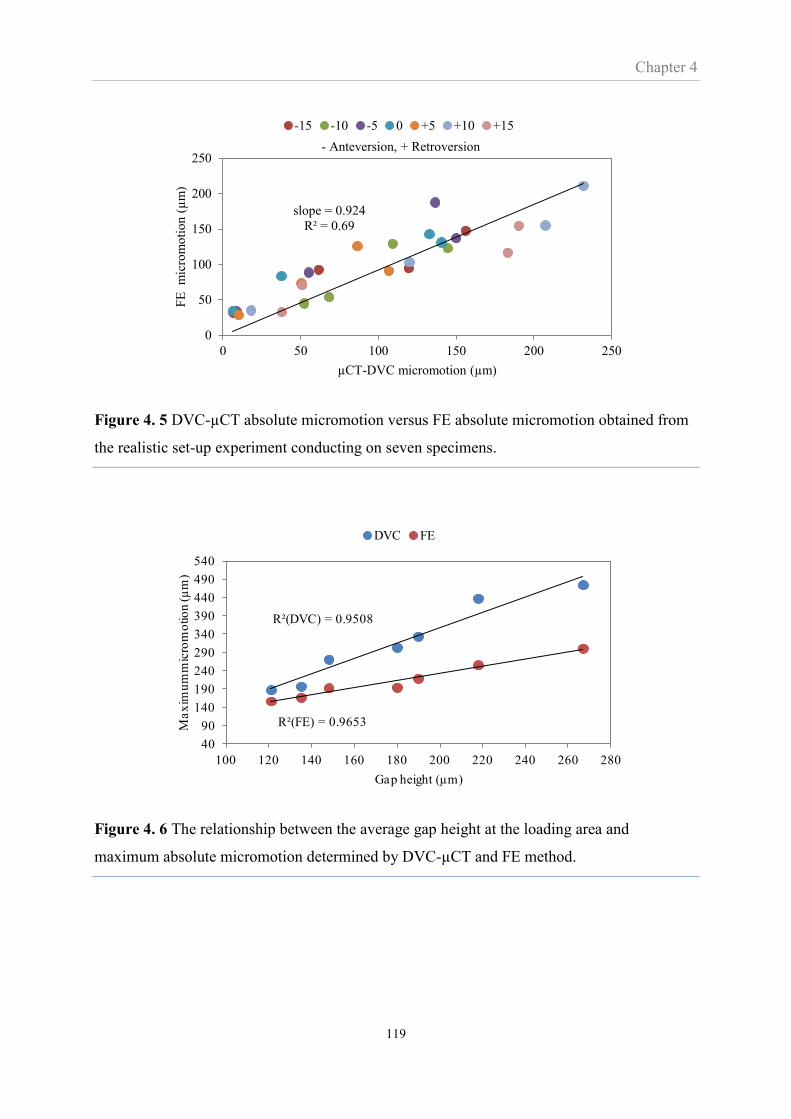
Chapter 4
119
Figure 4. 5 DVC-µCT absolute micromotion versus FE absolute micromotion obtained from
the realistic set-up experiment conducting on seven specimens.
Figure 4. 6 The relationship between the average gap height at the loading area and
maximum absolute micromotion determined by DVC-µCT and FE method.
slope = 0.924
R² = 0.69
0
50
100
150
200
250
0 50 100 150 200 250
FE
m
icro
mo
tio
n (
µm
)
µCT-DVC micromotion (µm)
- Anteversion, + Retroversion
-15 -10 -5 0 +5 +10 +15
R²(DVC) = 0.9508
R²(FE) = 0.9653
40
90
140
190
240
290
340
390
440
490
540
100 120 140 160 180 200 220 240 260 280
Ma
xim
um
mic
rom
otio
n (µ
m)
Gap height (µm)
DVC FE
Chapter 4
120
4.3.2 The effect of version on micromotion when isolated from effect of implant seating
When no interface gap was presented, the FE analyses predicted relatively low levels of
micromotion; less than 60 μm (Figure 4.6). The influence of the gap is therefore clear and the
variation in magnitudes of micromotion between the seven specimens seen in Figure 4.4 is
probably more representative of the different gap sizes in the specimens than the different
degrees of version. Another difference in the FE models with no gap, compared to the
specimens with a gap, was that the maximum absolute micromotion invariably occurred at the
inferior region of the component base plate (Figure 4.7) and mostly consisted of tangential
micromotion. However, the magnitude of maximum micromotion was affected by the degree
of version; the neutrally aligned component produced the smallest degree of maximum
absolute micromotion (32 μm) while the glenoids with 15° component version produced the
largest degree of maximum absolute micromotion (55 and 59 μm for anteversion and
retroversion, respectively). There was a positive correlation between increased micromotion
and both anteversion (R2 = 0.75) and retroversion (R2 = 0.60) (Figure 4.8). Tangential
micromotion was dominant at the pegs but low in magnitude compared to the maximum
absolute micromotion found around the inferior region of the component baseplate. At the
pegs, there was little correlation (R2 <0.34) between version and maximum absolute
micromotion.
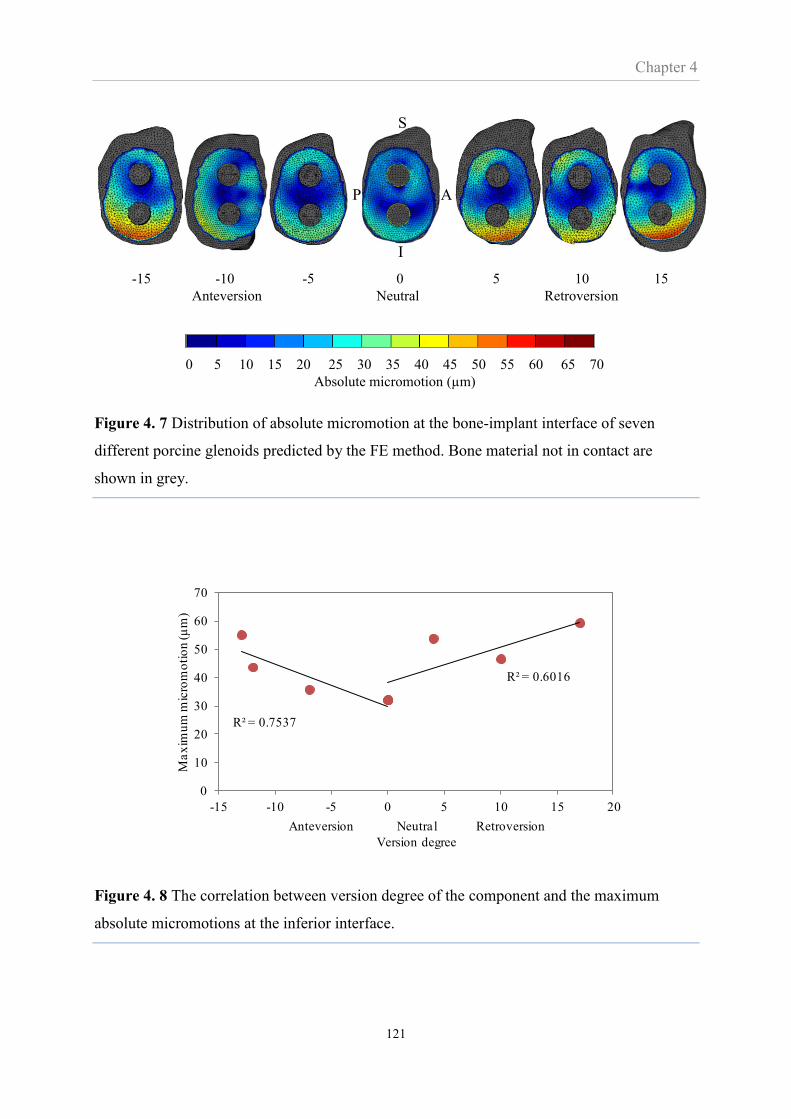
Chapter 4
121
Figure 4. 7 Distribution of absolute micromotion at the bone-implant interface of seven
different porcine glenoids predicted by the FE method. Bone material not in contact are
shown in grey.
Figure 4. 8 The correlation between version degree of the component and the maximum
absolute micromotions at the inferior interface.
0 5 10 15 20 25 30 35 40 45 50 55 60 65 70
Absolute micromotion (µm)
-15 -10 -5 0 5 10 15
Anteversion Neutral Retroversion
S
I
AP
R² = 0.7537
R² = 0.6016
0
10
20
30
40
50
60
70
-15 -10 -5 0 5 10 15 20
Ma
xim
um
mic
rom
oti
on
(µ
m)
Anteversion Neutral Retroversion
Version degree

Chapter 4
122
4.4 Discussion
The most important findings of this chapter were: 1) in specimens with imperfect seating the
pattern of micromotion was affected by the degree of version, however, this effect of version
was less apparent in specimens with perfect seating. 2) The magnitude of micromotion
increased with version for both imperfect and perfect seating, however, in the case of
imperfect seating this seemed mostly related to the gap size and in the case of perfect seating
the micromotion was sufficiently low to indicate osseointegration for all levels of version. 3)
The DVC-CT and the FE methods were consistent in their assessment of the effects of
version on micromotion and provided overall confidence in both methods for this purpose.
The effect of version on micromotion was not consistent for all levels of version. Notably, the
15° anteverted specimen did not follow the trend of the region of high micromotion moving
anteriorly (Figure 4.4). However, the fact that both the DVC-CT and FE method predicted
the same lack of trend for this specimen probably means that micromotion is affected by the
specimen specific geometry and material properties.
It has been suggested that reaming procedure is difficult and may lead to incomplete
component seating (Karelse et al., 2014). This was observed in this study, where the reamed
bone and component surface were incongruent, producing gaps which increase towards the
rim profile. Micromotion patterns observed in this study were influenced by the gap size as
well as the location of applied load. This would be expected as the load would close the gap
resulting in large normal micromotion underneath the loaded region. The load was applied at
the superior region of the component but could translate anterior-posteriorly according to the
glenoid component version. For the base plate, large micromotion was likely to occur at the
region where the load was applied. Micromotion at the pegs can be explained in the same
manner. The applied load forced the superior peg to translate downward resulting in peg
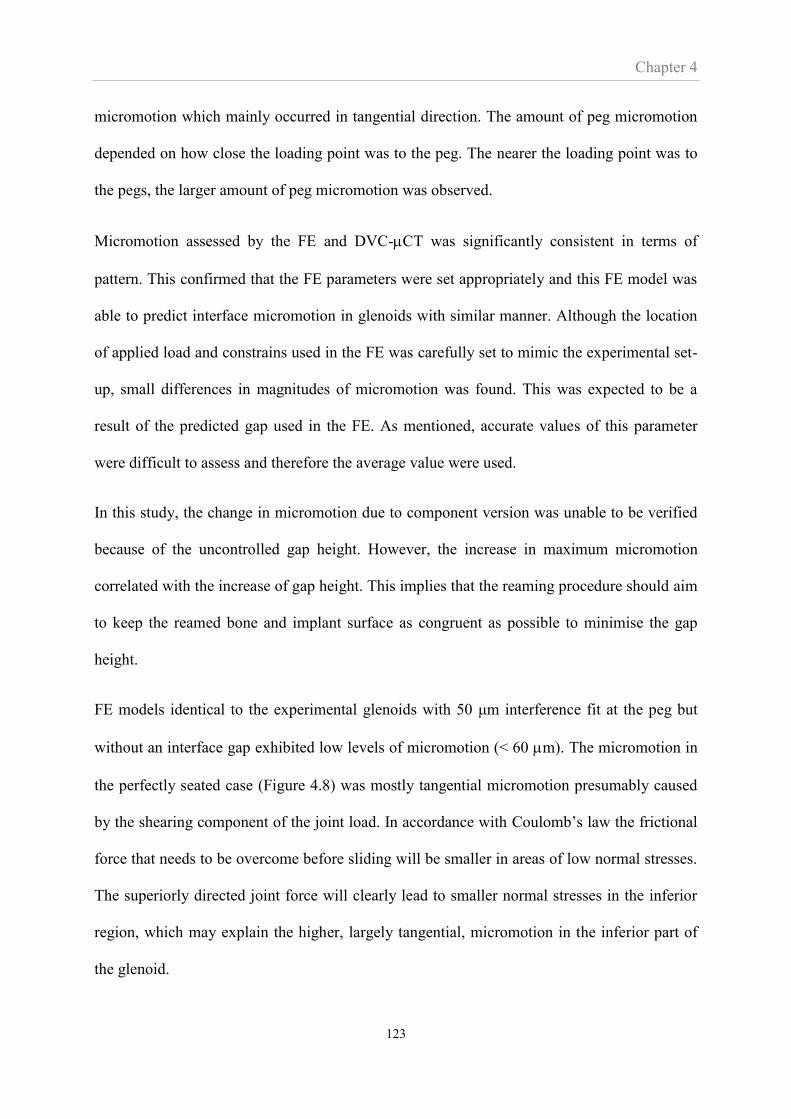
Chapter 4
123
micromotion which mainly occurred in tangential direction. The amount of peg micromotion
depended on how close the loading point was to the peg. The nearer the loading point was to
the pegs, the larger amount of peg micromotion was observed.
Micromotion assessed by the FE and DVC-CT was significantly consistent in terms of
pattern. This confirmed that the FE parameters were set appropriately and this FE model was
able to predict interface micromotion in glenoids with similar manner. Although the location
of applied load and constrains used in the FE was carefully set to mimic the experimental set-
up, small differences in magnitudes of micromotion was found. This was expected to be a
result of the predicted gap used in the FE. As mentioned, accurate values of this parameter
were difficult to assess and therefore the average value were used.
In this study, the change in micromotion due to component version was unable to be verified
because of the uncontrolled gap height. However, the increase in maximum micromotion
correlated with the increase of gap height. This implies that the reaming procedure should aim
to keep the reamed bone and implant surface as congruent as possible to minimise the gap
height.
FE models identical to the experimental glenoids with 50 μm interference fit at the peg but
without an interface gap exhibited low levels of micromotion (< 60 m). The micromotion in
the perfectly seated case (Figure 4.8) was mostly tangential micromotion presumably caused
by the shearing component of the joint load. In accordance with Coulomb’s law the frictional
force that needs to be overcome before sliding will be smaller in areas of low normal stresses.
The superiorly directed joint force will clearly lead to smaller normal stresses in the inferior
region, which may explain the higher, largely tangential, micromotion in the inferior part of
the glenoid.
Chapter 4
124
Suarez et al. (Suárez et al., 2009a) investigated the influence of positioning of a cementless
glenoid prosthesis on micromotion using FE models. Their FE study did not include an
interface gap. Comparing their results to this study (Fig.4.8), reveal similarity in that a large
micromotion was located at the inferior region of the interface and its maximum range lied
between 50 and 80 μm. In contrast to this study, their results showed that retroversion
produced the least micromotion followed by anteversion and neutral version. They found the
same trend in rheumatoid bone models where the maximum micromotion ranged between 150
and 250 μm. These differences may be caused by the prostheses used in the two studies.
Suarez’s prosthesis only had one central screw as opposed to the two press-fit pegs of this
study. Perhaps even more importantly Suarez et al. applied the joint force to the same area of
the glenoid surface for all degrees of version. In this thesis, the point of load application was
allowed to translate on the glenoid surface for different degrees of version consistent with the
findings reported by Nyffeler et al (2006).
A limitation of this study is the load contact point in the experiment. The perfect contact point
between the humeral head and glenoid prosthesis was sometimes shifted as a consequence of
the curing process of the bone cement. However, this error was presumably small as the FE
models in which the humeral head was unconstrained allowing it to find and stay in the self-
positioned and stable position predicted similar results to the DVC-CT experiment.
In conclusion, in the experiments a gap invariably formed in all specimens. Such imperfect
seating is a clinical reality and this study indicates that it is probably a very common
occurrence that has a significant effect on micromotion. In this thesis, which is focussed on
the effect of version, the presence of that gap made it difficult to isolate and properly evaluate
the effect of version from the clearly strong effect of the interface gap. Also, the micromotion
appeared to be affected by specimen specificity, particularly stiffness. Micromotion would be

Chapter 4
125
expected to be larger in a less dense glenoid. This factor led to inconsistent assessment of the
effect of version. Finally, some of the findings based on porcine specimens indicated that the
implant would osseointegrate irrespective of the amount of version, but arguably this may not
translate to the less dense human bone from older patients. These three issues; imperfect
seating, specimen specificity and porcine bone, necessitate an FE study on the effect of
version in human bone. In an FE study the problem of the gap can be eliminated; different
levels of version can be tested in the same specimen avoiding specimen specific issues; an FE
study of human bone does not involve the common ethical and practical issues of testing
human bone. Hence, in Chapter 5 an FE study of the effect of version using human bone will
be carried out.
Chapter 5
126
CHAPTER 5
The effect of misalignment on cementless
glenoid prosthesis fixation and the
importance of bone quality (human bone)
Outline of Chapter 5
In Chapter 4 the effect of version on micromotion was compounded by issues of imperfect
seating and specimen specificity, both of which made it difficult to isolate and interpret the
effect of version. Also Chapter 4 predicted low levels of micromotion but this may be
attributed to the use of porcine bone. In this Chapter the effect of version on micromotion will
again be investigated using CT scans of elderly human cadaveric bone as a basis for an FE
model. The FE approach allows the gap at the interface to be removed from the analysis and
different degrees of version to be investigated for the same specimen so as to isolate the issue
of specimen specific effects. In addition, this Chapter will investigate the effect of the degree
of arm abduction on micromotion. The purpose of this latter part is to confirm if the position
of 60° abduction used throughout this study is appropriate.
5.1 Introduction
Shoulder arthroplasty is a standard treatment to restore shoulder function. The most common
reasons for undergoing this treatment are osteoarthritis and rheumatoid arthritis (Norris and
Iannotti, 2002). Patients with these conditions often experience unbearable pain due to
deformed glenoid cartilage and bone. The pattern of glenoid deformity is highly variable and
involves posterior and anterior wear (Habermeyer et al., 2006; Mullaji et al., 1994). This

Chapter 5
127
complication in combination with poor exposure of the shoulder joint intraoperatively makes
the alignment of the glenoid prosthesis difficult and may cause excessive misalignment. This
can result in unsatisfactory outcomes such as component instability and loosening and often
necessitates future revision surgery (Warren et al., 2002).
A study of glenoid version conducted on quantitative CT images (Friedman et al., 1992)
reported that a range of glenoid anteversion of 2º±5º was found in the normal shoulder
whereas retroversion of 11º±8º was common in patients with osteoarthritis or inflammatory
arthritis. Thus, 2º anteversion was suggested to be a goal for shoulder reconstruction. Results
from several studies on glenoid replacement support this somewhat; neutrally aligned
prostheses were found to cause the least negative outcomes, indicated by the stress in cement
mantle, contact pressure, humeral head subluxation and impingement (Farron et al., 2006;
Favre et al., 2008; Hopkins et al., 2004; Nyffeler et al., 2006). However, an argument whether
an implant alignment close to 2º anteversion or neutral is optimal for cementless arthroplasty
has been unclear.
Failed arthroplasty due to excessive micromotion could possibly occur as a result of
component misalignment or excessive joint load. To the author’s knowledge, only one study
focusing on the influence of component version on micromotion has been conducted by
Suárez et al. (2009a), however, the effect of humeral head translation corresponding to the
component version suggested by Nyffeler et al. (2006) was not taken into account.
The aim of this study was to gain more understanding about the effect of glenoid component
version on interface micromotion in human based cementless arthroplasty and find the
optimal component version and its tolerable range for successful bone ingrowth. This study
used the finite element method to simulate the human shoulder joint during a range of
abduction angles. Micromotion of the glenoids implanted in five different degrees of version
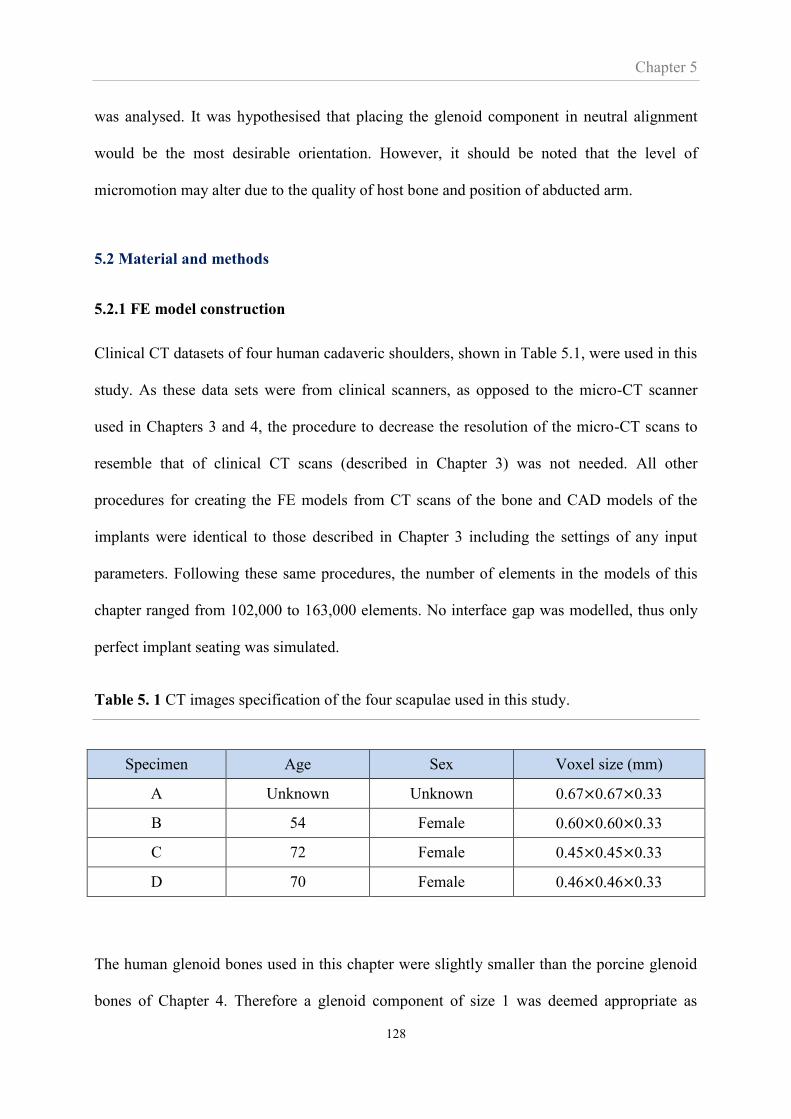
Chapter 5
128
was analysed. It was hypothesised that placing the glenoid component in neutral alignment
would be the most desirable orientation. However, it should be noted that the level of
micromotion may alter due to the quality of host bone and position of abducted arm.
5.2 Material and methods
5.2.1 FE model construction
Clinical CT datasets of four human cadaveric shoulders, shown in Table 5.1, were used in this
study. As these data sets were from clinical scanners, as opposed to the micro-CT scanner
used in Chapters 3 and 4, the procedure to decrease the resolution of the micro-CT scans to
resemble that of clinical CT scans (described in Chapter 3) was not needed. All other
procedures for creating the FE models from CT scans of the bone and CAD models of the
implants were identical to those described in Chapter 3 including the settings of any input
parameters. Following these same procedures, the number of elements in the models of this
chapter ranged from 102,000 to 163,000 elements. No interface gap was modelled, thus only
perfect implant seating was simulated.
Table 5. 1 CT images specification of the four scapulae used in this study.
Specimen Age Sex Voxel size (mm)
A Unknown Unknown 0.67×0.67×0.33
B 54 Female 0.60×0.60×0.33
C 72 Female 0.45×0.45×0.33
D 70 Female 0.46×0.46×0.33
The human glenoid bones used in this chapter were slightly smaller than the porcine glenoid
bones of Chapter 4. Therefore a glenoid component of size 1 was deemed appropriate as

Chapter 5
129
opposed to the larger size 2 glenoid component used in Chapter 4. These smaller glenoid
components provided less constraint against joint dislocation and components that were
implanted in 15° of retroversion, or anteversion, were prone to dislocate when loaded. Thus in
this chapter, only 5 different degrees of version were investigated: -10°, -5°, 0°, 5°, and 10°,
where the negative and positive sign refer to anterversion and retroversion, respectively as
indicated in Figure 5.1. The alignment procedure was described in Chapter 4 and is also
indicated in Figure 5.1.
(a) (b)
Figure 5. 1 The setting of glenoid prosthesis according to anatomical landmarks. (a) The
transverse axis of the scapula is defined as the line connecting the centre of the glenoid (GC)
and the most medial point of the trigonum spinae (TS). (b) The glenoid prosthesis was set in
five different versions. The version degree was defined as an angle between the line
connecting the anterior and the posterior rim of the prosthesis and the line perpendicular to the
transverse axis of the scapula. Anteversion and retroversion refers to the alignment with a
glenoid prosthesis facing anteriorly and posteriorly, respectively.

Chapter 5
130
5.2.2 Bone density and Young’s modulus
One of the aims of this chapter was to investigate the effect of specimen specific properties,
specifically Young’s modulus, on micromotion. The bone density distributions extracted via
CT scans of four specimens, is shown in Figure 5.2 and the average and maximum Young’s
modulus is shown in Figure 5.3. The Young’s modulus of the porcine bone used in Chapter 4
is also shown in this Figure.
Figure 5. 2 Variation in apparent density of the four FE models used in this study.
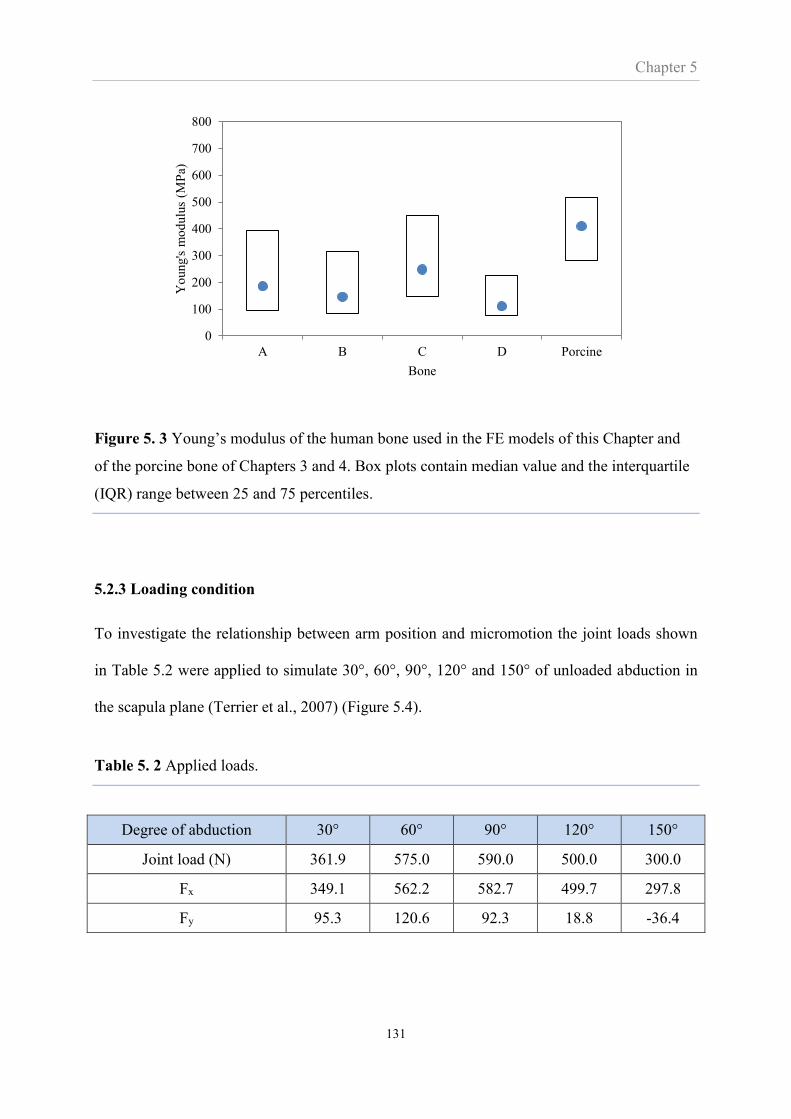
Chapter 5
131
Figure 5. 3 Young’s modulus of the human bone used in the FE models of this Chapter and
of the porcine bone of Chapters 3 and 4. Box plots contain median value and the interquartile
(IQR) range between 25 and 75 percentiles.
5.2.3 Loading condition
To investigate the relationship between arm position and micromotion the joint loads shown
in Table 5.2 were applied to simulate 30°, 60°, 90°, 120° and 150° of unloaded abduction in
the scapula plane (Terrier et al., 2007) (Figure 5.4).
Table 5. 2 Applied loads.
Degree of abduction 30° 60° 90° 120° 150°
Joint load (N) 361.9 575.0 590.0 500.0 300.0
Fx 349.1 562.2 582.7 499.7 297.8
Fy 95.3 120.6 92.3 18.8 -36.4
0
100
200
300
400
500
600
700
800
A B C D Porcine
Yo
ung's
mo
dulu
s (M
Pa)
Bone
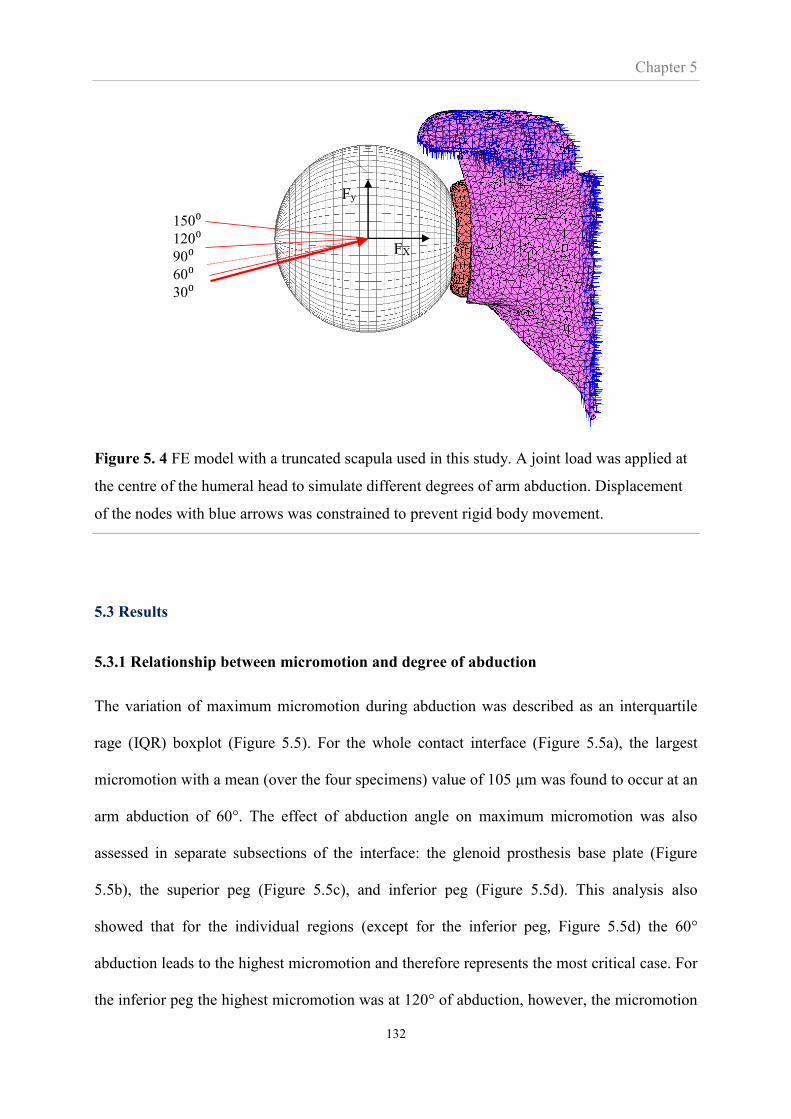
Chapter 5
132
Figure 5. 4 FE model with a truncated scapula used in this study. A joint load was applied at
the centre of the humeral head to simulate different degrees of arm abduction. Displacement
of the nodes with blue arrows was constrained to prevent rigid body movement.
5.3 Results
5.3.1 Relationship between micromotion and degree of abduction
The variation of maximum micromotion during abduction was described as an interquartile
rage (IQR) boxplot (Figure 5.5). For the whole contact interface (Figure 5.5a), the largest
micromotion with a mean (over the four specimens) value of 105 μm was found to occur at an
arm abduction of 60°. The effect of abduction angle on maximum micromotion was also
assessed in separate subsections of the interface: the glenoid prosthesis base plate (Figure
5.5b), the superior peg (Figure 5.5c), and inferior peg (Figure 5.5d). This analysis also
showed that for the individual regions (except for the inferior peg, Figure 5.5d) the 60°
abduction leads to the highest micromotion and therefore represents the most critical case. For
the inferior peg the highest micromotion was at 120° of abduction, however, the micromotion
150⁰120⁰90⁰60⁰30⁰
FX
Fy
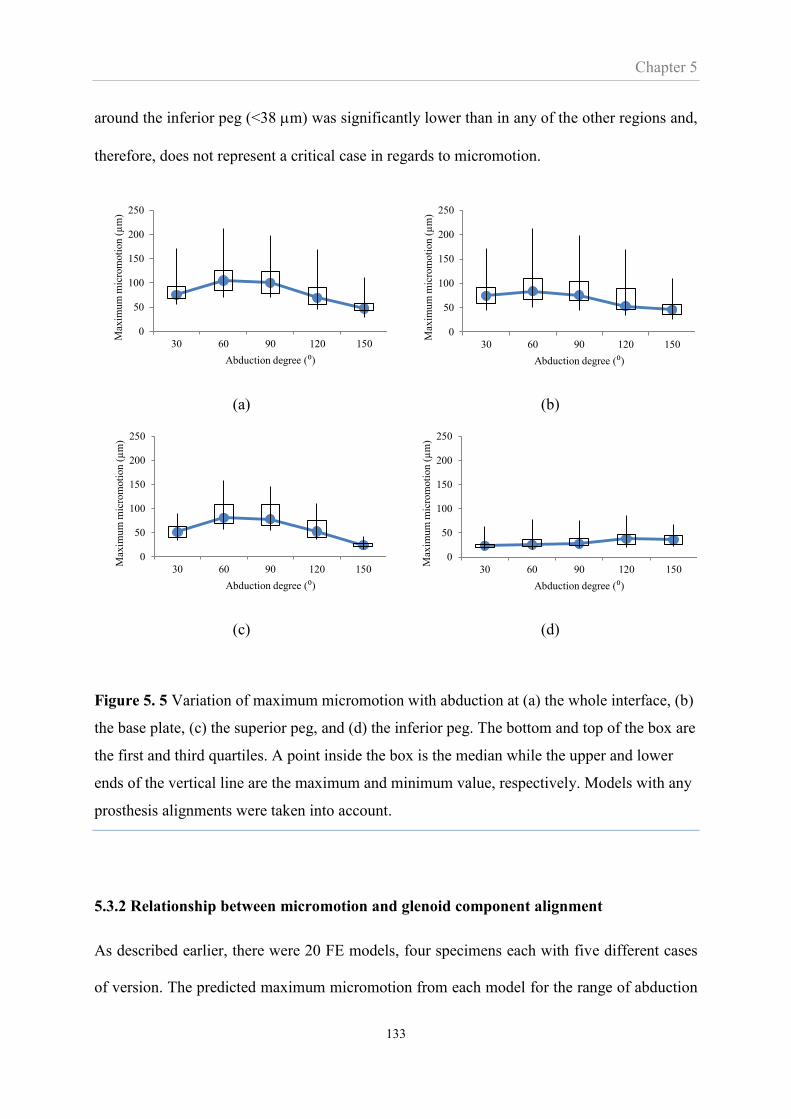
Chapter 5
133
around the inferior peg (<38 m) was significantly lower than in any of the other regions and,
therefore, does not represent a critical case in regards to micromotion.
(a) (b)
(c) (d)
Figure 5. 5 Variation of maximum micromotion with abduction at (a) the whole interface, (b)
the base plate, (c) the superior peg, and (d) the inferior peg. The bottom and top of the box are
the first and third quartiles. A point inside the box is the median while the upper and lower
ends of the vertical line are the maximum and minimum value, respectively. Models with any
prosthesis alignments were taken into account.
5.3.2 Relationship between micromotion and glenoid component alignment
As described earlier, there were 20 FE models, four specimens each with five different cases
of version. The predicted maximum micromotion from each model for the range of abduction
0
50
100
150
200
250
30 60 90 120 150
Max
imu
m m
icro
moti
on
(µ
m)
Abduction degree (⁰)
0
50
100
150
200
250
30 60 90 120 150
Max
imu
m m
icro
moti
on
(µ
m)
Abduction degree (⁰)
0
50
100
150
200
250
30 60 90 120 150
Max
imu
m m
icro
moti
on
(µ
m)
Abduction degree (⁰)
0
50
100
150
200
250
30 60 90 120 150
Max
imu
m m
icro
moti
on
(µ
m)
Abduction degree (⁰)
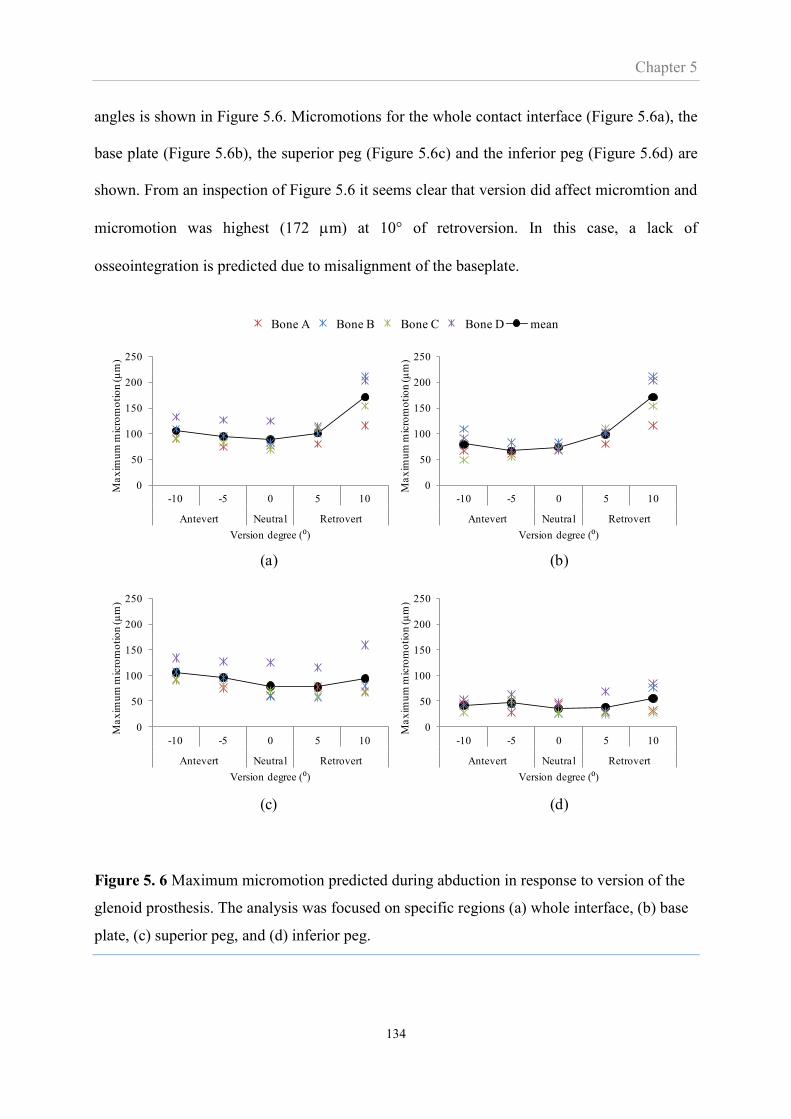
Chapter 5
134
angles is shown in Figure 5.6. Micromotions for the whole contact interface (Figure 5.6a), the
base plate (Figure 5.6b), the superior peg (Figure 5.6c) and the inferior peg (Figure 5.6d) are
shown. From an inspection of Figure 5.6 it seems clear that version did affect micromtion and
micromotion was highest (172 m) at 10° of retroversion. In this case, a lack of
osseointegration is predicted due to misalignment of the baseplate.
Figure 5. 6 Maximum micromotion predicted during abduction in response to version of the
glenoid prosthesis. The analysis was focused on specific regions (a) whole interface, (b) base
plate, (c) superior peg, and (d) inferior peg.
Bone A Bone B Bone C Bone D mean
0
50
100
150
200
250
-10 -5 0 5 10
Antevert Neutral Retrovert
Ma
xim
um
mic
rom
oti
on
(µ
m)
Version degree (⁰)
0
50
100
150
200
250
-10 -5 0 5 10
Antevert Neutral Retrovert
Ma
xim
um
mic
rom
oti
on
(µ
m)
Version degree (⁰)
0
50
100
150
200
250
-10 -5 0 5 10
Antevert Neutral Retrovert
Ma
xim
um
mic
rom
oti
on
(µ
m)
Version degree (⁰)
0
50
100
150
200
250
-10 -5 0 5 10
Antevert Neutral Retrovert
Ma
xim
um
mic
rom
oti
on
(µ
m)
Version degree (⁰)
(a) (b)
(c) (d)

Chapter 5
135
Figure 5.7 shows the micromotion distribution across the implant interface for the four bone
specimens for neutral orientation and the critical case of 10° retroversion. It is clear that
retroversion has elevated the level of micromotion across the interface. The grey areas
indicate interface regions that are unlikely to osseointegrate; these areas were present in the
retroverted case but not in the neutrally aligned case. It is also clear from the Figure that the
distribution of micromotion changes with version, the retroverted implants having high
micromotion in the anterior regions (opposite to the loaded region). Importantly, the Figure
also shows that the four different bones exhibited different levels of micromotion; the
micromotion of bones B and D were noticeably higher than bones A and C. This is also
noticeable from Figure 5.6. It is noteworthy that these observations of high levels of
micromotion appear to be associated with bone quality as bones B and D are also the bones
with the lowest Young’s Moduli (Figure 5.3).
The fraction of contact area with micromotion lower than threshold values was assessed and
shown in Figure 5.8. The results indicated that, in most alignments, nearly 100% of the
contact area had micromotions of less than 100 μm. However, at 10° retroversion this dropped
to 80% and for the specimen with the highest level of micromotion (bone B), more than 30%
of the interface exhibited micromotion higher than 100 m. The smallest percentage of
contact area that had micromotion less than 50 and 20 m were also found at 10° retroversion.
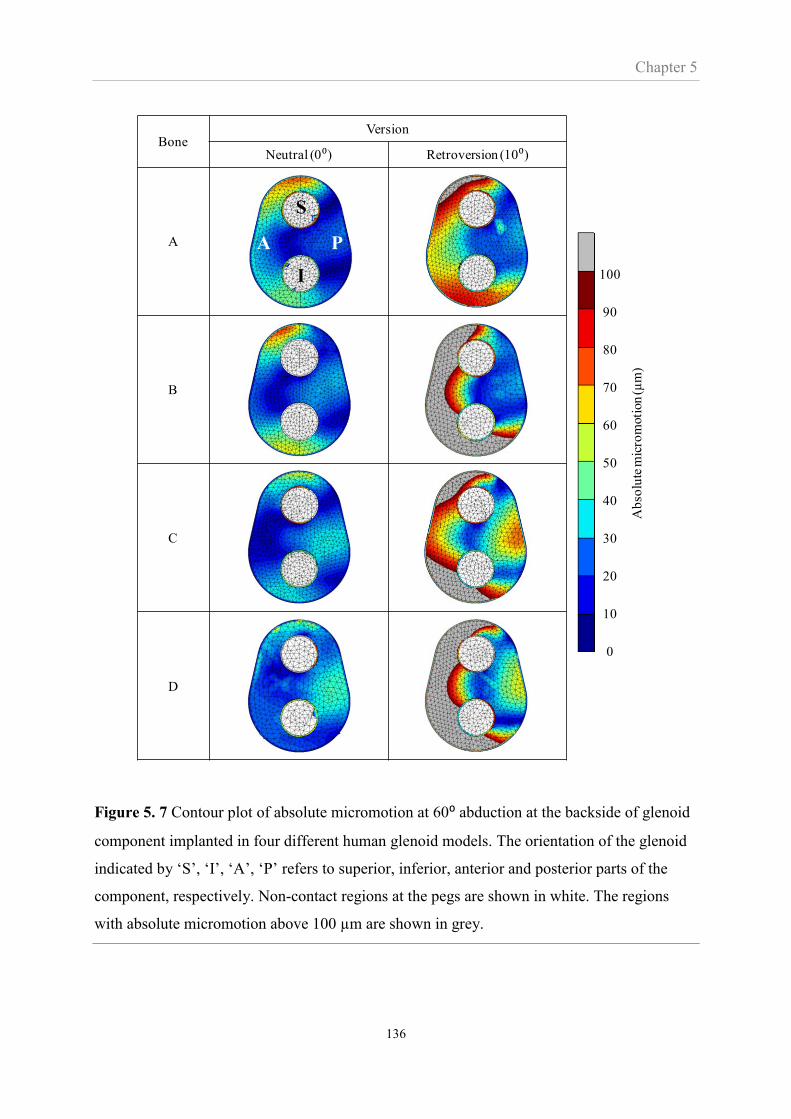
Chapter 5
136
Figure 5. 7 Contour plot of absolute micromotion at 60⁰ abduction at the backside of glenoid
component implanted in four different human glenoid models. The orientation of the glenoid
indicated by ‘S’, ‘I’, ‘A’, ‘P’ refers to superior, inferior, anterior and posterior parts of the
component, respectively. Non-contact regions at the pegs are shown in white. The regions
with absolute micromotion above 100 µm are shown in grey.
BoneVersion
Neutral (0⁰) Retroversion (10⁰)
A
B
C
D
S
I
A P
0
10
20
30
40
50
60
70
80
90
100
Ab
solu
te m
icro
moti
on
(µm
)

Chapter 5
137
Figure 5. 8 Bar chart represents the average percentage of contact area with micromotions
lower than 20, 50 and 100 µm. The thin line shows the data range including the maximum and
minimum values.
5.4 Discussion
In this study, version was shown to affect micromotion. In particular 10º of retroversion led to
micromtions greater than 100 µm and therefore less likely to result in osseointegration. Poor
bone quality also appeared to be associated with high levels of micromotion. Finally, it was
confirmed that 60° of arm abduction is the critical joint orientation for micromotion study.
The joint load combines a compressive normal load and a superiorly directed shear
component, resulting in an ecentric load located on the superior part of the glenoid. As a
result, the superior peg was pushed further into its reamed hole while the superior part of the
baseplate moved superiorly in a shearing mode relative to the bone. This circumstance
induced large tangential micromotion at the superior peg and superior baseplate (Figure 5.7).
The eccentric load possibly induced the opening gap at the inferior implant, leading to
normal micromotion. Although the shear force component was greater at an arm abduction of
0
10
20
30
40
50
60
70
80
90
100
-10 -5 0 5 10
Anteversion Neutral Retroversion
Per
centa
ge
of
inte
rfac
e ar
ea (
%)
Version degree (⁰)
<20 µm <50 µm <100 µm

Chapter 5
138
30º, the resultant contact force at this position was too small to produce as a large
micromotion as in the 60º abduction. The poorer performance at 60º abduction has also been
predicted in cemented prostheses by Hopkins et al. (2004), who showed the stresses in the
cement mantle were highest at this position. However, Suarez et al. (2009b) found that an arm
abduction of 30º induced greater micromotion in an abduction range between 0º and 90º. The
different findings may relate to the different shape of the glenoid implant and the load setting
algorithm as discussed in Section 4.4.
The mechasism of micromotion forming due to glenoid component version can be explained
as the effects of anterior-posterior ecentric load in response with the translation of the humeral
head. Combining the effect of eccentically superior load due to 60º abduction, the maximum
micromotion of the glenoid with retroverted component was found at the baseplate. The
pattern of micromotion at the baseplate can be divided into two regions; (1) inferior-anterior
and (2) superior-anterior part. Large micromotion at the first region, mostly comprised of
normal component, occured as the superior-posterior load lifted up the anterior side of the
prosthesis. Large micromotion of the later region, however, mostly comprised of tangential
component as it caused by the superior sliding of the prosthesis. For the glenoid with nuetral
and anteverted prothesis, micromotion at base plate was also found but its magnitude was
smaller than that found in the superior peg where the maximum micromotion was. The
magnitude of micromotion formed by eccentric load was found to depend on the magnitude of
applied force as well as the distance from the glenoid centre to the loading location.
Overall, anteversion was found be more preferable to retroversion. This finding is in line with
the FE study in human scapula by Hopkins et al.(2004) althrough their focus was on cemented
glenoid component. Conversely, the study of micromotion in porcine models (Chapter 4)
showed no notable difference between anteversion and retroversion. This can be explained as

Chapter 5
139
an effect of bone morphology. While the anterior and posterior part of porcine glenoid
geometry are observed to be more symmetrical, the anterior part of human glenoid connecting
to the coracoid process usually contains more bone stock compared to the posterior part.
When the loading region translated anteriorly in prosthesis anteversion, the bone stock
underneath may better withstand the glenohumeral load resulting in a smaller amount of
micromotion. Interestingly, shoulder arthroplasty is a common treatment to restore the
shoulder function of patients with osteoarthritis, where posterior glenoid erosion is common
(Mullaji et al., 1994; Walch et al., 1999). To avoid negative outcomes from retroverted
implantation, asymmetrical reaming, glenoid bone reconstruction or augmention of the
glenoid prosthesis should be considered.
The quality of supporting bone appeared to be associated with the level of micromotion.
Among the four models in this study, bone D was the least dense (Figure 5.3) and produced
large micromotions in all alignments (Figure 5.6). This finding is consistent with Suarez et al.
(2009b) who suggested that larger micromotion occurs in the rheumatoid bone compared to
the healthy bone. However, it was bone A, the second most dense bone, rather than bone C
(the densest bone) that showed the lowest level of micromotion for the retroverted glenoid
prosthesis. Comparing bone C’s density variation with bone A (Figure 5.2) shows that bone C
was weaker at the posterior rim of the bone. That may be the cause of the larger micromotion
since the contact load was applied posteriorly, and suggests that the distribution as well as the
average quality of supporting bone affects the level of micromotion. This makes micromotion
prediction difficult since the property of the underlying bone greatly varies across the glenoid
(Anglin et al., 1999; Lehtinen et al., 2004; Mimar et al., 2008).
In Chapter 4 the range of maximum micromotion was found to lie between 30 and 60 µm.
This was significantly lower than the 80 to 170 µm range found in this Chapter. However,

Chapter 5
140
Chapter 4 used porcine bone which is significantly denser and stiffer than the human bone
used in this chapter (Figure 5.3). Therefore, the different levels of predicted micromotion of
Chapter 4 and 5 seems relatively easily explained by the difference in bone density between
porcine and elderly human glenoid bone.
There are a number of limitations to this study. All the muscle loads and ligament forces of
the glenohumeral joint were simulated via a single load and relatively simple constraints.
However, these assumptions were applied consistently for all specimens, abduction angles
and levels of version, and therefore it is believed that at least the observed trends are sound.
Another limitation was that abduction was the only arm movement analysed in this study.
Including other arm movements would provided more insight into the effect of the misaligned
component on micromotion. Notwithstanding this, a FE study in cemented prosthesis
simulating internal and external arm rotation (Farron et al., 2006) and a cadaveric study
simulating horizonal abduction (Shapiro et al., 2007) also showed exceeding 10º retrovertion
caused negative outcomes and should be avoided in shoulder arthroplasty.
In summary, this chapter found that a glenoid component alignment between neutral and 5º
anteversion (i.e. normal version) should be targeted to encourage bone ingrowth. Pre-
operative assessment of bone quality is also indicated to identify patients with poor bone
stock and therefore with a higher risk of an unsuccessful outcome due to high levels of
micromotion.

Chapter 6
141
CHAPTER 6
The effect of misalignment on cemented
glenoid prosthesis fixation
Outline of Chapter 6
Chapters 3 to 5 addressed cementless fixation while this chapter focuses on cemented glenoid
fixation which is still the most common fixation technique in total shoulder arthroplasty.
Previous clinical studies have investigated the suspected association between misalignment
and radiographic loosening of cemented glenoid components. However, these clinical studies
involve many possible factors that could affect the outcome, and are therefore not as
controllable as in-vitro studies. Hence, the aim of this chapter, which adopted an in-vitro
approach where misalignment (specifically the version) could be controlled, was to
investigate if retroversion causes high levels of radiolucent lines in the fixation of the glenoid
component. The experimental set-up applied the principles of the ASTM standard for testing
of glenoid loosening under cyclic loading. Bone substitute specimens implanted in neutral,
10°, and 20° version were used and radiolucencies in the implant fixation were assessed from
the CT scans.
6.1 Introduction
Glenoid component loosening has been found to be the main complication of total shoulder
arthroplasty accounting for 39% of all complications (Bohsali et al., 2006). It is believed that
the cause of glenoid loosening is eccentric loading resulting in a “rocking horse”
phenomenon. Eccentric load occurs due to several factors; rotator cuff deficiency, improper
Chapter 6
142
component seating, and a misaligned component, in particular, excessive component version
(Franklin et al., 1988; Hsu et al., 2013; Matsen et al., 2008).
Glenoid loosening was found to significantly correlate with an incidence of radiolucent lines,
defined as gaps containing soft tissue with poor mechanical properties and their presence can
be observed via a subsequent radiographic image (Iwaki et al., 2002). According to a review
study (Bohsali et al., 2006), in 148 shoulders with evidence of loosening, 117 had evidence of
radiolucent lines during ten years follow-up. The radiolucent line was also found to correlate
with negative postoperative outcomes such as pain, muscular strength, and limited range of
motion (Gregory, 2010; Torchia et al., 1997; Yian et al., 2005)
In clinical practice using radiography, radiolucent lines have been assessed by several
protocols, depending on the component type. In most reports involving keeled component, a
grading system and a scoring system introduced by Franklin et al., 1988 and Mole et al., 1999
respectively, were frequently used as a gold standard. Lazarus et al., 2002 later modified
Franklin et. al’s grading system for use in multi-pegged components. Recently, a scoring
system for two pegged components has been introduced by Greiner et al., 2013.
Gregory et al., 2013 have investigated the effect of glenoid component retroversion on
radiographic loosening in cemented arthroplasty. However, due to the many parameters
involved in the clinical study, it was difficult to isolate the effect of misalignment from other
contributing effects and a significant association was suggested but not established. Other
studies have also investigated the effect of misalignment of glenoid components (Farron et al.,
2006; Hopkins et al., 2004). These studies used FE analysis to predict the distribution of stress
in the cement mantle and link these stresses to the likelihood of fixation failure. While such
computational studies can provide much insight they are based on many assumptions.
Therefore, in this chapter an in-vitro approach, using the radiographic criteria for loosening as
Chapter 6
143
used in clinical practise, was adopted to investigate the relationship between implant fixation
and excessive version.
The effect of glenoid misalignment on loosening has received scientific attention and
therefore some implants do add anteriorly/posteriorly positioned pegs. Such features may
better resist more posterior eccentric joint load acting on a retroverted glenoid component.
Without such anterior/posterior features the posteriorly eccentric load may lead to differences
in the radiolucencies in the anterior and posterior regions of the glenoid fixation, particularly
relative to the centrally acting joint load in a neutrally aligned glenoid.
The objective of this study was to investigate the effect of glenoid component version on
radiographic loosening. A second objective was to characterise the effect of version on the
regional distribution of radiolucencies to evaluate the likely benefits of anterior/posterior
fixation features.
6.2 Material and methods
6.2.1 Specimen preparation
Eighteen bone substitute specimens were used in this study (Sawbones, Pacific Research
Laboratories, Washington, USA). Each of them was made of a 45 mm3 cubic cellular
polyurethane block with a compressive modulus of 47.5 MPa, representative of rheumatoid
bone (Yang et al., 1997). The specimens were implanted with a cemented glenoid prosthesis
(Affinis size 2, Mathys Ltd., Bettlach, Switzerland). The pear-shaped prostheses were made of
ultra high molecular weight polyethylene (UHMWPE ), had two pegs, and had a curved-back
design with an articular radius of 27 mm (Figure 6.1a). The implantation process, including
reaming and drilling of peg holes, was performed as specified by the manufacturer.
Polymethyl methacrylate (PMMA) bone cement (Simplex Rapid, Austenal Dental Products
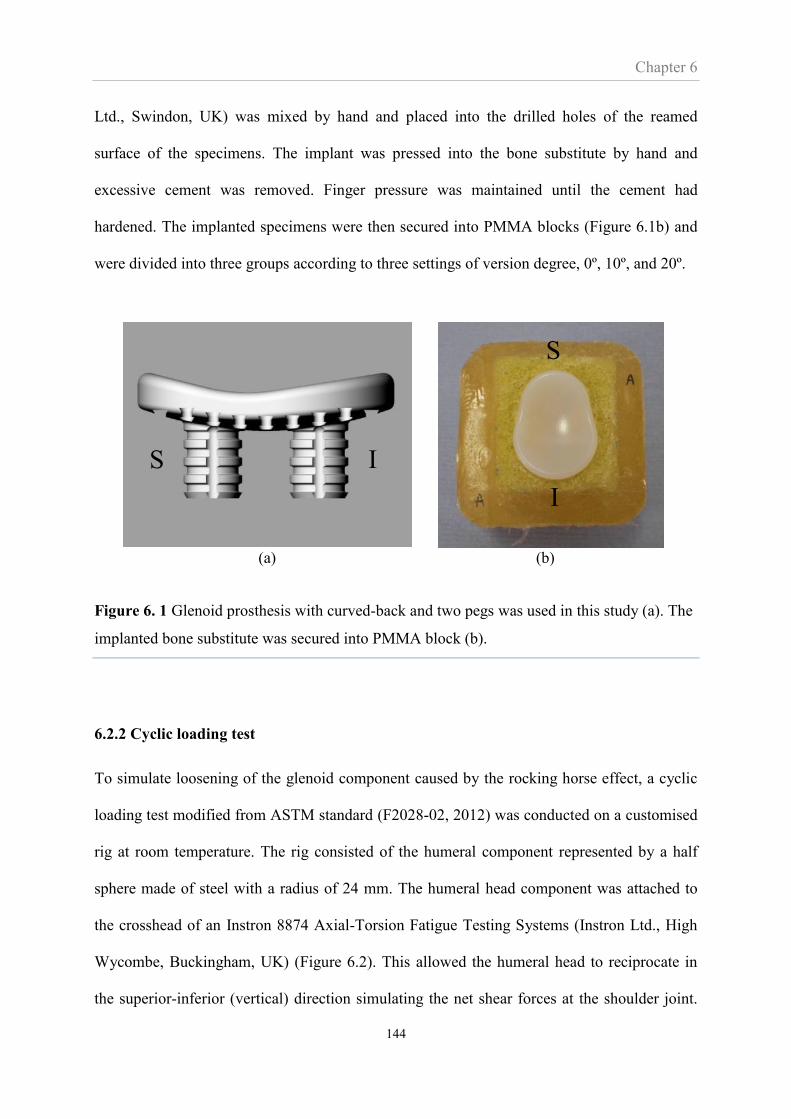
Chapter 6
144
Ltd., Swindon, UK) was mixed by hand and placed into the drilled holes of the reamed
surface of the specimens. The implant was pressed into the bone substitute by hand and
excessive cement was removed. Finger pressure was maintained until the cement had
hardened. The implanted specimens were then secured into PMMA blocks (Figure 6.1b) and
were divided into three groups according to three settings of version degree, 0º, 10º, and 20º.
(a) (b)
Figure 6. 1 Glenoid prosthesis with curved-back and two pegs was used in this study (a). The
implanted bone substitute was secured into PMMA block (b).
6.2.2 Cyclic loading test
To simulate loosening of the glenoid component caused by the rocking horse effect, a cyclic
loading test modified from ASTM standard (F2028-02, 2012) was conducted on a customised
rig at room temperature. The rig consisted of the humeral component represented by a half
sphere made of steel with a radius of 24 mm. The humeral head component was attached to
the crosshead of an Instron 8874 Axial-Torsion Fatigue Testing Systems (Instron Ltd., High
Wycombe, Buckingham, UK) (Figure 6.2). This allowed the humeral head to reciprocate in
the superior-inferior (vertical) direction simulating the net shear forces at the shoulder joint.
S I
S
I
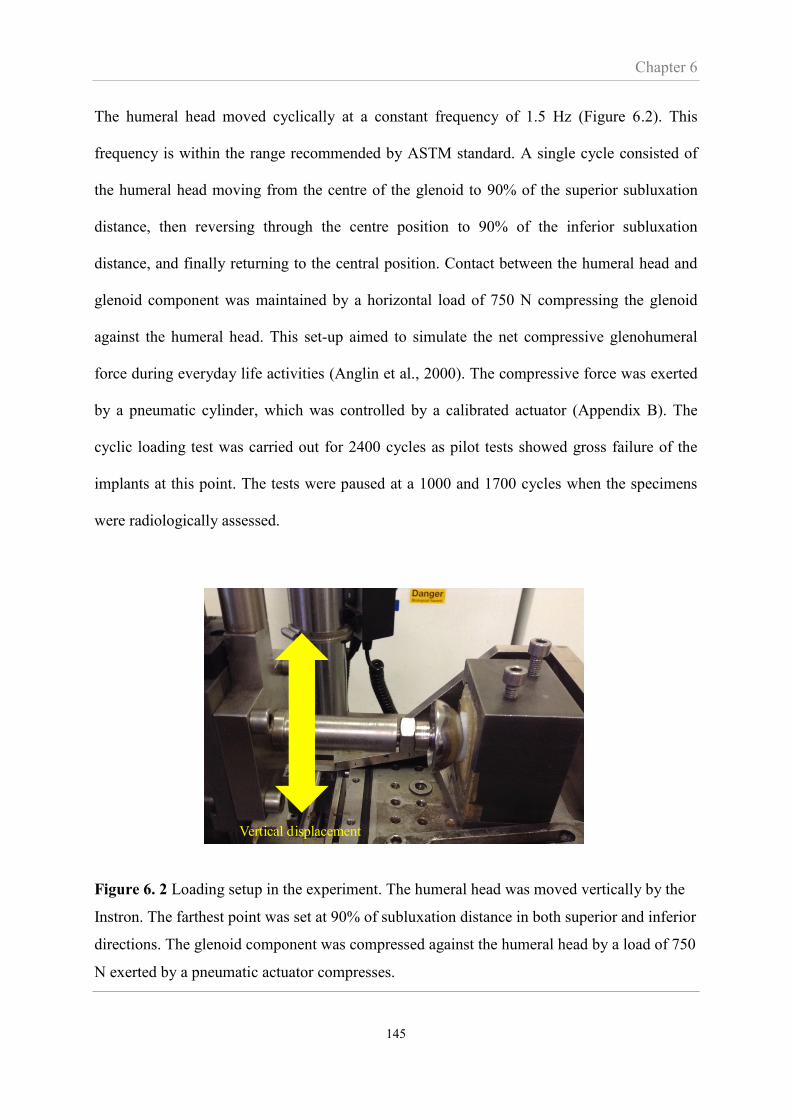
Chapter 6
145
The humeral head moved cyclically at a constant frequency of 1.5 Hz (Figure 6.2). This
frequency is within the range recommended by ASTM standard. A single cycle consisted of
the humeral head moving from the centre of the glenoid to 90% of the superior subluxation
distance, then reversing through the centre position to 90% of the inferior subluxation
distance, and finally returning to the central position. Contact between the humeral head and
glenoid component was maintained by a horizontal load of 750 N compressing the glenoid
against the humeral head. This set-up aimed to simulate the net compressive glenohumeral
force during everyday life activities (Anglin et al., 2000). The compressive force was exerted
by a pneumatic cylinder, which was controlled by a calibrated actuator (Appendix B). The
cyclic loading test was carried out for 2400 cycles as pilot tests showed gross failure of the
implants at this point. The tests were paused at a 1000 and 1700 cycles when the specimens
were radiologically assessed.
Figure 6. 2 Loading setup in the experiment. The humeral head was moved vertically by the
Instron. The farthest point was set at 90% of subluxation distance in both superior and inferior
directions. The glenoid component was compressed against the humeral head by a load of 750
N exerted by a pneumatic actuator compresses.
Vertical displacement
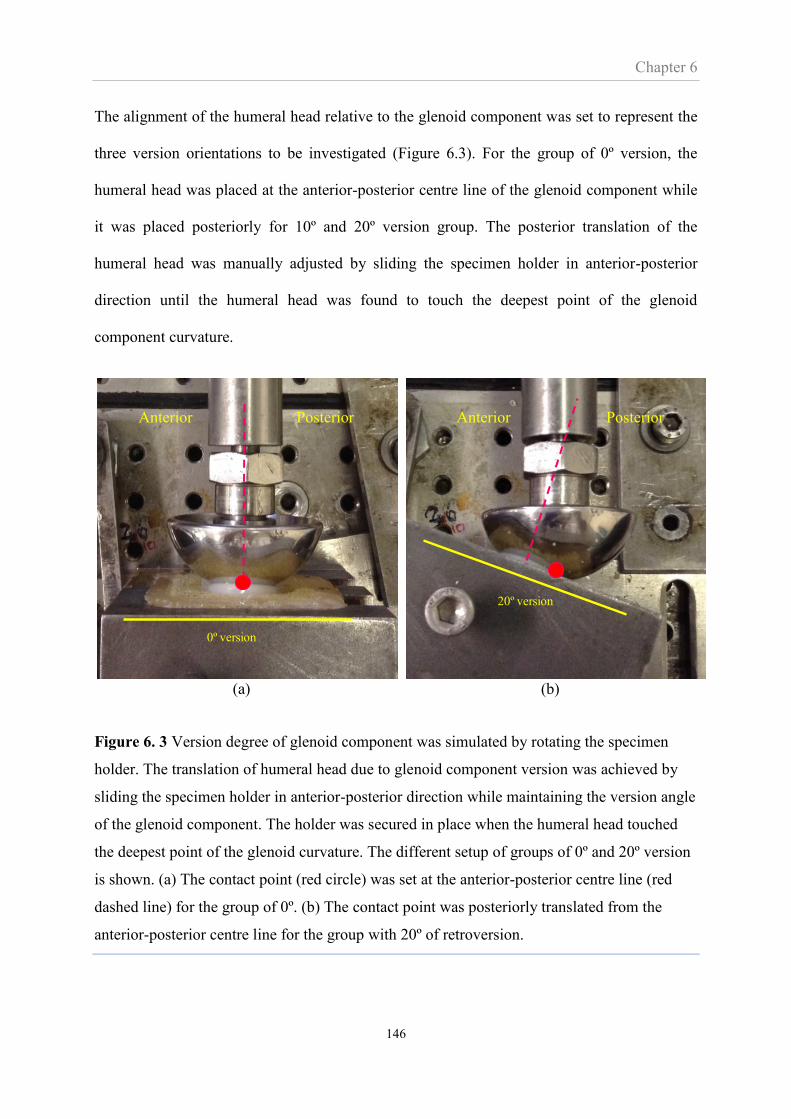
Chapter 6
146
The alignment of the humeral head relative to the glenoid component was set to represent the
three version orientations to be investigated (Figure 6.3). For the group of 0º version, the
humeral head was placed at the anterior-posterior centre line of the glenoid component while
it was placed posteriorly for 10º and 20º version group. The posterior translation of the
humeral head was manually adjusted by sliding the specimen holder in anterior-posterior
direction until the humeral head was found to touch the deepest point of the glenoid
component curvature.
(a) (b)
Figure 6. 3 Version degree of glenoid component was simulated by rotating the specimen
holder. The translation of humeral head due to glenoid component version was achieved by
sliding the specimen holder in anterior-posterior direction while maintaining the version angle
of the glenoid component. The holder was secured in place when the humeral head touched
the deepest point of the glenoid curvature. The different setup of groups of 0º and 20º version
is shown. (a) The contact point (red circle) was set at the anterior-posterior centre line (red
dashed line) for the group of 0º. (b) The contact point was posteriorly translated from the
anterior-posterior centre line for the group with 20º of retroversion.
0º version
20º version
Anterior Posterior Anterior Posterior

Chapter 6
147
According to the ASTM test the horizontal cyclic load should be such as to achieve 90% of
the subluxation distance; a distance measured from the deepest point on the glenoid to the
point corresponding to the peak shear load. As this distance is not known in advance of the
actual testing a pilot study including three specimens was first carried out to identify the
subluxation distance. Each specimen was placed in the rig to simulate glenoid version of 0º,
10º and 20º and compressed into the humeral head with a load of 750 N. The humeral head
was displaced in the superior and inferior direction of the glenoid component and the resulting
vertical load (shear) and vertical displacement of the humeral head is shown in Figure 6.4.
The subluxation distance was found to be approximately 4 mm for all version groups in both
superior and inferior cases. Therefore, the humeral head in this study was cycled to 3.6 mm
from the glenoid centre in both directions (90% of subluxation distance).
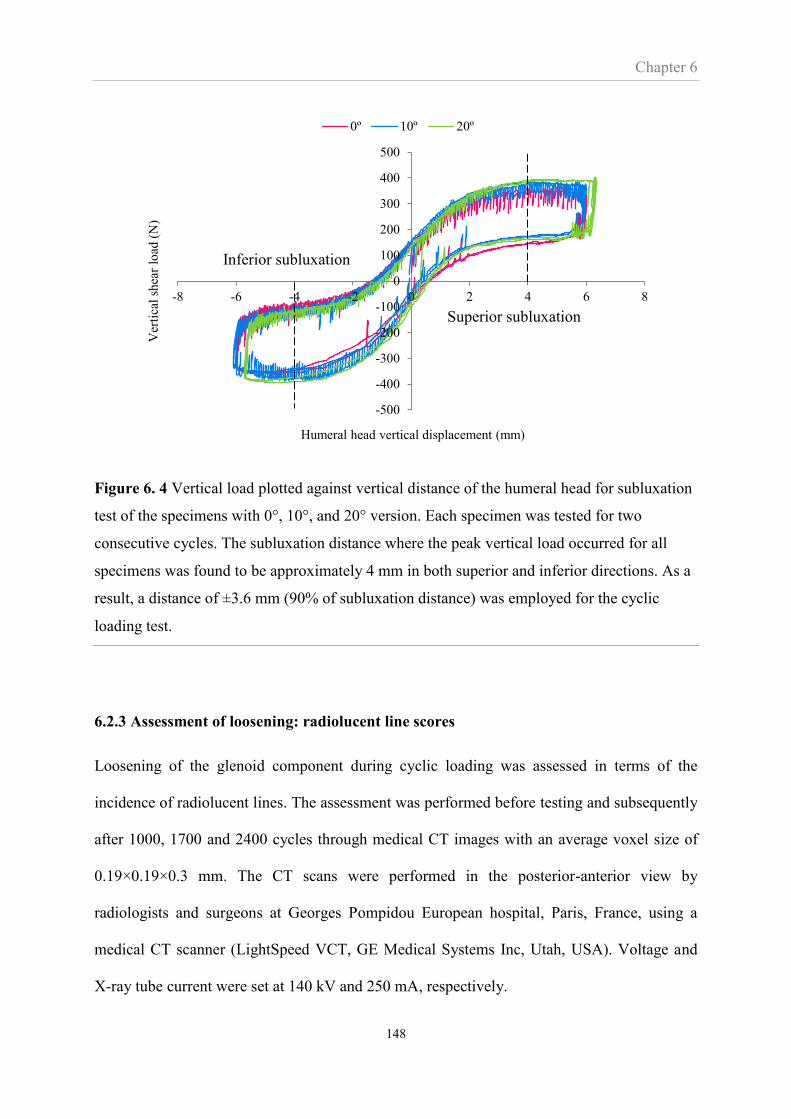
Chapter 6
148
Figure 6. 4 Vertical load plotted against vertical distance of the humeral head for subluxation
test of the specimens with 0°, 10°, and 20° version. Each specimen was tested for two
consecutive cycles. The subluxation distance where the peak vertical load occurred for all
specimens was found to be approximately 4 mm in both superior and inferior directions. As a
result, a distance of ±3.6 mm (90% of subluxation distance) was employed for the cyclic
loading test.
6.2.3 Assessment of loosening: radiolucent line scores
Loosening of the glenoid component during cyclic loading was assessed in terms of the
incidence of radiolucent lines. The assessment was performed before testing and subsequently
after 1000, 1700 and 2400 cycles through medical CT images with an average voxel size of
0.19×0.19×0.3 mm. The CT scans were performed in the posterior-anterior view by
radiologists and surgeons at Georges Pompidou European hospital, Paris, France, using a
medical CT scanner (LightSpeed VCT, GE Medical Systems Inc, Utah, USA). Voltage and
X-ray tube current were set at 140 kV and 250 mA, respectively.
-500
-400
-300
-200
-100
0
100
200
300
400
500
-8 -6 -4 -2 0 2 4 6 8
Ver
tica
l sh
ear
load
(N
)
Humeral head vertical displacement (mm)
0º 10º 20º
Superior subluxation
Inferior subluxation
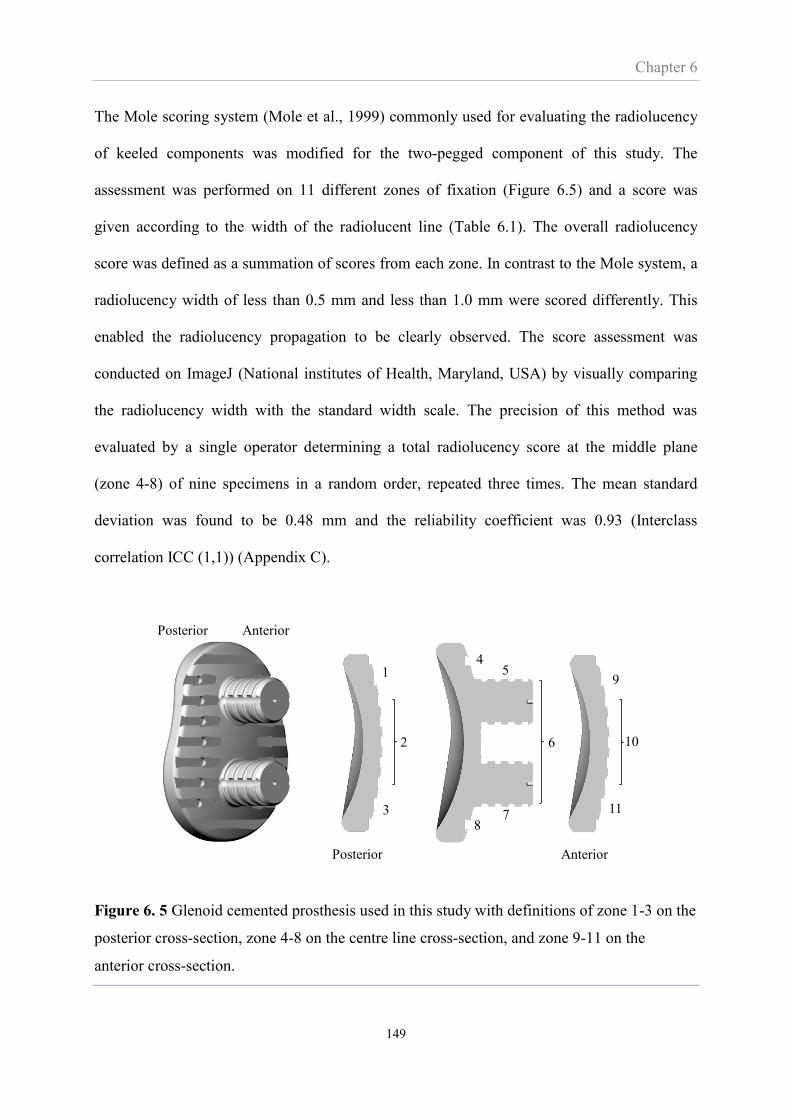
Chapter 6
149
The Mole scoring system (Mole et al., 1999) commonly used for evaluating the radiolucency
of keeled components was modified for the two-pegged component of this study. The
assessment was performed on 11 different zones of fixation (Figure 6.5) and a score was
given according to the width of the radiolucent line (Table 6.1). The overall radiolucency
score was defined as a summation of scores from each zone. In contrast to the Mole system, a
radiolucency width of less than 0.5 mm and less than 1.0 mm were scored differently. This
enabled the radiolucency propagation to be clearly observed. The score assessment was
conducted on ImageJ (National institutes of Health, Maryland, USA) by visually comparing
the radiolucency width with the standard width scale. The precision of this method was
evaluated by a single operator determining a total radiolucency score at the middle plane
(zone 4-8) of nine specimens in a random order, repeated three times. The mean standard
deviation was found to be 0.48 mm and the reliability coefficient was 0.93 (Interclass
correlation ICC (1,1)) (Appendix C).
Figure 6. 5 Glenoid cemented prosthesis used in this study with definitions of zone 1-3 on the
posterior cross-section, zone 4-8 on the centre line cross-section, and zone 9-11 on the
anterior cross-section.
Posterior Anterior
1
2
3
9
10
11
45
6
78
Posterior Anterior
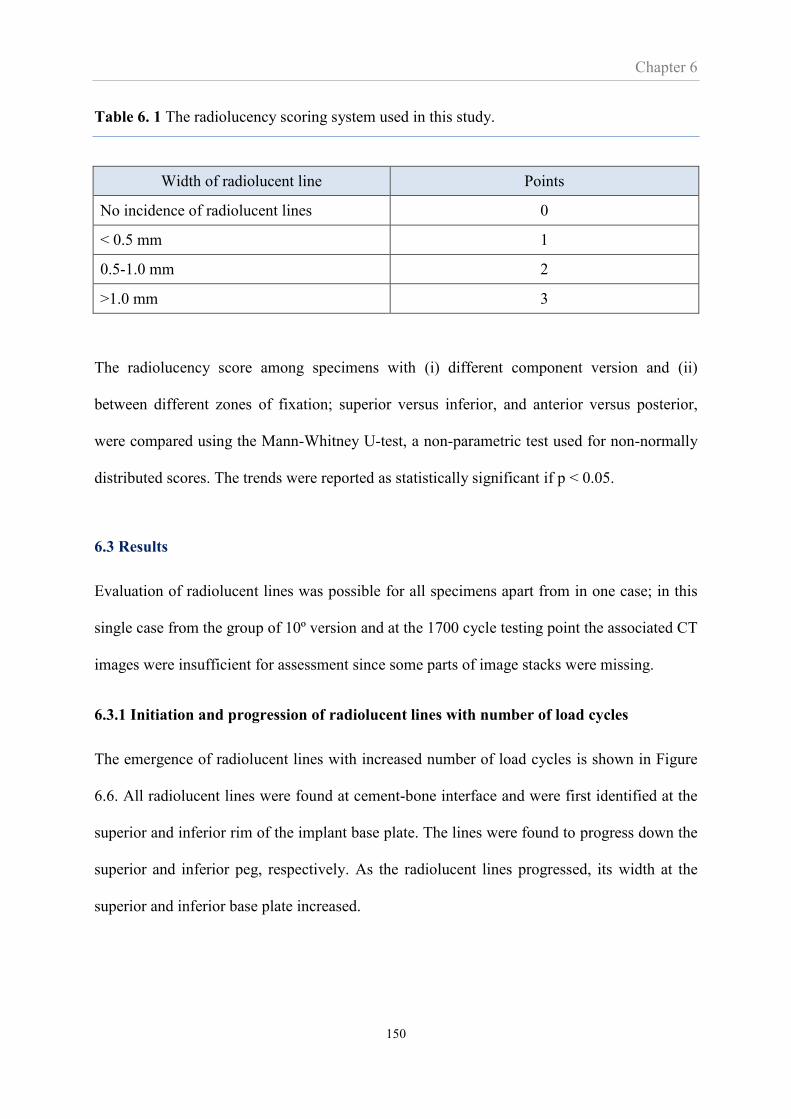
Chapter 6
150
Table 6. 1 The radiolucency scoring system used in this study.
Width of radiolucent line Points
No incidence of radiolucent lines 0
< 0.5 mm 1
0.5-1.0 mm 2
>1.0 mm 3
The radiolucency score among specimens with (i) different component version and (ii)
between different zones of fixation; superior versus inferior, and anterior versus posterior,
were compared using the Mann-Whitney U-test, a non-parametric test used for non-normally
distributed scores. The trends were reported as statistically significant if p < 0.05.
6.3 Results
Evaluation of radiolucent lines was possible for all specimens apart from in one case; in this
single case from the group of 10º version and at the 1700 cycle testing point the associated CT
images were insufficient for assessment since some parts of image stacks were missing.
6.3.1 Initiation and progression of radiolucent lines with number of load cycles
The emergence of radiolucent lines with increased number of load cycles is shown in Figure
6.6. All radiolucent lines were found at cement-bone interface and were first identified at the
superior and inferior rim of the implant base plate. The lines were found to progress down the
superior and inferior peg, respectively. As the radiolucent lines progressed, its width at the
superior and inferior base plate increased.
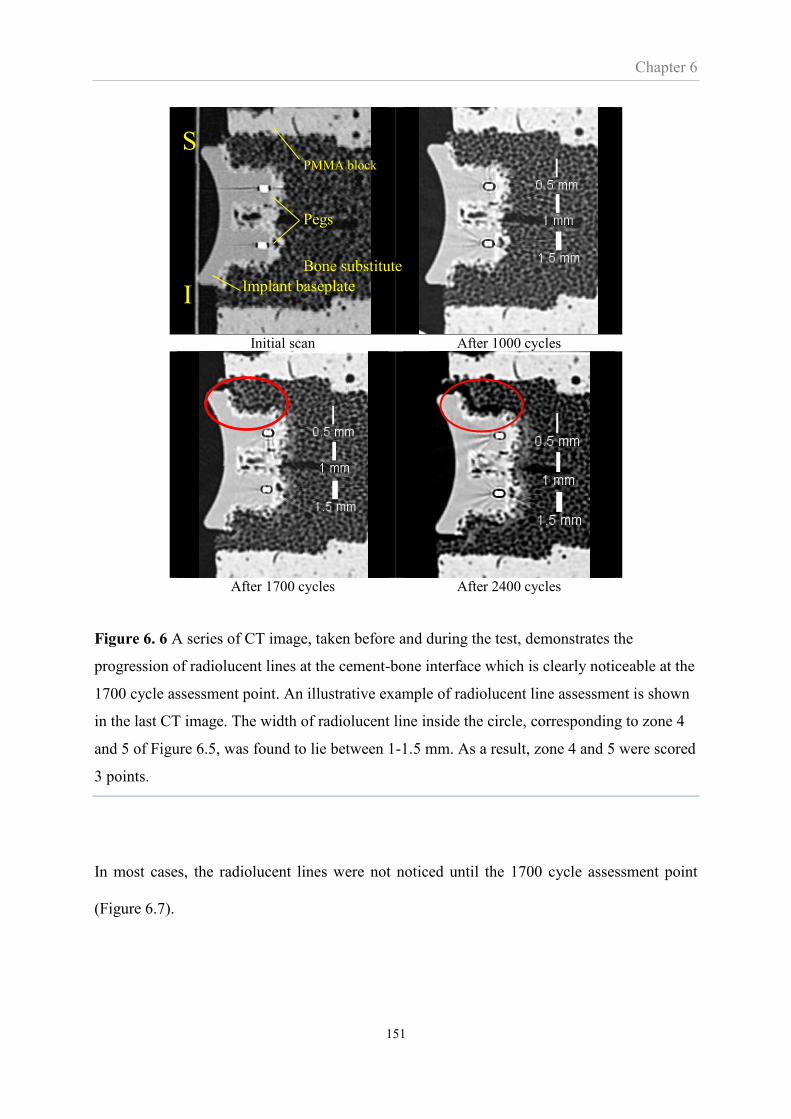
Chapter 6
151
Initial scan After 1000 cycles
After 1700 cycles After 2400 cycles
Figure 6. 6 A series of CT image, taken before and during the test, demonstrates the
progression of radiolucent lines at the cement-bone interface which is clearly noticeable at the
1700 cycle assessment point. An illustrative example of radiolucent line assessment is shown
in the last CT image. The width of radiolucent line inside the circle, corresponding to zone 4
and 5 of Figure 6.5, was found to lie between 1-1.5 mm. As a result, zone 4 and 5 were scored
3 points.
In most cases, the radiolucent lines were not noticed until the 1700 cycle assessment point
(Figure 6.7).
PMMA block
Bone substitute
Pegs
Implant baseplate
S
I
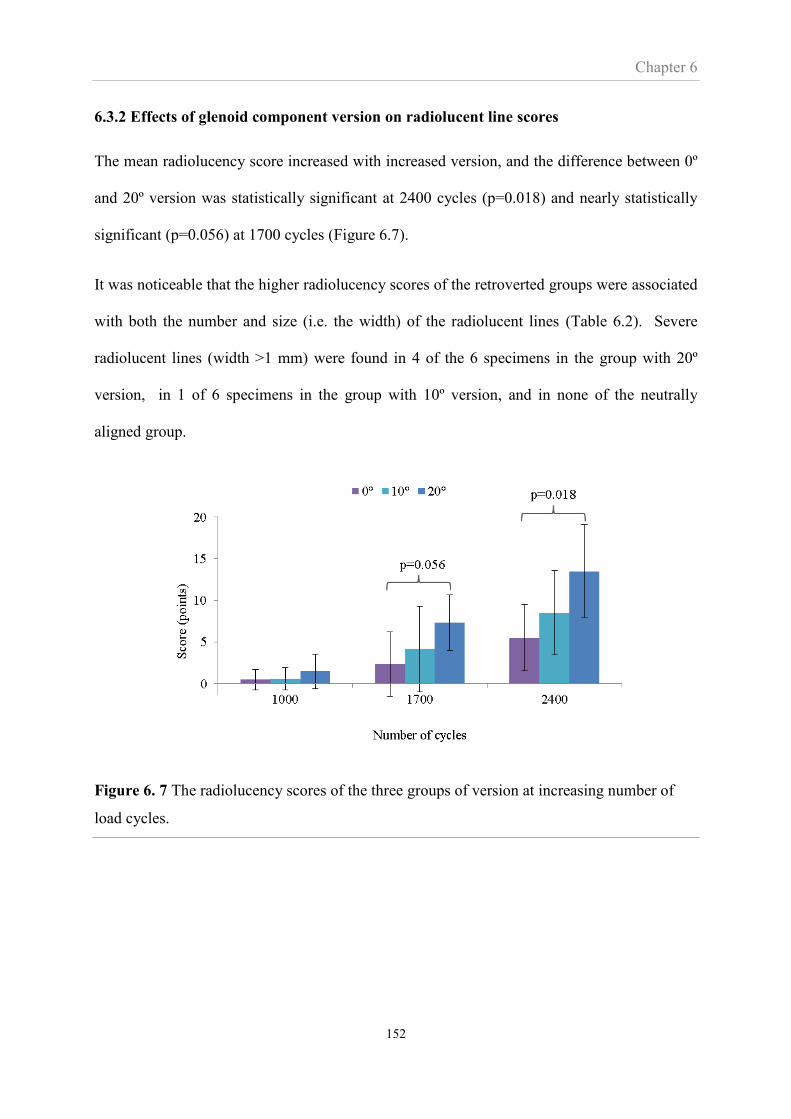
Chapter 6
152
6.3.2 Effects of glenoid component version on radiolucent line scores
The mean radiolucency score increased with increased version, and the difference between 0º
and 20º version was statistically significant at 2400 cycles (p=0.018) and nearly statistically
significant (p=0.056) at 1700 cycles (Figure 6.7).
It was noticeable that the higher radiolucency scores of the retroverted groups were associated
with both the number and size (i.e. the width) of the radiolucent lines (Table 6.2). Severe
radiolucent lines (width >1 mm) were found in 4 of the 6 specimens in the group with 20º
version, in 1 of 6 specimens in the group with 10º version, and in none of the neutrally
aligned group.
Figure 6. 7 The radiolucency scores of the three groups of version at increasing number of
load cycles.

Chapter 6
153
Table 6. 2 The number of specimens categorised according to the largest (width) radiolucent
line present in the specimen at 2400 cycle. “*” indicates that the width of radiolucent line
shown in the table is found in all 6 specimens of the group but not the largest width.
Level of radiolucent line Specimen group
0º 10º 20º
No radiolucent line (score=0) 1 * *
<0.5 mm (score=1) 2 2 *
0.5-1 mm (score=2) 3 3 2
>1 mm (score=3) 0 1 4
Total number of specimens 6 6 6
6.3.3 Did version affect the location of radiolucencies?
Analysing the locations of radiolucencies shows that more retroverted implants exhibited
radiolucencies in all 11 fixation zones while less retroverted implants and neutrally aligned
implants had evidence of radiolucency in 9 and 7 zones respectively.

Chapter 6
154
Figure 6. 8 The effect of version on regional distribution of radiolucencies. The zones 1 to 11
on the abscissa are defined in Figure 6.5.
Figure 6.8 also shows that the highest frequency of radiolucent lines occurred in the superior
(zone 4) and inferior (zone 8) parts of the fixation, however, there was no significant effect of
version on the radiolucency scores in these two regions (Figure 6.9a). Perhaps more
surprisingly, there was no significant effect of version on the radiolucency scores in the
posterior (zones 1 to 3) and anterior (zones 9 to 11) regions (Figure 6.9b).

Chapter 6
155
(a)
(b)
Figure 6. 9 The effect of version on the mean radiolucency scores in the (a) superior and
inferior regions, and (b) anterior and posterior regions at 2400 load cycles. Bars indicate
standard deviations.
0
2
4
6
8
10
12
0° 10° 20°
Sco
re (
po
ints
)
Version degree
Superior Inferior
-2
0
2
4
6
8
10
12
0° 10° 20°
Sco
re (
po
ints
)
Version degree
Anterior Posterior
p=0.46
p=0.30
p=0.38
p=0.30
p=0.26 p=0.33

Chapter 6
156
6.4 Discussion
The most important findings of this chapter were that the radiolucent line scores increased
with glenoid component version but a significant effect of version on the regional distribution
of radiolucencies across the fixation interface was not found.
Clinical radiographic loosening of shoulder arthroplasties has been widely reported and some
of these reports are possibly related to the effect of misalignment. Greiner et al., 2013
reported that the radiolucent lines were most frequently found in arthroplasties which
preoperatively had posterior wear and a posteriorly subluxed humeral head (type B2) or
preoperative retroversion of the natural glenoid greater than 25° (type C) according to the
classification of Walch et al., 1999. Yian et al., 2005 also reported that posterior wear of the
preoperative glenoid was significantly associated with high radiolucency scores. These
authors did not report the postoperative glenoid component version, however, preoperative
retroversion is associated with postoperative retroversion (Iannotti et al., 2011; Lazarus et al.,
2002). Therefore, consistent with the findings in this chapter, the findings of these previous
studies indicate that retroversion of the glenoid component was associated with high
radiolucency scores.
FE studies (Farron et al., 2006; Shapiro et al., 2007) have also found that glenoid component
retroversion increased the stresses in the fixation interface which would logically imply a
causal relationship to implant loosening.
The progression of radiolucent lines was generally not observed until 1700 cycles. It is
possible that the radiolucent lines may initiate earlier but that this was difficult to determine
from the CT images. This may imply a limitation of the study but probably not the
conclusions in regards to the effect of misalignment.
Chapter 6
157
Regarding the location of radiolucent lines and consistent with the findings of this chapter,
previous studies of both pegged and keeled components reported radiolucent lines to be
present primarily in the superior and inferior regions of the component base plate (Greiner et
al., 2013; Kasten et al., 2010).
The radiolucency scores found at the superior and inferior regions were not significantly
different, suggesting that it was not significantly affected by an axial asymmetry of the pear-
shaped component.
Although the number of specimens exhibiting posterior radiolucent lines was found to be
higher than those with anterior radiolucent lines (Fig 6.7), there was no statistical difference
in terms of total radiolucent score even in the specimens with a retroverted component where
the glenohumeral contact point shifted posteriorly. Perhaps, the number of test specimens was
too small to obtain statistical output; moreover, a comparison with clinical results was
challenging as the standard method for measuring the radiolucency score used a CT image
taken only in a middle of anteroposterior plane (Lazarus et al., 2002; Mole et al., 1999).
Junaid et al., 2010 and Gregory et al., 2009 investigated failure mechanisms of glenoid
components using an experimental set-up similar to the work in this chapter. In contrast to
this study which found the fixation to fail in the bone-cement interface, these authors reported
the fixation to fail in the implant-cement interface. The different findings may be caused by
the different glenoid components used in the studies. The implants in this chapter included
macro features in the fixation surface (Figure 6.5) while these were either not present or
different in the studies of Junaid et al. and Gregory et al., respectively. The test protocols also
differed; Junaid et al. and Gregory et.al simulated the rocking horse effect only in the superior
direction. This is likely to induce tensile stress at the inferior fixation which makes these tests
more prone to tensile failure of the implant-cement interface. In contrast this thesis simulated

Chapter 6
158
the rocking horse effect in both superior and inferior directions which may make the fixation
interface more prone to compressive failure of the cancellous bone structures of the bone-
cement interface. These comparisons are further compounded by the predominant belief
amongst clinicians that the failure takes place in the bone-cement interface. However, this
belief is mostly based on anecdotal evidence of radiographic images, which may not possess
the resolution needed to demonstrate implant-cement failure (Cofield, 1984).
Bone substitute with a low Young’s modulus and strength was used in this study. This
material has been used by other researchers investigating glenoid loosening (Oosterom et al.,
2004) and was preferred over a stronger bone substitute material because of its open cell
structure that allows more appropriate cement interdigitation. This was viewed as an
important feature in a study of fixation strength. It may be that the bone substitute was too
weak and prone to compressive failure. However, compressive failure of the glenoid bone was
also observed in another study by Junaid (Junaid, 2010) and therefore may be a natural
clinical failure mode.
In conclusion, this study found that version caused higher radiolucent lines scores and
therefore further supports the importance of trying to achieve neutral alignment during total
shoulder arthroplasty. The study did not find that retroversion caused differences in
radiolucency scores between anterior and posterior regions and therefore did not find
evidence to support that anterior/posterior fixation features will improve fixation strength.
.
Chapter 7
159
CHAPTER 7
Summary, Discussion and Conclusions
In total shoulder arthroplasty the glenoid component is commonly implanted in a misaligned
orientation. An in-depth understanding of how the component version affects the
postoperative outcomes is crucial. With this motivation, this thesis aimed to investigate such
effects focusing on the component loosening in both cementless and cemented arthroplasty.
There were four main achievements in this thesis summarised below.
7.1 Summary
Chapter 3 developed the DVC-CT as an in-vitro technique for measuring micromotion in
cementless arthroplasty and presents a conceptually novel method of relevance and
importance for research of bone ingrowth in cementless implant. This chapter showed that the
DVC-CT is a reliable technique and can be a useful tool for investigations of micromotion
around implants.
Chapter 4 applied the DVC-CT technique to determine the relationship between glenoid
component version and micromotion. Due to the presence of an interface gap (imperfect
seating of the implant) and bone quality, both of which varied between specimens, the effect
of version was not clearly established in this chapter. However, the work of Chapter 4 did
show that DVC-CT and FE results were consistent and in effect validated the FE method as
a tool for investigating the effect of version on micromotion.
Chapter 7
160
Chapter 5 used the FE analysis to determine micromotion around a glenoid component during
a full range of shoulder abduction and confirmed that 60º of abduction is the critical position
to be investigated in studies of glenoid micromotion. Poor results were shown to be related to
component retroversion. Bone stiffness was also an important parameter. Large micromotions
were associated with less stiff bone.
Finally, Chapter 6 focused on cemented arthroplasty where the radiolucent line was evaluated
via CT scans during cyclic loading tests. It was found that the incidence of radiolucent lines
increased with glenoid component version in this in-vitro model.
7.2 Discussion and Conclusions of findings of clinical issues: misalignment, implant
seating, bone quality
7.2.1 Misalignment: the effect of component version
Glenoid component loosening in both cementless and cemented arthroplasty were
investigated in this study. Regardless of the difference of fixation types and methodologies,
glenoid component version resulted in outcomes associated with component loosening; i.e.
increased micromotion in cementless components and increased radiolucency scores in
cemented components. On the basis of the results, it is not possible to recommend one
fixation type over the other as being more tolerant of misalignment, both respond poorly.
Aiming for neutral alignment is recommended with particular care to avoid excessive
component retroversion.
The findings were obtained using abduction loading conditions that resulted in superior-
inferior translation of the glenohumeral contact point (Chapter 5 and 6). It is therefore not
representative of other clinical situations such as external rotation, where the contact point has
been found to translate posteriorly (Novotny et al., 2000).

Chapter 7
161
In this study, maximum component versions of 10° and 20° were simulated for cementeless
and cemented arthroplasty, respectively, and the retroverted implant was compared with the
intact glenoid. Misalignment is a clinically relevant scenario as it is difficult for the surgeon to
consistently attain correct neutral alignment. Navigation or guiding systems aiming to assist
surgeons’ placement of the glenoid component into its target position (Kircher et al., 2009;
Nguyen et al., 2009) may provide a solution to the problem demonstrated in this thesis.
In the case of severe retroversion (~20º), this is probably not due to surgical error but rather
because the preoperative glenoid bone was severely eroded or dysplastic. In such cases the
surgeon is aware of the glenoid component retroversion but may have chosen it over
alignment procedures such as asymmetric reaming which would have removed much of the
limited glenoid bone stock, or reconstruction procedures such as posterior bone grafting or an
augmented component (Iannotti et al., 2013; Neer and Morrison, 1988; Riboh and Garrigues,
2012; Youderian et al., 2012). However, some studies have reported poor clinical outcomes
due to resorption of the graft material and instability of shoulder after augmented arthroplasty
(Rice et al., 2008; Scalise and Iannotti, 2008). Although such glenoid bone reconstruction
procedures have managed to align the glenoid components the muscle balance across the joint
may not have been restored and recurrent posterior subluxation of the humeral head has been
reported (Boileau et al., 2002; Walch et al., 1998). To investigate the effect of misalignment
in the context of reconstruction procedures, the misaligned position should not be compared
to a component implanted in the intact (ideal) glenoid as was done in this thesis but, instead,
to a component that had been implanted into a glenoid bone that had undergone one of the
aforementioned reconstruction procedures. This thesis chose not to investigate this
reconstruction problem but it will be further addressed in the Further Work section (Chapter
8).
Chapter 7
162
7.2.2 The importance of implant seating/interface gap
Chapter 5 suggested that implant seating is a significant problem for cementless glenoid
implants as poor seating dramatically affected and increased the micromotion. Previous
studies have highlighted that poor seating is a clinical and common reality. Our experience is
that even in the highly controlled laboratory environment it was very difficult to ream the
bone to achieve perfect seating (no gap). In contrast, no problems with implant seating were
noticed in the cemented study of Chapter 6. In all likelihood the reaming procedure of
Chapter 6 was no better than the reaming procedure of Chapter 5 but it seems reasonable to
assume that the cement used in Chapter 6 would simply fill any gaps in the interface. In terms
of interfacial gap development therefore, the thesis suggests that cemented fixation presents a
significant advantage over cementless fixation. The thesis also suggests that methods to
mediate cementless implants’ vulnerability to poor implant seating need to be devised before
the potential of cementless fixation of the glenoid can be fully realised.
In this thesis (Chapters 4 and 5), the interface gap was found in all porcine glenoids. Closer
inspection revealed that the curvature of the reamed host bone was larger than the implant
base plate curvature and the gap was essentially the mismatch in curvature. The curvature of
the reaming tool and the implant base plate did match and it would seem that the mismatch
with the reamed bone was due to slight movements of the handheld tool during the reaming
procedure. In clinical practice, with limited exposure of the joint and inability to hold the
scapular blade and surgical tool very firmly during the reaming process, it is expected that
implant seating would be worse than that obtained in this study.
In this thesis the gap width ranged from 121 to 267 μm. According to in-situ animal studies, a
gap size exceeding 500 μm significantly reduced the chance of osseointegration as the gap
was too large to be bridged. A gap size of 2.0 mm effectively disables the process of bone

Chapter 7
163
ingrowth (Clemens et al., 1997; Dalton et al., 1995; Kienapfel et al., 1999; Mavrogenis et al.,
2009). The existence of a gap in cementless shoulder arthroplasty as found in this study (<267
µm) may therefore be argued to be small enough not to inhibit biological fixation at the
implant base plate. However, such an argument is based on a static gap and whether the cells
can bridge the gap, whereas in a ‘dynamically’ loaded environment the presence of a gap of
this size has the secondary effect of causing increased micromotion.
The press-fit and specific geometry of the implant pegs were noticed to play a role, albeit
minor, in the creation of the interface gap. If the fit of the pegs within the drilled holes was
poor or too tight this may have prevented good seating of the base plate. More subtly, the
frictional spring back of the pegs once the impaction force was removed created a small gap.
This was further influenced by the particular ‘thread’ design of the pegs in this study. These
threads were designed to be easy to elastically bend, thereby easing insertion but acting like
fish-hooks to resist pull-out. However, upon release of the impaction force the elastic recoil of
the threads further added to the creation of a small gap. In summary, subtle details of the
glenoid design may play a role when trying to devise procedures to avoid or reduce the size of
the gap.
7.2.3 Considerations about glenoid bone quality
The FE study on cementless implants in human bone (Chapter 5) suggested that micromotion
was affected by the quality of the underlying bone. In effect weak glenoid bone is at relatively
high risk of implant loosening since bone ingrowth may fail due to excessive micromotion.
The in-vitro study on cemented implants (Chapter 6) also suggested that weak bone caused
failure of the bone-cement interface as opposed to implant-cement interface failure. Thus for
both cementless and cemented implants, weak bone at the fixation interface presented a
notably higher risk of component loosening. Therefore on the basis of bone quality and
Chapter 7
164
loosening alone, the results of this thesis do not suggest a preference for one fixation method
over the other.
These results do suggest that the bone quality of patients should be preoperatively assessed to
guide the decision of choosing the best treatment. If the bone quality is found to be poor this
may affect the decision to carry out the shoulder arthroplasty or the type of arthroplasty (hemi
arthroplasty or total arthroplasty). These results also indicate a need to design glenoid
components or bone preparation procedures specifically for patients with poor bone quality.
These results also support the commonly held principle to avoid excessive reaming of the
glenoid cavity. The stiffness of glenoid is non-uniform throughout glenoid vault and denser
towards the articulating surface. Excessive reaming of this surface would remove the denser
bone that this study has shown is important for both cemented and cementless implants.
7.3 Discussion and Conclusions of methodologies (DVC-CT, FE, In-Vitro experiment
including the use of radiolucent lines)
7.3.1 The DVC-µCT technique
Chapter 3 presented a novel use of DVC and μCT images for measuring micromotion and the
performance of the DVC-μCT technique was found to be robust in this study.
Conceptually, the technique relies on the ability of DVC to track the pattern of the implant
coating and the adjacent bone. Severe deformation of the tracked patterns after loading or
poor quality of the μCT images may lead to inaccurate results and even disable the application
of this technique. Subvolume size is also a parameter that influences the tracked displacement
precision (Gillard et al., 2014; Jandejsek et al., 2011; Roberts et al., 2014), and thus affect the
Chapter 7
165
precision of micromotion. The optimum size is recommended to be determined prior to the
use of such technique.
As mentioned in Chapter 3, the setting of contact point between the humeral head and glenoid
component was challenging; therefore, the specimens frequently did not achieve the desired
position. Furthermore, the micromotion obtained in this study was an effect of static loading
while early implant loosening is more likely to be due to dynamic physical loading during
daily activities. In addition, the critical micromotion thresholds (reported to range between 40
and 150 μm) were investigated via in-vivo studies conducted under dynamic loading condition
(Bragdon et al., 1996; Duyck et al., 2006; Jasty et al., 1997; Szmukler-Moncler et al., 1998;
Vandamme et al., 2007), and therefore were inconsistent with this study The difference in
loading application may influence the result interpretation. A modification of the loading
device and methodology could overcome these limitations and enhance the accuracy and
robustness of the DVC-μCT technique.
The concept of this method is not only useful for a study relating shoulder implants but for
any application that is concerned with movements at the interface of this scale. For example
cementless arthroplasty in other joints, and fixation of cartilage plugs for repairing
osteochondral defects.
7.3.2 FE methodology for predicting micromotion in cementless arthroplasty
According to this study, the most important parameter that hinders the accuracy of the FE
analysis is the gap between the base plate of the implant and the host bone. The existence of
the gap is overlooked in most FE studies, which according to our findings, means that these
studies are likely to underestimate micromotion. Although the existence of a gap can be
simulated through the FE model, simulations with exact gap size is challenging since its size
is varies due to imperfect reaming procedure. A realistic estimation of the gap size is needed

Chapter 7
166
prior to implementation of FE analysis. To obtain the most accurate results, the FE should be
used in combination with the experimental method, at least for validation of micromotion.
7.3.3 Radiolucent lines in cemented arthroplasty
Loosening of the cemented glenoid component was evaluated experimentally using the
modified ASTM dynamic testing protocol presented in Chapter 6. The experiment showed
that an eccentric load due to component version, induced bone fracture at the cement-bone
interface causing the appearance of radiolucent lines on the CT images. It is challenging to
validate this failure mechanism clinically not only because of a lack of studies reporting the
relationship between postoperative glenoid version and radiolucent lines, but also the
subjectivity of radiographic interpretation.
Although radiolucent lines are the main radiographic assessment method in prosthetic
arthroplasty, it is unclear whether their presence is a result of true mechanical loosening
associated with fibrous tissue formation or just a change of bone structure at the implant-bone
interface (Szabo and Walch, 2007). A post-mortem study of femurs that had undergone total
hip arthroplasty suggested that a change in bone structure caused by osteoporosis contributed
to the presence of radiolucent lines but did not alter the strength of component fixation
assessed by mechanical testing (Kwong et al., 1992). In shoulder arthroplasty, the radiolucent
lines can be observed in the glenoid without fixation problems and the number of patients
with the significant radiolucent lines requiring revision surgery is relatively small (Nho et al.,
2010). This indicates the difficulty in using radiolucent line for assessing component
loosening and highlights the importance of distinguishing between radiolucent line from
mechanical loosening and radiolucent line responsible for biological change.

Chapter 7
167
Although the comparison between the results obtained from this study and clinical
observations is still unclear, the dynamic loading test should provide sufficient data to
indicate the effect of component version on the incidence of radiolucent lines.

Chapter 8
168
CHAPTER 8
Future work
The work of this thesis brought up several issues, the importance of which was not anticipated
at the outset-of the study: most notably, the effects of implant seating and bone properties.
While this thesis did go some way to address these issues further work is warranted.
Also, as mentioned in Chapter 7, the importance of misalignment is appreciated by many
surgeons but they are faced with 3 key problems if wishing to address it. The first of these is
the lack of joint exposure and suitable bony landmarks and, accordingly, the practical
difficulty of orientating the implant to match a desired position. Possibly the solution to this is
some sort of guiding system. Secondly, it is unclear which bony anatomy to align the implant
according to: should the alignment follow the orientation of the scapular blade or the glenoid
vault? Thirdly, the preoperative bone is frequently asymmetrically eroded and this is often the
cause of the implant misalignment. It is not clear how to best reconstruct the joint to achieve
proper alignment: asymmetrical reaming, augmenting with bone graft or cement, or an
augmented implant? Indeed it may be better to accept some misalignment than to carry out a
reconstruction of the glenoid. This thesis showed the effect of misalignment and which
alignments should be aimed for. However, the thesis did not address how to aid the surgeon to
achieve such alignment nor which bony anatomy should be the target for fixation or to the
best reconstruction procedure if faced with an eroded glenoid bone. The thesis showed that
misalignment of the glenoid prosthesis is a problem but further studies are warranted to
provide a solution.
Chapter 8
169
The thesis was focussed ‘directly’ on the effect of misalignment on fixation failure. However,
implant misalignment may have other effects which, in turn, may affect prosthetic loosening.
Specifically, implant misalignment may cause bony impingement against the rim of the
implant during arm movement. Such impingement may induce high forces on the prosthesis
possibly leading to failure of the fixation. Misalignment and associated eccentric loading of
the implant may cause raised levels of polyethylene wear followed by osteolysis and
component loosening. Further work to investigate the effect of misalignment on impingement
and wear are warranted.
Implant design may be optimised to better resist misalignment, lack of implant seating, poor
bone quality and wear. Further work of implant design to mediate these issues is warranted.
Some of the above mentioned studies were considered in more detail during the work of this
thesis and in some cases initial work was carried out as described in the following. Also,
further work on the methodologies (DVC-CT and FE) for assessing implant loosening is
discussed below.
8.1 Addressing implant seating
Chapter 5 suggested that implant seating is a significant problem for cementless implants as it
dramatically affected and increased the micromotion. Previous studies have highlighted that
imperfect seating is a clinical reality. Our experience was that even in the highly controlled
laboratory environment it was very difficult to ream the bone to get perfect seating (no gap).
Also most glenoids are currently fixed using cement and it would seem that cemented
implants would be less vulnerable to imperfect reaming. However, as shown in Chapter 5,
cementless implants may be very vulnerable to the reaming and preparation of the bone.

Chapter 8
170
Therefore, in regards to improving the success of cementless glenoid components a study of
implant seating appears very relevant. An important part of such a study would be an
assessment of the seating and accurate characterisation of the interface gap occurring in
clinical practice. Once established such gaps could be introduced in the physical and
computational experiments similar to those of Chapters 3 and 4 to evaluate the effect of the
gap. An important part of any such study would be to identify ways to improve the reaming
procedures or otherwise device mechanisms to improve the seating of the implant.
8.2 Should the glenoid implant be aligned according to the scapular blade orientation or
according to the orientation of the glenoid vault?
Currently, the gold standard is to aim for the glenoid to be aligned according to the scapular
blade orientation (Figure 8.1, left). However, this orientation frequently does not coincide
with the orientation of the glenoid vault (as is the case in the example shown in Figure 8.1)
and it has recently been suggested that, instead, the aim should instead be to align the implant
according to the glenoid vault as indicated in the right part of Figure 8.1 (Gregory et al.,
2012). The reasoning for the first approach is to achieve a force balance of the rotator cuff
muscles which attach along the scapular blade, while the reasoning for the second approach is
to avoid perforation of the glenoid vault and that the natural balance of rotator cuff forces will
have adapted to the orientation of the glenoid vaults.

Chapter 8
171
Figure 8. 1 The yellow line indicates the orientation of the scapular blade (a line joining the
most medial point of the scapular blade with the centre point of the glenoid articular surface).
The schematic implant (red) in the left part of the figure indicates the current standard of
aligning the glenoid component according to the scapular blade. The implant in the right part
of the figure indicates the positioning of an implant according to the orientation of the glenoid
vault.
It was considered to address this issue as part of this PhD using the in-vitro test set-up of
Chapter 6 investigating differences in the occurrence of radiolucencies between the two
different procedures. The geometry of the glenoid and the scapular bone will clearly be
crucial when addressing this question and such a study would necessitate the use of cadaveric
bone instead of bone substitute material. It would also be important to get cadaveric bone
where the orientation of the glenoid vault and the scapular blade do not coincide. This was
thought to significantly complicate the acquisition of suitable cadaveric material as it is not
possible to determine the orientation of the vault relative to the scapular prior to acquiring the
specimens. It was therefore decided not to pursue this issue as part of this Thesis but it would
be an important study to consider for the future.
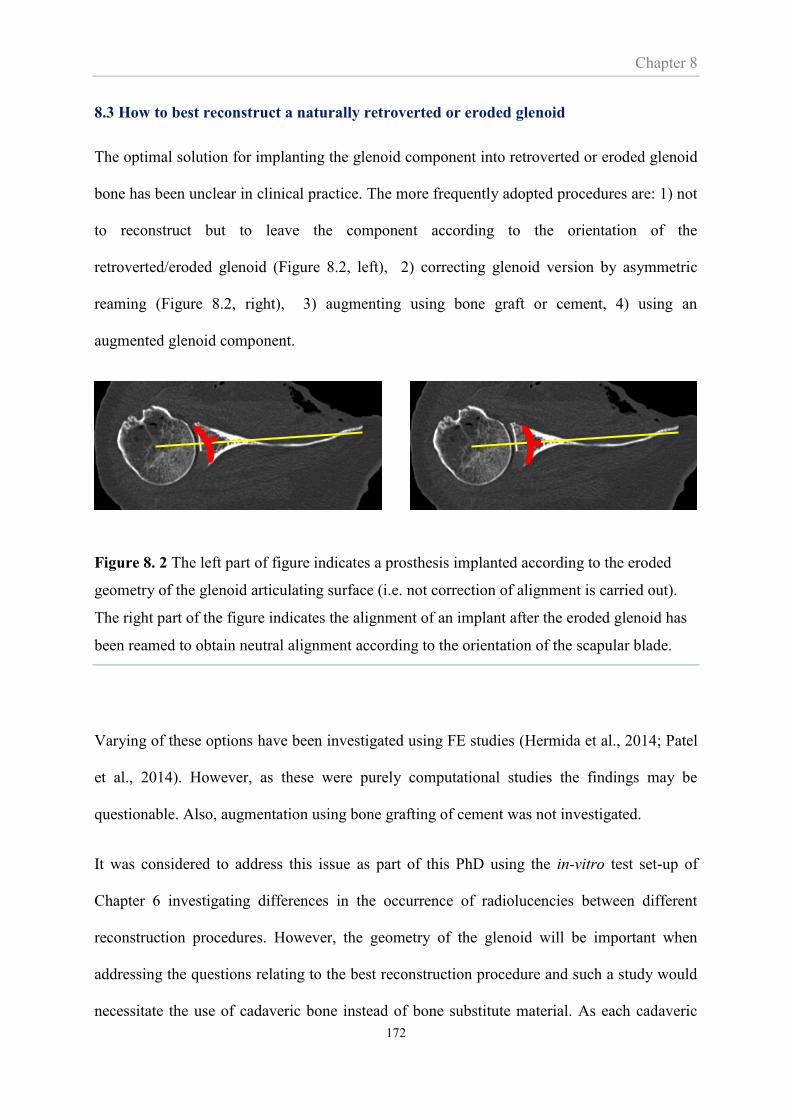
Chapter 8
172
8.3 How to best reconstruct a naturally retroverted or eroded glenoid
The optimal solution for implanting the glenoid component into retroverted or eroded glenoid
bone has been unclear in clinical practice. The more frequently adopted procedures are: 1) not
to reconstruct but to leave the component according to the orientation of the
retroverted/eroded glenoid (Figure 8.2, left), 2) correcting glenoid version by asymmetric
reaming (Figure 8.2, right), 3) augmenting using bone graft or cement, 4) using an
augmented glenoid component.
Figure 8. 2 The left part of figure indicates a prosthesis implanted according to the eroded
geometry of the glenoid articulating surface (i.e. not correction of alignment is carried out).
The right part of the figure indicates the alignment of an implant after the eroded glenoid has
been reamed to obtain neutral alignment according to the orientation of the scapular blade.
Varying of these options have been investigated using FE studies (Hermida et al., 2014; Patel
et al., 2014). However, as these were purely computational studies the findings may be
questionable. Also, augmentation using bone grafting of cement was not investigated.
It was considered to address this issue as part of this PhD using the in-vitro test set-up of
Chapter 6 investigating differences in the occurrence of radiolucencies between different
reconstruction procedures. However, the geometry of the glenoid will be important when
addressing the questions relating to the best reconstruction procedure and such a study would
necessitate the use of cadaveric bone instead of bone substitute material. As each cadaveric

Chapter 8
173
specimen will be different, each type of reconstruction would need to be carried out for
sufficient specimens such that a statistically significant difference between the various
reconstruction procedures could be identified. This would require many cadaveric specimens
and a time consuming experimental programme. An additional complication was that
cadaveric specimens with eroded glenoids would be needed, or, a suitable way of simulating
the erosion would need to be identified. While it was deemed that it would not be feasible to
do this within the time constraints of this thesis it is an important study for further work.
While (Hermida et al., 2014; Patel et al., 2014) investigated some of the reconstruction
procedures using finite element analyses they only did so in the context of cemented shoulder
arthroplasties. Therefore, an FE study of the effect of reconstruction procedures of cementless
shoulder arthroplasty was considered for this PhD. However, as it was decided not to carry
out the experimental part of the reconstruction study it was decided that an FE-only study
would not be very robust and the time better spend on other aspects. However, it would be an
interesting further study.
Possibly, advances in 3D printing may soon be able to replicate the eroded/retroverted
glenoid. In that case, the exact same specimen can be printed eliminating specimen specific
effects and the reconstruction procedures can evaluated in a straightforward manner. Multiple
specimens can also be easily produced. However, such a printed bone would need to be
validated as being representative of real bone.
8.4 Does glenoid component misalignment cause impingement?
This study was initiated during the work of this PhD. The purpose was to test the hypotheses
that replaced shoulders with retroverted and/or inclined glenoid implants have a lower range
of motion and a greater possibility of impingement than those with neutrally aligned implants.

Chapter 8
174
The study used a rigid body model (Articulis) that was developed for predicting impingement
and ranges of motion in the shoulder (Krekel et al., 2006). The predictions of the models,
which were based on CT scans from patients, were to be correlated in a pair-wise fashion with
clinical Constant scores from the same patients. The hypothesis of this part being that if the
correlation was high then the model would be able to predict optimal implant alignments for
successful outcomes by avoiding impingement and achieving a good range of motion.
The study imported CT scans from patients and created 3D surface models which were then
virtually implanted with the prosthesis (Figure 8.3) in 0°, 5° and 10° of retroversion,
respectively.
(a) (b)
Figure 8. 3 Preparation of 3D model for studying range of motion and impingement on the
replaced shoulder joint. Glenoid implant component is virtually aligned based on the original
alignment observed from the CT dataset (a). 3D model consisting of humeral head, glenoid,
and glenoid component prepared for motion analysis (b).

Chapter 8
175
These geometric models of the implanted bone were imported into the rigid body model
Articulis which moved the joint through a range of motions to establish the joint’s movement
envelope (i.e. the range of motion limited by impingement).
Figure 8. 4 The Articulis shows envelope profile representing the maximum degree of
elevation at various elevation planes, e.g., abduction, flexion.
The results of one such simulation is shown in Figure 8.5. In brief, the results suggested that
retroversion increases the movement envelope.
As familiarity with the models was gained, its limitations became increasingly clear. Most
significantly, the model does not take into account the effects of any soft tissues. It was felt
that neglecting the effect of ligaments in predicting impingement at the extremes of motion
was a very significant shortcoming of the model and one that would render the predictions
very questionable. Because of this and because it was felt that other parts of the thesis showed
more promise this work was discontinued. However, if/when the model is improved this work
would be interesting to pursue further.

Chapter 8
176
Figure 8. 5 Effect of retroversion on maximum degree of elevation before impingement. The
abscissa indicates in which plane the arm is lifted while the ordinate indicates how high it was
possible to flex the arm before impingement. Elevation plane at 0o corresponds to forward
flexion (sagittal plane) and 270° to abduction.in the coronal plane.
8.5 Improvement of the loading device used for the DVC-μCT technique
The positioning error of the specimen and the inability to conduct dynamic loading tests were
limitations of this study as discussed in Chapter 7. To overcome those issues, it will be
necessary to make a few modifications of the current design of the loading device. The
considerable modifications include a new design of the specimen holder allowing the contact
between the humeral head and the glenoid component to be precisely set in the desired
position. In addition, a more sophisticated loading system should be added to allow more
physiological loading including high loading rates and oscillating micromotion. Related to
this may be the need for faster scan times. Currently, the scanning procedure takes 20 min
effectively resulting in a very slow loading rate and relaxation effects. It is noted that loading
pattern in this study is a load at a single time point during shoulder abduction. A more
realistic loading pattern may obtained from a full loading cycle (time-dependant loading).
0
20
40
60
80
100
120
140
160
180
0 30 60 90 120 150 180 210 240 270 300 330 360
Ma
xim
um
ele
va
tio
n (
Deg
ree)
Elevation plane (Degree)
0º retroversion 5º retroversion 10º retroversion

Chapter 8
177
However, a study in hip arthroplasty (Ploeg et al., 2012) showed that the two loading patterns
resulted in a difference in micromotion magnitude at several regions of the bone-implant
interface. Related to this an in-depth investigation based on shoulder arthroplasty may
necessitated.
Several other factors for the future development of the loading device need to be considered.
The dimensional size of loading device should be minimal, making the specimen to
close to the X-ray source to maximise the image resolution.
To obtain sufficient image quality, the device should be made from materials in which
their densities are not close to those of the bone and implant.
The configuration of design should allow the device to be rotated 360º during the scan
without any obstructions.
An appropriate fixation should be carried out to avoid rigid body movement of the
loaded specimen during the scan period
The net weight of the device should be compatible with the allowance limit (<5 kg for
the μCT scanner used in this study).
References
178
References
Abdul-Kadir, M.R., Hansen, U., Klabunde, R., Lucas, D., Amis, A., 2008. Finite element
modelling of primary hip stem stability: the effect of interference fit. J Biomech 41, 587-594.
Abel, R.L., Laurini, C.R., Richter, M., 2012. A palaeobiologist's guide to 'virtual' micro-CT
preparation. Palaeontologia Electronica (Online) 15. Available at: http://palaeo-
electronica.org/content/issue-2-2012-technical-articles/233-micro-ct-workflow.
Anglin, C., Tolhurst, P., Wyss, U.P., Pichora, D.R., 1999. Glenoid cancellous bone strength
and modulus. J Biomech 32, 1091-1097.
Anglin, C., Wyss, U., Pichora, D., 2000. Glenohumeral contact forces. Proc Inst Mech Eng H
214, 637-644.
Antuna, S.A., Sperling, J.W., Cofield, R.H., Rowland, C.M., 2001. Glenoid revision surgery
after total shoulder arthroplasty. J Shoulder Elbow Surg 10, 217-224.
Anuta, P.E., 1970. Spatial registration of multispectral and multitemporal digital imagery
using fast Fourier transform techniques. IEEE Trans Geosci Electron 8, 353-368.
Apreleva, M., Parsons, I.M., Warner, J.J.P., Fu, F.H., Woo, S.L.Y., 2000. Experimental
investigation of reaction forces at the glenohumeral joint during active abduction. J Shoulder
Elbow Surg 9, 409-417.
Bartelt, R., Sperling, J.W., Schleck, C.D., Cofield, R.H., 2011. Shoulder arthroplasty in
patients aged fifty-five years or younger with osteoarthritis. J Shoulder Elbow Surg 20, 123-
130.
Bay, B.K., Smith, T.S., Fyhrie, D.P., Saad, M., 1999. Digital volume correlation: Three-
dimensional strain mapping using X-ray tomography. Exp Mech 39, 217-226.
Bigliani, L.U. and Flatow, E.V., 2005. Shoulder Arthroplasty. Springer-Verlag New York Inc.
Bohsali, K.I., Wirth, M.A., Rockwood, C.A., Jr., 2006. Complications of total shoulder
arthroplasty. J Bone Joint Surg Am 88, 2279-2292.
Boileau, P., Avidor, C., Krishnan, S.G., Walch, G., Kempf, J.F., Mole, D., 2002. Cemented
polyethylene versus uncemented metal-backed glenoid components in total shoulder
arthroplasty: a prospective, double-blind, randomized study. J Shoulder Elbow Surg 11, 351-
359.
References
179
Bragdon, C.R., Burke, D., Lowenstein, J.D., O Connor, D.O., Ramamurti, B., Jasty, M.,
Harris, W.H., 1996. Differences in stiffness of the interface between a cementless porous
implant and
cancellous bone in vivo in dogs due to varying amounts of implant motion. J Arthroplasty 11,
945-951.
Branemark, P.I., 1959. Vital microscopy of bone marrow in rabbit. Scand J Clin Lab Invest
11 Supp 38, 1-82.
Brekelmans, W.A., Poort, H.W., Slooff, T.J., 1972. A new method to analyse the mechanical
behaviour of skeletal parts. Acta Orthop Scand 43, 301-317.
Bremand, F., Germaneau, A., Doumalin, P., Dupre, J.C., 2008. Study of mechanical
behaviour of cancellous bone by digital volume correlation and X-ray micro-computed
tomography. Proceedings of the XIth International Congress and Exposition.
Choi, D., Park, Y., Yoon, Y.-S., Masri, B.A., 2010. In vitro measurement of interface
micromotion and crack in cemented total hip arthroplasty systems with different surface
roughness. Clin Biomech 25, 50-55.
Churchill, R.S., Brems, J.J., Kotschi, H., 2001. Glenoid size, inclination, and version: an
anatomic study. J Shoulder Elbow Surg 10, 327-332.
Clarke, S.G., Phillips, A.T., Bull, A.M., 2012. Validation of FE micromotions and strains
around a press-fit cup: introducing a new micromotion measuring technique. Ann Biomed
Eng 40, 1586-1596.
Clemens, J.A., Klein, C.P., Sakkers, R.J., Dhert, W.J., de Groot, K., Rozing, P.M., 1997.
Healing of gaps around calcium phosphate-coated implants in trabecular bone of the goat. J
Biomed Mater Res 36, 55-64.
Cofield, R.H., 1984. Total shoulder arthroplasty with the Neer prosthesis. J Bone Joint Surg
Am 66, 899-906.
Collins, D., Tencer, A., Sidles, J., Matsen, F., 3rd, 1992. Edge displacement and deformation
of glenoid components in response to eccentric loading. The effect of preparation of the
glenoid bone. J Bone Joint Surg Am 74, 501-507.
Constant, C., Murley, A., 1987. A clinical method of functional assessment of the shoulder.
Clin Orthop Relat Res 214, 160-164.
Cristofolinia, L., Teutonicoa, A.S., Montia, L., Cappellob, A., Tonia, A., 2003. Comparative
in vitro study on the long term performance of cemented hip stems: validation of a protocol to
discriminate between “good” and “bad” designs. J Biomech 36, 1603–1615.
References
180
Dalton, J.E., Cook, S.D., Thomas, K.A., Kay, J.F., 1995. The effect of operative fit and
hydroxyapatite coating on the mechanical and biological response to porous implants. J Bone
Joint Surg Am 77, 97-110.
Dawson, J., Fitzpatrick, R., Carr, A., 1999. The assessment of shoulder instability. The
development and validation of a questionnaire. J Bone Joint Surg Br 81, 420-426.
Doblare, M., Garcia, J.M., 2002. Anisotropic bone remodelling model based on a continuum
damage-repair theory. J Biomech 35, 1-17.
Doblare, M., Garcia, J.M., 2004. Modelling bone tissue fracture and healing: a review. Eng
Fract Mech 71, 1809-1840.
Duyck, J., Vandamme, K., Geris, L., Van Oosterwyck, H., De Cooman, M., Vandersloten, J.,
Puers, R., Naert, I., 2006. The influence of micro-motion on the tissue differentiation around
immediately loaded cylindrical turned titanium implants. Arch Oral Biol 51, 1-9.
Erdemir, A., Guess, T.M., Halloran, J., Tadepalli, S.C., Morrison, T.M., 2012. Considerations
for reporting finite element analysis studies in biomechanics. J biomech 45, 625-633.
F2028-02, 2012. Standard test methods for dynamic evaluation of glenoid loosening or
disassociation. Book of ASTM standards.
Farron, A., Terrier, A., Buchler, P., 2006. Risks of loosening of a prosthetic glenoid implanted
in retroversion. J Shoulder Elbow Surg 15, 521-526.
Favre, P., Moor, B., Snedeker, J.G., Gerber, C., 2008. Influence of component positioning on
impingement in conventional total shoulder arthroplasty. Clin Biomech (Bristol, Avon) 23,
175-183.
Forsberg, F., Mooser, R., Arnold, M., Hack, E., Wyss, P., 2008. 3D micro-scale deformations
of wood in bending: synchrotron radiation muCT data analyzed with digital volume
correlation. J Struct Biol 164, 255-262.
Franck, C., 2008. Dissertation (Ph.D.). Quantitative characterization of 3D deformations of
cell interactions with soft biomaterials. California Institute of Technology.
Franck, C., Hong, S., Maskarinee, S.A., 2007. Three-dimensional full-field measurement of
large deformations in soft materials using confocal microscopy and digital volume
correlation. Exp Mech 47, 427-438.
Franklin, J.L., Barrett, W.P., Jackins, S.E., Matsen, F.A., 3rd, 1988. Glenoid loosening in total
shoulder arthroplasty. Association with rotator cuff deficiency. J Arthroplasty 3, 39-46.
References
181
Franta, A.K., Lenters, T.R., Mounce, D., Neradilek, B., Matsen, F.A., 3rd, 2007. The complex
characteristics of 282 unsatisfactory shoulder arthroplasties. J Shoulder Elbow Surg 16, 555-
562.
Frich, L.H., Jensen, N.C., Odgaard, A., Pedersen, C.M., Sojbjerg, J.O., Dalstra, M., 1997.
Bone strength and material properties of the glenoid. J Shoulder Elbow Surg 6, 97-104.
Friedman, R.J., Hawthorne, K.B., Genez, B.M., 1992. The Use of Computerized-Tomography
in the Measurement of Glenoid Version. J Bone Joint Surg Am 74A, 1032-1037.
Galetz, M.C., Seiferth, S.H., Theile, B., Glatzel, U., 2010. Potential for adhesive wear in
friction couples of UHMWPE running against oxidized zirconium, titanium nitride coatings,
and cobalt-chromium alloys. Journal of biomedical materials research. Part B, J Appl
Biomater 93, 468-475.
Garrigues, G.E., Johnston, P.S., Pepe, M.D., Tucker, B.S., Ramsey, M.L., Austin, L.S., 2012.
Hemiarthroplasty versus reverse total shoulder arthroplasty for acute proximal humerus
fractures in elderly patients. Orthopedics 35, e703-708.
Gates, M., Lambros, J., Heath, M.T., 2011. Towards high performance digital volume
correlation. Exp Mech 51, 491-507.
Germaneau, A., Doumalin, P., Dupre, J.C., 2007. 3D strain field measurement by correlation
of volume images using scattered light: Recording of images and choice of marks. Strain 43,
207-218.
Gibson, L.J., 1985. The mechanical behaviour of cancellous bone. J Biomech 18, 317-328.
Gillard, F., Boardman, R., Mavrogordato, M., Hollis, D., Sinclair, I., Pierron, F., Browne, M.,
2014. The application of digital volume correlation (DVC) to study the microstructural
behaviour of trabecular bone during compression. J Mech Behav Biomed Mater 29, 480-499.
Gortchacow, M., Wettstein, M., Pioletti, D.P., Muller-Gerbl, M., Terrier, A., 2012.
Simultaneous and multisite measure of micromotion, subsidence and gap to evaluate femoral
stem stability. J Biomech 45, 1232-1238.
Gregory, T., Hansen, U., Emery, R., Amis, A., Mutchler, C., Taillieu, F., Augereau, B., 2012.
Total shoulder arthroplasty does not correct the orientation of the eroded glenoid. Acta Orthop
83, 529–535.
Gregory, T., 2010. Dissertation (Ph.D.). Glenoid failure in total shoulder arthroplasty.
Imperial College London.
Gregory, T., Hansen, U., Taillieu, F., Baring, T., Brassart, N., Mutchler, C., Amis, A.,
Augereau, B., Emery, R., 2009. Glenoid loosening after total shoulder arthroplasty: an in vitro
CT-scan study. J Orthop Res 27, 1589-1595.
References
182
Gregory, T., Hansen, U., Emery, R.J., Augereau, B., Amis, A.A., 2007. Developments in
shoulder arthroplasty. Proc Inst Mech Eng H 221, 87-96.
Gregory, T, Sankey, A., Augereau, B., Vandenbussche, E., Amis, A., Emery, R., Hansen, U.,
2013. Accuracy of Glenoid Component Placement in Total Shoulder Arthroplasty and Its
Effect on Clinical and Radiological Outcome in a Retrospective, Longitudinal, Monocentric
Open
Study. PLOS one (Online) 8. Available at: http://journals.plos.org/plosone/article?id=
10.1371/ journal.pone.0075791#pone-0075791-g006.
Greiner, S., Berth, A., Kaab, M., Irlenbusch, U., 2013. Glenoid morphology affects the
incidence of radiolucent lines around cemented pegged polyethylene glenoid components.
Arch Orthop Trauma Surg 133, 1331-1339.
Habermeyer, P., Magosch, P., Luz, V., Lichtenberg, S., 2006. Three-dimensional glenoid
deformity in patients with osteoarthritis: a radiographic analysis. J Bone Joint Surg Am 88,
1301-1307.
Haga, M., Fujii, N., Nozawa-Inoue, K., Nomura, S., Oda, K., Uoshima, K., Maeda, T., 2009.
Detailed process of bone remodeling after achievement of osseointegration in a rat
implantation model. Anat Rec (Hoboken) 292, 38-47.
Hasan, S.S., Leith, J.M., Campbell, B., Kapil, R., Smith, K.L., Matsen, F.A., 3rd, 2002.
Characteristics of unsatisfactory shoulder arthroplasties. J Shoulder Elbow Surg 11, 431-441.
Hermida, J.C., Flores-Hernandez, C., Hoenecke, H.R., D'Lima, D.D., 2014. Augmented
wedge-shaped glenoid component for the correction of glenoid retroversion: a finite element
analysis. J Shoulder Elbow Surg 23, 347-354.
Hirji, Z., Hunjun, J.S., Choudur, H.N., 2011. Imaging of the Bursae. J Clin Imaging Sci 1, 22.
Hopkins, A., 2004. Dissertation (Ph.D.). Total Soulder Arthroplasty Simulation using Finite
Elemeny Analysis. Imperial College London.
Hopkins, A.R., Hansen, U.N., Amis, A.A., Emery, R., 2004. The effects of glenoid
component alignment variations on cement mantle stresses in total shoulder arthroplasty.
Journal of shoulder and elbow surgery 13, 668-675.
Hopkins, A.R., Hansen, U.N., Amis, A.A., 2005. Finite element models of total shoulder
replacement: Application of boundary conditions. Comput Methods Biomech Biomed Engin
8, 39-44.
Hsu, J.E., Ricchetti, E.T., Huffman, G.R., Iannotti, J.P., Glaser, D.L., 2013. Addressing
glenoid bone deficiency and asymmetric posterior erosion in shoulder arthroplasty. J Shoulder
Elbow Surg 22, 1298-1308.
References
183
Huiskes, R., Chao, E.Y., 1983. A survey of finite element analysis in orthopedic
biomechanics: the first decade. J Biomech 16, 385-409.
Hussein, A.I., Barbone, P.E., Morgan, E.F., 2012. Digital volume correlation for study of the
machanics of whole bones. Procedia IUTAM 4, 116-125.
Iannotti, J.P., Lappin, K.E., Klotz, C.L., Reber, E.W., Swope, S.W., 2013. Liftoff resistance
of augmented glenoid components during cyclic fatigue loading in the posterior-superior
direction. J Shoulder Elbow Surg 22, 1530-1536.
Iannotti, J.P., Greeson, C., Downing, D., Sabesan, V., Bryan, J.A., 2011. Effect of glenoid
deformity on glenoid component placement in primary shoulder arthroplasty. J Shoulder
Elbow Surg, 1-8.
Iwaki, H., Scott, G., Freeman, M., 2002. The natural history and significance of radiolucent
lines at a cemented femoral interface. J Bone Joint Surg Br 84, 550-555.
Jacobs, C.R., Simo, J.C., Beaupre, G.S., Carter, D.R., 1997. Adaptive bone remodeling
incorporating simultaneous density and anisotropy considerations. J Biomech 30, 603-613.
Jandejsek, I., Jirousek, O., Vavrik, D., 2011. Precise strain measurement in complex materials
using Digital Volumetric Correlation and time lapse micro-CT data. 11th International
Conference on the Mechanical Behavior of Materials (Icm11) 10, 1730-1735.
Jasty, M., Bragdon, C., Burke, D., O'Connor, D., Lowenstein, J., Harris, W.H., 1997. In vivo
skeletal responses to porous-surfaced implants subjected to small induced motions. J Bone
Joint Surg Am 79, 707-714.
Jirousek, O., Jandejsek, I., Vavrik, D., 2011. Evaluation of strain field in microstructures
using micro-CT and digital volume correlation. J Instrum (Online) 6. Available at:
http://iopscience.iop.org/1748-0221/6/01/C01039).
Junaid, S., 2010. Dissertation (Ph.D.). Failure characteristics of all polyethylene cemented
glenoid implants in total shoulder arthroplasty. Imperial College London.
Junaid, S., Gupta, S., Sanghavi, S., Anglin, C., Emery, R., Amis, A., Hansen, U., 2010.
Failure mechanism of the all-polyethylene glenoid implant. J Biomech 43, 714-719.
Kalouche, I., Crepin, J., Abdelmoumen, S., Mitton, D., Guillot, G., Gagey, O., 2010.
Mechanical properties of glenoid cancellous bone. Clin Biomech (Bristol, Avon) 25, 292-298.
Karelse, A., Leuridan, S., Tongel, A.V., Piepers, I.M., Debeer, P., Wilde, L.F.D., 2014. A
glenoid reaming study how accurate are current reaming techniques. J Shoulder Elbow Surg
23, 1120–1127.
References
184
Kasten, P., Pape, G., Raiss, P., Bruckner, T., Rickert, M., Zeifang, F., Loew, M., 2010. Mid-
term survivorship analysis of a shoulder replacement with a keeled glenoid and a modern
cementing technique. J Bone Joint Surg Br 92, 387-392.
Kienapfel, H., Sprey, C., Wilke, A., Griss, P., 1999. Implant fixation by bone ingrowth. J
Arthroplasty 14, 355-368.
Kircher, J., Wiedemann, M., Magosch, P., Lichtenberg, S., Habermeyer, P., 2009. Improved
accuracy of glenoid positioning in total shoulder arthroplasty with intraoperative navigation: a
prospective-randomized clinical study. J Shoulder Elbow Surg 18, 515-520.
Krekel, P.R., Botha, C.P., Valstar, E.R., Bruin, P.W.d., Rozing, P.M., Post, F.H., 2006.
Interactive simulation and comparative visualisation of the bone-determined range of motion
of the human shoulder, The Simulation und Visualisierung Conference 2006, 275-288.
Kumar, S., Sperling, J.W., Haldukewych, G.H., Cofield, R.H., 2004. Periprosthetic humeral
fractures after shoulder arthroplasty. J Bone Joint Surg Am 86, 680-689.
Kurtz, S.M., 2009. UHMWPE biomaterials handbook: ultra high molecular weight
polyethylene in total joint replacement and medical devices, 2th Edition, Elsevier Inc.
Kwong, L.M., Jasty, M., Mulroy, R.D., Maloney, W.J., Bragdon, C., Harris, W.H., 1992. The
histology of the radiolucent line. J Bone Joint Surg Br 74, 67-73.
Landau, J.P., Hoenecke, H.R., 2009. Genetic and biomechanical determinants of glenoid
version: implications for glenoid implant placement in shoulder arthroplasty. J Shoulder
Elbow Surg 18, 661-667.
Lazarus, M.D., Jensen, K.L., Southworth, C., Matsen, F.A., 3rd, 2002. The radiographic
evaluation of keeled and pegged glenoid component insertion. J Bone Joint Surg Am 84-A,
1174-1182.
Lehtinen, J.T., Tingart, M.J., Apreleva, M., Warner, J.J., 2004. Total, trabecular, and cortical
bone mineral density in different regions of the glenoid. J Shoulder Elbow Surg 13, 344-348.
Leucht, P., Kim, J.B., Wazen, R., Currey, J.A., Nanci, A., Brunski, J.B., Helms, J.A., 2007.
Effect of mechanical stimuli on skeletal regeneration around implants. Bone 40, 919-930.
Lewis, G.S., Armstrong, A.D., 2011. Glenoid spherical orientation and version. J Shoulder
Elbow Surg 20, 3-11.
Liu, L., Morgan, E.F., 2007. Accuracy and precision of digital volume correlation in
quantifying displacements and strains in trabecular bone. J Biomech 40, 3516-3520.
Lugli, T., 1978. Artificial shoulder joint by Pean (1893): the facts of an exceptional
intervention and the prosthetic method. Clin Orthop Relat Res 133, 215–218.
References
185
Madi, K., Tozzi, G., Zhang, Q.H., Tong, J., Cossey, A., Au, A., Hollis, D., Hild, F., 2013.
Computation of full-field displacements in a scaffold implant using digital volume correlation
and finite element analysis. Med Eng Phys 35, 1298-1312.
Maire, E., Withers, P.J., 2014. Quantitative X-ray tomography. Int Mater Rev 59, 1-43.
Mansat, P., Barea, C., Hobatho, M.C., Darmana, R., Mansat, M., 1998. Anatomic variation of
the mechanical properties of the glenoid. J Shoulder Elbow Surg 7, 109-115.
Matsen, F.A., 3rd, Clinton, J., Lynch, J., Bertelsen, A., Richardson, M.L., 2008. Glenoid
component failure in total shoulder arthroplasty. J Bone Joint Surg Am 90, 885-896.
Matsen, F.A., 3rd, Boileau, P., Walch, G., Gerber, C., Bicknell, R.T., 2007. The reverse total
shoulder arthroplasty. J Bone Joint Surg Am 89, 660-667.
Mavrogenis, A.F., Dimitriou, R., Parvizi, J., Babis, G.C., 2009. Biology of implant
osseointegration. J Musculoskelet Neuronal Interact 9, 61-71.
McBroom, R.J., Hayes, W.C., Edwards, W.T., Goldberg, R.P., White, A.A., 1985. Prediction
of vertebral body compression fracture using quantitative computed tomography. J Bone Joint
Surg 67, 1206-1214.
Merolla, G., 2013. Shoulder replacement in advanced glenohumeral osteoarthritis: current
concepts review. OA Orthopaedics (Online). Available at: https://www.oapublishinglondon.
com/article/604.
Mimar, R., Limb, D., Hall, R.M., 2008. Evaluation of the mechanical and architectural
properties of glenoid bone. J Shoulder Elbow Surg 17, 336-341.
Mole, D., Roche, C., Riand, N., Levigne, G., Walch, G., 1999. Cemented Glenoid
Component: Results in Osteoarthritis and Rheumatoid Arthritis. Shoulder Arthroplasty, 163-
171.
Moorman, C.T., Warren, R.F., Dines, D.M., Moeckel, B.H., Altcheck, D.W., 1994. Total
shoulder arthroplasty: Revision for instability. Oper Tech Orthop 4, 237-242.
Morrey, B.F., Sperling, J.W., An, K., A., 2011. Joint Replacement Arthroplasty: Basic
Science, Elbow and Shoulder, 4th Edition, Wolters Kluwer, Lippincott Willaims & Wilkins.
Mullaji, A.B., Beddow, F.H., Lamb, G.H.R., 1994. CT measurement of glenoid eroion in
arthritis. J Bone Joint Surg Br 76, 384-388.
Nahas, A., Bauer, M., Roux, S., Boccara, A.C., 2013. 3D static elastography at the
micrometre scale using full field OCT. Biomed Opt Express 4, 2138-2149
References
186
Neer, C.S., 2nd, Morrison, D.S., 1988. Glenoid bone-grafting in total shoulder arthroplasty. J
Bone Joint Surg Am 70, 1154-1162.
Neer, C.S., 2nd, 1974. Replacement arthroplasty for glenohumeral osteoarthritis. J Bone Joint
Surg Am 56, 1-13.
Nguyen, D., Ferreira, L.M., Brownhill, J.R., King, G.J., Drosdowech, D.S., Faber, K.J.,
Johnson, J.A., 2009. Improved accuracy of computer assisted glenoid implantation in total
shoulder arthroplasty: an in-vitro randomized controlled trial. J Shoulder Elbow Surg 18, 907-
914.
Nguyen, D., Ferreira, L.M., Brownhill, J.R., Faber, K.J., Johnson, J.A., 2007. Design and
development of a computer assisted glenoid implantation technique for shoulder replacement
surgery. Comput Aided Surg 12, 152-159.
Nho, S.J., Frank, R.M., Verma, N.N., Romeo, A.A., 2010. Incidence of early development of
radiolucent lines in keeled polyethylene glenoid components after total shoulder arthroplasty.
Am J Orthop (Belle Mead NJ) 39, 333-337.
Norris, T.R., Iannotti, J.P., 2002. Functional outcome after shoulder arthroplasty for primary
osteoarthritis: a multicenter study. J Shoulder Elbow Surg 11, 130-135.
Novotny, J.E., Beynnon, B.D., Nichols, C.E., 2000. Modeling the stability of the human
glenohumeral joint during external rotation. J Biomech 33, 345-354.
Nyffeler, R.W., Sheikh, R., Atkinson, T.S., Jacob, H.A., Favre, P., Gerber, C., 2006. Effects
of glenoid component version on humeral head displacement and joint reaction forces: an
experimental study. J Shoulder Elbow Surg 15, 625-629.
Oosterom, R., Rozing, P.M., Bersee, H.E., 2004. Effect of glenoid component inclination on
its fixation and humeral head subluxation in total shoulder arthroplasty. Clin Biomech
(Bristol, Avon) 19, 1000-1008.
Patel, R.J., Gulotta, L., Wright, T.M., Gao, Y., 2014. Effects of osteoarthritis on load transfer
after cemented total shoulder arthroplasty. J Shoulder Elbow Surg, 407–415.
Pierron, F., McDonald, S.A., Hollis, D., Fu, J., Withers, P.J., Alderson, A., 2013. Comparison
of the Mechanical Behaviour of Standard and Auxetic Foams by X-ray Computed
Tomography and Digital Volume Correlation. Strain 49, 467-482.
Poon, P.C., Ting, F.S., 2011. A 2-dimensional glenoid vault method for measuring glenoid
version on computed tomography. J Shoulder Elbow Surg, 329–335.
Ploeg, B., Tarala, M., Homminga, J., Janssen, D., Buma, P., Verdonschot, N. 2012. Toward a
more realistic prediction of peri-prosthetic micromotions. J Orthop Res, 1147–1154.
References
187
Pruitt, L.A., 2005. Deformation, yielding, fracture and fatigue behavior of conventional and
highly cross-linked ultra high molecular weight polyethylene. Biomaterials 26, 905-915.
Radnay, C.S., Setter, K.J., Chambers, L., Levine, W.N., Bigliani, L.U., Ahmad, C.S., 2007.
Total shoulder replacement compared with humeral head replacement for the treatment of
primary glenohumeral osteoarthritis: a systematic review. J Shoulder Elbow Surg 16, 396-
402.
Ramazanoglu, M., Oshida, Y., 2011. Osseointegration and Bioscience of Implant Surfaces -
Current Concepts at Bone-Implant Interface, Implant Dentistry - A Rapidly Evolving Practice,
Prof. Ilser Turkyilmaz (Ed.), Available at: http://www.intechopen.com/books/implant-
dentistry-a-rapidly-evolving-practice/osseointegration-and-bioscience-of-implant-surfaces-
current-concepts-at-bone-implant-interface.
Riboh, J.C., Garrigues, G.E., 2012. Bone grafting in shoulder arthroplasty. Orthopedics 35,
966-973.
Ricchetti, E.T., Williams Jr, G.R., 2011. Total Shoulder Arthroplasty-Indications, Technique,
and Results. Oper Tech Orthop 21, 28-38.
Rice, J.C., Cowin, S.C., Bowman, J.A., 1988. On the dependence of the elasticity and strength
of cancellous bone on apparent density. J Biomech 21, 155-168.
Rice, R.S., Sperling, J.W., Miletti, J., Schleck, C., Cofield, R.H., 2008. Augmented glenoid
component for bone deficiency in shoulder arthroplasty. Clin Orthop Relat Res 466, 579-583.
Rice, J.C., Cowin, S.C., Bowman, J.A., 1988. On the dependence of the elasticity and strength
of cancellous bone on apparent density. J Biomech 21, 155-168.
Roberts, B.C., Perilli, E., Reynolds, K.J., 2014. Application of the digital volume correlation
technique for the measurement of displacement and strain fields inbone: A literaturereview. J
Biomech 47, 923–934.
Roche, C., Angibaud, L., Flurin, P.H., Wright, T., Zuckerman, J.D., 2006. Glenoid loosening
in response to dynamic multi-axis eccentric loading. Bull Hosp Jt Dis 63, 88-92.
Roux, S., Hild, F., Viot, P., Bernard, D., 2008. Three-dimensional image correlation from X-
ray computed tomography of solid foam. Compos Part A Appl Sci Manuf 39, 1253-1265.
Sabesan, V., Callanan, M., Youderian, A., Iannotti, J., 2014. 3D CT Assessment of the
relationship between humeral head alignment and glenoid retroversion in glenohumeral
osteoarthritis. J Bone Joint Surg 96, 1-7.
Scalise, J.J., Iannotti, J.P., 2008. Bone grafting severe glenoid defects in revision shoulder
arthroplasty. Clin Orthop Relat Res 466, 139-145.
References
188
Schaffler, M.B., Burr, D.B., 1988. Stiffness of compact bone: effects of porosity and density.
J Biomech 21, 13-16.
Shapiro, T.A., McGarry, M.H., Gupta, R., Lee, Y.S., Lee, T.Q., 2007. Biomechanical effects
of glenoid retroversion in total shoulder arthroplasty. J Shoulder Elbow Surg 16, S90-95.
Shirazi-Adl, A., Dammak, M., Paiement, G., 1993. Experimental determination of friction
characteristics at the trabecular bone/porous coated metal interface in cementless implants. J
Biomed Mater Res 27, 167- 175.
Sjodahl, M., Siviour, C.R., Forsberg, F., 2012. Digital volume correlation applied to
compaction of granular materials. IUTAM Symposium on Full-Field Measurements and
Identification in Solid Mechanics, 2011 4, 179-195.
Skirving, A.P., 1999. Total shoulder arthroplasty-current problems and possible solutions. J
Orthop Sci 4, 42-53.
Smith, T.S., Bay, B.K., 2001. Experiment measurement of strains using digital volume
correlation, Nontraditional methods of sensing stress, strain, and damage in materials and
structures: 2nd volume, Lucas, G.F., McKeigham, P.C., Ransom, J.S., Eds., ASTM STP 1323,
West Conshohocken, PA, 117-126.
Søballe, K., Hansen, E.S., Brockstedt-Rasmussen, H., Bünger, C., 1993. Hydroxyapatite
coating converts fibrous tissue to bone around loaded implants. J Bone Joint Surg Br 75, 270-
278.
Speirs, A.D., Slomczykowski, M.A., Orr, T.E., Siebenrock, K., Nolte, L.P., 2000. Three-
dimensional measurement of cemented femoral stem stability: an in vitro cadaver study. Clin
Biomech 15, 248-255.
Strauss, E.J., Roche, C., Flurin, P.H., Wright, T., Zuckerman, J.D., 2009. The glenoid in
shoulder arthroplasty. J Shoulder Elbow Surg 18, 819-833.
Suarez, D.R., 2010. Dissertation (Ph.D.). Mechanical Stability of Cementless Implants, The
Glenoid Replacement. Delft University of Technology.
Suarez, D.R., Nerkens, W., Valstar, E.R., Rozing, P.M., van Keulen, F., 2012. Interface
micromotions increase with less-conforming cementless glenoid components. J Shoulder
Elbow Surg 21, 474-482.
Suárez, D.R., van Keulen, F., Rozing, P.M., Poort, G., Broomans, P., Valstar, E.R., van der
Linden, J.C., 2009a. Influence of the positioning of a cementless glenoid prosthesis on its
interface micromotions. Proceedings of the Institution of Mechanical Engineers, Part H:
Journal of Engineering in Medicine 223, 795-804.

References
189
Suarez, D.R., Valstar, E.R., Linden, J.C.v.d., Keulen, F.v., Rozing, P.M., 2009b. Effect of
rotator cuff dysfunction on the initial mechanical stability of cementless glenoid components.
Med Biol Eng Comput 47, 507-514.
Szabo, I., Walch, G., 2007. Factors affecting cemented glenoid component loosening in total
shoulder arthroplasty. Int J Shoulder Surg 1, 23-29.
Szmukler-Moncler, S., Salama, H., Reingewirtz, Y., Dubruille, J.H., 1998. Timing of loading
and effect of micromotion on bone-dental implant interface: review of experimental literature.
J Biomed Mater Res 43, 192-203.
T. Reiner, S. Jaeger, M. Schwarze, M. C. Klotz, N. A. Beckmann, R. G. Bitsch, 2014. The
stability of the femoral component in the Oxford unicompartmental knee replacement. Bone
Joint J 96, 896-901.
Taylor, M., Prendergast, P.J., 2015. Four decades of finite element analysis of orthopaedic
devices: Where are we now and what are the opportunities?. J Biomech 48, 767-778.
Terrier, A., Reist, A., Vogel, A., Farron, A., 2007. Effect of supraspinatus deficiency on
humerus translation and glenohumeral contact force during abduction. Clin Biomech (Bristol,
Avon) 22, 645-651.
Terrier, A., Buchler, P., Farron, A., 2005. Bone-cement interface of the glenoid component:
stress analysis for varying cement thickness. Clin Biomech (Bristol, Avon) 20, 710-717.
Torchia, M.E., Cofield, R.H., Settergren, C.R., 1997. Total shoulder arthroplasty with the
Neer prosthesis: long-term results. J Shoulder Elbow Surg 6, 495-505.
Tuncer, M., Cobb, J.P., Hansen, U.N., Amis, A.A., 2013. Validation of multiple subject-
specific finite element models ofunicompartmental knee replacement. Med Eng Phys 35,
1457-1464.
Vandamme, K., Naert, I., Geris, L., Vander Sloten, J., Puers, R., Duyck, J., 2007. The effect
of micro-motion on the tissue response around immediately loaded roughened titanium
implants in the rabbit. Eur J Oral Sci 115, 21-29.
Van de Sande, M.A.J., Brand, R., Rozing, P.M., 2006. Indications, complications, and results
of shoulder arthroplasty. Scand J Rheumatol 35, 426-434.
Walch, G., Badet, R., Boulahia, A., Khoury, A., 1999. Morphologic study of the glenoid in
primary glenohumeral osteoarthritis. J Arthroplasty 14, 756-760.
Walch, G., Boulahia, A., Boileau, P., Kempf, J.F., 1998. Primary glenohumeral osteoarthritis:
clinical and radiographic classification. The Aequalis Group. Acta Orthop Belg 64 Suppl 2,
46-52.

References
190
Wallace, A.L., Phillips, R.L., MacDougal, G.A., Walsh, W.R., Sonnabend, D.H., 1999.
Resurfacing of the glenoid in total shoulder arthroplasty. J Bone Joint Surg 81, 510-518.
Warren, R.F., Coleman, S.H., Dines, J.S., 2002. Instability after arthroplasty: the shoulder. J
Arthroplasty 17, 28-31.
Weber, P., Utzschneider, S., Sadoghi, P., Andress, H., Jansson, V., 2011. Management of the
infected shoulder prothesis: a retrospective analysis and review of the literature. Int Orthop
35, 365-373.
Wong, A.S., Gallo, L., Kuhn, J.E., Carpenter, J.E., Hughes, R.E., 2003. The effect of glenoid
inclination on superior humeral head migration. J Shoulder Elbow Surg 12, 360-364.
Wright, T.W., Cofield, R.H., 1995. Humeral fractures after shoulder arthroplasty. J Bone Joint
Surg 77, 1340-1346.
Yang, J.P., Bogoch, E.R., Woodside, T.D., Hearn, T.C., 1997. Stiffness of trabecular bone of
the tibial plateau in patients with rheumatoid arthritis of the knee. J Arthroplasty 12, 789-803.
Yian, E.H., Werner, C.M., Nyffeler, R.W., Pfirrmann, C.W., Ramappa, A., Sukthankar, A.,
Gerber, C., 2005. Radiographic and computed tomography analysis of cemented pegged
polyethylene glenoid components in total shoulder replacement. J Bone Joint Surg Am 87,
1928-1936.
Youderian, A.R., Napolitano, L.A., Davidson, I.U., Iannotti, J.P., 2012. Management of
Glenoid Bone Loss With the Use of a New Augmented All-Polyethylene Glenoid
Component. Tech Should Elb Surg 13, 163-169.
Zadeh, H.G., Calvert, P.T., 1998. Recent advances in shoulder arthroplasty. Current
Orthopaedics 12, 122-134.
Zauel, R., Yeni, Y.N., Bay, B.K., Dong, X.N., Fyhrie, D.P., 2006. Compararison of the linear
finite element prediction of deformation and strain of human cancellous bone to 3D digital
volume correlation measurements. J Biomech Eng 128, 1-6.
Zioupos, P., Cook, R.B., Hutchinson, J.R., 2008. Some basic relationships between density
values in cancellous and cortical bone. J Biomech 41, 1961-1968.
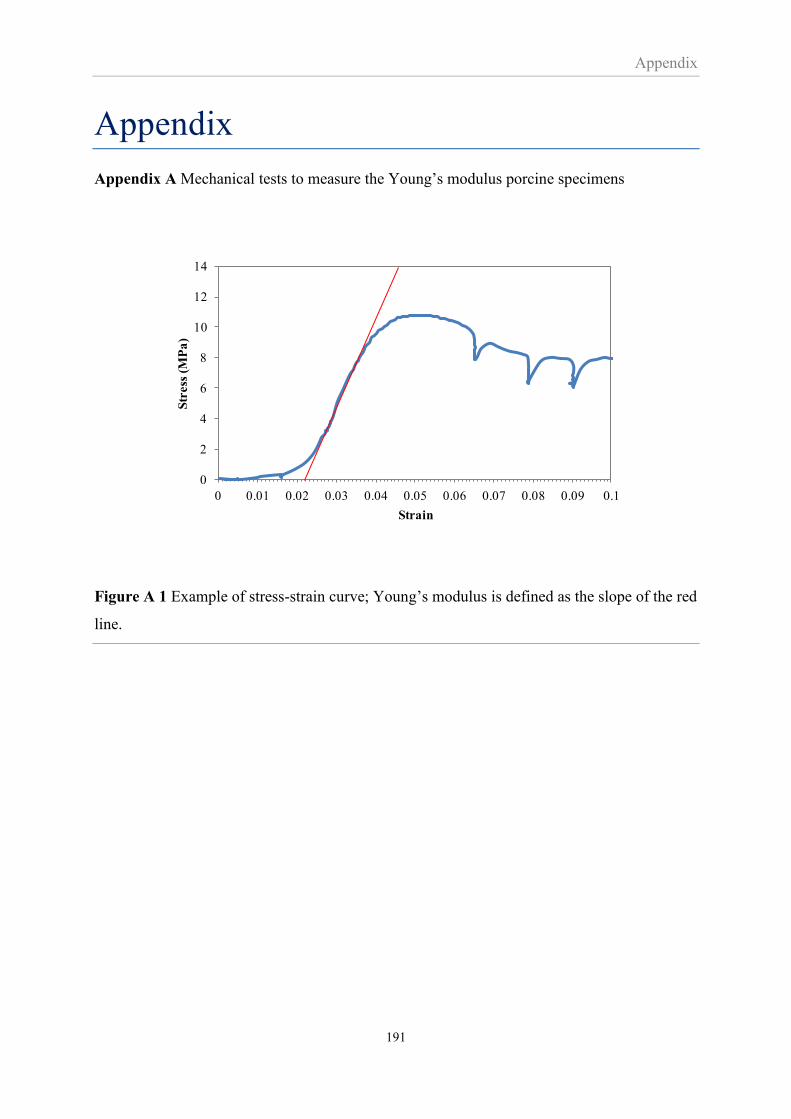
Appendix
191
Appendix
Appendix A Mechanical tests to measure the Young’s modulus porcine specimens
Figure A 1 Example of stress-strain curve; Young’s modulus is defined as the slope of the red
line.
0
2
4
6
8
10
12
14
0 0.01 0.02 0.03 0.04 0.05 0.06 0.07 0.08 0.09 0.1
Str
ess
(M
Pa
)
Strain
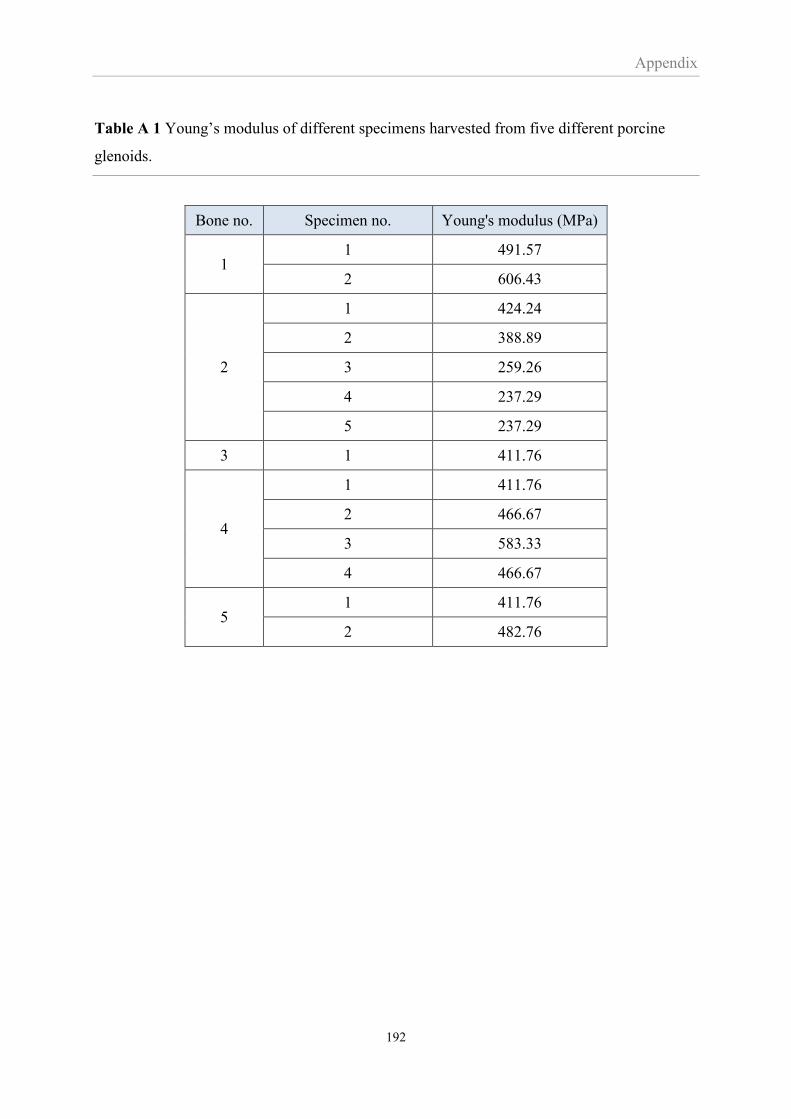
Appendix
192
Table A 1 Young’s modulus of different specimens harvested from five different porcine
glenoids.
Bone no. Specimen no. Young's modulus (MPa)
1 1 491.57
2 606.43
2
1 424.24
2 388.89
3 259.26
4 237.29
5 237.29
3 1 411.76
4
1 411.76
2 466.67
3 583.33
4 466.67
5 1 411.76
2 482.76
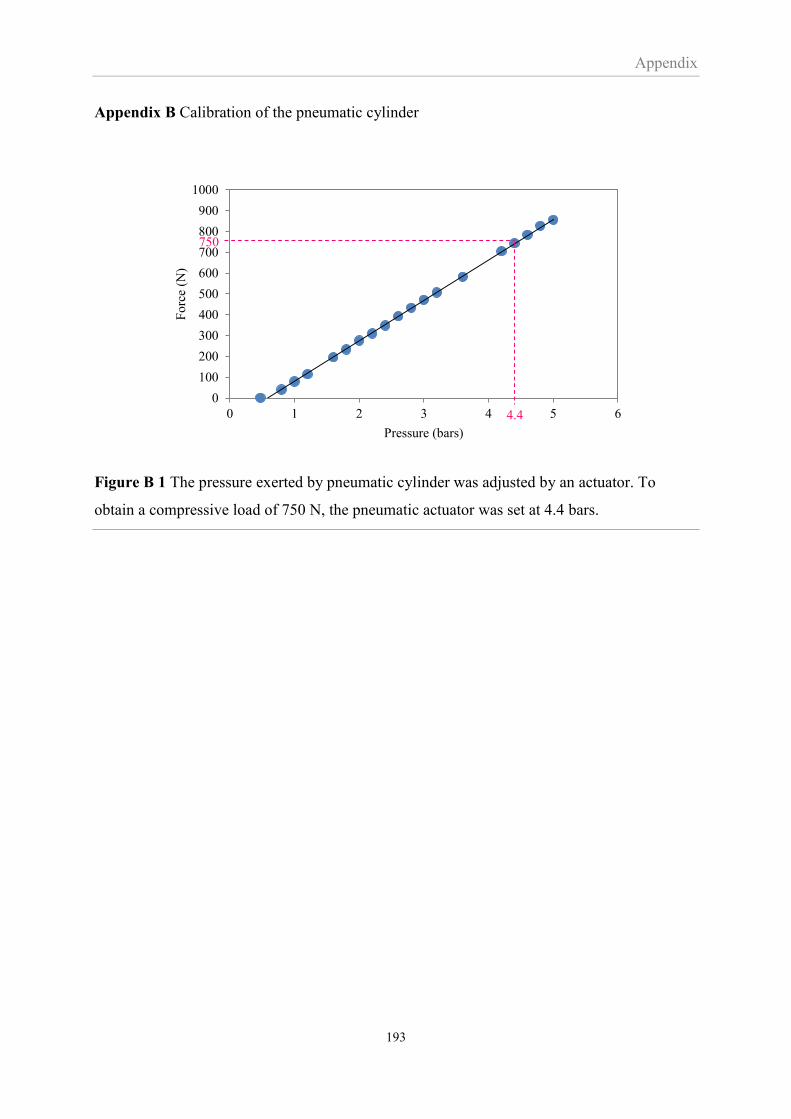
Appendix
193
Appendix B Calibration of the pneumatic cylinder
Figure B 1 The pressure exerted by pneumatic cylinder was adjusted by an actuator. To
obtain a compressive load of 750 N, the pneumatic actuator was set at 4.4 bars.
0
100
200
300
400
500
600
700
800
900
1000
0 1 2 3 4 5 6
Fo
rce
(N)
Pressure (bars)
4.4
750
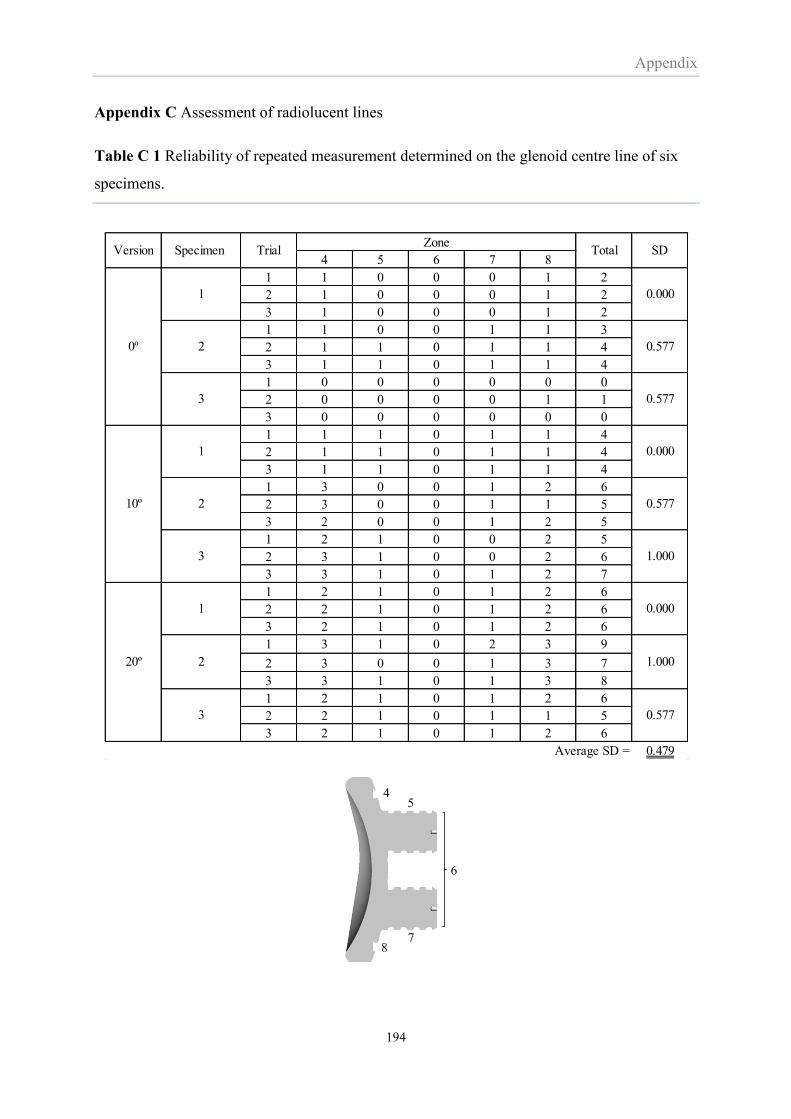
Appendix
194
Appendix C Assessment of radiolucent lines
Table C 1 Reliability of repeated measurement determined on the glenoid centre line of six
specimens.
4 5 6 7 8
1 1 0 0 0 1 2
2 1 0 0 0 1 2
3 1 0 0 0 1 2
1 1 0 0 1 1 3
2 1 1 0 1 1 4
3 1 1 0 1 1 4
1 0 0 0 0 0 0
2 0 0 0 0 1 1
3 0 0 0 0 0 0
1 1 1 0 1 1 4
2 1 1 0 1 1 4
3 1 1 0 1 1 4
1 3 0 0 1 2 6
2 3 0 0 1 1 5
3 2 0 0 1 2 5
1 2 1 0 0 2 5
2 3 1 0 0 2 6
3 3 1 0 1 2 7
1 2 1 0 1 2 6
2 2 1 0 1 2 6
3 2 1 0 1 2 6
1 3 1 0 2 3 9
2 3 0 0 1 3 7
3 3 1 0 1 3 8
1 2 1 0 1 2 6
2 2 1 0 1 1 5
3 2 1 0 1 2 6
Average SD = 0.479
0.577
1.000
0.000
1.000
0.577
SD
0.000
0.577
0.577
0.000
3
0º
10º
20º
Version
3
1
2
3
1
2
2
ZoneTotalTrialSpecimen
1
Posterior Anterior
1
2
3
9
10
11
45
6
78
Posterior Anterior

Appendix
195
Table C 2 Radiolucency score classified by zone of specimens completing 1000 cycles of
loading test.
Superior Inferior Anterior Posterior
1 2 3 4 5 6 7 8 9 10 11 1,4,5,9 3,7,8,11 9,10,11 1,2,3
1 0 0 0 0 0 0 0 0 0 0 0 0 0 0 0 0
2 0 0 0 0 0 0 0 0 0 0 0 0 0 0 0 0
3 0 0 0 0 0 0 0 0 0 0 0 0 0 0 0 0
4 0 0 0 1 0 0 0 1 1 0 0 3 2 1 1 0
5 0 0 0 0 0 0 0 0 0 0 0 0 0 0 0 0
6 0 0 0 0 0 0 0 0 0 0 0 0 0 0 0 0
1 0 0 0 0 0 0 0 0 0 0 0 0 0 0 0 0
2
3 0 0 0 0 0 0 0 0 0 0 0 0 0 0 0 0
4 0 0 0 0 0 0 0 0 0 0 0 0 0 0 0 0
5 0 0 0 2 0 0 0 1 0 0 0 3 2 1 0 0
6 0 0 0 0 0 0 0 0 0 0 0 0 0 0 0 0
1 1 0 1 0 0 0 0 1 0 0 0 3 1 2 0 2
2 0 0 0 0 0 0 0 0 0 0 0 0 0 0 0 0
3 1 0 1 2 0 0 0 0 1 0 0 5 4 1 1 2
4 0 0 1 0 0 0 0 0 0 0 0 1 0 1 0 1
5 0 0 0 0 0 0 0 0 0 0 0 0 0 0 0 0
6 0 0 0 0 0 0 0 0 0 0 0 0 0 0 0 0
ZoneTotal
failed scan
Version Specimen
0º
10º
20º
Posterior Anterior
1
2
3
9
10
11
45
6
78
Posterior Anterior

Appendix
196
Table C 3 Radiolucency score classified by zone of specimens completing 1700 cycles of
loading test.
Superior Inferior Anterior Posterior
1 2 3 4 5 6 7 8 9 10 11 1,4,5,9 3,7,8,11 9,10,11 1,2,3
1 0 0 0 0 0 0 0 0 0 0 0 0 0 0 0 0
2 0 0 0 0 0 0 0 0 0 0 0 0 0 0 0 0
3 0 0 0 0 0 0 0 0 0 0 0 0 0 0 0 0
4 1 0 1 2 0 0 0 2 2 0 2 10 5 5 4 2
5 0 0 0 1 0 0 0 1 0 0 0 2 1 1 0 0
6 0 0 0 0 0 0 1 1 0 0 0 2 0 2 0 0
1 0 0 0 0 0 0 0 1 0 0 0 1 0 1 0 0
2 2 1 2 3 0 0 0 1 0 0 0 9 5 3 0 5
3 0 0 0 0 0 0 0 0 0 0 0 0 0 0 0 0
4 0 0 0 0 0 0 0 0 0 0 0 0 0 0 0 0
5 2 0 2 2 1 0 1 1 1 0 2 12 6 6 3 4
6 0 0 1 1 0 0 0 1 0 0 0 3 1 2 0 1
1 2 0 2 1 0 0 1 1 0 0 1 8 3 5 1 4
2 0 0 0 2 0 0 1 1 1 0 1 6 3 3 2 0
3 1 1 2 2 1 0 1 2 2 0 0 12 6 5 2 4
4 0 0 1 0 0 0 0 1 0 0 0 2 0 2 0 1
5 1 0 1 1 0 0 1 1 1 0 1 7 3 4 2 2
6 1 0 1 1 1 0 1 1 2 0 1 9 5 4 3 2
0º
10º
20º
ZoneTotalVersion Specimen
Posterior Anterior
1
2
3
9
10
11
45
6
78
Posterior Anterior

Appendix
197
Table C 4 Radiolucency score classified by zone of specimens completing 2400 cycles of
loading test.
Superior Inferior Anterior Posterior
1 2 3 4 5 6 7 8 9 10 11 1,4,5,9 3,7,8,11 9,10,11 1,2,3
1 0 0 0 1 0 0 0 1 0 0 0 2 1 1 0 0
2 1 0 1 1 0 0 1 1 1 0 0 6 3 3 1 2
3 0 0 0 0 0 0 0 0 0 0 0 0 0 0 0 0
4 1 0 1 2 0 0 1 2 2 0 2 11 5 6 4 2
5 0 0 0 2 0 0 0 1 2 0 1 6 4 2 3 0
6 1 0 1 2 0 0 1 2 0 0 1 8 3 5 1 2
1 1 0 1 1 1 0 1 1 0 0 0 6 3 3 0 2
2 2 2 2 3 0 0 1 2 2 0 0 14 7 5 2 6
3 1 0 0 2 1 0 0 2 2 0 0 8 6 2 2 1
4 0 0 0 1 0 0 0 1 0 0 0 2 1 1 0 0
5 2 0 2 2 1 0 2 2 2 0 2 15 7 8 4 4
6 0 0 2 2 1 0 0 1 0 0 0 6 3 3 0 2
1 3 0 2 2 1 0 1 2 1 0 2 14 7 7 3 5
2 1 1 1 3 1 0 2 3 1 1 1 15 6 7 3 3
3 3 1 3 3 1 1 1 3 3 0 0 19 10 7 3 7
4 0 0 2 2 1 0 1 2 0 0 0 8 3 5 0 2
5 1 0 1 2 0 0 1 1 2 0 1 9 5 4 3 2
6 3 0 2 3 3 0 2 2 3 0 1 19 12 7 4 5
0º
10º
20º
Version SpecimenZone
Total
Posterior Anterior
1
2
3
9
10
11
45
6
78
Posterior Anterior