the effect of getting things done software by
TRANSCRIPT
THE EFFECT OF GETTING THINGS DONE SOFTWARE
ON THE MOTIVATION AND SELF-REGULATION OF
PRESERVICE TEACHERS IN AN INTRODUCTORY
EDUCATIONAL TECHNOLOGY COURSE
By
AMY LYNN JOHNSON
Bachelor of Science in Psychology Kansas State University
Manhattan, Kansas 1992
Master of Arts in Industrial/Organizational Psychology
University of Tulsa Tulsa, Oklahoma
1995
Master of Science in College Teaching Northeastern State University
Tahlequah, Oklahoma 2003
Submitted to the Faculty of the
Graduate College of the Oklahoma State University
in partial fulfillment of the requirements for
the Degree of DOCTOR OF PHILOSOPHY
May, 2013
brought to you by COREView metadata, citation and similar papers at core.ac.uk
provided by SHAREOK repository

ii
THE EFFECT OF GETTING THINGS DONE SOFTWARE
ON THE MOTIVATION AND SELF-REGULATION OF
PRESERVICE TEACHERS IN AN INTRODUCTORY
EDUCATIONAL TECHNOLOGY COURSE
Dissertation Approved:
Patricia Jordan, Ed.D.
Dissertation Adviser
John Curry, Ph.D.
Jerry Jordan, Ed.D.
Ed Harris, Ph.D.

iii
Name: AMY LYNN JOHNSON Date of Degree: MAY, 2013 Title of Study: THE EFFECT OF GETTING THINGS DONE SOFTWARE ON THE
MOTIVATION AND SELF-REGULATION OF PRESERVICE TEACHERS IN AN INTRODUCTORY EDUCATIONAL TECHNOLOGY COURSE
Major Field: EDUCATION Abstract: The purpose of this study was to investigate the effect of Getting Things Done ™ (GTD) software on the motivation and self-regulation of pre-service teachers in an introductory Educational Technology course. Getting Things Done™ software has the potential to provide pre-service teachers with a positive influence on their personal growth in relation to their accomplishments in the course. This dissertation attempts to integrate an examination of motivation and self-regulation for pre-service teachers with the use of Getting Things Done™ software. The study was a concurrent mixed methods study, employing both quantitative and qualitative measures, to determine and ascertain the differences in motivation and self-regulation between comparison groups. Comparison groups consisted of eight intact sections of the Educational Technology course, randomly divided into equal numbers of experimental and control groups. The Motivated Strategies for Learning Questionnaire (MSLQ) and a researcher developed, Likert-type scale, were utilized for the pre- and post-test component of the study. Additional qualitative data was collected through interviews with eight randomly selected participants from the experimental groups at the end of the study. Paired sample t-tests, independent samples t-tests, and Pearson bivariate correlations were conducted on the quantitative data. The qualitative interviews were transcribed and analyzed for themes. Significant results were discovered in both the experimental control groups for the MSLQ subscales and the Likert-type data. As a result, alternative causes for significance were considered. The number of significant results in both groups point to unexpected consequences via an unintentional cause. It is believed that there were statistically significant changes in both groups because course instructors for the experimental groups and the control groups modeled the components of GTD via their use of the online course platform, Desire2Learn (D2L), for calendaring, reminders, and course materials, which closely mimicked the components of the GTD software for all of the classes. Therefore, due to course structure, all students were provided with information and tools to stay connected to and on top of course material via the online course platform and were not forced to seek out alternative methods to stay organized.

iv
TABLE OF CONTENTS
Chapter Page I. INTRODUCTION ......................................................................................................1
Purpose of Study ......................................................................................................2 Research Question ...................................................................................................3 Statement of Problem ...............................................................................................3 Theoretical Approach: Self-Determination Theory .................................................3 Significance of the Study .........................................................................................6 Assumptions of the Study ........................................................................................6 Limitations of the Study...........................................................................................6 Definition of Terms..................................................................................................7 Conclusion ...............................................................................................................8 II. REVIEW OF LITERATURE..................................................................................10 Introduction ............................................................................................................10 Pre-Service Teachers .............................................................................................10 Self-Regulation ......................................................................................................14 Motivation ..............................................................................................................21 Self-Regulation and Motivation .............................................................................26 Pre-Service Teachers, Self-Regulation, and Motivation ........................................29 Web 2.0 ..................................................................................................................31 Getting Things Done ..............................................................................................35 Conclusion .............................................................................................................40 III. METHODOLOGY ................................................................................................41 General Procedures ................................................................................................41 Participants .............................................................................................................43 Instrument/Materials ..............................................................................................45 Quantitative Measure ........................................................................................45 Scale Definitions ........................................................................................49 Qualitative Measures ........................................................................................52 Instructional Materials ......................................................................................54 Procedures ..............................................................................................................58

v
Chapter Page
III. METHODOLOGY .................................................................................... continued Data Analysis .........................................................................................................59 Quantitative Data Analysis Procedures ............................................................59 Qualitative Data Analysis Procedures ..............................................................61 Independent and Dependent Variables ..................................................................61 Validity Considerations .........................................................................................61 Conclusion .............................................................................................................63 IV. RESULTS ..............................................................................................................64 Introduction ............................................................................................................64 Participant Demographic Information ...................................................................65 Analysis of MSLQ Data.........................................................................................67 Paired Sample t-test Experimental Groups .......................................................67 Paired Sample t-test Control Groups ................................................................72 Pearson Bivariate Correlations Experimental Groups ......................................76 Pearson Bivariate Correlations Control Groups ...............................................80 Independent Samples t-test ...............................................................................84 Pearson Bivariate Correlations Experimental and Control Groups ..................87 Analysis of Skill Level Likert-Type Scale Data ....................................................90 Paired Sample t-test Experimental Groups .......................................................90 Paired Sample t-test Control Groups ................................................................94 Pearson Bivariate Correlations Experimental Groups ......................................97 Pearson Bivariate Correlations Control Groups ...............................................99 Independent Samples t-test .............................................................................102 Pearson Bivariate Correlations Experimental and Control Groups ................104 Analysis of Open-Ended Short Answer Question Data .......................................105 Experimental Groups Pre-Test Self-Assessment ............................................105 Experimental Groups Post-Test Self-Assessment ..........................................108 Control Groups Pre-Test Self-Assessment .....................................................110 Control Groups Post-Test Self-Assessment ....................................................113 Analysis of Interview Data ..................................................................................115 Demographic Data ..........................................................................................115 Self-Assessment Data .....................................................................................116 Opinion Data ...................................................................................................120 D2L Platform Data ..........................................................................................135 Conclusion ...........................................................................................................139
vi
Chapter Page V. DISCUSSION, CONCLUSIONS, AND RECOMMENDATIONS ....................140 Introduction ..........................................................................................................140 Summary of the Study .........................................................................................140 General Discussion ..............................................................................................141 MSLQ Results ................................................................................................142 Likert-Type Scale Results ..............................................................................146 Open-Ended Question Results .......................................................................149 Interview Results ...........................................................................................150 Research Study Conclusions ................................................................................154 Limitations ...........................................................................................................161 Implications..........................................................................................................163 Implications for Students ................................................................................163 Implications for Instructors .............................................................................165 Implications for Education ..............................................................................166 Implications for Researchers...........................................................................168 Recommendations for Future Research ...............................................................170 Potential Research Question ...............................................................................173 Concluding Remarks ............................................................................................174 REFERENCES ..........................................................................................................177 APPENDICES ...........................................................................................................201

vii
LIST OF TABLES
Table Page 3.1 Section Information ............................................................................................44 3.2 Experimental and Control Groups Subject Information .....................................45 3.3 Coefficient (Cronbach’s) Alpha for MSLQ ........................................................47 3.4 Correlations among MSLQ Scales......................................................................48 4.1 Gender Summary ................................................................................................66 MSLQ Data 4.2 Paired Sample Descriptive Statistics Experimental Groups ...............................68 4.3 Paired Sample Paired Differences Experimental Groups ..................................69 4.4 Paired Sample Descriptive Statistics Control Groups ........................................72 4.5 Paired Sample Paired Differences Control Groups ............................................73 4.6 Pearson Bivariate Correlations Post-Test Variables Experimental Groups ........76 4.7 Pearson Bivariate Correlations Post-Test Variables Control Groups .................80 4.8 Independent Samples Descriptive Statistics .......................................................85 4.9 Pearson Bivariate Correlations Experimental and Control Groups Post-Test ....88 4.10 Descriptive Indices for Statistically Significant Post-Test Variables ...............89 Skill Level Likert-Type Scale Data 4.11 Paired Sample Descriptive Statistics Experimental Groups .............................91 4.12 Paired Sample Paired Differences Experimental Groups ................................92 4.13 Paired Sample Descriptive Statistics Control Groups ......................................94 4.14 Paired Sample Paired Differences Control Groups ..........................................95 4.15 Pearson Bivariate Correlations Post-Test Variables Experimental Groups ......97 4.16 Pearson Bivariate Correlations Post-Test Variables Control Groups .............100 4.17 Independent Samples Descriptive Statistics ...................................................103 4.18 Pearson Bivariate Correlations Experimental and Control Groups Post-Test 104 Open-Ended Short Answer Question Data 4.19 Experimental Groups Pre-Test Question Summary ........................................105 4.20 Experimental Groups Post-Test Question Summary ......................................108 4.21 Control Groups Pre-Test Question Summary .................................................111 4.22 Control Groups Post-Test Question Summary ...............................................114
viii
Table Page Interview Data 4.23 Self-Assessment Question 1 Summary ...........................................................116 4.24 Self-Assessment Question 2 Summary ...........................................................117 4.25 Self-Assessment Question 3 Summary ...........................................................118 4.26 Self-Assessment Question 4 Summary ...........................................................118 4.27 Self-Assessment Question 5 Summary ...........................................................119 4.28 Opinion Data Question 1 Summary ................................................................121 4.29 Opinion Data Question 2 Summary ................................................................122 4.30 Opinion Data Question 3 Summary ................................................................122 4.31 Opinion Data Question 4 Summary ................................................................123 4.32 Opinion Data Question 5 Summary ................................................................124 4.33 Opinion Data Question 6 Summary ................................................................125 4.34 Opinion Data Question 7 Summary ................................................................126 4.35 Opinion Data Question 8 Summary ................................................................127 4.36 Opinion Data Question 9 Summary ................................................................128 4.37 Opinion Data Question 10 Summary ..............................................................129 4.38 Opinion Data Question 11 Summary ..............................................................130 4.39 Opinion Data Question 12a Summary ............................................................131 4.40 Opinion Data Question 12b Summary ............................................................132 4.41 Opinion Data Question 13 Summary ..............................................................132 4.42 Opinion Data Question 14a Summary ............................................................133 4.43 Opinion Data Question 14b Summary ............................................................134 4.44 Opinion Data Question 15 Summary ..............................................................135 4.45 D2L Platform Question 1 Summary ...............................................................135 4.46 D2L Platform Question 2 Summary ...............................................................136 4.47 D2L Platform Question 3 Summary ...............................................................137 4.48 D2L Platform Question 4 Summary ...............................................................138 5.1 Pearson Bivariate Correlations Experimental Groups Post-Test Variables ......143 5.2 Pearson Bivariate Correlations Control Groups Post-Test Variables ...............144
ix
LIST OF FIGURES
Figure Page 2.1 David Allen’s Workflow Diagram......................................................................38 3.1 David Allen’s Workflow Diagram......................................................................55

1
CHAPTER I
INTRODUCTION
The world of technology is constantly changing and evolving. Those teaching
others to use technology are in a continual struggle to balance existing programs and
applications with newly released products. A further challenge exists for teacher
educators in technology preparation courses. Not only do these educators instruct pre-
service teachers in how to use these programs and the appropriate application of the
technology, but also they must educate these future teachers on ways in which technology
can be effectively integrated into K-12 classroom environments.
Unfortunately, the overwhelming number of programs and applications to be
taught in these courses can put a strain on pre-service teachers. Tarafdar et al. (2007)
found that technostress or stress from too much computer technology can cause overload,
privacy invasion, inability to deal with the complexities of the technology, and lead to a
fear of technology. Aoki and Downes (2003) discovered that students struggle when they
endeavor to manipulate more technology than they think they can handle.
Balancing technology and coursework assignments in the classroom is difficult
for many students. Learning to use new programs and staying current with course
assignments can be daunting tasks. Trying to balance coursework, technology
instruction, and future technology implementation may be an overwhelming process for

2
for pre-service teachers. Kinzie (1990) notes “for learners to be effective, they must be
able to make appropriate instructional choices based on effective learning strategies, and
they must be motivated by a desire to learn” (p. 6). Kinzie also believes that learners
who use self-regulated learning methods will demonstrate better ongoing motivation to
learn.
Zimmerman (2008) states that current research should focus on the ways
motivational feelings and beliefs of students influences their ability to begin and sustain
changes in self-regulation of learning. Additionally, Dexter, Doering, and Riedel (2006)
contend that while National Educational Technology Standards for Teachers have been
implemented in higher education programs, pre-service teachers need opportunities to
learn to use technology. Topper (2004) discovered that pre-service teachers graduating
from a teacher education program did not have the confidence or capability to utilize
basic technology in their own classrooms. College students face a variety of obstacles to
successfully complete their coursework including, competing demands from different
courses, lack of personal confidence in their ability to accomplish tasks, and insufficient
knowledge in applying technological applications to help with assignments. This
research study attempted to address several of these issues for pre-service teachers in an
introductory Educational Technology course.
Purpose of study
The purpose of this study was to investigate the effect of Getting Things Done ™
(GTD) software on the motivation and self-regulation of pre-service teachers in an
introductory Educational Technology course. The researcher hypothesized pre-service
teachers who used GTD software would demonstrate a greater increase in motivation and

3
self-regulation scores on the Motivated Strategies Learning Questionnaire (MSLQ) than
pre-service teachers who did not utilize the GTD software.
Research question
The research question guiding this current study was: Do pre-service teachers in
an introductory Educational Technology course using Getting Things Done™ software
demonstrate an increase in motivation and self-regulation?
Statement of the Problem
Randi (2004) believes that self-regulated learning strategies are essential skills for
teachers to develop. Randi suggests one way to develop self-regulation skills is to
provide related learning experiences. To explore how the motivation and self-regulation
of pre-service teachers is affected by Getting Things Done™ software, a related learning
experience was presented to students in the experimental groups. According to Self-
Determination Theory (Ryan & Deci, 2002), people have the natural tendency to pursue
challenges and ascertain new perspectives due to an innate desire to expand their
interests. The authors go on to say that broadening personal capacities as well as
conveying talents and inclinations is part of actualizing their human potential. Self-
Determination Theory was utilized as a foundation for this research and will be briefly
discussed.
Theoretical Approach: Self-Determination Theory
Self-Determination Theory (SDT) is “an organismic-dialectical theory that views
human beings as proactive organisms whose natural or intrinsic functioning can be either
facilitated or impeded by the social context” (Deci et al., 1994, p. 120). The organismic
framework in this theory demonstrates that humans seek growth, challenges and self-

4
actualization to become successful. The dialectic interface in this theory holds that
actualization is at one end of the spectrum and the social environment is at the other; one
end or the other of the spectrum can facilitate or block an individual’s tendencies (Ryan
& Deci, 2002).
The focus of the theory is on individual growth tendencies and inherent
psychological needs which influence self-motivation and personality integration (Ryan &
Deci, 2000a). According to this theory, people have innate predispositions to integrate
human nature and social contexts that can either positively or negatively influence the
individual’s behaviors. To promote healthy intellectual or emotional functioning in
humans, three specific needs should be met: competence, relatedness, and autonomy
(Ryan & Deci 2002).
SDT has evolved through over thirty years of exploration and research. Today’s
theory is comprised of four mini theories: Cognitive Evaluation Theory, Organismic
Integration Theory, Causality Orientations Theory, and Basic Needs Theory (Ryan &
Deci, 2002). Cognitive Evaluation Theory describes how social contexts influence
intrinsic motivation. Organismic Integration Theory explains extrinsically motivated
behaviors. Causality Orientation Theory details differences in orientations towards the
social world. Basic Needs Theory illustrates the relationship between motivation and
goals towards health and wellbeing.
Black and Deci (2000) offer the opinion that SDT sees motivated behaviors as
spanning the spectrum of internal locus of control or external locus of control. Those in
the internal locus of control are considered to be intrinsically motivated. Those in the
external locus of control are seen as extrinsically motivated. Intrinsic and extrinsic
5
motivation are additional key components of SDT. Vansteenkiste, Lens, and Deci (2006)
differentiate intrinsic motivation or “engagement in an activity for its own sake” (p. 20)
from extrinsic motivation or “engaging in an activity to obtain an outcome that is
separable from the activity itself” (p.20). Black and Deci (2000) believe that intrinsically
motivated behaviors are carried out due to interest and are autonomous. Furthermore,
“autonomy-supportive contexts tend to maintain or enhance intrinsic motivation and
promote identification with external regulations, while controlling contexts tend to
undermine intrinsic motivation” (Black & Deci, 2000, p. 742). Ryan and Deci (2006)
note that SDT “views the issue of autonomy as a key to understanding the quality of
behavioral regulation” (p. 1562). They also see autonomy as a quality of self-regulation.
On the other side of the spectrum is extrinsic motivation. Ryan and Deci (2000b)
see extrinsic motivation as non-autonomous and contrasting with intrinsic motivation.
According to the authors, extrinsic motivation and extrinsically motivated behaviors
occur due to outside consequences and control. Vansteenkiste et al. (2004) offer the
opinion that within SDT, “learning is an active process that functions optimally when
students’ motivation is autonomous (vs. controlled) for engaging in learning activities
and assimilating new information” (p. 247).
Ryan and Deci (2006) explain that they “attempt to apply self-determination
theory and the empirical evidence it yields in fostering healthy self-regulation and
positive mental health” (p. 158). Furthermore, Vansteenkiste, Lens, and Deci (2006)
believe that SDT explains differences in learning strategies, performance and persistence
in students.

6
Significance of the Study
The results from this research will advance the understanding of the relationship
between motivation and self-regulation when incorporating Getting Things Done™
software with pre-service teachers in their Educational Technology course. This research
will also set the stage for future research with these constructs for this or other
populations. Finally, the research will add to scholarly information on the topic of
motivation and self-regulation in pre-service teachers.
Assumptions of the Study
1. Subjects participating in the study are a representative sample of pre-service
teachers attending the university under study.
2. Subjects will respond honestly to the questions on the MSLQ and the open-ended
questions in the pre- and post-testing processes.
3. Subjects participating in the interviews will respond honestly and truthfully to the
questions posed to them during the process.
4. Subjects in the experimental groups will utilize the Getting Things Done™
software during the course of the semester.
Limitations of the Study
1. The sample is limited to pre-service teachers enrolled in introductory Educational
Technology courses taught by multiple instructors.
2. The sample size may limit the generalizability of the results of the study.
3. The population of pre-service teachers may limit the generalizability of the results
of the study.

7
4. The duration of the study is relatively short in nature (16 weeks) and may have an
effect on the generalizability of the study.
5. The qualitative data in this study could have interpretations other than those found
by the researcher.
Definition of Terms
Pre-service teacher: Students enrolled in teacher education programs at degree granting
institutions of higher education.
Educational Technology: “The study and ethical practice of facilitating learning and
improving performance by creating, using and managing appropriate technological
processes and resources” (Richey, 2008, p. 24).
Educational Technology 3123 (EDTC 3123): An undergraduate level course for pre-
service teachers in the field of education at a Midwestern university. The course covers
planning and developing instruction using educational media and technology. The course
also covers materials development, contemporary applications of computers and other
electronic systems for instruction as well as integration of instructional design,
instructional media, and instructional computing. (OSU Course Catalogue, 2012-2013).
Self-regulation: “Self-generated thoughts, feelings, and actions that are planned and
cyclically adapted to the attainment of personal goals” (Zimmerman, 2000, p. 14).
Self-regulated learning: “Self-directive processes and self-beliefs that enable learners to
transform their mental abilities…into an academic performance skill” (Zimmerman,
2008, p. 166).
Motivation: Sense of energy or activation regarding an end result (Ryan & Deci, 2000b).
8
Intrinsic Motivation: Accomplishing something due to innate interest (Ryan & Deci,
2000b).
Extrinsic Motivation: Accomplishing something due to an external influence (Ryan &
Deci, 2000b).
Web 2.0:
“A trend in the use of World Wide Web technology and web design that aims to
facilitate creativity, information sharing, and, most notably, collaboration among
users. These concepts have led to the development and evolution of web-based
communities and hosted services, such as social-networking sites, wikis, and blogs.”
(http://en.wikipedia.org/wiki/Web_2, 2008).
Getting Things Done™: David Allen’s (2001) productivity and organizational method.
The method is based on two objectives. First, capture everything that needs to be
accomplished in a logical and trusted organization system outside of one’s thoughts.
Two, use discipline to make front-end decisions about items in one’s life and making
plans for items that will be occurring in the future.
Getting Things Done™ software: Organizational and productivity software designed to
assist individuals in completing tasks and events within predefined time frames as well as
planning for long range goals.
Conclusion
Pre-service teachers have only a short period of time to learn as many
competencies and skills as possible for their transition to in-service teaching. Assisting
these pre-service teachers with the development of additional tools for the classroom is
one goal of the Educational Technology course. Getting Things Done™ software has the

9
potential to provide pre-service teachers with a positive influence on their personal
growth in relation to their accomplishments in this course. This dissertation attempts to
integrate an examination of motivation and self-regulation for pre-service teachers with
the use of Getting Things Done™ software.
Chapter 1 outlines the purpose, statement of the problem, research question,
theoretical approach, assumptions and limitations of the study, and definition of terms. In
the chapters that follow, the research will be organized in the following manner. Chapter
2 contains a review of literature relevant to the research topic including a) Pre-service
Teachers, b) Self-Regulation, c) Motivation, d) Self-Regulation and Motivation, e) Pre-
service Teachers, Self-Regulation and Motivation, f) Web 2.0, and g) Getting Things
Done™. Chapter 3 discusses the research methodology, including general procedures,
subject information, a review of the quantitative and qualitative materials utilized in the
study, study procedures, and data analysis. Chapter 4 summarizes and discusses the
results from the study, including quantitative and qualitative data. Chapter 5 concludes
the research by connecting the results to existing literature, addressing limitations and
implications, and offering suggestions for future research.

10
CHAPTER II
REVIEW OF LITERATURE
Introduction
The purpose of this study was to investigate the effect of Getting Things Done™
(GTD) software on the motivation and self-regulation of pre-service teachers in an
introductory Educational Technology course. The following research question was
addressed: Did pre-service teachers in an introductory Educational Technology course
using Getting Things Done™ software demonstrate an increase in motivation and self-
regulation? This chapter will review literature related to the research by looking at the
following areas: a) Pre-service Teachers, b) Self-Regulation, c) Motivation, d) Self-
Regulation and Motivation, e) Pre-service Teachers, Self-Regulation and Motivation, f)
Web 2.0, and g) Getting Things Done™.
Pre-service Teachers
Pre-service teachers are students enrolled in teacher education programs at degree
granting institutions of higher education. These students traditionally seek college
degrees in one of three areas. The first is Early Childhood Education, or education of
children younger than 5. The second is Elementary Education, or education of children
in grades 1-8. The third is Secondary Education, or education of children in grades 6-12.
According to Ottensen (2007), “teacher education is usually made up of three parts:

11
academic coursework providing subject-matter knowledge, professional coursework
focusing on pedagogical issues, and field experience during internship periods” (p. 613).
One form of professional coursework essential in preparing today’s pre-service
teachers for their classrooms is instruction on effectively implementing technology into
the educational process. While Strudler and Wetzel (1999) note that pre-service teachers
will be less inclined to use technology when they teach if their education faculty do not
use it in the college classroom, there is encouraging news regarding the technological
preparation of pre-service teachers. The National Center for Education Statistics (NCES)
(2007) published findings related to Educational Technology in teacher education
programs. The report found that 57% of all Title IV degree-granting instructions offer
teacher education programs. Of those offering teacher education programs, 100% report
some sort of technology integration into the teacher education process. That percentage
can be translated to integrating technology into methods courses, field experiences, and
stand alone Educational Technology courses. Teacher education planners find that
learning about technology is a fundamental component to the pre-service teacher
experience (Schrum, 1999).
Morrison and Lowther (2005) describe ways pre-service teachers can learn to
utilize computer technology in their lesson planning. Ideas include rewriting story
endings with word processing programs, calculating food costs with spreadsheets, and
creating student newspapers with publishing programs. Bitter and Pierson (2005) note
the increased use of other technology tools. They believe that email opens the lines of
communication among teachers with internet searches used for research and knowledge
acquisition. Benson et al. (2004) deem that pre-service teachers should be able to instruct

12
their students in basic technology functions such as using the internet, multimedia
products, and CD-ROMS. For pre-service teachers to employ these technologies in their
classroom, they themselves must be proficient in the use and application of a variety of
technological functions and tools.
Pre-service teachers learn additional technological integration skills from personal
projects and experiences in their technology coursework. Most pre-service teachers
create a portfolio of course work and assignments during the course of their teacher
training. The portfolios are used for admission and to showcase accomplishments for the
college and future employers. While pre-service teacher portfolios have existed for many
years, only in the recent past have colleges of education embraced the notion of placing
these artifacts into electronic documents. Barrett (2007) offers this general definition for
portfolios, “An educational portfolio contains work that a learner has collected, reflected
upon, selected, and presented to show growth and change over time, work that represents
an individual’s or an organization’s human capital” (p.436). Barrett goes on to note that
“an electronic portfolio uses technologies as the container, allowing students or teachers
to collect and organize portfolio artifacts in many media types (audio, video, graphics,
and text). Hypertext links organize the material, connecting evidence to appropriate
outcomes, goals, or standards” (p. 438). Overall, the e-portfolio is a versatile tool for pre-
service teacher education.
Online courses are another experience for pre-service teachers. According to
Dempsey and Van Eck (2002), “Online learning is any learning that uses the internet to
deliver some form of instruction to a learner or learners separated by time, distance or
both” (p. 283). The authors also note that online learning may be asynchronous,

13
synchronous, or a combination of the two forms of communication. Allen and Seaman
(2007) found that 86% of students in online courses are undergraduates and the majority
of universities offering online courses expect the number of students enrolled in those
courses to continue to increase. With this in mind, online learning has the potential to
play a significant role in teacher education preparation. Sorin (2004) conducted what she
called the Webfolio project which was designed to address issues of integration,
relevance and collaboration for pre-service teachers. According to the author, “it was an
online learning environment, where education students, and education related
professionals… interacted with each other and accessed virtual resources to explore
topics of significance to the developing and practicing educational professional” (p. 103).
After the course, 86% of participants reported that the experience was beneficial to them.
Pre-service teachers should be taught not only ways to integrate technology into their
classroom, but also taught in ways that will expose them to prevailing forms of
technology integration.
Delfino and Persico (2007) believe that “future teachers should be trained with
methods and tools that are similar to those they are supposed to use with their own
students” (p. 351). Furthermore, the experiences of pre-service teacher education will
shape pre-service teachers’ actions once they arrive in their own classrooms (Kennedy,
1999). Importantly, Benson et al. (2004) found that students showed a statistically
significant increase in their technological knowledge and skills after completing a
technology education course and a technology integration student teaching experience.
Strudler and Wetzel (1999) found that pre-service teachers view Educational Technology
as a vital component of their professional training. In today's world, it is becoming more

14
difficult to imagine sending pre-service teachers to their own classroom without
technological skills and abilities.
Self-Regulation
Self-regulation can be defined as “self-generated thoughts, feelings and actions
that are planned and cyclically adapted to the attainment of personal goals” (Zimmerman,
2000, p. 14). Pintrich describes self-regulated learning as “an active, constructive process
whereby learners set goals for their learning and then attempt to monitor, regulate, and
control their cognition, motivation, and behavior, guided and constrained by their goals
and the contextual features in the environment (2000, p.453).” Hofer, Yu, and Pintrich
(1998) believe that self-regulated learning is a central part of academic performance and
achievement in students. Boekaerts and Cascallar (2006) contend that students who are
able to self-regulate feel control over their own learning. Zimmerman (2002) also says
self-regulation is essential in the education process since a primary goal of education is to
develop lifelong learning skills that will allow students to function in their chosen
workplace.
Looking at self-regulation from an education standpoint, Zimmerman, Bonner,
and Kovach advocate the notion that students use self-regulation to “attain specific
educational goals, such as analyzing a reading assignment, preparing to take a test, or
writing a paper” (2008, p.2). They also found that high achieving students set specific
learning goals, self-monitor, and then adapt their efforts. McCann and Turner (2004)
suggest that successful student self-regulation comes from the ability to cope with
different emotional states during the learning process. Zimmerman (1998a) characterizes
self-regulated learners as those who view their academics as a proactive learning

15
experience that they initiate for themselves rather than as a learning experience provided
or completed for them. Schunk and Zimmerman (1998) state that strategy teaching or
teaching students systematic methods for working on academics is an important
component in self-regulated learning. Strategy teaching increases motivation and
independent work on academic materials. Winne (1995) offers the opinion that self-
regulated learning develops in increments as students engage in educational experiences.
Those experiences provide students with the ability to build awareness about future self-
regulation.
Wolters, Pintrich, and Karabenick (2003) present four common assumptions seen
in the majority of self-regulated learning models. These assumptions include the belief
that 1) students are active participants in their learning, 2) students can monitor and
control certain portions of their learning environment, 3) students can compare their
personal progress against standards, and 4) self-regulated students mediate between
individual characteristics and actual performance. The researchers go on to describe four
phases of self-regulated learning that can be utilized in the classroom. Phase 1 includes
planning, setting goals, and initiating awareness of the task in comparison to personal
knowledge. Phase 2 relates to metacognitive awareness monitoring related to the task or
the self. Phase 3 comprises of personal effort to control and regulate the task or the self.
Phase 4 concerns reflections and responses to the task or the self. These assumptions and
phases form the basis of the Motivated Strategies for Learning Questionnaire (MSLQ)
utilized in the research for this dissertation.
Zimmerman (2002) states that while research reveals that self-regulation leads to
success in academics, many students do not know how to self-regulate their academic

16
studying. How do you help students develop self-regulation? Zimmerman (1986) notes
there are no specific learning environments which ensure students will develop the ability
to self-regulate. According to Zimmerman, this means that teachers should use an
assortment of methods for assisting students in the achievement of their goals. He
suggests the following self-regulation strategies be incorporated into the learning
environment: helping students 1) become active participants in their personal learning, 2)
teaching students self-evaluation processes, 3) helping students see themselves as
competent learners, and 4) constructing an optimal learning environment. Zimmerman
(2002) also believes that teachers should assist their students in recognizing their own
strengths and limitations in learning. McCann and Turner (2004) propose that teachers
provide feedback on errors in the learning experiences rather than focusing on
insufficiencies. Zimmerman, Bonner, and Kovach (2008) feel that specific instruction in
goal setting, self-monitoring, and methodical practice can help students develop self-
regulation. Wolters, Pintrich, and Karabenick (2003) offer three cognitive strategies to
help develop self-regulation: 1) rehearsal, 2) elaboration, and 3) organization. Rehearsal
strategies include memorization of materials through reciting phrases over and over.
Elaboration strategies include summarizing the materials or putting the materials into
one’s own words. Organization strategies include writing notes, drawing diagrams or
creating concept maps.
McCann and Turner (2004) contend that students must deal with situations both in
and out of the classroom and learning volitional control can assist students in mastering
academic challenges. Boekaerts and Cascallar (2006) state that student interactions with
teachers and peers affect self-regulation, which leads the authors to explain that

17
contextual classroom clues can either prompt or impede the use of self-regulation. The
researchers go on to describe classrooms which use situated learning or anchored
instruction to assist students in knowledge building and collaboration to help support the
development of self-regulation. A study by Zimmerman and Martinez-Pons (1990)
compared 14 different self-regulated learning strategies in middle and high school
students. The results indicate that girls used self-regulation strategies more often than
boys, gifted students possessed more self-regulation than traditional students, and self-
regulation increased from 5th to 8th grade but decreased by 11th grade. The authors offer
the following suggestions for teachers: find ways to reduce social comparisons, focus on
task mastery, and assist students in the use of learning strategies. Wolters (2003b) also
looked at self-regulation, interestingly, as a way to understand procrastination in college
students. The author notes that those students who procrastinate are starkly contrasted
with those who self-regulate. The study found that procrastination was related to
student’s beliefs about their ability to complete required coursework. These results point
toward the belief that those with high self-regulation do not procrastinate as much as
those with low levels of self-regulation. Overall self-regulation in education is a
complicated topic, but students and teachers can work together to improve learning both
in and out of the classroom.
Online learning is rapidly becoming a mainstay of education at all levels. College
students have the ability to take courses in the traditional classroom setting, via online
platforms or through a blended approach. Various authors have looked at the impact of
online learning on self-regulation in higher education. Schunk and Ertmer (1999)
assessed the influence of process and product goals on the achievement of college

18
students undergoing computer skills training. The first experiment found significant
correlation results on the two self-regulation measures. The authors note that providing
students with process goals was successful in improving achievement outcomes. Azevedo
and Cromley (2004) researched the effect of self-regulation training on college students’
ability to regulate learning about the circulatory system in a hypermedia environment.
Results indicate that training in self-regulation is effective in improving students’
comprehension of a complex topic. Chen (2002) found that effort regulation, a
component of self-regulated learning, was the most effective in lecture environment
achievement in an information systems course. Lynch and Dembo (2004) utilized the
MSLQ to look at learner self-regulation in hybrid learning environments. Interestingly,
the only items significantly correlated to final grade and self-regulation were self-efficacy
and verbal ability. Time and study environments, help seeking, internet self-efficacy, and
intrinsic goal orientation were not significantly correlated. The authors attribute this to
the blended environment of the class and the fact that the college was a top-tier university
with a highly competitive admission process. These two factors mean that students may
be highly self-regulated to gain admission and that the face-to-face time with the
instructor may lessen the need for self-regulation in the online component of the course.
Overall the results of these studies indicate that self-regulation plays a notable role in
online learning in many different capacities.
Educators at the elementary and secondary level who want to develop self-
regulation ability in their own students need to shift the responsibility of learning from
themselves to their students (Zimmerman, Bonner, & Kovach, 2008). That means that
we must educate pre-service teachers about methods to increase not only their own self-

19
regulation but also that of their future students. The question could be raised of why do
we need to develop self-regulation in pre-service teachers? Dettori, Giannetti, and
Persico (2006) offer the thought that teachers need self-regulation skills to be able to
adapt to different classroom situations, to keep up with technological and cultural
changes, and to maintain effective classroom management. Paris and Winograd (2003)
suggest that self-regulated teachers should comprehend their personal thinking so that
they can cultivate the thinking of their students. Randi and Corno (2000) focus on the
fact that self-regulation is needed for preparation and success in school due to the
demands, restraints, and affordances that schools offers students. Sungur and Tekkaya
(2006) note that there is little value in self-regulatory skills if students are not motivated
to use them. The authors utilized the MSLQ to investigate how problem-based learning
and traditional instruction affect self-regulated learning in high school students. The
results of the study indicated that self-regulation is enhanced through problem-based
learning.
How do we go about training pre-service teachers to be more self-regulated?
Kitsantas and Baylor (2001) conducted self-regulation training with pre-service teachers
in an introductory Educational Technology course via their Instructional Planning Self-
Reflective Tool (IPSRT). The results found that students improved their performance
and attitudes toward instructional planning based on training they received on self-
monitoring and self-evaluation. Hofer, Yu, and Pintrich (1998) advocate the use of a
two-by-two matrix to teach students self-regulation. These factors include a focus on the
constructs of knowledge and beliefs as well as information on regulation strategies and
the cognitive and motivational domains. The authors implemented this model in a
20
Learning to Learn course whereby students were taught how to process information, take
notes, prepare for tests, set goals, and manage their time.
Randi and Corno (2000) put forth several different instructional methods for
increasing self-regulation in students. These include encouraging flexible assignments,
implementing collaborative learning, scaffolding instruction, utilizing self- and peer-
evaluations, and embedding assessment into the curriculum itself. These are only a few
of a variety of methods and techniques utilized. The main concern is to train pre-service
teachers to become aware of self-regulatory teaching methods that can be utilized in their
future classrooms.
Paris and Winograd (2003) note that students who see teachers model self-
regulatory behavior such as planning, making priority decisions, and dealing
constructively with bad situations will model that behavior. Zimmerman (2002) contends
that the goal of teachers should be to empower their students to become self-aware of
their need to self-regulate as opposed to accommodating every student’s limitations.
However, McCann and Turner (2004) point out that regardless of the effort teachers
expend on developing self-regulatory learners, state guidelines and curriculum standards
must still be followed and certain topics or subjects are more difficult to teach in self-
regulatory ways than are others. A key component to remember is that while teachers
chose the assignments and homework, students make the choice to study and do the work
(Zimmerman, 1998b). Therefore, students and teachers must work collaboratively to
reach requirements in a way that fosters not only self-regulation, but also knowledge and
understanding.
21
Motivation
Motivation is the activation and persistence of behavior and is partially embedded
in cognitive actions; it functions through goal setting and self-evaluative reactions
(Bandura, 1977). Moreover, Bandura (1977, p. 193) contends that “self-motivation
involves standards against which to evaluate performance. By making self-rewarding
reactions conditional on attaining a certain level of behavior, individuals create self-
inducements to persist in their efforts until their performances match self-prescribed
standards.” In a later study, Bandura (1989) infers that a large source of personal
motivation comes from cognitive activities whereby forethought is utilized to
anticipatorily guide one’s actions and plan future courses of action. Furthermore, people
set goals for themselves and plan courses of action based on their anticipation of likely
outcomes. Ryan (1998) believes that the discipline of motivation is a cornerstone to the
science of human behavior due to its focus on what moves people. Anderson (2001)
believes that those who exhibit the capacity for self-regulated learning have the ability to
direct and monitor their metacognitive and cognitive activities as well as maintain the
necessary motivation to accomplish their goals. Bandura (1991) offers the thought that
the ability to influence oneself through personal challenges and evaluate one’s
attainments is a key cognitive instrument of motivation.
According to Bandura, (1977) a fundamental component of motivation is efficacy
expectation, which he defines as the assurance people have that they can successfully
accomplish the behaviors needed to generate an outcome. Efficacy beliefs influence
people’s feelings, thoughts, motivations, and behaviors (Bandura, 1993). Individual’s
efficacy beliefs or self-efficacy influences anticipatory scenarios; people with high self-
22
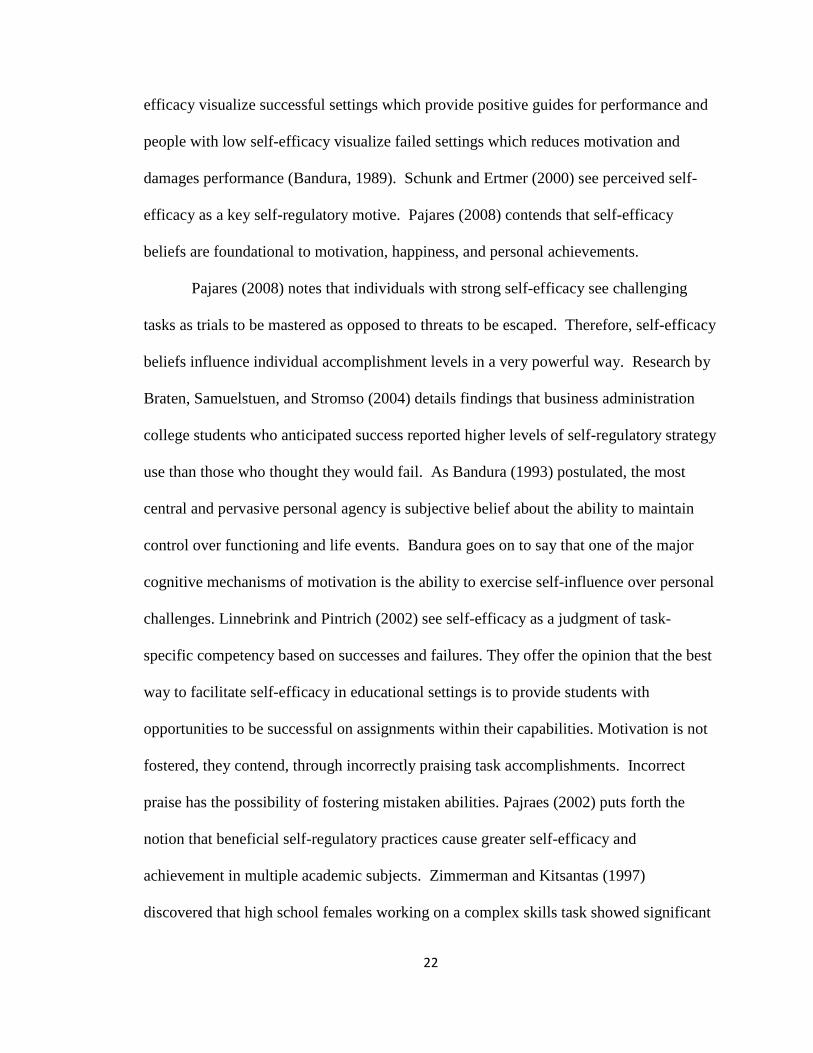
efficacy visualize successful settings which provide positive guides for performance and
people with low self-efficacy visualize failed settings which reduces motivation and
damages performance (Bandura, 1989). Schunk and Ertmer (2000) see perceived self-
efficacy as a key self-regulatory motive. Pajares (2008) contends that self-efficacy
beliefs are foundational to motivation, happiness, and personal achievements.
Pajares (2008) notes that individuals with strong self-efficacy see challenging
tasks as trials to be mastered as opposed to threats to be escaped. Therefore, self-efficacy
beliefs influence individual accomplishment levels in a very powerful way. Research by
Braten, Samuelstuen, and Stromso (2004) details findings that business administration
college students who anticipated success reported higher levels of self-regulatory strategy
use than those who thought they would fail. As Bandura (1993) postulated, the most
central and pervasive personal agency is subjective belief about the ability to maintain
control over functioning and life events. Bandura goes on to say that one of the major
cognitive mechanisms of motivation is the ability to exercise self-influence over personal
challenges. Linnebrink and Pintrich (2002) see self-efficacy as a judgment of task-
specific competency based on successes and failures. They offer the opinion that the best
way to facilitate self-efficacy in educational settings is to provide students with
opportunities to be successful on assignments within their capabilities. Motivation is not
fostered, they contend, through incorrectly praising task accomplishments. Incorrect
praise has the possibility of fostering mistaken abilities. Pajraes (2002) puts forth the
notion that beneficial self-regulatory practices cause greater self-efficacy and
achievement in multiple academic subjects. Zimmerman and Kitsantas (1997)
discovered that high school females working on a complex skills task showed significant

23
results when social goal setting and self-monitoring were utilized to enhance their self-
efficacy. The researchers also found high correlations between self-efficacy and intrinsic
interest. The authors offer the thought that providing students with social guidance
during complex skill learning prepares students to utilize self-regulation when working
on their own.
Linnebrink and Pintrich (2003) offer a two-sided approach to student motivation.
The authors generalize that a student is motivated if they have interest in, are excited
about, or think that school tasks are important. Additionally, students are motivated
when they have high self-efficacy or believe that they can accomplish school tasks.
Finally, the researchers postulate that educators can arrange instruction to positively
impact student self-efficacy and learning. Joo, Bong, and Choi (2000) researched the
effect of academic self-efficacy on learning and performance in web-based instruction.
The results revealed a significant relationship between self-efficacy for self-regulated
learning and student confidence in the classroom and on the internet. The authors note
that if educators have self-efficacy and confidence information about their students when
planning instruction, instructional time could be allocated to improve weaker skills.
Pokay and Blumenfield (1990) researched the relationship between student
motivation and learning strategy usage with high school math students. The researchers
reported that motivation research points to the prominence of self-concept of competence,
belief of successfulness, and perceived subject worth as forecasters of academic behavior
at different times in the semester. The results from their study found significant results
with regards to motivation and the use of learning strategies early and later in the
semester. Wang, Ertmer, and Newby (2004) examined how vicarious learning

24
experiences and goal setting, individually and combined, influenced the self-efficacy of
pre-service teachers within a technology integration setting. While all results were
significant, pre-service teachers who received the combination of vicarious learning
experiences and goal setting related to technology integration saw the most significant
increase in their self-efficacy. The authors point out that these conditions may assist pre-
service teachers with the confidence to use technology in their own classrooms.
Intrinsic motivation, according to Zimmerman and Schunk (2008), concerns the
interest, enjoyment, and contentment in a duty or activity completed by individuals.
Vansteenkiste, Lens, and Deci (2006) offer the opinion that intrinsic motivation is an
activity in which the behaviors are rewarding in and of themselves as opposed to
physiological drives. Deci, Koestner, and Ryan (2001) completed a meta-analysis of the
interplay between extrinsic rewards and intrinsic motivation. The results revealed that
educators should focus on facilitating intrinsic motivation in students rather than focus on
rewards for motivation. Research by Zuckerman et. al (1978) looked at intrinsic
motivation in college students working collaboratively, in pairs, on a task. The authors
discovered that those students who were given actual choice over the illusion of choice
worked on the task significantly longer. In summary, the authors state that an
individual’s motivation is higher when they are given more control over their
environment than when it’s controlled for them. Wolfe’s (2001) work on the Dragonfly
Web Pages, interlinked educational web pages for elementary students, promotes intrinsic
motivation by giving students control through choices in problem solving.
Ames (1992) assessed classroom structure as it relates to achievement goals and
student motivation. The author explains that tasks should be meaningfully focused,

25
contain a variety of designs, and assist students in goal setting. Classroom authority
needs to provide students with the ability to participate in the decision-making process,
with decisions based on effort as opposed to the evaluation of ability, and giving students
the opportunity to develop independence. When it comes to student evaluation, educators
need to consider effort recognition, emphasize individual improvement, and promote
mistakes as part of the learning process. Overall, viewing motivation as a qualitative
change in multiple classroom structures allows students to see themselves in the learning
process.
Pintrich (2003) summarized five major ways educators can motivate students
through corresponding design ideas. First, utilize self-efficacy and competence beliefs to
motivate students. This can be accomplished through competence-based feedback and
classroom tasks that challenge students yet allow them to be successful. Second, give
students control and choices. Present feedback centered around learning and student
control of the learning. Additionally, develop understanding and caring relationships
with students. Third, ensure students have high interest and intrinsic motivation towards
the topic. Provide materials in a novel and stimulating manner, use personally
meaningful and interesting materials, and exhibit teacher curiosity on the subject. Fourth,
make sure students are motivated with high value towards the topic. Materials should be
relevant and personally identifiable. Fifth, goals should contribute to student motivation
and provide a sense of direction. Promote student responsibility, foster classroom
discussion on mastery and understanding, and nurture cooperative and collaborative
classroom groups to achieve goals.
26
Self-Regulation and Motivation
Schunk (2008) suggests that self-regulation is inspired by motivation. One
important component of this is perceived self-efficacy. Schunk notes that students with
higher self-efficacy will put forth more effort, try longer when the task is difficult, and
accomplish tasks at higher completion rates. How is higher self-efficacy developed?
Schunk contends that learners develop higher self-efficacy from successful personal
performances, positive experiences of peers, and persuasive reports from teachers.
Pintrich and DeGroot (1990) conducted a correlational study to explore the link between
motivation, self-regulated learning, and academic performance in middle school English
students. The authors believe that differences in self-regulation could be linked to
differences in student motivation. The results suggested that self-efficacy was connected
to cognitive engagement and academic performance and intrinsic value was strongly
associated with cognitive strategies and self-regulation. According to the authors, these
outcomes suggest evidence to support inclusion of motivation and self-regulation
learning elements in the classroom. Pajares (2008) contends that students who utilize
effective self-regulation demonstrate greater self-efficacy and accomplishment in school
settings, therefore self-regulation should be a part of improving self-beliefs and success
in school.
Lens and Vansteenkiste (2008) advocate that the degree to which students use
self-regulated learning strategies is contingent on their motivational resources. The
authors present suggestions to increase self-regulated learning. These include, organizing
the learning environment to be free of distractions, reducing the number of activities that
are not related to academics, developing specific goals for the future related to the current

27
academic subject, and creating intrinsic learning goals as opposed to extrinsic learning
goals. Zimmerman and Schunk (2008) observed that even though self-regulated learning
research yielded positive results in the classroom, the effects were not sustained over the
long term in less-structured environments; these findings led to research on sources of
student motivation to self-regulate. According to the authors, one important component
of the self-regulation and motivation interplay is student interest in a topic. Interested
students persist while uninterested will disengage. Corno (2008) believes that motivation
should be an after effect of learning to self-regulate. However, Zimmerman (1998a)
advocates that there is not a single learning strategy that will work for all students and the
usefulness of a given strategy changes as students develop additional skills. Therefore,
learning should be conceptualized as an open-ended cyclical process which includes
processes such as goal setting, self-efficacy beliefs, self-monitoring, self-evaluation, and
adaptations.
Pintrich (2004) details a four phase self-regulated learning conceptual framework
related to motivation and leaning in college students. Phase 1 includes planning and goal
setting; Phase 2 brings in self-monitoring and metacognitive awareness; Phase 3
comprises control and regulation of self or task; and Phase 4 consists of reactions and
reflections. Pintrich points out that students obviously utilize different strategies and
have different levels of motivation for different courses. Roberts et. al (2006) researched
the competencies of successful pre-service and inservice agricultural science teachers.
The results revealed several traits of a successful teacher, including internal motivation,
time management, planning and organizational skills, and people skills.

28
Kinzie (1990) presents potential methods for effective instruction including
learner control, self-regulation and ongoing motivation. As noted by the author, learners
are more effective when suitable instructional selections, based on useful learning
strategies, are coupled with motivation to learn. Artino and Stephens (2007) investigated
academic motivation and self-regulation in undergraduate and graduate students in an
online environment. Results indicated that graduate students were more effective in
academic self-regulation. The authors provide suggestions for conducting online
instruction. Including, offering specific instructional support and organization,
developing self-efficacy in students, encouraging collaboration between students, and
scaffolding online communication.
Wolters (2003a) sets forth the notion that when it comes to educational
motivation, those learners with self-regulatory skills tend to possess an assortment of
adaptive behaviors which encourage persistence and willingness to participate in
academic assignments. Therefore, the author contends, self-regulated learners can
choose, monitor, and control the use of those behaviors. Wolters also presents a
compilation of strategies to regulate student motivation. These include personal
consequences and rewards, self-talk about goals, increasing intrinsic motivation or
interest in the situation, removing distractions, managing self-efficacy through goal
setting and positive self-talk, and regulation of emotions. Kuyper, van der Werf, and
Lubbers (2000) conducted a longitudinal study to research the educational attainment of
secondary education students, postulating that a highly motivated student will achieve
more in the long run. Achievement motivation and fear of failure predicted achievement
while self-regulation was not associated with mean achievement.

29
Pre-service Teachers, Self-Regulation, and Motivation
Randi (2004) described ways in which teachers can develop self-regulation in
their students. Ideas include encouraging students to use self-regulated learning
strategies such as goal attainment or task mastery. Randi also presented information on
outcomes of self-regulation by pre-service teachers. These results include higher levels
of autonomy, reflection on the teaching process, and internalization of knowledge. The
author states that if self-regulation helps students to assume responsibility of their
learning, then it should be beneficial to teachers as well. Song, Hannafin, and Hill (2007)
view the co-dependence of teaching and learning as important to examine to aid teacher
understanding of student needs. According to the authors, one area for teachers to attend
to is motivational sensitivity. Teachers who identify student motivational needs assist
learners with conceptual changes.
Kremer-Hayon and Tillema (1999) found that pre-service teacher education could
play a decisive role in developing the competencies of self-regulated learning by providing
more opportunities to allow students to take charge of their own learning, being open to
questioning, and constructing new knowledge through testing personal ideas. The authors
offer the opinion that teacher education programs may need to include specific information
on developing self-regulated learning among pre-service teachers within the instructional
curriculum. Tillema and Kremer-Hayon (2002) expanded their earlier work and found that
self-regulated learning for teacher educators and pre-service teachers comes from using a
reflective approach in teaching, based on gathering information and studying student
reactions. One important point is that teacher educators influence their students with

30
regards to self-regulated learning and, as such, need to ensure proper modeling of self-
regulation to their students.
Bembenutty (2006) found that pre-service teachers who seek help for homework
tasks from their instructors, have higher homework self-efficacy. Yet students who seek
help from peers have lower homework self-efficacy. Chen (2002) discovered similar
results regarding working with peers in a recent study on self-regulated learning for
college students in an information systems course. Chen reported that those students who
studied with peers scored lower on course exams while those who had high effort
regulation scored significantly higher. Bembenutty (2007) also found that pre-service
teachers who highly value the tasks have higher use of metacognitive strategies, learning
self-efficacy, and personal self-efficacy. The author also discovered those pre-service
teachers who have high levels of control over their personal time and study environments
reported higher levels of learning self-efficacy and teacher self-efficacy.
Perry, Philips, and Dowler (2004) investigated the effects of pairing pre-service
teachers with mentor teachers on developing self-regulating lessons for elementary
students. Results indicate that pre-service teachers were effective in designing lessons
that encouraged self-regulation in the students with whom they were working. Perry,
Phillips, and Hutchinson (2006) also presented additional longitudinal data on pre-service
teachers developing self-regulation in their own students. These results show that pre-
service teachers are capable of promoting self-regulation in their own elementary school
students. Kitsantas and Talleyrand (2005) note that pre-service teachers who use self-
regulation strategies learn to adapt their performance in light of external and internal
classroom situations.

31
Baylor, Kitsantas, and Hu (2003) postulate that pre-service teachers need self-
regulation to write lesson plans. One reason behind this is the fact that pre-service
teachers traditionally lack experience, skill, and confidence in their ability. Pre-service
teachers who utilized the authors’ Instructional Planning Self-Reflective Tool (IPSRT)
saw an increase in their self-efficacy and intrinsic motivation for writing lesson plans.
Pierce and Kalkman (2003) reflect that pre-service teachers bring years of observational
experience into their education classes and instructing them to utilize learner-centered
techniques can be challenging. The researchers offer suggestions to assist with the self-
regulation of learning. These include intentionally building meaning from information,
connecting novel information with existing information, and encouraging students to use
directed reflection. The authors argue that motivation is a key issue to using self-
regulation during these processes. Training pre-service teachers to utilize these tools
themselves increases the probability that they will guide their own students through these
processes once they enter the classroom.
Web 2.0
Web 2.0 is the idea of seeing the web as a platform where users actively
participate and control data, data that can be thought of as collective intelligence. The
term was first coined by Dale Dougherty and Tim O’Reilly in 2004 (O’Reilly, 2005).
Defining specifically what Web 2.0 is has been an ongoing process since the term was
first introduced. According to Oliver (2007), Web 2.0 is “an umbrella term for many
individual tools that have been created with web collaboration, sharing and/or new
information creation in mind” (p. 55). Wikipedia (2008) defines Web 2.0 as

32
“A trend in the use of World Wide Web technology and web design that aims to
facilitate creativity, information sharing, and, most notably, collaboration among
users. These concepts have led to the development and evolution of web-based
communities and hosted services, such as social-networking sites, wikis, and
blogs.” http://en.wikipedia.org/wiki/Web_2.0.
Madden and Fox (2006) note that Web 2.0 allows users to contribute content, but not
control that content. Whatever way one defines Web 2.0, the components of it have
become integral to the way the internet is used today.
However, many of those faculty responsible for educating students have not kept
up with the proliferation of Web 2.0 technologies. According to Thompson (2007)
students will soon arrive at institutions of higher education expecting the integration of
Web 2.0 technologies into the education process and be met with archaic technology.
Hardman and Carpenter (2007) believe that the way many schools teach today is
inconsistent with the world outside the classroom. Those faculty that have introduced
these technologies into the classroom often use them more for delivery of content than
changing the way teaching and learning occur (Maloney, 2007). Alexander (2006)
believes that the ease of entry into Web 2.0 technologies will lower the barriers to
implementation. Alexander sees that implementation as a powerful tool for education and
educators.
One area in which technology is infiltrating the university is in teacher education
programs. Currently, most colleges of education offer some sort of Educational
Technology course to pre-service teachers in hopes not only of teaching them how to use
current technology for themselves, but also how to implement technology in their own

33
classrooms once they graduate. However, Sprague (2004) notes that those within the field
of Educational Technology keep to themselves more than they should. Sprague goes on to
note that Educational Technology faculty need to interact with other teacher educators so
they can learn the best ways to integrate technology into traditional classes. This sharing of
ideas and techniques helps technology become an integral part of the teacher education
program rather than a stand-alone entity.
While the issue and process of transforming education into a Web 2.0
environment will continue to exist for some time, some educators are currently
implementing these technologies into their classrooms. Web 2.0 functions include tools
like blogs (web-logs), wikis, and advanced Google functions, and they have become the
focus of research regarding pre-service teachers and education. While these tools are for
the most part cost-free, Oliver (2007) remarks that educators need to address the potential
problems that may occur due to their use. These problems, Oliver notes, include privacy
issues, ethical concerns, and program/software disappearance. Privacy and ethical issues
come from sharing personal information in public spaces. The disappearance of programs
and software occur as developers create something new or move their site to a new
location without a “forwarding” address. Taking these issues into consideration prior to
their use in class affords teachers and students the knowledge necessary to navigate
through the maze of Web 2.0 tools. Albion (2007) notes that this is important because
“Teacher education faces the dual challenges of applying Web 2.0 tools to enhance
teacher preparation and preparing teachers for whom the application of Web 2.0 tools in
the classroom will be authentic practice” (p. 2).

34
Blogs (web-logs) are one tool pre-service teachers can easily utilize. Oliver
(2007) found that the majority (79%) of students in a graduate level Educational
Technology course found blogs useful. The instructor also had the students use web
bookmarking and most thought it would be very useful in engaging students on the
internet. Wassell and Crouch (2008) used blogs in a multicultural education course for
pre-service teachers. The goal of the research was for the students to investigate not only
the textbook, but also web-related information and to share what they learned. The
authors discovered that students were able to “present their own ideas and opinions and
respond to others outside the temporal and spatial boundaries of the classroom”
(p. 223). Kuzu (2007) investigated the use of blogs in an introductory Educational
Technology course for pre-service teachers. The goal of the research was to gather the
viewpoints of pre-service teachers towards blogging. The majority (80%) of the class
responded favorably to the blogging experience. According to the researcher, blogs
allowed for additional communication with the instructor and classmates. Issues addressed
by the author included the need for instructional planning prior to the use of blogs in the
classroom, the need to use relevant and up to date information, and the need to moderate
what the students were blogging about.
While most of the research indicated that students found blogging useful, there is
another side to the story. Hernández-Ramos (2004) used blogs and online discussion as
methods for pre-service teachers to reflect on their personal beliefs about teaching,
learning, and technology. This researcher found that students did not write long detailed
opinions about class issues in their blogs. Additionally, only five of the fifty-six students
reported interest in using blogs as a teaching tool for their own classroom.

35
Also included in Web 2.0 are wikis. Foley and Chang (2006) define wikis as, “a
type of web site (or a feature of a site) in which users are allowed to add and edit the
content on the site” (p. 1). Their research on wikis focused on how wikis can be used as
a support for pre-service teachers as they learn about teaching. The results were mixed
regarding wiki use. While some saw the wikis as a collaborative tool, others expressed
concern over the technical aspect of the process. Overall, the students noted that they
prefer discussion boards to wikis.
Overall, Web 2.0 promises to alter the way in which education occurs. No longer
are students at any level bound by the four walls of the classroom. Additionally, the web
promises collaboration and interaction with others around the world as well as access to
information faster than ever experienced. As Rollett et al. (2007) note, Web 2.0 will allow
education to become a community of ideas. That community will continue to grow and
expand, hopefully embracing more and more educators.
Getting Things Done
The term Getting Things Done originated with Percy Creed, who wrote three
versions of a book entitled Getting Things Done in the 1930’s and 1940’s. These books
were written after Creed spent extensive time evaluating the notion of business
organization in the United States (www.wikipedia.com, 2008). Davidson (2005) notes
another book, also entitled Getting Things Done, was published in 1976, prior to the
advent of current technological advances for organizing and streamlining lives. Since
those books were written, technology has advanced and the pace of life has picked up
speed. Today more and more people are struggling to stay current with commitments and
responsibilities. According to Davidson (2005), today’s goal for the Getting Things

36
Done™ books, software, and motivational seminars is not to accomplish more in a day,
but to complete current tasks with greater peace of mind.
Three authors have written books on the subject of Getting Things Done. Allen
(2001) desires for people to be relaxed yet efficient. Bossidy and Charan (2002) want
people to get to the heart of issues. Davidson (2005) would like for people to be
organized, be better time managers, have increased efficiency, and be more effective.
Bossidy and Charan (2002) note that when space exists between goals and
outcomes, there is a gap between ambition and reality. According to Bossidy and Charan,
to deal with that gap, people must be realistic, set clear goals and priorities, and follow
through. Davidson (2005) thinks that people are distracted, overloaded, have too many
choices, and have too many interruptions. Davidson believes the answer lies in
organization, efficiency, effectiveness, and managing energy. Allen (2001) offers this,
“Ineffective personal organization systems create huge subconscious resistance to
undertaking even bigger projects and goals that will likely not be managed well, and that
will in turn cause even more distraction and stress” (p. 8).
Although there are many books on the topics of organization, productivity, and
efficiency, one book has caught the eye of technology experts. This is Allen’s (2001)
book, Getting Things Done™. Google returns almost three-quarters of million hits on the
topic. Mann (2004), author of the 43Folders website, notes that Allen’s notion succeeds
because it addresses the fact that “stuff” is the major barrier in accomplishing daily tasks.
Michel (2005) thinks that the system helps to capture tasks, projects and follow-up items
dealt on a daily basis. Fallows (2004) likes Allen’s notion of closing the open-loops left
by unfinished tasks.

37
According to Robinson (2003) “At some point, you have to actually do something,
and getting just about anything done requires the proper tools” (p.4). Allen’s (2001)
Getting Things Done™ method offers a set of tools for organization. The system is based
on what the author calls natural planning. Natural planning involves five phases. The first
phase is to determine the purpose of why one is doing what one is doing. The second phase
is to understand how your principles give parameters and criteria to your behavior. The
third phase is to develop a vision of what a successful outcome to a project would entail.
The fourth phase is to brainstorm ways in which projects go from ideas in your mind to
finished events. The final phase is to determine the allocation and reallocation of resources
to get the project moving.
Allen (2001) describes how to master workflow in five steps: collect, process,
organize, review, and do (see Figure 2.1). The first step is to collect, in one place, all
“stuff” to which you need to attend. The second step is to process the information
contained in the in-baskets. The third step is to organize the information from the process
step. The fourth step is to review the outstanding items in your baskets and decide what
needs immediate attention and what can be deferred for later. The final step is what
Allen (2001) calls the “Do” step. This is where items that take longer than two minutes
to complete are acted upon.

38
Figure 2.1 David Allen’s Workflow Diagram
Reprinted with permission. www.davidco.com
Allen offers models to consider for the “Do” step. One is the “Four-Criteria
Model” whereby individuals determine the context in which the action needs to take
place, the time available to complete the task, the energy available to complete the task,
and where on the priority list the action items falls. A second model is the “Threefold
Model” to evaluate daily items. This means individuals determine to do work as it is
predefined, as it shows up, or redefines the work to be accomplished. He recommends
the first defining your work process.

39
There is a lack of scholarly articles on the Getting Things Done™ topic and
software, yet many websites are dedicated to the topic and Allen’s software. Bloggers
(i.e. www.gtd.marvelz.com, www.thatcanadiangirl.co.uk, www.smallfuel.com/blog,
ideamatt.blogspot.com, blog.ianbicking.org, scottadams.blogs.com,
www.foldedspace.org/weblog, and www.officezealot.com) report on their inclusion of
Allen’s software into their personal and professional lives. Additionally, technology
websites post information about the use of the Getting Things Done™ method (i.e.
lifehacker.com, www.43folders.com, www.minezone.org, lifelearningtoday.com, and
www.centernetworks.com). Furthermore, the David Allen Company
(www.davidco.com) provides interested users with information, instruction, and support
related to the use of the Getting Things Done™ method.
No study could be found that sought to determine the relationship between pre-
service teachers, Educational Technology, and the Getting Things Done™ software.
Levin and Wadmany (2008) note that a gap exists in integrating technology into the
classroom and teachers’ desires to use technology. That gap, Levin and Wadmany note,
evolves from the incompatibility between educational goals and the interaction between
students, teachers, curriculum goals, and materials. Results from a longitudinal attitude
study on the issue found that teacher educators who viewed technology as a partner in
teaching demonstrated positive views towards using technology in the classroom. Using
technology as a tool for pre-service teachers to accomplish their goals will be more likely
to occur when educators believe that the use of technology helps to achieve educational
goals. Furthermore, Aoki and Downes (2003) found that college students who feel
overwhelmed by information coming in from media and classes struggle to handle all of

40
the information. Utilizing Getting Things Done™ software may provide overwhelmed
students with a way to control part of the information bombardment.
Conclusion
Pre-service teachers undergo a lengthy schooling process prior to entering the
classroom as educators. Essential to their ability to teach in today’s classroom is training
in utilizing Educational Technology methods. This training is enhanced when pre-service
teachers are taught self-regulatory skills and are encouraged to employ personal
motivation. One method of incorporating Educational Technology methods in pre-
service teacher preparation is training in Web 2.0 components such as blogs, wikis, and
web-based applications. A technique to promote staying on task is instruction in David
Allen’s Getting Things Done™ method.
The following chapter will discuss the research methodology for this study. This
will include descriptions of general procedures, subject information, a review of the
quantitative and qualitative materials utilized in the study, study procedures, and data
analysis.

41
CHAPTER III
METHODOLOGY
General Procedures The purpose of this study was to investigate the effect of Getting Things Done™
(GTD) software on the motivation and self-regulation of pre-service teachers in an
introductory Educational Technology course. This research was conducted at a
Midwestern university, within the College of Education, during the Fall 2008 semester.
The course utilized in the study was Educational Technology 3123 (EDTC 3123). This is
an undergraduate course for pre-service teachers in the field of education at a Midwestern
university. The course covers planning and developing instruction using educational
media and technology. The course also covers materials development, contemporary
applications of computers and other electronic systems for instruction as well as
integration of instructional design, instructional media, and instructional computing.
(OSU Course Catalogue, 2012-2013). The study was a concurrent mixed methods study,
employing both quantitative and qualitative measures to determine and ascertain the
differences in motivation and self-regulation between comparison groups with regards to
Getting Things Done™ software. Creswell and Plano-Clark (2007) note, “The use of
quantitative and qualitative approaches in combination provides a better understanding of
research problems than either approach alone” (p.5). Researching differences between
groups via mixed methods provided a more comprehensive explanation regarding the

42
differences observed. The research question guiding this study was: Do pre-service
teachers in an introductory Educational Technology course using Getting Things Done™
software demonstrate an increase in motivation and self-regulation?
There were ten sections of the introductory Educational Technology course (EDTC
3123) taught during the study, seven were taught during the day, two were taught during
the evening, and one was taught completely online. Eight face-to-face sections were
included in the study. One face-to-face section was randomly chosen to be excluded from
the study to provide an equal number of intact sections to divide between the experimental
and control groups. The online course was excluded from the study because of the
differences in the course format. Three sections of the course were taught by the
researcher, while seven sections were taught by other instructors. Differences between
instructors were controlled through the use of the standardized curriculum. Sections used
the same production assignments, the same text, and the same reading assignments and
quizzes. All sections utilized the university online learning platform, Desire2Learn (D2L),
to turn in assignments and complete quizzes.
The study took place over the course of a 16-week semester. The first week of
the semester was considered a probationary period for students since it is traditionally a
time when courses are added and dropped. Therefore, the study did not begin until the
second week of the semester. The study concluded after 12 weeks of intervention to
minimize the effect on the results caused by the end-of-the-semester projects and course
finals. During the 14th week of the semester, the post-test materials were collected from
the subjects and debriefing information was presented to the subjects. A pre-test/post-test
design was used to collect and analyze the data from the two comparison groups.

43
Comparison groups consisted of a control group and an experimental group of pre-service
teachers enrolled in different sections of a required instructional course. Subjects
completed the Motivated Strategies Learning Questionnaire (MSLQ). Furthermore, a
Likert-type scale and open-ended short answer/essay questions were collected from all
the participants at both the beginning and end of the experimental cycle. Additional
qualitative data was collected through interviews with eight randomly selected students
participating in the experimental groups. Two students from each of the experimental
groups were interviewed. No students from the control groups were interviewed due to
the fact that the majority of the interview questions focused on the GTD software utilized
during the study as opposed to concepts the software reinforced. During the time of
treatment, the control groups, the subjects without GTD software, were presented course
content as it is traditionally done. The experimental groups completed course content in
the traditional manner, but were also provided with instruction on the Getting Things
Done™ method, developed by David Allen (2001), as well as instruction for using GTD
software to organize course assignments at the beginning of the semester.
Participants
The participants in this study were pre-service education students, either
secondary or elementary majors, enrolled in an introductory Educational Technology
course (EDTC 3123) at a university in the Midwest. Intact sections were randomly
assigned to either the control groups, without GTD software, or the experimental groups,
with GTD software. Students enrolled in both the experimental and control groups who
were not pre-service teachers were allowed to complete the survey materials; however,
their data was not included in the data analysis. Due to the need to compare pre- and

44
post-test results, only students who completed both the pre- and post-test materials were
included in the final quantitative data analysis. Overall there were 90 students involved
in the study, with 45 in students in the experimental groups and 45 in the control groups.
See Tables 3.1 and 3.2 for details regarding the subjects.
Table 3.1
Section Information
Section Overall Number Enrolled
*Pre-Service Teachers
Completing Pre-Test
*Pre-Service Teachers
Completing Post-Test
Experimental or
Control
EDTC 3123-001 **Excluded from study
EDTC 3123-002 19 16 12 Control
EDTC 3123-003 19 14 13 Experimental
EDTC 3123-004 13 12 12 Experimental
EDTC 3123-005 20 15 14 Experimental
EDTC 3123-006 20 16 14 Control
EDTC 3123-007 19 10 7 Control
EDTC 3123-008 17 13 12 Control
EDTC 3123-801 9 8 6 Experimental
EDTC 3123-503 ***Excluded from study
Overall Numbers 136 104 90
*Students enrolled in the class who were non-education majors were excluded from the study and the subject count **Section randomly chosen to be excluded from the study ***Online course excluded from the study

45
Table 3.2
Experimental and Control Groups Subject Information
Sections
Pre-Test Participants
Post-Test Participants
Final Number
Experimental (003, 004, 005, 801)
49 45 45
Control (002, 006, 007, 008) 55 45 45
Instrument/Materials
Quantitative measure.
The Motivated Strategies Learning Questionnaire (MSLQ) was used in this study.
According to Pintrich et al. (1993), “The MSLQ is a self-report instrument designed to
assess college students’ motivational orientations and their use of different learning
strategies for a college course” (p. 801). The instrument was first constructed in 1986 to
assess the effectiveness of Learning to Learn classes at the University of Michigan
(Pintrich et al., 1991). The original format was administered to over 1,700 students over
a three-year period with revisions occurring as necessary (Pintrich et al., 1993). Duncan
and McKeachie (2005) report the use of the MSLQ in over eighteen countries with
populations ranging from elementary age students to graduate students.
The MSLQ has been used to study motivation and self-regulation of K-12
students in areas such as mathematics (Kaya, 2007; Ruiz, 2006; Missildine, 2004),
science (Ulkins, 2007; Kennedy, 2007; Barlia, 1999), and music (Bailey, 2006). Studies
have also been conducted at the graduate level for medical students (Sullivan, 2003;
Barker, 1997) seminary students (Harlow, 2006) and with community college students
(Puzzifero, 2006; Reed, 2003). The predominate use of the MSLQ is with undergraduate

46
students. Studies have been conducted with distance education classes (Richardson,
2007, Dunigan, 2003), economics classes (Zachariah, 1995), accounting classes (Eide,
1998), English composition classes (Wu, 2006; Hatcher, 1999), history classes (Quick,
2000), mathematics (Clarke, 2006; Hurn, 2006; Warneke, 2000), business classes
(Thongnoum, 2002), information systems classes (Sanders, 2002; Chen, 2002), and
engineering classes (Krupczak et al., 2005; Matthews, 2004). The MSLQ has also been
used to study students in online courses (Caldwell, 2006; Fredricksen, 2004; Maupin,
2003), non-traditional students (Spencer, 1999), and under-prepared students (Beverly,
2003). While pre-service teachers have been studied with the MSLQ (Lewis, 2006;
Bhattacharyya, 2004; Selvester, 2004; Willems, 2000; McClendon, 1996; Gilles, 1994;
McClendon, 1993), no study could be found that sought to determine the relationship
between pre-service teachers, Educational Technology, and Getting Things Done™
software.
According to Duncan and McKeachie (2005), the instrument consists of 81, 7-
point Likert-type items, with responses ranging from 1 (not true at all of me) to 7 (very
true of me). The items are divided into fifteen scales, comprising of two major
components: motivation and learning strategies. Pintrich et al. (1993) evaluated the
reliability and validity of the final version of the MSLQ with 356 students. The
reliability for all fifteen scales can be seen in Table 3.3. Predictive validity for the both
components, via correlation, can be seen in Table 3.4.

47
Table 3.3
Coefficient (Cronbach’s) Alpha for MSLQ:
Scale Cronbach’s
Alpha Scale
Cronbach’s Alpha
Motivational Scales Learning Strategies Scales
Intrinsic Goal Orientation .74 Rehearsal .69
Extrinsic Goal Orientation .62 Elaboration .75
Task Value .90 Organization .64
Control of Learning Beliefs .68 Critical Thinking .80
Self-Efficacy for Learning and Performance .93
Metacognitive Self-Regulation .79
Test Anxiety
.80 Time and Study Environment Management .76
Effort Regulation .69
Peer Learning .76
Help-Seeking .52

48
Table 3.4
Correlations among MSLQ Scales:
Intrinsic Goal Orientation: Intr; Extrinsic Goal Orientation: Extr; Task Value: Tskv; Control of Learning Beliefs: Cont; Self-Efficacy for Learning and Performance: Slfef; Test Anxiety: Tanx; Rehearsal: Reh; Elaboration: Elab; Organization: Org; Critical Thinking: Crit; Metacognitive Self-Regulation: Mcg; Time and Study Environment Management: Tstdy: Effort Regulation: Efft; Peer Learning: Prlrn and Help-Seeking: Hsk
Intr Extr Tskv Cont Slfef Tanx Reh Elab Org Crit Mcg Tstdy Efft Prlrn Extr 0.15 Tskv 0.68 0.18 Cont 0.29 0.14 0.30 Slfef 0.59 0.15 0.51 0.44 Tanx -0.15 0.23 -0.14 -0.10 -0.37 Reh 0.10 0.23 0.12 0.02 0.10 0.11 Elab 0.48 0.13 0.44 0.22 0.37 -0.13 0.36 Org 0.27 0.09 0.19 0.02 0.21 -0.05 0.49 0.52 Crit 0.58 0.06 0.39 0.19 0.42 -0.11 0.15 0.57 0.31 Mcg 0.50 0.07 0.45 0.17 0.46 -0.24 0.39 0.67 0.55 0.53 Tstdy 0.32 0.13 0.37 0.00 0.32 -0.17 0.38 0.44 0.44 0.25 0.58 Efft 0.43 0.11 0.47 0.07 0.44 -0.21 0.26 0.44 0.36 0.25 0.61 0.70 Prlrn 0.13 0.20 0.09 -0.03 0.05 0.10 0.21 0.19 0.23 0.25 0.15 0.10 0.05 Hsk 0.10 0.08 0.16 0.00 0.08 0.08 0.18 0.28 0.22 0.19 0.25 0.21 0.18 0.55
48

49
Duncan and McKeachie (2005) state that since the scale was designed in a
modular fashion, each scale can be used by itself or with any of the other scale. For this
study, the following motivation subscales were used: task value, control of learning
beliefs, and self-efficacy for learning. The following learning strategies subscales were
used: organization, metacognitive self-regulation, time and study environment
management, and effort regulation. These scales were included since they aligned with
the research question. See Appendix B for the MSLQ.
The scales that were excluded from the motivation subscales include: intrinsic
goal orientation, extrinsic goal orientation, and test anxiety. The scales excluded from
the learning strategies subscales included: rehearsal, elaboration, critical thinking, peer
learning, and help seeking. These subscales were excluded from the study because they
were not in alignment with the goals of this research.
Scale definitions.
Task Value: According to Pintrich et al. (1991) task value refers to the student’s
assessment of how interesting, how important, and how useful the task is to them. There
are six questions in this subscale. Sample questions include the following:
• “I think I was able to use what I learn in this course in other courses.
• I think the course material in this class is useful for me to learn.
• Understanding the subject matter of this course is very important to me.
(p. 11)”
Control of Learning Beliefs: This scale investigates the subject’s opinion about
outcomes being contingent on personal effort instead of external factors like the teacher

50
(Pintrich et al., 1991). There are four questions in this subscale. Sample questions
include the following:
• “It is my own fault if I don’t learn the materials in this course.
• If I don’t understand the course material, it is because I didn’t try hard
enough. (p.12)”
Self-Efficacy for Learning and Performance: This scale refers to performance
expectations, and self-appraisal of ability to accomplish a task, and confidence in ability
to perform the task (Pintrich et al., 1991). There are eight questions in this subscale.
Sample questions include the following:
• “I believe I will receive an excellent grade in this class.
• I’m confident that I can do an excellent job on the assignments and tests in
this course.
• Considering the difficulty of this course, the teacher, and my skills, I think I
will do well in this class. (p. 14)”
Organization: Organizing involves selecting appropriate information and
establishing connections between information in the class. Organizing takes effort from
the student and being organized should increase performance (Pintrich et al., 1991).
There are four questions in this subscale. Sample questions include the following:
• “When I study the readings for this course, I outline the material to help me
organize my thoughts.
• I make simple charts and diagrams, or tables to help me organize course
material. (p. 21)”
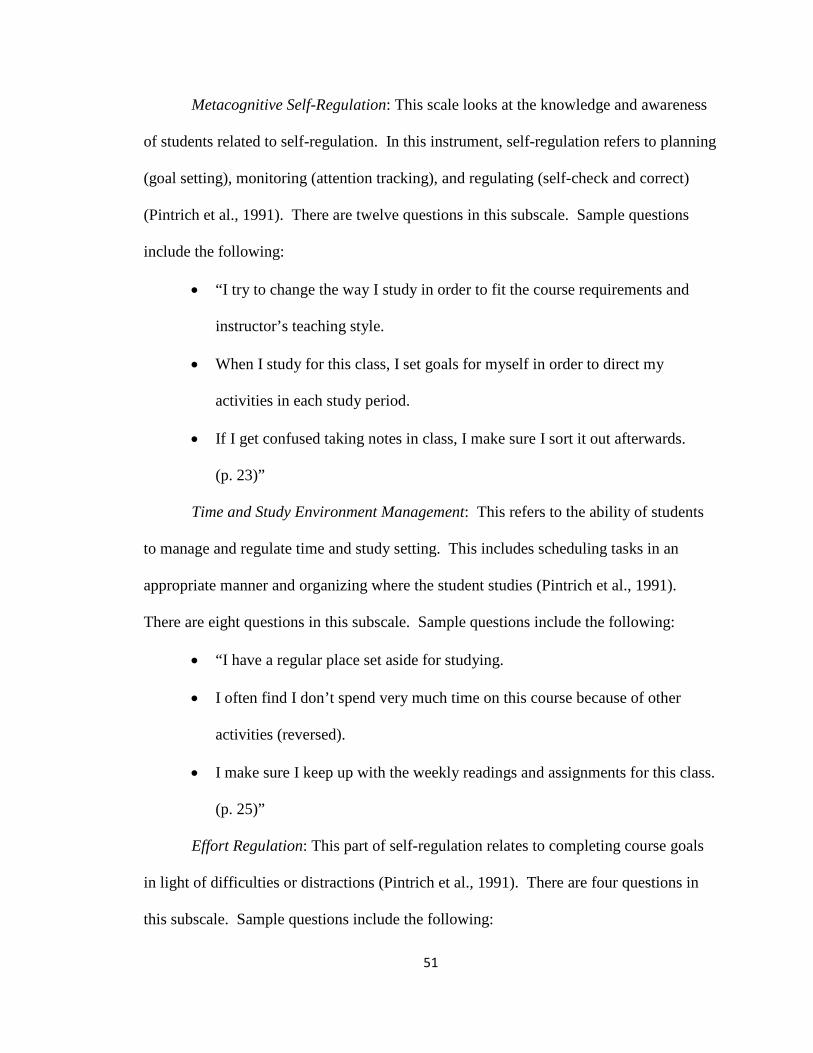
51
Metacognitive Self-Regulation: This scale looks at the knowledge and awareness
of students related to self-regulation. In this instrument, self-regulation refers to planning
(goal setting), monitoring (attention tracking), and regulating (self-check and correct)
(Pintrich et al., 1991). There are twelve questions in this subscale. Sample questions
include the following:
• “I try to change the way I study in order to fit the course requirements and
instructor’s teaching style.
• When I study for this class, I set goals for myself in order to direct my
activities in each study period.
• If I get confused taking notes in class, I make sure I sort it out afterwards.
(p. 23)”
Time and Study Environment Management: This refers to the ability of students
to manage and regulate time and study setting. This includes scheduling tasks in an
appropriate manner and organizing where the student studies (Pintrich et al., 1991).
There are eight questions in this subscale. Sample questions include the following:
• “I have a regular place set aside for studying.
• I often find I don’t spend very much time on this course because of other
activities (reversed).
• I make sure I keep up with the weekly readings and assignments for this class.
(p. 25)”
Effort Regulation: This part of self-regulation relates to completing course goals
in light of difficulties or distractions (Pintrich et al., 1991). There are four questions in
this subscale. Sample questions include the following:
52
• “I work hard to do well in this class even if I don’t like what we are doing.
• I often feel so lazy or bored when I study for this class that I quit before I
finish what I planned to do. (p. 27)” (reversed).
Qualitative measures.
The following qualitative measures were utilized to collect data from participants.
First, demographic information was collected from all participants. Participants indicated
their gender, current age, number of years of college completed, grade classification, and
current major. See Appendix C for the Demographic Data Questionnaire.
Secondly, pre- and post-test Likert-type Scale (not qualitative) questions were
used to collect additional data from all participants in the study. The instrument
consisted of five, 5-point Likert-type items, with responses ranging from 1 (very high) to
5 (very low). Questions addressed self-assessment of current technological proficiency,
current comfort level with technology, self-assessment of ability to successfully complete
the course, self-assessment of motivation to complete the course, and self-assessment of
organizational skills related to ability to complete coursework. Additionally, one open-
ended question was asked of all participants. The question was different for the pre- and
post-tests. For the pre-test data collection, participants were asked how they planned on
organizing their time and study environment for the course. For the post-test data
collection, participants were asked if they learned or experienced anything in the course
that helped them organize their time and study environment for the class. Data was
summarized and assessed for themes. See Appendices D and E for the pre-test and post-
test Self-Assessment Questions.

53
The final set of qualitative data collected came from eight individual interviews
done at the end of the semester with students from the experimental groups. Two student
names from each experimental section were randomly chosen from a pool of volunteer
names gathered during the post-test process.
Interviews began with general background questions, including gender, age, years
of college completed, grade classification and current major. Interview questions focused
on students’ perception of personal technology proficiency, whether their proficiency
changed over the course of the semester, students’ perceptions of their level of comfort
with technology, how their level of comfort changed over the semester, and their opinion
of the ease of successfully completing the course/assignments.
Additional questions were asked about students’ motivation toward completing
the course, students’ organizational skills for the course and how those may have changed
over the semester, and organization of time and study environment. Lastly, interviewees
were asked what, if anything, they learned in the class that assisted them with personal
organization,
Finally, interview questions focused on students’ personal opinions related to the
use of the Getting Things Done™ (GTD) software in the courses. The researcher asked a
series of open-ended questions about the use of the GTD software during the
experimental period. These questions focused on the training, the utilization of the
software during the semester, use of to-do lists, use of the calendaring functions, ease of
completion of tasks based on the use of the software, issues that kept the interviewee
from utilizing the software and software-program specific opinion questions. The last
series of questions sought student opinions on their ability to utilize the software in other

54
courses, their recommendation of the software to others, and any additional comments
related to the study. The data was summarized and assessed for themes. The GTD
interview questions were based on components of the GTD software and the MSLQ
subscales utilized in this study. Interviews were conducted at the College of Education
and scheduled for a time that was convenient for the interviewee; interviews lasted no
longer than 45 minutes apiece. The students’ responses were recorded via digital audio
recorder and theme analysis was conducted from the results. See Appendix F for the
Interview Guide.
Instructional materials. At the beginning of the semester, the experimental groups received instructions
from the researcher about the use of David Allen’s Getting Things Done™ software and
method to assist them in completing the assignments for the course. The control groups
received the same materials following the post-test data collection. Students learned
about mastering workflow, natural planning, and the use of two types of Getting Things
Done™ software to assist with productivity in this course. See Appendix G for the
Getting Things Done™ PowerPoint Training Materials.
Allen (2001) describes how to master workflow in five steps: collect, process,
organize, review, and do (see Figure 3.1).

55
Figure 3.1 David Allen’s Workflow Diagram
Reprinted with permission. www.davidco.com
The first step is to collect, in one place, all the “stuff” to which one needs to
attend. This involves gathering physical items and representations of electronic items into
an “in-basket” that holds said items until time is available to process the information.
Allen (2001) notes that this stage is essential for clearing the RAM of the mind so that
one is not overwhelmed by trying to keep track of all there is to do. One important note
for this stage is to set up enough in-baskets to organize various components of your life,
but not so many in-baskets that they become too overwhelming to manage.
56
The second step is to process the information contained in the in-baskets. This
step is time consuming and should only be undertaken with a large block of available
time. Processing involves determining what the item is and if an action needs to be taken
to deal with it. Actions include determining if this task is a project, if the task is an action
item, or if the task is a non-action item.
The third step is to organize the information addressed by the process step. Non-
action items will be trashed, filed away for future use, or put into a reference folder. Action
items that take two minutes or less to complete are accomplished immediately and those
taking longer than two minutes are either delegated or deferred for later. If a task is project
based, it goes onto a projects list for action.
The fourth step is to review the outstanding items in the various baskets and
decide what needs immediate attention and what can be deferred for later. One way to
organize items for review is to document them in a personal organization system. Allen
(2001) recommends a calendar that lists projects, next action items, and waiting for items.
The review should take place on a weekly basis for maximum success.
The final step is what Allen (2001) calls the “Do” step. For items taking longer
than two minutes to complete another set of organizing procedures are followed. He
offers three models to consider during this phase. The first step is addressing the “Four-
Criteria Model” where individuals determine the context in which the action needs to
take place, the time available to complete the task, the energy available to complete the
task, and where on the priority list the action items falls. The second model is the
“Threefold Model” used to evaluate daily items. Using the “Threefold Model,”
individuals complete the work as it is predefined, as it shows up, or defines the work to

57
be accomplished. Allen recommends beginning with the “defining your work” process.
Finally, Allen offers the “Six-Level Model” to assist individuals in reviewing their
personal work. This model involves the individual viewing his/her personal priorities
from different perspectives. These six perspectives are based on altitude and consist of
the “Runway” which lists current items that need to be accomplished. The next level is
“10,000 feet” which includes current projects. The third level is “20,000 feet” and is
made up of the top ten to fifteen “results driven” categories in your life. Examples here
might include health, finances, and strategic planning. The fourth level is “30,000 feet”
and involves setting one- and two-year goals for both work and personal life. The fifth
level is “40,000 feet” and entails establishing three- to five-year visions for your future.
The final level is the “50,000+ feet” level. This is what Allen (2001) calls the big picture
of life level and where primary life purposes are developed.
The Getting Things Done™ method is based on what Allen (2001) calls “natural
planning” (p.56). Natural planning involves five phases. The first phase is to determine
the purpose of why one is doing what one is doing. The second phase is to understand
how your principles establish parameters and criteria for your behavior. The third phase
is to develop a vision for the successful completion outcome of a project. The fourth
phase is to brainstorm ways to move projects from ideas in your mind to finished events.
The final phase is to determine the allocation and reallocation of resources to get the
project moving towards completion.
Students also received instruction on the two Getting Things Done™ software
programs chosen for the study. These programs were used as organizational tools for the
course assignments. Instruction was given on setting up and managing an account,

58
entering action item information into the tasks section of the program and setting up
reminders for both iGoogle™ (http://www.google.com/ig) and Remember the Milk
(http://www.rememberthemilk.com/ ).
Procedures
During the second week of the semester, the researcher attended seven sections of
the EDTC 3123 face-to-face classes to invite students to participate in the study and
complete the pre-test materials, consisting of the MSLQ, open-ended questions and
demographic materials. See Appendix H for the Recruitment Script and Appendix I for the
Informed Consent Document. One of the researcher’s dissertation co-chairs presented the
materials to the eighth section, one of the evening classes, because the researcher was
engaged teaching the other evening class 80 miles away on a different campus. Sections in
both the control groups and the experimental groups were told that the survey would collect
data on Attitudes of Pre-Service Teachers towards an Introductory Educational Technology
Course. All sections were debriefed on the deception following the post-test data
collection. The deception was carried out during the study in to lessen the possibility that
the title of the research study might influence or bias the results.
Additionally, those sections chosen to be in the experimental groups received
instruction in organizing their course assignments via David Allen’s Getting Things
Done™ method. Students were given two choices for the organization software to be
utilized during the semester. The two tools for the organization were either iGoogle™
(http://www.google.com/ig) with the calendaring and task functions added to personal
homepages or Remember the Milk software (http://www.rememberthemilk.com/ ).

59
Instructions for setting up an account, entering assignments, and managing the accounts
were also provided.
At the end of the semester, the researcher returned to seven sections of EDTC
3123 and re-administered the MSLQ and the open-ended questions. The dissertation
co-chair returned to the eighth section, the evening class, to re-administer the MSLQ and
the open-ended questions, again due to the researcher’s teaching schedule. After
administering the post-test data collection, the researcher/dissertation chair provided each
subject with a debriefing letter and explained the deception in the title to all participants.
See Appendix J for the Post-Test Debriefing Letter.
Additionally, those subjects in the control groups were presented with instruction
in David Allen’s Getting Things Done™ method and the two organization tools,
iGoogle™ and Remember the Milk following the collection of post-test data. After the
post-test data collection, individual interviews with eight student volunteers from the
experimental groups were conducted over the course of two weeks. Each interview lasted
approximately 45 minutes.
Data Analysis
Quantitative data analysis procedures.
The majority of the quantitative data for this study came from the MSLQ
instruments completed by the students at the beginning and end of the semester. Data
from each subject was entered into a spreadsheet program and mean scores from each of
the seven subscales used in the study were calculated. The subscale means for each
subject was entered into statistical analysis software (SPSS). Paired sample t-tests were
calculated for each subscale variable at the 95% confidence interval. Additionally, paired
60
sample correlations, means, standard deviations, and Pearson bivariate correlations
between the variables were calculated. To test for statistical differences between the
post-test means of the control and the experimental groups, independent samples t-tests
were also calculated. For consistency in this study, the researcher and the researcher’s
co-chair chose the following levels for interpreting r2 in the Pearson bivariate
correlations: low 10%, moderate 15% - 40%, and high 50% and higher.
Additional quantitative data came from 5 Likert-type Scale questions asked of all
subjects during the pre- and post-test data collection process. Responses from each
question were summarized via subject in a spreadsheet program. Then, summarized pre-
and post-test answers for each person was entered into statistical analysis software
(SPSS). Paired sample t-tests were calculated for each question. Additionally, means,
standard deviations, and Pearson bivariate correlations between the variables were
calculated. To test for statistical differences between the post-test means of the control
and the experimental groups, independent samples t-tests were also calculated. As stated
previously, for consistency in this study, the researcher and the researcher’s co-chair
chose the following levels for interpreting r2 in the Pearson bivariate correlations: low
10%, moderate 15% - 40%, and high 50% and higher.
Finally, demographic data was summarized to provide a complete picture of the
subjects involved in the study. Gender, grade classification and student major data was
tallied. The data for current age and number of years of college completed was tallied and
averaged, with range also calculated.

61
Qualitative data analysis procedures.
One component of the research involved qualitative data collection from open-
ended interviews with eight students randomly selected from the experimental groups.
The information was transcribed, coded and analyzed for themes utilizing qualitative
coding methods. Miles and Huberman (1984) present information on coding data. They
note that coding allows the researcher to cluster similar information as a precursor to
analyzing the data. Three strategies suggested by Miles and Huberman were utilized in
the coding process for this data: counting the number of times a topic is mentioned,
clustering the information, and looking for patterns in the information.
A second component of the qualitative data came from open-ended questions
asked of subjects in both the experimental and control groups during the pre- and post-
data collection. During the pre-test data collection, subjects were asked how they
planned to organize their time and study environment for the course. During the post-test
data collection, subjects were asked if there was anything learned or experienced in the
course that helped them to organize their time and study environment for the class. The
information was transcribed, coded and analyzed for themes utilizing qualitative coding
methods.
Independent and Dependent Variables
For this study, the Getting Things Done™ software served as the independent
variable. Motivation and self-regulation served as the dependent variables.
Validity Considerations
Threats to internal and external validity were controlled as much as possible in
this study. Creswell (2003) notes that internal validity threats come from “experimental

62
procedures, treatments, or experiences of the participants that threaten the researcher’s
ability to draw correct inferences from the data in an experiment” (p. 171). To control for
instrumentation, the researcher chose an instrument that has been tested and found to be a
reliable and valid measure. This instrument was used for all subjects in the pre- and post-
testing and was given at the same point in time during the semester to all subjects. For
experimental procedures, the same protocol was followed each time the instrument was
given to subjects. For treatment and experiences, all subjects in the control groups and in
the experimental groups received the same training on the Getting Things Done™
methods and Getting Things Done™ software. Gall, Borg, and Gall (1996) offer another
threat to internal validity known as “compensatory rivalry by the control group” (p. 472).
This threat is also called the John Henry effect. This effect occurs when the control
groups try to outperform the experimental groups. To counter this effect, no special
treatment or grading incentives were offered to either group.
Creswell (2003) also offers this with regards to external validity threats, “external
validity threats arise when experimenters draw incorrect inferences from the sample data
to other persons, other setting, and past or future settings” (p. 171). To control for these
external validity threats, the results of the study will only be generalized to the population
under consideration, pre-service teachers taking a technology methods course.
Gall, Borg, and Gall (1996) present additional threats to external validity; these
ecological concerns are the Hawthorne effect and post-test sensitization. According to
Gall, Borg and Gall, “The Hawthorne effect refers to any situation in which the
experimental conditions are such that the mere fact that individuals are aware of
participating in an experiment, are aware of the hypothesis, or receiving special attention

63
improves their performance” (p. 475). Pre-service teachers tend to complete educational
courses together and compare notes on the coursework being completed in different
sections of the same course. Gall, Borg, and Gall note that while attempts to control for
this effect tend to fail; researchers should attempt to minimize special treatment to
experimental subjects. For this study, the researcher attempted to minimize Hawthorne
effects by only providing the basic information necessary to the experimental groups to
complete the study and not emphasize that the experimental groups are receiving special
treatment. Post-test sensitization occurs when subjects remember the pre-test and learn
from their responses to the pre-test. For this study, the time between tests downplayed
the effects of post-test sensitization.
Conclusion
The following chapter will present the quantitative and qualitative results from the
statistical analyses. This will include analysis of the pre- and post-test results from the
MSLQ, the Likert-type scale questionnaire and the interviews conducted with the eight
volunteers from the experimental groups.

64
CHAPTER IV
RESULTS
Introduction
The purpose of this study was to investigate the effect of Getting Things Done™
(GTD) software on the motivation and self-regulation of pre-service teachers in an
introductory Educational Technology course. The following research question was
addressed: Do pre-service teachers in an introductory Educational Technology course
using Getting Things Done™ software demonstrate an increase in motivation and self-
regulation? This chapter will describe the sample, the data analysis, and the results of the
quantitative and qualitative data collected during the course of the study.
A pre-test/post-test design was used to collect data from the two comparison
groups. Comparison groups consisted of a control group and an experimental group of
pre-service teachers enrolled in different sections of a required instructional course.
Subjects first completed the Motivated Strategies Learning Questionnaire (MSLQ).
Additionally, a Likert-Type Scale survey with open-ended short answer/essay questions
was administered to all participants so they could self-assess their skill level, their
comfort with technology, and their classroom experiences. These surveys were
administered at both the beginning and end of the research cycle. To enhance the results
gathered through the surveys, qualitative data was collected through semi-structured

65
interviews conducted with eight randomly selected students participating in the
experimental groups. Two students from each of the experimental groups (classes) were
interviewed. No students from the control groups were interviewed because the
researcher discovered that the majority of the interview questions focused only on the
GTD software utilized during the study instead of the concepts the software reinforced.
Paired sample t-tests were used to investigate pre- and post-test means between
the variables and independent samples t-tests were conducted to look at the difference in
means between the control groups and the experimental groups. Pearson bivariate
correlations were performed for pre- and post-test variables and control and experimental
groups. For consistency in this study, the researcher and the researcher’s co-chair chose
the following levels for interpreting r2 in the Pearson bivariate correlations: low 10%,
moderate 15% - 40%, and high 50% and higher. Open-ended questions and interview
results were transcribed and analyzed for common themes.
Chapter 4 will first present participant information, including demographic
characteristics of the students who participated in the study. The research question: Do
pre-service teachers in an introductory Educational Technology course using Getting
Things Done™ software demonstrate an increase in motivation and self-regulation, will
be addressed first through the presentation of quantitative and then, qualitative data.
Participant Demographic Information
A total of ninety pre-service teachers completed both the pre- and post-test survey
questionnaires, forty-five students in the experimental groups and forty-five in the control
groups. Only pre-service education teacher data was included in the results. Students
with other majors were enrolled the course and all students were allowed to complete the

66
instruments to avoid any negative effects on the data collection process. However, the
data from other majors was excluded from the final data analysis. Table 4.1 presents the
control and experimental groups gender summaries.
Table 4.1
Gender Summary
Control groups Experimental groups Gender N % N % Male 14 31% 18 40%
Female 31 69% 27 60%
The average age of the control groups was 21.31 (SD 1.81) and the ages of the
students ranged from 19 to 31. The average age of the experimental groups was 22.87
(SD 4.94) and the ages ranged from 19 to 44. Median age for the control groups was 21
years and median age for the experimental groups was also 21 years. Students in the
control groups had spent an average of 2.67 (SD 0.94) years in college. Students in the
experimental groups had spent 2.73 years in college (SD 1.25).
The control groups’ grade classification distribution was 13% sophomores, 49%
juniors, and 38% seniors. The experimental groups’ grade classification percentages
were 11% sophomores, 69% juniors and 20% seniors. Within the control groups, 42% of
students were Elementary Education majors and 58% were Secondary Education majors.
Within the experimental groups, 33% were Elementary Education majors and 67% were
Secondary Education majors.
67
Analysis of MSLQ Data
After data was collected, numbers from each subject’s MSLQ were entered into
an excel spreadsheet and mean scores from each of the seven subscales used in the study
was calculated for each subject. The subscale means for each person was entered into
statistical analysis software (SPSS, version 17). Paired sample t-tests were calculated for
each subscale variable at the 95% confidence interval. Additionally, paired sample
correlations, means, standard deviations, and Pearson bivariate correlations between the
variables were calculated. Following the analysis of paired sample t-tests, independent
samples t-tests were calculated between the experimental and the control groups to
compare post-test means. Means, standard deviations, and Pearson bivariate correlations
between the variables were also calculated.
Paired sample t-test experimental groups.
Table 4.2 presents the means, standard deviations, and pre- and post-test
correlations with corresponding significance of the pre- and post-test scales for the
experimental groups.

68
Table 4.2
Paired Sample Descriptive Statistics Experimental Groups
Pre-Test Mean (SD) (n = 45)
Post-Test Mean (SD) (n = 45)
Pre- and Post-Correlations
Sig.
Task Value
6.09 (0.84)
6.08 (0.92)
0.452
0.002*
Control Learning Beliefs
6.22 (0.72) 5.90 (1.17) 0.573 0.000*
Self-Efficacy for Learning and Performance
5.92 (0.68) 5.91 (0.74) 0.508 0.000*
Organization
3.64 (1.46) 3.15 (1.55) 0.813 0.000*
Metacognitive Self-Regulation
4.30 (0.94) 4.05 (0.97) 0.738 0.000*
Time and Study Environment
5.36 (0.84) 4.87 (1.29) 0.632 0.000*
Effort Regulation
5.73 (0.87) 5.42 (1.13) 0.537 0.000*
Note. Responses to scale items were on a 7-point Likert scale, with responses ranging from 1 - not true at all of me to 7 - very true of me. *p < .05 statistically significant

69
Table 4.3 presents paired differences descriptive statistics for the pre- and post-
test scales of the experimental groups.
Table 4.3 Paired Sample Paired Differences Experimental Groups
Paired Differences
Mean SD Std. Error Mean
95% CI
Lower
95% CI
Upper
t df Sig. (2-tailed)
Pair 1 Pre/Post Task Value
.011
.925
.138
-.267
.289
.081
44
.936
Pair 2 Pre/Post Control Learning Beliefs
.318
.963
.143
.028
.607
2.21
44
.032*
Pair 3 Pre/Post Self-Efficacy for Learning and Performance
.007
.705
.105
-.205
.219
.070
44
.945
Pair 4 Pre/Post Organization
.494
.922
.138
.217
.771
3.60
44
.001*
Pair 5 Pre/Post Metacognitive Self-Regulation
.250
.693
.103
.413
.458
2.42
44
.020*
Pair 6 Pre/Post Time and Study Environment
.491
.999
.149
.191
.791
3.30
44
.002*
Pair 7 Pre/Post Effort Regulation
.317
.988
.147
.020
.613
2.15
44
.037*
*p < .05 statistically significant
A paired sample t-test was calculated to compare the mean of the pre- and post-
test results of the experimental groups’ Task Value scale. Descriptive indices, including

70
paired sample correlations, means and standard deviations for the variables of interest
were also calculated. For the Task Value scale, results were not statistically significant at
the 95% confidence level, t(44) = .081, p > .05. Paired sample correlations revealed a
significant positive correlation (r = .45, p < .002) between Task Value pre-test and Task
Value post-test.
A paired sample t-test was calculated to compare the mean of the pre- and post-
test results of the experimental groups’ Control of Learning Beliefs scale. Descriptive
indices, including paired sample correlations, means and standard deviations for the
variables of interest were also calculated. For the Control of Learning Beliefs scale,
results were statistically significant at the 95% confidence level, t(44) = 2.210, p < .05.
Paired sample correlations revealed a significant positive correlation (r = .573, p < .000)
between Control of Learning Beliefs pre-test and Control of Learning Beliefs post-test.
A paired sample t-test was calculated to compare the mean of the pre- and post-
test results of the experimental groups’ Self-Efficacy for Learning and Performance scale.
Descriptive indices, including paired sample correlations, means and standard deviations
for the variables of interest were also calculated. For the Self-Efficacy for Learning and
Performance scale, results were not statistically significant at the 95% confidence level,
t(44) = .070, p > .05. Paired sample correlations revealed a significant positive
correlation (r = .508, p < .000) between Self-Efficacy for Learning and Performance pre-
test and Self-Efficacy for Learning and Performance post-test.
A paired sample t-test was calculated to compare the mean of the pre- and post-
test results of the experimental groups’ Organization scale. Descriptive indices,
including paired sample correlations, means and standard deviations for the variables of

71
interest were also calculated. For the Organization scale, results were statistically
significant at the 95% confidence level, t(44) = 3.596, p < .05. Paired sample
correlations revealed a significant positive correlation (r = .813, p < .000) between
Organization pre-test and Organization post-test.
A paired sample t-test was calculated to compare the mean of the pre- and post-
test results of the experimental groups’ Metacognitive Self-Regulation scale. Descriptive
indices, including paired sample correlations, means and standard deviations for the
variables of interest were also calculated. For the Metacognitive Self-Regulation scale,
results were statistically significant at the 95% confidence level, t(44) = 2.415, p < .05.
Paired sample correlations revealed a significant positive correlation (r = .738, p < .000)
between Metacognitive Self-Regulation pre-test and Metacognitive Self-Regulation post-
test.
A paired sample t-test was calculated to compare the mean of the pre- and post-
test results of the experimental groups’ Time and Study Environment scale. Descriptive
indices, including paired sample correlations, means and standard deviations for the
variables of interest were also calculated. For Time and Study Environment scale, results
were statistically significant at the 95% confidence level, t(44) = 3.301, p < .05. Paired
sample correlations revealed a significant positive correlation (r = .632, p < .000)
between Time and Study Environment pre-test and Time and Study Environment post-
test.
A paired sample t-test was calculated to compare the mean of the pre- and post-
test results of the experimental groups’ Effort Regulation scale. Descriptive indices,
including paired sample correlations, means and standard deviations for the variables of

72
interest were also calculated. For the Effort Regulation scale, results were statistically
significant at the 95% confidence level, t(44) = 2.151, p < .05. Paired sample
correlations revealed a significant positive correlation (r = .537, p < .000) between Effort
Regulation pre-test and Effort Regulation post-test.
Paired sample t-test control groups.
Table 4.4 presents the means, standard deviations, and pre- and post-test
correlations with corresponding significance of the pre- and post-test scales for the
control groups.
Table 4.4
Paired Sample Descriptive Statistics Control Groups
Pre-Test Mean (SD) (n=45)
Post-Test Mean (SD) (n=45)
Pre- and Post-Correlations
Sig.
Task Value
5.89 (0.96)
5.96 (0.97)
0.522
0.000*
Control Learning Beliefs
5.71 (0.97) 5.51 (1.23) 0.542 0.000*
Self-Efficacy for Learning and Performance
5.99 (0.71) 6.08 (0.85) 0.565 0.000*
Organization
3.71 (1.39) 3.28 (1.32) 0.493 0.001*
Metacognitive Self-Regulation
4.31 (0.84) 4.02 (1.03) 0.632 0.000*
Time and Study Environment
5.46 (0.68) 4.80 (1.02) 0.419 0.004*
Effort Regulation
5.36 (0.87) 5.14 (1.12) 0.320 0.032*
Note. Responses to scale items were on a 7-point Likert scale with responses ranging from 1 - not true at all of me to 7 - very true of me. *p < .05 statistically significant

73
Table 4.5 presents paired differences descriptive statistics for the pre- and post-
test scales of the control groups.
Table 4.5 Paired Sample Paired Differences Control Groups
Paired Differences
Mean SD Std. Error Mean
95% CI
Lower
95% CI
Upper
t df Sig. (2-tailed)
Pair 1 Pre/Post Task Value
-.072
.944
.141
-.356
.211
-.513
44
.610
Pair 2 Pre/Post Control Learning Beliefs
.199
1.08
.160
-.124
.523
1.243
44
.221
Pair 3 Pre/Post Self-Efficacy for Learning and Performance
-.086
.736
.110
-.307
.135
-.780
44
.439
Pair 4 Pre/Post Organization
.428
1.36
.204
.017
.838
2.101
44
.041*
Pair 5 Pre/Post Metacognitive Self-Regulation
.293
.816
.122
.048
.539
2.411
44
.020*
Pair 6 Pre/Post Time and Study Environment
.662
.961
.143
.373
.950
4.623
44
.000*
Pair 7 Pre/Post Effort Regulation
.211
1.18
.176
-.143
.565
1.202
44
.236
*p < .05 statistically significant
A paired sample t-test was calculated to compare the mean of the pre- and post-
test results of the control groups’ Task Value scale. Descriptive indices, including paired

74
sample correlations, means and standard deviations for the variables of interest were also
calculated. For the Task Value scale, results were not statistically significant at the 95%
confidence level, t(44) = -.513, p > .05. Paired sample correlations revealed a significant
positive correlation (r = .522, p < .000) between Task Value pre-test and Task Value
post-test.
A paired sample t-test was calculated to compare the mean of the pre- and post-
test results of the control groups’ Control of Learning Beliefs scale. Descriptive indices,
including paired sample correlations, means and standard deviations for the variables of
interest were also calculated. For the Control of Learning Beliefs scale, results were not
statistically significant at the 95% confidence level, t(44) = 1.243, p > .05. Paired sample
correlations revealed a significant positive correlation (r = .542, p < .000) between
Control of Learning Beliefs pre-test and Control of Learning Beliefs post-test.
A paired sample t-test was calculated to compare the mean of the pre- and post-
test results of the control groups’ Self-Efficacy for Learning and Performance scale.
Descriptive indices, including paired sample correlations, means and standard deviations
for the variables of interest were also calculated. For the Self-Efficacy for Learning and
Performance scale, results were not statistically significant at the 95% confidence level,
t(44) = -.780, p > .05. Paired sample correlations revealed a significant positive
correlation (r = .565, p < .000) between Self-Efficacy for Learning and Performance pre-
test and Self-Efficacy for Learning and Performance post-test.
A paired sample t-test was calculated to compare the mean of the pre- and post-
test results of the control groups’ Organization scale. Descriptive indices, including
paired sample correlations, means and standard deviations for the variables of interest

75
were also calculated. For the Organization scale, results were statistically significant at
the 95% confidence level, t(44) = 2.101, p < .05. Paired sample correlations revealed a
significant positive correlation (r = .493, p < .001) between Organization pre-test and
Organization post-test.
A paired sample t-test was calculated to compare the mean of the pre- and post-
test results of the control groups’ Metacognitive Self-Regulation scale. Descriptive
indices, including paired sample correlations, means and standard deviations for the
variables of interest were also calculated. For the Metacognitive Self-Regulation scale,
results were statistically significant at the 95% confidence level, t(44) = 2.411, p < .05.
Paired sample correlations revealed a significant positive correlation (r = .632, p < .000)
between Metacognitive Self-Regulation pre-test and Metacognitive Self-Regulation post-
test.
A paired sample t-test was calculated to compare the mean of the pre- and post-
test results of the control groups’ Time and Study Environment scale. Descriptive
indices, including paired sample correlations, means and standard deviations for the
variables of interest were also calculated. For Time and Study Environment scale, results
were statistically significant at the 95% confidence level, t(44) = 4.623, p < .05. Paired
sample correlations revealed a significant positive correlation (r = .419, p < .004)
between Time and Study Environment pre-test and Time and Study Environment post-
test.
A paired sample t-test was calculated to compare the mean of the pre- and post-
test results of the control groups’ Effort Regulation scale. Descriptive indices, including
paired sample correlations, means and standard deviations for the variables of interest
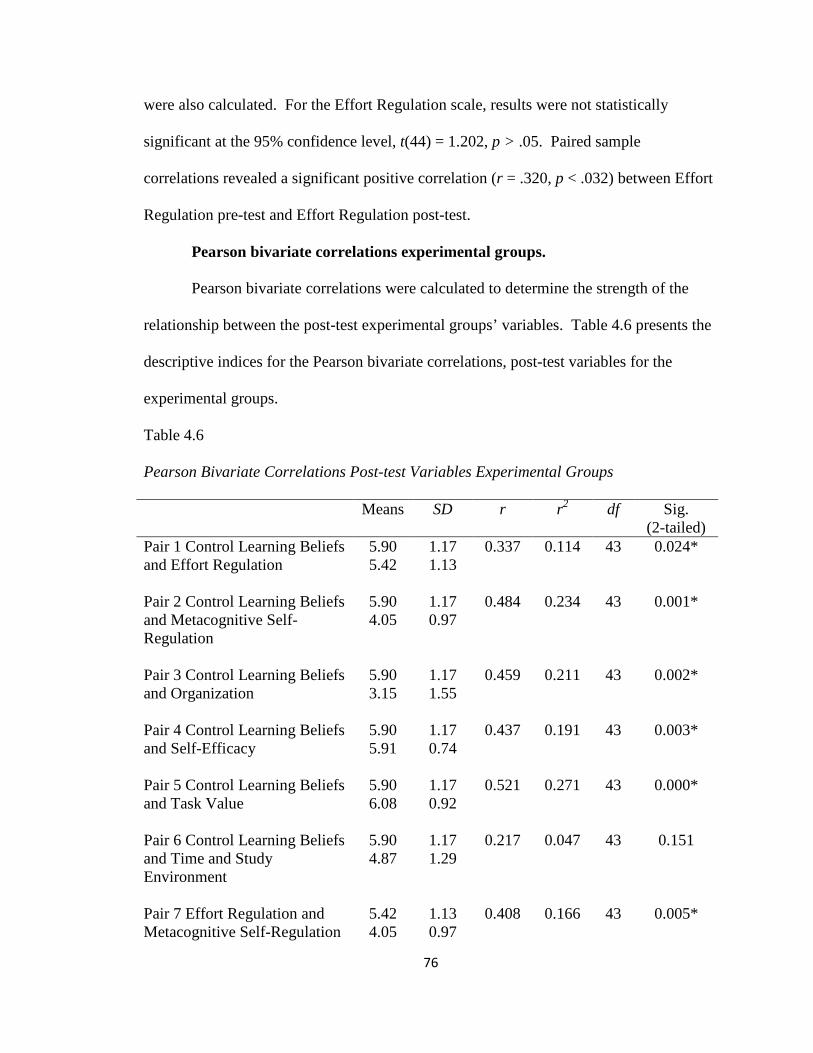
76
were also calculated. For the Effort Regulation scale, results were not statistically
significant at the 95% confidence level, t(44) = 1.202, p > .05. Paired sample
correlations revealed a significant positive correlation (r = .320, p < .032) between Effort
Regulation pre-test and Effort Regulation post-test.
Pearson bivariate correlations experimental groups.
Pearson bivariate correlations were calculated to determine the strength of the
relationship between the post-test experimental groups’ variables. Table 4.6 presents the
descriptive indices for the Pearson bivariate correlations, post-test variables for the
experimental groups.
Table 4.6
Pearson Bivariate Correlations Post-test Variables Experimental Groups
Means SD r r2 df Sig. (2-tailed)
Pair 1 Control Learning Beliefs and Effort Regulation
5.90 5.42
1.17 1.13
0.337 0.114 43 0.024*
Pair 2 Control Learning Beliefs and Metacognitive Self-Regulation
5.90 4.05
1.17 0.97
0.484 0.234 43 0.001*
Pair 3 Control Learning Beliefs and Organization
5.90 3.15
1.17 1.55
0.459 0.211 43 0.002*
Pair 4 Control Learning Beliefs and Self-Efficacy
5.90 5.91
1.17 0.74
0.437 0.191 43 0.003*
Pair 5 Control Learning Beliefs and Task Value
5.90 6.08
1.17 0.92
0.521 0.271 43 0.000*
Pair 6 Control Learning Beliefs and Time and Study Environment
5.90 4.87
1.17 1.29
0.217 0.047 43 0.151
Pair 7 Effort Regulation and Metacognitive Self-Regulation
5.42 4.05
1.13 0.97
0.408 0.166 43 0.005*

77
Pair 8 Effort Regulation and Organization
5.42 3.15
1.13 1.55
0.354 0.125 43 0.017*
Pair 9 Effort Regulation and Self-Efficacy
5.42 5.91
1.13 0.74
0.530 0.281 43 0.000*
Pair 10 Effort Regulation and Task Value
5.42 6.08
1.13 0.92
0.330 0.109 43 0.027*
Pair 11 Effort Regulation and Time and Study Environment
5.42 4.87
1.13 1.29
0.561 0.315 43 0.000*
Pair 12 Metacognitive Self-Regulation and Organization
4.05 3.15
0.97 1.55
0.721 0.520 43 0.000*
Pair 13 Metacognitive Self-Regulation Self-Efficacy
4.05 5.91
0.97 0.74
0.347 0.120 43 0.019*
Pair 14 Metacognitive Self-Regulation and Task Value
4.05 6.08
0.97 0.92
0.374 0.140 43 0.011*
Pair 15 Metacognitive Self-Regulation and Time and Study Environment
4.05 4.87
0.97 1.29
0.311 0.097 43 0.038*
Pair 16 Organization and Self-Efficacy
3.15 5.91
1.55 0.74
0.211 0.045 43 0.163
Pair 17 Organization and Task Value
3.15 6.08
1.55 0.92
0.267 0.071 43 0.076
Pair 18 Organization and Time and Study Environment
3.15 4.87
1.55 1.29
0.342 0.117 43 0.021*
Pair 19 Self-Efficacy and Task Value
5.91 6.08
0.74 0.92
0.484 0.234 43 0.001*
Pair 20 Self-Efficacy and Time and Study Environment
5.91 4.87
0.74 1.29
0.358 0.128 43 0.016*
Pair 21 Task Value and Time and Study Environment
6.08 4.87
0.92 1.29
0.098 0.010 43 0.522
*p < .05 statistically significant

78
A Pearson bivariate correlation was calculated to determine the strength and
direction of the shared variation between the post-test variables, Control of Learning
Beliefs and Metacognitive Self-Regulation. Descriptive indices, including means and
standard deviations for the variables of interest were also calculated. The two variables
demonstrated a moderate positive correlation, r(43) = .484, p < .001. This indicates that
23.4% of the variance between the variables was shared, r2 = .234.
A Pearson bivariate correlation was calculated to determine the strength and
direction of the shared variation between the post-test variables, Control of Learning
Beliefs and Organization. Descriptive indices, including means and standard deviations
for the variables of interest were also calculated. The two variables demonstrated a
moderate positive correlation, r(43) = .459, p < .002. This indicates that 21.1% of the
variance between the variables was shared, r2 = .211.
A Pearson bivariate correlation was calculated to determine the strength and
direction of the shared variation between the post-test variables, Control of Learning
Beliefs and Self-Efficacy. Descriptive indices, including means and standard deviations
for the variables of interest were also calculated. The two variables demonstrated a
moderate positive correlation, r(43) = .437, p < .003. This indicates that 19.1% of the
variance between the variables was shared, r2 = .191.
A Pearson bivariate correlation was calculated to determine the strength and
direction of the shared variation between the post-test variables, Control of Learning
Beliefs and Task Value. Descriptive indices, including means and standard deviations for
the variables of interest were also calculated. The two variables demonstrated a moderate

79
positive correlation, r(43) = .521, p < .000. This indicates that 27.1% of the variance
between the variables was shared, r2 = .271.
A Pearson bivariate correlation was calculated to determine the strength and
direction of the shared variation between the post-test variables, Effort Regulation and
Metacognitive Self-Regulation. Descriptive indices, including means and standard
deviations for the variables of interest were also calculated. The two variables
demonstrated a moderate positive correlation, r(43) = .408, p < .005. This indicates that
16.6% of the variance between the variables was shared, r2 = .166.
A Pearson bivariate correlation was calculated to determine the strength and
direction of the shared variation between the post-test variables, Effort Regulation and
Self-Efficacy. Descriptive indices, including means and standard deviations for the
variables of interest were also calculated. The two variables demonstrated a moderate
positive correlation, r(43) = .530, p < .000. This indicates that 28.1% of the variance
between the variables was shared, r2 = .281.
A Pearson bivariate correlation was calculated to determine the strength and
direction of the shared variation between the post-test variables, Effort Regulation and
Time and Study Environment. Descriptive indices, including means and standard
deviations for the variables of interest were also calculated. The two variables
demonstrated a moderate positive correlation, r(43) = .561, p < .000. This indicates that
31.5% of the variance between the variables was shared, r2 = .315.
A Pearson bivariate correlation was calculated to determine the strength and
direction of the shared variation between the post-test variables, Metacognitive Self-
Regulation and Organization. Descriptive indices, including means and standard

80
deviations for the variables of interest were also calculated. The two variables
demonstrated a high positive correlation, r(43) = .721, p < .000. This indicates that
52.0% of the variance between the variables was shared, r2 = .520.
A Pearson bivariate correlation was calculated to determine the strength and
direction of the shared variation between the post-test variables, Self-Efficacy and Task
Value. Descriptive indices, including means and standard deviations for the variables of
interest were also calculated. The two variables demonstrated a moderate positive
correlation, r(43) = .484, p < .001. This indicates that 23.4% of the variance between the
variables was shared, r2 = .234.
Pearson bivariate correlations control groups.
Pearson bivariate correlations were calculated to determine the strength of the
relationship between the post-test control groups’ variables. Table 4.7 presents the
descriptive indices for the Pearson bivariate correlations, post-test variables for the
control groups.
Table 4.7 Pearson Bivariate Correlations Post-test Variables Control Groups
Means SD r r2 df Sig. (2-tailed)
Pair 1 Control Learning Beliefs and Effort Regulation
5.51 5.14
1.23 1.12
0.497 0.247 43 0.001*
Pair 2 Control Learning Beliefs and Metacognitive Self-Regulation
5.51 4.02
1.23 1.03
0.200 0.040 43 0.188
Pair 3 Control Learning Beliefs and Organization
5.51 3.28
1.23 1.32
0.120 0.014 43 0.431
Pair 4 Control Learning Beliefs and Self-Efficacy
5.51 6.08
1.23 0.85
0.571 0.326 43 0.000*
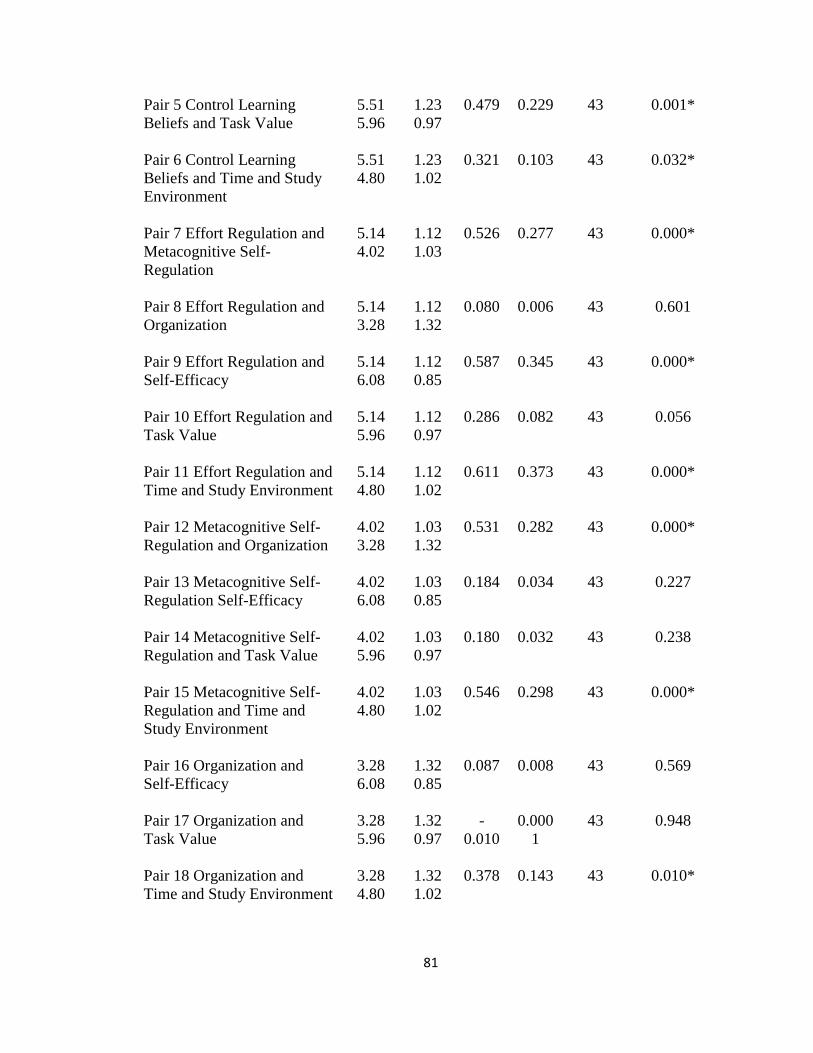
81
Pair 5 Control Learning Beliefs and Task Value
5.51 5.96
1.23 0.97
0.479 0.229 43 0.001*
Pair 6 Control Learning Beliefs and Time and Study Environment
5.51 4.80
1.23 1.02
0.321 0.103 43 0.032*
Pair 7 Effort Regulation and Metacognitive Self-Regulation
5.14 4.02
1.12 1.03
0.526 0.277 43 0.000*
Pair 8 Effort Regulation and Organization
5.14 3.28
1.12 1.32
0.080 0.006 43 0.601
Pair 9 Effort Regulation and Self-Efficacy
5.14 6.08
1.12 0.85
0.587 0.345 43 0.000*
Pair 10 Effort Regulation and Task Value
5.14 5.96
1.12 0.97
0.286 0.082 43 0.056
Pair 11 Effort Regulation and Time and Study Environment
5.14 4.80
1.12 1.02
0.611 0.373 43 0.000*
Pair 12 Metacognitive Self-Regulation and Organization
4.02 3.28
1.03 1.32
0.531 0.282 43 0.000*
Pair 13 Metacognitive Self-Regulation Self-Efficacy
4.02 6.08
1.03 0.85
0.184 0.034 43 0.227
Pair 14 Metacognitive Self-Regulation and Task Value
4.02 5.96
1.03 0.97
0.180 0.032 43 0.238
Pair 15 Metacognitive Self-Regulation and Time and Study Environment
4.02 4.80
1.03 1.02
0.546 0.298 43 0.000*
Pair 16 Organization and Self-Efficacy
3.28 6.08
1.32 0.85
0.087 0.008 43 0.569
Pair 17 Organization and Task Value
3.28 5.96
1.32 0.97
-0.010
0.0001
43 0.948
Pair 18 Organization and Time and Study Environment
3.28 4.80
1.32 1.02
0.378 0.143 43 0.010*

82
Pair 19 Self-Efficacy and Task Value
6.08 5.96
0.85 0.97
0.505 0.255 43 0.000*
Pair 20 Self-Efficacy and Time and Study Environment
6.08 4.80
0.85 1.02
0.159 0.025 43 0.297
Pair 21 Task Value and Time and Study Environment
5.96 4.80
0.97 1.02
0.074 0.005 43 0.627
*p < .05 statistically significant A Pearson bivariate correlation was calculated to determine the strength and
direction of the shared variation between the post-test variables, Control of Learning
Beliefs and Effort Regulation. Descriptive indices, including means and standard
deviations for the variables of interest were also calculated. The two variables
demonstrated a moderate positive correlation, r(43) = .497, p < .001. This indicates that
24.7% of the variance between the variables was shared, r2 = .247.
A Pearson bivariate correlation was calculated to determine the strength and
direction of the shared variation between the post-test variables, Control of Learning
Beliefs and Self-Efficacy. Descriptive indices, including means and standard deviations
for the variables of interest were also calculated. The two variables demonstrated a
moderate positive correlation, r(43) = .571, p < .000. This indicates that 32.6% of the
variance between the variables was shared, r2 = .326.
A Pearson bivariate correlation was calculated to determine the strength and
direction of the shared variation between the post-test variables, Control of Learning
Beliefs and Task Value. Descriptive indices, including means and standard deviations for
the variables of interest were also calculated. The two variables demonstrated a moderate
positive correlation, r(43) = .479, p < .001. This indicates that 22.9% of the variance
between the variables was shared, r2 = .229.

83
A Pearson bivariate correlation was calculated to determine the strength and
direction of the shared variation between the post-test variables, Effort Regulation and
Metacognitive Self-Regulation. Descriptive indices, including means and standard
deviations for the variables of interest were also calculated. The two variables
demonstrated a moderate positive correlation, r(43) = .526, p < .000. This indicates that
27.7% of the variance between the variables was shared, r2 = .277.
A Pearson bivariate correlation was calculated to determine the strength and
direction of the shared variation between the post-test variables, Effort Regulation and
Self-Efficacy. Descriptive indices, including means and standard deviations for the
variables of interest were also calculated. The two variables demonstrated a moderate
positive correlation, r(43) = .587, p < .000. This indicates that 34.5% of the variance
between the variables was shared, r2 = .345.
A Pearson bivariate correlation was calculated to determine the strength and
direction of the shared variation between the post-test variables, Effort Regulation and
Time and Study Environment. Descriptive indices, including means and standard
deviations for the variables of interest were also calculated. The two variables
demonstrated a moderate positive correlation, r(43) = .611, p < .000. This indicates that
37.3% of the variance between the variables was shared, r2 = .373.
A Pearson bivariate correlation was calculated to determine the strength and
direction of the shared variation between the post-test variables, Metacognitive Self-
Regulation and Organization. Descriptive indices, including means and standard
deviations for the variables of interest were also calculated. The two variables
84
demonstrated a moderate positive correlation, r(43) = .531, p < .000. This indicates that
28.2% of the variance between the variables was shared, r2 = .282.
A Pearson bivariate correlation was calculated to determine the strength and
direction of the shared variation between the post-test variables, Metacognitive Self-
Regulation and Time and Study Environment. Descriptive indices, including means and
standard deviations for the variables of interest were also calculated. The two variables
demonstrated a moderate positive correlation, r(43) = .546, p < .000. This indicates that
29.8% of the variance between the variables was shared, r2 = .298.
A Pearson bivariate correlation was calculated to determine the strength and
direction of the shared variation between the post-test variables, Self-Efficacy and Task
Value. Descriptive indices, including means and standard deviations for the variables of
interest were also calculated. The two variables demonstrated a moderate positive
correlation, r(43) = .505, p < .000. This indicates that 25.5% of the variance between the
variables was shared, r2 = .255.
Independent samples t-test.
An independent samples t-test was calculated to compare the post-test mean score
of the experimental and control MSLQ scale variables.
Table 4.8 presents the means, standard deviations, degrees of freedom, and
significance level for the results. Each of the independent samples t-test results had a
significance greater than .05 in Levene’s test for equality of variance, so the top row of
the SPSS data output was utilized in the reporting.

85
Table 4.8
Independent Samples Descriptive Statistics
Experimental Mean (SD)
(n = 45)
Control Mean (SD) (n = 45)
t df Sig.
Task Value
6.08 (0.92)
5.96 (0.97)
.585
88
.560
Control Learning Beliefs
5.90 (1.17) 5.51 (1.23) 1.54 88 .128
Self-Efficacy for Learning and Performance
5.91 (0.74) 6.08 (0.85) -.991 88 .325
Organization
3.15 (1.55) 3.28 (1.32) -.440 88 .661
Metacognitive Self-Regulation
4.05 (0.97) 4.02 (1.03) .130 88 .897
Time and Study Environment
4.87 (1.29) 4.80 (1.02) .261 88 .795
Effort Regulation
5.42 (1.13) 5.14 (1.12) 1.15 88 .254
Note. Responses to scale items were on a 7-point Likert scale, with responses ranging from 1 - not true at all of me to 7 - very true of me. *p < .05 statistically significant
An independent samples t-test was calculated comparing the post-test mean score
of the Task Value Scale for the experimental groups and the control groups. No
significant difference was found (t(88) = .585, p > .05). The mean of the experimental
groups (m = 6.08, SD = 0.92) was not significantly different from the mean of the control
groups (m = 5.96, SD = 0.97).
An independent samples t-test was calculated comparing the post-test mean score
of the Control of Learning Beliefs Scale for the experimental groups and the control
groups. No significant difference was found (t(88) = 1.54, p > .05). The mean of the

86
experimental groups (m = 5.90, SD = 1.17) was not significantly different from the mean
of the control groups (m = 5.51, SD = 1.23).
An independent samples t-test was calculated comparing the post-test mean score
of the Self-Efficacy for Learning and Performance Scale for the experimental groups and
the control groups. No significant difference was found (t(88) = -.991, p > .05). The
mean of the experimental groups (m = 5.91, SD = 0.74) was not significantly different
from the mean of the control groups (m = 6.08, SD = 0.85).
An independent samples t-test was calculated comparing the post-test mean score
of the Organization Scale for the experimental groups and the control groups. No
significant difference was found (t(88) = -.440, p > .05). The mean of the experimental
groups (m = 3.15, SD = 1.55) was not significantly different from the mean of the control
groups (m = 3.28, SD = 1.32).
An independent-samples t-test was calculated comparing the post-test mean score
of the Metacognitive Self-Regulation Scale for the experimental groups and the control
groups. No significant difference was found (t(88) = .130, p > .05). The mean of the
experimental groups (m = 4.05, SD = 0.97) was not significantly different from the mean
of the control groups (m = 4.02, SD = 1.03).
An independent samples t-test was calculated comparing the post-test mean score
of the Time and Study Environment Scale for the experimental groups and the control
groups. No significant difference was found (t(88) = .261, p > .05). The mean of the
experimental groups (m = 4.87, SD = 1.29) was not significantly different from the mean
of the control groups (m = 4.80, SD = 1.02).

87
An independent samples t-test was calculated comparing the post-test mean score
of the Effort Regulation Scale for the experimental groups and the control groups. No
significant difference was found (t(88) = .1.15, p > .05). The mean of the experimental
groups (m = 5.42, SD = 1.13) was not significantly different from the mean of the control
groups (m = 5.14, SD = 1.12).
Pearson bivariate correlations between experimental and control groups.
Pearson bivariate correlations were calculated to determine the strength of the
relationship between the post-test control groups and experimental groups’ variables.
There were two significant correlations found in the forty-nine calculations. Table 4.9
presents the results.

88
Table 4.9 Pearson Bivariate Correlations Experimental and Control Groups Post-Test
Post Control CLB
Post Exp. ER
Post Exp. MCSR
Post Exp. Org
Post Exp. Self-Eff. Post Exp.
Tsk Vle. Post Exp.
Time Study Post Exp.
Control Learning Beliefs .031 .135 .027 -.006 -.037 .143 .121 Effort Regulation .193 .181 -.069 .118 -.244 -.033 .150 Metacognitive Self-Reg. .094 -.129 -.027 .040 -.384* -.080 -.132 Organization -.006 -.180 .010 .028 -.078 -.046 -.062 Self-Efficacy .204 .053 .142 .002 .037 .184 .109 Task Value .002 -.164 .084 -.022 -.036 -.028 -.204 Time Study Environment .114 .042 .134 .338* -.222 -.111 -.235 *p < .05 statistically significant
88

89
Table 4.10 presents the descriptive indices for the Pearson bivariate correlations,
post-test variables for the two statistically significant correlations.
Table 4.10
Descriptive Indices for Statistically Significant Post-test Variables
Means SD r r2 df Sig. (2-tailed)
Pair 1 Metacognitive Self-Regulation control and Self-Efficacy experimental
4.02 5.91
1.03 0.74
-0.384 0.147 43 0.009*
Pair 2 Time and Study Environment control and Organization experimental
4.80 3.15
1.02 1.55
0.338 0.114 43 0.023*
*p < .05 statistically significant A Pearson bivariate correlation was calculated to determine the strength and
direction of the shared variation between the post-test variables, Metacognitive Self-
Regulation control and Self-Efficacy experimental. Descriptive indices, including means
and standard deviations for the variables of interest were also calculated. The two
variables demonstrated a low negative correlation, r(43) = -.384, p < .01. This indicates
that 14.7% of the variance between the variables was shared, r2 = .147.
A Pearson bivariate correlation was calculated to determine the strength and
direction of the shared variation between the post-test variables, Time and Study
Environment control and Organization experimental. Descriptive indices, including
means and standard deviations for the variables of interest were also calculated. The two
variables demonstrated a low positive correlation, r(43) = .338, p < .05. This indicates
that 11.4% of the variance between the variables was shared, r2 = .114.

90
Analysis of Skill Level Likert-Type Scale Data
After data was collected, numbers from each subject’s Skill Level Likert-type
Scale questionnaire were entered into an excel spreadsheet and mean scores for each of
the five subscales used in the study was calculated for each subject. The subscale means
for each person was entered into statistical analysis software (SPSS, version 17). Paired
sample t-tests were calculated for each subscale variable at the 95% confidence interval.
Additionally, paired sample correlations, means, standard deviations, and Pearson
bivariate correlations between the variables were calculated. Following the analysis of
paired sample t-tests, independent samples t-tests were calculated between the
experimental and the control groups to compare post-test means. Means, standard
deviations, and Pearson bivariate correlations between the variables were also calculated.
Paired sample t-test experimental groups.
Table 4.11 presents the means, standard deviations, and pre- and post-test
correlations with corresponding significance of the pre- and post-test scales for the
experimental groups.

91
Table 4.11
Paired Sample Descriptive Statistics Experimental Groups
Pre-Test Mean (SD) (n = 45)
Post-Test Mean (SD) (n = 45)
Pre & Post Correlations
Significance
Ability
2.13 (0.79)
1.87 (0.76)
0.260
0.850
Comfort
2.71 (0.82) 2.31 (0.67) 0.628 0.000*
Motivation
1.80 (0.79) 2.22 (0.74) 0.315 0.035*
Organization
2.33 (0.74) 2.47 (0.99) 0.311 0.038*
Proficiency
2.82 (0.78) 2.42 (0.62) 0.489 0.001*
Note. Responses to scale items were on a 5-point Likert-type scale, with responses ranging from 1 – very high to 5 - very low. *p < .05 statistically significant
Table 4.12 presents paired differences descriptive statistics for the pre- and post-
test scales of the experimental groups.

92
Table 4.12 Paired Sample Paired Differences Experimental Groups
Paired Differences
Mean SD Std. Error Mean
95% CI
Lower
95% CI
Upper
t df Sig (2-tailed)
Pair 1 Pre/Post Ability
0.267
0.94
0.14
-0.15
0.55
1.905
44
.063
Pair 2 Pre/Post Comfort
0.400
0.65
0.10
0.20
0.60
4.105
44
.000*
Pair 3 Pre/Post Motivation
-
0.422
0.89
0.13
-0.69
-0.15
-3.177
44
.003*
Pair 4 Pre/Post Organization
-
0.133
1.04
0.15
-0.44
0.18
-0.864
44
.393
Pair 5 Pre/Post Proficiency
0.400
0.72
0.11
0.18
0.62
3.728
44
.001*
*p < .05 statistically significant A paired sample t-test was calculated to compare the mean of the pre- and post-
test results of the experimental groups’ Ability scale. Descriptive indices, including
paired sample correlations, means and standard deviations for the variables of interest
were also calculated. For the Ability scale, results were not statistically significant at the
95% confidence level, t(44) = 1.905, p > .05. Paired sample correlations revealed no
significant correlation (r = .26, p < .085) between Ability pre-test and Ability post-test.
A paired sample t-test was calculated to compare the mean of the pre- and post-
test results of the experimental groups’ Comfort scale. Descriptive indices, including
paired sample correlations, means and standard deviations for the variables of interest
were also calculated. For the Comfort scale, results were statistically significant at the
93
95% confidence level, t(44) = 4.105, p < .05. Paired sample correlations revealed a
significant positive correlation (r = .628, p < .000) between Comfort pre-test and Comfort
post-test.
A paired sample t-test was calculated to compare the mean of the pre- and post-
test results of the experimental groups’ Motivation scale. Descriptive indices, including
paired sample correlations, means and standard deviations for the variables of interest
were also calculated. For the Motivation scale, results were statistically significant at the
95% confidence level, t(44) = -3.177, p < .05. Paired sample correlations revealed a
significant positive correlation (r = .315, p < .035) between Motivation pre-test and
Motivation post-test.
A paired sample t-test was calculated to compare the mean of the pre- and post-
test results of the experimental groups’ Organization scale. Descriptive indices,
including paired sample correlations, means and standard deviations for the variables of
interest were also calculated. For the Organization scale, results were not statistically
significant at the 95% confidence level, t(44) = -0.864, p > .05. Paired sample
correlations revealed a significant positive correlation (r = .311, p < .038) between
Organization pre-test and Organization post-test.
A paired sample t-test was calculated to compare the mean of the pre- and post-
test results of the experimental groups’ Proficiency scale. Descriptive indices, including
paired sample correlations, means and standard deviations for the variables of interest
were also calculated. For the Proficiency scale, results were statistically significant at the
95% confidence level, t(44) = 3.728, p < .05. Paired sample correlations revealed a

94
significant positive correlation (r = .486, p < .001) between Proficiency pre-test and
Proficiency post-test.
Paired sample t-test control groups.
Table 4.13 presents the means, standard deviations, and pre- and post-test
correlations with corresponding significance of the pre- and post-test scales for the
control groups.
Table 4.13
Paired Sample Descriptive Statistics Control Groups
Pre-Test Mean (SD) (n = 45)
Post-Test Mean (SD) (n = 45)
Pre & Post Correlations
Significance
Ability
1.98 (0.72)
1.71 (0.69)
0.485
0.001*
Comfort
2.82 (0.58) 2.49 (0.59) 0.531 0.000*
Motivation
1.80 (0.76) 2.24 (0.83) 0.333 0.025*
Organization
2.18 (0.68) 2.33 (0.85) 0.403 0.006*
Proficiency
2.82 (0.53) 2.51 (0.63) 0.617 0.000*
Note. Responses to scale items were on a 5-point Likert-type scale, with responses ranging from 1 – very high to 5 - very low. *p < .05 statistically significant
Table 4.14 presents paired differences descriptive statistics for the pre- and post-
test scales of the control groups.

95
Table 4.14 Paired Sample Paired Differences Control Groups
Paired Differences
Mean SD Std. Error Mean
95% CI
Lower
95% CI
Upper
t df Sig (2-tailed)
Pair 1 Pre/Post Ability
0.267
0.72
0.11
0.05
0.48
2.485
44
.017*
Pair 2 Pre/Post Comfort
0.333
0.56
0.08
0.16
0.50
3.964
44
.000*
Pair 3 Pre/Post Motivation
-0.444
0.92
0.14
-0.72
-0.17
-3.246
44
.002*
Pair 4 Pre/Post Organization
-0.155
0.85
0.13
-0.41
0.10
-1.225
44
.227
Pair 5 Pre/Post Proficiency
0.311
0.51
0.08
0.16
0.47
4.057
44
.000*
*p < .05 statistically significant
A paired sample t-test was calculated to compare the mean of the pre- and post-
test results of the control groups’ Ability scale. Descriptive indices, including paired
sample correlations, means and standard deviations for the variables of interest were also
calculated. For the Ability scale, results were statistically significant at the 95%
confidence level, t(44) = 2.485, p < .05. Paired sample correlations revealed a significant
correlation (r = .485, p < .001) between Ability pre-test and Ability post-test.
A paired sample t-test was calculated to compare the mean of the pre- and post-
test results of the control groups’ Comfort scale. Descriptive indices, including paired
sample correlations, means and standard deviations for the variables of interest were also
calculated. For the Comfort scale, results were statistically significant at the 95%
96
confidence level, t(44) = 3.964, p < .05. Paired sample correlations revealed a significant
positive correlation (r = .531, p < .000) between Comfort pre-test and Comfort post-test.
A paired sample t-test was calculated to compare the mean of the pre- and post-
test results of the control groups’ Motivation scale. Descriptive indices, including paired
sample correlations, means and standard deviations for the variables of interest were also
calculated. For the Motivation scale, results were statistically significant at the 95%
confidence level, t(44) = -3.246, p < .05. Paired sample correlations revealed a
significant positive correlation (r = .333, p < .025) between Motivation pre-test and
Motivation post-test.
A paired sample t-test was calculated to compare the mean of the pre- and post-
test results of the control groups’ Organization scale. Descriptive indices, including
paired sample correlations, means and standard deviations for the variables of interest
were also calculated. For the Organization scale, results were not statistically significant
at the 95% confidence level, t(44) = -1.225, p > .05. Paired sample correlations revealed
a significant positive correlation (r = .403, p < .006) between Organization pre-test and
Organization post-test.
A paired sample t-test was calculated to compare the mean of the pre- and post-
test results of the control groups’ Proficiency scale. Descriptive indices, including paired
sample correlations, means and standard deviations for the variables of interest were also
calculated. For the Proficiency scale, results were statistically significant at the 95%
confidence level, t(44) = 4.057, p < .05. Paired sample correlations revealed a significant
positive correlation (r = .617, p < .000) between Proficiency pre-test and Proficiency
post-test.

97
Pearson bivariate correlations experimental groups.
Pearson bivariate correlations were calculated to determine the strength and
direction of the shared variation between pairs of post-test variables for the experimental
groups. Descriptive indices, including means and standard deviations for the pairs of
variables were also calculated.
Based on the results, only the pairings of Ability/Proficiency (r2 = 0.259) and
Motivation/Organization (r2 = 0.364) demonstrated that more than 25% of the variance
was attributed to differences between the two variables. Table 4.15 presents the
descriptive indices for the Pearson bivariate correlations, post-test variables for the
experimental groups.
Table 4.15 Pearson Bivariate Correlations Post-test Variables Experimental Groups
Means SD r r2 % of variance
df Sig (2-
tailed) Pair 1 Ability and Comfort
1.87 2.31
0.76 0.67
0.097 0.009 0.9% 43 0.532
Pair 2 Ability and Motivation
1.87 2.22
0.76 0.74
0.177 0.031 3.1% 43 0.245
Pair 3 Ability and Organization
1.87 2.47
0.76 0.99
0.327 0.107 10.7% 43 0.028*
Pair 4 Ability and Proficiency
1.87 2.42
0.76 0.62
0.509 0.259 25.9% 43 0.000*
Pair 5 Comfort and Motivation
2.31 2.22
0.67 0.74
-0.185 0.034 3.4% 43 0.228
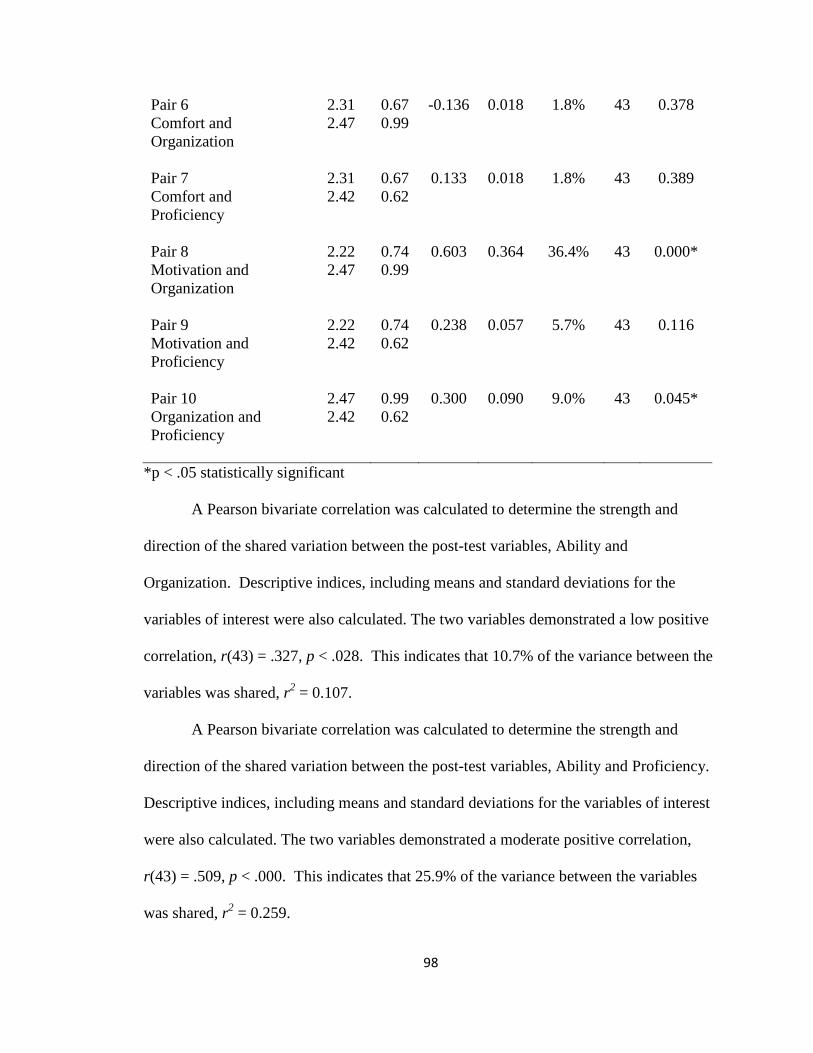
98
Pair 6 Comfort and Organization
2.31 2.47
0.67 0.99
-0.136 0.018 1.8% 43 0.378
Pair 7 Comfort and Proficiency
2.31 2.42
0.67 0.62
0.133 0.018 1.8% 43 0.389
Pair 8 Motivation and Organization
2.22 2.47
0.74 0.99
0.603 0.364 36.4% 43 0.000*
Pair 9 Motivation and Proficiency
2.22 2.42
0.74 0.62
0.238 0.057 5.7% 43 0.116
Pair 10 Organization and Proficiency
2.47 2.42
0.99 0.62
0.300 0.090 9.0% 43 0.045*
*p < .05 statistically significant
A Pearson bivariate correlation was calculated to determine the strength and
direction of the shared variation between the post-test variables, Ability and
Organization. Descriptive indices, including means and standard deviations for the
variables of interest were also calculated. The two variables demonstrated a low positive
correlation, r(43) = .327, p < .028. This indicates that 10.7% of the variance between the
variables was shared, r2 = 0.107.
A Pearson bivariate correlation was calculated to determine the strength and
direction of the shared variation between the post-test variables, Ability and Proficiency.
Descriptive indices, including means and standard deviations for the variables of interest
were also calculated. The two variables demonstrated a moderate positive correlation,
r(43) = .509, p < .000. This indicates that 25.9% of the variance between the variables
was shared, r2 = 0.259.

99
A Pearson bivariate correlation was calculated to determine the strength and
direction of the shared variation between the post-test variables, Motivation and
Organization. Descriptive indices, including means and standard deviations for the
variables of interest were also calculated. The two variables demonstrated a moderate
positive correlation, r(43) = .603, p < .000. This indicates that 36.4% of the variance
between the variables was shared, r2 = 0.364.
A Pearson bivariate correlation was calculated to determine the strength and
direction of the shared variation between the post-test variables, Organization and
Proficiency. Descriptive indices, including means and standard deviations for the
variables of interest were also calculated. The two variables demonstrated a low positive
correlation, r(43) = .300, p < .045. This indicates that 9.0% of the variance between the
variables was shared, r2 = 0.090.
Pearson bivariate correlations control groups.
Pearson bivariate correlations were calculated to determine the strength and
direction of the shared variation between pairs of post-test variables for the control
groups.
Based on the results, only the pairings of Ability/Organization (r2 = 0.261),
Comfort/Proficiency (r2 = 0.719) and Motivation/Organization (r2 = 0.469) demonstrated
that more than 25% of the variance was attributed to differences between the two
variables. Table 4.16 presents the descriptive indices for the Pearson bivariate
correlations, post-test variables for the control groups.

100
Table 4.16 Pearson Bivariate Correlations Post-test Variables Control Groups
Means SD r r2 % of variance
df Sig (2-tailed)
Pair 1 Ability and Comfort
1.71 2.49
0.69 0.59
0.298 0.089 8.9% 43 0.047*
Pair 2 Ability and Motivation
1.71 2.24
0.69 0.83
0.440 0.194 19.4% 43 0.002*
Pair 3 Ability and Organization
1.71 2.33
0.69 0.85
0.511 0.261 26.1% 43 0.000*
Pair 4 Ability and Proficiency
1.71 2.51
0.69 0.63
0.399 0.159 15.9% 43 0.007*
Pair 5 Comfort and Motivation
2.49 2.24
0.59 0.83
0.355 0.126 12.6% 43 0.017*
Pair 6 Comfort and Organization
2.49 2.33
0.59 0.85
0.392 0.154 15.4% 43 0.008*
Pair 7 Comfort and Proficiency
2.49 2.51
0.59 0.63
0.848 0.719 71.9% 43 0.000*
Pair 8 Motivation and Organization
2.24 2.33
0.83 0.85
0.685 0.469 46.9% 43 0.000*
Pair 9 Motivation and Proficiency
2.24 2.51
0.83 0.63
0.323 0.104 10.4% 43 0.031*
Pair 10 Organization and Proficiency
2.33 2.51
0.85 0.63
0.355 0.126 12.6% 43 0.017*
*p < .05 statistically significant

101
A Pearson bivariate correlation was calculated to determine the strength and
direction of the shared variation between the post-test variables, Ability and Motivation.
Descriptive indices, including means and standard deviations for the variables of interest
were also calculated. The two variables demonstrated a moderate positive correlation,
r(43) = .440, p < .002. This indicates that 19.4% of the variance between the variables
was shared, r2 = 0.194.
A Pearson bivariate correlation was calculated to determine the strength and
direction of the shared variation between the post-test variables, Ability and
Organization. Descriptive indices, including means and standard deviations for the
variables of interest were also calculated. The two variables demonstrated a moderate
positive correlation, r(43) = .511, p < .000. This indicates that 26.1% of the variance
between the variables was shared, r2 = 0.261.
A Pearson bivariate correlation was calculated to determine the strength and
direction of the shared variation between the post-test variables, Ability and Proficiency.
Descriptive indices, including means and standard deviations for the variables of interest
were also calculated. The two variables demonstrated a moderate positive correlation,
r(43) = .399, p < .007. This indicates that 15.9% of the variance between the variables
was shared, r2 = 0.159.
A Pearson bivariate correlation was calculated to determine the strength and
direction of the shared variation between the post-test variables, Comfort and
Organization. Descriptive indices, including means and standard deviations for the
variables of interest were also calculated. The two variables demonstrated a moderate

102
positive correlation, r(43) = .392, p < .008. This indicates that 15.4% of the variance
between the variables was shared, r2 = 0.154.
A Pearson bivariate correlation was calculated to determine the strength and
direction of the shared variation between the post-test variables, Comfort and
Proficiency. Descriptive indices, including means and standard deviations for the
variables of interest were also calculated. The two variables demonstrated a high positive
correlation, r(43) = .848, p < .000. This indicates that 71.9% of the variance between the
variables was shared, r2 = 0.719.
A Pearson bivariate correlation was calculated to determine the strength and
direction of the shared variation between the post-test variables, Motivation and
Organization. Descriptive indices, including means and standard deviations for the
variables of interest were also calculated. The two variables demonstrated a moderate
positive correlation, r(43) = .685, p < .000. This indicates that 46.9% of the variance
between the variables was shared, r2 = 0.469.
Independent samples t-test.
An independent samples t-test was calculated to compare the post-test mean score
of the experimental groups and control groups Skill Level Likert-type Scale variables.
Table 4.17 presents the means, standard deviations, degrees of freedom, and
significance level for the results. Each of the independent samples t-test results had a
significance greater than .05 in Levene’s test for equality of variance, so the top row of
data was utilized in the reporting.

103
Table 4.17
Independent Samples Descriptive Statistics
Experimental Mean (SD) (n = 45)
Control Mean (SD) (n = 45)
t df Sig.
Ability
1.87 (0.76)
1.71 (0.69)
1.02
88
.313
Comfort
2.31 (0.67) 2.49 (0.59) -1.34 88 .184
Motivation
2.22 (0.74) 2.24 (0.83) -.134 88 .893
Organization
2.47 (0.99) 2.33 (0.85) .684 88 .496
Proficiency
2.42 (0.62) 2.51 (0.63) -.676 88 .501
Note. Responses to scale items were on a 5-point Likert-type scale, with responses ranging from 1 – very high to 5 - very low. *p < .05 statistically significant
An independent samples t-test was calculated comparing the post-test mean score
of the Ability Scale for the experimental groups and the control groups. No significant
difference was found (t(88) = 1.02, p > .05). The mean of the experimental groups
(m = 1.87, SD = 0.76) was not significantly different from the mean of the control groups
(m = 1.71, SD = 0.69).
An independent samples t-test was calculated comparing the post-test mean score
of the Comfort Scale for the experimental groups and the control groups. No significant
difference was found (t(88) = -1.34, p > .05). The mean of the experimental groups
(m = 2.31, SD = 0.67) was not significantly different from the mean of the control groups
(m = 2.49, SD = 0.59).
An independent samples t-test was calculated comparing the post-test mean score
of the Motivation Scale for the experimental groups and the control groups. No
significant difference was found (t(88) = -.134, p > .05). The mean of the experimental

104
groups (m = 2.22, SD = 0.74) was not significantly different from the mean of the control
groups (m = 2.24, SD = 0.83).
An independent samples t-test was calculated comparing the post-test mean score
of the Organization Scale for the experimental groups and the control groups. No
significant difference was found (t(88) = .684, p > .05). The mean of the experimental
groups (m = 2.47, SD = 0.99) was not significantly different from the mean of the control
groups (m = 2.33, SD = 0.85).
An independent samples t-test was calculated comparing the post-test mean score
of the Proficiency Scale for the experimental groups and the control groups. No
significant difference was found (t(88) = -.676, p > .05). The mean of the experimental
groups (m = 2.42, SD = 0.62) was not significantly different from the mean of the control
groups (m = 2.51, SD = 0.63).
Pearson bivariate correlations experimental and control groups.
Pearson bivariate correlations were calculated to determine the strength of the
relationship between the post-test experimental groups and control groups variables.
There were zero significant correlations found in the twenty-five correlations. Table 4.18
presents the results.
Table 4.18 Pearson Bivariate Correlations Experimental and Control Groups Post-test
Ability
Post Exp. Comfort Post Exp.
Motivation Post Exp.
Org. Post Exp.
Proficiency Post Exp.
Ability Post Control -.118 .002 .084 .002 -.132 Comfort Post Control .150 -.107 .058 .068 .044 Motivation Post Control -.128 -.058 .207 .079 -.072 Organization Post Control -.106 -.266 .060 .081 -.186 Proficiency Post Control .099 -.063 -.055 -.064 .017

105
Analysis of Open-Ended Short Answer Question Data
Experimental groups pre-test self-assessment.
All participants were asked the following question during the pre-test data
collection process: How do you plan to organize your time and study environment for
this course? Table 4.19 summarizes the responses of the experimental groups. The data
is summarized via categorized responses. Totals exceed the number of participants due
to multiple responses by participants. One of forty-five participants offered no response.
Table 4.19
Experimental Groups Pre-Test Question Summary
Response Number Mentioned Percent Mentioned (out of 44 responses)
Time – Calendar/Planner/Schedule 14 32%
Time – Due Dates 2 5%
Time – Early 5 11%
Time - Daily 5 11%
Time – Time Blocks 7 16%
Time – Free Time 11 25%
Time – No Plans/Other 8 18%
Study Environment – Home 6 14%
Study Environment – School 5 11%
Study Environment – Other 4 9%
Time – Calendar/Planner/Schedule Responses included the following. “I also
have scheduled specific study/work times planned into my weekly schedule.” “I have set
study hall time during the week to do my work.” “Make a study schedule to give me
106
enough time to take in all the material.” “I have a marker board at home where I plan out
each week to do homework, study and work.” “I plan to keep track of all of my
assignments in my planner and then mark them off as I have competed them.” And “Use
of a planner and computer lab time.”
Time – Due Date Responses included the following. “Doing everything on time at
school.” And “Do the work and practice the skill before it is due.”
Time – Early Responses included the following. “I want to complete assignments
well before they are due so may work is complete and not rushed.” “Get the homework
done as soon as it is given so I don’t forget about it.” “I try to complete assignments as
early as possible so I’m not rushing to finish, and so I can be thorough and take my time.”
And “I will organize my time by making sure I give myself plenty of time to complete
assignments.”
Time – Daily Responses included the following. “I will dedicate some time each
day to working on this class work.” “I plan to do the same thing I do with other classes,
set aside time each day to complete any assignments or reading.” “Do a bit of homework
each night instead of leaving it all to do the night before it is due.” “I keep a couple of
hours of my day free to do my homework.” And “I try to set aside at least 30 minutes to
an hour each day for each class I am in.”
Time – Time Blocks Responses included the following. “I tend to study at least an
hour a week in a quiet room.” “With busy work schedule and personal/family life all
school work will be done during the only available time slots, weekends and late nights.”
“Devote the night before class to review the chapter and work on weekly assignments.”

107
And “By setting certain times aside especially for this class so that I may study the
information to help me succeed for this course.”
Time – Free Time Responses included the following. “Take each day as it comes
and utilize my free time in order to effectively and efficiently study.” “I’m taking 24
hours so I have a very strict time allotment. I try to use my free time for studying.” And
“The same as any other course, do the assigned work and study for tests during my time
at my place.”
Time – No Plans/Other Responses included the following. “Attend class daily and
keep on top of homework.” “I plan to use all available technology at my disposal to
complete this class.” And “I plan to take accurate notes and save them for class use and
later use.”
Study Environment – Home Responses included the following. “I will do all my
studying between potty training, fixing snacks and meals, and sharing the arm of my
chair with my 3 year old…” “Most of my studying will be done in my chair at my desk
reading the materials.” And “Since much of this course is done on the computer, I will do
most of my work on my laptop at home or on the school computers during breaks.”
Study Environment – School Responses included the following. “Doing
everything on time at school.” “I plan to finish as much as I can in class and with the
remaining work that needs to be done, I plan on going to the computer lab after all my
classes to finish the assignments.” And “Use of a planner and computer lab time.”
Study Environment – Other Responses included the following. “Proper use of
D2L, my laptop and travel time on the bus from A to B.” “I study in environments in

108
which I feel the most comfortable and appropriate for the topic at hand.” And “I have set
study hall time during the week to do my work.” (D2L is the online course platform.)
Experimental groups post-test self-assessment.
All participants were asked the following question during the post-test data
collection process: Was there anything you learned or experienced in this course that
helped you to organize your time and study environment for this class? The data is
summarized via categorized responses. Totals exceed the number of participants due to
multiple responses by participants. Nine of the forty-five participants offered no
response. Table 4.20 summarizes responses.
Table 4.20
Experimental Groups Post-Test Question Summary
Response Number Mentioned Percent Mentioned (out of 36 responses)
Online Calendar 10 28%
D2L Online Calendar 4 11%
iGoogle™ 6 17%
Remember the Milk 2 6%
General Comments 3 8%
Microsoft Office 6 17%
Time Management 3 8%
Did not learn anything useful 5 14%
Online Calendar Responses included the following. “The online Google calendar
and to-do lists.” “The calendar activities have been helpful.” “All of the sites we were
given with calendars and information really helped me focus and organize.” “Calendars
109
are a great way to organize either one or more classes.” And “…the use of the class
calendar was a great help! I wish all teachers used it.”
D2L Online Calendar Responses included the following. ““The calendar on D2L
was very helpful.” “As the course went on, I learned to actually check the D2L website
every day in order to stay on top of the class.” “I liked having the calendar on D2L. It
was very helpful having the instructor post deadlines. I found it easier to manage the
content by the way it was outlined for me in the content section of D2L. I really wish
more professors used D2L to its full advantage, like this class.”
iGoogle™ Responses included the following. “iGoogle™ was useful.”
“iGoogle™ helped me so much!” “iGoogle™ has helped me with organizing what needs
to be done in the future.” “The set-up of our iGoogle™.”
Remember the Milk Responses included the following. “I learned about various
calendars and reminder software. I really liked the jeopardy game creation. I will use it
in the future. iGoogle™ and Remember the Milk were good as well.” “I learned about
Remember the Milk but I stuck with my familiar excel spreadsheet method. However,
the use of the class calendar was a great help! I wish all teachers used it.”
General Online Comments Responses included the following. “A few
organizational sites were shown, which would be great for persons who spend vast
amounts of time on the computer/Internet.” “Many of the links were helpful to me in
finding good things to use for organization and other topics.”
Microsoft Office Responses included the following. “Yes, I learned how to use
Excel which will help me organize several things in the future.” “I learned how to use
Excel to calculate grades for me.” “Learning all the programs and their uses really
110
helped conserve time. Like using Publisher instead of trying to use Word in difficult
ways.”
Time Management Responses included the following. “I learned that
procrastination is a problem, and I need to manage my time better.” “I learned that
computers are problematic and it’s important to finish things before the last minute so
these problems can be corrected if needed.”
Did Not Learn Anything Useful Responses included the following. “We learned
ways, but none that I would use.” “Not really, just skills that I learned through my
scholastic career.” “Everything I learn in this class I tend to forget about a week later.”
Control groups pre-test self-assessment.
All participants were asked the following question during the pre-test data
collection process: How do you plan to organize your time and study environment for
this course? The following summarizes the responses of the control groups. The data is
summarized via categorized responses. Totals exceed the number of participants due to
multiple responses by participants. Table 4.21 summarizes the responses.

111
Table 4.21
Control Groups Pre-Test Question Summary
Response Number Mentioned Percent Mentioned (out of 45)
Time - Calendar/Planner/Schedule
7 16%
Time – Due Dates 11 24%
Time – Early 6 13%
Time - Daily 3 7%
Time – Time Blocks 8 18%
Time – Free Time 2 4%
Time – No Plans/Other 9 20%
Study Environment – Home 11 24%
Study Environment – School 4 9%
Study Environment – Other 7 16%
Time – Calendar/Planner/Schedule Responses included the following. “I will
organize my time by marking specific times in my day planner to study and do activities
for this course.” “Make lists of when I need to get things done, keep track of assignments
in my planner, and do the work/study when necessary for me to get done in time.” “I plan
to write in my planner for reading and studying time and I plan on checking D2L every
day for new assignments.” “Don’t overwhelm myself with too many classes. Set
scheduled times and places to study.”
Time – Due Date Responses included the following. “Finish quizzes and other
assignments by the specified deadline.” “I’m going to make sure everything is turned in,
so in order to do that, I must not forget due dates.” “Read the chapters before quizzes.” “I

112
plan to organize my time by keeping up with the assignments. I will do the assignments
when it is given.” And “Make sure I complete all of my online quizzes at home and on
time.”
Time – Early Responses included the following. “I will work on my assignments
and prepare for projects as early as possible.” “I will plan for all assignments ahead of
time and use my skills that I have accrued so far in technology.” “Manage time by
completing all assignments and quizzes on time or ahead of schedule.” And “Making sure
I do all my quizzes and assignments before the due dates.”
Time – Daily Responses included the following. “I set time aside each day for a
few minutes to do work for this class. As I do for all of my classes.” “Evenings during
free time on computer.” And “I plan to take time every day to check D2L to look and
make sure all my assignments are done or that I have worked on them.”
Time – Time Blocks Responses included the following. “I plan to organize my
time appropriately in order to have time to study the necessary hours required to pass and
highly succeed in this course.” “Set 3 hours aside of work time for each class session.” “I
plan to set aside a certain amount of time per week to study and complete assignments for
this course.” And “Set aside a certain amount of time a week in which to read over
material. Add extra time near exams, quizzes or tests.”
Time – Free Time Responses included the following. “I do not have a job which
leaves all my spare time available to studying.” And “Evenings during free time on
computer.”
Time – No Plans/Other Responses included the following. “Just have a quiet
environment to complete the assignments and study in.” “As best I can, because

113
unfortunately, I am in 20 hours this semester.” “I have no plans to organize my time. I
know the course requirements and deadlines and can get things done.” “I need to stay on
top of things because I have a job as well.” And “Make sure I keep track of when my
assignments are due and give myself accurate time to complete them."
Study Environment – Home Responses included the following. “”My primary
study environment will be my home.” “My study environment is set up in a spare room
where I can isolate myself while doing my work.” “Do the assignments when they are
assigned at my house.” “I plan on getting everything done on time by doing it at home
when I am finished with the 19 hours of credit I took on this semester.” And “Make sure I
complete all of my online quizzes at home and on time.”
Study Environment – School Responses included the following. “I plan to
organize my study environment by having my apartment quiet or going someplace quiet
on campus.” “Usually work on my laptop in my room or library.” And “I plan to study in
my room or in a quiet part of the library.”
Study Environment – Other Responses included the following. “I plan to study in
an environment that works best for me.” “Don’t overwhelm myself with too many
classes. Set scheduled times and places to study.” “Quiet environment where I can
study.” And “I like to study in quiet areas where I can concentrate on the materials.”
Control groups post-test self-assessment.
All participants were asked the following question during the post-test data
collection process: Was there anything you learned or experienced in this course that
helped you to organize your time and study environment for this class? Table 4.22
summarizes the responses of the control groups. The data is summarized via categorized
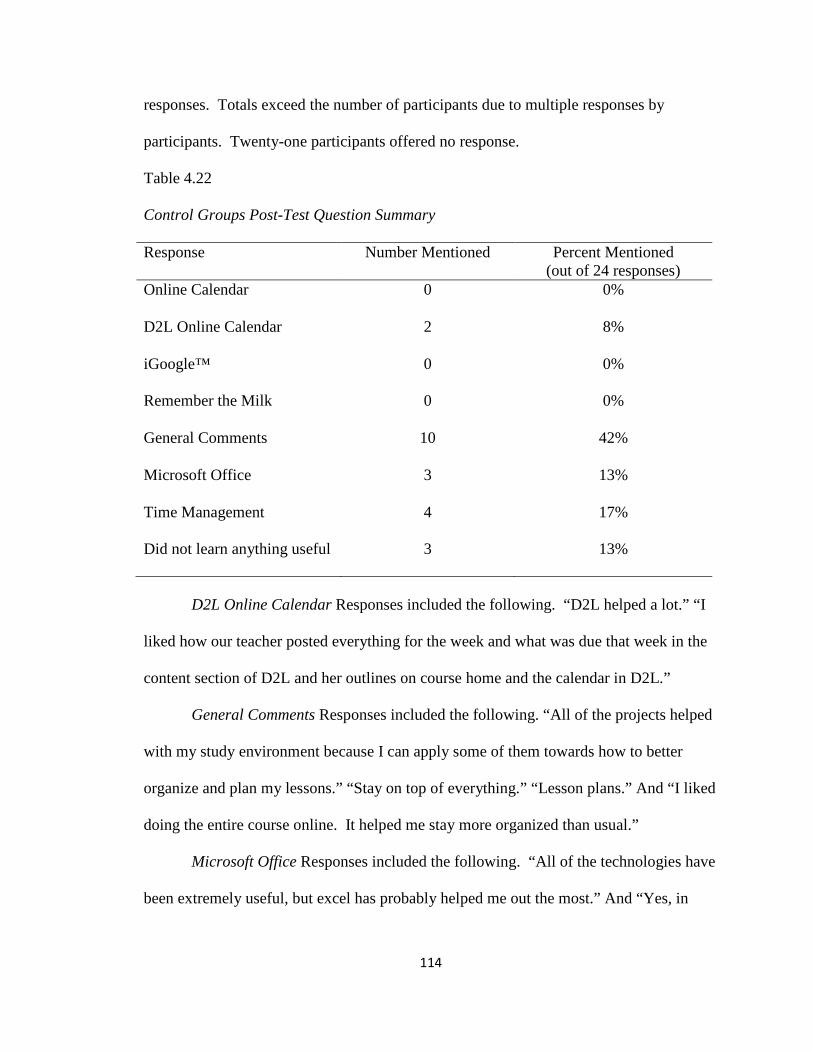
114
responses. Totals exceed the number of participants due to multiple responses by
participants. Twenty-one participants offered no response.
Table 4.22
Control Groups Post-Test Question Summary
Response Number Mentioned Percent Mentioned (out of 24 responses)
Online Calendar 0 0%
D2L Online Calendar 2 8%
iGoogle™ 0 0%
Remember the Milk 0 0%
General Comments 10 42%
Microsoft Office 3 13%
Time Management 4 17%
Did not learn anything useful 3 13%
D2L Online Calendar Responses included the following. “D2L helped a lot.” “I
liked how our teacher posted everything for the week and what was due that week in the
content section of D2L and her outlines on course home and the calendar in D2L.”
General Comments Responses included the following. “All of the projects helped
with my study environment because I can apply some of them towards how to better
organize and plan my lessons.” “Stay on top of everything.” “Lesson plans.” And “I liked
doing the entire course online. It helped me stay more organized than usual.”
Microsoft Office Responses included the following. “All of the technologies have
been extremely useful, but excel has probably helped me out the most.” And “Yes, in
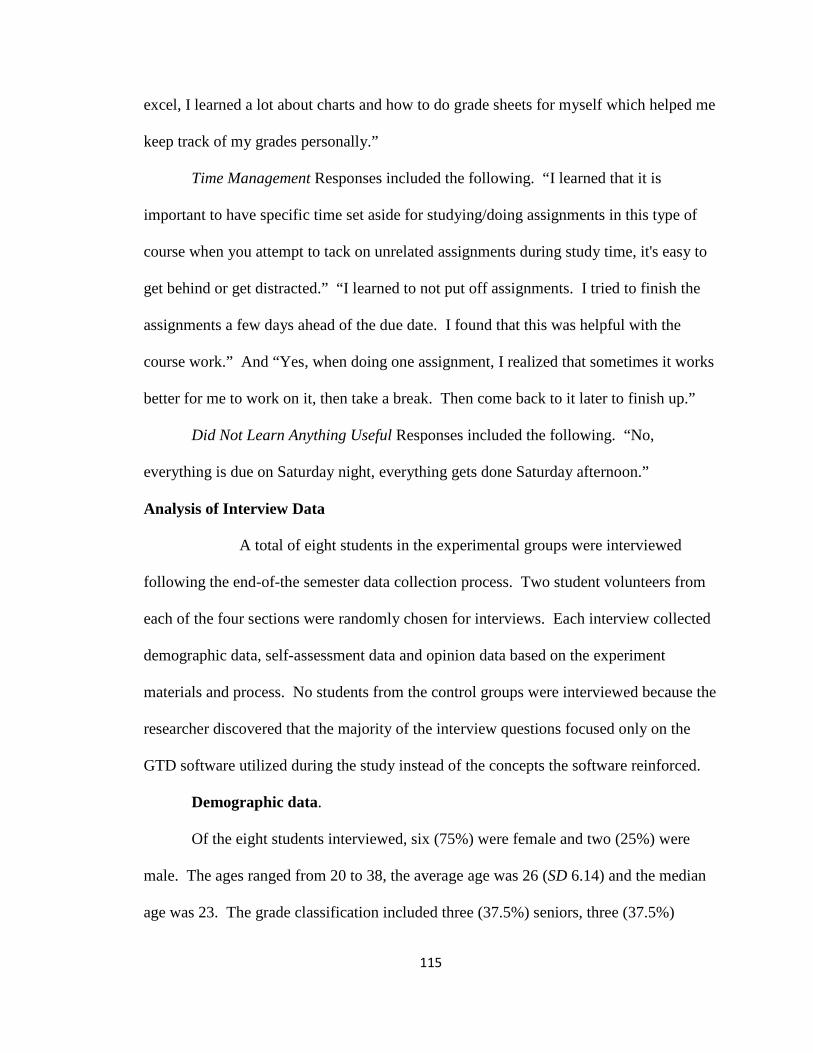
115
excel, I learned a lot about charts and how to do grade sheets for myself which helped me
keep track of my grades personally.”
Time Management Responses included the following. “I learned that it is
important to have specific time set aside for studying/doing assignments in this type of
course when you attempt to tack on unrelated assignments during study time, it's easy to
get behind or get distracted.” “I learned to not put off assignments. I tried to finish the
assignments a few days ahead of the due date. I found that this was helpful with the
course work.” And “Yes, when doing one assignment, I realized that sometimes it works
better for me to work on it, then take a break. Then come back to it later to finish up.”
Did Not Learn Anything Useful Responses included the following. “No,
everything is due on Saturday night, everything gets done Saturday afternoon.”
Analysis of Interview Data
A total of eight students in the experimental groups were interviewed
following the end-of-the semester data collection process. Two student volunteers from
each of the four sections were randomly chosen for interviews. Each interview collected
demographic data, self-assessment data and opinion data based on the experiment
materials and process. No students from the control groups were interviewed because the
researcher discovered that the majority of the interview questions focused only on the
GTD software utilized during the study instead of the concepts the software reinforced.
Demographic data.
Of the eight students interviewed, six (75%) were female and two (25%) were
male. The ages ranged from 20 to 38, the average age was 26 (SD 6.14) and the median
age was 23. The grade classification included three (37.5%) seniors, three (37.5%)

116
juniors, and two (25%) sophomores. Five (62.5%) of the students were Secondary
Education majors and three (37.5%) of the students were Elementary Education majors.
Self-assessment data.
Five self-assessment questions were asked of the interviewees. The questions
focused on technological proficiency, comfort level with technology, assessment of
ability to successfully complete the course, motivation towards the course, and course
organizational skills.
The first self-assessment question asked during the interview process: How would
you describe your current level of technology proficiency? How has that level changed
during the course of the semester? Table 4.23 summarizes the responses.
Table 4.23
Self-Assessment Question 1 Summary
Proficiency Level Number Mentioned Percent Mentioned
Above Average 3 37.5%
Average 4 50.0%
Below Average 1 12.5%
The majority of the students described their technology proficiency as average or
very good. When asked how that level had changed over the course of the semester, the
following responses were given: “Improved.” “Better able to use Excel.” “Learned a lot
of tricks.” “Learned things to use as a teacher.” “Learned hints and tips.” “Learned new
tools.” “I can use Microsoft programs better now.” and “Proficiency in new areas.”
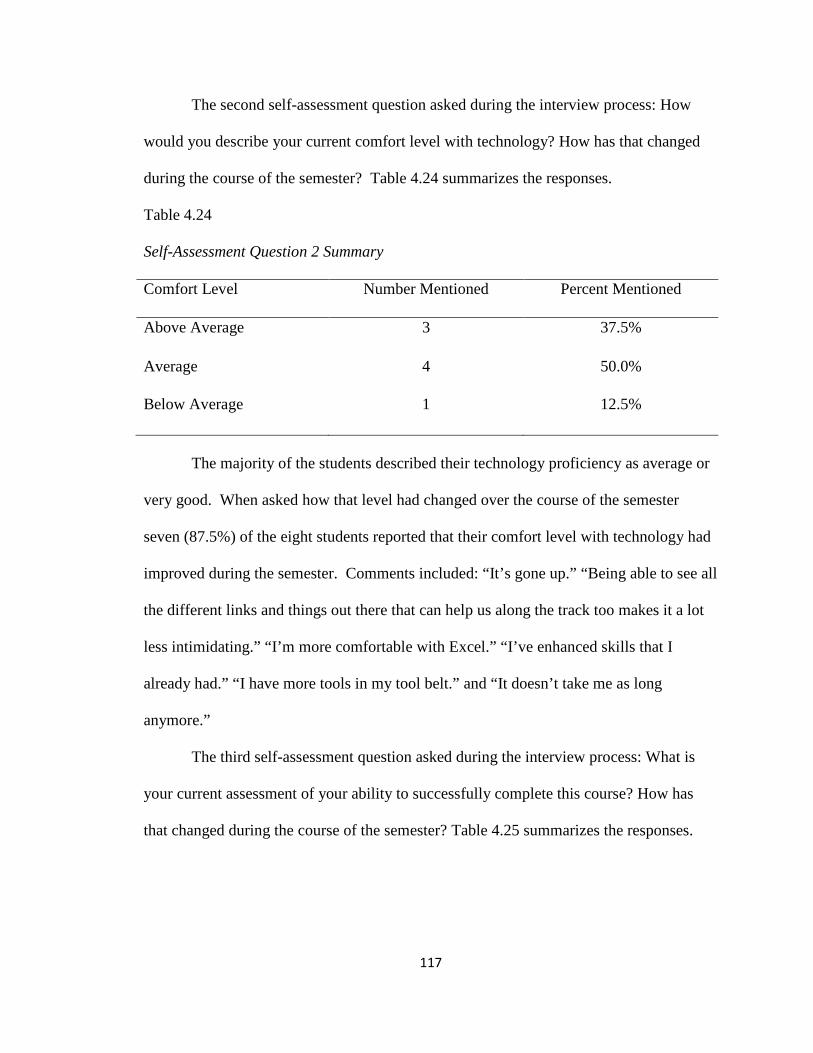
117
The second self-assessment question asked during the interview process: How
would you describe your current comfort level with technology? How has that changed
during the course of the semester? Table 4.24 summarizes the responses.
Table 4.24
Self-Assessment Question 2 Summary
Comfort Level Number Mentioned Percent Mentioned
Above Average 3 37.5%
Average 4 50.0%
Below Average 1 12.5%
The majority of the students described their technology proficiency as average or
very good. When asked how that level had changed over the course of the semester
seven (87.5%) of the eight students reported that their comfort level with technology had
improved during the semester. Comments included: “It’s gone up.” “Being able to see all
the different links and things out there that can help us along the track too makes it a lot
less intimidating.” “I’m more comfortable with Excel.” “I’ve enhanced skills that I
already had.” “I have more tools in my tool belt.” and “It doesn’t take me as long
anymore.”
The third self-assessment question asked during the interview process: What is
your current assessment of your ability to successfully complete this course? How has
that changed during the course of the semester? Table 4.25 summarizes the responses.

118
Table 4.25
Self-Assessment Question 3 Summary
Assessment of Ability to Complete Course Number Mentioned Percent Mentioned
Confident in Ability to Complete 8 100%
All students (100%) reported that they felt confident in their ability to
successfully complete the course. When asked how their confidence levels had changed
over the course of the semester, students reported: “I feel that I’ve met all of my goals
and I’ve done the best I can.” “I didn’t accomplish what I thought I could do.” and “I feel
good because we did the iGoogle™ and we got organized. I learned how to manage my
time a little better.”
The fourth self-assessment question asked during the interview process: What is
your current level of motivation towards this course? How has that changed during the
course of the semester? Table 4.26 summarizes the responses.
Table 4.26
Self-Assessment Question 4 Summary
Motivation towards Course Number Mentioned Percent Mentioned
High Motivation 5 62.5%
Took Course because Required 3 37.5%
The majority of students (62.5%) felt highly motivated towards the course.
Reasons included: “I was really pumped to see how to incorporate different things in the
class setting, and I was hoping it wouldn’t be just another computer concepts, but it really
just completely blew it out of the water, because it was really actually applying it to

119
specifically to Math.” “It sounded like a fun class to me.” And “It was really high since
this was my first semester coming back.” There were several students (37.5%) who took
the course because it was a course requirement. Their comments regarding motivation
included: “It’s required, so I was motivated enough to complete it.”
The majority of students (62.5%) still feel motivated towards the course at the end
of the semester. Responses included: “At first I was just doing the minimum and trying
to get by or whatever, but then I got more interested in the subject and in all the materials
and really trying to connect them in more of a creative manner to my subject.” “Really
motivated at the end, I kind of waddled in the middle a little bit, but now I am pushing
toward the end really hard.” And “I think that it is going to be more exciting to teach
middle school science. Especially with all the technology that I learned in this class.”
The final self-assessment question asked during the interview process: What is
your current level of organization skills as related to this course? Table 4.27 summarizes
the responses.
Table 4.27
Self-Assessment Question 5 Summary
Organizational Skills for the Course Number Mentioned Percent Mentioned
Average but Decreased over Semester 2 25.5%
Used D2L to Organize for Course 3 37.5%
Improved over the Semester 1 12.5%
Organized but Difficulty Completing Tasks
1 12.5%
No Organizational Skills for Course 1 12.5%

120
Comments related to the last assessment question include: “I thought I had really
good organizational skills until this semester and I felt like I tried to be organized, but the
more I tried, the worse it got.” “It really helped with having the calendar on the D2L and
having the assignments placed on that. And with the other classes, I just put those
assignments on there too and it was really easy to be organized.” “I have learned how to
do our, I learned a lot about time management and organization because we had so much
in this class that I kind of had to fit it all in.” “As far as having things organized as what’s
due when and all that, I had that under wraps. That was taken care of, it was just finding
the time to be able to carry that out.” And “Zero to none.”
Opinion data.
Following the collection of self-assessment data, students were asked a series of
questions about their experiences with the Getting Things Done™ software and materials
as well as how participating in the experiment affected their perceptions of and ability to
complete the course materials. Totals exceed the number of participants on several
questions due to multiple responses by participants.
The first question asked about Getting Things Done™: How did the training on
the Getting Things Done™ method assist you with course material completion? Table
4.28 summarizes the responses.

121
Table 4.28
Opinion Data Question 1 Summary
How Did Training Assist Number Mentioned Percent Mentioned
Helped with Organization 4 50.0%
Helped to Focus on Tasks 3 37.5%
Learned to Use iGoogle™/Calendar 6 75.0%
Comments related to this question include: “I liked the calendar in the D2L
system better, because I was already there.” “The calendar that you have, I will go
through and get my personal calendar and put what dates things are due and then weekly,
I make a to do list of what I am supposed to do that week.” “The iGoogle™ because I put
all of my tasks in there.” “The concept of using the calendar, it helped me more than the
actual iGoogle™ account, just making the point that you really do need to get organized
for this class or you will forget stuff.” “I write stuff down a lot and I use the calendar on
D2L a lot.” “I have to write it down and then that way I can go check it off later and then
I have a sense of accomplishment.” And “In the sense that I have been using iGoogle™ a
whole lot more, since I didn’t even know it existed. I’ve been using some of the stuff that
D2L provides that follows the same line of thinking, which has helped organize,
especially more lately when I started to get a little behind. Because with my focus
wavering, I used those things to kind of help monitor myself because I wasn’t being as
adherent in my own brain without the help.”
The second question asked about Getting Things Done™: How exactly did you
use the Getting Things Done™ software during the semester? Table 4.29 summarizes the
responses.

122
Table 4.29
Opinion Data Question 2 Summary
How was GTD Software Utilized Number Mentioned Percent Mentioned
Did Not Use during Semester 6 75.0%
Deadlines 1 12.5%
To Do List/Calendar 1 12.5%
Comments related to this question include: “I used them [iGoogle™ and D2L] for
deadlines. I use them for reminding me of things, keeping track of assignments,
deadlines, and also in both cases, I sent myself advance warnings.” “I used the little task
manager. The To Do List. Where you put it in and check off what you have done. And
then I used the calendar. So, it gave me reminders and updates or whatever.” And “I
opted not to use the Getting Things Done™ software.”
The third question asked about Getting Things Done™: How often did you use
the software during the semester? Table 4.30 summarizes the responses.
Table 4.30
Opinion Data Question 3 Summary
How often was GTD Software Used Number Mentioned Percent Mentioned
Did Not Use during Semester 5 62.5%
Daily 2 25.0%
Used D2L instead of GTD Software 1 12.5%
123
Comments related to this question include: “Pretty much daily.” “I probably use
iGoogle™ a little bit more because I don’t go to D2L every day, but I go to iGoogle™
every day.” And “I checked the calendar every time I go onto D2L.”
The fourth question asked about Getting Things Done™: Were there any issues
that kept you from using the software? Table 4.31 summarizes the responses.
Table 4.31
Opinion Data Question 4 Summary
Issues Number Mentioned Percent Mentioned
Another Thing to Do 3 37.5%
Internet Access 2 25.0%
Duplicate Software 1 12.5%
No Issues 2 25.0%
Comments related to this question include: “I think the fact that it was just another
thing that I’d had to log into. I liked being able to just click back to the calendar in D2L
since I was already there for the Ed Tech class.” “It just seemed like an extra, an extra
thing. You know with D2L, I’ve got to go there anyway, that’s where my class is.
Whereas that other stuff, you have to go somewhere else that isn’t you know, I don’t have
anything there already that is drawing me there.” “It was just another thing to go into and
another place to go for another calendar that I had to look at whenever I already had my
calendar in my email and I had the calendar in D2L, and so there was just going to be
another link that I had to go to.” “I think because I don’t have the Internet on my phone.”
“The main thing that stopped me from using those is the electronic one we have on D2L,

124
it’s the same thing varied for the class. I use that [D2L] a lot.” And “No, because I could
get on it from every computer.”
The fifth question asked about Getting Things Done™: What could be changed to
allow you to use the software in the course? Table 4.32 summarizes the responses.
Table 4.32
Opinion Data Question 5 Summary
What Could be Changed Number Mentioned Percent Mentioned
Teacher Use to Encourage Students 2 25.0%
Make it Part of Grade/Required 2 25.0%
Phone with App 1 12.5%
Nothing 1 12.5%
Did Not Ask 2 25.0%
Comments related to this question include: “If [the instructor] put all of [their]
stuff on iGoogle™, then I would have a reason that I would kind of have to go there and
so it would kind of veer me that direction.” “Some type of point award.” And “It would
have been easier if I had like a palm pilot, like a blackberry, so it would just be there.”
The sixth question asked about Getting Things Done™: What is your opinion of
iGoogle™? Table 4.33 summarizes the responses.

125
Table 4.33
Opinion Data Question 6 Summary
Opinion of iGoogle™ Number Mentioned Percent Mentioned
Positive 8 100%
Negative 0 0%
Comments related to this question include: “It seemed like a neat little custom
page and all that stuff.” “I think it was really neat, and it could be really useful. But you
need to be somewhere you are at a computer every day.” “I thought it was pretty cool,
some of the different things, like the applications.” “I think the concept is really good. I
mean, it’s easy access, it’s easy to use. You can put anything on there.” And “I really
like it. I like the layout. I like that you can customize it. So you can make it almost like
your own homepage.”
The seventh question asked about Getting Things Done™: Which functions of
iGoogle™ did you use? Table 4.34 summarizes the responses.
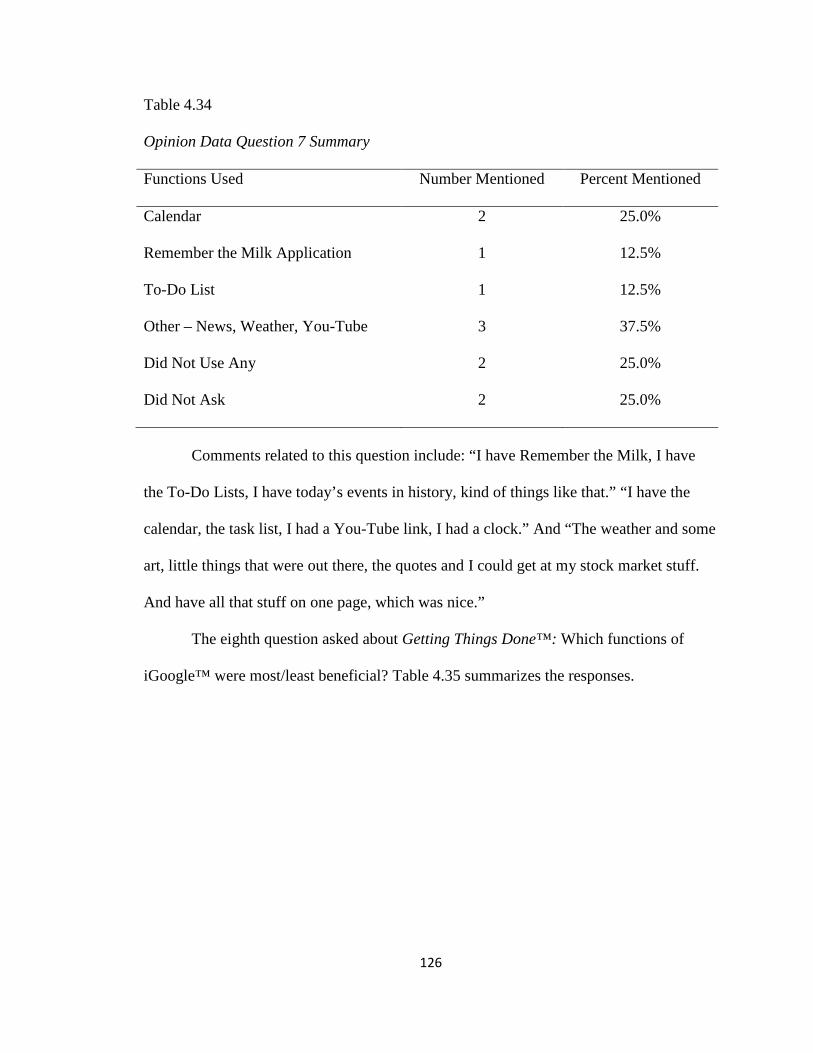
126
Table 4.34
Opinion Data Question 7 Summary
Functions Used Number Mentioned Percent Mentioned
Calendar 2 25.0%
Remember the Milk Application 1 12.5%
To-Do List 1 12.5%
Other – News, Weather, You-Tube 3 37.5%
Did Not Use Any 2 25.0%
Did Not Ask 2 25.0%
Comments related to this question include: “I have Remember the Milk, I have
the To-Do Lists, I have today’s events in history, kind of things like that.” “I have the
calendar, the task list, I had a You-Tube link, I had a clock.” And “The weather and some
art, little things that were out there, the quotes and I could get at my stock market stuff.
And have all that stuff on one page, which was nice.”
The eighth question asked about Getting Things Done™: Which functions of
iGoogle™ were most/least beneficial? Table 4.35 summarizes the responses.
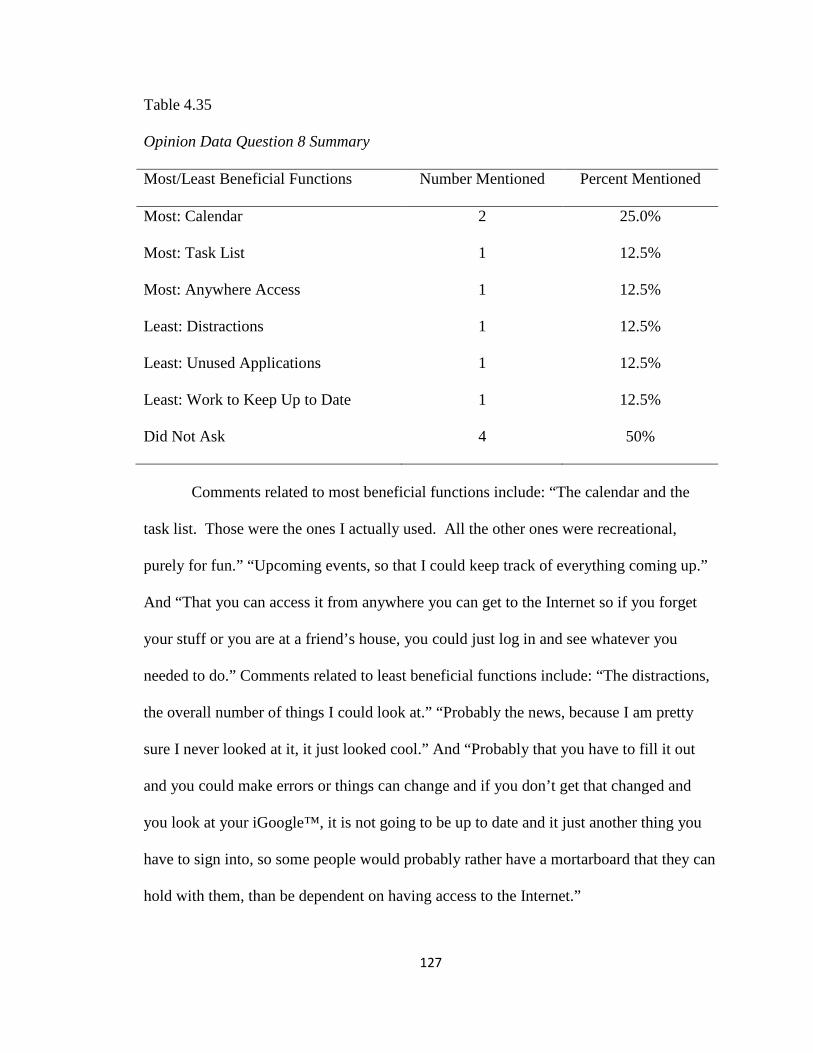
127
Table 4.35
Opinion Data Question 8 Summary
Most/Least Beneficial Functions Number Mentioned Percent Mentioned
Most: Calendar 2 25.0%
Most: Task List 1 12.5%
Most: Anywhere Access 1 12.5%
Least: Distractions 1 12.5%
Least: Unused Applications 1 12.5%
Least: Work to Keep Up to Date 1 12.5%
Did Not Ask 4 50%
Comments related to most beneficial functions include: “The calendar and the
task list. Those were the ones I actually used. All the other ones were recreational,
purely for fun.” “Upcoming events, so that I could keep track of everything coming up.”
And “That you can access it from anywhere you can get to the Internet so if you forget
your stuff or you are at a friend’s house, you could just log in and see whatever you
needed to do.” Comments related to least beneficial functions include: “The distractions,
the overall number of things I could look at.” “Probably the news, because I am pretty
sure I never looked at it, it just looked cool.” And “Probably that you have to fill it out
and you could make errors or things can change and if you don’t get that changed and
you look at your iGoogle™, it is not going to be up to date and it just another thing you
have to sign into, so some people would probably rather have a mortarboard that they can
hold with them, than be dependent on having access to the Internet.”

128
The ninth question asked about Getting Things Done™: How did you organize
your time and study environment for this course? Table 4.36 summarizes the responses.
Table 4.36
Opinion Data Question 9 Summary
Time and Study Environment Organization Number Mentioned Percent Mentioned
To Do Lists 3 37.5%
Around Available Time Slots 3 37.5%
Around Deadlines 2 25.0%
Daily Study Time 1 12.5%
Break Projects into Steps 1 12.5%
Library with Music 1 12.5%
Calendar 1 12.5%
Did Not Organize – Rushed to Finish Projects
1 12.5%
Comments related to this question include: “Based on what’s coming up and if I
had another major thing in another class I would spend time on that but pretty much after
class every day.” “Each week we would have certain stuff due, so I tried to slowly work
on it during the week whenever I had time.” “Well, I work from 7:00-2:00, I pick my son
up from school at 2:00 and I get my time with him and then at 7:30 at night, I get to do
school until about 10:30 or 11:00. And then I get up and do it all over again.” “For
organization, the main thing is, if you have a project that is going to take more than just
sitting there and doing it, it’s planning out when each step is going to be done around the
rest of your schedule.” “What I would do is just start off and go to the library so I
wouldn’t have any distractions, listen to music and tune out.” And “Oh, it was horrible, in
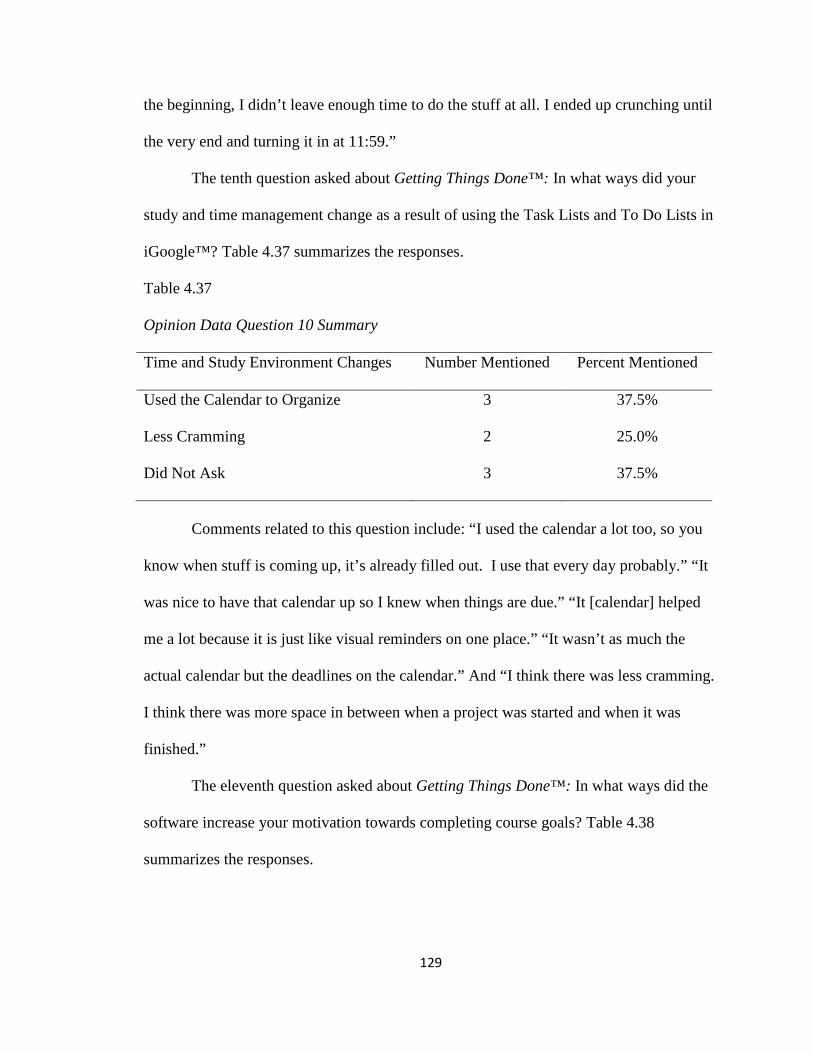
129
the beginning, I didn’t leave enough time to do the stuff at all. I ended up crunching until
the very end and turning it in at 11:59.”
The tenth question asked about Getting Things Done™: In what ways did your
study and time management change as a result of using the Task Lists and To Do Lists in
iGoogle™? Table 4.37 summarizes the responses.
Table 4.37
Opinion Data Question 10 Summary
Time and Study Environment Changes Number Mentioned Percent Mentioned
Used the Calendar to Organize 3 37.5%
Less Cramming 2 25.0%
Did Not Ask 3 37.5%
Comments related to this question include: “I used the calendar a lot too, so you
know when stuff is coming up, it’s already filled out. I use that every day probably.” “It
was nice to have that calendar up so I knew when things are due.” “It [calendar] helped
me a lot because it is just like visual reminders on one place.” “It wasn’t as much the
actual calendar but the deadlines on the calendar.” And “I think there was less cramming.
I think there was more space in between when a project was started and when it was
finished.”
The eleventh question asked about Getting Things Done™: In what ways did the
software increase your motivation towards completing course goals? Table 4.38
summarizes the responses.

130
Table 4.38
Opinion Data Question 11 Summary
How did Software increase Motivation Number Mentioned Percent Mentioned
Confidence 1 12.5%
Not Overwhelmed 2 25.0%
Organization 2 25.0%
Kept on Track 1 12.5%
Did Not Miss Deadlines 1 12.5%
Could See Progress 1 12.5%
Did Not Increase Motivation 1 12.5%
Did Not Ask 2 25.0%
Comments related to this question include: “I felt more confident in myself to do
all the projects.” “Since I had it organized, I didn’t get overwhelmed as much.” It helped
me not get too overwhelmed. I didn’t get the feeling at the end of the semester that
‘there’s no way I can pass this class because I am so far behind’ because it was able to
keep me organized.” “It helped keep me on track.” It would make you happy that you
caught something before it was too late.” And “I don’t know if it increased my
motivation, I think the grades section increased my motivation.”
The twelfth question asked about Getting Things Done™: How did the software
help you in this course? And How did the software hinder you in this course? Tables 3.39
and 3.40 summarize the responses.

131
Table 4.39
Opinion Data Question 12a Summary
How did the Software Help Number Mentioned Percent Mentioned
Due Dates 2 25.0%
Stay on Task 1 12.5%
Prioritize 1 12.5%
Planning 1 12.5%
Maintain focus and organization 1 12.5%
Time Management 1 12.5%
Comments related to this question include: “It kept me in line to get things done
on time.” ”I used it to organize my tasks, set reminders, and used online sticky notes.” “I
think it maintained my focus and organizational processes.” “It helped to look forward to
see and to plan my week. I know if another big assignment in a different class is due that
same day, then I will try to do one the day before and one the day of, to try to space it out
a little bit so that I am not panicking the last day that it is due.” “It helped me stay on task
as far as prioritizing. It just helped me to prioritize my time.” “It helped me seeing due
dates on things. Knowing when something’s due down to the time and knowing just
ahead of time that this is due next week and be ready for it.” And “It just helped me with
my time management.”

132
Table 4.40
Opinion Data Question 12b Summary
How did the Software Hinder Number Mentioned Percent Mentioned
No Hindrance 4 50.0%
Mismanage Time 1 12.5%
Distractions 2 25.0%
Forgot to Add Tasks 1 12.5%
Comments related to this question include: “I don’t really see that it was a
hindrance.” “I don’t know that it did other than when I forgot to put stuff on there.”
“Probably not unless I spent too much time on there on other widgets.” “Other than the
mild distractions of having too much on iGoogle™, I don’t think that it truly hindered me
once I deleted the games off of there and I didn’t let myself get distracted.” And “I don’t
know that it really did other than when I forgot to put stuff on there.”
The thirteenth question asked about Getting Things Done™: How could you use
this software/calendar in other courses? Table 4.41 summarizes the responses.
Table 4.41
Opinion Data Question 13 Summary
Use in Other Courses Number Mentioned Percent Mentioned
To See the Big Picture 6 75.0%
For Preparation 1 12.5%
For Time Management 1 12.5%
Did Not Ask 1 12.5%

133
Comments related to this question include: “You log in and it’s on the side [of the
screen] and you’ll see I’ve got a speech coming up in my class Thursday night or my
professor in my methods class changed something.” “In the sense of strategy planning
with my papers and plotting out what I was supposed to do and when so that I could.
Giving me more of a rhythm to the semester instead of just being hectic and reacting to
the semester.” “All my due dates are on there. And the good thing about it, if I didn’t
have my planner on me, I could check it online on my phone too.” “If all the classes, if all
the teachers, put all their assignments and when they’re due and all of that stuff on D2L,
that would be awesome. Because you could just see it and you could see how that
correlates with the other classes.” And “It helps you with your time management and
better organization.”
The fourteenth question asked about Getting Things Done™: Would you
recommend the software to others? Why or why not? Tables 3.42 and 3.43 summarize
the responses.
Table 4.42
Opinion Data Question 14a Summary
Would You Recommend the Software Number Mentioned Percent Mentioned
Yes 8 100%
All students would recommend the software to other students.
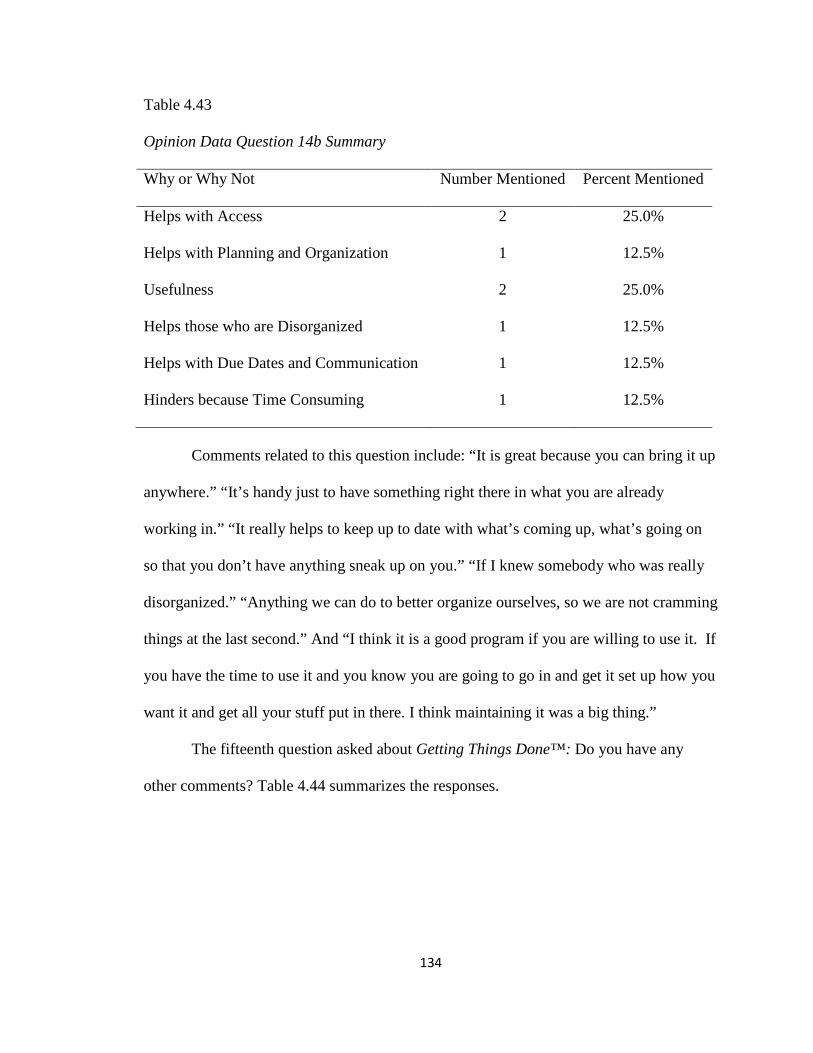
134
Table 4.43
Opinion Data Question 14b Summary
Why or Why Not Number Mentioned Percent Mentioned
Helps with Access 2 25.0%
Helps with Planning and Organization 1 12.5%
Usefulness 2 25.0%
Helps those who are Disorganized 1 12.5%
Helps with Due Dates and Communication 1 12.5%
Hinders because Time Consuming 1 12.5%
Comments related to this question include: “It is great because you can bring it up
anywhere.” “It’s handy just to have something right there in what you are already
working in.” “It really helps to keep up to date with what’s coming up, what’s going on
so that you don’t have anything sneak up on you.” “If I knew somebody who was really
disorganized.” “Anything we can do to better organize ourselves, so we are not cramming
things at the last second.” And “I think it is a good program if you are willing to use it. If
you have the time to use it and you know you are going to go in and get it set up how you
want it and get all your stuff put in there. I think maintaining it was a big thing.”
The fifteenth question asked about Getting Things Done™: Do you have any
other comments? Table 4.44 summarizes the responses.

135
Table 4.44
Opinion Data Question 15 Summary
Any Additional Comments Number Mentioned Percent Mentioned
No Further Comments 7 87.5%
Useful Tools but Not For Me 1 12.5%
Comments related to this question include: “It was good, useful tools but my life
didn’t really facilitate using them.”
D2L platform data.
Additional questions were asked of the interviewees related to D2L, the online
course platform, due to overwhelming comments made by students that the functions in
the D2L platform were utilized more than the study software. Questions were asked
about opinions, most and least beneficial functions, and how the calendar was utilized.
Their responses are summarized below.
The first question asked about the D2L platform: What is your opinion of the
D2L platform? Table 4.45 summarizes the responses.
Table 4.45
D2L Platform Question 1 Summary
Opinion of the D2L Platform Number Mentioned Percent Mentioned
Good because already in D2L for class 4 50.0%
Good for Teacher/Student Interface 5 62.5%
Good for Deadlines and Reminders 5 62.5%
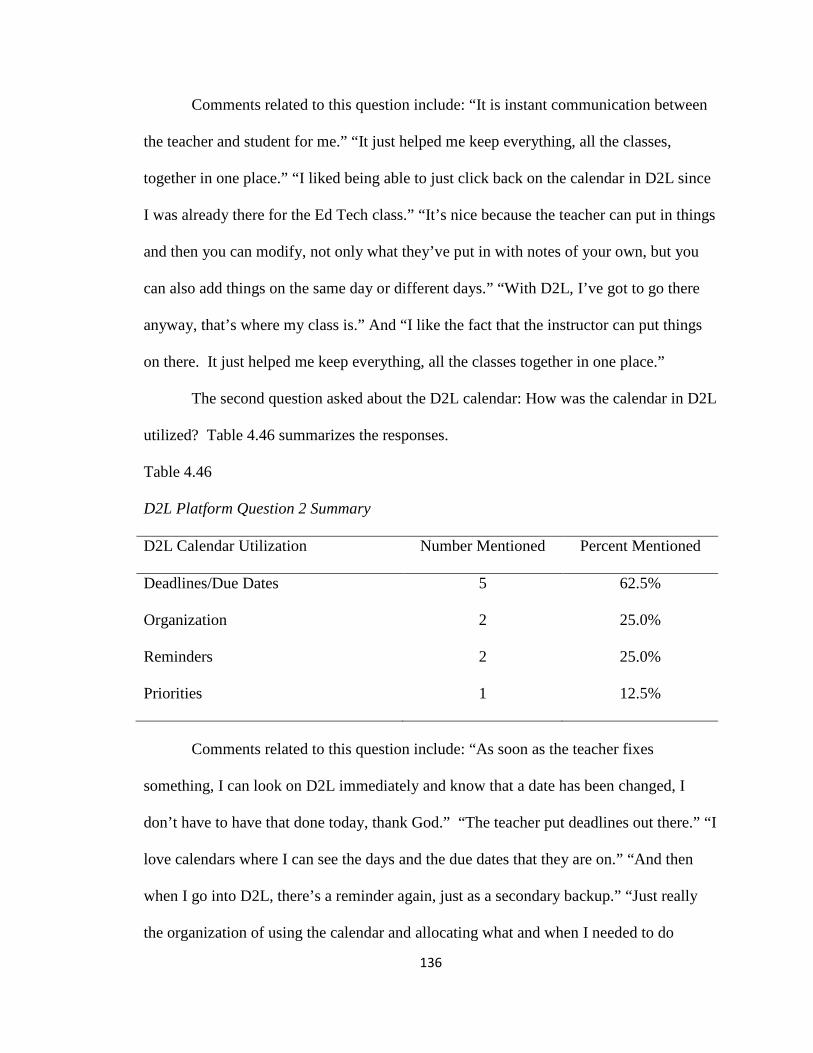
136
Comments related to this question include: “It is instant communication between
the teacher and student for me.” “It just helped me keep everything, all the classes,
together in one place.” “I liked being able to just click back on the calendar in D2L since
I was already there for the Ed Tech class.” “It’s nice because the teacher can put in things
and then you can modify, not only what they’ve put in with notes of your own, but you
can also add things on the same day or different days.” “With D2L, I’ve got to go there
anyway, that’s where my class is.” And “I like the fact that the instructor can put things
on there. It just helped me keep everything, all the classes together in one place.”
The second question asked about the D2L calendar: How was the calendar in D2L
utilized? Table 4.46 summarizes the responses.
Table 4.46
D2L Platform Question 2 Summary
D2L Calendar Utilization Number Mentioned Percent Mentioned
Deadlines/Due Dates 5 62.5%
Organization 2 25.0%
Reminders 2 25.0%
Priorities 1 12.5%
Comments related to this question include: “As soon as the teacher fixes
something, I can look on D2L immediately and know that a date has been changed, I
don’t have to have that done today, thank God.” “The teacher put deadlines out there.” “I
love calendars where I can see the days and the due dates that they are on.” “And then
when I go into D2L, there’s a reminder again, just as a secondary backup.” “Just really
the organization of using the calendar and allocating what and when I needed to do

137
things. Not necessarily as a reminder, but specifically putting on the calendar ‘start on
this date’ so I can organize my thoughts a little and plan ahead.” “Mainly for just
assignments and specific things related to class, deadlines, reminders, things like that.
And strategy to the sense of planning ahead on things organizationally.” “I can set
priorities on it and stuff like that.” “Basically just to organize. Just to put in the dates
when things were due.” And “It wasn’t as much the actual calendar but the deadlines on
the calendar.”
The third question asked about the D2L calendar: What were the most beneficial
functions of the D2L platform? Table 4.47 summarizes the responses.
Table 4.47
D2L Platform Question 3 Summary
Most Beneficial Functions Number Mentioned Percent Mentioned
Due Dates 4 50.0%
Visual Planning 2 25.0%
Course Information Online 2 25.0%
Reminders 1 12.5%
Comments related to this question include: “The connection that the teachers
could put things into it as well as I did. I didn’t have to go back in and double-check my
syllabus on everything. A lot of it was already in there.” “The reminder, the fact that it
will let you set reminders by certain numbers of dates, so that you can, literally not have
it flash up there on the due date, but you can set it in advance.” “Pretty near anytime I got
on D2L, I’d look at the events calendar, so that I could see if anything had changed. See
if anything new had been added to that I could keep my stuff up to date.” “I absolutely

138
loved that the teacher used the calendar, that was such an awesome tool and I wish all my
teachers did.” “Being able to access information within the D2L system. Whichever
class I was in I was able to go back to my home and plug things in.” “The due dates,
having it all visually available. This week I have this much to do. I’ve got that much to
do and I can just transfer it over to my planner and match it up with my other classes.” “It
was right there in my space, I was already looking at all the content stuff in the class. I
would just go to the calendar for the class and it was right there and everything was out
there and deadlines were there.” “It was easy for me to quickly check things while I was
at work on a break or in between tasks. I was able to pull it up and leave it up.” And “It
was nice to have that calendar up so I know when things are due.”
The last question asked about the D2L platform: What were the least beneficial
functions of the D2L platform? Table 4.48 summarizes the responses.
Table 4.48
D2L Platform Question 4 Summary
Least Beneficial Functions Number Mentioned Percent Mentioned
Time to learn how to use D2L 2 25.0%
Miss assignments not on D2L 1 12.5%
Unused class functions 1 12.5%
Comments related to this question include: “It could be a little bit more user
friendly. But otherwise, once you get the hang of it, it’s nice.” “Not very user friendly. It
takes a little bit to figure out.” “If I forgot to put something out there or sometimes the
discussion boards wouldn’t be on the calendar but they would be in the discussion board
section, but I would sometimes check only the calendar and not the other places so that

139
was kind of bad. I think I missed a quiz, I missed two quizzes cause I didn’t get it put on
the calendar and it was on the quiz part, so I completely forgot.” And “There were some
things that I didn’t find that were relevant but someone else might.”
Conclusion
The following chapter will discuss findings, conclusions and future
recommendations. This will include a discussion of the quantitative and qualitative
findings, conclusions that can be drawn from the findings and recommendations for
future areas of research.

140
CHAPTER V
DISCUSSION, CONCLUSIONS, AND RECOMMENDATIONS
Introduction
Chapter 5 completes the dissertation. A summary of the purpose and design of
the study precedes a discussion of the results as they relate to the research question.
Conclusions are made and limitations are noted. Based on the results of the study,
implications are drawn from the conclusions and recommendations for future research are
then presented. Finally, the researcher brings this phase of the study to a close.
Summary of the Study
This study sought to investigate the effect of Getting Things Done™ (GTD)
software on the motivation and self-regulation of pre-service teachers enrolled in an
introductory Educational Technology course. The following research question was
addressed: Do pre-service teachers in an introductory Educational Technology course
using Getting Things Done™ software demonstrate an increase in motivation and self-
regulation?
A pre-test/post-test design was used to collect data from the two comparison
groups. Comparison groups consisted of a control group and an experimental group of
pre-service teachers enrolled in different sections of an Educational Technology course
required for pre-service teachers. Subjects first completed the Motivated Strategies
Learning Questionnaire (MSLQ). Additionally, a Likert-Type Scale survey with open-
141
ended, short answer/essay questions was administered to all participants so they could
self-assess their skill level, their comfort with technology, and their classroom
experiences. These surveys were administered at both the beginning and end of the
research cycle. To enhance the results gathered through the surveys, qualitative data was
collected through semi-structured interviews conducted with eight randomly selected
students participating in the experimental groups. Two students from each of the
experimental groups (classes) were interviewed. No students from the control groups
were interviewed because the researcher discovered that the majority of the interview
questions focused only on the GTD software utilized during the study instead of the
concepts the software reinforced.
Paired sample t-tests were used to investigate pre- and post-test means between
the variables and independent samples t-tests were conducted to look at the difference in
means between the control groups and the experimental groups. Pearson bivariate
correlations were performed for pre- and post-test variables in the control and
experimental groups. For consistency in this study, the researcher and the researcher’s
co-chair chose the following levels for interpreting r2 in the Pearson bivariate
correlations: low 10%, moderate 15% - 40%, and high 50% and higher. Open-ended
questions and interview results were transcribed and analyzed for common themes.
General Discussion
In this section the results are discussed in terms of their relationship to the
research question: Do pre-service teachers in an introductory Educational Technology
course using Getting Things Done™ software demonstrate an increase in motivation and
self-regulation? Based on the researcher’s experience teaching the course, using

142
organizational software, and presenting the instructional requirements for the course, she
anticipated there would be a significant difference between the pre-test and post-test
results of the experimental groups and the control groups.
MSLQ results.
Paired sample t-tests conducted on the data from the experimental groups found
significant differences in the pre- and post-test means for five of the seven MSLQ pairs
utilized in the study. Within the Motivation Scales, only the subscale, Control of
Learning Beliefs was significant at the 95% confidence level, t(44) = 2.210, p < .05.
Within the Learning Strategies Scale, data collected on all four subscales was
significantly different. Data gathered from the Organization Scale was significant at the
95% confidence level, t(44) = 3.596, p < .05. Metacognitive Self-Regulation data results
were significant at the 95% confidence level, t(44) = 2.415, p < .05. Time and Study
Environment data was significant at the 95% confidence level, t(44) = 3.301, p < .05.
Effort Regulation data was significant at the 95% confidence level, t(44) = 2.151, p < .05.
The results suggest that utilizing Getting Things Done™ software does increase
Motivation and Self-Regulation in pre-service teachers.
However, within the control group, three of the seven MSLQ pairs were
statistically significant. None of the Motivation Scales demonstrated statistical
significance. Three of the Learning Strategies subscales were significant. Organization
was significant at the 95% confidence level, t(44) = 2.101, p < .05. Metacognitive Self-
Regulation was significant at the 95% confidence level, t(44) = 2.411, p < .05. And,
Time and Study Environment was significant at the 95% confidence level,

143
t(44) = 4.623, p < .05. Significant results in both the experimental and control groups
suggest that something other than the experimental factors were affecting results.
Along with paired sample t-tests, Pearson bivariate correlations were conducted
between all of the subscales for the experimental groups. Of the twenty-one pairs,
seventeen were statistically significant at the 95% confidence level. Of the statistically
significant pairs, nine displayed moderate levels of correlation. Table 5.1 details the
findings.
Table 5.1
Pearson Bivariate Correlations Experimental Groups Post-Test Variables
Pearson Correlation
r
Coefficient of Determination
r2
Sig. (2-tailed)
Control Learning Beliefs and Metacognitive Self-Regulation
0.484 0.234 0.001*
Control Learning Beliefs and Organization
0.459 0.211 0.002*
Control Learning Beliefs and Self-Efficacy
0.437 0.191 0.003*
Control Learning Beliefs and Task Value
0.521 0.271 0.000*
Effort Regulation and Self-Efficacy
0.530 0.281 0.000*
Effort Regulation and Time and Study Environment
0.561 0.315 0.000*
Metacognitive Self-Regulation and Organization
0.721 0.520 0.000*
Self-Efficacy and Task Value
0.484 0.234 0.001*
*p < .05 statistically significant

144
Pearson bivariate correlations were also conducted between all of the subscales of
the control groups. Of the twenty-one pairs, eleven were statistically significant at the
95% confidence level. Of the statistically significant pairs, nine displayed moderate
levels of correlation. Table 5.2 details the findings.
Table 5.2
Pearson Bivariate Correlations Control Groups Post-Test Variables
Pearson Correlation
r
Coefficient of Determination
r2
Sig. (2-tailed)
Control Learning Beliefs and Effort Regulation
0.497 0.247 0.001*
Control Learning Beliefs and Self-Efficacy
0.571 0.326 0.000*
Control Learning Beliefs and Task Value
0.479 0.229 0.001*
Effort Regulation and Metacognitive Self-Regulation
0.526 0.277 0.000*
Effort Regulation and Self-Efficacy
0.587 0.345 0.000*
Effort Regulation and Time and Study Environment
0.611 0.373 0.000*
Metacognitive Self-Regulation and Organization
0.531 0.282 0.000*
Metacognitive Self-Regulation and Time and Study Environment
0.546 0.298 0.000*
Self-Efficacy and Task Value
0.505 0.255 0.000*
*p < .05 statistically significant Comparing the Pearson bivariate correlations for the experimental and the control
groups reveals that both groups had nine pairs with moderate levels of correlation. Of

145
those nine pairs, seven were the same for both: Control of Learning Beliefs and Self-
Efficacy, Control of Learning Beliefs and Task Value, Effort Regulation and
Metacognitive Self-Regulation, Effort Regulation and Self-Efficacy, Effort Regulation
and Time and Study Environment, Metacognitive Self-Regulation and Organization, and
Self-Efficacy and Task Value. While the correlation results are consistent with the
literature (Sungur & Tekkaya, 2006; Crede & Phillips, 2011; Clark, 2006; and Pintrich et
al., 1991), the overlapping similarities suggest that something other than the GTD
treatment was affecting the correlations; therefore, the correlations do not confirm that
GTD alone increased the motivation and self-regulation of pre-service teachers in this
study.
Independent samples t-tests were also conducted to determine whether differences
between the post-test means of the experimental groups and the control groups for each
of the seven subscales existed. No statically significant differences were found in any of
the subscales. See Table 4.8 for specific details. Based on these results, the researcher
concluded that the experimental groups did not show a statistically significant increase in
motivation and self-regulation when compared to the control groups. These results do
not support an affirmative answer to the research question: Do pre-service teachers in an
introductory Educational Technology course using Getting Things Done™ software
demonstrate an increase in motivation and self-regulation when compared to students
who do not use the organizational software?
In addition to the independent samples t-tests, Pearson bivariate correlations were
also conducted between the post-test experimental groups and control groups variables to
ascertain strength of relationships. Of the forty-nine calculations, only two were

146
statistically significant. The first, Metacognitive Self-Regulation control groups and Self-
Efficacy experimental groups, demonstrated a low negative correlation, r(43) = -.384,
p < .01 between the two scales. This indicates that only 14.7% of the variance between
the variables was shared, r2 = .147. The negative correlation indicated that as Self-
Efficacy increased, Metacognitive Self-Regulation decreased. The second, Time and
Study Environment control groups and Organization experimental groups, also
demonstrated a low positive correlation between the two scales, r(43) = .338, p < .05.
This indicates that only 11.4% of the variance between the variables was shared,
r2 = .114. These low positive correlations indicate a weak relationship exists between the
two sets of variables. However, Pyrczak (2006) indicates caution should be used when
interpreting small values of r2 since large percentages of the variance cannot be
accounted for between the variables. In general, it seems as though there may be a
possible causal relationship between the variables, but other effects should be considered.
Likert-type scale results.
Paired sample t-tests conducted with the experimental groups found significant
differences in the pre- and post-test means for three of the five Likert-Type Scale pairs
utilized in the study. All three were significant at the 95% confidence level: Comfort,
t(44) = 4.105, p < .05; Motivation, t(44) = -3.177, p < .05; and Proficiency,
t(44) = 3.728, p < .05. Alternatively, the mean scores from four of the five control
groups’ Likert-Type Scale pairs demonstrated statistical significance in the pre- and post-
test data. All results were significant at the 95% confidence level: Ability,
t(44) = 4.2.485, p < .05; Comfort, t(44) = 3.964, p < .05; Motivation, t(44) = -3.246,
p < .05; and Proficiency, t(44) = 4.057, p < .05. As mentioned previously, regarding the

147
MSLQ results, significant results between the experimental groups and the control groups
suggest that some influence other than the experimental factors were affecting the results.
Along with paired sample t-tests, Pearson bivariate correlations were conducted
between all of the subscale data collected from the experimental groups. Of the ten pairs,
four were statistically significant at the 95% confidence level. Of the statistically
significant pairs, two displayed moderate levels of correlation. These include: Ability
and Proficiency (r = 0.509 and r2 = .259), and Motivation and Organization
(r = 0.603 and r2 = .364).
Pearson bivariate correlations were also conducted between all of the subscales
for the control groups. All ten pairs were statistically significant at the 95% confidence
level. Of the statistically significant pairs, five displayed moderate to high levels of
correlation. These include: Ability and Motivation (r = 0.440 and r2 = .194); Ability and
Organization (r = 0.511 and r2 = .261); Ability and Proficiency (r = 0.399 and r2 = .159);
Comfort and Proficiency (r = 0.848 and r2 = .719); and Motivation and Organization
(r = 0.685 and r2 = .469).
Comparing the Pearson bivariate correlations for the experimental groups and the
control groups reveals that the experimental groups had four statistically significant pairs
of subscales while all of the control groups’ pairings were statistically significant. While
the statistical significance of the correlations presents strong evidence that the variables
are related to each other, caution is advised in the interpretation of these results due to the
fact that the control groups displayed more statistically significant correlations and higher
levels of correlation. Research from Ary, Jacobs, and Razavieh (2002) and Pyrczak
(2006) warn against the assumption of a causal relationship or practical significance
148
between variables based only on one set of results. Further research is warranted to
determine the origin behind the relationships and no assumptions can be made on the
relationships found in these correlations. One relationship that decidedly deserves further
review is the construct of Ability. This construct appears to be a connecting factor in the
results of both the experimental groups and the control groups. For this study, the
researcher defined Ability as a personal self-assessment of organizational skills as related
to the ability to complete required coursework. Future research could explore the
connections this construct has with other variables.
Independent samples t-tests were also conducted to determine whether differences
between the post-test means of the experimental groups and the control groups for each
of the five subscales existed. No statically significant differences were found in any of
the subscales. Table 4.17 details the statistics. In addition to the independent samples
t-tests, Pearson bivariate correlations were also conducted between the variables of the
post-test experimental groups and control groups to ascertain the strength of
relationships. None of the twenty-five calculations demonstrated statistical significance
(see Table 4.18). These results lead to the conclusion that the experimental groups did
not show a statistically significant increase in motivation and self-regulation when
compared to the motivation and self-regulation of the control groups. These results do
not support a positive answer to the research question, do pre-service teachers in an
introductory Educational Technology course using Getting Things Done™ software
demonstrate an increase in motivation and self-regulation?

149
Open-ended question results.
A pre-test question was asked of all participants: How do you plan to organize
your time and study environment for this course? Utilizing a calendar, planner, or
scheduler was the most common response (32%) from the experimental groups, followed
by free time (25%) and time blocks (16%). Comparatively, the control groups noted due
dates (24%), no plans (20%), and time blocks (18%). Zimmerman, Bonner, and Kovach
(2008) offer the opinion that the effective use of study time becomes imperative to
academic success, and those who do not effectively use their study time are forced into
expediency, which is the exact opposite of self-regulated learning.
A post-test question was also asked of all participants: Was there anything you
learned or experienced in this course that helped you to organize your time and study
environment for this class? The experimental groups responded overwhelming that
technology applications assisted them with their time and study environment. The
responses included online calendar (28%), iGoogle™ (17%), Microsoft Office (17%),
D2L, the online course platform (11%), and Remember the Milk (6%). Hofer, Yu and
Pintrich (1998) note that inserting strategy instruction into course materials shows
students the usefulness of using a self-regulatory approach. The authors say that this
increases the possibility that students will continue to utilize the skill rather than see it as
a course specific method. Alternatively, almost half of the control groups (48.8%)
offered no response to this question. Of those who did answer, only two dedicated
technology components were mentioned, Microsoft Office (13%) and D2L (8%).
The results of these questions indicate that students in the experimental groups
were more likely to utilize technology tools to assist them with organizing their time and

150
study environment than those in the control groups. This also suggests that students in
the experimental groups were more likely to utilize self-regulation tools to complete
course assignments. In a study of college students’ self-regulation and motivation,
Wolters (1998) found that self-regulated learners successfully adapt or modify learning
strategies to fit situational requirements. This leads to the conclusion that students in the
experimental groups began utilizing the self-regulation tools provided to them during the
study to help them complete course assignments in a timely fashion.
Interview results.
The majority of students interviewed considered themselves to be average or
above average in their computer skills (87.5%). Most students had previously worked
with computers, so they were confident in their ability to use the computer in this class.
This could be attributed to the fact that computers and computer assignments are a staple
in most college classrooms. Technology assistance came in the form of tips, tools and
education-specific skills on the computer. Students’ confidence decreased during the
semester when they were presented with new technologies and a heavy course workload.
However, by the end of the semester, students felt as if their confidence levels had
increased and they had more tools to utilize in their future classrooms as teachers. This
rise in confidence is discussed in Bandura’s (1993) work on self-efficacy. Bandura points
out that self-efficacy, which is the belief that one can accomplish a given goal, is the most
powerful contributing factor in one’s personal belief about the ability to exercise control
over his or her level of functioning. The students interviewed during this study offered
the opinion that they felt they could utilize the newly learned technology in their future
classrooms based on the positive personal experiences they encountered with the

151
software over the course of the semester. The implication for this finding asserts that
students developed higher levels of self-efficacy towards Educational Technology tools
through their proficiency with the software.
Several students mentioned they were not motivated to complete this required
course (37.5%); however, their motivation increased during the semester as they began to
realize how useful the tools were and discussed ways technology could be implemented
successfully in their future classrooms. That excitement motivated them to consider the
usefulness of integrating technology into their future classroom instruction. Pintrich
(2003) offers the opinion that students are motivated to do well when they have a high
interest in the subject. The possibility exists that students in this course showed increased
motivation because they were provided with course tools and assignments that, as
Pintrich suggests, are interesting, meaningful, and varied.
Most students desired to be organized in completing course assignments and
tasks, yet interestingly only one student utilized the GTD technology consistently during
the semester. Most of the students utilized the tools offered on the university online
learning platform, D2L, instead. The utilization of the D2L platform tools instead of the
GTD technology seems to be a function of the course design and instructional
requirements. Since the course instructors utilized the D2L platform for course
components, due dates, rubrics, assignment descriptions, reminders, and links for support
materials, students were not required to invest the personal effort and time to organize
course materials for themselves. Wolters, Pintrich, and Karabenick (2003) assert that
self-regulated learning is an active, constructive process. In the process, learning goals
are set, monitored, and regulated personally by the student. The environment gives

152
context and constraints to the goals. In this study, the environment was not conducive to
self-regulated learning since the students were not required to play an active role in the
organization of course materials.
When asked how the GTD training assisted with course material completion, most
students were of the opinion that the GTD software helped them with organization (50%),
focus (37.5%) and use of new programs (75.0%). Allen (2001) believes that organization
occurs when components, sequences and priorities have been identified. As one
interviewed student commented, “You really do have to be organized for this class or you
will forget stuff.” Surprisingly, only one of the students interviewed had utilized the
GTD software over the duration of the course during the semester. However, the student
who utilized the software did so on a daily basis. The lack of utilization by the remaining
students may be explained by their consistent use of the course resources in the D2L
system. As indicated in the interviews, specific reasons for not utilizing the GTD
software included the opinion that it was “another thing to log into” or “an extra thing to
do.” These students recognized that the GTD software provided an innovative way to
organize course workload, due dates and assignments; however, as Maloney (2007)
points out, course management systems are typically only utilized to provide students
with access to course materials and grades. Introducing an ungraded, novel system to
organize and manage course material may have moved students out of their comfort zone
of traditional online course material delivery since utilizing the GTD software required
the students to go to a new website, create a new account and take personal responsibility
for entering to-do items.

153
During pre-test data collection, students were trained to use iGoogle™ and
Remember the Milk (a web-based, task management program). Based on that training,
students reported creating iGoogle™ accounts with calendar functions (25%), to-do lists
(12.5%), and news applications (37.5%). They offered the opinion that the most
beneficial functions were the calendar (25%), the task list (12.5%), and anywhere access
(12.5%). All interviewed students responded favorably to the GTD programs of
iGoogle™ and Remember the Milk; however, 50% of the students did not offer opinions
on the most beneficial functions because they did not utilize the program. These results
correspond to Kumar and Vigil’s (2011) comparison of pre-service teachers’ informal
and formal use of technologies. They found that informal or personal use of technologies
was higher than students’ formal or classroom use of technologies.
When asked how time and study environments were organized for this course, the
most common responses from the students were to create to-do lists (37.5%) and work
around available time slots (37.5%). From further probing, it was determined that many
students used online calendars to stay current with class requirements (37.5%). Online
calendars also provided several students (25%) with the opportunity to complete
coursework with less last minute cramming. These findings indicate the use of self-
regulated learning strategies as put forth by Wolters (2003a). Wolters discusses the belief
that self-regulated learners possess higher levels of awareness about different learning
tactics and they have the capacity to choose and regulate their use of those approaches
when engaged in academic responsibilities.
Inquiring about motivation towards course goals as related to GTD software
revealed that students felt more confident (12.5%), stayed on track (12.5%), felt less

154
overwhelmed (25%), were more organized (25%), missed fewer deadlines (12.5%), and
could see personal progress (12.5%). Linnebrink and Pintrich (2002) offer the opinion
that instructional efforts and classroom design can make a difference in motivating
students towards academic achievement. Furthermore, students reported that the calendar
software assisted them with being aware of due dates (25%), staying on task (12.5%),
prioritizing (12.5%), planning (12.5%), maintaining focus (12.5%), and managing their
time (12.5%). Accordingly, interviewed students demonstrated that they are more
motivated and self-regulated to achieve course goals in a timely manner than simply
completing course assignments at the last minute.
Interviewees discussed methods in which calendaring software could be used in
other courses. The vast majority (75%) of interviewees said that the calendaring software
allowed them to see the “big picture” for their coursework and all said they would
recommend calendaring software to other students for help with accessing course
requirements (25%), planning and organization (12.5%), and meeting due dates (12.5%).
When describing how D2L was used for this course, students responded for deadlines and
due dates (62.5%), organization, (25%), reminders (25%), and priorities (12.5%). The
most beneficial features of D2L were due dates (50%), visual planning (25%), online
course information (25%), and reminders (12.5%). Revere and Kovach (2011) discussed
how course platform options enhance learning and note that when utilized appropriately,
technological options promote student engagement in the learning process.
Research Study Conclusions
To summarize the components and ideas reflected in this study, Self-Regulated
Learning was defined as “Self-directive processes and self-beliefs that enable learners to

155
transform their mental abilities…into an academic performance skill” (Zimmerman,
2008, p. 166). Motivation is the sense of energy or activation students demonstrated in
completing the course assignments (Ryan & Deci, 2000b). Pre-service teachers refers to
the students enrolled in teacher education programs at degree granting institutions of
higher education. The MSLQ is “a self-report instrument designed to assess college
students’ motivational orientations and their use of different learning strategies for a
college course” particularly as it relates to the timely completion of course assignments
(Pintrich et al., 1993, p. 801). Educational Technology was defined as “The study and
ethical practice of facilitating learning and improving performance by creating, using and
managing appropriate technological processes and resources” (Richey, 2008, p. 24). The
EDTC 3123 class was an undergraduate level course required for pre-service teachers at a
Midwestern university, focused on planning, developing, and implementing educational
media and technology into classroom instruction. The course also introduces guidelines
for materials development, contemporary applications of computers and other electronic
systems for instruction as well as integration of instructional design, instructional media,
and instructional computing for use personally and in the classroom (OSU Course
Catalogue, 2012-2013). Taking the pieces of the puzzle and putting them together in
light of the research question: Do pre-service teachers enrolled in an introductory
Educational Technology course using Getting Things Done™ software demonstrate an
increase in motivation and self-regulation, the following discussion is offered.
Given the significant results in both the experimental groups and the control
groups for the MSLQ subscales and the Likert-type data, alternative causes for
significance were considered. The researcher is of the opinion that the number of
156
significant results in both groups point to unexpected consequences via an unintentional
cause. The researcher purports there were statistically significant changes in both the
experimental groups and the control groups because course instructors for every section
modeled the components of GTD via their use of D2L, the university online course
platform, for calendaring, reminders, and course materials, which closely mimics the
components of the GTD software for all of the classes. The use of D2L by all instructors
as a forum for assignment updates, course scheduling, and as an organizational tool has
been part of the standard class format for several years. These instructional strategies
have been employed because of the high student enrollment, the high number of
instructors teaching multiple sections every semester, and a standardized, but heavy,
workload for the students. Unfortunately, the standardized utilization of the D2L platform
by instructors in both the experimental groups and control groups was not considered
when the study was designed; consequently, there was little room for making changes in
the format of the course or among the instructors teaching the experimental groups and
control groups.
Therefore, due to course structure, all students were provided with information
and tools to stay connected to and on top of course material via the online course
platform and were not forced to seek out alternative methods to stay organized. The
impact of the experimental intervention had little to do with the statistical outcomes
because all courses are taught the same way. For the experimental groups, iGoogle™
and/or Remember the Milk would have provided them with the tools to current with the
course assignments, but these additional tools were not needed. As Zimmerman (1998a,
p.1) points out “Self-regulated learners, whether historic or contemporary, are

157
distinguished by their view of academic learning as something they do for themselves
rather than as something that is done for them or to them.” The instructors did not
compel the students in the experimental groups to do it for themselves. Ironically,
Zimmerman points out later in the chapter, self-regulated learning is impacted by social
influences such as modeling and social structuring.
One important component of the EDTC 3123 course is the high number of
assignments due throughout the semester, approximately 1 or 2 every week. There are
multiple assignments, projects, quizzes, presentations and group activities. Students in
the class who can juggle the multiple demands of the course and their other courses do
well. Students who struggle to keep up with the assignment due dates, and seemingly
finding it too much to do, typically do not do well in the course because they lack the
organizational skills. The MSLQ descriptive statistics highlight this struggle to keep up
with course demands. It was found that the post-test means decreased from the pre-test
means for all seven of the subscales in the experimental groups and for five of the seven
subscales in the control groups (see Tables 4.2 and 4.4). Zimmerman, Bonner, and
Kovach (2008) offer the opinion that the effective use of study time becomes imperative
to academic success and those students who do not effectively use their study and prep
time are forced into expediency, the exact opposite of self-regulated learning.
Although the Pearson bivariate correlation results revealed several large
correlations between the study variables, the researcher acknowledges that while parts of
the data are significant, not all of the results may be meaningful. Perhaps the data from
the correlations must be looked at as only one part of the whole picture presented in the
study. When taking all of the statistics into consideration, there are questions about the

158
reliability of the data and the concern that the data is confounded by the instructor
influences mentioned previously. For example, Effort Regulation and Time and Study
Environment demonstrated moderately high levels of correlation in both the experimental
groups (r2 = .315) and the control groups (r2 = .373). This indicates there is a definite
relationship between these variables, but since it was seen in both groups, the cause of the
high correlation is suspect and cannot be attributed to the experimental groups’
intervention. Additionally, the high Pearson bivariate correlation results from the MSLQ
pairs may have resulted from the utilization of the same subjects for the pre- and post-test
data collection. Since these are the exact same students, the results should be highly
correlated. Nonetheless, some of the correlations merit further discussion and all deserve
another review in a new study that controls for instructor influences.
One correlation result that should be reviewed is the relationship between Control
of Learning Beliefs and Metacognitive Self-Regulation. This relationship is key for
students who desire to succeed in the classroom. According to Pintrich et al. (1991),
Control of Learning Beliefs refers to students who believe that personal efforts can
positively affect academic performance. Metacognitive Self-Regulation is defined as
being aware of, having knowledge of, and controlling personal cognition. For this study,
23.4% of the variance between the experimental groups’ Control of Learning Beliefs and
Metacognitive Self-Regulation is in common, indicating a moderate positive relationship
between the two variables. These results are consistent with results Sungur and Tekkaya
(2006) found in their research on motivation and self-regulation with 10th grade students
for Control of Learning Beliefs and Metacognitive Self-Regulation (r = 0.503, p < .01).

159
Therefore, those who are aware of their personal cognition may also believe they can
positively affect their academic performance.
The current study attempted to provide pre-service teachers additional tools they
could utilize to be successful, not only in this class, but in their future academic work and
their own classrooms once they have graduated. This study was also a starting point for
future research in a variety of areas and disciplines. The statistical results were
disappointing; however, once a possible root cause was discovered, there came hope that
the study could be improved and conducted again. GTD was seen by the researcher as a
tool to enhance learning and organize the chaos of a high intensity and heavy workload
class. The researcher hoped that GTD would make the class workload and life easier for
the students in the experimental groups. However, whether it was the impact of GTD or
D2L, the goal was to encourage motivation and self-regulation in students. Corno (2008)
says that ongoing use of self-regulation in academic settings increases the likelihood that
the skills will become an automatic response.
One thing to consider is the prevalence of emerging technologies our current pre-
service teachers will access in their own classrooms. Pre-service teachers must learn to
utilize technology as a tool not only in their personal lives, but also in their academic and
professional lives. Many of today’s in-service teachers use computer technology to enter
grades, communicate with parents, and send homework reminders, therefore, pre-service
teachers have to learn to manage the technology themselves so they can do it when they
move into their own classrooms. Dettori, Giannetti, and Persico (2006) conducted a self-
regulation study with pre-service teachers in an online environment. The authors found
that having an online social presence in the community of the online classroom is a key

160
element in self-regulation for online courses. While most of the students did not use
iGoogle™ during the course of the study, the environments created in the iGoogle™
application provide the opportunity to merge school and personal lives. The course
platform, D2L, does provide an online social presence since course members can access
discussion boards, class members’ home pages and class members’ blogs.
Connecting the research to Self-Determination Theory, the theoretical approach
employed in the study, Deci et al. (1994) offer the thought that Self-Determination
Theory assumes that individuals are innately motivated to take on and integrate useful
activities that assist them in negotiating the social environment of their lives. Self-
regulated students must learn to make connections between their social presence and their
academic presence. The incorporation of GTD was intended to provide that type of
guidance for pre-service teachers. Unfortunately, because of the set-up of the course,
those same functions were already included on the D2L platform so many of the students
did not rely on the GTD software. The future goal is to blend the most effective
components of GTD and D2L into a positive and supportive learning experience for pre-
service teachers.
Lastly, even though the results from this study are four years old, the findings are
still important and relevant because they add to the field of Educational Technology in
the area of utilizing online course platforms and software to impact students’ learning,
motivation, and self-regulation. Even though the face of technology has changed
significantly during the last four years, it is believed that students do not yet recognize the
power of the technology they utilize on a daily basis. Students know how to utilize the
technology for personal reasons, but it is critical that students learn how to capitalize on
161
the educational power that lies behind the hand held-devices. Therefore, the researcher
believes that the results from this study are not obsolete because they show how small
interventions can add significantly to the improvement of study skills, assignment
completion, and organization strategies. These are competencies that are still critically
needed in today’s classroom so students understand how to make use of the power of
technology to improve their lives. Additionally, the interview results illustrate the need
for instruction to be student centered, especially in the area of technology. Zimmerman,
Bonner, and Kovach (2008) offer the following belief, developing proficient academic
learning results from developing a skill set based on systematic application of self-
regulatory methods through everyday course assignments.
Limitations
Several limitations became apparent during the analyses of the study results.
First, the study is involuntarily limited because of course design. All instructors
inadvertently modeled GTD behavior through the standardized use of calendaring and
task lists on the online class platform (D2L). This unintentionally impacted the results of
the study since the instructors did the work for the students as opposed to forcing the
students to do the work themselves. Different results may have been found if the students
had been responsible for entering their own information into the GTD software.
Additionally, different results may have been obtained in a class other than the EDTC
course since the EDTC instructors did the work for the students. This can be seen as a
hidden or lurking variable that did not allow the researcher to accurately gauge the power
of the GTD software.

162
Second, the generalizability of the findings of the study are limited because the
results were generated in an Educational Technology course conducted within the
College of Education at a Midwestern university utilizing pre-service teachers. This
study was not designed to produce results generalizable across multiple disciplines or
locations.
Third, the MSLQ, a reliable and valid instrument, was employed to collect pre-
and post-test data from students. Additional data was collected utilizing a Likert-Type
scale developed by the researcher. The Likert-Type scale does not have proven reliability
or validity, so the results generated by this instrument may not have true statistical
significance.
Fourth, only students from the experimental groups were interviewed for the
study because the majority of questions focused on the utilization of the GTD software
rather than the concepts the software reinforced. A more comprehensive picture may
have been obtained with interviews conducted with both the control and experimental
groups related to the type of functions generated by GTD.
Fifth, the high Pearson bivariate correlation results from the MSLQ pairs could be
seen as misrepresentative. In retrospect, these numbers were generated through the
utilization of the same subjects in the pre- and post-test process; therefore, the results
naturally would be highly correlated. Additionally, the higher correlations seen in the
control groups may be explained by non-interference from the researcher, allowing the
control groups to focus only on the organizational assistance provided by the course
instructors on the D2L site.
163
Sixth, students who participated in the study utilized self-reporting to relay
results. Self-report data may be flawed because the results rely on to student opinions,
judgments, and attitudes. Lastly, due to semester time frame constraints, the study was
short-term in nature. Different results may have been obtained with a longer or
longitudinal study.
Implications
Implications for students.
Ease of access and instantaneous information is a hallmark of the current
technological times in which we live. Oblinger and Oblinger (2005) reflect that students
currently on college campuses have never known a world without computers. The
authors also point out these students feel like technology is embedded into the fabric of
their lives. For example, computers have become staples on college campuses, either
personal, in the computer lab, or in the classroom, and students can easily find answers to
questions simply by using their hand-held electronic devices. Embedding the EDTC
course with instantaneous access to course assignments and information provided
students with a specific tool to increase their motivation and self-regulation. Hofer, Yu,
and Pintrich (1998) found that even semester long interventions on metacognition and
self-regulation are helpful in developing self-regulation for college students. The authors
go on to say that increasing students’ knowledge base and capabilities is key in
entrenching their automatic response to utilize their self-regulatory capabilities. Students
should, therefore, be aware that every course they take not only builds their knowledge
base for a subject or skill, but also builds their knowledge base for understanding how
they personally learn best and what is needed for success. Classrooms today need to

164
work with students in expanding their knowledge and skills so that success is seen as
more than a final letter grade in a class, and working with students means that the
technology that they take for granted is an integral part of the classroom and the course
structure.
ISTE (2007) developed a set of National Educational Technology Standards for
Students (NETS-S). These standards put forth the belief that students should use
creativity and innovation to construct knowledge; communicate and collaborate to
support learning; develop research fluency to gather information; utilize critical thinking,
problem solving and decision making to complete course work; understand relevant
issues related to technology; and demonstrate a thorough knowledge of technology
concepts and operations. The EDTC 3123 course was designed around these standards.
The goal of the course was to integrate current technology with teaching practices so
when these students became in-service teachers, they did not have to think twice about
using the computer to develop and implement lesson plans and assignments. Yet given
the heavy workload and the introduction to a plethora of new programs and devices,
students often struggle to stay motivated and current with assignment due dates. A study
of pre-service teachers in an Educational Technology course by Lewis and Litchfield
(2011) found that that those students who believed they could achieve the course goals
were more likely to receive a higher course grade. Therefore, using GTD software to
assist students in achieving course goals could positively impact course grades. The
researcher believes the impact of using organizational software could be much greater
than just raising grades. Meeting the pre-service teachers at their hand-held technological
level and providing them with course imbedded reminders and organizational tools to

165
complete course goals could have big picture effects. This could be a course where
students learn to use technology not only to organize themselves and stay on top of the
coursework in one class, but also, it could have a trickle-down effect in all their classes
and their future career.
Implications for instructors.
Students in today’s schools walk through the classroom door with a multitude of
options available for staying connected. Smart phones, tablets, and computers instantly
connect them to the world around them. Instructors who model this connectivity in their
course content are demonstrating their ability to reach out to students at the students’
level. If a university offers an online platform as part of the educational environment, it
would be worthwhile for instructors to place course content, including due dates and
reminders, on the platform for students to access at their convenience. Students who
need to be reminded of a due date can access the information from their phone or tablet
as opposed to waiting for the next class meeting to learn the information. Thompson
(2007) contends that Web 2.0 has the potential to transform the traditional higher
education model from the long-established classroom structure to an asynchronous 24/7
model. Instructors should be aware that this change is occurring and, while many
continue to operate within the walls of the traditional classroom, these walls are falling
down. To stay as current with technology as the students, changes must occur in course
structure and coursework to meet the students at their level in their world.
Song, Hannafin, and Hill (2007) indicate that the effect of the shared teaching and
learning environment should be evaluated by educators to help understand student needs
and to identify teaching strategies that will help facilitate learning. Togia, Korobili, and

166
Malliari (2012) discovered that IT students who were motivated to learn had greater
cognitive learning outcomes. The authors go on to say that educators should employ
teaching strategies that drive the motivation of their students and connect course
assignments with real-world applications to facilitate student self-efficacy. At the end of
this experimental process, the interview results indicated that students were motivated by
the real-world assignments in this course and the D2L platform met their needs for
connectivity and staying current with assignments. The tools were present in the
experimental groups’ classrooms to increase students’ motivation and self-regulation,
there were confounding factors in the way of achieving the goals. While it is not possible
to return to and follow up with the students who participated in the study to see if GTD
had a long term effect, going forward all educators should make themselves self-aware of
what they are doing within their classrooms that meet the needs of the students, model
connectivity, and encourage motivation and self-regulation. This is important because
the students are the reason we have the classrooms.
Implications for education.
Educators, to be effective instructional leaders, should consider how fast the
world we live in changes and the importance of keeping up with students’ knowledge and
use of technology. Carpenter and Carpenter (2008) believe that successful
implementation of instructional technology in the field of education can occur when the
skills are seen as relevant to the agendas that exist in schools, lifting them from noise to
employment. To ensure technology is successfully put into practice in the school, the
following recommendations were offered. The process should be a teacher-involved
collaborative process, the initial undertakings should be small and manageable, using a
167
versatile program. Finally, teachers should learn alongside students, in some cases, the
students taught the teachers about the technology being implemented. Carpenter and
Carpenter provide the field of education with a simple and basic roadmap to technology
integration. Based on the interview and open-ended question results from this current
study, students are very interested in implementing easily accessible technology tools to
assist them in completing course goals. Levin and Wadmany (2006/2007) found that
technology means different things to different teachers, and integrating technology into
the classroom is a unique process for each educator in their longitudinal study. Overall,
the authors feel that integrating technology into the classroom occurs over a continuum,
moving from seeing technology as a technical tool to seeing it as an empowering partner
for teachers and students. Perhaps, then, the current study can be used as a launching
point of a continuum, not only for future expansion studies, but as a model for educators
in what students are looking for in technology integration to assist them with self-
regulation and motivation for course completion.
McCann and Turner (2004) note that a major stumbling block to learning new
material, task engagement, and assignment completion is a lack of ability to maintain
motivation when confronted with internal and external distractions or obstacles. The
authors offer the opinion that motivation can be maintained and, hence, academic tasks
completed more successfully when students utilize volitional strategies including
reminders, self-rewards and organization. The GTD components of the current study
provided access to several volitional strategies. For the field of education, this means that
implementing volitional strategies to help students succeed is not a costly or time-
168
consuming process. This task can be accomplished inexpensively and with on-hand
tools.
A longitudinal study following students over the course of their academic career
in the College of Education could provide interesting insight. Zimmerman (2000) states
that self-regulation is cyclical and that feedback from earlier performances can be utilized
to make adjustments during current efforts. He goes on to say that this feedback is
important because of the changes in environmental, personal and behavioral factors that
occur during the course of learning. Personally, the researcher believes that the field of
education should employ a similar cyclical feedback loop because changes in the
environment for educators and students are ongoing and staying in tune with how to best
reach students and how to best empower educators to reach the students should be a top
priority. The current research is a starting point, but it is not an ending point for the topic
of GTD in Educational Technology. The study has been examined for issues and
problems and now exciting ideas for how to move forward are presented with the current
results taken into account. Stagnancy should be eliminated as much as possible.
Implications for researchers.
There are many purposes for educational-based research. Some of these purposes
include seeking to uncover new truths and discovering new ways to enhance or improve
the education process for students. The current research was aimed at discovering a new
method to enhance and improve student learning in an Educational Technology course.
Granted, this research has generalizability limitations, but at its core, the goal was to
enhance and improve students’ educational experience. The research data presented in
this study was collected four years before the final pages were written. In those four

169
years, the face of technology has decidedly evolved. There are several new tools utilized
by students on a daily basis, including touch based computer tablets, multipurpose
cellphones, and a variety of new programs and applications. Importantly, even though the
technology has advanced, the idea behind utilizing Getting Things Done ™ software and
online course platforms, has not changed. That idea is still very current and important
since the classroom is normally slow to evolve. Going forward, researchers have to
determine which online programs and applications will successfully fill the void for
students in enhancing their organizational skills such as calendaring and keeping on top
of multiple to-do lists and deadlines. Additionally, these students will become educators
with their own classrooms and research on ways to enhance their organizational skills
would be salient in the areas of classroom management and institutional administration.
Wilson (2011) states that new teachers steadily improve their effectiveness in the
classroom over the first five years of teaching, but 30% of these new teachers leave the
profession in that same time period. What does that mean for researchers? Research
should be conducted in areas that assist in teacher retention and effectiveness. Wilson
goes on to say that one key component of retaining these teachers is to focus the teacher
preparation programs on foundational skills and practices. Furthermore, Shaltry et al.
(2013) note that effective incorporation of technology into the classroom is a key
challenge in our country today. The classroom technological components presented in
this paper offer a foundational technological skill set for effective classroom management
and organization for pre-service teachers. These are the same pre-service teachers who
will quickly become in-service teachers seeking to improve their own classroom skills.
By teaching pre-service teachers how to take care of time management and task lists

170
while students, they will be one step ahead in their development as more effective
teachers once they graduate.
Recommendations for Future Research
The most salient area for future research lies in the area of the D2L platform. Due
to the unexpected consequences of the study, future research should be conducted that
accounts and controls for the online course platform. GTD research should be conducted
without the instructors utilizing the course platform components to accurately account for
treatment effects. Additionally, future research should include interviews with students
from both the experimental and control groups to capture a comprehensive picture of the
study effects. Interview questions should be designed around the concepts and skills that
the GTD software reinforces. One final consideration for this future research idea is to
revisit the participants after a period of time to ascertain if there are long term changes
due to the GTD software and training.
Furthermore, since only one of the interviewed students consistently utilized the
GTD software during the semester, while all of the students utilized the D2L platform,
the researcher believes that those percentages would hold true for the entire experimental
group. Therefore, research should be conducted to measure the motivation and self-
regulation of students as it relates to the D2L platform as opposed to the use of external
GTD products.
Future research should be considered across courses and disciplines. Completing
an Educational Technology course necessitates a hands-on approach and familiarity with
technology components. Different results may be found if the study was conducted in
other courses or in other disciplines.
171
Future research could be conducted with different web-based applications and/or
instruments. The GTD web applications chosen for the study, iGoogle™ and Remember
the Milk, were chosen based on an informal survey of several Educational Technology
sections in semesters preceding data collection. These two applications were favored
among students. Perhaps future studies should utilize different applications.
Additionally, the MSLQ is only one of a multitude of instruments available. Future
research on D2L or motivation and self-regulation may be conducted with different
instruments. Finally, given the proliferation of new hand-held technologies that have
been developed in the four years since the research data was collected, future research
could be conducted utilizing new technologies such as iPhones or personal notebooks.
A longitudinal study could provide a better picture of the effects of GTD.
Therefore future research should look at the long-term effects of GTD and/or the D2L
platform. Additionally, for colleges utilizing a cohort system for students, future research
could be conducted employing multiple instructors all using the same online course
platform and techniques.
GTD training may also be of assistance to freshman college students. A study
might compare groups of new students who went through GTD training during new
student orientation week with those who did not. Would the long-term effects of GTD
make themselves known if freshman were shown a successful way to organize their
education from the very beginning?
One interesting area for future research could lie in the area of combining several
of these ideas. Future research could take a cohort group, instruct them early on in their
coursework on the GTD method, and then follow them through their college years to
172
determine if the GTD has had any effect on their skills and abilities. Would the skills
translate to all courses taken by the students? Since the EDTC 3123 is a required course
for all education majors, the training would cut across all disciplines, providing an
interesting picture of pre-service and in-service teaching at a multitude of facilities and
disciplines.
Moreover, as pre-service teachers transition to in-service teachers, the reality of
having their own classrooms emphasizes the overwhelming responsibility for teaching
multiple classes with multiple students every day. Would training in the GTD method
while in college provide them with practices to use while student teaching or in their own
future classrooms? Would they be more effective teachers because of the training?
Would those practices take place online or offline? A longitudinal study could provide
the answer to those questions.
GTD research could also be conducted with university faculty. With regards to
faculty as instructors, if they were trained in the GTD method, what would the outcome
be for themselves and their classes? Would providing faculty members with the tools to
effectively organize themselves and utilize the online class platform change course
structure, teaching methods, or assignments? Another aspect of being a faculty member
is the scholarly writing that takes place. For those tenure-track faculty members, would
training on the GTD method assist them with their scholarly pursuits? Perhaps the GTD
training could be part of new faculty orientation and be offered each year for new faculty
and any current faculty desiring a refresher course.
Furthermore, how would GTD training affect in-service teachers? The EDTC
3123 course aims to prepare educators to comfortably utilize technology in the classroom

173
but there are many educators in the field who completed their coursework prior to the
standardized inclusion of an Educational Technology course. Could in-service teachers
benefit from the GTD method in organizing their classrooms?
Potential Research Questions
Summarizing the Recommendations for Future Research, one finds that research
with pre-service teachers could be conducted utilizing a variety of alternative methods,
including different instruments or software. Additionally, research could be conducted
with entirely different or expanded populations in diverse settings for alternative periods
of time. Based on these sentiments, potential research questions have been derived from
the recommendations for future research section. One note regarding the design of a
study similar to this dissertation: ensure that the experimental and control groups are as
similar and equal as possible in their makeup. The similarity and equality will allow the
researcher to more decisively ascertain if the treatment makes a difference since
differences will be as controlled as possible. A second note for those designing a similar
study, instructor training should be incorporated in research that is student focused.
Included in the instructor training should be the knowledge that the students should be
required to use the software or course platform included as an independent variable in the
study.
• Do pre-service teachers in an introductory Educational Technology course utilizing
the online course platform demonstrate an increase in motivation and self-
regulation?
• Do college students utilizing Getting Things Done ™ Software demonstrate an
increase in motivation and self-regulation?

174
• Do pre-service teachers in an introductory Educational Technology course utilizing
OmniFocus software, based on David Allen’s book, Getting Things Done (2001),
demonstrate an increase in motivation and self-regulation?
(http://www.omnigroup.com/products/omnifocus)
• Does pre-service teacher motivation and self-regulation change during the school
year as a result of utilizing Getting Things Done ™ software?
• In what way does student motivation and self-regulation change during college
students’ academic career as a result of utilizing Getting Things Done ™ software?
• Do university faculty trained in the Getting Things Done ™ method demonstrate an
increase in motivation and self-regulation towards course instruction and/or
scholarly writing?
• Do pre-service teachers transitioning into in-service teachers demonstrate an
increase in motivation and self-regulation after utilizing Getting Things Done ™
software?
Concluding Remarks
This concludes the dissertation. The study began as a way to investigate an idea
for improving the Educational Technology course at the Midwestern university. After
teaching the course for two years, it became apparent to the researcher that students were
struggling with their self-regulation, mainly a personal struggle with keeping the
multitude of assignments organized and completed on-time. Students were also wrestling
to maintain motivation for the required course. This course is typically taught near the
beginning of the students’ professional education coursework, so it is an introduction to
technology in the classroom and education requirements in general. What was found is

175
that by the end of the course, many students were overwhelmed and frustrated with the
whole process of completing assignments by specific times. The goal was to simplify,
not the course, but students’ approach to and handling of the assignments to keep them
focused and motivated.
Along the way, the study uncovered interesting outcomes. When the instructors
faithfully utilized the course platform as desired by the faculty overseeing the course,
students did improve their attitudes and motivation towards the class. The researcher
believes that the instructors were more faithful in keeping up with the calendaring of
assignments and reminders since they knew that their sections were involved in a study.
While the MSLQ and Likert-type scale results were statistically inconclusive, the
interviews provided a glimpse into the lives of the students taking the course. As
anticipated, students’ motivation levels went down during the semester as they got
bogged down in the workload, but towards the end of the semester when they could see
the big picture of what their new knowledge meant for their future classrooms and they
felt confident in their skills and ability to successfully handle the new programs, their
motivation levels increased. The researcher believes that the D2L platform was part of
the motivation and self-regulation of these students. Every student interviewed
mentioned how important the dates and reminders were to their overall organization.
With regards to the course information on D2L, the following phrase was heard
repeatedly, “I wish all my instructors did this.”
The study revealed the benefits of employing a mixed methods approach. The
two paradigms worked in concert to inform each other and provided additional depth to
the study. While the results of the qualitative interviews and open-ended questions

176
cannot be generalized to a larger population, the results offered a broad picture for this
study that gave the research a sense of understanding for the quantitative results.
Additionally, the quantitative data provided insight for this study and has the potential to
replicated in other settings. The study also revealed the realities of working with human
subjects. Due to the number of sections offered, there were multiple instructors and
while the course format and content is standardized, each instructor has his or her own
way of doing things in the classroom. Additionally, each of the 90 students involved in
the study brought their own way of approaching the course to the table. All of this meant
that the study was impacted by individual personalities no matter how many controls
were put in place. Going forward, this means remembering that human subject studies
may not work the way one wants them to work, but that it is important to conduct the
research to further the knowledge base of the field of study.
In retrospect, it is amazing to think that one intervention could have a large
impact on education. Going forward, to be able to implement GTD training for pre-
service teachers, faculty and in-service teachers would be very helpful for all involved in
the education process. Visualizing a classroom where instructors place course content,
due dates and reminders on a web accessible platform that students can effortlessly
access via any internet connected device would be a huge step forward in the direction
towards maintaining the motivation and self-regulation of students and teachers alike.
Many innovations start small and become something much larger. The desire is for GTD
training, as a classroom organizational tool, to become commonplace across disciplines
and assist students in all areas to improve their learning experience and then take those
experiences into their workplace.

177
REFERENCES
Albion, P. (2007). Web 2.0 in teacher education: two imperatives for action. Computers in
the schools. Retrieved April 1, 2008 from
http://eprints.usq.edu.au/3666/1/Albion_Web_2.0_in_teacher_education.pdf.
Alexander, B. (2006, Marc/April). Web 2.0: A new wave of innovation for teaching and
learning? Educase Review, 41 (2), 33-44.
Allen, D. (2001). Getting things done: The art of stress free productivity. New York:
Viking Penguin.
Allen, I.E. & Seaman, J. (2007, October). Online nation: Five years of growth in online
learning. Needham, MA: The Sloan Consortium.
Ames, C. (1992). Classrooms: Goals, structures, and student motivation. Journal of
Educational Psychology, 84 (3), 261-271.
Anderson, M.D. (2001). Individual characteristics and web-based courses. In C.R. Wolfe
(Ed.), Learning and teaching on the world wide web (pp. 45-72). San Diego,
California: Academic Press.
Aoki, K. & Downes, E.J. (2003). Information overload among college students. Paper
presented at International Conference on Computer Communication and Control
Technologies, Orlando, FL.
Artino Jr., A.R. & Stephens, J.M. (2007). Motivation and self-regulation in online
courses: a comparative analysis of undergraduate and graduate students. M.R.
Simonson (Ed.) Proceedings of the Association of Educational Communications

178
and Technology: Volume 1. Selected Research and Development Paper (pp. 1-9).
Bloomington, IN: AECT.
Ary, D., Jacobs, L.C., & Razavieh, A. (2002). Introduction to research in education
(Sixth edition). Belmont, CA: Wadsworth/Thomson Learning.
Azevedo, R. & Cromley, J.G. (2004). Does training on self-regulated learning facilitate
students’ learning with hypermedia? Journal of Educational Psychology, 96 (3),
523-535.
Bailey, L.W. (2006). A study of motivation and self-regulation among high school
instrumental music students (Doctoral dissertation, Capella University, 2006).
Dissertation Abstracts International, 67.
Bandura, A. (1977). Self-efficacy: Toward a unifying theory of behavioral change.
Psychological Review, 84 (2), 191-215.
Bandura, A. (1989). Regulation of cognitive processes through perceived self-efficacy
Developmental Psychology, 25 (5), 729-735.
Bandura, A. (1991). Social cognitive theory of self-regulation. Organizational Behavior
and Human Decision Processes, 50 (2), 248-287.
Bandura, A. (1993). Perceived self-efficacy in cognitive development and functioning.
Educational Psychologist, 28 (2), 117-148.
Barker, J.R. (1997). An evaluation of the effects of self-regulated learning on USMLE
Step 1 scores at the University of Mississippi School of Medicine (Doctoral
dissertation, Vanderbilt University, 1997). Dissertation Abstracts International,
58,759.
Barlia, L. (1999). High school student’s motivation to engage in conceptual change-

179
learning in science (Doctoral dissertation, The Ohio State University, 1999).
Dissertation Abstracts International, 60, 1435.
Barrett, H.C. (2007, March). Researching electronic portfolios and learner engagement:
The REFLECT Initiative. Journal of Adolescent & Adult Literacy, 50 (6), 436-
449.
Baylor, A.L., Kitsantas, A., & Hu, H. (2003, March). Two tools to facilitate pre-service
teachers’ self-regulation during instructional planning. TechTrends, 47 (2), 45-49.
Bembenutty, H. (2006, April). Preservice teachers’ help seeking tendencies and self-
regulation of learning. Paper presented at the meeting of the American
Educational Research Association, San Francisco, CA.
Bembenutty, H. (2007, April). Preservice teachers’ motivational beliefs and self-
regulation of learning. Paper presented at the meeting of the American
Educational Research Association, Chicago, IL.
Benson, L.F., Farnsworth, B.J., Bahr, D.L., Lewis, V.K., & Shaha, S.H. (2004). The
impact of training in technology assisted instruction on skills and attitudes of pre-
service teachers. Education, 124 (4), 649-663.
Beverly, J.H. (2003). Effects of academic integration on the persistence and achievement
of under-prepared college students (Doctoral dissertation, Florida International
University, 2004). Dissertation Abstracts International, 64, 3605.
Bhattacharyya, S. (2004). Dynamics of motivation and self-regulation among college
pre-service teachers: A cross-cultural perspective (Doctoral dissertation, The
University of Memphis, 2005). Dissertation Abstracts International, 65, 4099.

180
Bitter, G.G. & Pierson, M.E. (2005). Using technology in the classroom (6th ed.)
Massachusetts: Pearson Education, Inc.
Black, A.E. & Deci, E.L. (2000). The effects of instructors’ autonomy support and
students’ autonomous motivation on learning organic chemistry: A self-
determination theory perspective. Science Education, 84 (6), 740-756.
Boekaerts, M. & Cascallar, E. (2006). How far have we moved toward the integration of
theory and practice in self-regulation? Educational Psychology Review, 18 (3),
199-210. doi: 10.1007/s10648-006-9013-4.
Bossidy, L. & Charan, R. (2002). Execution: The discipline of getting things done. New
York: Crown Business.
Braten, I., Samuelstuen, M.S., & Stromso, H.I. (2004, April). Do students’ self-efficacy
beliefs moderate the effects of performance goals on self-regulatory strategy use?
Educational Psychology, 24 (2), 231-247.
Caldwell, E.R. (2006). A comparative study of three instructional modalities in a
computer programming course: Traditional instruction, Web-based instruction,
and online instruction (Doctoral dissertation, The University of North Carolina at
Greensboro, 2007). Dissertation Abstracts International, 67.
Carpenter, D. & Carpenter, M. (2008) All aboard. Learning and Leading with
Technology, 36 (4), 18-21.
Chen, C.S. (2002, Spring). Self-regulated learning strategies and achievement in an
introduction to information systems course. Information Technology, Learning,
and Performance Journal, 20 (1), 11-25.
Clarke, R.B. (2006). Undergraduate mathematic students: How do differences in

181
motivation and learning strategy use affect performance? (Doctoral dissertation,
The University of Memphis, 2007). Dissertation Abstracts International, 67.
Corno, L. (2008). Work habits and self-regulated learning: Helping students find a “will”
from a “way.” In Schunk, D.H. & Zimmerman, B.J. (Eds.) Motivation and self-
regulated learning: Theory, research, and applications (197-222). Mahwah, New
Jersey: Taylor and Francis Group, LLC.
Credé, M. & Phillips, L.A. (2011, August). A meta-analytic review of the motivated
strategies for learning questionnaire. Learning and Individual Differences, 21 (4),
337-346.
Creswell, J.W. (2003). Research Design: Qualitative, quantitative, and mixed method
approaches (2nd ed.). Thousand Oaks, California: Sage Publications, Inc.
Creswell, J.W. & Plano-Clark, V.L. (2007). Designing and conducting mixed methods
research. Thousand Oaks, California: Sage Publications, Inc.
Davidson, J. (2005). The complete idiots guide to getting things done. New York:
Alpha Books.
Deci, E.L., Eghrari, Patrick, B.C., & Leone, D.R. (1994, March). Facilitating
internalization: The self-determination theory perspective. Journal of
Personality, 62 (1), 119-142.
Deci, E.L., Koestner, R., & Ryan, R.M. (2001, Spring). Extrinsic rewards and intrinsic
motivation in education: Reconsidered once again. Review of Educational
Research, 71 (1), 1-27.
Delfino, M. & Persico, D. (2007). Online or face-to-face? Experimenting with different
182
techniques in teacher training. Journal of Computer Assisted Learning, 23, 351-
365.
Dempsey, J.V. & Van Eck, R.M. (2002). Instructional design on-line: Evolving
expectations. In R.A. Reiser & J.V. Dempsey (Eds.). Trends and issues in
instructional design and technology (pp. 281-294). Upper Saddle River, NJ:
Pearson Education, Inc.
Dettori, G., Giannetti, T., Persico, D. (2006). SRL in online cooperative learning:
implications for pre-service teacher training. European Journal of Education, 41
(3/4), 397-414.
Dexter, S., Doering, A.H., & Riedel, E.S. (2006). Content area specific technology
integration: A model for educating teachers. Journal of Technology and Teacher
Education, 14 (2), 325-345.
Duncan, T.G. & McKeachie, W.J. (2005). The making of the motivated strategies for
learning questionnaire. Educational Psychologist, 40 (2), 117-128.
Dunigan, A.B. (2003). Motivation and learning strategies of students in distance
education (Doctoral dissertation, The University of Southern Mississippi, 2004).
Dissertation Abstracts International, 64, 3256.
Eide, B.J. (1998). Integrating learning strategy instruction in an intermediate accounting
course: Changes in accounting majors’ learning strategy use and course
performance (Doctoral dissertation, Virginia Commonwealth University, 1999).
Dissertation Abstracts International, 59, 2314.
Fallows, J. (2004, July/August). Organize your life! The Atlantic Monthly, 249 (1), 171-
176.

183
Foley, B. & Chang, T. (2006, April). Wiki as a professional development tool. Paper
presented at the meeting of the American Educational Research Association, San
Francisco, CA. Retrieved April 1, 2008 from
http://www.csun.edu/~bfoley/AERA_Wiki.pdf.
Fredricksen, D.E. (2004). A study of the on-line learning strategy predictors of
motivation, as well as the difference between in-class and on-line learning
strategy and motivation scores, among students enrolled in undergraduate courses
at Dallas Baptist University (Doctoral dissertation, Southwestern Baptist
Theological Seminary, 2004). Dissertation Abstracts International, 65, 426.
Gall, M.D., Borg, W.R., & Gall, J.P. (1996). Educational research: An introduction (6th
ed). White Plains, NY: Longman Publishers.
Gilles, L.T. (1994, January). The assessment of student study skills and learning
strategies to prepare teachers for academic advising tasks or the prevalidation of
Motivated Strategies for Learning Questionnaire (MSLQ), Learning and Study
Strategies Inventory (LASSI), and Test of Reactions and Adaptation to College
(TRAC). (ERIC Document Reproduction Service No. ED372035) Retrieved
April 1, 2008 from
http://eric.ed.gov/ERICDocs/data/ericdocs2sql/content_storage_01/0000019b/80/
15/bf/19.pdf.
Hardman, J. & Carpenter, D. (2007, February). Breathing fire into web 2.0.
International Society for Technology in Education, 18-21.
Harlow, J.E. (2006). Social integration, motivational orientation, and self-regulated

184
learning strategies of online versus face-to-face theological seminary biblical
language students (Doctoral dissertation, The University of North Carolina at
Greensboro, 2006). Dissertation Abstracts International, 67.
Hatcher, J.P. (1999). A casual comparative study: Motivational and learning strategies of
developmental and non-developmental freshman English composition students at
Mississippi community colleges (Doctoral dissertation, The University of
Mississippi, 2000). Dissertation Abstracts International, 61, 1317.
Hernandez-Ramos, P. (2004, Summer). Web logs and online discussions as tools to
promote reflective practice. The Journal of Interactive Online Learning, 3 (1), 1-
16.
Hofer, B.K., Yu, S.L., & Pintrich, P.R. (1998). Teaching college students to be self-
regulated learners. In D.H. Schunk & B.J. Zimmerman (Eds.), Self-Regulated
Learning, (pp. 57-85). New York, NY: The Guilford Press.
Hurn, J.L. (2006). An analysis of the effects of online practice quizzes on the
achievement, self-efficacy, and academic motivation of college algebra students
at a community college (Doctoral dissertation, Kansas State University, 2006).
Dissertation Abstracts International, 67.
ISTE (2007). NETS for students 2007. International Society for Technology in
Education. Retrieved March 3, 2013 from http://www.iste.org/standards/nets-for-
students/nets-student-standards-2007.
Joo, Y.-J., Bong, M., & Choi, H.-J. (2000). Self-efficacy for self-regulated learning,
academic self-efficacy, and internet self-efficacy in web-based instruction.
Educational Technology Research and Development, 48 (2), 5-17.

185
Kaya, S. (2007). The influences of student views related to mathematics and self-
regulated learning on achievement of Algebra I students (Doctoral dissertation,
The Ohio State University, 2008). Dissertation Abstracts International, 68.
Kennedy, L.L.J. (2007). The effects of self-determination theory on learning and
motivation of repeating students in a high school earth science classroom
(Doctoral dissertation, The University of North Carolina at Greensboro, 2007).
Dissertation Abstracts International, 68.
Kennedy, M.M. (1999). The role of preservice teacher education. In L. Darling-
Hammond & G. Sykes (Eds.). Teaching as the Learning Profession: Handbook
of Teaching and Policy (pp. 54-86). San Francisco, CA: Jossey Bass.
Kinzie, M.B. (1990). Requirements and benefits of effective interactive instruction:
Learner control, self-regulation, and continuing motivation. Educational
Technology Research and Development, 38 (1), 5-21.
Kitsantas, A. & Baylor, A. (2001). The impact of the instructional planning self-reflective
tool on preservice teacher performance, disposition, and self-efficacy beliefs
regarding systematic instructional planning. Educational Technology Research
and Development, 49 (4), 97-106.
Kitsantas, A. & Talleyrand, R.M. (2005, Summer). The use of online resources to
promote multicultural competencies among k-12 preservice teachers: A model for
self-regulatory learning. Education, 125 (4), 627-637.
Kremer-Hayon, L. & Tillema, H.H. (1999). Self-regulated learning in the context of
teacher education. Teaching and Teacher Education, 15, 507-522.
Krupczak et al. (2005, October). Work in progress – case study of a technological

186
literacy and non-majors engineering course. Paper presented at the ASEE/IEEE
Frontiers in Education Conference, Indianapolis, IN.
Kumar, S. & Vigil, K. (2011, Summer). The net generation as preservice teachers:
Transferring familiarity with new technologies to educational environments.
International Society for Technology in Education, 27 (4), 144-153.
Kuyper, H., van der Werf, M.P.C., & Lubbers, M.J. (2000). Motivation, meta-cognition
and self-regulation as predictors of long term educational attainment. Educational
Research and Evaluation, 6 (3), 181-205.
Kuzu, A. (2007, July). Views of preservice teachers on blog use for instruction and
social interaction. Turkish Online Journal of Distance Education, 8 (3), 34.51.
Lens, W. & Vansteenkiste, M. (2008). Promoting self-regulated learning: A motivational
analysis. In Schunk, D.H. & Zimmerman, B.J. (Eds.) Motivation and self-
regulated learning: Theory, research, and applications (141-168). Mahwah, New
Jersey: Taylor and Francis Group, LLC.
Levin, T. & Wadmany, R. (2006/2007, Winter). Teachers’ beliefs and practice in
technology-based classrooms: A developmental view. Journal of Research on
Technology in Education, 39 (2), 157-181.
Levin, T. & Wadmany, R. (2008). Teachers views on factors affecting effective
integration of information technology in the classroom: Developmental scenery.
Journal of Technology and Teacher Education, 16 (2), 233-263.
Lewis, J. P. (2006). Effects of self-regulated learning on metacognitive strategies,

187
academic performance, and transfer of preservice teachers in an educational
technology class (Doctoral dissertation, University of South Alabama, 2006).
Dissertation Abstracts International, 67.
Lewis, J.P. & Litchfield, B.C. (2011, Winter). Effects of self-regulated learning
strategies on preservice teachers in an educational technology course. Education,
132 (2), 455-462.
Linnenbrink, E.A. & Pintrich, P.R. (2002). Motivation as an enabler for academic
success. School Psychology Review, 31 (3), 313-327.
Linnenbrink, E.A. & Pintrich, P.R. (2003). The role of self-efficacy beliefs in student
engagement and learning in the classroom. Reading and Writing Quarterly, 19
(2), 119-137.
Lynch, R. & Dembo, M. (2004, August). The relationship between self-regulation and
online learning in a blended context. International Review of Research in Open
and Distance Learning, 5 (2), 1-16.
Madden, M. & Fox, S. (2006, October 5). Riding the waves of “web2.0”: More than a
buzzword, but still not easily defined. Pew Internet & American Life Project.
Retrieved April 12, 2008 from
http://www.pewinternet.org/pdfs/PIP_Web_2.0.pdf.
Maloney, E.J. (2007, January 5). What web 2.0 can teach us about learning. Chronicle
of Higher Education, 53 (18), B26.
Mann, M. (2004, September 8). Getting started with “getting things done.” Retrieved
April 7, 2008 from http://www.43folders.com/2004/09/08/getting-started-with-
getting-things-done.

188
Matthews, B. (2004). The effects of direct and problem-based learning instruction in an
undergraduate introductory engineering graphics course (Doctoral dissertation,
North Carolina State University, 2005). Dissertation Abstracts International, 65,
4151.
Maupin, D.L. (2003). A comparison of demographics, motivation, and learning
strategies of college students taking traditional campus-based courses and
Internet-based distance learning courses (Doctoral dissertation, Florida Atlantic
University, 2004). Dissertation Abstracts International, 64, 3653.
McCann, E.J. & Turner, J.E. (2004, September). Increasing student learning through
volitional control. Teachers College Record, 106 (9), 1695-1714.
McClendon, R.C. (1996, September). Motivation and cognition of preservice teachers:
MSLQ. Journal of Instructional Psychology, 23 (3), 216-220.
McClendon, R.C. (1993). Construct validity of the MSLQ and cognition as related to
motivation and learning strategy use of perspective teachers (Doctoral
dissertation, The University of Akron, 1994). Dissertation Abstracts
International, 54, 4369.
Michel, C.P. (2005, July). Life Hack 101: Getting things done. U.S. Naval Institute
Proceedings, 131 (7), 96.
Miles, M.B. & Huberman, A.M. (1984, May). Drawing valid meaning from qualitative
data: Toward a shared craft. Educational Researcher, 13 (5), 20-30.
Missildine, M.L. (2004). The relations between self-regulated learning, motivation,
189
anxiety, attributions, student factors, and mathematics performance among fifth-
and sixth-grade learners (Doctoral dissertation, Auburn University, 2004).
Dissertation Abstracts International, 65, 2128.
Morrison, G. R. & Lowther, D. L. (2005). Integrating computer technology into the
classroom (3rd ed.) New Jersey: Pearson Merrill Prentice Hall.
National Center for Education Statistics (2007). Educational Technology in Teacher
Education Programs for Initial Licensure: Statistical Analysis Report, December
2007. Retrieved April 12, 2008 from http://nces.ed.gov/pubs2008/2008040.pdf.
Oblinger, D.G. & Oblinger, J.L (2005). Introduction. In Oblinger, D.G. & Oblinger, J.L.
(Eds.) Educating the net generation (1.1-1.5). Retrieved March 3, 2013 from
http://www.educause.edu/research-and-publications/books/educating-net-
generation.
O’Reilly, T. (2005, September 30). What is web 2.0: Design patterns and business
models for the next generation of software. Retrieved April 7, 2008 from
http://www.oreillynet.com/lpt/a/6228.
Oklahoma State University. (2012). OSU 2012-2013 University Catalogue. Stillwater,
OK: Transcript Press, Inc. Retrieved March 23, 2013 from
http://registrar.okstate.edu/images/2012Catalog/2012-2013_catalog-final.pdf.
Oliver, K. (2007). Leveraging web 2.0 in the redesign of a graduate-level technology
integration course. TechTrends, 51 (5), 55-61.
OmniFocus (2013). OmniFocus Software. Retrieved April 20, 2013 from
http://www.omnigroup.com/products/omnifocus.

190
Ottesen, E. (2007). Teachers “in the making”: Building accounts of teaching. Teaching
and Teacher Education, 23 (5), 612-623.
Pajares, F. (2002, Spring). Gender and perceived self-efficacy in self-regulated learning.
Theory into Practice, 41 (2), 116-125.
Pajares, F. (2008). Motivational role of self-efficacy beliefs in self-regulated learning. In
Schunk, D.H. & Zimmerman, B.J. (Eds.) Motivation and self-regulated learning:
Theory, research, and applications (111-139). Mahwah, New Jersey: Taylor and
Francis Group, LLC.
Paris, S.G. & Winograd, P. (2003). The role of self-regulated learning in contextual
teaching: Principals and practices for teacher preparation. Washington, D.C.:
Office of Educational Research and Improvement.
Perry, N.E., Phillips, L. & Dowler, J. (2004, September). Examining features of tasks
and their potential to promote self-regulated learning. The Elementary School
Journal, 106 (9), 1854-1878.
Perry, N.E., Phillips, L. & Hutchinson, L. (2006). Mentoring student teachers to support
self-regulated learning. The Elementary School Journal, 106 (3), 237-254.
Pierce, J.W. & Kalkman, D.L. (2003, Spring). Applying learner-centered principles in
teacher education. Theory into Practice, 42 (2), 127-132.
Pintrich, P.R. (2000). The role of goal orientation in self-regulated learning. In M.
Boekearts, P.R. Pintrich, & M. Zeidner (Eds.), Handbook of Self-Regulation (pp.
451-502). San Diego, California: Academic Press.
Pintrich, P.R. (2003). A motivational science perspective on the role of student

191
motivation in learning and teaching contexts. Journal of Educational Psychology,
95 (4), 667-686.
Pintrich, P.R. (2004, December). A conceptual framework for assessing motivation and
self-regulated learning in college students. Educational Psychology Review, 16
(4), 385-407.
Pintrich, P.R. & DeGroot, E.V. (1990). Motivation and self-regulated learning
components of classroom academic performance. Journal of Educational
Psychology, 82 (1), 33-40.
Pintrich, P.R., Smith, D.A., Garcia, T., & McKeachie, W.J. (1991). A manual for the use
of the motivated strategies for learning questionnaire (MSLQ). Ann Arbor:
University of Michigan, National Center for Research to Improve Postsecondary
Teaching and Learning.
Pintrich, P.R., Smith, D.A., Garcia, T., & McKeachie, W.J. (1993). Reliability and
predictive validity of the motivated strategies for learning questionnaire (mslq).
Educational and Psychological Measurement, 53, 801-813.
Pokay, P. & Blumenfeld, P.C. (1990). Predicting achievement early and late in the
semester: The role of motivation and use of early learning strategies. Journal of
Educational Psychology, 82 (1), 41-50.
Puzziferro, M. (2006). Online technologies self-efficacy, self-regulated learning, and
experimental variables as predictors of final grade and satisfaction in college-level
courses (Doctoral dissertation, New York University, 2006). Dissertation Abstracts
International, 66.
Pyrczak, F. (2006). Making sense of statistics: A conceptual overview. (Fourth edition).

192
Glendale, CA: Pyrczak Publishing.
Quick, D.G. (2000). Using experiential constructivist teaching methods in the college
classroom: Learning motivation in an American History Course (Doctoral
dissertation, Colorado State University, 2001). Dissertation Abstracts
International, 62, 99.
Randi, J. (2004, September). Teachers as self-regulated learners. Teachers College
Record, 106, 1825-1853.
Randi, J. & Corno, L. (2000). Teacher innovations in self-regulated learning. In M.
Boekearts, P.R. Pintrich, & M. Zeidner (Eds.), Handbook of Self-Regulation (pp.
651-685). San Diego, California: Academic Press.
Reed, B.J. (2003). Influences upon academic achievement: The relationships among
cognitive strategies, metacognitive strategies and motivation (Doctoral
dissertation, Wayne State University, 2004). Dissertation Abstracts International,
63, 4344.
Revere, L. & Kovach, J.V. (2011). Online technologies for engaged learning: A
meaningful synthesis for educators. The Quarterly Review of Distance Education,
12 (2), 113-124.
Richardson, J.T.E. (2007). Motives, attitudes and approaches to studying in distance
education. Higher Education, 54 (3), 385-416. doi: 10.1007/s10734-006-9003-y.
Richey, R.C. (2008). Reflections on the 2008 AECT Definitions of the Field.
TechTrends, 52 (1) 24-25.
Roberts, T.G., Dooley, K.E., Harlin, J.F. & Murphrey, T.P. (2006, Fall). Competencies
193
and traits of successful agricultural science teachers. Journal of Career and
Technical Education, 22 (2), 6-17.
Robinson, C. (2003, Fall). The battle of the toolbooks. The Journal for Quality and
Participation, 26 (3), 4-19.
Rollett, H. et al. (2007). The web 2.0 way of learning with technologies. International
Journal of Learning Technology, 3 (1), 87-101.
Ruiz, E.C. (2006). Rhizomatous motivational aspects of Hispanic/Latino students in
regular high school programs (Doctoral dissertation, Texas A&M University,
2007). Dissertation Abstracts International, 67.
Ryan, R.M. (1998). Commentary: Human psychological needs and the issues of volition,
control, and outcome focus. In J. Heckhausen & C.S. Dweck (Eds.) Motivation
and Self-Regulation Across the Life Span (pp. 114-134).Cambridge, United
Kingdom: Cambridge University Press.
Ryan, R.M. & Deci, E.L. (2000a). Self-determination theory and the facilitation of
intrinsic motivation, social development, and well-being. American Psychologist,
55 (1), 68-78.
Ryan, R.M. & Deci, E.L. (2000b). Intrinsic and extrinsic motivations: Classic definitions
and new directions. Contemporary Educational Psychology, 25, 54-67.
Ryan, R.M. & Deci, E.L. (2002). Overview of self-determination theory: An organismic
dialectical perspective. In E.L. Deci & R.M. Ryan (Eds.) Handbook of Self-
Determination Research. (pp. 3-33). Rochester, NY: The University of
Rochester Press.
Ryan, R.M. & Deci, E.L. (2006, December). Self-regulation and the problem of human

194
autonomy: Does psychology need choice, self-determination, and will? Journal
of Personality, 74 (6), 1557-1586.
Sanders, C.S. (2002). Integrating multimedia in technology education to improve college
student comprehension, problem-solving skills, and attitudes toward instructional
effectiveness (Doctoral dissertation, North Carolina State University, 2003).
Dissertation Abstracts International, 64, 119.
Schrum, L. (1999). Technology professional development for teachers. Educational
Technology Research and Development, 47 (4), 83-90.
Schunk, D. H. (2008). Attributions as motivators of self-regulated learning. In Schunk,
D.H. & Zimmerman, B.J. (Eds.) Motivation and self-regulated learning: Theory,
research, and applications (245-266). Mahwah, New Jersey: Taylor and Francis
Group, LLC.
Schunk, D.H. & Ertmer, P.A. (1999). Self-regulatory processes during computer skill
acquisition: Goal and self-evaluative influences. Journal of Educational
Psychology, 91 (2), 251-260.
Schunk, D.H. & Ertmer, P.A. (2000). Self-regulation and academic learning: Self-
efficacy enhancing interventions. In M. Boekearts, P.R. Pintrich, & M. Zeidner
(Eds.), Handbook of Self-Regulation (pp. 631-649). San Diego, California:
Academic Press.
Schunk, D.H. & Zimmerman, B.J. (1998). Conclusions and future directions for
academic interventions. In Authors (Eds.), Self-Regulated Learning, (pp. 225-
235). New York, NY: The Guilford Press.
Selvester, P.M. (2004). Self-regulated learning: Understanding how preservice teachers

195
learn to teach (Doctoral dissertation, University of Southern California, 2005).
Dissertation Abstracts International, 65, 3343.
Shaltry, C., Henriksen, D., Wu, M.L., & Dickson, W.P. (2013). Teaching pre-service
teachers to integrate technology: Situated learning with online portfolios,
classroom websites and facebook. TechTrends, 57 (3), 20-25.
Song, L., Hannafin, M.J., & Hill, J.R. (2007, February). Reconciling beliefs and practices
in teaching and learning. Educational Technology Research and Development, 55
(1), 27-50.
Sorin, R. (2004). Webfolio: An online learning community to help link university studies
and classroom practice in preservice teacher education. Australasian Journal of
Educational Technology, 20 (1), 101-113.
Spencer, D. (1999). Differences in motivated strategies and learning strategies of
traditional and non-traditional age undergraduates enrolled in elective general
education courses (Doctoral dissertation, University of San Francisco, 1999).
Dissertation Abstracts International, 60, 1867.
Sprague, D. (2004). Technology and teacher education: Are we talking to ourselves?
Contemporary Issues in Technology and Teacher Education, 3 (4), 353-361.
Strudler, N. & Wetzel, K. (1999). Lessons from exemplary colleges of education: Factors
affecting technology integration in preservice programs. Educational Technology
Research and Development, 47 (4), 63-81.
Sullivan, M.E. (2003). Self-regulated learning of medical students: Assessment of a
social cognitive model (Doctoral dissertation, University of Southern California,
2004). Dissertation Abstracts International, 65, 1665.

196
Sungur, S. & Tekkaya, C. (2006, May/June). Effects of problem-based learning and
traditional instruction on self-regulated learning. The Journal of Educational
Research, 99 (5), 307-317.
Tarafdar, M., & Tu, Q., Ragu-Nathan, B.S., & Ragu-Nathan, T.S. (2007, Summer). The
impact of technostress on role stress and productivity. Journal of Management
Information Systems, 24 (1), 301-328.
Thompson, J. (2007, April/May). Is education 1.0 ready for web 2.0 students? Innovate,
3 (4). Retrieved April 12, 2008 from
http://www.innovateonline.info/index.php?view=article&id=393.
Thongnoum, D. (2002). Self-efficacy, goal orientations, and self-regulated learning in
Thai students (Doctoral dissertation, Oklahoma State University, 2003).
Dissertation Abstracts International, 64, 2004.
Tillema, H.H. & Kremer-Hayon, L. (2002). “Practicing what we preach” – teacher
educators’ dilemmas in promoting self-regulated learning: A cross case
comparison. Teaching and Teacher Education, 18, 593-607.
Togia, A., Korobili, S., & Malliari, A. (2012). Motivation to learn and learning strategies:
IT courses in a library and information science department. Library Review, 61
(1), 41-56. doi: 10.1108/00242531211207415.
Topper, A. (2004). How are we doing? Using self-assessment to measure changing
teacher technology literacy within a graduate educational technology program.
Journal of Technology and Teacher Education, 12 (3), 303-317.
Ulkins, D.S. (2007). The impact of single-gender classrooms on science achievement of

197
middle school gifted girls (Doctoral dissertation, Walden University, 2007).
Dissertation Abstracts International, 68.
Vansteenkiste, M., Lens, W., & Deci, E.L. (2006). Intrinsic versus extrinsic goal
contents in self-determination theory: Another look at the quality of academic
motivation. Educational Psychologist, 41 (1), 19-31.
Vansteenkiste, M., et al. (2004). Motivating learning, performance, and persistence: The
synergistic effects of intrinsic goal contents and autonomy-supportive contexts.
Journal of Personality and Social Psychology, 87(2), 246-260.
Wang, L., Ertmer, P.A., & Newby, T.J. (2004, Spring). Increasing preservice teachers’
self-efficacy beliefs for technology integration. Journal of Research on
Technology in Education, 36 (3), 231-250.
Warneke, C.A. (2000). Characteristics of help-seekers and non-help-seekers among
developmental math students (Doctoral dissertation, The University of Akron,
2000). Dissertation Abstracts International, 61, 487.
Wassell, B. & Crouch, C. (2008). Fostering connections between multicultural education
and technology: Incorporating weblogs into preservice teacher education.
Journal of Technology and Teacher Education, 16 (2), 211-232.
Wikipedia (2008). Percy Redfern Creed. Retrieved April 12, 2008 from
http://en.wikipedia.org/wiki/Percy_Redfern_Creed.
Wikipedia (2008). Web 2.0. Retrieved April 12, 2008 from
http://en.wikipedia.org/wiki/Web_2.
Willems, P.P. (2000). The effects of situated cognition, academic efficacy, and intrinsic
198
motivation in education students’ learning if reciprocal teaching (Doctoral
dissertation, University of Florida, 2001). Dissertation Abstracts International,
61, 4676.
Wilson, S.M. (2011, October). How can we improve teacher quality? The Phi Delta
Kappan, 93 (2), 64-67.
Winne, P.H. (1995). Inherent details in self-regulated learning. Educational Psychologist,
30 (4), 173-187.
Wolfe, C.R. (2001). Creating informal learning environments on the world wide web. In
Author (Ed.), Learning and teaching on the world wide web (pp. 91-112). San
Diego, California: Academic Press.
Wolters, C.A. (1998). Self-regulated learning and college students’ regulation of
motivation. Journal of Educational Psychology, 90 (2), 224-235.
Wolters, C.A. (2003a). Regulation of motivation: Evaluating an underemphasized aspect
of self-regulated learning. Educational Psychologist, 38 (4), 189-205.
Wolters, C.A. (2003b). Understanding procrastination from a self-regulated learning
perspective. Journal of Educational Psychology, 95 (1), 179-187.
Wolters, C.A., Pintrich, P.R., & Karabenick, S.A. (2003, March). Assessing academic
self-regulated learning. Paper presented at the Conference on Indicators of
Positive Development: Definitions, Measures and Prospective Validity,
Washington, D.C.
Wu, J.H. (2006). Significant factors in college students’ motivation and learning
strategies in English courses in Taiwan (Doctoral dissertation, University of the
Incarnate Word, 2007). Dissertation Abstracts International, 67.

199
Zachariah, S. (1995). The effects of multimedia-based instruction on the academic
achievement of students studying economics (Doctoral dissertation, The
University of Akron, 1996). Dissertation Abstracts International, 57, 1108.
Zimmerman, B.J. (1986). Becoming a self-regulated learner: Which are the key
subprocesses? Contemporary Educational Psychology, 11 (4), 307-313.
Zimmerman, B.J. (1998a). Developing self-fulfilling cycles of academic regulation: An
analysis of exemplary instructional models. In D.H. Schunk & B.J. Zimmerman
(Eds.), Self-Regulated Learning, (pp. 1-19). New York, NY: The Guilford Press.
Zimmerman, B.J. (1998b). Academic studying and the development of personal skill: A
self-regulatory perspective. Educational Psychologist, 33 (2/3), 73-86.
Zimmerman, B.J. (2000). Attaining self-regulation: A social perspective. In M.
Boekaerts, P.R. Pintrich, & M. Zeidner (Eds.), Handbook of Self-Regulation (pp.
13-39). San Diego, CA: Academic Press.
Zimmerman, B.J. (2002, Spring). Becoming a self-regulated learner: An overview.
Theory Into Practice, 41 (2), 64-70.
Zimmerman, B.J. (2008, March). Investigating self-regulation and motivation: Historical
background, methodological developments, and future prospects. American
Educational Research Journal, 45 (1), 166-183.
Zimmerman, B.J., Bonner, S., & Kovach, R. (2008). Developing self-regulated learners:
Beyond achievement to self-efficacy. Washington, D.C.: American Psychological
Association.
Zimmerman, B.J. & Kitsantas, A. (1997). Developmental phases in self-regulation:

200
shifting from process goals to outcome goals. Journal of Educational
Psychology, 89 (1), 29-36.
Zimmerman, B.J. & Martinez-Pons, M. (1990). Student differences in self-regulated
learning: Relating grade, sex, and giftedness to self-efficacy and strategy use.
Journal of Educational Psychology, 82 (1), 51-59.
Zimmerman, B.J. & Schunk, D.H. (2008). Motivation: An essential dimension of self-
regulated learning. In Schunk, D.H. & Zimmerman, B.J. (Eds.) Motivation and
self-regulated learning: Theory, research, and applications (1-30). Mahwah, New
Jersey: Taylor and Francis Group, LLC.
Zuckerman, M., Porac, J., Lathin, D., Smith, R., & Deci, E.L. (1978). On the importance
of self-determination for intrinsically-motivated behavior. Personality and Social
Psychology Bulletin, 4 (3), 443-446.
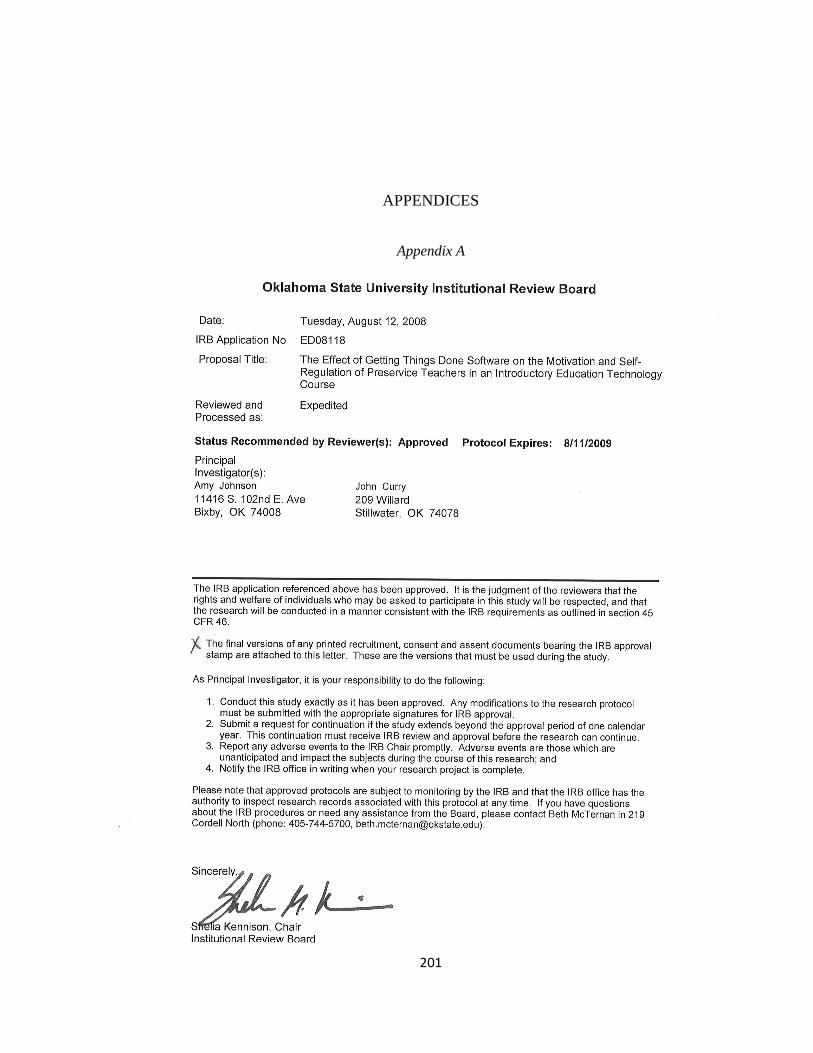
201
APPENDICES
Appendix A

202
Appendix B
Appendix B MSLQ by Pintrich, Smith, Garcia, and McKeachie (1991, 1993)
Do not put your name on the form. You may quit at any time without consequence.
Please rate each of the following items based on your behavior in this class: Your rating should be on a 7 point scale where:
1 = not true at all of me, 4 = neutral, 7 = very true of me.
Part A:
1. In a class like this, I prefer course material that really challenges me so I can learn new
things.
2. If I study in appropriate ways, then I will be able to learn the material in this course.
3. When I take a test I think about how poorly I am doing compared with other students.
4. I think I will be able to use what I learn in this course in other courses.
5. I believe I will receive an excellent grade in this class.
6. I’m certain I can understand the most difficult material presented in the readings for this
course.
7. Getting a good grade in this class is the most satisfying thing for me right now.
8. When I take a test I think about items on other parts of the test I can’t answer.
9. It is my own fault if I don’t learn the material in this course.
10. It is important for me to learn the course material in this class.
11. The most important thing for me right now is improving my overall grade point average,
so my main concern in this class is getting a good grade.
12. I’m confident I can learn the basic concepts taught in this course.
13. If I can, I want to get better grades in this class than most of the other students.
14. When I take tests I think of the consequences of failing.

203
15. I’m confident I can understand the most complex material presented by the instructor in
this course.
16. In a class like this, I prefer course material that arouses my curiosity, even if it is difficult
to learn.
17. I am very interested in the content area of this course.
18. If I try hard enough, then I will understand the course material.
19. I have an uneasy, upset feeling when I take an exam.
20. I’m confident I can do an excellent job on the assignments and tests in this course.
21. I expect to do well in this class.
22. The most satisfying thing for me in this course is trying to understand the content as
thoroughly as possible.
23. I think the course material in this class is useful for me to learn.
24. When I have the opportunity in this class, I choose course assignments that I can learn
from even if they don’t guarantee a good grade.
25. If I don’t understand the course material, it is because I didn’t try hard enough.
26. I like the subject matter of this course.
27. Understanding the subject matter of this course is very important to me.
28. I feel my heart beating fast when I take an exam.
29. I’m certain I can master the skills being taught in this class.
30. I want to do well in this class because it is important to show my ability to my family,
friends, employer, or others.
31. Considering the difficulty of this course, the teacher, and my skills, I think I will do well in
this class.

204
Please rate each of the following items based on your behavior in this class: Your rating should be on a 7 point scale where:
1 = not true at all of me, 4 = neutral, 7 = very true of me. Part B:
32. When I study the readings for this course, I outline the material to help me organize my
thoughts.
33. During class time I often miss important points because I’m thinking of other things.
34. When studying for this course, I often try to explain the material to a classmate or friend.
35. I usually study in a place where I can concentrate on my course work.
36. When reading for this course, I make up questions to help focus my reading.
37. I often feel so lazy or bored when I study for this class that I quit before I finish what I
planned to do.
38. I often find myself questioning things I hear or read in this course to decide if I find them
convincing.
39. When I study for this class, I practice saying the material to myself over and over.
40. Even if I have trouble learning the material in this class, I try to do the work on my own,
without help from anyone.
41. When I become confused about something I’m reading for this class, I go back and try to
figure it out.
42. When I study for this course, I go through the readings and my class notes and try to find
the most important ideas.
43. I make good use of my study time for this course.
44. If course readings are difficult to understand, I change the way I read the material.
45. I try to work with other students from this class to complete the course assignments.

205
46. When studying for this course, I read my class notes and the course readings over and
over again.
47. When a theory, interpretation, or conclusion is presented in class or in the readings, I try
to decide if there is good supporting evidence.
48. I work hard to do well in this class even if I don’t like what we are doing.
49. I make simple charts, diagrams, or tables to help me organize course material.
50. When studying for this course, I often set aside time to discuss course material with a
group of students from the class.
51. I treat the course material as a starting point and try to develop my own ideas about it.
52. I find it hard to stick to a study schedule.
53. When I study for this class, I pull together information from different sources, such as
lectures, readings, and discussions.
54. Before I study new course material thoroughly, I often skim it to see how it is organized.
55. I ask myself questions to make sure I understand the material I have been studying in this
class.
56. I try to change the way I study in order to fit the course requirements and the instructor’s
teaching style.
57. I often find that I have been reading for this class but don’t know what it was all about.
58. I ask the instructor to clarify concepts I don’t understand well.
59. I memorize key words to remind me of important concepts in this class.
60. When course work is difficult, I either give up or only study the easy parts.
61. I try to think through a topic and decide what I am supposed to learn from it rather than
just reading it over when studying for this course.
206
62. I try to relate ideas in this subject to those in other courses whenever possible.
63. When I study for this course, I go over my class notes and make an outline of important
concepts.
64. When reading for this class, I try to relate the material to what I already know.
65. I have a regular place set aside for studying.
66. I try to play around with ideas of my own related to what I am learning in this course.
67. When I study for this course, I write brief summaries of the main ideas from the readings
and my class notes.
68. When I can’t understand the material in this course, I ask another student in this class for
help.
69. I try to understand the material in this class by making connections between the readings
and the concepts from the lectures.
70. I make sure that I keep up with the weekly readings and assignments for this course.
71. Whenever I read or hear an assertion or conclusion in this class, I think about possible
alternatives.
72. I make lists of important items for this course and memorize the lists.
73. I attend this class regularly.
74. Even when course materials are dull and uninteresting, I manage to keep working until I
finish.
75. I try to identify students in this class whom I can ask for help if necessary.
76. When studying for this course I try to determine which concepts I don’t understand well.
77. I often find that I don’t spend very much time on this course because of other activities.
207
78. When I study for this class, I set goals for myself in order to direct my activities in each study
period.
79. If I get confused taking notes in class, I make sure I sort it out afterwards.
80. I rarely find time to review my notes or readings before an exam.
81. I try to apply ideas from course readings in other class activities such as lecture and
discussion.
208
Appendix C
Demographic Data Questions: Please answer the following questions as they relate to you this semester. 1. What is your gender? Male or Female
2. What is your current age? ______________________
3. How many years of college have you completed? ____________________
4. What grade classification are you? Freshman Sophomore Junior Senior Graduate
5. What is your current major? ________________________
6. What is your area of specialization (if applicable)? ________________________

209
Appendix D
Self-Assessment Questions: (pre-test collection)
Please answer the following questions as they relate to this class. 1. What is your current level of technological proficiency? 1 2 3 4 5 Very High Above Average Average Below Average Very Low
2. What is your current comfort level with technology? 1 2 3 4 5 Very High Above Average Average Below Average Very Low
3. What is your current assessment of your ability to successfully complete this course? 1 2 3 4 5 Very High Above Average Average Below Average Very Low
4. What is your current level of motivation to complete this course? 1 2 3 4 5 Very High Above Average Average Below Average Very Low
5. What is your current level of organizational skills as related to the ability to complete this
course? 1 2 3 4 5 Very High Above Average Average Below Average Very Low
6. How do you plan to organize your time and study environment for this course? ______________________________________________________________________________
______________________________________________________________________________
______________________________________________________________________________
______________________________________________________________________________
______________________________________________________________________________

210
Appendix E
Self-Assessment Questions: (post-test collection) Please answer the following questions as they relate to this class. 1. What is your current level of technological proficiency? 1 2 3 4 5 Very High Above Average Average Below Average Very Low
2. What is your current comfort level with technology? 1 2 3 4 5 Very High Above Average Average Below Average Very Low
3. What is your current assessment of your ability to successfully complete this course? 1 2 3 4 5 Very High Above Average Average Below Average Very Low
4. What is your current level of motivation towards this course? 1 2 3 4 5 Very High Above Average Average Below Average Very Low
5. What is your current level of organizational skills as related to this course? 1 2 3 4 5 Very High Above Average Average Below Average Very Low
6. Was there anything you learned or experienced in this course that helped you to organize
your time and study environment for this class? ______________________________________________________________________________
______________________________________________________________________________
______________________________________________________________________________
______________________________________________________________________________
______________________________________________________________________________

211
Appendix F
Interview Guide:
Opening information: Thank you for agreeing to participate in this interview. It should last approximately 30-45 minutes and we will be discussing your opinions of the Getting Things Done method and the Getting Things Done software used in class this semester. Just so you know, at no point in time will your name be used in the results of this interview. You will be assigned a pseudonym in the final results. The interview itself is an electronic document, which will be stored on my password protected laptop and the interview will be deleted after two years from my computer. Questions: • I would like to start with some general background questions: 7. What is your current age? ______________________
8. How many years of college have you completed? ____________________
9. What grade classification are you? Freshman Sophomore Junior Senior Graduate
10. What is your current major? ________________________
• I would like to ask you some self-assessment questions: 7. How would you describe your current level of technological proficiency? How has that level
changed during the course of the semester? 8. How would you describe your current comfort level with technology? How has that changed
during the course of the semester? 9. What is your current assessment of your ability to successfully complete this course? 10. What is your current level of motivation towards this course? 11. What is your current level of organizational skills as related to this course? • Questions related to the Getting Things Done Method and Getting Things Done Software 1. How did the training on the Getting Things Done method assist you with course material
completion?

212
2. How exactly did you use the Getting Things Done software during the semester?
3. How often did you use the software during the semester? 4. Were there any issues that kept you from using the software? 5. What could be changed to allow you to use the software in the course? 6. What is your opinion of IGoogle? 7. Which functions of IGoogle did you use? 8. Which functions were most/least beneficial? 9. How did you organize your time and study environment for this course? In what ways did
your study and time management change as a result of using the Task Lists and To Do Lists in IGoogle?
10. In what ways did the software increase your motivation towards completing course goals? 11. How did the software help you during the course? How did it hinder you during the course? 12. How could you use this software in other courses? 13. Would you recommend the software to others? Why or why not?

Getting Things Done PowerPoint Training Materials
213
Appendix G
Getting Things Done PowerPoint Training Materials

214
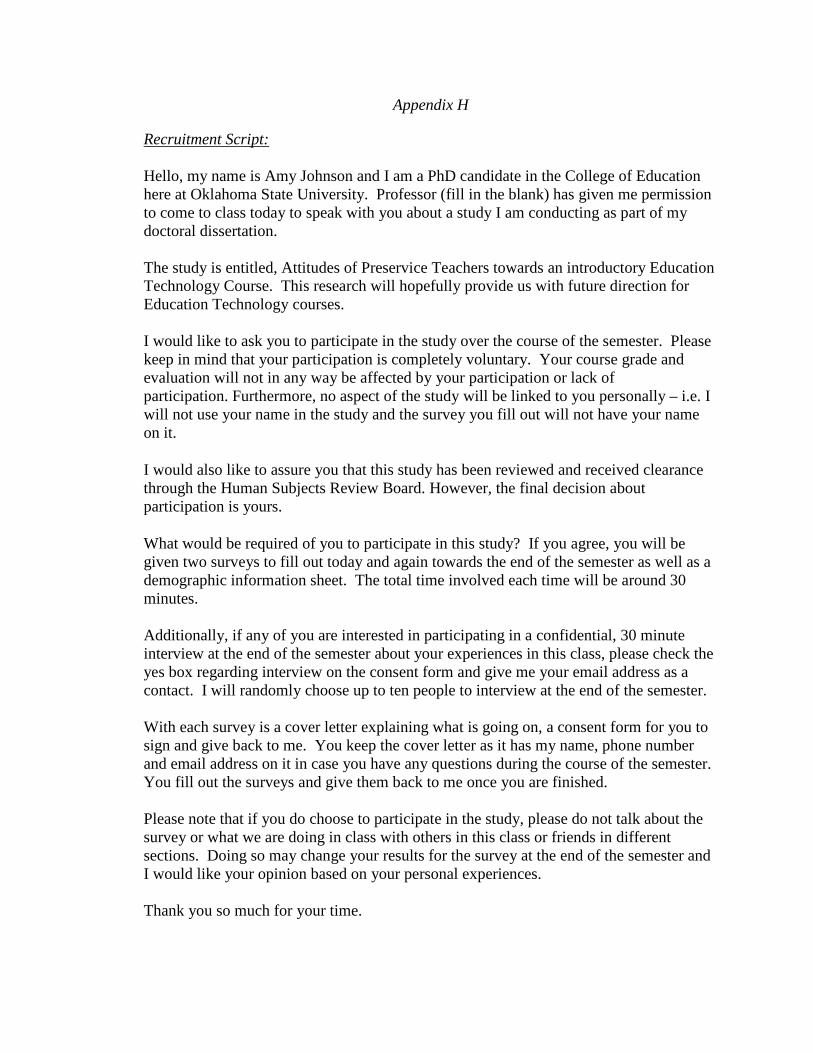
Appendix H
Recruitment Script: Hello, my name is Amy Johnson and I am a PhD candidate in the College of Education here at Oklahoma State University. Professor (fill in the blank) has given me permission to come to class today to speak with you about a study I am conducting as part of my doctoral dissertation. The study is entitled, Attitudes of Preservice Teachers towards an introductory Education Technology Course. This research will hopefully provide us with future direction for Education Technology courses. I would like to ask you to participate in the study over the course of the semester. Please keep in mind that your participation is completely voluntary. Your course grade and evaluation will not in any way be affected by your participation or lack of participation. Furthermore, no aspect of the study will be linked to you personally – i.e. I will not use your name in the study and the survey you fill out will not have your name on it.
I would also like to assure you that this study has been reviewed and received clearance through the Human Subjects Review Board. However, the final decision about participation is yours.
What would be required of you to participate in this study? If you agree, you will be given two surveys to fill out today and again towards the end of the semester as well as a demographic information sheet. The total time involved each time will be around 30 minutes. Additionally, if any of you are interested in participating in a confidential, 30 minute interview at the end of the semester about your experiences in this class, please check the yes box regarding interview on the consent form and give me your email address as a contact. I will randomly choose up to ten people to interview at the end of the semester. With each survey is a cover letter explaining what is going on, a consent form for you to sign and give back to me. You keep the cover letter as it has my name, phone number and email address on it in case you have any questions during the course of the semester. You fill out the surveys and give them back to me once you are finished. Please note that if you do choose to participate in the study, please do not talk about the survey or what we are doing in class with others in this class or friends in different sections. Doing so may change your results for the survey at the end of the semester and I would like your opinion based on your personal experiences. Thank you so much for your time.

Appendix I
INFORMED CONSENT DOCUMENT
THIS COPY IS FOR THE SUBJECT TO KEEP
Thank you for agreeing to participate in this study. This form outlines the purpose of
the study, a description of the involvement required, and your rights as a participant.
Project Title:
• Attitudes of Preservice Teachers towards an introductory Education Technology Course
Investigators:
• Amy Johnson, M.A. & M.S, Doctoral Candidate
Purpose:
• The purpose of this study will be to research the attitudes of preservice teachers towards an
introductory education technology course.
• The participant has been asked to participate in this study in order to share with the investigator
their personal opinions about and experiences in an Education Technology Course.
• This study seeks to gain the personal opinion of the participant regarding their personal
experiences prior to completing the Education Technology Course and after completing the
Education Technology Course.
Procedures:
• The first research tool is the Motivated Strategies for Learning Questionnaire (MSLQ). This tool
is a three-page instrument to be completed by the participant at the beginning and the end of the
semester. It will take approximately 20 minutes to complete this instrument.
• The second tool is a series of demographic questions about each respondent to provide an overall
picture of the participants in the study. There are six questions that will take approximately 2-3
minutes to complete.
• The final research tool consists of a series of Likert-scale and open-ended questions about
technology proficiency and course materials. This is a one-page form that will take approximately
5-10 minutes to complete.
• There is an optional interview process about the course that students can volunteer to participate
in. These interviews will take place at the end of the semester and will last approximately 30

minutes.
Risks of Participation:
• “There are no known risks associated with this project which are greater than those ordinarily
encountered in daily life.”
Benefits:
• The benefits to the subjects include the satisfaction of being involved in a large research project.
This project is unique in topical area and has not been undertaken to date. This makes the project
at the forefront of research in the field.
• This research will also set the stage for future research with these constructs for this or other populations.
• Finally, the research will add to scholarly information on the topic.
Confidentiality:
• The results from this study will be analyzed, tabulated and summarized in order to write my
doctoral dissertation.
• Your real name will not be used at any time during the data collection process or in the dissertation.
• All results will be assigned a random number so no personal identification can be made with the
data.
• The written data will be stored for two years in a locked filing cabinet in the primary
investigators office. The data will be destroyed after two years.
• The primary investigator and the faculty advisor will have access to the data in order to analyze,
tabulate and summarize the findings.
• The digital interview data will be stored on the primary investigators personal computer; the data
will not be placed on a network of computers at any time. The interview data will be password
protected so that only the primary investigator and the advisor can access the data. The data will
only be accessed in the primary researcher’s office, with the door closed during review to maintain
confidentiality. The interview records will be erased after two years.
• There are no foreseeable risks to maintaining confidentiality in this study.
• The OSU IRB has the authority to inspect consent records and data files to assure
compliance with approved procedures. Please note the following from the OSU IRB:

“The records of this study will be kept private. Any written results will discuss group
findings and will not include information that will identify you. Research records will be
stored securely and only researchers and individuals responsible for research oversight
will have access to the records. It is possible that the consent process and data collection
will be observed by research oversight staff responsible for safeguarding the rights and
wellbeing of people who participate in research.”
Compensation:
• No compensation is offered for participating in this study.
Contacts:
• If you have any questions about the research, please contact the investigator via phone or email
Amy Johnson, via phone at 918-477-2695 or via email at [email protected]
• You may also contact the faculty advisor, Dr. John Curry, at 405-744-8042 or via email at
• If you have questions about your rights as a research volunteer, you may contact Dr. Shelia
Kennison, IRB Chair, 219 Cordell North, Stillwater, OK 74078, 405-744-1676 or
Participant Rights:
• Your participation in this study is voluntary and you may discontinue at any time, for any
reason, without reprisal or penalty.
• If you choose to discontinue the study, your paperwork will be destroyed.
• There are no potential risks for withdrawing from the study.
• Your participation in the study may be terminated or your results may not be included in the
final study if the materials are not completely filled out.
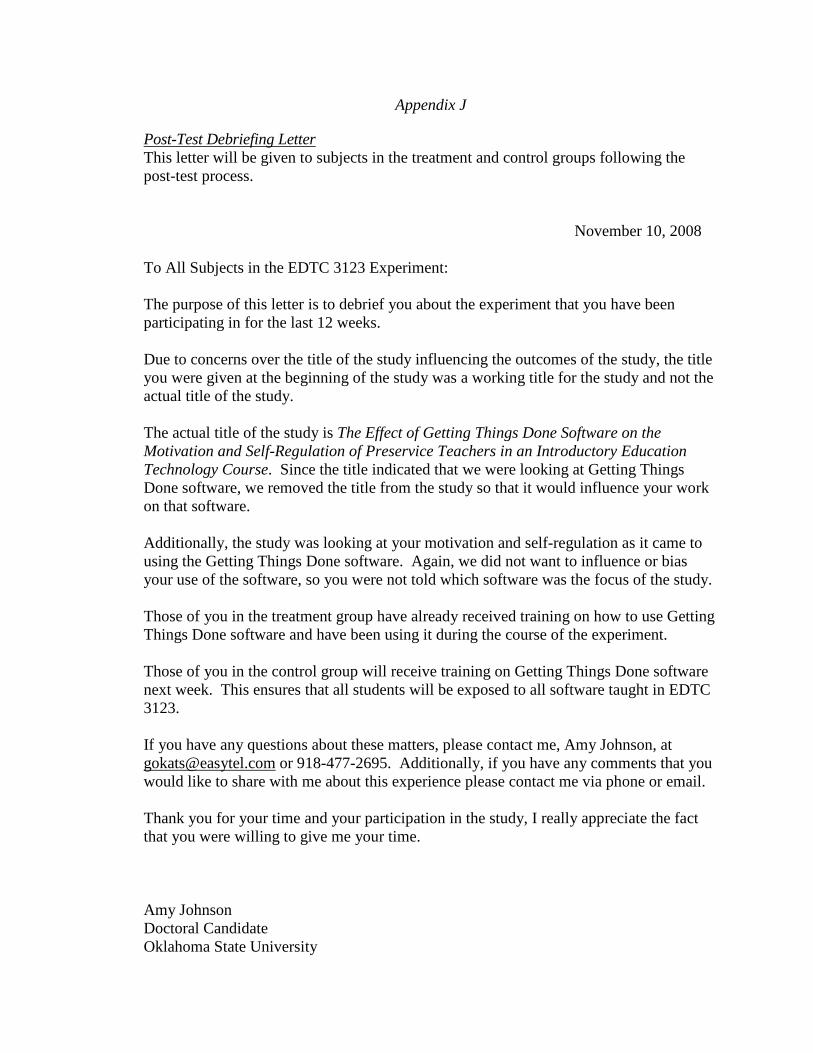
Appendix J
Post-Test Debriefing Letter This letter will be given to subjects in the treatment and control groups following the post-test process.
November 10, 2008 To All Subjects in the EDTC 3123 Experiment: The purpose of this letter is to debrief you about the experiment that you have been participating in for the last 12 weeks. Due to concerns over the title of the study influencing the outcomes of the study, the title you were given at the beginning of the study was a working title for the study and not the actual title of the study. The actual title of the study is The Effect of Getting Things Done Software on the Motivation and Self-Regulation of Preservice Teachers in an Introductory Education Technology Course. Since the title indicated that we were looking at Getting Things Done software, we removed the title from the study so that it would influence your work on that software. Additionally, the study was looking at your motivation and self-regulation as it came to using the Getting Things Done software. Again, we did not want to influence or bias your use of the software, so you were not told which software was the focus of the study. Those of you in the treatment group have already received training on how to use Getting Things Done software and have been using it during the course of the experiment. Those of you in the control group will receive training on Getting Things Done software next week. This ensures that all students will be exposed to all software taught in EDTC 3123. If you have any questions about these matters, please contact me, Amy Johnson, at [email protected] or 918-477-2695. Additionally, if you have any comments that you would like to share with me about this experience please contact me via phone or email. Thank you for your time and your participation in the study, I really appreciate the fact that you were willing to give me your time. Amy Johnson Doctoral Candidate Oklahoma State University

VITA
Amy Lynn Johnson
Candidate for the Degree of
Doctor of Philosophy Thesis: THE EFFECT OF GETTING THINGS DONE SOFTWARE ON THE
MOTIVATION AND SELF-REGULATION OF PRESERVICE TEACHERS IN AN INTRODUCTORY EDUCATIONAL TECHNOLOGY COURSE
Major Field: Education Biographical:
Education: Completed the requirements for the Doctor of Philosophy in Education at Oklahoma State University, Stillwater, Oklahoma in May 2013. Completed the requirements for the Master of Science in College Teaching at Northeastern State University, Tahlequah, Oklahoma in 2003. Completed the requirements for the Master of Arts in Industrial/Organizational Psychology at the University of Tulsa, Tulsa, Oklahoma in 1995. Completed the requirements for the Bachelor of Science in Psychology at Kansas State University, Manhattan, Kansas in 1992. Experience: Fall 2006 – Fall 2008 Graduate Teaching Assistant, Department of Education, Oklahoma State University
• Course taught: Applications of Educational Technologies Spring 2006 Graduate Research Assistant, Department of Education, Oklahoma State University
• Assisted professor as needed with research projects Fall 2002 – Fall 2005 Adjunct Instructor, Liberal Arts Division, Tulsa Community College
• Courses taught: Personality Theories of Psychology, Developmental Psychology, Human Relations, and HR Management
Professional Memberships: AECT, Kappa Delta Phi, and Golden Key