the effect of eucalyptus on crop...
TRANSCRIPT
THE EFFECT OF EUCALYPTUS ON CROP PRODUCTIVITY, AND SOIL
PROPERTIES IN THE KOGA WATERSHED, WESTERN AMHARA REGION,
ETHIOPIA
A Thesis
Presented to the Faculty of the Graduate School
of Cornell University
in Partial Fulfillment of the Requirements for the Degree of
Masters of Professional Studies
by
Tilashwork Chanie Alemie
May 2009

© 2009 Tilashwork Chanie Alemie

ABSTRACT
This study was conducted at the Koga Watershed in the Western Amhara
region of Ethiopia. The main objective of the study was to observe if the Eucalyptus
plantation is harmful for the ecosystem. The study through key informants’ interview
proved that almost all local farmers perceive that Eucalyptus trees are exhausting the
once productive land because of its fast growth. Water points dried up, too. Despite
this, the growers insist on planting Eucalyptus because of its fast biomass production
to sell it after relative short time for cash income and use in construction. A triplicate
experiment was established to understand the effect of Eucalyptus on soil properties,
crop production and water bodies. Its effect was compared to other land uses such as
Croton macrostachyus border plantation along maize farm (regarding soil bulk
density, moisture content and maize plant count and height) and coffee garden
(concerning undergrowth density). There were no pronounced changes in soil bulk
density, organic matter, texture, pH, exchangeable potassium and available water
capacity due to Eucalyptus hedgerows along maize farmland. Eucalyptus trees
significantly affect available phosphorus (avail. P), exchangeable calcium (exch. Ca),
total nitrogen (TN), moisture content (MC), soil hydrophobicity, light intensity and the
density of the undergrowth. At 5 m distance from Eucalyptus stand, there were the
greatest reductions of values of avail. P (3.5 mg kg-1), TN (0.1 %) and MC at maize
maturity stage (8.7 %) compared to the not affected soil at 40 m away from the
Eucalyptus trees. In addition, the exch. Ca value at 1 m distance was most reduced and
was decreased by 4.1 (cmol (+) kg soil-1) compared to the control. The top dried field
soils at 0 to 220 cm distances were water repellent since the water drop penetration
time values were greater than 5 seconds. Moreover, Eucalyptus canopy intercepted
64.5 to 1579 lux of the light intensity resulting in poor performance of maize plants

under its shade. Plant height, yield, biomass and count decreased with distance to
Eucalyptus trees. This was not the case for Croton macrostachyus. The yield reduction
was in the range of 4.9 to 13.5 ton.ha-1. Furthermore, the undergrowth density of
Eucalyptus was almost nil (24787 No.ha-1) as compared to that of coffee garden shade
(171102 No.ha-1). Altogether, our findings lead to a conclusion that Eucalyptus
plantation has a negative effect on sustainable cropping, soil, and water conservation
systems by decreasing TN, avail. P and exch. Ca through plant uptake, lowering the
soil moisture content both by its dense root system and by making the soil
hydrophobic and taking light away from the crop due to its dense and long canopy. It
has also been reported by local farmers that the dense Eucalyptus root network lowers
water tables and dries up springs.
iii
BIOGRAPHICAL SKETCH
Tilashwork C. Alemie was born and raised in Western Amhara region,
Ethiopia. She received her Diploma in General Agriculture in 1999 from Ambo
College of Agriculture, located at 125km distance from Addis. From 2000 to 2002,
she taught chemistry at Gambella High School in Southern Ethiopia. Then, she joined
Debub University as an advance standing student and received a B.Sc. degree in Plant
Production and Dry land Farming in July 2005. Soon after she was employed as a
researcher in Amhara Regional Agricultural Research Institute (ARARI) and worked
for two years. Even though she had experience in plant breeding research, she wanted
to know much more about the details of the basic natural resources (soil and water),
which are key if they are managed well to reduce poverty in Ethiopia effectively.
Therefore, she joined the Integrated Watershed Management and Hydrology Masters
Program opened by Cornell University in collaboration with Bahir Dar University.
Now, she has been assessing the environmental impact of Eucalyptus plantation in the
Koga Watershed, which is a known watershed in the Amhara Region of Ethiopia. Her
further interest area of research is conducting poverty alleviating research activities by
giving due attention to Integrated Watershed Management: Developing suitable
model(s) to assess soil loss and the impact of hydrological dynamics on crop
production in a given watershed, and developing high yielding crop varieties there.

iv
This work is dedicated to my father, Chanie Alemie and my mother, Dilulanch
Aemiro. Without their decision that allowed me to pass through modern education, in
a situation where modern education was not significantly encouraged, I would have
never been in my present position. Especially, my mother was spice for my success
until she passed away in February 2009. Mam, my hope is buried with you! But I
never forget you forever.
v
ACKNOWLEDGEMENTS
This work has been in its present shape with considerable professional,
financial, and material inputs from various sources. Therefore, I deeply wish to extend
thanks to many people and organizations that made this work possible.
In grateful recognition, I want to address my sincere thanks to Professor
Tammo Steenhuis first and foremost for his willingness to accept me as his student
with all provision of space and working facilities. He kindly shared all possible
facilities and was available to share ideas whenever required. Totally, this research
work was formulated with his great support and encouragement.
My appreciation also goes to Professor Johannes Lehmann for his valuable
comments for the preparation of the manuscript and for acting as co-examiner. His
comments on the manuscript helped me to make much improvement.
My heartfelt thanks are also addressed to Professor Enyew Adgo for his
significant contribution throughout the research work, personal interest he showed to
supervise this work, and for all the professional support he did with all provisions. In
total, the work was shaped to its present form with his genuine support.
I would like to address my sincere thanks to Dr. Amy S Collick for her
unreserved help throughout this work. She always encouraged me when I face
difficulties besides her great help on the technical part.
Truthful thanks should also be addressed to Bahir Dar Water Resources and
Soil Bureau laboratory analysts for their willingness to analyze important parameters
in their lab in addition to lending me reading materials.
Mr. Tadele Amare must be appreciated beyond any doubt for his
encouragement that gave me the strength to go for the accomplishment of this work

vi
through material and technical support. Last but not least I remain sincere and grateful
to Mengistu Asmamaw for his encouragement. Above all I am thankful to God.

vii
TABLE OF CONTENTS BIOGRAPHICAL SKETCH ......................................................................................... iii ACKNOWLEDGEMENTS ........................................................................................... v TABLE OF CONTENTS ............................................................................................. vii LIST OF FIGURES ....................................................................................................... ix LIST OF TABLES ......................................................................................................... x 1. INTRODUCTION ...................................................................................................... 1 2. MATERIALS AND METHODS ............................................................................... 4
2.1. Study area ............................................................................................................ 4 2.2 Data collection and analysis ................................................................................. 6
3. RESULTS ................................................................................................................. 11 3.1 Farmers’ perception about the environmental impact of Eucalyptus plantation 11 3.2 Experimental findings about the effect of Eucalyptus plantation on the ecosystem ................................................................................................................. 14
3.2.1 Status of soil physical properties ................................................................. 14 3.2.2 Status of soil chemical properties ................................................................ 18 3.2.3 Status of soil hydrophobicity ....................................................................... 20 3.2.4 Effect of Eucalyptus trees on status of light intensity ................................. 21 3.2.5 Eucalyptus root distribution ........................................................................ 22 3.2.6 Undergrowth status of shade trees ............................................................... 23 3.2.7 Effects of trees on crop performance ........................................................... 23
4. DISCUSSION ........................................................................................................... 25 5. CONCLUSIONS AND RECOMMENDATIONS ................................................... 30 6. REFERENCES ......................................................................................................... 32 7. APPENDIX .............................................................................................................. 36 Appendix 1: Status of soil moisture content ................................................................. 36
Appendix 1.1: Statistical summaries of gravimetric moisture content in July, August and September .......................................................................................................... 36 Appendix 1.2: Statistical summaries of gravimetric moisture content in September .................................................................................................................................. 37 Appendix 1.3: Statistical summaries of gravimetric moisture content in October ... 38 Appendix 1.4: Statistical summary of available water capacity in October ............. 38
Appendix 2: The USDA soil texture triangle ............................................................... 39 Appendix 3: Statistical summaries of soil parameters ................................................. 40 Appendix 4: Hydrophobicity ........................................................................................ 41
Appendix 4.1: Statistical summary of soil hydrophobicity ...................................... 41 Appendix 4.2: Statistical summary of Eucalyptus parts ........................................... 41
Appendix 5: Statistical summaries of light intensity .................................................... 42 Appendix 5.1: Light intensity at 9:00 am, 12:00 am and 12:30 pm ......................... 42 Appendix 5.2: Light intensity 3:00 and 4:00 pm ...................................................... 43
Appendix 6: Statistical summaries of maize parameters .............................................. 44 Appendix 7: Statistical summary of Eucalyptus root distribution ................................ 45 Appendix 8: Under growth density comparison of Eucalyptus and C. macrostachyus 45 Appendix 9: Exposed deep and dense networked roots of Eucalyptus tree ................. 46

viii
Appendix 10: Questionnaire to Survey the environmental impact of Eucalyptus plantation in the Koga Watershed ................................................................................ 47

ix
LIST OF FIGURES Figure 1: The Irrigation scheme in partial view of the Koga Watershed (Photo, in August 2008) .................................................................................................................. 5 Figure 2: Croton macrostachyus (A) and Eucalyptus (B) trees along maize farm borders, and the under growth density within a coffee garden (C) and a Eucalyptus stand (D). ...................................................................................................................... 10 Figure 3: Gravimetric moisture content mean values comparison along distance from Eucalyptus stand at three different depths in July and August. Mean values followed by the same letters are not significantly different. Error bars represent the standard errors of the means (n=3). ............................................................................................ 16 Figure 4: September gravimetric moisture content as a function of distance and depth of sampling to the Eucalyptus (E in the legend) and C. macrostachyus trees (C in the legend). Mean values followed by the same letters are not significantly different. Error bars represent the standard errors of the means (n=3). ................................................. 17 Figure 5: Gravimetric moisture content values comparison along distance from Eucalyptus stand at different depths in October. Mean values followed by the same letters are not significantly different. Error bars represent the standard errors of the means (n=3). ................................................................................................................. 17 Figure 6: Organic matter values comparison along distance from Eucalyptus stand in the plough depth. Mean values followed by the same letter since they are not significantly different at 0.05 level LSD test. Error bars represent the standard errors of the means (n=3). ....................................................................................................... 18 Figure 7: pH (moles/litre) values comparison along distance from Eucalyptus stand. Mean values marked with the same letter since they are not significantly different at 0.05 level LSD test. Error bars represent the standard errors of the means (n=3). ...... 18 Figure 8: Percentage of total nitrogen (A) available phosphorus in mg kg-1 (B) and exchangeable calcium in centimol of cations per kg of soil, and (C) mean values comparison along distance from Eucalyptus stand in plough depth. Mean values followed by the same letters are not significantly different at 0.05 level LSD test. Error bars represent the standard errors of the means (n=3). ................................................. 19 Figure 9: Water repellence comparison of parts of Eucalyptus plant. ......................... 20 Figure 10: Light intensity values comparison along distance from Eucalyptus stand at different times within a day. Error bars represent the standard errors of the means (n=3). The measurements were taken in west direction at 9:00 and 12:00 am, north direction at 12:30 pm and east direction at 3:00 and 4:00 pm. ..................................... 22 Figure 11: Undergrowth density (no.ha-1) values comparison between Eucalyptus and coffee garden shade trees stands. .................................................................................. 23 Figure 12: Maize plant count (A), Plant height (B) and biomass and grain yield (C) comparison along distance from Eucalyptus and C. macrostachyus trees. Error bars represent the standard errors of the means (n=3). The measurements were taken in west, east and north direction after half of November. ................................................ 24

x
LIST OF TABLES Table 1: Demographic expression of well-informed farmers in the study area (N=25) ...................................................................................................................................... 11 Table 2: Farmers’ perception concerning tree planting in the locality (N=25) ............ 11 Table 3: Activities performed by a farmer on his land in the Koga watershed (N=25)12 Table 4: Farmers’ perception about environmental impact of Eucalyptus plantation in the Koga Watershed (N=25) ......................................................................................... 13 Table 5: Mechanisms and conditions by which Eucalyptus plantation affects the ecosystem (N=25) ......................................................................................................... 13 Table 6: Conditions at which Eucalyptus plantation effect is more pronounced (N=25) ...................................................................................................................................... 14 Table 7: Farmers’ recommendation for the future (N=25) ........................................... 14 Table 8: Means of percent soil fractions and textural classes at different sampling distances from Eucalyptus hedge rows ......................................................................... 14 Table 9: Average percent soil fractions and textural classes of each field soil ............ 15 Table 10: Soil bulk density mean values (g.cm-3) at different distances from wood lots ...................................................................................................................................... 15 Table 11: Soils hydrophobicity classification at different distances from Eucalyptus stand for soils in the field and sampled soils in the lab. in July and October ............... 21 Table 12: Mean Eucalyptus tree root distribution at different distances and depths (№/0.2 m2) .................................................................................................................... 22
1
CHAPTER ONE
1. INTRODUCTION
The livelihood of 85% of the Ethiopian population depends on agriculture.
There are more than seven million predominantly subsistence farm families who
produce about 90% of the agricultural output such as food crops (cereals, pulses,
vegetables and oil seeds), livestock and coffee. In the past, Ethiopia was rich in natural
resources. As population pressure increased, resources have been exploited
excessively. The need to expand cultivated land and shortages of fuel biomass have
led to the removal of well-adapted, nutrient additive indigenous trees. Cropping areas
have expanded into marginal lands, such as steep slopes and mountainous areas, and
fallow periods have been shortened or abandoned (Jouquet et al., 2007). Despite this
expansion, food insecurity remains because agricultural productivity has been
seriously eroded by resource depletion.
To alleviate this problem, the past emphasis was on introducing early maturing
tree species rather than environmentally friendly species, such as nutrient-
replenishing, leguminous trees into agricultural systems in areas where trees can be
combined with the production of crops (Garay et al., 2004). Eucalyptus has been a
common species introduced during past agroforestry efforts (Kidanu et al., 2005).
Traditional agro-forestry practices in Ethiopia involve tree planting in various spatial
patterns to meet the demand for fuel wood and construction. In recent years, single
rows of Eucalyptus species planted along field borders have become a dominant
feature of the central highlands of Ethiopia including the Koga Watershed, located at
the head of the Blue Nile basin. Although quantitative evidence is scanty, there has
been a perception that this practice adversely affects crop productivity (Kidanu et al.,
2005). However, in order to satisfy the biomass energy demand of the country by
2
2014, 6 percent of the total utilizable land area would have to be put under Eucalyptus
plantations (Kidanu et al., 2005) entailing a major shift in land use. Increasing
plantations would create competition between agricultural food crops and Eucalyptus
trees for land area, major resources (water and soil nutrients) and light.
In general, ecological implications of exotic trees like those that Eucalyptus
species, which have been used for industrial purpose as well as for agro-forestry are
often questioned since their ecology has not been appropriately studied (Bernhard-
Reversat, 1999). Lane et al. (2004) found in China described that the expansion of
Eucalyptus plantation on lands previously used for crops and occupied by indigenous
trees and grass lowers water tables and reduces water availability for irrigation due to
soil hydrophobicity (water repellancy) and its deep and dense root network.
Eucalyptus seedlings are vulnerable to severe water stress unlike the seedlings of
indigenous deciduous tree species in Ethiopia (Gindaba et al., 2004). This shows that
Eucalyptus trees need more water and compete with neighboring plants for the
available water in the soil. EI-Amin et al. (2001) in Sudan reported that Eucalyptus
caused crop yield reduction due to nutrient depletion and production of toxic exudates
(allelochemicals). Finally, nutrients are exported out from the plantation’s soil system
by removing trees for timber sales and fuel wood (zerfu, 2002).
Even though there has been concern among scientists and farmers that
Eucalyptus trees are affecting ecosystem negatively in watersheds, environmental
impacts of Eucalyptus trees have been studied only to limited extents in Ethiopia and
eastern Africa. Therefore, this study (1) examines the effects of two common
plantation types (Eucalyptus stand and coffee garden shade) on the density of
undergrowth; (2) determines the effect of Eucalyptus trees on the soil physical and
chemical properties; (3) investigates the influence of Eucalyptus stand on light
intensity at different times within the day and at different distances from woodlots; (4)

3
evaluates the soil hydrophobicity under a Eucalyptus stand; (5) assesses Eucalyptus
root distribution at different distances and depths; and (6) compares crop performances
at different distances from tree stands.
Results from this study can effectively create awareness for the community
concerning specific effects of Eucalyptus on nearby crops and the surrounding
environment. Furthermore, land management planners can use this information in their
decisions on land use in the study area and to understand the particular choices made
by farmers concerning Eucalyptus.

4
CHAPTER TWO
2. MATERIALS AND METHODS
2.1. Study area
The study was conducted in the 28,000-hectare (ha) Koga Irrigation and
Watershed Management project, an agriculturally potential area at the head of the Blue
Nile within the Lake Tana Watershed. This project supported by the African
Development Bank (ADB) and the Ethiopian government, has a 7000 ha command
area intended for the cultivation of profitable and environmentally friendly crops. The
catchment area, defined by its hydrological boundaries, is located at 11o 10’ N to 11o
25’ N latitude and 37o 02’ E to 37o 17’ E longitude and ranges from 1800 to 3200
meters above sea level (masl) with a mean annual rainfall of 1560 mm and a mean
daily temperature between 16 and 20 oC.
The dominant soil type in the watershed is nitisol. As reported by FAO (2001),
nitisols are deep, well-drained, red, tropical soils. They are generally considered fertile
soils. Besides, they are stable soils with favourable physical properties .The deep
porous and stable soil structure permits deep rooting and make the soil quite resistant
to erosion. Thus, they are the most productive soils to produce the commonly grown
food and plantation crops. Coffee, Zea mays L., finger millet, Eragrostis teff, Guizotia
abyssinica and others, such as lupine, beans and vegetables are cultivated throughout
the study area. Despite the future opportunity to diversify crop production, farmers
have widely planted Eucalyptus because it grows fast and requires low upkeep
(Figure 1). The Eucalyptus trees are mostly planted along cropland borders and the
main road to fulfil the need for fuel wood, construction and to generate income (Jagger
and Pender, 2003). Its purpose is not to protect land against erosion.

5
Figure 1: The Irrigation scheme in partial view of the Koga Watershed (Photo, in August 2008)
However, indigenous, environmentally, friendly trees are nearly absent due to
intensive deforestation. Maize is the major crop to perform well on nitisols including
in the study area (FAO, 2001). The variety, BH540, which was utilized for the study is
late maturing, has good grain filling ability, and is characterized by reddish tassel.
Spacing between plants and between rows was 30 cm. 100 kg. DAP and 50 kg urea
per hectare were applied at sowing and vegetative stages, respectively. As described
by development agents and local farmers, growers could harvest greater than 50
quintals (5 tons) per hectare with a sale price of about 600 Ethiopian birr per quintal (1
quintal is equivalent to 100kg) in 2008.

6
2.2 Data collection and analysis
The general impact of Eucalyptus trees on crop production, soil property and
moisture storage was assessed through interviews with key informants. Twenty-five
interested, active farmers were interviewed in two representative kebeles (Ambomesk
and Enguty), which are dominated by Eucalyptus plantations. The primary purpose of
these interviews was to gather information concerning the history and background of
Eucalyptus and to provide direction concerning the fundamental issues and questions
to be answered experimentally. The answers from respondents were expressed in
percentages for comparison. Since the interviewed farmers were very familiar with
their environment, accurate indigenous knowledge concerning Eucalyptus trees with
their environment was definitely collected.
For field and laboratory experiments, three farmers’ maize croplands with
adjacent Eucalyptus and C. macrostachyus plantations were selected since sampling
was possible with out causing excessive damage to crop plants unlike in other
croplands in the area. To check the effects of trees on maize cropland, soil physical
properties, such as texture, bulk density, moisture content, available water capacity
(AWC), and hydrophobicity were determined. In addition, the soil pH (KCl and H2O),
percentages of organic matter (OM) and total nitrogen (TN), available phosphorus
(avail. P), exchangeable calcium (exch. Ca) and potassium (exch. K) were determined
to test whether the Eucalyptus hedgerows affect soil chemical properties. For the
analyses of the above parameters, soil samples were taken at 0.5, 1, 2, 5, 10, 15, 20
and 40 m distances from Eucalyptus hedgerows except for soil hydrophobicity taken
at 0 to 300 cm at 20 cm intervals, and for pH, moisture in July-August and all the soil
nutrients taken at 1, 5, 10, 15, 20 and 40 m.
Soil texture was determined using the textural triangle after the percentages of
sand, silt and clay were determined from laboratory analysis using particle-size or

7
mechanical analysis for air-dried soil samples, which were collected at different
distances from Eucalyptus trees in the maize farm fields as described by Rowell
(1994). According to Blake (1965), bulk density was determined to compare the
values at the given sampling distances from both Eucalyptus and C. macrostachyus
woodlots and in different depths (0-20, 20-40 and 40-60 cm) using tube core method.
To examine at what distance(s), stage(s) and depth(s), Eucalyptus trees caused
moisture scarcity upon the adjacent maize plant, soil samples for gravimetric and
volumetric soil moisture determination were collected at different distances from tree
stands every month between July and October 2008 (at vegetative, flowering, tasseling
and grain filling stages) in 0-20, 20-40 and 40-60 cm depths. The soil samples were
taken using an auger and sealed in plastic bags to control moisture loss until the wet
soil weight was recorded. Soil moisture contents were determined after the soil was
oven-dried for 24 hours at 105 ◦C. At tasseling, the moisture contents at similar
distances from C. macrostachyus stand were determined in three depths as described
for Eucalyptus to compare the effects of the two tree species. In addition, the AWC
was evaluated at field capacity (FC) and permanent wilting point (PWP), which were
determined at suctions of 0.33 and 15 bars, respectively (Klute, 1965).
Hydrophobicity was determined in both the field and laboratory for dry and
wet soils using a water drop penetration time (WDPT) test used by Dekker and
Ritsema (1995). The water drop penetration time (WDPT) test was used to determine
how long water repellency persists on a soil surface, and this measure is highly
relevant to the hydrological effects of water repellency in soils caused by Eucalyptus
trees as it relates to the time required for raindrops to infiltrate. For the laboratory
analysis, five-gram samples of air-dried soil samples were placed in Petri dishes. A
wetting phase was imposed through adding two grams of distilled water on the surface
of each sample and allowing it to penetrate for three days. The samples were mixed

8
gently to obtain constant moisture content (40%) in the whole volume of soil. For the
field case, the test was done during the rainy month (July) to impose wetting phase,
and the drier month (October) for the dried soils. Then three drops of distilled water
released from approximately 10 mm above the soil surface, a standard droplet release
height to minimize the cratering effect were dripped on to the soil. The actual time
required for the complete penetration of the drops was recorded with a stopwatch for
both laboratory and field tests. Moreover, the WDPT test was done for the dried and
wetted Eucalyptus tree parts (leaf, bark and root) after they were ground to check
which part and at which moisture condition causes soil water repellency.
Regarding the major soil chemical properties, pH was measured
potentiometrically using a digital pH meter in the supernatant suspension of 1:2.5 soil
to liquid ratio where the liquids were water and 1 M KCl whereas the percentages of
OM and TN were determined by titration method. Exchangeable bases such as
calcium and potassium were extracted from the soil colloids with 1M-ammonium
acetate at pH 7 (Sahlemeden and Taye, 2000). Then, exchangeable Ca was measured
from the extracts with atomic absorption spectrophotometer while exchangeable K
was determined from the same extracts with flame photometer as described by Rowell
(1994). Finally, available P was determined by Olsen extraction method (Olsen et al.,
1954).
Since light is one of the most important plant growth factors, the impact of
Eucalyptus shade on light intensity at the stand edge and on the undergrowth within
the plantations was examined using a light meter. The measurements were taken above
the canopy of neighbouring plants. The data were collected inside the shade and at 0.5,
1, 2, 5, 10, 15, 20 and 40 m distances from the Eucalyptus stands in the maize fields at
different times during a day (9:00 am, noon, 12:30 pm, 3:00 pm and 4:00 pm).
9
In addition, the Eucalyptus root distribution was examined at 1, 5 and 10 meter
distances from the trunk and in 0-20, 20-40 and 40-60 cm depths in profile pits. Roots
were counted per 0.2 m2 (1 m length x 0.2 m width) area. Then, comparisons were
done along distance and depth.
To check the overall effects of Eucalyptus trees on maize plant performance
for the factors described previously, maize plant population, plant height, biomass and
yield data collected per 4 m2 (2 m x 2 m) area at 1, 5, 10, 15, 20 and 40 m distances in
to the maize fields from the tree stands were compared. In this case, the effects of C.
macrostachyus and Eucalyptus spp. on maize plant height and count were compared.
Moreover, to evaluate the effect of habitat modification on the growth of ecologically
important understory assemblages in the study area, Eucalyptus stands and coffee
garden shades were compared in terms of undergrowth density expressed as number
of individual stands of shrubs, herbs, climbers and others in sum per ha. The plants
considered as undergrowth were less than 3 m in height. By observing the canopy
closure of the plantation stands, a count of understory growth was conducted under
very sparse, sparse, dense and very dense shades of each plantation. Plot area for
counting was 3 m x 3 m. A similar procedure was carried out for a coffee plantation
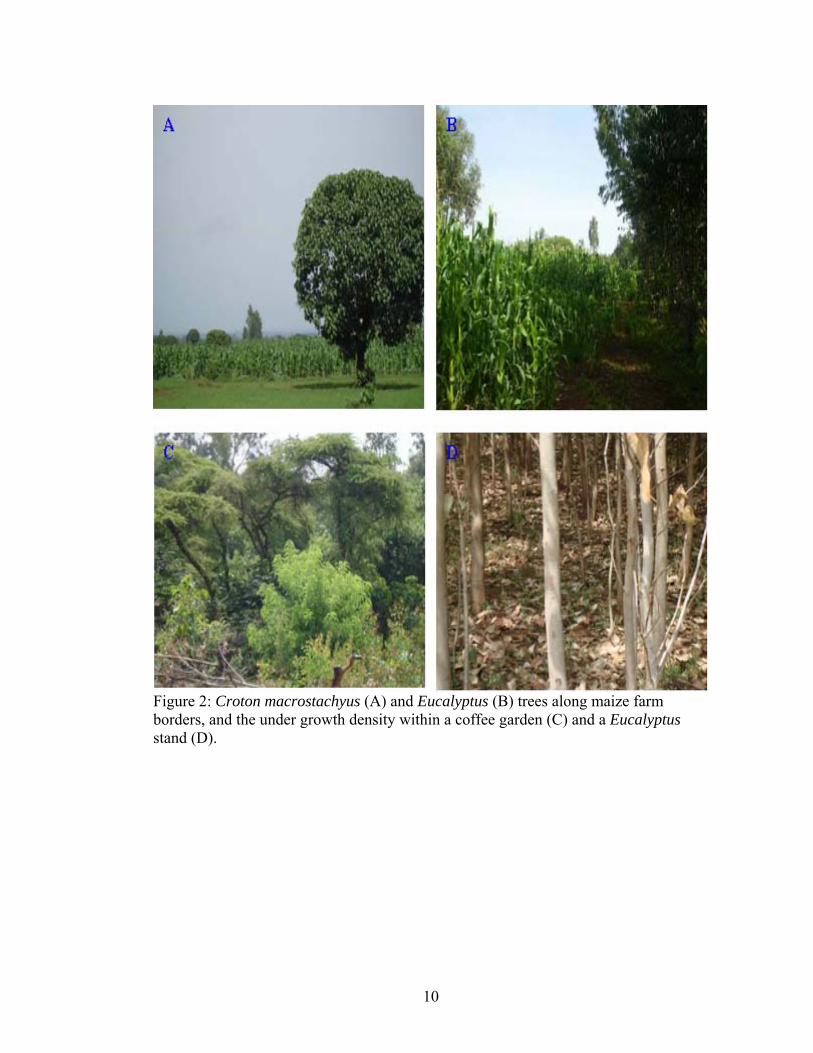
with Croton macrostachyus as shade trees. Photographs of coffee gardens with the
Croton macrostachyus and Eucalyptus stands are shown in Figure 2.
The experiment was carried out in triplicate using three different fields. For each
parameter, the data collected at the 40 m distance from the tree stand edge was used as
the control value. Statistical differences were determined by one-way ANOVA
employing a 95% level of confidence. Descriptive statistical procedures were also
applied.
10
Figure 2: Croton macrostachyus (A) and Eucalyptus (B) trees along maize farm borders, and the under growth density within a coffee garden (C) and a Eucalyptus stand (D).

11
CHAPTER THREE
3. RESULTS
3.1 Farmers’ perception about the environmental impact of Eucalyptus plantation
The interviewed key informants were nearly all males ranging in age from 36
to 45 years old with an education level that varies from non formal education to grade
eight or higher (Table 1). Females were less familiar with the day-to-day agricultural
activities and there was little exchange of information from males to females. Tree
planting in the area was most commonly for fuel wood (100%), income generation
(96%) and construction (84%). No respondents replied that trees were planted for
environmental conservation. The most commonly planted tree species in the Koga
Watershed was Eucalyptus, planting of which began during the reign of Emperor
Haile Selassie (1915-1974) with a very fast expansion rate since 1991 (Table 2).
Table 1: Demographic expression of well-informed farmers in the study area (N=25) Demographic information % Farmers
Gender Male (100) Female (0)
Age 25 - 35(32)
36 - 45(52)
46 - 55(24)
56 -65 (4)
Farmers’ educational status Illiterate (28)
Grade 1-4 (60)
Grade 5-8 (8)
>8th grade (4)
Table 2: Farmers’ perception concerning tree planting in the locality (N=25) Issues regarding to trees planting Percentage of respondents
Source of energy in the area
Wood (100)
Manure (12)
Others (12)
Purpose of tree planting in study area
For fuel (100)
Income (96)
Construction (84)
Others (4)
Mostly planted tree Eucalyptus (100) Others (0) Start of Eucalyptus plantation
During emperor Mengistu (36)
HaileSelassie (64)
Eucalyptus plantation expansion
Very fast (56)
Fast (24)
Average (12)
Slowly (8)
12
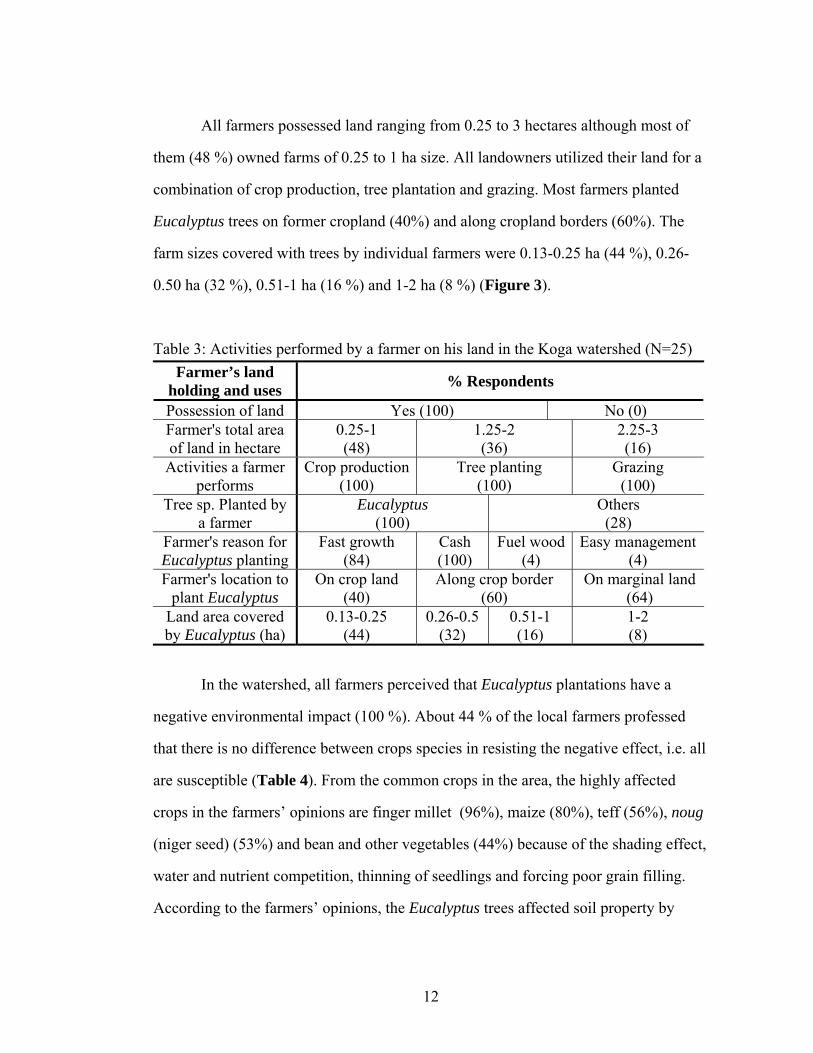
All farmers possessed land ranging from 0.25 to 3 hectares although most of
them (48 %) owned farms of 0.25 to 1 ha size. All landowners utilized their land for a
combination of crop production, tree plantation and grazing. Most farmers planted
Eucalyptus trees on former cropland (40%) and along cropland borders (60%). The
farm sizes covered with trees by individual farmers were 0.13-0.25 ha (44 %), 0.26-
0.50 ha (32 %), 0.51-1 ha (16 %) and 1-2 ha (8 %) (Figure 3).
Table 3: Activities performed by a farmer on his land in the Koga watershed (N=25) Farmer’s land
holding and uses % Respondents
Possession of land Yes (100) No (0) Farmer's total area of land in hectare
0.25-1 (48)
1.25-2 (36)
2.25-3 (16)
Activities a farmer performs
Crop production(100)
Tree planting (100)
Grazing (100)
Tree sp. Planted by a farmer
Eucalyptus (100)
Others (28)
Farmer's reason for Eucalyptus planting
Fast growth (84)
Cash (100)
Fuel wood(4)
Easy management (4)
Farmer's location to plant Eucalyptus
On crop land (40)
Along crop border (60)
On marginal land (64)
Land area covered by Eucalyptus (ha)
0.13-0.25 (44)
0.26-0.5 (32)
0.51-1 (16)
1-2 (8)
In the watershed, all farmers perceived that Eucalyptus plantations have a
negative environmental impact (100 %). About 44 % of the local farmers professed
that there is no difference between crops species in resisting the negative effect, i.e. all
are susceptible (Table 4). From the common crops in the area, the highly affected
crops in the farmers’ opinions are finger millet (96%), maize (80%), teff (56%), noug
(niger seed) (53%) and bean and other vegetables (44%) because of the shading effect,
water and nutrient competition, thinning of seedlings and forcing poor grain filling.
According to the farmers’ opinions, the Eucalyptus trees affected soil property by
13
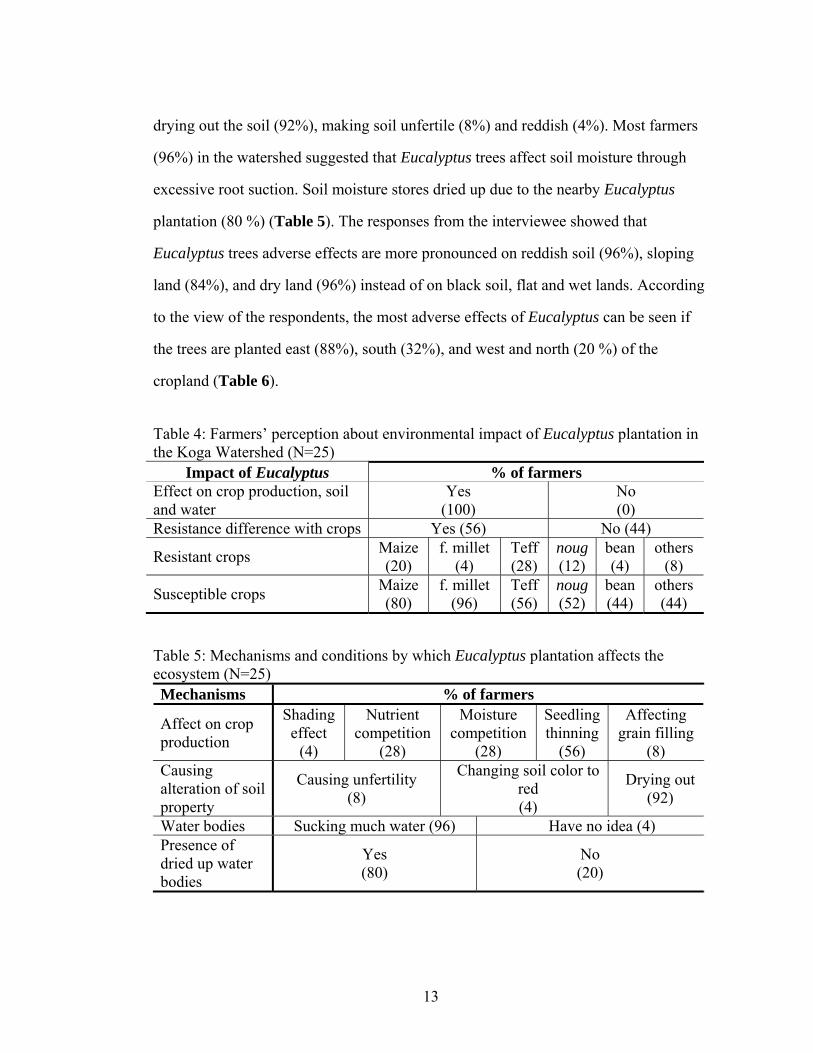
drying out the soil (92%), making soil unfertile (8%) and reddish (4%). Most farmers
(96%) in the watershed suggested that Eucalyptus trees affect soil moisture through
excessive root suction. Soil moisture stores dried up due to the nearby Eucalyptus
plantation (80 %) (Table 5). The responses from the interviewee showed that
Eucalyptus trees adverse effects are more pronounced on reddish soil (96%), sloping
land (84%), and dry land (96%) instead of on black soil, flat and wet lands. According
to the view of the respondents, the most adverse effects of Eucalyptus can be seen if
the trees are planted east (88%), south (32%), and west and north (20 %) of the
cropland (Table 6).
Table 4: Farmers’ perception about environmental impact of Eucalyptus plantation in the Koga Watershed (N=25)
Impact of Eucalyptus % of farmers Effect on crop production, soil and water
Yes (100)
No (0)
Resistance difference with crops Yes (56) No (44)
Resistant crops Maize (20)
f. millet (4)
Teff (28)
noug (12)
bean (4)
others (8)
Susceptible crops Maize (80)
f. millet (96)
Teff (56)
noug (52)
bean (44)
others (44)
Table 5: Mechanisms and conditions by which Eucalyptus plantation affects the ecosystem (N=25) Mechanisms % of farmers
Affect on crop production
Shading effect
(4)
Nutrient competition
(28)
Moisture competition
(28)
Seedling thinning
(56)
Affecting grain filling
(8) Causing alteration of soil property
Causing unfertility (8)
Changing soil color to red (4)
Drying out (92)
Water bodies Sucking much water (96) Have no idea (4) Presence of dried up water bodies
Yes (80)
No (20)
14
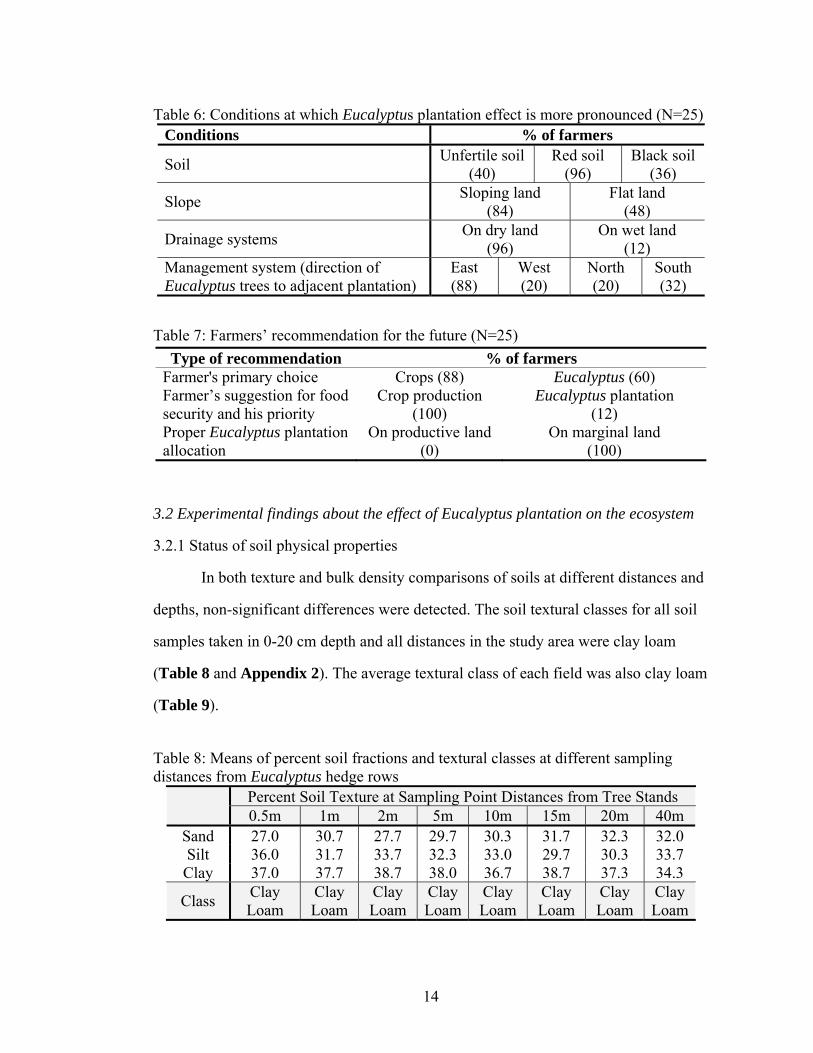
Table 6: Conditions at which Eucalyptus plantation effect is more pronounced (N=25) Conditions % of farmers
Soil Unfertile soil (40)
Red soil (96)
Black soil (36)
Slope Sloping land (84)
Flat land (48)
Drainage systems On dry land (96)
On wet land (12)
Management system (direction of Eucalyptus trees to adjacent plantation)
East (88)
West (20)
North (20)
South (32)
Table 7: Farmers’ recommendation for the future (N=25) Type of recommendation % of farmers
Farmer's primary choice Crops (88) Eucalyptus (60) Farmer’s suggestion for food security and his priority
Crop production (100)
Eucalyptus plantation (12)
Proper Eucalyptus plantation allocation
On productive land (0)
On marginal land (100)
3.2 Experimental findings about the effect of Eucalyptus plantation on the ecosystem
3.2.1 Status of soil physical properties
In both texture and bulk density comparisons of soils at different distances and
depths, non-significant differences were detected. The soil textural classes for all soil
samples taken in 0-20 cm depth and all distances in the study area were clay loam
(Table 8 and Appendix 2). The average textural class of each field was also clay loam
(Table 9).
Table 8: Means of percent soil fractions and textural classes at different sampling distances from Eucalyptus hedge rows
Percent Soil Texture at Sampling Point Distances from Tree Stands 0.5m 1m 2m 5m 10m 15m 20m 40m
Sand 27.0 30.7 27.7 29.7 30.3 31.7 32.3 32.0 Silt 36.0 31.7 33.7 32.3 33.0 29.7 30.3 33.7 Clay 37.0 37.7 38.7 38.0 36.7 38.7 37.3 34.3
Class Clay Loam
Clay Loam
Clay Loam
Clay Loam
Clay Loam
Clay Loam
Clay Loam
Clay Loam

15
Table 9: Average percent soil fractions and textural classes of each field soil Plots
(Fields) Percent soil fraction
Class Sand Silt Clay F1 27.4 34.0 38.6 Clay loam F2 30.4 32.5 37.1 Clay loam F3 32.8 31.3 36.3 Clay loam
All the bulk densities in all depths and distances from Eucalyptus and C.
macrostachyus stands were grouped in the medium range (1-6 g.cm-3); no samples
were in low ( < 1 g.cm-3) or high ( > 1.6 g.cm-3) ranges (Table 10). Table 10: Soil bulk density mean values (g.cm-3) at different distances from wood lots
Tree species Sampling depth (cm)
Soil bulk density at sampling point distances (m) from trees stand
0.5 1 2 5 15 20 40
Eucalyptus 20 1.1 1.0 1.1 1.0 1.1 1.1 1.1 40 1.1 1.1 1.1 1.1 1.1 1.1 1.1 60 1.0 1.1 1.0 1.0 1.1 1.1 1.1
Croton macrostachyus
20 1.1 1.1 1.2 1.1 1.1 1.0 1.1 40 1.1 1.1 1.1 1.0 1.0 1.1 1.1 60 1.1 1.1 1.1 1.1 1.1 1.1 1.1
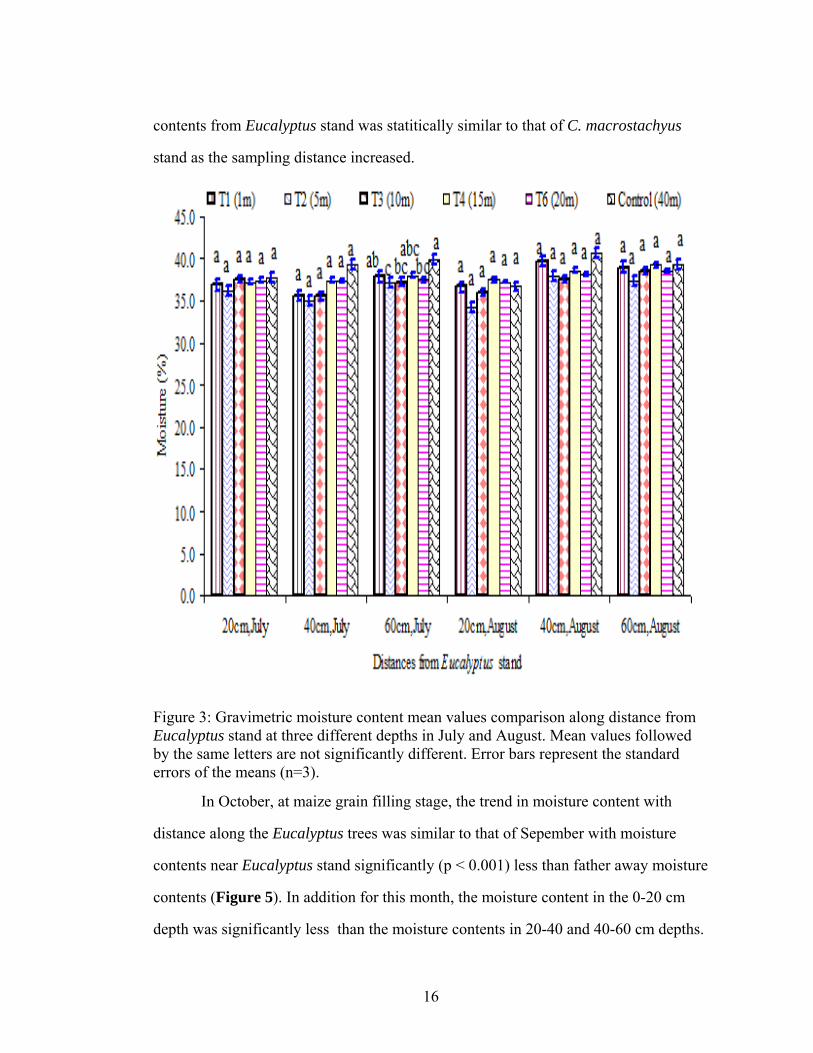
In July and August when it rains almost contimuously, there was generally not
a significant difference between moisture contents at the various distances from the
Eucalyptus stand (Figure 3). Only in the 40-60 cm depth in July, the moisture content
at 5 m from the tree was significantly lower thanvalues at 1 and 40 m. In the other
depths and times the moisture content at 5 m was generally lower.
In September, at the end of the rainy monsoon period , the moisture contents
near the Eucalyptus stand in all three depths were significantly less (p < 0.001) than
the moisture contents farther away (Figure 4). This trend was not observed for C.
macrostachyus where no signifcant difference in moisture content with distance to the
tree was observed. It is interesting that at 15 m distance from the tree the moisture
16
contents from Eucalyptus stand was statitically similar to that of C. macrostachyus
stand as the sampling distance increased.
Figure 3: Gravimetric moisture content mean values comparison along distance from Eucalyptus stand at three different depths in July and August. Mean values followed by the same letters are not significantly different. Error bars represent the standard errors of the means (n=3).
In October, at maize grain filling stage, the trend in moisture content with
distance along the Eucalyptus trees was similar to that of Sepember with moisture
contents near Eucalyptus stand significantly (p < 0.001) less than father away moisture
contents (Figure 5). In addition for this month, the moisture content in the 0-20 cm
depth was significantly less than the moisture contents in 20-40 and 40-60 cm depths.

17
In other words, the AWC values of the maize farm soil at different distances from the
trees at plow depth were notsignificantly difeerent (p > 0.05).
Figure 4: September gravimetric moisture content as a function of distance and depth of sampling to the Eucalyptus (E in the legend) and C. macrostachyus trees (C in the legend). Mean values followed by the same letters are not significantly different. Error bars represent the standard errors of the means (n=3).
Figure 5: Gravimetric moisture content values comparison along distance from Eucalyptus stand at different depths in October. Mean values followed by the same letters are not significantly different. Error bars represent the standard errors of the means (n=3).

18
As expected, Eucalyptus trees did not affect organic matter content in the soil
significantly. The organic matter varied from (2-4%) (Figure 6).
Figure 6: Organic matter values comparison along distance from Eucalyptus stand in the plough depth. Mean values followed by the same letter since they are not significantly different at 0.05 level LSD test. Error bars represent the standard errors of the means (n=3).
3.2.2 Status of soil chemical properties
In the study area, the surface soils (in 0-20 cm depth) were very acidic and did
not significantly different (p > 0.05) with distance to the Eucalyptus stand (Figure 7).
As for moisture content observation, the pH value at 5 m from the tree was the lowest.
Figure 7: pH (moles/litre) values comparison along distance from Eucalyptus stand. Mean values marked with the same letter since they are not significantly different at 0.05 level LSD test. Error bars represent the standard errors of the means (n=3).
Unlike pH, there were significant differences in macronutrient concentration
with distance from Eucalyptus tree. In general, the macronutrient status increased with
distance from the Eucalyptus stand. Total N, nearest to the Eucalyptus stand however,

19
was very significantly (p < 0.001) above the average. Next to it at 5 m TN was
minimum (Figure 8 A). Farther from the trees, it increased up to the same value at 40
m as 1 m from the trees.
The available P content calculated was in the very low range (< 5 mg kg-1).
The one-way ANOVA showed that there was a highly significant difference (P <
0.001) in up ward trend with distance from the Eucalyptus stand (Figure 8 B).
Exchangeable Ca concentrations, at 1 m distance was 7.8 (coml (+). kg soil-1) and
significantly (P < 0.05) less than the values at the other sampling points along the
transect (Figure 8 C) which were in range that was considered in the high range 10-20
(coml (+). kg soil-1) in Ethiopia. Finally, the exchangeable K concentrations at all
distances were in high range, and independent of distance to the Eucalyptus stand at
the 5% significant level (Appendix 3).
Figure 8: Percentage of total nitrogen (A) available phosphorus in mg kg-1 (B) and exchangeable calcium in centimol of cations per kg of soil, and (C) mean values comparison along distance from Eucalyptus stand in plough depth. Mean values followed by the same letters are not significantly different at 0.05 level LSD test. Error bars represent the standard errors of the means (n=3).

20
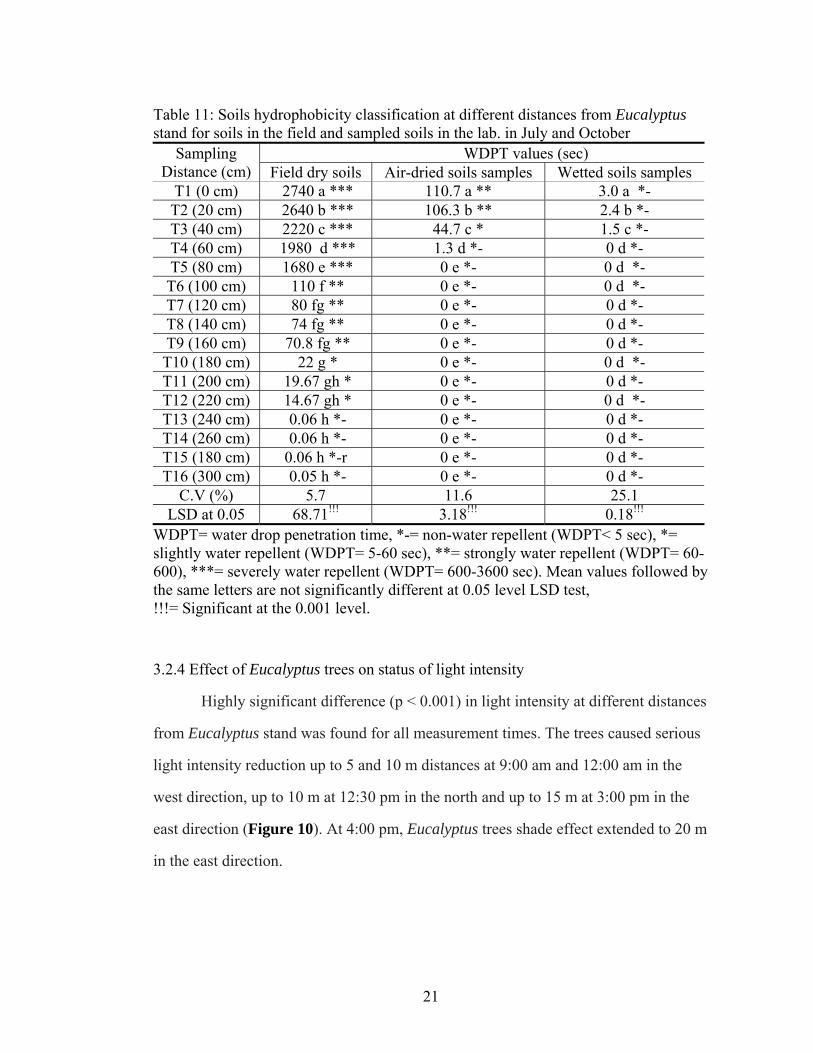
3.2.3 Status of soil hydrophobicity
Hydrophobicity has been often associated with Eucalyptus trees. We tested during
July the soils for hydrophobicity in transect when they were wet. Samples were also
taken at 20 cm intervals up to 3 m from the Eucalyptus stand and wet in the
laboratory. Under these wet conditions, the soils were wettable with WDPT value < 4s
(Table 11). However, when the soils were air or oven dried, they became highly
hydrophobic especially close to the Eucalyptus stand as shown by the WDPT test with
highly significant difference (P < 0.001). The WDPT test showed that for the field
dried soils at 0 to 80 cm from the trees, the soils were severely water repellent, from
100 to 160 cm strongly water repellent, from 180 to 220 cm slightly water repellent
and over 240 cm, non- water repellent. For the air-dried soil, the same trend was
observed but water repellency was less severe. The dried Eucalyptus plant parts (leaf,
bark and root) were found to be slightly water repellent. The WDPT value of the leaf
was significantly (P < 0.001) greater than the values of bark and root (Figure 9). Figure 9: Water repellence comparison of parts of Eucalyptus plant.
21
Table 11: Soils hydrophobicity classification at different distances from Eucalyptus stand for soils in the field and sampled soils in the lab. in July and October
WDPT= water drop penetration time, *-= non-water repellent (WDPT< 5 sec), *= slightly water repellent (WDPT= 5-60 sec), **= strongly water repellent (WDPT= 60-600), ***= severely water repellent (WDPT= 600-3600 sec). Mean values followed by the same letters are not significantly different at 0.05 level LSD test, !!!= Significant at the 0.001 level.
3.2.4 Effect of Eucalyptus trees on status of light intensity
Highly significant difference (p < 0.001) in light intensity at different distances
from Eucalyptus stand was found for all measurement times. The trees caused serious
light intensity reduction up to 5 and 10 m distances at 9:00 am and 12:00 am in the
west direction, up to 10 m at 12:30 pm in the north and up to 15 m at 3:00 pm in the
east direction (Figure 10). At 4:00 pm, Eucalyptus trees shade effect extended to 20 m
in the east direction.
Sampling Distance (cm)
WDPT values (sec) Field dry soils Air-dried soils samples Wetted soils samples
T1 (0 cm) 2740 a *** 110.7 a ** 3.0 a *- T2 (20 cm) 2640 b *** 106.3 b ** 2.4 b *- T3 (40 cm) 2220 c *** 44.7 c * 1.5 c *- T4 (60 cm) 1980 d *** 1.3 d *- 0 d *- T5 (80 cm) 1680 e *** 0 e *- 0 d *-
T6 (100 cm) 110 f ** 0 e *- 0 d *- T7 (120 cm) 80 fg ** 0 e *- 0 d *- T8 (140 cm) 74 fg ** 0 e *- 0 d *- T9 (160 cm) 70.8 fg ** 0 e *- 0 d *- T10 (180 cm) 22 g * 0 e *- 0 d *- T11 (200 cm) 19.67 gh * 0 e *- 0 d *- T12 (220 cm) 14.67 gh * 0 e *- 0 d *- T13 (240 cm) 0.06 h *- 0 e *- 0 d *- T14 (260 cm) 0.06 h *- 0 e *- 0 d *- T15 (180 cm) 0.06 h *-r 0 e *- 0 d *- T16 (300 cm) 0.05 h *- 0 e *- 0 d *-
C.V (%) 5.7 11.6 25.1 LSD at 0.05 68.71!!! 3.18!!! 0.18!!!
22
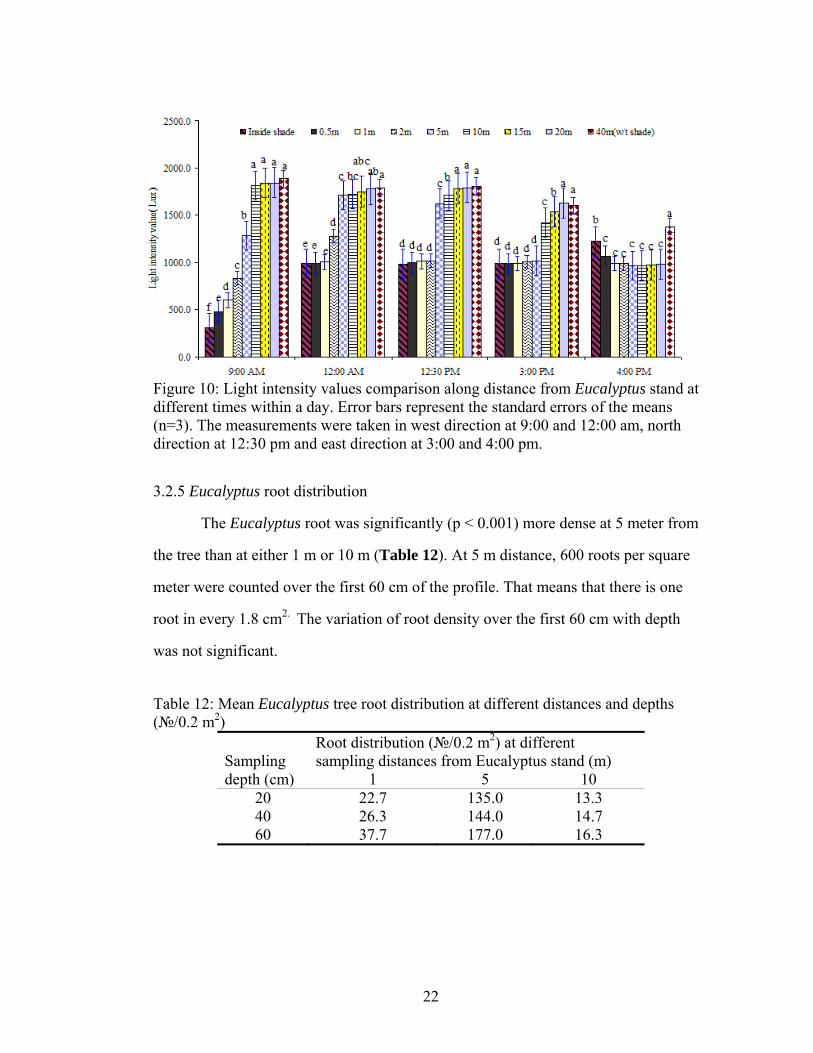
Figure 10: Light intensity values comparison along distance from Eucalyptus stand at different times within a day. Error bars represent the standard errors of the means (n=3). The measurements were taken in west direction at 9:00 and 12:00 am, north direction at 12:30 pm and east direction at 3:00 and 4:00 pm.
3.2.5 Eucalyptus root distribution
The Eucalyptus root was significantly (p < 0.001) more dense at 5 meter from
the tree than at either 1 m or 10 m (Table 12). At 5 m distance, 600 roots per square
meter were counted over the first 60 cm of the profile. That means that there is one
root in every 1.8 cm2. The variation of root density over the first 60 cm with depth
was not significant.
Table 12: Mean Eucalyptus tree root distribution at different distances and depths (№/0.2 m2)
Sampling depth (cm)
Root distribution (№/0.2 m2) at different sampling distances from Eucalyptus stand (m)
1 5 10 20 22.7 135.0 13.3 40 26.3 144.0 14.7 60 37.7 177.0 16.3

23
3.2.6 Undergrowth status of shade trees
In the study area, a survey was performed to identify environmentally friendly
tree species. The important overstory trees other than Eucalyptus spp. in the watershed
were Acacia albida, Acacia lahai, Croton macrostachyus, Grevilla robusta, Cordia
Africana, Albizia spp., Maytenus obscura, Vernonia volkameriaefolia, Psidium
guajava, Rhamnus prinoides, Ficus vasta, Olea africana and some others. Most of
these trees were used to provide shade for the coffee plants. Coffee is one of the most
important exportable products. Moreover, some of them such as P. guajava and R.
prinoides serve as food consumption. The average undergrowth density of the coffee
garden shade was significantly (P < 0.01) greater than that of under Eucalyptus trees
(Figure 11). The study proved that although the undergrowth density under both
shades decreased as the canopy closure increased, the coffee shade trees undergrowth
density is greater than that of the Eucalyptus stand at all densities of the overstory.
Figure 11: Undergrowth density (no.ha-1) values comparison between Eucalyptus and coffee garden shade trees stands.
3.2.7 Effects of trees on crop performance
In Figure 12 A and B, the number of plants and plant height is given as
function of distance from the tree for both the Eucalyptus and C. macrostachyus spp.
Obviously the corn was not affected by the proximity of the Croton spp. while the
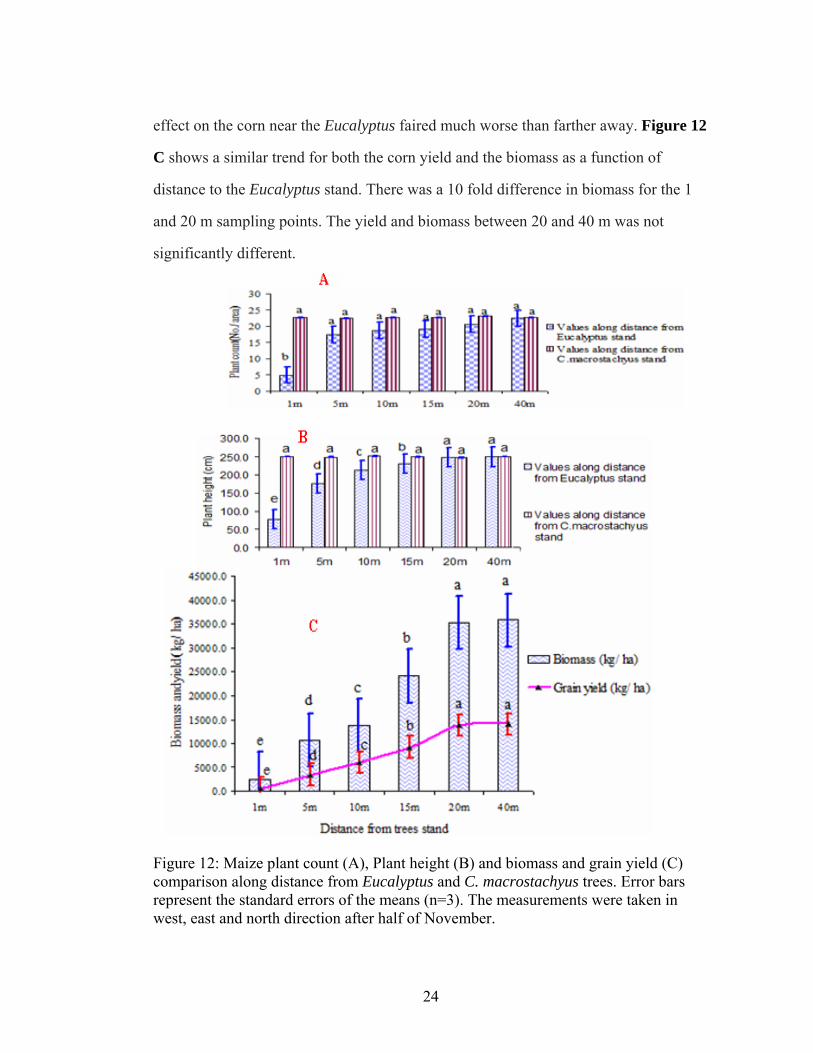
24
effect on the corn near the Eucalyptus faired much worse than farther away. Figure 12
C shows a similar trend for both the corn yield and the biomass as a function of
distance to the Eucalyptus stand. There was a 10 fold difference in biomass for the 1
and 20 m sampling points. The yield and biomass between 20 and 40 m was not
significantly different.
Figure 12: Maize plant count (A), Plant height (B) and biomass and grain yield (C) comparison along distance from Eucalyptus and C. macrostachyus trees. Error bars represent the standard errors of the means (n=3). The measurements were taken in west, east and north direction after half of November.

25
CHAPTER FOUR
4. DISCUSSION
In this study, there was a remarkable similarity between the three Eucalyptus
stands tested. The soil in all three sites was a clay loam (Table 9) with medium
organic matter (Figure 6) and low pH (Figure 7). The similarity was a result of that
all sites were located on an old lakebed.
We found that for the three sites, the root density was greatest at 5 m from the
tree (Table 12), and we found that the macronutrients (with exception of potassium)
were most depleted at this point. Moisture content was also the lowest here, but not
always statistically significant difference. Yield and biomass of maize were also most
reduced near the Eucalyptus stand (Figure 12). Here not only the soil played a role but
in addition, the light intensity was greatly reduced as well (Figure 10). However, soil
pH (Figure 7), organic matter (Figure 6), exchangeable K (Appendix 3) and bulk
density (Table 10) were not affected by the Eucalyptus.
At the maize maturity stage, moisture content was reduced even farther away
5m because of Eucalyptus border effect. Selamyihun and Stroonider (2004) reported
that irrespective of crop species, less water remained in the soil in the tree-crop system
than in the sole cropping. Since the growing medium is nitisol, both species can
extend their roots deeper to take out water during the drier period. The nearest crop
plants were wilted unlike the farther stands since Eucalyptus competes for moisture
even deeper in the soil. However, the values were not significantly different because
of Croton hedgerows due to their little lateral root extension and networking opposite
to Eucalyptus. Yu et al. (2006) reported that the occurrence of most densely, maize
plant rooted layers at or below 30 cm soil depth was very conducive to maintain plant
water under the dry soil condition. In other words, Susiluoto and Berninger (2007)
26
explained that the roots of Eucalyptus trees are usually well developed in the dry areas
and enable them to use the water stored deep in the soil during the dry season. This
opposes the maize plant to use the local water during the dry period by sending the
roots deeply. As the respondents’ opinion, Eucalyptus suctions excessive water from
the soil and water stores. Therefore, the water in the plow depth and water points
reduced and dried (Table 5). Thus, Eucalyptus trees unlike the other tree spp. such as
C. macrostachyus compete with maize plants for soil moisture, and the plant available
water is insufficient for the crop performance to get good yield.
Regarding the soil hydrophobicity, the soils at the field during the rainy season
in the study area were non-water repellent even under the Eucalyptus trees similar to
the wetted soil samples in the laboratory (Appendix 4.1). On the other hand, results of
the WDPT test for the dry soils in the field revealed that the soils were severely,
strongly, slightly and non-water repellent at 0 to 80, 100 to 160, 180 to 220 and ≥ 240
cm distances from Eucalyptus trees respectively. Moreover, the air-dried soils were
only strongly water-repellent at 0-20 cm, and slightly and non- water repellent at 40
and ≥ 60 cm distances respectively (Table 11). Thus, the undisturbed top dry soil is
more hydrophobic than the disturbed soil. Furthermore, from the Eucalyptus parts, leaf
was much more water repellent than either the root or stem bark even though all are
slightly water repellent (Figure 9). Therefore, Eucalyptus trees cause soil
hydrophobicity up to 2.2 m distance from the woodlot during the dry season through
leaf litter incorporation at surface soil. The situation happens particularly at the
beginning and end of rainy seasons. Abelho and Graca (1996) found similarly that the
Eucalyptus forest soils were highly hydrophobic and resulting in seasonal fluctuations
in discharge. Hydrophobicity can affect soil microorganisms, plant growth, soil
hydrology and soil erosion processes at centimetre to catchment scale as confirmed

27
partly by Florenzano (1956) who found that the nitrifying bacteria were very low
under Eucalyptus plantation litter.
Considering the soil chemical properties, all the soil samples taken at different
distances from Eucalyptus stand in the maize farm were acidic (Appendix 3). One
reason for that is leaching of cations deep in to the soil since the soil is red and rainfall
is high (1560 mm). The other reason might be due to the incorporation of the maize
stalk that increases humic and fulvic acids in the soil (Dou et al., 2008).
From the soil macronutrients, total nitrogen percentages in the plow zone from
0 to 20 cm depth at all distances were in the very high range (Appendix 3). Near the
Eucalyptus stand, this might be due to its allelopathic effect, which opposes the
mineral uptake by the plants and low mineralization. Bernhard-Reversat (1987)
reported that mineralizable N, measured by 20 days averaged 11-14 mg N kg-1 soil
under Eucalyptus and 40-50 mg N kg-1 soil under Acacia soils. Nevertheless, there
was very highly significant difference between the TN values of sampling points. The
value at 5 m was the least since the Eucalyptus root number was the highest. The TN
values increased at the point where the competition of the Eucalyptus trees decreased.
The available phosphorus content calculated in the first 20 cm depth at different
distances from Eucalyptus stand was in the very low range (< 5 mg kg-1) (Appendix
3) because the acidic soil fixed the phosphorus. Similar to other Ethiopian soils, we
found that the exchangeable calcium and potassium were all in the high range (Ilaco,
1985). Dedecek et al. (2007) reported that Eucalyptus had a small effect on K level.
In the Koga Watershed, there were environmentally friendly trees like Acacia
species. Under the important overstory tree types, the understory density was superior
to Eucalyptus species (Appendix 8). Fabião et al. (2002) stated that Eucalyptus
species were usually considered as having less understory vegetation than the other
types of forest stands due to its competition and hydrophobic effects. These local tree

28
species serve as shades of coffee plant including the other important undergrowth
plant species like grasses, shrubs and ferns. As Mahmud et al. (2005) explained that
there have been easily manageable, fast maturing and widely adaptable leguminous
tree species (Leucaena leucocephala, Prosopis juliflora and Albizia procera), which
improve the productivity of the adjacent plantation. The good performance of
understory plants under these coffee shade trees is due to absence of competition for
resources with the overstory plants as well as the advantage from the shade like
nitrogen fixation. Hanil et al. (2008) stated that the undergrowth plants might show
different patterns than the shade tree species because of different responses to light
level, nutrient availability and temperature. Shaded crops such as coffee have
shallower roots than the other fruit trees, and thus perform well (Lehmann, 2003). This
is not true for Eucalyptus since local farmers tried and failed growing coffee under its
shade. In addition, the different strata with in coffee garden shade facilitate infiltration,
reduce erosion, increases water table and improve soil physical and chemical
properties through the undergrowth biomass incorporation. Parker and Brown (1999)
explained that multiple canopy or more specifically, the continuous distribution of
foliar surfaces from the top of the crown to the ground created greater quantities and
diversity of animal habitat, which enhances the decomposition of organic matter.
However, allelopathy affects important soil organisms and other plant species under
the Eucalyptus shade. Watson (2000) stated Eucalyptus leaf extracts have inhibited the
germination of several plants. Therefore, Eucalyptus species caused drawbacks rather
than improving the performance of the undergrowth vegetation unlike the mentioned
multipurpose trees. One of the most important trees in the study area, A. albida shades
and retains its tiny leaves during the rainy and dry seasons respectively (Dupuy and
Dreyfus, 1992). Thus, it facilitates infiltration and reduces erosion due to mulches of
29
the shaded leaves during rainy season, and reduces the sun radiation effect for
vegetation and other microorganisms under the shade during the dry season.
As it was ensured experimentally, the maize plant performs poorly in its plant
height and count up to 15 and 1 m distances respectively due to the impact of
Eucalyptus species rather than C. macrostachyus border plantation. Eucalyptus
hedgerow was also checked that it causes severe biomass and grain yield reductions up
to 15 m from woodlots. The local farmers perceived that the common crop production
is depressed by the adjacent Eucalyptus plantation although most farmers grew
Eucalyptus species to be as similar as their neighbours did (Table 4). Eucalyptus
reduces seedling emergence and other parameters of maize (EI-Khawas and Shehata,
2005). The reductions from the controls were 18.7-171 cm, 11.8-33.3 ton.ha-1 and 4.9-
13.5 ton ha-1 in plant height, biomass and grain yield respectively. The most important
parameter, the maize grain yield was greatly determined by light intensity that is
important to get energy for whatever performances the crop does. Intercepted radiation
by the crop plant relates to seed yield (R > 95) (Agele et al., 2007). Kotowskil et al.
(2000) reported that light availability and/ or intensity had a large effect on most plant,
species biomass production even than water level. Therefore, the plant species such as
maize crop, planted to the Eucalyptus proximity in the west direction is more seriously
affected due to light shortage (Figure 10). About 88, 32 and 20 percents of the farmers
in the study area perceived that the Eucalyptus shading effect is more pronounced if
the neighboring plants are in west, north, and south and east directions respectively
(Table 6). In addition, Eucalyptus trees affected the maize plant performance by
reducing available p even if the strength of belowground competition can be decreased
with fertilization (James and Jr, 1999). Ayoola and Makinde (2008) explained that
maize plant could give good yield if the growing medium has good amounts of N, P,
K and Ca.

30
CHAPTER FIVE
5. CONCLUSIONS AND RECOMMENDATIONS
In the study area, the active farmers (males in the adult stage) perceived that
Eucalyptus plantation depreciates the potential of the environment even though they
keep on growing the trees because of the relative short time required to produce wood
biomass for fuel, construction and cash. Experimentally, it was proven that the soils
did not vary significantly in texture, bulk density, organic matter, pH, exchangeable K
and AWC because of Eucalyptus impact. Therefore, the poor performances of the
adjacent plants, particularly maize crop and undergrowth plants such as coffee and
grasses were because of light, water and nutrients (total nitrogen, available phosphorus
and exchangeable calcium) competition and soil hydrophobicity. Since Eucalyptus
spp. are fast growing, and deep and dense rooted, the reducing and drying status of
previously functional nearby water stores in the watershed is as a result of its greatest
water sucking ability besides soil hydrophobicity and poor undergrowth that reduce
infiltration and water table. Thus, there is a frustration that the potential ecosystem
will be exhausted in the future because of the described worse environmental
modification.
In the Koga Watershed, farmers suggested that priority should be given to crop
production for food security point of view. That is crops and Eucalyptus trees should
be cultivated on productive and marginal lands (consisting of wetlands and
wastelands) respectively. Altogether, the results from the study leads to the
recommendations those crops should be cultivated from at distance greater to about 15
m from Eucalyptus stand. Additional crops and undergrowth vegetation should be
tested for its behaviour adjacent to the Eucalyptus. Furthermore, it is better to try to
select the less resource seeking Eucalyptus species through additional studies. In

31
addition, its allelopathic effect should be studied in detail. Economic analysis for
Eucalyptus plantation should also be done to continue, reduce and potentially stop its
use.
For the sustainability and efficiency of the Koga irrigation project, Eucalyptus
should not be planted in close proximity to the water source (Koga River) since it
reduces and dries up springs. Moreover, nitrogen fixing multipurpose tree species
should be given preference to try to replace Eucalyptus species for successful
plantation since Eucalyptus trees add nothing to the soil system except recycling some
inputs unlike leguminous species, which fix nitrogen to the soil from the atmosphere.
Therefore, Acacia albida, Leucaena leucocephala, Prosopis juliflora and Albizia
procera due to special phenology, wide adaptability, drought resistance and timber
quality respectively are promising species.

32
CHAPTER SIX
6. REFERENCES
Abelho, A., Mas, G., 1996. Effect of Eucalyptus afforestation on leaf litter dynamics
In addition, macro invertebrate community structure of streams in central Portugal, Portugal. Hydrobiologia, 324, 195-204.
Agele, S. O., Maraiyesa, I. O., Adeniji, I. A., 2007. Effects of variety and raw spacing
on radiation interception, partitioning of dry matter and seed set efficiency in late. season sunflower (Helianthus annuus L.) in a humid zone of Nigeria, 2, 80-88.
Ayoola, O. T., Makinde, E. A., 2008. Performance of green maize and soil nutrient
changes with fortified cow dung, Nigeria. African journal of plant science, 2, 19-22.
Bernhard-Reversat, F., 1987. Soil nitrogen mineralization under a Eucalyptus
plantation a natural Acacia forest in Senegal, 23, 233-244. Bernhard-Reversat, F., 1999. The leaching of Eucalyptus hybrids and Acacia
auriculiformis leaf litter: laboratory experiments on early Decomposition and ecological implications in Congolese tree plantations, France. Applied Soil Ecology. 12, 251-261.
Blake, G.R.,1965. Bulk density. pp. 374-399. C.A. Black (Ed). Methods of soil
analysis Agron. Part I, No. 9.Am. Soc. Agron. Madison, Wisconsin, USA. Dedecek, A. R., Bellote, J. F. A., Menegol, O., 2007. Influence of residue
management and soil tillage on second rotation of Eucalyptus growth. Dekker, L.W., Ritsema, C.J., 1995. Fingerlike wetting patterns in two water-repellent
loam soils. J. Environ. Qual., 24:324-333.
Dupuy, N.C., Dreyfus, B.L., 1992. Bradyrhizobium populations occur in deep soil under the leguminous tree Acacia albida, Senegal,58, 2415-2419.
Dou, S., Zhang, J. J., Li, K., 2008. Effect of organic matter applications on 13 C-NMR
spectra of humic acids of soil, China, 59, 532-539. EI-Amin, E.A., Diab, I.E., Ibrahim, S.I., 2001. Influence of Eucalyptus on some
Physical and chemical properties of a soil in Sudan, Sudan. COMMUN. SOIL PLANT ANAL. 32, 2267-2278.
EI-Khawas, S. A., Shehata, M. M., 2005. The allelopathic potentialities of Acacia
nilotica and Eucalyptus rostrata on monocot (Zea mays L.) and dicot (Phaseolus
33
vulgaris L.) plants. Biotechnology, 4, 23-34. Fabião, A., Martins, M. C., Cerveira, C., Santos, C., Lousa˜, M., Madeira, M.,
Correia, A., 2002. Influence of soil and organic residue management on biomass and biodiversity of understory vegetation in a Eucalyptus globulus Labill plantation, Portugal, 171, 87-100.
Florenzano, G.,1956. Richerche sui terreni coltivati ad eucalitti. II Recherch
Microbiologiche e Biochimiche, Centro di Sperimentazione Agricola e Forestale, Laimburg, Italy, 133-152.
Garay, I., Pellens, R., Kindel, A., 2004. Evaluation of soil conditions in fast-
growing Plantations of Eucalyptus grandis and Acacia mangium in Brazil: a contribution to the study of sustainable land use, Brazil. Applied Soil Ecology. 27,177-187.
Gindaba, J., Rozanove, A., Negash, L., 2004. Response of seedlings of two Eucalyptus and three deciduous tree species from Ethiopia to severe water stress, Ethiopia. 201, 119-129.
Hanil, R., Tjitrosoedirdjo, S. S., Setiadi, D., 2008. Structure and composition of
understory plant assemblages of six land use types in the lore Lindu Natiional Park, Central Sulawesi, Indonesia. Bangladesh J. Plant Taxon, 15, 1-12.
Ilaco, B.V., 1985. Agricultural compendium. Jagger, P., Pender, J., 2003. The role of trees for sustainable management of less-
Favored lands: the case of Eucalyptus in Ethiopia, USA. 5, 83-95. James, F., Jr, C., 1999. Fertilization effects on interactions between above-and-
belowground competition in an old field, USA, 80, 466-480. Jouquet, P., Bernared-Reversat, F., Bottinelli, N., Orange, D., Rouland-Lefervre, C.,
Tran Duc, T., Podwojewski, P., 2007. Influence of changes in land use and Earthworm activities on carbon and nitrogen dynamics in a steep land ecosystem in Northern Vietnam, Vietnam. 44, 69-77.
Kidanu, S., Mamo, T., Stroosnijder, L., 2005. Biomass production of Eucalyptus
boundary plantations and their effect on crop productivity on Ethiopian highlands vertisols, Ethiopia. 63, 281-290.
Klute, A., 1965.Water holding capacity. Pp. 273-278. C.A. Black (Ed.). Methods of
soil analysis. Agron. Part I, No. 9, Am. Soc. Agron. Madison, Wisconsin, USA. Kotowskil, W., Andel, V. J., Diggelen, V. R., Hogendorf, J., 2000. Response of fen
34
plant species to groundwater level and light intensity, Netherlands. Plant Ecology, 155, 147-156.
Lane, P. N. J., Morris, J., Ningnan, Z., 2004. Water balance of tropical Eucalyptus
plantations in southeast China, China.124, 253-267.
Lehmann, J., 2003.Subsoil root activity in tree-based cropping systems, USA. Plant and Soil, 255:319-331.
Mahmud, S., Hoque, R. A. T. M., Mohiuddin, M., 2005. Nodulation behavior and
biomass productivity of three leguminous plant species at nursery stage in Chittagong University soils, Bangladesh, 1, 89-93.
Olsen, S.R., C.V. Cole, F.S. Watanabe, L.A. Dean, 1954. Estimation of available
phosphorus in soil by extraction with sodium bicarbonate. USDA, Circular, 939: 1-19.
Parker, G. G. Brown, J. M., 1999. Forest canopy stratification-Is it useful? Rowell, D.L., 1994. Soil science: Methods and applications. Addison Wesley
Longman Limited. England. 350p. Selamyihun, K., Stroosnider, L., 2004. Soil erosion and seasonal water use in
Eucalyptus globulus based rotational agroforestry system on Ethiopian highland vertisols.
Sahlemeden, S., Taye, B.,2000.procedure for soil and pland analyusis. National Soil Research Center, Ethiopia Agricultura research organization, Addis Ababa, Ethiopia. 110p.
Selamyihun, K., Tekalign, M., Stroosnijder, L., 2004. Biomass production of.
Eucalyptus boundary plantations and their effect on crop productivity on Ethiopian highland vertisols.
Susiluoto, S., Berninger, F., 2007. Interactions between Morphological and
physiological drought responses in Eucalyptus microtheca, Canada. 41, 221-233. Watson, K., 2000. The effect of Eucalyptus and Oak leaf extracts on California Native
plants, California. World Soil Resources Reports 94, FAO, 2001. Yu, G., Zhuang, J. E.,Nakayama, K. E., Jin, J. Y., 2006. Root water uptake and profile
soil water as affected by vertical root distribution.

35
Zerfu, H., 2002. Ecological impact evaluation of Eucalyptus plantations in comparison with agricultural and grazing land-use types in the highlands of Ethiopia.
36
CHAPTER SEVEN
7. APPENDIX
Appendix 1: Status of soil moisture content
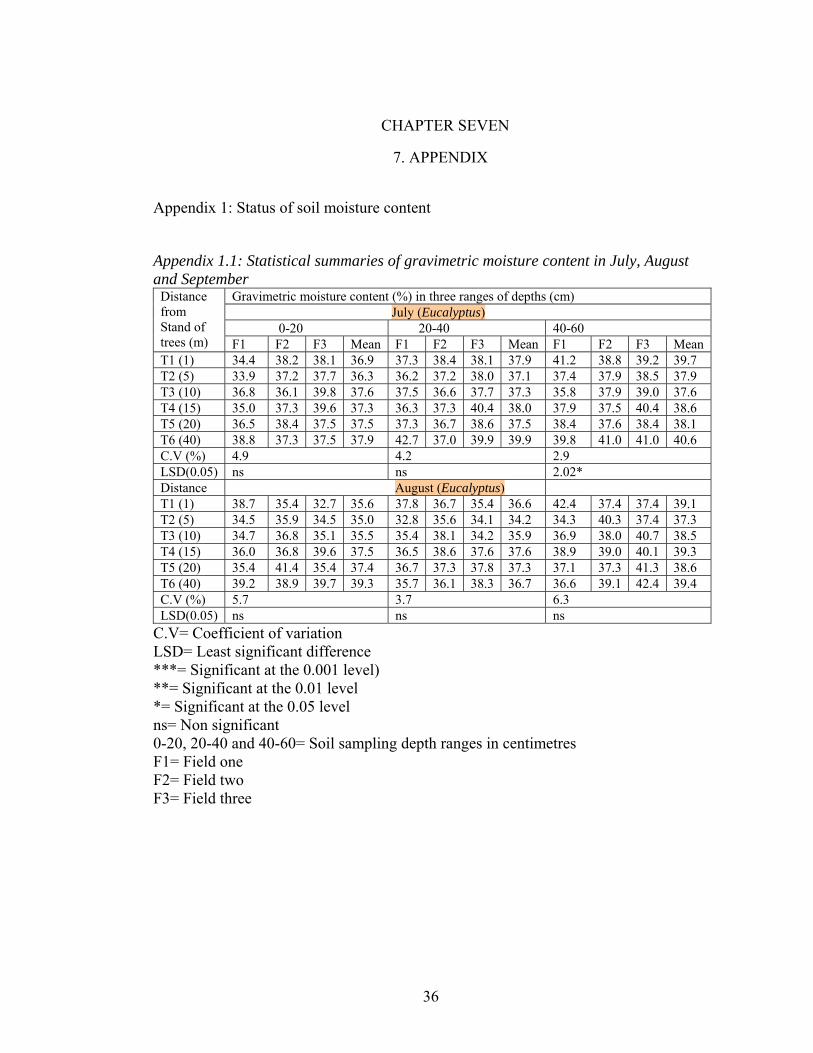
Appendix 1.1: Statistical summaries of gravimetric moisture content in July, August and September
Distance from Stand of trees (m)
Gravimetric moisture content (%) in three ranges of depths (cm) July (Eucalyptus) 0-20 20-40 40-60 F1 F2 F3 Mean F1 F2 F3 Mean F1 F2 F3 Mean
T1 (1) 34.4 38.2 38.1 36.9 37.3 38.4 38.1 37.9 41.2 38.8 39.2 39.7 T2 (5) 33.9 37.2 37.7 36.3 36.2 37.2 38.0 37.1 37.4 37.9 38.5 37.9 T3 (10) 36.8 36.1 39.8 37.6 37.5 36.6 37.7 37.3 35.8 37.9 39.0 37.6 T4 (15) 35.0 37.3 39.6 37.3 36.3 37.3 40.4 38.0 37.9 37.5 40.4 38.6 T5 (20) 36.5 38.4 37.5 37.5 37.3 36.7 38.6 37.5 38.4 37.6 38.4 38.1 T6 (40) 38.8 37.3 37.5 37.9 42.7 37.0 39.9 39.9 39.8 41.0 41.0 40.6 C.V (%) 4.9 4.2 2.9 LSD(0.05) ns ns 2.02* Distance August (Eucalyptus) T1 (1) 38.7 35.4 32.7 35.6 37.8 36.7 35.4 36.6 42.4 37.4 37.4 39.1 T2 (5) 34.5 35.9 34.5 35.0 32.8 35.6 34.1 34.2 34.3 40.3 37.4 37.3 T3 (10) 34.7 36.8 35.1 35.5 35.4 38.1 34.2 35.9 36.9 38.0 40.7 38.5 T4 (15) 36.0 36.8 39.6 37.5 36.5 38.6 37.6 37.6 38.9 39.0 40.1 39.3 T5 (20) 35.4 41.4 35.4 37.4 36.7 37.3 37.8 37.3 37.1 37.3 41.3 38.6 T6 (40) 39.2 38.9 39.7 39.3 35.7 36.1 38.3 36.7 36.6 39.1 42.4 39.4 C.V (%) 5.7 3.7 6.3 LSD(0.05) ns ns ns
C.V= Coefficient of variation LSD= Least significant difference ***= Significant at the 0.001 level) **= Significant at the 0.01 level *= Significant at the 0.05 level ns= Non significant 0-20, 20-40 and 40-60= Soil sampling depth ranges in centimetres F1= Field one F2= Field two F3= Field three

37
Appendix 1.2: Statistical summaries of gravimetric moisture content in September Distance from Eucalyptus (m)
September (Eucalyptus) F1
F2
F3
Mean
F1
F2
F3
Mean
F1
F2
F3
Mean
T1 (0.5) 27.2 30.0 28.6 28.6 26.3 29.7 28.0 28.0 27.7 30.7 29.2 29.2 T2 (1) 30.1 30.5 30.9 30.5 32.7 33.1 33.5 33.1 34.3 33.4 35.1 34.3 T3 (2) 33.4 32.7 31.7 32.6 32.1 33.2 31.0 32.1 29.1 32.4 32.5 31.3 T4 (5) 27.8 30.5 29.8 29.4 28.0 32.5 32.3 30.9 31.5 35.2 33.4 33.4 T5 (10) 33.0 34.5 35.9 34.5 34.5 35.6 36.7 35.6 38.3 37.7 38.9 38.3 T6 (15) 38.2 41.1 37.0 38.8 35.9 38.0 38.3 37.4 39.6 38.1 41.1 39.6 T7 (20) 40.5 41.2 41.0 40.9 37.3 38.2 39.1 38.2 41.1 40.0 42.1 41.1 C.V (%) 3.8 4.3 4.0 LSD(0.05) 2.2*** 2.5*** 2.5*** Distance September (C. macrostachyus) T1 (0.5) 40.2 42.0 41.0 41.1 39.0 37.1 38.1 38.1 39.8 40.0 37.7 39.2 T2 (1) 42.4 41.8 40.0 41.4 38.4 38.2 38.3 38.3 38.0 38.7 38.4 38.4 T3 (2) 39.4 42.2 41.8 41.1 38.0 39.5 39.0 38.8 38.0 38.9 39.0 38.6 T4 (5) 39.8 39.0 43.4 40.7 45.0 38.1 40.0 41.0 38.9 38.0 40.0 39.0 T5 (10) 39.8 38.8 41.5 40.0 39.8 40.4 39.0 39.7 39.8 41.0 42.2 41.0 T6 (15) 43.0 39.0 41.0 41.0 38.0 44.3 42.9 41.7 41.0 39.2 39.1 39.8 T7 (20) 44.2 40.0 41.0 41.7 39.0 40.0 39.5 39.5 41.7 40.0 39.2 40.3 C.V (%) 4.2 4.9 2.6 LSD(0.05) ns ns ns
38
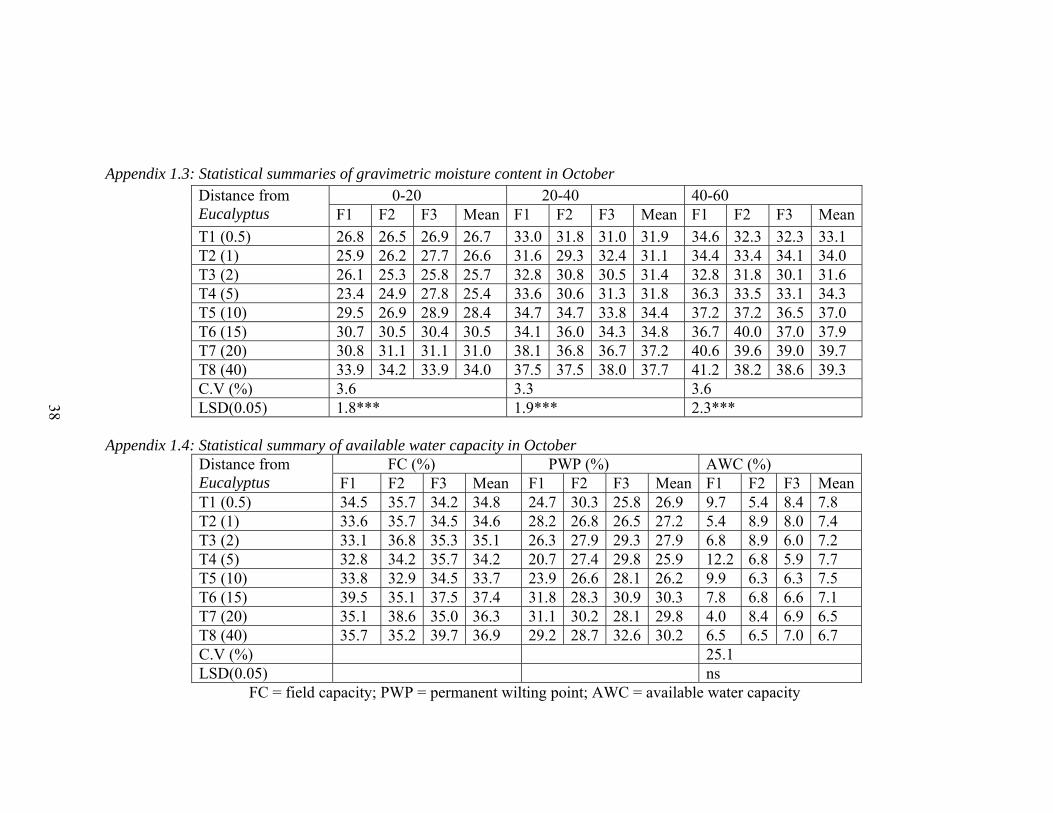
Appendix 1.3: Statistical summaries of gravimetric moisture content in October Distance from Eucalyptus
0-20 20-40 40-60 F1 F2 F3 Mean F1 F2 F3 Mean F1 F2 F3 Mean
T1 (0.5) 26.8 26.5 26.9 26.7 33.0 31.8 31.0 31.9 34.6 32.3 32.3 33.1 T2 (1) 25.9 26.2 27.7 26.6 31.6 29.3 32.4 31.1 34.4 33.4 34.1 34.0 T3 (2) 26.1 25.3 25.8 25.7 32.8 30.8 30.5 31.4 32.8 31.8 30.1 31.6 T4 (5) 23.4 24.9 27.8 25.4 33.6 30.6 31.3 31.8 36.3 33.5 33.1 34.3 T5 (10) 29.5 26.9 28.9 28.4 34.7 34.7 33.8 34.4 37.2 37.2 36.5 37.0 T6 (15) 30.7 30.5 30.4 30.5 34.1 36.0 34.3 34.8 36.7 40.0 37.0 37.9 T7 (20) 30.8 31.1 31.1 31.0 38.1 36.8 36.7 37.2 40.6 39.6 39.0 39.7 T8 (40) 33.9 34.2 33.9 34.0 37.5 37.5 38.0 37.7 41.2 38.2 38.6 39.3 C.V (%) 3.6 3.3 3.6 LSD(0.05) 1.8*** 1.9*** 2.3***
Appendix 1.4: Statistical summary of available water capacity in October Distance from Eucalyptus
FC (%) PWP (%) AWC (%) F1 F2 F3 Mean F1 F2 F3 Mean F1 F2 F3 Mean
T1 (0.5) 34.5 35.7 34.2 34.8 24.7 30.3 25.8 26.9 9.7 5.4 8.4 7.8 T2 (1) 33.6 35.7 34.5 34.6 28.2 26.8 26.5 27.2 5.4 8.9 8.0 7.4 T3 (2) 33.1 36.8 35.3 35.1 26.3 27.9 29.3 27.9 6.8 8.9 6.0 7.2 T4 (5) 32.8 34.2 35.7 34.2 20.7 27.4 29.8 25.9 12.2 6.8 5.9 7.7 T5 (10) 33.8 32.9 34.5 33.7 23.9 26.6 28.1 26.2 9.9 6.3 6.3 7.5 T6 (15) 39.5 35.1 37.5 37.4 31.8 28.3 30.9 30.3 7.8 6.8 6.6 7.1 T7 (20) 35.1 38.6 35.0 36.3 31.1 30.2 28.1 29.8 4.0 8.4 6.9 6.5 T8 (40) 35.7 35.2 39.7 36.9 29.2 28.7 32.6 30.2 6.5 6.5 7.0 6.7 C.V (%) 25.1 LSD(0.05) ns
FC = field capacity; PWP = permanent wilting point; AWC = available water capacity
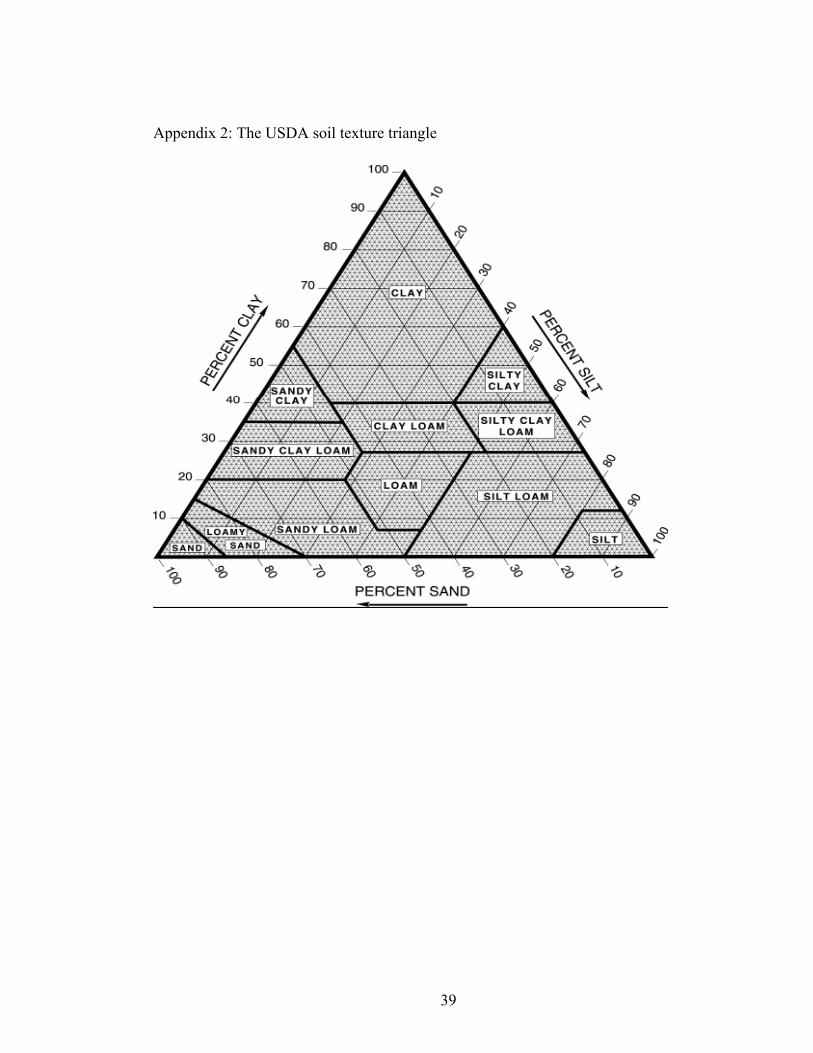
39
Appendix 2: The USDA soil texture triangle

40
Appendix 3: Statistical summaries of soil parameters Distance from Eucalyptus (m)
pH(KCl) (mole/litre) pH(H2O) (mole/litre) O.M (%)
F1
F2
F3
Mean
F1
F2
F3
Mean
F1
F2
F3
Mean
T1 (1m) 3.7 3.8 3.9 3.8 3.9 4.8 4.0 4.2 2.1 3.1 3.3 2.8 T2 (5m) 3.6 3.6 3.5 3.6 3.7 3.9 4.0 3.9 3.3 2.3 2.8 2.8 T3 (10m) 3.7 3.7 3.7 3.7 3.9 4.5 3.9 4.1 2.2 2.6 2.3 2.4 T4 (15m) 3.7 3.8 3.6 3.7 3.8 4.9 3.8 4.2 2.6 2.7 3.0 2.8 T5 (20m) 3.6 3.9 3.6 3.7 3.8 4.9 3.8 4.2 3.0 3.0 3.1 3.0 C (40m) 3.6 3.8 3.7 3.7 4.3 4.5 3.8 4.2 3.1 3.1 3.1 3.1 C.V (%) 2.70 9.68 10.64 LSD (0.05)
ns ns ns
Distance
TN (%)
Available P (mg kg-1) Exch. Ca (cmol (+) kg soil-1)
T1 (1m) 0.35 0.34 0.32 0.34 0.0 3.0 1.5 1.5 8.8 8.2 6.3 7.8 T2 (5m) 0.25 0.28 0.24 0.26 1.8 1.0 0.2 1.0 10.4 12.8 9.5 10.9 T3 (10m) 0.26 0.29 0.26 0.27 1.3 1.5 1.3 1.4 11.4 13.1 10.2 11.6 T4 (15m) 0.28 0.30 0.29 0.29 1.4 2.4 1.9 1.9 11.5 13.2 10.5 11.7 T5 (20m) 0.30 0.33 0.30 0.31 2.4 2.2 2.3 2.3 11.6 13.2 10.6 11.8 C (40m) 0.34 0.33 0.34 0.34 5.3 4.7 3.2 4.4 11.6 13.4 10.6 11.9 C.V (%) 0.00 33.55 12.79 LSD(0.05) 0.00*** 1.23*** 2.47* Distance
Exch. K (cmol (+) kg soil-1)
Cmol (+) kg soil-1 = Cations in centimole per kilogram of soil Exch. Ca= Exchangeable calcium K= Potassium
T1 (1m) 1.59 1.07 0.95 1.20 T2 (5m) 1.02 1.45 1.19 1.22 T3 (10m) 0.64 0.83 1.04 0.84 T4 (15m) 0.64 1.69 0.81 1.05 T5 (20m) 0.64 1.37 1.06 1.02 C (40m) 0.64 1.42 0.68 0.91 C.V (%) 39.34 LSD(0.05) ns
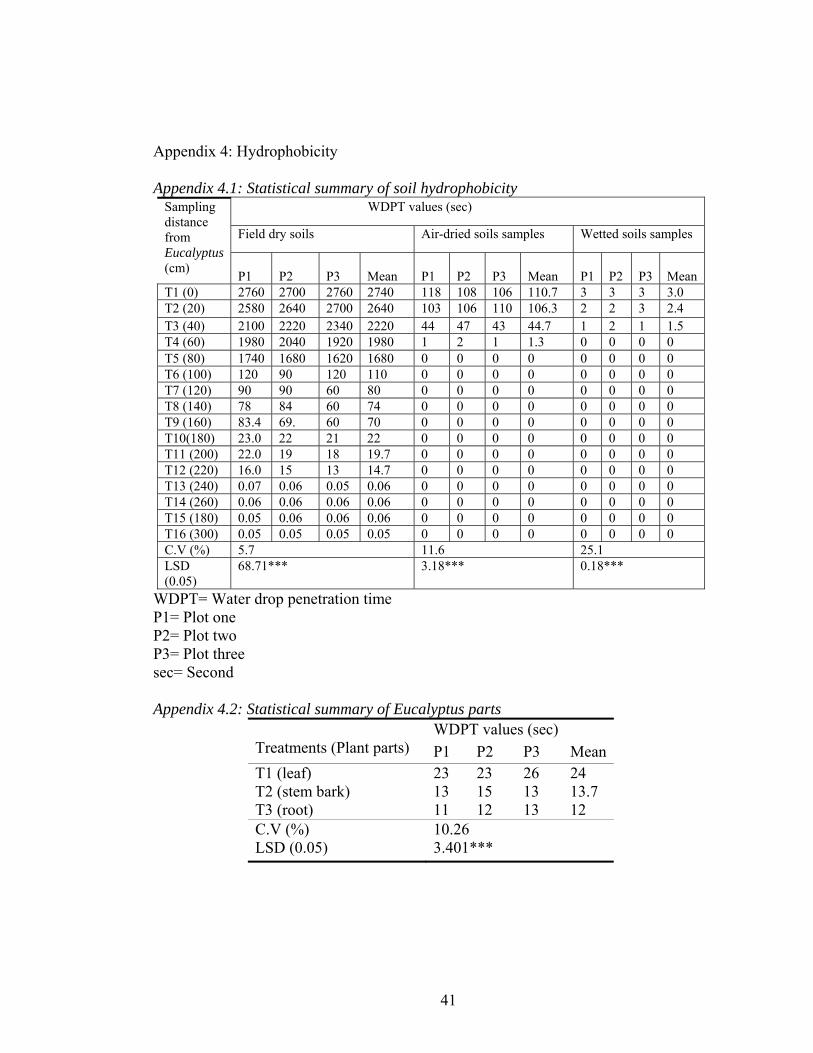
41
Appendix 4: Hydrophobicity Appendix 4.1: Statistical summary of soil hydrophobicity
Sampling distance from Eucalyptus (cm)
WDPT values (sec)
Field dry soils Air-dried soils samples Wetted soils samples
P1
P2
P3
Mean
P1
P2
P3
Mean
P1
P2
P3
Mean
T1 (0) 2760 2700 2760 2740 118 108 106 110.7 3 3 3 3.0 T2 (20) 2580 2640 2700 2640 103 106 110 106.3 2 2 3 2.4 T3 (40) 2100 2220 2340 2220 44 47 43 44.7 1 2 1 1.5 T4 (60) 1980 2040 1920 1980 1 2 1 1.3 0 0 0 0 T5 (80) 1740 1680 1620 1680 0 0 0 0 0 0 0 0 T6 (100) 120 90 120 110 0 0 0 0 0 0 0 0 T7 (120) 90 90 60 80 0 0 0 0 0 0 0 0 T8 (140) 78 84 60 74 0 0 0 0 0 0 0 0 T9 (160) 83.4 69. 60 70 0 0 0 0 0 0 0 0 T10(180) 23.0 22 21 22 0 0 0 0 0 0 0 0 T11 (200) 22.0 19 18 19.7 0 0 0 0 0 0 0 0 T12 (220) 16.0 15 13 14.7 0 0 0 0 0 0 0 0 T13 (240) 0.07 0.06 0.05 0.06 0 0 0 0 0 0 0 0 T14 (260) 0.06 0.06 0.06 0.06 0 0 0 0 0 0 0 0 T15 (180) 0.05 0.06 0.06 0.06 0 0 0 0 0 0 0 0 T16 (300) 0.05 0.05 0.05 0.05 0 0 0 0 0 0 0 0 C.V (%) 5.7 11.6 25.1 LSD (0.05)
68.71*** 3.18*** 0.18***
WDPT= Water drop penetration time P1= Plot one P2= Plot two P3= Plot three sec= Second Appendix 4.2: Statistical summary of Eucalyptus parts
Treatments (Plant parts)
WDPT values (sec) P1 P2 P3 Mean
T1 (leaf) 23 23 26 24 T2 (stem bark) 13 15 13 13.7 T3 (root) 11 12 13 12 C.V (%) 10.26 LSD (0.05) 3.401***

42
Appendix 5: Statistical summaries of light intensity Appendix 5.1: Light intensity at 9:00 am, 12:00 am and 12:30 pm
Distance from trees (m)
Light intensity values (Lux) 9:00 am
P1 P2 P3 Mean T1 (0) 392.4 267.0 256.5 305.3 T2 (0.5) 479.8 470.3 490.2 480.1 T3 (1) 570.0 617.5 617.5 601.7 T4 (2) 845.5 788.5 855.0 829.7 T5 (5) 1125.8 1425.0 1292.0 1280.9 T6 (10) 1805.0 1824.0 1813.6 1814.2 T7 (15) 1871.5 1843.0 1805.0 1839.8 T8 (20) 1795.5 1890.5 1843.0 1843.0 T9 (40) 1890.5 1881.0 1881.0 1884.2 C.V (%) 5.1 LSD (0.05) 105.2*** Distance 12:00 am T1 (0) 988.0 990.4 987.5 988.6 T2 (0.5) 996.6 993.2 996.1 995.3 T3 (1) 1008.4 1002.3 999.4 1003.4 T4 (2) 1251.6 1388.0 1188.5 1276.0 T5 (5) 1730.4 1698.1 1709.1 1712.5 T6 (10) 1720.5 1713.8 1731.9 1722.0 T7 (15) 1725.7 1757.5 1761.3 1748.2 T8 (20) 1765.1 1779.4 1786.0 1776.8 T9 (40) 1778.0 1790.0 1791.7 1786.6 C.V (%) 2.5 LSD (0.05) 60.9*** Distance 12:30 pm T1 (0) 988.0 978.5 977.6 981.4 T2 (0.5) 997.5 1001.3 1002.3 1000.4 T3 (1) 1019.4 1007.0 1002.3 1009.5 T4 (2) 1018.4 1014.6 1019.4 1017.5 T5 (5) 1502.0 1663.5 1702.4 1622.6 T6 (10) 1705.3 1708.1 1710.0 1707.8 T7 (15) 1772.7 1778.4 1780.3 1777.1 T8 (20) 1790.8 1791.7 1792.7 1791.7 T9 (40) 1793.6 1806.9 1810.7 1803.7 C.V (%) 2.5 LSD (0.05) 61.4***

43
Appendix 5.2: Light intensity 3:00 and 4:00 pm Distance from trees (m)
Light intensity values (Lux) 3:00 pm
P1 P2 P3 Mean T1 (0) 984.2 985.2 988.0 985.8 T2 (0.5) 985.2 987.1 986.1 986.1 T3 (1) 984.2 980.4 1006.1 990.2 T4 (2) 992.8 997.5 1026.0 1005.4 T5 (5) 995.6 1007.0 1058.3 1020.3 T6 (10) 1425.0 1414.6 1424.1 1421.2 T7 (15) 1589.4 1475.4 1541.9 1535.5 T8 (20) 1638.8 1635.9 1609.3 1628.0 T9 (40) 1589.4 1596.0 1618.8 1601.4 C.V (%) 2.0 LSD (0.05) 42.2*** Distance 4:00 pm T1 (0) 1324.3 1311.0 1035.5 1223.6 T2 (0.5) 1063.1 1161.9 980.4 1068.4 T3 (1) 988.0 978.5 997.5 988.0 T4 (2) 1007.0 969.0 978.5 984.8 T5 (5) 964.3 971.9 965.2 967.1 T6 (10) 970.0 968.1 970.0 969.3 T7 (15) 969.0 973.8 971.9 971.5 T8 (20) 980.4 984.2 978.5 981.0 T9 (40) 1383.2 1351.9 1392.7 1375.9 C.V (%) 6.0 LSD (0.05) 108.2***

44
Appendix 6: Statistical summaries of maize parameters Treatment (Distances from trees)
Ph vs. Eu. Effect (cm) Ph vs. Cr Effect (cm)
F1 F2 F3 Mean F1 F2 F3 Mean
T1 (1m) 82.5 73.7 77.9 78 245 250 255 250 T2 (5m) 175.5 177 176.5 176.3 253 249 243 248.3 T3 (10m) 211.8 215.3 213.5 213.5 255 248 254 252.3 T4 (15m) 232.8 227.8 230.5 230.4 255 240 251 248.7 T5 (20m) 242 253 248.0 247.7 243 256 243 247.3 C (40m) 242 256 249.0 249 246 250 255 250.3 C.V (%) 2.1 2.3 LSD (0.05)
7.6*** ns
Distance PC vs. Eu Effect (No./area) PC vs. Cr Effect (No./area) T1 (1m) 5 6 4 5 24 21 23 22.7 T2 (5m) 17 13 22 17.3 21 24 22 22.3 T3 (10m) 13 19 24 18.7 21 24 23 22.7 T4 (15m) 13 20 24 19 22 23 23 22.7 T5 (20m) 13 23 26 20.7 22 23 24 23 C (40m) 14 20 33 22.3 20 20 28 22.7 C.V (%) 35.5 9.8 LSD(0.05) 10.9* ns Distance Biomass vs. Eu Kg/ha Yield vs. Eu (Kg/ha) T1 (1m) 1250 2500 3750 2500 750 250 625 541.7 T2 (5m) 10000 11250 10750 10666.7 3750 3000 3250 3333.3 T3 (10m) 12500 15000 13750 13750 6250 6000 5500 5916.7 T4 (15m) 23750 24000 24500 24083.3 8750 9000 9750 9166.7 T5 (20m) 35000 35000 35750 35250 12500 14500 14250 13750 C (40m) 35000 36250 36250 35833.3 12500 14750 15000 14083.3C.V (%) 4.2 10.1 LSD (0.05)
1519.2*** 1399.7***
Ph=plant height of maize PC= plant count of maize Eu= Eucalyptus Cr= Croton macrostachyus vs = Versus C= Control
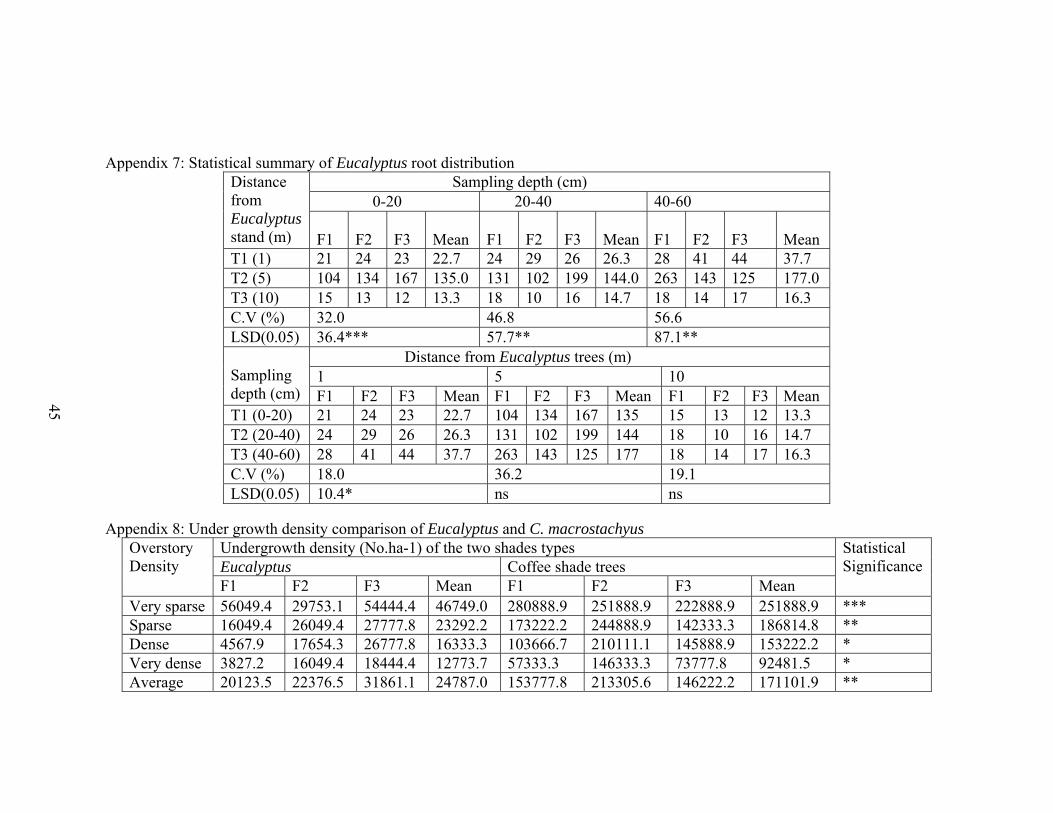
45
Appendix 7: Statistical summary of Eucalyptus root distribution Distance from Eucalyptus stand (m)
Sampling depth (cm) 0-20 20-40 40-60 F1
F2
F3
Mean
F1
F2
F3
Mean
F1
F2
F3
Mean
T1 (1) 21 24 23 22.7 24 29 26 26.3 28 41 44 37.7 T2 (5) 104 134 167 135.0 131 102 199 144.0 263 143 125 177.0 T3 (10) 15 13 12 13.3 18 10 16 14.7 18 14 17 16.3 C.V (%) 32.0 46.8 56.6 LSD(0.05) 36.4*** 57.7** 87.1** Sampling depth (cm)
Distance from Eucalyptus trees (m) 1 5 10 F1 F2 F3 Mean F1 F2 F3 Mean F1 F2 F3 Mean
T1 (0-20) 21 24 23 22.7 104 134 167 135 15 13 12 13.3 T2 (20-40) 24 29 26 26.3 131 102 199 144 18 10 16 14.7 T3 (40-60) 28 41 44 37.7 263 143 125 177 18 14 17 16.3 C.V (%) 18.0 36.2 19.1 LSD(0.05) 10.4* ns ns
Appendix 8: Under growth density comparison of Eucalyptus and C. macrostachyus
Overstory Density
Undergrowth density (No.ha-1) of the two shades types Statistical Significance Eucalyptus Coffee shade trees
F1 F2 F3 Mean F1 F2 F3 Mean Very sparse 56049.4 29753.1 54444.4 46749.0 280888.9 251888.9 222888.9 251888.9 *** Sparse 16049.4 26049.4 27777.8 23292.2 173222.2 244888.9 142333.3 186814.8 ** Dense 4567.9 17654.3 26777.8 16333.3 103666.7 210111.1 145888.9 153222.2 * Very dense 3827.2 16049.4 18444.4 12773.7 57333.3 146333.3 73777.8 92481.5 * Average 20123.5 22376.5 31861.1 24787.0 153777.8 213305.6 146222.2 171101.9 **
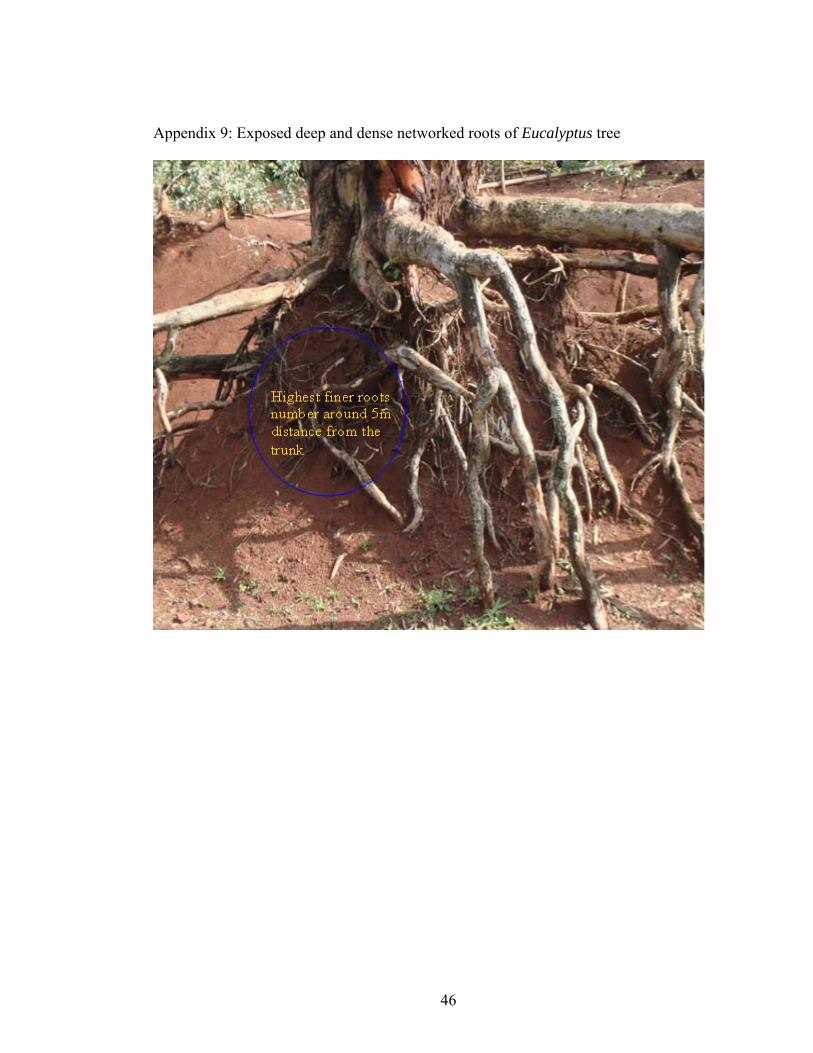
46
Appendix 9: Exposed deep and dense networked roots of Eucalyptus tree
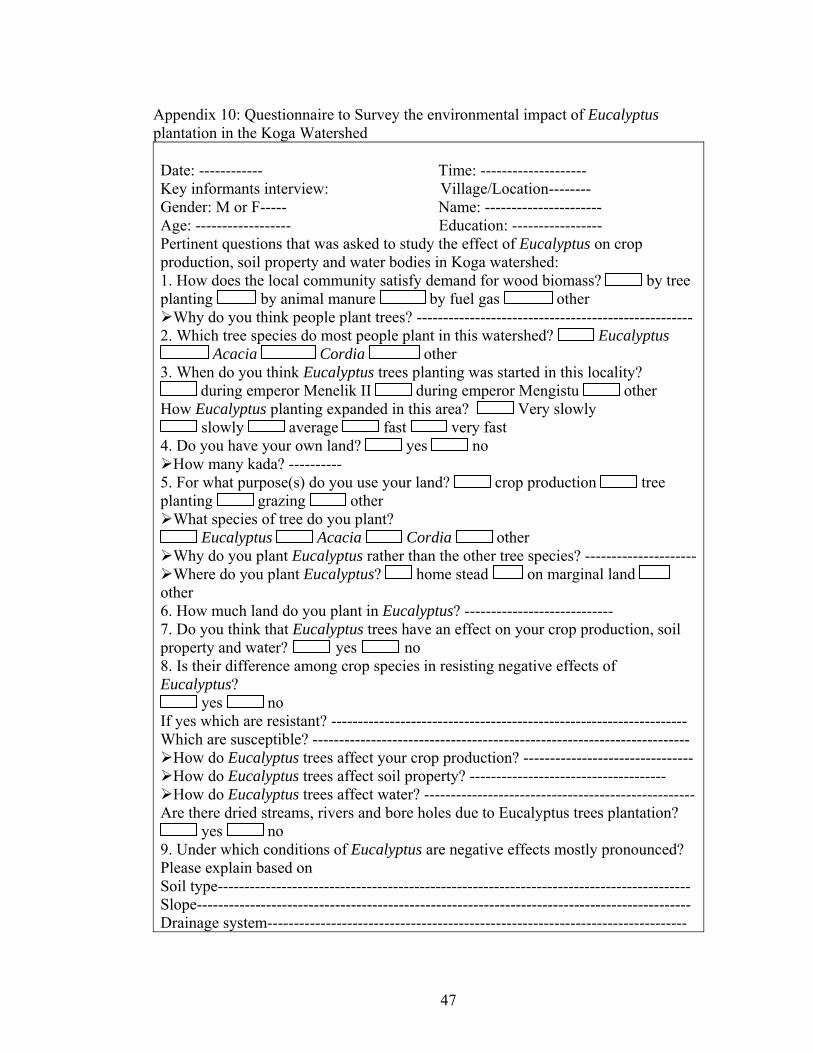
47
Appendix 10: Questionnaire to Survey the environmental impact of Eucalyptus plantation in the Koga Watershed Date: ------------ Time: -------------------- Key informants interview: Village/Location-------- Gender: M or F----- Name: ---------------------- Age: ------------------ Education: ----------------- Pertinent questions that was asked to study the effect of Eucalyptus on crop production, soil property and water bodies in Koga watershed: 1. How does the local community satisfy demand for wood biomass? by tree planting by animal manure by fuel gas other
Why do you think people plant trees? ---------------------------------------------------- 2. Which tree species do most people plant in this watershed? Eucalyptus
Acacia Cordia other 3. When do you think Eucalyptus trees planting was started in this locality?
during emperor Menelik II during emperor Mengistu other How Eucalyptus planting expanded in this area? Very slowly
slowly average fast very fast 4. Do you have your own land? yes no
How many kada? ---------- 5. For what purpose(s) do you use your land? crop production tree planting grazing other
What species of tree do you plant? Eucalyptus Acacia Cordia other
Why do you plant Eucalyptus rather than the other tree species? ---------------------Where do you plant Eucalyptus? home stead on marginal land
other 6. How much land do you plant in Eucalyptus? ---------------------------- 7. Do you think that Eucalyptus trees have an effect on your crop production, soil property and water? yes no 8. Is their difference among crop species in resisting negative effects of Eucalyptus?
yes no If yes which are resistant? ------------------------------------------------------------------- Which are susceptible? -----------------------------------------------------------------------
How do Eucalyptus trees affect your crop production? -------------------------------- How do Eucalyptus trees affect soil property? ------------------------------------- How do Eucalyptus trees affect water? ---------------------------------------------------
Are there dried streams, rivers and bore holes due to Eucalyptus trees plantation? yes no
9. Under which conditions of Eucalyptus are negative effects mostly pronounced? Please explain based on Soil type----------------------------------------------------------------------------------------- Slope--------------------------------------------------------------------------------------------- Drainage system-------------------------------------------------------------------------------

48
Crop Management(direction)---------------------------------------------------------------- 10. What measures could be taken to maximize crop productivity and the advantage of Eucalyptus in your locality? --------------------------------------------------------------- 11. Where do you think Eucalyptus should be planted? ----------------------------------
Please explain why---------------------------------------------------------------------------