the effect of eu 2006 sugar regime reform on vertical
TRANSCRIPT

RESEARCH Open Access
The effect of EU 2006 sugar regime reformon vertical price transmissionMaurizio Aragrande1* , Mauro Bruni2, Alberico Loi3 and Roberto Esposti4
* Correspondence:[email protected] of Agricultural andFood Sciences, University ofBologna, via G. Fanin 50, 40127Bologna, ItalyFull list of author information isavailable at the end of the article
Abstract
CAP regulation of sugar sector has frequently been questioned because of its potentialeffect on competition. In 2006 the CAP reform of the sugar sector established a relevantbreak in policy trend with potential albeit untargeted effects on price transmission. In2012 DG AGRI commissioned a study to assess the effects of the 2006 reform of the EUsugar regime on the price transmission within the sugar sector. This paper highlights theeffects of the new CAP sugar regime on sugar retail price and on the degree ofcompetition and concentration in the sugar industry. Vertical price transmissionis tested through econometric models. The relationship between concentrationand competition is analysed putting in relation the concentration index and amodified version of the Lerner index. Results of empirical investigation show thatvertical price transmission asymmetries still exist after the reform, which in turncontributed to increase sugar sector concentration, partly confirming the validityof the Structure-Conduct-Performance assumptions. The sugar market is far fromefficient and the reform only created more favourable conditions for its improvement.
Keywords: Sugar reform, Vertical price transmission, EU
BackgroundPrice transmission measures how the price variation of a good in a market is transmit-
ted to derived goods in other markets. The transmission varies vertically along the sup-
ply chain, horizontally among spatially linked markets, or among the markets of
substitute products. The relevant point within the sugar industry is how sugar price
variations are transmitted downstream to the price of sugar for consumption or goods
containing sugar. Sugar beet processors play a special role in the implementation of
the Common Market Organisation (CMO) which directly targets industrial products
(sugar and its derivatives) to sustain sugar beet producers. The functioning of sugar
CMO has been frequently questioned because of its potential influence on competition
and sugar companies’ strategies. It might lead to the creation or strengthening of mar-
ket power of processing companies to the detriment of the downstream stages of the
supply chain and consumers, thus reducing consumer’s surplus (OECD 2007). Up-
stream the supply chain, the exertion of market power might theoretically hit beet pro-
ducers (e.g. in case industrial oligopsony with market power occurs), thus reducing the
effectiveness of Common Agricultural Policy (CAP) measures on the setting of sugar
beet price. Consumer welfare and policy effectiveness are the main social and eco-
nomic concerns related to the exertion of market power within the sugar supply chain.
Agricultural and FoodEconomics
© The Author(s). 2017 Open Access This article is distributed under the terms of the Creative Commons Attribution 4.0 InternationalLicense (http://creativecommons.org/licenses/by/4.0/), which permits unrestricted use, distribution, and reproduction in any medium,provided you give appropriate credit to the original author(s) and the source, provide a link to the Creative Commons license, andindicate if changes were made.
Aragrande et al. Agricultural and Food Economics (2017) 5:18 DOI 10.1186/s40100-017-0087-8
The empirical assessment of market power is a complex issue which has raised a
multiplicity of investigation methods until recently. Digal and Ahmadi-Esfahani (Digal
and Ahmadi-Esfahani, 2002) trace back that complexity to the Structure-Conduct-
Performance (SCP) paradigm, the New Empirical Industrial Organisation (NEIO) ap-
proach and time series approach. The Bain’s SCP paradigm (Bain, 1951) establishes a
straight relationship between industry concentration and firms’ strategies, and conse-
quently between strategies and market performance. Performance refers to market effi-
ciency in resource allocation, which would increase in perfect markets to the detriment
of firms’ profit (and vice-versa in imperfect markets).
SCP paradigm has been criticised according to a variety of reasons. Among these, the
assumption of industry structure as an exogeneous variable is relevant here, simply be-
cause feedback of performance and/or conduct toward the structure may exist. If the
latter occurs, the typical SCP causal link would be reversed as the structure would be a
result of the conduct. This entails a conceptual problem, which, in a typical SCP model,
structure and performance would be logically endogenous. For example, if one accepts
the Lerner index and the Herfindal index as measures of firm performance and market
structure respectively, they both would be endogenous and simultaneously determined,
thus “making it impossible to infer the direction of causality between market structure
and performance” (Sheldon and Sperling, 2003, p. 91). Higher profits may depend from
other factors than market power, namely firm efficiency to name just one (Digal and
Ahmadi-Esfahani, 2002, p. 562).
Further concerns are about the direct observability of price-cost margins and whether
high profits (i.e. firm performance) should be associated with good or bad market per-
formance (Bresnahan 1989, p. 1013), thus questioning the effect of concentration on
consumer welfare. NEIO studies put forward some conceptual and operational differ-
ences with respect to SCP. Starting from the assumption that firm conduct has to be
observed in its economic and structural environment, NEIO studies focus on the con-
duct of firms within a particular industry. In this context, firm conduct is not assumed
a priori, but empirically tested (e.g. via conjectural models about firm behaviour under
different competitive assumptions). The same method goes for price-cost margins
which are not measured but instead they are derived from microeconomic models of
supply and demand of the industry (Bresnahan, 1989; Sheldon and Sperling, 2003).
The time series approach allows for the analysis of price movements between markets
which are vertically linked along the supply chain (vertical price transmission, VPT) or
spatially related (horizontal price transmission), or between the markets of related
products. Data required to run time series models, that are market prices occurring in
the markets, are relatively easy to find and make these models easier than typical SCP
and NEIO ones (Digal and Ahmadi-Esfahani, 2002, p. 563) and this data availability
probably explains their diffusion.
VPT studies are based on the assumption that firms can avoid to transmit price varia-
tions (e.g. decreases) from upstream to downstream levels or vice versa, and increase
their profits consequently (firm performance). The analysis of price movements results
in elasticity coefficients which assess price symmetry or asymmetry in speed and/or
magnitude, nature and direction (Meyer and Von Cramon-Taubadel, 2004). Peltzman’s
work (Peltzman, 2000) gave VPT studies a strong impulse, as the same methodology
was applied to a wide range of product categories (agro-food products in particular)
Aragrande et al. Agricultural and Food Economics (2017) 5:18 Page 2 of 20

revealing that asymmetries in price transmission are often the rule rather than the ex-
ception in real markets. Once VPT is assessed, the issue goes back to whether market
power can be simply inferred from the existence of asymmetries via industry concen-
tration (as the SCP paradigm suggests) or not. Empirical evidence is mixed and it does
not allow for simple generalisations about the causes of price asymmetries (Meyer and
Von Cramon-Taubadel, 2004; Vavra and Goodwin 2005, Cavicchioli, 2010).
VPT studies provide a variety of explanations to asymmetries that go beyond market
power, and this clearly emerges even from the analysis of a restricted sample of litera-
ture. Within the VPT framework, the argument of firm/industry costs holds a central
place among the causes of asymmetries. More specifically, different hypotheses about
return to scale (e.g. increasing) may give reason of weak price transmission as firms, for
example, can offset the increase of input price by way of increased efficiency (Betten-
dorf and Verboven, 2000; McCorriston et al., 2001; Wang et al., 2006).
Transaction cost may affect price transmission in different ways. On the supply side,
menu costs may prevent retailers from changing selling price despite variations of input
prices or inflation (Ball and Mankiw, 1994); the organisation of stock management pro-
cedure (i.e. first-in-first-out and last-in-first-out of the stock) may determine time lags in
price transmission (Reagan and Weitzman, 1982; Wohlgenant, 1985). Kimmel (Kimmel,
2009) develops practical reasoning about the process that lead firms to react to decrease/
increase of input price, mixing considerations about cost structure, transaction cost which
are implicit in the decision-making process regarding output level (e.g. via contracts,
advertising), expectations, and the inherent time lag of decision making itself. On the de-
mand side, transaction cost may also be effective if consumer search cost in oligopoly
appears (Chavas and Mehta, 2001, p. 1; Sheldon and Sperling, 2003, p. 103).
Modification of the macroeconomic framework started an interesting stream of stud-
ies which puts price transmission in relation with inflation and commodities price hikes
(Bukeviciute et al., 2009), and with taxation (Bonnet and Réquillart, 2013). Supply and
demand functions’ shape may also influence price transmission elasticity (Kinnucan
and Forker, 1987; Azzam, 1999; Xia, 2009). A peculiar case in this chapter is the effect
of food crises on price transmission. In such a context, falling demand or falling supply
determines certain situations, which combines with imperfect information (e.g. food
scare) and the pre-existing structure of the sectors involved (Aragrande and Canali,
2017). Edging toward the focus of this paper, changes of the institutional framework
(e.g. CAP measures such as decoupling, quota, price floor; retail policy) have also been
studied because of their effect on price transmission (Ferrucci et al., 2010; Bolotova and
Novakocic, 2012; Cacchiarelli et al., 2016).
Finally, we would like to make two last remarks about methodology. In the effort of
shedding light on the reasons behind price asymmetries, Bakucs, Falkowski, and Fertő
developed a meta-analysis of price transmission studies within the agro-food sector
(Bakucs et al., 2014). This is an innovative perspective in this field and it revealed the
relation of some “sets of factors” (e.g. farm sector structure, retail regulation, public
support, etc.) with symmetric or asymmetric farm-retail price transmission in relation
to country and/or product specifications.
Last but not least, part of this debate is around the methods to test price trans-
mission, which is inexorably evolving since decades. Aiming at classifying the
types of asymmetries and the methods used to assess them, Frey and Manera
Aragrande et al. Agricultural and Food Economics (2017) 5:18 Page 3 of 20
conclude that each model fits better to detect some types of asymmetries and, in
turn, each type of asymmetry is better caught by specific models (Frey and
Manera, 2007).
In 2012 the Commission’s Directorate-General for Agriculture and Rural Develop-
ment (DG AGRI) commissioned a study1 to assess, among others, the influence of the
2006 reform of the EU sugar regime on:
a) The price transmission within the sugar sector
b) The industrial concentration and competition in the sector
The 2006 reform of the sugar sector is the most recent step of a reforming
process, which dates back to the World Trade Organization (WTO) establishment.
Differently from previous attempts, this reform established a relevant break in the
policy trend, and provided the opportunity to study the effects of the reform on
price transmission (an unintended but not less relevant outcome of the reform). In
2011 the European Commission-Directorate General for Agriculture and Rural De-
velopment (DG AGRI) launched a study to assess the effects of 2006 sugar reform
on price transmission in the European Union (EU) sugar industry. The study took
into account the sugar sector situation up to the end of 2011. Starting form sugar
industry, VPT was tested toward upstream and downstream sectors (respectively
agriculture, and processing industry and retail). Furthermore, the impact of the re-
form on competition and concentration was tested. The study covered all of the
Member States (MS) of the EU, which were grouped in sub-set of relevant
countries (e.g. EU-15, NMS-12). Limited availability of data sometimes forced
scholars to focus on more limited groups.
This paper reports about the result of the study. Its relevance should be ascertained
in consideration of the elements listed below:
i. The absence of studies on price transmission in the sugar sector since the 2006
reform, as far as we know
ii. The geographical scope, which covers all of the EU Member States (with the sole
limitation of availability, completeness and reliability of the existing data series),
differently from previous research which was primarily based on simulation (OECD
2007) or focusing on individual Member States (Nolte et al., 2012; Hamulczuk and
Szajner, 2015; Varga, 2007; Dejgård and Møller, 2007)
iii. The analysis of competition based on original price-cost margins data of sugar
industry (an Adjusted Lerner Index modified to preserve industrial sensitive
data was calculated)
iv. The analysis of concentration of the EU sugar industry (first and second degree) in
a wide range of EU countries
In the following pages, the “Methods” section explains the methodology
adopted to develop the study; the “Results” section introduces the results of the
theoretical and empirical analysis; the “Discussion” section discusses some out-
comes and limitations of the study; and the “Conclusions” section draws general
conclusions.
Aragrande et al. Agricultural and Food Economics (2017) 5:18 Page 4 of 20

MethodsThe study adopted qualitative and quantitative methodology to comply with the objectives
of the research. The 2006 reform of the sugar sector brought some relevant modifications
of the former regime, which concerned both the domestic market regulation and trade.
As a reference point for this study, Table 1 below outlines the relevant modifications
brought about by the 2006 reform (Council Regulation (EC) 318/2006; 320/2006; 1234/
2007; 1261/2007) in comparison with the previous situation (Council Regulation (EC)
1260/2001 and successive modifications).
The qualitative approach
The qualitative approach included in depth analysis of the EU sugar regime measures.
This analysis aimed to outline the relevant changes concerning the regulation of the
domestic market and the trade with Third Countries, including price and quota system,
import limitations and derogations, export refund system and restructuring aid.
A revision of price transmission theories was developed in order to identify the policy
measures potentially affecting VPT. The guaranteed price system, the management of
sugar production and the management of import and export flows were the most relevant
measures, and a theoretical analysis of their expected effects was developed. Each measure
was analysed separately under a ceteris paribus assumption, focusing the sugar industry.
The analysis also concerned the potential effects of the same measures on concentra-
tion and competition within the sector, and how they might influence price transmis-
sion directly and indirectly. The SCP approach and Porter’s approach to competition
(Porter, 1985) guided this part of the research. A global view of the theoretical analysis
concerning the reform’s effects on VPT, concentration and competition was finally pro-
vided. This part of the study allowed for the formulation of hypothesis to be tested by
the quantitative approach.
The quantitative approach
Listorti and Esposti (Listorti and Esposti, 2012) recently reviewed the wide empirical lit-
erature on agricultural price transmission also in the presence of non-linearities. These
latter may be the consequence of temporary price peaks but also of a regime change in-
duced by a new policy. The current methodological toolkit offers two possible solutions
on how to include policy regime changes within price transmission model. A first intui-
tive way is to assume that a regime change intervenes at a perfectly known point in
time and permanently changes the cointegration relationship among prices. So, it
Table 1 The 2006 sugar reform. Overview of the relevant modifications
Type of measures Trend in comparison with pre-reform status
1. Guaranteed price system Reduction of price support
2. Production quotas Promotion of reduction of both in-quota and out-of-quota production
3. Market withdrawals Termination of public intervention
4. Restructuring Radical change in the approach (from “helping laggards” to “selecting the best”)
5. Regulation of import Improved market access for sugar produced in LDCs and in non-LDC ACP countries
6. Export refunds Greatly reduced room for recourse to subsidised exports
Source: Adapted form (Areté srl Research and Consulting in Economics, 2012)
Aragrande et al. Agricultural and Food Economics (2017) 5:18 Page 5 of 20

behaves like an exogenous (i.e. independent on price changes themselves) structural
break of the long-term price relationship while not affecting their short-term inter-
dependence. A second and more sophisticated approach collects a set of alternative
variants under the common label of regime-dependent or state-dependent Vector Error
Correction Models (VECM). Among the possible specifications of this latter approach,
recent empirical literature has mostly focused on the so-called threshold cointegration
where the change in the price transmission relationship occurs when some price ex-
ceeds a given value, so the regime change is, in this respect, endogenous (Goodwin and
Harper, 2000; Abdulai, 2002; Balcombe et al., 2007; Rezitis and Stavropoulos, 2011). It
must be emphasised, however, that the common feature of the threshold cointegration
approach is that it concentrates the non-linearity of price transmission (i.e. the regime
change) in the adjustment and short-run parameters, leaving the long-run equilibrium
unchanged (not regime dependent). In practice, threshold cointegration and structural
break modelling are, in fact, complementary rather than alternative solutions and a
combination of the two should be actually adopted to admit policy changes to affect
both the short-run and the long-run price transmissions.
Eventually, such empirical solutions are highly data demanding for the large number
of parameters to be identified, thus requiring quite long high-frequency time series.
These conditions are not met with the data set under analysis here. Moreover, thresh-
old cointegration seems more suited to analyse non-linear price transmission during
period of market instability and whenever the timing and the causes of this change in
regime are hardly identifiable rather than when non-linearities are generated by a well-
identified exogenous external factor, like a change in policy regime.
The quantitative approach, here adopted to test the effect of the CAP sugar reform
on VPT, concentration and competition, enters the policy regime change as a structural
break. The policy-related breaks, adopted to structure statistical investigation, are:
– November 2005: achievement of a political compromise on the content of the reform
– March 2006: publication of the implementing regulation on the Official Journal
– July 2006: entry into force of the regulation, start of the first EU sugar marketing
year (MY) under the reformed2 regime
The preliminary visual inspection of data series and qualitative analysis also followed
the relevant events related to changes in the CAP and firms’ strategies (e.g. mergers, ac-
quisitions). Table 2 below displays a list of the abovementioned events in relation to the
main investigation area of the study (within brackets in table headlines).
Testing VPT
Vector Autoregression Model (VAR) and Vector Error Correction Model (VECM) were
adopted for the assessment of time series (Sims, 1980; Engle and Granger, 1987). In the
VAR model variables were used symmetrically, thus we included an equation for each
variable in order to explain its evolution based on its own lags and the lags of the other
variables in the model. VECM is considered an extension of VAR model allowing the
distinction between short-run and long-run dynamics.
In this study, the short-term time horizon is defined by the maximum number of
monthly lags (nine) which we considered for the purposes of the assessment following
economic considerations linked to duration of supply contracts in the sugar sector.
Aragrande et al. Agricultural and Food Economics (2017) 5:18 Page 6 of 20

Table
2Timelineof
relevant
policychange
sandfirm
strategy
even
tsDate
Relevant
even
tsin:
Date
Relevant
even
tsin:
Policychange
s(VPT)
Structuralchange
(CAPandconcen
tration)
EUsugartrade
(HPT)
Policychange
s(VPT)
Structuralchange
(CAPandconcen
tration)
EUsugartrade
(HPT)
Janu
ary
1995
Marrakesh
agreem
entstake
effect;creationof
WTO
;Austria,
FinlandandSw
eden
access
EU
July2006
Starto
f1stsugarM
Yun
der
thereform
edregime
1ststagein
redu
ctionof
thesuga
rbeet
minimum
priceandsuga
rinterventio
nprice
Establishm
entof
anEU
sugarrestructuringfund
Startof
1stsugarMYun
der
thereform
edregime
1ststagein
redu
ctionof
thesugarbeet
minimum
priceandsugarintervention
price
July2001
Startof
sugar1stMYun
der
the1stEBAsugarregime
May
2002
De-mergero
fEridania
Bègh
in-Say
July2002
1stsugarMYun
derthe
“Balkaninitiative”
Octob
er2007
Startof
1stsugarMYwith
27MS
2ndstagein
redu
ctionof
sugarbe
etminim
umprices
Starto
f1stsugarM
Ywith
27MS
2ndstagein
redu
ctionof
sugarbe
etminim
umprices
Janu
ary
2003
Takeover
ofBegh
in-Say
byUnion
SDAfinalised
July2003
Firstcampaignof
EUwide-fullintegrationof
activities
betw
een
SudzuckerandSaint
Louise
Sucre
Octob
er2008
(not
relevant
for
concentration
analysis)
3rdstagein
redu
ctionof
sugarbe
etprice
2ndstagein
redu
ctionof
sugarinterven
tionprice
July2004
Startof
1stsugarMY
with
25MS
Starto
f1stsugarM
Ywith
25MS
July2005
1stsugarMYun
derthe
reform
ed“Balkaninitiative”
March
2009
Takeoverof
Danisco
byNordZ
ucherfinalised
Novem
ber
2005
Politicalagreem
enton
thereform
oftheEU
sugarregimereache
d
Politicalagreem
enton
the
reform
oftheEU
sugar
regimereache
d
April2009
Takeover
ofAzucareraEbro
byABF-British
Sugarfinalise
d
March
2006
Publicationof
thereform
implem
entin
gregu
latio
nson
theEU
OfficialJournal
Publicationof
thereform
implem
entin
gregu
latio
nson
theEU
OfficialJournal
Janu
ary2010
Term
inationof
the
Eurosugarmarketin
gagreem
ent
June
2006
Form
ationof
Eurosugar
marketin
galliance
Octob
er2010
Term
inationof
interven
tion
onsugar
Term
inationof
interven
tion
onsugar
MYmarketin
gyear
Source:ada
pted
from
(Areté
srlR
esearchan
dCon
sulting
inEcon
omics,20
12)
Aragrande et al. Agricultural and Food Economics (2017) 5:18 Page 7 of 20

The long-term time horizon was defined by a period which extends for the entire
length of each subsample, varying from 6 to 11 years according to the key issues con-
sidered. Possible presence of both short-term and long-term PT was systematically in-
vestigated through econometric tests in the framework of the key questions.
The abovementioned models were used to analyse connections between series of
prices referring to different levels of the supply chain, in order to understand the way
price transmission works within the sector. Moreover, those models allowed to detect
possible delayed reactions among variables, which were deemed to be particularly rele-
vant in the analysis of price transmission mechanisms, as price adjustments often were
distant in time from each other.
Speed, intensity and the existence of asymmetry were also investigated. The sugar in-
dustry was the pivotal reference to test price transmission. VPT was tested upstream
toward agricultural sector for sugar beet price, and downstream toward the retailing
sector for retail price. Tests were performed in the relevant sugar-producing countries
and different EU Member State aggregations (EU-15, NMS-12, EU-25 and EU-27), de-
pending on the specific issue. The potential effects of the reform were analysed taking
into account the absolute level of price, its variation and the relation between prices oc-
curring within two different markets over a certain time span. In particular, VPT was
tested by taking into account the relation between ex-work and retail prices and vice
versa in the pre- and post-reform periods.3
Testing concentration and competition
Due to confidentiality issues concerning sugar production cost data, an ad hoc procedure
was adopted to treat the Lerner Index—defined as [(sugar price − sugar production cost)/
(sugar price)]—in the assessment, thus shaping a modified version of the Lerner index.
Time series of the Lerner Index were calculated by DG Agriculture on the basis of sugar
ex-work prices and of LMC International sugar production cost data. The values of the
Lerner Index were then multiplied by an unknown constant, different for each Member
State. The resulting time series are referred to in this study as “Adjusted Lerner Index”
(ALI). The abovementioned procedure allowed comparisons of time series of the ALI be-
tween Member States only in terms of dynamics, not of absolute level of the ALI itself.
We assessed the effects of the reform on competition by observing the evolution of the
index against the succession of policy-related and industry-related significant events (see
Table 2 above), which we considered in the study of the evolution of other variables con-
cerning competition as well (number of producers, number of beet sugar factories in
operation, average production capacity of such factories).
The relationship between the evolution of the Herfindahl-Hirschman Index (HHI)
and the ALI in the 2000–2011 period was investigated through statistical methods, in
order to detect the possible presence of correlation, and hence to assess consistency
with or deviation from the classic SCP paradigm. The evolution of all the relevant
prices was then studied against the evolution of the ALI through econometric methods,
which allowed to empirically assess the impact of the evolution of concentration and
competition on price transmission. The 2006 reform of the EU sugar regime was con-
sidered as the policy-related break for the assessment.4
The time series which underwent econometric testing were updated to the end of
2011. As a consequence, we carried out an empirical assessment, which did not cover
the potential influence of ex-work price increases occurred in the first months of 2012.
Aragrande et al. Agricultural and Food Economics (2017) 5:18 Page 8 of 20
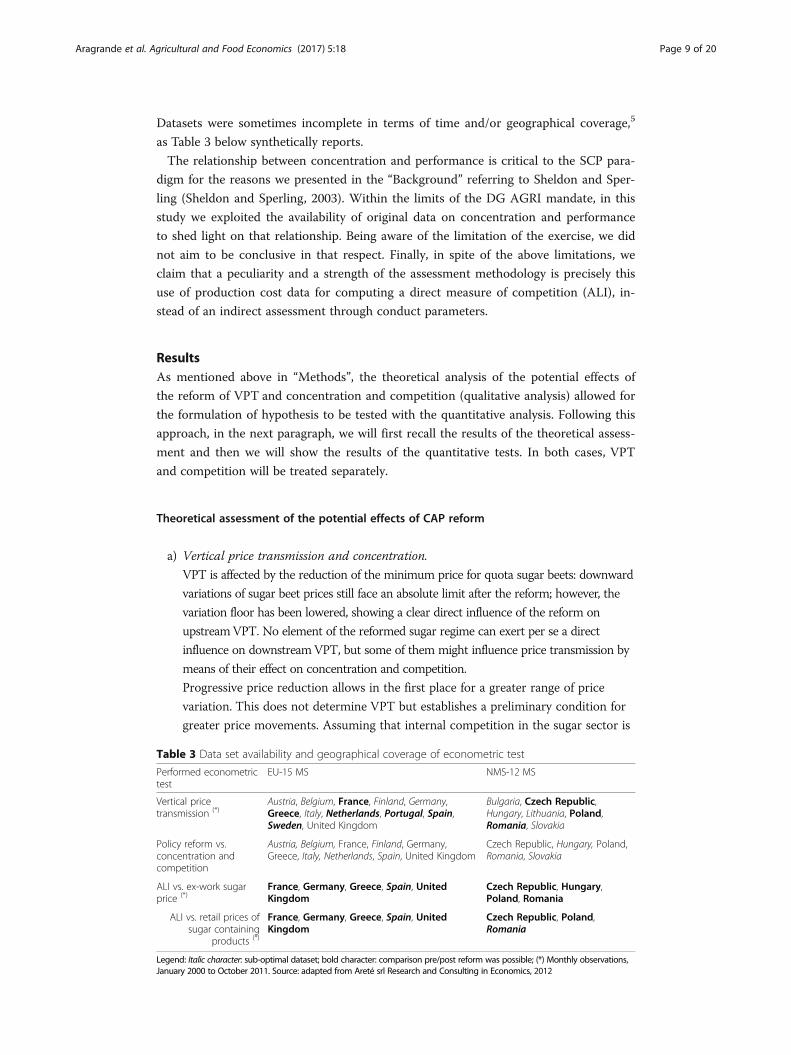
Datasets were sometimes incomplete in terms of time and/or geographical coverage,5
as Table 3 below synthetically reports.
The relationship between concentration and performance is critical to the SCP para-
digm for the reasons we presented in the “Background” referring to Sheldon and Sper-
ling (Sheldon and Sperling, 2003). Within the limits of the DG AGRI mandate, in this
study we exploited the availability of original data on concentration and performance
to shed light on that relationship. Being aware of the limitation of the exercise, we did
not aim to be conclusive in that respect. Finally, in spite of the above limitations, we
claim that a peculiarity and a strength of the assessment methodology is precisely this
use of production cost data for computing a direct measure of competition (ALI), in-
stead of an indirect assessment through conduct parameters.
ResultsAs mentioned above in “Methods”, the theoretical analysis of the potential effects of
the reform of VPT and concentration and competition (qualitative analysis) allowed for
the formulation of hypothesis to be tested with the quantitative analysis. Following this
approach, in the next paragraph, we will first recall the results of the theoretical assess-
ment and then we will show the results of the quantitative tests. In both cases, VPT
and competition will be treated separately.
Theoretical assessment of the potential effects of CAP reform
a) Vertical price transmission and concentration.
VPT is affected by the reduction of the minimum price for quota sugar beets: downward
variations of sugar beet prices still face an absolute limit after the reform; however, the
variation floor has been lowered, showing a clear direct influence of the reform on
upstreamVPT. No element of the reformed sugar regime can exert per se a direct
influence on downstreamVPT, but some of them might influence price transmission by
means of their effect on concentration and competition.
Progressive price reduction allows in the first place for a greater range of price
variation. This does not determine VPT but establishes a preliminary condition for
greater price movements. Assuming that internal competition in the sugar sector is
Table 3 Data set availability and geographical coverage of econometric test
Performed econometrictest
EU-15 MS NMS-12 MS
Vertical pricetransmission (*)
Austria, Belgium, France, Finland, Germany,Greece, Italy, Netherlands, Portugal, Spain,Sweden, United Kingdom
Bulgaria, Czech Republic,Hungary, Lithuania, Poland,Romania, Slovakia
Policy reform vs.concentration andcompetition
Austria, Belgium, France, Finland, Germany,Greece, Italy, Netherlands, Spain, United Kingdom
Czech Republic, Hungary, Poland,Romania, Slovakia
ALI vs. ex-work sugarprice (*)
France, Germany, Greece, Spain, UnitedKingdom
Czech Republic, Hungary,Poland, Romania
ALI vs. retail prices ofsugar containing
products (*)
France, Germany, Greece, Spain, UnitedKingdom
Czech Republic, Poland,Romania
Legend: Italic character: sub-optimal dataset; bold character: comparison pre/post reform was possible; (*) Monthly observations,January 2000 to October 2011. Source: adapted from Areté srl Research and Consulting in Economics, 2012
Aragrande et al. Agricultural and Food Economics (2017) 5:18 Page 9 of 20
mainly based on scale economies, reduced price support combined with reduced
production quotas should theoretically promote cost-based competition among
producers, leading toward an increased concentration. In this regard, it is worth
remembering that price floor is not limited by the intervention price, and a reference
price (which is not a guaranteed price) substituted it.
The reduction of import barriers makes it possible for Third Countries to sell increasing
quantities of sugar in the EU market at reduced price and under preferential agreements
(countries under tariff exemption). This situation is likely to occur because the revised
quota system reduces EU domestic supply potential and, when the EU market price is
higher than world price, those countries would find profitable to export to EU. Such
import would increase pressure toward the reduction of domestic cost, depending on
the importance of imported volume, of course. Once more, the downward revision of
the quota system might push sugar firms to maintain or develop their production
potential adopting the clause of re-allocation of national production or by other means
(quota trade, mergers and acquisitions are typical means used in the sugar sector).
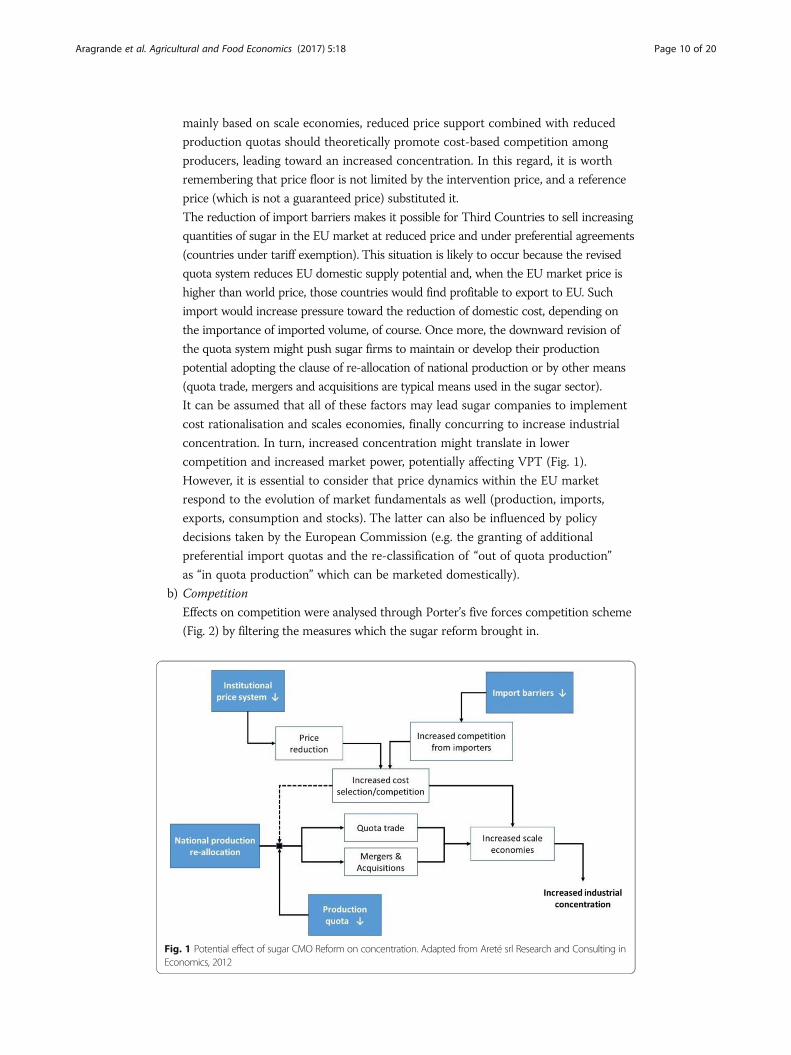
It can be assumed that all of these factors may lead sugar companies to implement
cost rationalisation and scales economies, finally concurring to increase industrial
concentration. In turn, increased concentration might translate in lower
competition and increased market power, potentially affecting VPT (Fig. 1).
However, it is essential to consider that price dynamics within the EU market
respond to the evolution of market fundamentals as well (production, imports,
exports, consumption and stocks). The latter can also be influenced by policy
decisions taken by the European Commission (e.g. the granting of additional
preferential import quotas and the re-classification of “out of quota production”
as “in quota production” which can be marketed domestically).
b) Competition
Effects on competition were analysed through Porter’s five forces competition scheme
(Fig. 2) by filtering the measures which the sugar reform brought in.
Fig. 1 Potential effect of sugar CMO Reform on concentration. Adapted from Areté srl Research and Consulting inEconomics, 2012
Aragrande et al. Agricultural and Food Economics (2017) 5:18 Page 10 of 20

In line with what has been stated above, increased concentration might influence
sugar companies’ behaviour according to the SCP paradigm, potentially reducing
internal competition. Individual measures may have different effects on the five
forces. As mentioned above, the reduction of institutional prices is likely to
increase cost competition (internal competition) among domestic sugar producers.
The new quota system, together with continuing import duties regime, still
protect domestic industry from competition (especially from generic Third
Countries exporting to the EU market). In this framework, only exporting
Countries under tariff exemption may increase the competition on the domestic
market (depending on the import volume and on price differential between EU
and world market), contributing to increase the market power of sugar purchasers
(e.g. confectionery industry, retailers).
Looking at this phenomenon from another point of view, it can be expected that
the incentives to the reduction or termination of sugar production provided by the
EU restructuring fund, in combination with the EU enlargement process (which, as
a result, created more favourable conditions for the implementation of merger and
acquisition strategies by increasing the number of potential firms to be merged/
acquired) promoted an increase in the concentration of the EU sugar sector.
The final result on competition is uncertain. On the one side, according to classical
SCP paradigm, all the above elements should theoretically lead to a reduced competition
within the sugar sector because of the reduced price support, the revised quota system,
the incentives to industrial restructuring, and the improved access to the EU market,
considered separately and according to their combined effect on concentration.
On the other side, increased concentration does not necessarily determine a
decrease in competition, as sugar producers may react to or anticipate policy
effects and implement competitive strategies to reshape the organisation of the
sugar supply chain (also in its geographic aspects) in a way to offset, totally or
Fig. 2 Potential effect of sugar CMO Reform on competition. Source: Areté srl Research and Consulting inEconomics, 2012
Aragrande et al. Agricultural and Food Economics (2017) 5:18 Page 11 of 20
in part, potential increases in the degree of competition within the sector, the
final effect depending on the balance of the forces on the field.
Empirical assessment of CAP reform effects
Vertical price transmission
The empirical assessment investigated about intensity and speed of VPT and on the ex-
istence of asymmetries. The visual inspection revealed that the three-step reduction of
sugar intervention price between 2006/07 and 2009/10 (and conclusion of intervention
purchases from the 2010/11 campaign onwards), which was implemented by the 2006
reform, did not fully translate in a decrease of ex-work sugar prices in the EU. Indeed,
ex-work prices stayed well above the intervention price until the end of the 2009/10
marketing year, and kept a wide margin over the reference price from October 2009
onwards. Evidence also suggests that the reduction of sugar beet minimum prices intro-
duced by the 2006 reform did not fully translate into an equivalent decrease of sugar
beet prices.
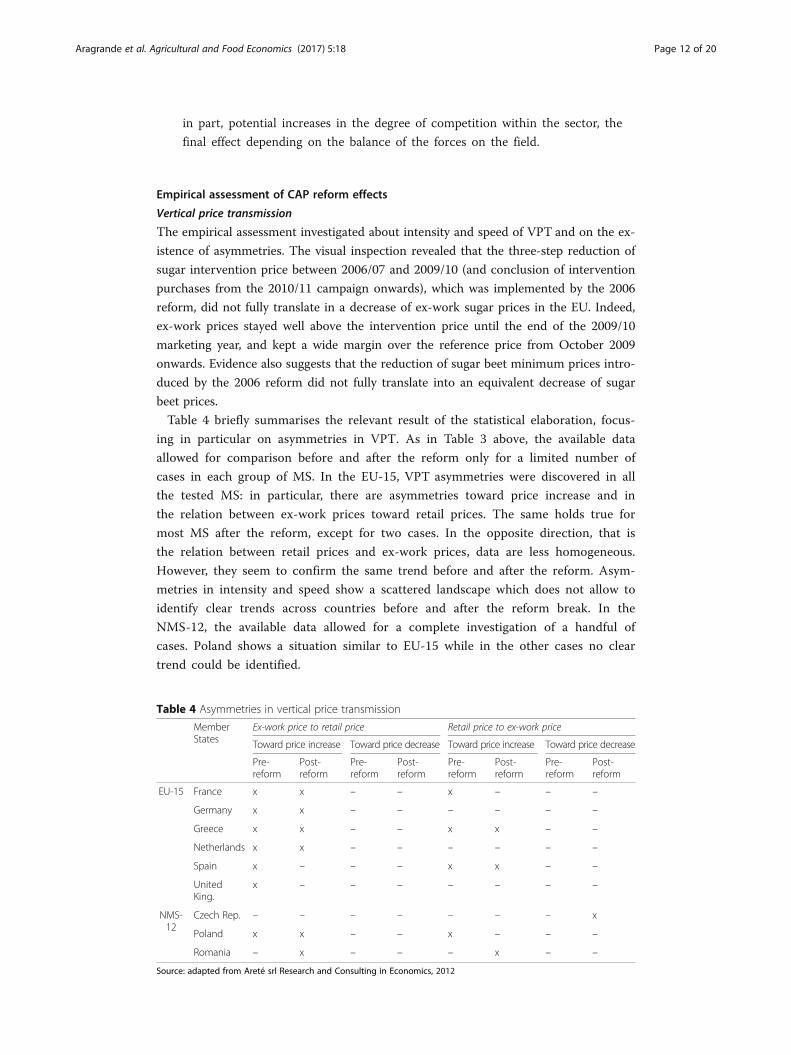
Table 4 briefly summarises the relevant result of the statistical elaboration, focus-
ing in particular on asymmetries in VPT. As in Table 3 above, the available data
allowed for comparison before and after the reform only for a limited number of
cases in each group of MS. In the EU-15, VPT asymmetries were discovered in all
the tested MS: in particular, there are asymmetries toward price increase and in
the relation between ex-work prices toward retail prices. The same holds true for
most MS after the reform, except for two cases. In the opposite direction, that is
the relation between retail prices and ex-work prices, data are less homogeneous.
However, they seem to confirm the same trend before and after the reform. Asym-
metries in intensity and speed show a scattered landscape which does not allow to
identify clear trends across countries before and after the reform break. In the
NMS-12, the available data allowed for a complete investigation of a handful of
cases. Poland shows a situation similar to EU-15 while in the other cases no clear
trend could be identified.
Table 4 Asymmetries in vertical price transmission
MemberStates
Ex-work price to retail price Retail price to ex-work price
Toward price increase Toward price decrease Toward price increase Toward price decrease
Pre-reform
Post-reform
Pre-reform
Post-reform
Pre-reform
Post-reform
Pre-reform
Post-reform
EU-15 France x x – – x – – –
Germany x x – – – – – –
Greece x x – – x x – –
Netherlands x x – – – – – –
Spain x – – – x x – –
UnitedKing.
x – – – – – – –
NMS-12
Czech Rep. – – – – – – – x
Poland x x – – x – – –
Romania – x – – – x – –
Source: adapted from Areté srl Research and Consulting in Economics, 2012
Aragrande et al. Agricultural and Food Economics (2017) 5:18 Page 12 of 20

Concentration and competition
In the pre-reform period, we witnessed an already concentrated structure, which the
changes introduced by the reform made even more concentrated at both EU and MS
levels. Concentration in the EU sugar sector increased remarkably in the post-reform
period due to important transnational developments at the EU level (see Table 1 above).6
A number of Member States experienced significant and even substantial increases in the
HHI since the first campaign under the reformed regime (2006/07). The most remarkable
increases occurred in the Netherlands and Hungary, where a single producer was in oper-
ation from, respectively, 2007/08 to 2008/09 campaigns onwards. Concentration increased
significantly after the reform in France, Italy, Spain and Belgium within the EU-15, and in
the Czech Republic and Slovakia among the NMS-12.
Competition was studied in relation to a number of variables.7 The main trends from
the pre-reform to the post-reform period are:
– An acceleration in the decrease of operating sugar producers
– Greater emphasis on the achievement of scale economies: scale economies were
achieved mainly by closing less performing plants and expanding the production
capacity of the remaining ones
– The potential beneficial influence of additional imports on competition (i.e. entry of
new operators on national markets) might have been partially offset by the control
exerted by EU sugar producers on a portion of such flows through their overseas
subsidiaries and/or long-term supply agreements. In any case, it is important to
underline that the price premium over the international market is the key driver
behind preferential imports (mostly coming from African, Caribbean and Pacific
countries (ACP countries) and Least Developed Countries (LDCs)) and it is generally
achieved on the EU market
– No elements suggest an evident relation between concentration levels and the evolution
of the degree of competition in the sugar sector
This last issue, i.e. the existence of a relationship between competition and concentra-
tion, was empirically investigated through the correlation analysis between the ALI and
the HHI. Results are displayed in Table 5. It is valuable to bear in mind that ALI is in-
versely related to competition (the greater the index, the lower the competition), while
the HHI is directly related to concentration (the greater the value, the greater the concen-
tration). This means that positive and high values of correlation between ALI and HHI
sketch a situation in which high concentration corresponds to reduced competition. Such
situation occurs in a few countries, namely France, Poland, Romania and Spain. Moreover,
different trends appear before and after the reform: correlation increased in France and
Spain, whereas it was rather stable in Poland and reversed in the UK.
DiscussionThe main objective of the research was to extensively test the effect of the sugar reform
on VPT and on concentration and competition within the EU. The first hindrance to
accomplish this task was data limitation. Indeed, data were not homogeneous across
countries and, in some instances, the data series were not complete enough to allow
for a geographically extensive analysis across all of the EU MS.
Aragrande et al. Agricultural and Food Economics (2017) 5:18 Page 13 of 20

Table
5Correlatio
nbe
tweenconcen
trationandcompe
titionin
thesugarsector
Correlatio
nbe
tweenALIandHHIInd
ex(2nd
level)
Perio
dAustria
Belgium
Czech
Rep.
Finland
France
Germany
Greece
Hun
gary
Italy
Nethe
rland
sPo
land
Romania
Slovakia
Spain
UK
2000–2005
––
−0.87
–0.31
−0.96
0.00
−0.04
––
0.93
0.75
0.06
0.78
2006–2011
0.00
−0.73
−0.60
0.00
0.72
−0.85
0.00
−0.51
−0.91
0.00
0.77
0.25
−0.10
0.58
−0.69
Aragrande et al. Agricultural and Food Economics (2017) 5:18 Page 14 of 20

Some of such limitations also affected the analysis of the correlation between concen-
tration and competition. As mentioned in “Testing concentration and competition”, the
ALI does not allow for comparison in absolute terms, but only trend comparison
among countries. In other words, it does not allow to measure the actual degree of
competition, as it just appreciates its dynamics over time. Furthermore, the ALI does
not allow to understand whether variations in sugar price or in sugar production cost
predominantly drive the evolution of competition.
The data limitations notwithstanding, a trend to the prevalence of VPT asymmetries
toward price increase seems to prevail both from ex-work to retail price and the other
way around. On the one hand, this means that when ex-work price increased, retail
price followed. However, it also means that the reduction of ex-work price was not fully
transmitted to retail, causing the distance in absolute terms between ex-work and retail
prices of sugar in the EU to tendentially increase over time.
On the other hand, asymmetries toward price increase from retail to ex-work price
implies that sugar producers were often able to follow (more or less proportionally, and
with different extent of delay) price increases coming from the retail sector, while
downward variations of retail prices have not resulted in an analogous response by
sugar producers.8
Data on concentration showed that the reform also determined an increased concen-
tration of the sector. This, however, follows a long-term trend which is, at least in part,
endogenous, i.e. not strictly depending on the reform itself, and in part it falls under
the dynamics of the long-term history of the sector. An interesting aspect of this trend
leads to outline the relation between the role, which should have been played by prefer-
ential sugar imports from ACP/LDCs, and the strategies of the EU sugar companies,
which have probably tried to counteract the potential effect of preferential imports on
internal competition by reshaping the organisation of the sugar supply chain (also in its
geographic aspects, as mentioned in “Concentration and competition”).
As for the degree of competition, the dynamics of the ALI suggests the presence of a
trend toward a higher degree of competition in the sugar sector following the 2006 re-
form. However, such conclusion should be considered against the abovementioned lim-
itations stemming from the use of the ALI, and also considering further developments
in the evolution of concentration and competition in the EU sugar sector occurred dur-
ing the first months of 2012.
If it is true that the ALI constitutes a synthetic index of the degree of competition
which takes into account also the effect of increased sugar imports, and hence of the
possible entry of new operators on the EU market, it should be conceded that it cannot
adequately represent the many qualitative aspects which may determine actual compe-
tition within the EU sugar sector. In this respect, it is also extremely important to
underline that the average EU ex-work sugar price remarkably increased over the first
months of 2012 in comparison with late 2011 levels. Such price dynamics might have
affected the recent evolution of the ALI, especially if sugar production cost has not ex-
perienced an analogous evolution over the same period. Hence, these price dynamics
also suggest that EU sugar producers might again be exerting remarkable market
power, keeping in mind that price dynamics on the EU market mainly derive from the
evolution of market fundamentals, which can be influenced by policy decisions taken
by the European Commission.
Aragrande et al. Agricultural and Food Economics (2017) 5:18 Page 15 of 20
The relation between concentration and competition finally allows for some consider-
ation about the suitability of the basic of SCP paradigm in capturing the relevant deter-
minant of industrial competition and structure. Theoretical investigation was not
among the aims of this study, which nevertheless added some empirical elements to
the debate, as we briefly summarised in Table 5 above. Taking into account the limita-
tion of the ALI we used to calculate the correlation, results make sense and are varied.
SCP paradigm seems to be confirmed in the same number of MS where it is not. Con-
sidering the type of strategies adopted by the sugar companies before and after the re-
form, we are tempted to claim that the most relevant criticism to the classical SCP
paradigm, i.e. the feedback from firms’ strategies on the sector structure, has indeed a
reason of being true. Beside this, from the study did not emerge any further element,
which can support the theoretical debate on this issue, so we leave this cue as a mes-
sage for further investigations.9
ConclusionsThe assessment we carried out provided empirical evidence, which partly confirmed
the actual occurrence of the expected effects of the reform on price transmission in the
sugar sector.
If market efficiency requires that any change in upstream sector of the supply chain
translates into a corresponding change of retail price downstream, the empirical evi-
dence suggests the EU sugar market after the reform is still far from achieving
complete efficiency, despite significant steps were made in this direction.
At the same time, the reform contributed to accelerate the on-going process of con-
centration of the sugar industry, at both the national and the EU level. The possible
presence of a trend toward a higher degree of competition (at least up to end 2011) is
confirmed within the limits of the competition index adopted in this study. And also
within a competitive context in which EU sugar producers might still exert remarkable
market power, within the limits allowed by the evolution of market fundamentals and
by policy decisions taken by the European Commission.
It can be concluded that the reform has contributed to improve the conditions of the
price transmission mechanism, by removing some important constraints and freeing
variation of domestic sugar prices, eventually starting a process which might lead to an
improved price transmission in the EU sugar sector, if combined with other non-policy
developments.
Despite significant progresses were made, from 2011 the expected effects of policy
changes on vertical price transmission in the sugar sector have only partially occurred.
Changes in the EU sugar regime are probably not deep enough in order to promote full
price transmission along the entire sugar supply chain (i.e. down to the final consump-
tion stage) in absence of the contribution of changes in other policies and of favourable
non-policy developments.
Actually, the functioning of vertical price transmission in the sugar sector is re-
markably affected by the state of competition in the downstream levels of the sup-
ply chain (food industry, distribution), over which the EU sugar regime bears no
direct influence. The assessment highlighted the evident asymmetry toward price
increases with retail prices reacting to increases more often than to decreases in
ex-work prices. This implies that operators in the downstream sectors are prone to
Aragrande et al. Agricultural and Food Economics (2017) 5:18 Page 16 of 20

adopting such pricing behaviour: it is unlikely that they will change it in absence
of any pressure in this direction.
Endnotes1Areté Research & Consulting in Economics (2012), Study on price transmission in
the sugar sector. Final report October 2012. The European Commission, DG Agriculture
and Rural Development, Brussels (http://ec.europa.eu/agriculture/external-studies/
sugar-price-transmission_en.htm). EU tender reference: European Commission-DG
Agriculture and Rural Development. TENDER N° AGRI-2011-EVAL-03.2A further policy break was adopted, the WTO creation in 1995, but it only applied
to the analysis of horizontal price transmission.3Price transmission at intermediate stages of the supply chain could not be tested
quantitatively. Qualitative considerations were derived from evidence concerning the
Italian and the British markets.4Three hypotheses were considered for the timing of such break: (a) achievement of a
political compromise on the content of the reform (November 2005); (b) publication of
the implementing regulation on the Official Journal (March 2006); (c) entry into force
of the regulation (July 2006—start of the first EU sugar marketing year under the
reformed regime).5Main data sources were Official Journal of the European Union (relevant legislation);
EUROSTAT and DG Agriculture (sugar supply balance and other sugar sector data,
including ex-work sugar price); EUROSTAT-COMEXT (sugar trade data); LIFFE
(London refined sugar price), FCB Commodity Price Index (sugar based commodities
and food); national statistical institutes (sugar production data); Bartens Verlag “Sugar
Economy Europe” yearbook and F.O. Licht’s “International Sugar & Sweetener Report”
(information on sugar structure and strategies)6The termination of the Eurosugar alliance in January 2010 brought to a decrease in
concentration at EU level, which remains however remarkable (HHI at EU-27 level was
equal to 1.207 points in the 2010/11 campaign). In detail: number of sugar producers
at the second level of aggregation (EU level) and at the first level of aggregation (Mem-
ber State level); number of beet sugar factories in operation (EU level); average produc-
tion capacity of beet sugar factories (EU level); self-sufficiency ratio and share of
imports on internal use for human consumption (EU level); Adjusted Lerner Index -
ALI (Member State level only).7In detail: number of sugar producers at the second level of aggregation (EU level)
and at the first level of aggregation (Member State level); number of beet sugar factor-
ies in operation (EU level); average production capacity of beet sugar factories (EU
level); self-sufficiency ratio and share of imports on internal use for human consump-
tion (EU level); Adjusted Lerner Index—ALI (Member State level only).8As in note 3, the influence of market intermediaries on vertical price transmission
could not be tested empirically for absence of adequate data. A qualitative assessment
suggested that pricing behaviour of market intermediaries in the pre-reform period was
basically neutral with respect to vertical price transmission, whereas after the reform
increased price volatility induced market intermediaries to vary more frequently their
margins according to market conditions and type of customer thus exerting a more sig-
nificant influence on price transmission along the supply chain in particular market
Aragrande et al. Agricultural and Food Economics (2017) 5:18 Page 17 of 20

conditions. Finally, the pricing behaviour of sugar merchants shows a certain asym-
metry toward price increases.9To conclude, let us make reference to Peltzman words once more: “My findings sug-
gest some caveats and perhaps other paths for future research. I found no asymmetry
when I examined the response of a single decision maker to its own costs. By contrast,
I found above-average asymmetry between factory and consumer prices when there
were many small intermediaries between the factory and the retailer. This suggests that
an explanation for asymmetry may require a fuller understanding of those vertical mar-
ket linkages”. (Peltzman, 2001, p. 494).
AbbreviationsACP: African, Caribbean and Pacific countries; ALI: Adjusted Lerner Index; CAP: Common Agricultural Policy;CMO: Common Market Organisation; DG AGRI: Directorate General for Agriculture and Rural Development;EU: European Union; HHI: Herfindahl-Hirschman Index; LDCs: Least Developed Countries; MS: Member States;MY: Marketing year; NEIO: New Empirical Industrial Organisation; NMS: New Member States; OECD: Organisation forEconomic Co-operation and Development; SCP: Structure-Conduct-Performance; VAR: Vector Autoregression Model;VECM: Vector Error Correction Model; VPT: Vertical price transmission; WTO: World Trade Organization
AcknowledgementsThis paper has been selected as a best paper of the 52nd SIDEA Conference in Rome-Viterbo (17–19 September 2015).It has been accepted for publication in this journal following the usual revision process. The Authors wish to thank Dr.Enrica Gentile for coordinating and connecting Authors during writing and revision sessions.
Authors’ contributionsThe authors are equally responsible for the different sections of the paper. All authors read and approved the finalmanuscript.
Authors’ informationMaurizio ARAGRANDE (PhD) is a Professor of Agricultural Economics at the University of Bologna. Since 2002 co-ordinator,team leader and author of studies for the European Commission and the European Parliament and other internationalinstitutions (FAO, OIE). He has experience in policy evaluation and methodology design concerning the agro-food sectoralso according to innovative approaches (system approach inter-disciplinarity). He is involved in European network focusedon the economic evaluation of complex interventions and policies, in the framework of EU COST Action programme.Mauro BRUNI (PHD) is a Co-founder and partner at Areté srl, research and consultancy company specialised on theagriculture and agro-food sector. Since 2002 he has been consultant in a number of studies and projects for theEuropean Commission (DG Agri, DG Sanco, DG Enter, DG Growth, JRC, EFSA), the European Parliament and a numberof other institutions at the national and international level, as well as for private companies in the agro-food sector.Expert in the field of agricultural policy, agricultural markets and agro-food economics, with a deep and long termexperience on the sugar sector.Alberico LOI (PhD) is an Agribusiness economist, 13 years of experience as consultant for the European Commission(DG Agriculture, DG SANTE, DG Enterprise/DG Growth, JRC, EFSA) and the European Parliament, as well as for majororganisations and companies; experience in the evaluation of EU policies applied to the agro-food sector, with aspecific knowledge of the sugar sector and of the related markets and policies, in the EU and third countries.Roberto ESPOSTI (PhD) is an Associate Professor in Economic Policy at the Università Politecnica delle Marche, heteaches courses in Economic Policy, Economics of the Environment and Natural Resources, Panel Da ta Econometrics.He is also deputy Director of the Department of Economics and Social Sciences and Member of the Board of Directorsof Università Politecnica delle Marche.
Competing interestsThe authors declare that they have no competing interests.
Publisher’s NoteSpringer Nature remains neutral with regard to jurisdictional claims in published maps and institutional affiliations.
Author details1Department of Agricultural and Food Sciences, University of Bologna, via G. Fanin 50, 40127 Bologna, Italy. 2Aretésrl-Research & Consulting in Economics, via del Gomito 26/4, 40127 Bologna, Italy. 3Areté srl-Research & Consulting inEconomics, via del Gomito 26/4, 40127 Bologna, Italy. 4Department of Economics and Social Sciences, MarchePolytechnic University of Ancona, Piazzale Martelli 8, 60121 Ancona, Italy.
Received: 3 August 2016 Accepted: 25 August 2017
ReferencesAbdulai A (2002) Using Threshold Cointegration to estimate asymmetric price transmission in the Swiss pork market.
Appl Econ 34(6):679–687
Aragrande et al. Agricultural and Food Economics (2017) 5:18 Page 18 of 20

Aragrande M, Canali M (2017) Animal health and price transmission along livestock supply chain. In “Economics ofAnimal Health” edited by J. Rushton. Scientific and Technical Review, Office Internationale des Epizooties (OIE)/World Organization of Animal Health, 36 (1), pp. 87-96
Areté srl Research and Consulting in Economics (2012), Study on price transmission in the sugar sector. Final reportOctober 2012, the European Commission, DG agriculture and rural development, Brussels. (https://ec.europa.eu/agriculture/external-studies/sugar-price-transmission_en. Accessed 13 July 2017)
Azzam A (1999) Asymmetries and rigidities in farm-retail price transmission. Am J Agric Econ 81(3):525–533Bain JS (1951) Relation of profit rate to industry concentration: American manufacturing, 1936-1940. Q J Econ 65(3):
293–324Balcombe K, Bailey A, Brooks J (2007) Threshold effects in price transmission: the case of Brazilian wheat, maize and
soya prices. Am J Agric Econ 89(2):308–323Ball L, Mankiw GN (1994) Asymmetric adjustment and economic fluctuation. Econ J 104(423):247–261Bakucs Z, Falkowski J, Fertő I (2014) Does market structure influence price transmission in the agro-food sector? A
meta-analysis perspective. J Agric Econ 65(1):1–25Bettendorf I, Verboven F (2000) Incomplete transmission of coffee beans prices: evidence from the Netherland. Eur Rev
Agric Econ 27(1):1–16Bolotova Y, Novakocic A (2012) The impact of New York state milk price gauging law on the price transmission and
supermarket pricing strategies in the fluid whole milk market. Agribusiness 28(4):377–399Bonnet C, Réquillart V (2013) Impact of cost shocks on consumer prices in vertically-related markets: the case of the
French soft drink market. Am J Agric Econ 95(5):1088–1108Bresnahan T (1989) Empirical studies of industries with market power. In Handbook of Industrial Organization, vol. II,
chapter 17, edited by R. Schmalensee and R.D. Willig. Elsevier Science Pubilisher B.VBukeviciute L, Dierx A, Ilzkovitz F (2009) The functioning of food supply chain and its effect on food prices in the
European Union, occasional papers n. 47, may 2009, directorate general for economic and Financial Affairs of theEuropean Commission, Brussels (http://ec.europa.eu/economy_finance/publications/pages/publication15234_en.pdf. Accessed 13 July 2017)
Cacchiarelli L, Lass D, Sorrentino A (2016) CAP reform and price transmission in the Italian pasta chain. Agribusiness32(4):482–497
Cavicchioli D (2010) Detecting market power along the food supply chain: evidence from the fluid milk sector in Italy.Paper prepared for the 116th EAAE seminar “spatial dynamics in the agro-food system: implications forsustainability and consumer welfare” Parma (I) October 27 th-30th, 2010 (https://www.researchgate.net/profile/Daniele_Cavicchioli/publication/254386681_Detecting_Market_Power_Along_Food_Supply_Chains_Evidence_From_the_Fluid_Milk_Sector_in_Italy/links/0deec53c4d6733fd26000000.pdf. Accessed 13 July 2017)
Chavas JP, Mehta A (2001) Price dynamics in a vertical sector: the case of butter. Am J Agric Econ 86(4):1078–1093Dejgård JD, Møller AS (2007) Vertical price transmission in the Danish food marketing chain, Fødevareøkonomisk
Institut, Københavns Universitet. FOI working paper, no. 2007/8. (http://curis.ku.dk/ws/files/134788710/FOI_WP_2007_8.pdf. Accessed 13 July 2017)
Digal LN, Ahmadi-Esfahani FZ (2002) Market power in the retail food industry: a survey of methods. Aust J Agric ResourEcon 46(4):559–584
Engle R, Granger C (1987) Co-integration and error correction: representation, estimation and testing. Econometrica 55:251–276
Ferrucci G, Jiménez-Rodriguez R, Onorante L (2010) Food price pass-through in the euro area. The role of asymmetriesand non-linearities. European Central Bank. Working paper series no. 1168, April 2010 (https://papers.ssrn.com/sol3/papers.cfm?abstract_id=1578209. Accessed 13 July 2017)
Frey G, Manera M (2007) Econometric models of asymmetric price transmission. J Econ Surv 21(2):349–415Goodwin BK, Harper DC (2000) Price transmission, threshold behaviour and asymmetric adjustment in the U.S. pork
sector. J Agric Appl Econ 32(3):543–553Hamulczuk M, Szajner P, (2015) Sugar prices in Poland and their determinants. Problems of Agricultural Economics, 4
345: 59-79Kimmel S (2009) Why prices rise faster than they fall. U.S. economic analysis group, antitrust division, U.S. Department
of Justice. Discussion paper, EAG 09-4, July 2009. http://citeseerx.ist.psu.edu/viewdoc/download?doi=10.1.1.918.7612&rep=rep1&type=pdf. Accessed 13 July 2017)
Kinnucan HW, Forker OD (1987) Asymmetry in farm-retail price transmission for major dairy products. Am J Agric Econ69(2):285–292
Listorti G, Esposti R (2012) Horizontal price transmission in agricultural markets: fundamental concepts and openempirical issues. Bio-based and Applied Economics, 1(1), 81-108
McCorriston S, Morgan WC, Rayner AJ (2001) Price transmission: the interaction between firm behaviour and returns toscale. Eur Rev Agric Econ 28(2):143–159
Meyer J, Von Cramon-Taubadel S (2004) Asymmetric price transmission: a survey. J Agric Econ 55(3):581–611Nolte S, Natanelov V, Buysse J, Van Huylenbroeck G (2012) Price transmission in the German sugar market, contributed
paper prepared for presentation at the 56th Australian Agricultural & Resource Economics Society annualconference, Fremantle, Western Australia, February 7-10, 2012. http://ageconsearch.umn.edu/record/124351/files/2012AC%20Nolte%20CP.pdf. Accessed 13 July 2017)
OECD (2007) Sugar policy reform in the European Union and in world sugar markets, OECD Committee for Agriculture.OECD publishing, Paris 2007 (http://www.keepeek.com/Digital-Asset-Management/oecd/agriculture-and-food/sugar-policy-reform-in-the-european-union-and-in-world-sugar-markets_9789264040212-en#.WSrR50m1vcs.Accessed 13 July 2017)
Peltzman S (2000) Prices raise faster than they fall. J Polit Econ 108(3):466–502 The University of Chicago PressPorter M (1985) Competitive advantage. Creating and sustaining superior performance. Free Press, New YorkReagan P, Weitzman M (1982) Asymmetries in price and quantity adjustments by the competitive firm. J Econ Theory
27(2):410–420
Aragrande et al. Agricultural and Food Economics (2017) 5:18 Page 19 of 20

Rezitis AN, Stavropoulos KS (2011) Price transmission and volatility in the Greek broiler sector: a threshold Cointegrationanalysis. Journal of Agricultural & Food Industrial Organization 9(1), Article 11. https://www.degruyter.com/view/j/jafio.2011.9.issue-1/issue-files/jafio.2011.9.issue-1.xml. Accessed 31 Aug 2017
Sheldon I, Sperling R 2003 Estimating the extent of imperfect competition in the food industry: what have we learned?J Agric Econ 54 1: 89-109
Sims C (1980) Macroeconomics and reality. Econometrica 48(1):1–48Varga T (2007) Vertical price transmission between market operators in Hungarian agricultural product chains. Studies
Agricultural Economics 106:41–70Vavra P, Goodwin B (2005), Analysis of price transmission along the food chain. OECD food, agriculture and fisheries
working papers, no. 3, OECD publishing. (http://www.Oecd.Org/Agriculture/Agricultural-policies/40459642.Pdf.Accessed 13 July 2017)
Wang X, Weldegebriel H, Rayner T (2006) Price transmission, market power and return to scale. Land economy workingpaper series no. 19. SAC, Edinburgh (Nov., 2006), (http://ageconsearch.Umn.Edu/record/46004/files/Work19Habtu.Pdf. Accessed 13 July 17)
Wohlgenant M (1985) Competitive storage, rational expectations, and short-run price determination. Am J Agri Econ67(4):739–748
Xia T (2009) Asymmetric price transmission, market power, and supply and demand curvature. J Agri Food Ind Organ7(1), Article 6. https://www.degruyter.com/view/j/jafio.2009.7.1/issue-files/jafio.2009.7.issue-1.xml. Accessed 31 Aug2017
Aragrande et al. Agricultural and Food Economics (2017) 5:18 Page 20 of 20