the effect of environmental changes on the photosynthesis ... · the effect of environmental...
TRANSCRIPT

UBC Social Ecological Economic Development Studies (SEEDS) Student Report
The Effect of Environmental Changes on the Photosynthesis and Transpiration of Rates of Evergreen and Deciduous Trees during the Summer, Autumn, and
Winter Periods
Manmeet Kaile
University of British Columbia
Directed Studies in Biology (BIOL 448)
June 5, 2011
Disclaimer: UBC SEEDS provides students with the opportunity to share the findings of their studies, as well as their opinions, conclusions and recommendations with the UBC community. The reader should bear in mind that this is a student project/report and is not an official document of UBC. Furthermore readers should bear in mind that these reports may not reflect the current status of activities at UBC. We urge you to contact the research persons mentioned in a report or the SEEDS Coordinator about the current
status of the subject matter of a project/report.

2
The Effect of Environmental Changes on the
Photosynthesis and Transpiration of Rates of
Evergreen and Deciduous Trees during the
Summer, Autumn, and Winter Periods
Biology 448 - Directed Studies Research in Biology
Manmeet Kaile Email: [email protected]
Date: June 5, 2011
Research Supervisor: DR. SANTOKH SINGH Department of Botany
Faculty of Science University of British Columbia
3
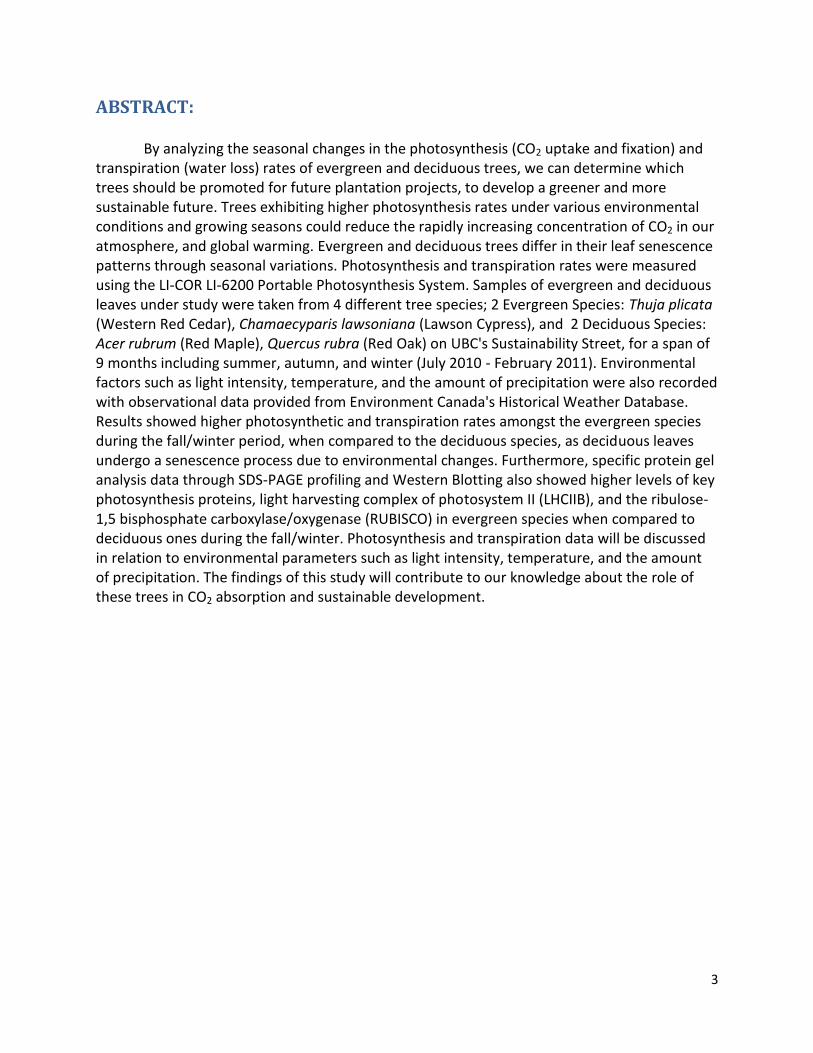
ABSTRACT:
By analyzing the seasonal changes in the photosynthesis (CO2 uptake and fixation) and transpiration (water loss) rates of evergreen and deciduous trees, we can determine which trees should be promoted for future plantation projects, to develop a greener and more sustainable future. Trees exhibiting higher photosynthesis rates under various environmental conditions and growing seasons could reduce the rapidly increasing concentration of CO2 in our atmosphere, and global warming. Evergreen and deciduous trees differ in their leaf senescence patterns through seasonal variations. Photosynthesis and transpiration rates were measured using the LI-COR LI-6200 Portable Photosynthesis System. Samples of evergreen and deciduous leaves under study were taken from 4 different tree species; 2 Evergreen Species: Thuja plicata (Western Red Cedar), Chamaecyparis lawsoniana (Lawson Cypress), and 2 Deciduous Species: Acer rubrum (Red Maple), Quercus rubra (Red Oak) on UBC's Sustainability Street, for a span of 9 months including summer, autumn, and winter (July 2010 - February 2011). Environmental factors such as light intensity, temperature, and the amount of precipitation were also recorded with observational data provided from Environment Canada's Historical Weather Database. Results showed higher photosynthetic and transpiration rates amongst the evergreen species during the fall/winter period, when compared to the deciduous species, as deciduous leaves undergo a senescence process due to environmental changes. Furthermore, specific protein gel analysis data through SDS-PAGE profiling and Western Blotting also showed higher levels of key photosynthesis proteins, light harvesting complex of photosystem II (LHCIIB), and the ribulose-1,5 bisphosphate carboxylase/oxygenase (RUBISCO) in evergreen species when compared to deciduous ones during the fall/winter. Photosynthesis and transpiration data will be discussed in relation to environmental parameters such as light intensity, temperature, and the amount of precipitation. The findings of this study will contribute to our knowledge about the role of these trees in CO2 absorption and sustainable development.

4
CONTENTS
ABSTRACT...................................................................................................................................... 3 LIST OF ILLUSTRATIONS ................................................................................................................. 5 1.0 INTRODUCTION ....................................................................................................................... 6 2.0 MATERIAL AND METHODS..................................................................................................... 10 3.0 RESULTS ................................................................................................................................ 13
3.1 Section A: Morphological Data.................................................................................. 13 3.2 Section B: Photosynthesis Rate ................................................................................ 14 3.3 Section C: Transpiration Rate.................................................................................... 15 3.4 Section D: Environmental Data................................................................................. 16 3.5 Section E: Biochemical Data ..................................................................................... 18
4.0 DISCUSSION .......................................................................................................................... 20 5.0 FUTURE STUDIES.................................................................................................................... 25 6.0 ACKNOWLEDGEMENTS ......................................................................................................... 25 7.0 LITERATURE CITED ................................................................................................................ 26 8.0 APPENDIX .............................................................................................................................. 27

5
LIST OF ILLUSTRATIONS
List of Figures: Figure 1: Changes in atmospheric carbon dioxide (CO2) levels from 1958-2010. Data collected
from Mauna Loa Observatory Hawaii. (Keeling and Sundquist, 2008) ........................... 7
Figure 2: Experimental Setup of the LI-COR 6200 Portable Photosynthesis System. …………...... 11 Figure 3: Morphological changes occurring in leaves of deciduous and evergreen trees from July
2010 – February 2011.…..……………………………………………………………………………..........………13
Figure 4: Average Photosynthesis Rates (µmol/m2/s) in deciduous and evergreen samples from June 2010 – February 2011 measured by the LI-COR 6200. ………………..………..,,…….……14
Figure 5: Average Transpiration Rates (µmol/m2/s) in deciduous and evergreen samples from June 2010 – February 2011 measured by the LI-COR 6200. …….…………………………..….…15
Figure 6: Light Intensity (µmol/m2/s) VS Time (date). ……..………………………………………………………16
Figure 7: Temperature (°C) VS Time (date). ……..………………….…………………………………………………16 Figure 8: Photoperiod (hr) VS Time (date). ………………………………..……………………………..……………17
Figure 9: Precipitation (mm) VS Time (date). …………………………………..…………………………………...17
Figure 10: A-D) SDS-PAGE Coomassie Brilliant Blue gels of 4 tree species (A-B) Evergreen, (C-D) Deciduous, showing the protein-profile of the leaf extracts. Two leaf samples were taken each month from July 2010 – January 2011. 10 µL of each sample were loaded on to the gel.….…………….…………………………………………………………………………………………………18
Figure 11: A-D) Western Blots of 4 tree species (A-B) Evergreen, (C-D) Deciduous, showing
amounts of specific proteins LHCIIB and RUBISCO. Two leaf samples were taken each
month starting from July 2010 – January 2011. 5 µL of each sample were loaded on to
the gel.…………………………………..……………………………………………………………………………..…...19
Figure 12: Photosynthesis Rates & Stomatal Conductance of 2 Evergreen Species (Syzyglum,
Hopea) VS 2 Deciduous Species (Vitex, Xylia) from a study done by Ishida et al. (2010). ............22

6
1.0 INTRODUCTION
Atmospheric carbon dioxide (CO2) levels are increasing in our atmosphere and this of
considerable concern in global climate change because of its greenhouse gas warming
potential. CO2, like many other greenhouse gasses is capable of trapping heat radiating away
from the earth, leading to an effect known as "Global Warming" (Tans, 2006). As human
civilization progresses, advances in technology due to the industrial revolution, has lead to an
increase in carbon emissions. Inventions such as the internal combustion engine, which burns
fossil fuels in automobiles and other vehicles, and an increase in the number of coal burning
factories has lead to increased levels of CO2 (Lehr, 1992). Global atmospheric CO2 levels have
increased from 315.98ppm in (1958) to 385.75ppm in (2008) according to data taken from the
Mauna Loa Observatory in Hawaii (Keeling and Sundquist, 2008). The average annual increase
has increased to 2.04ppm per year (Keeling and Sundquist, 2008).
Trees are one of the most important agents in reducing the concentration of CO2 in our
atmosphere as they play an important role in atmospheric gas exchange through the processes
of photosynthesis and respiration. Plants take in carbon dioxide (CO2) from the atmosphere
during photosynthesis, and release oxygen (O2) back into the atmosphere, reducing
atmospheric carbon dioxide levels. Through photosynthesis, green plants use solar energy
absorbed by light harvesting complex proteins, in chlorophyll to turn atmospheric carbon
dioxide into carbohydrates (Taiz and Zeiger, 2002). Other photosynthetic proteins, such as

7
RUBISCO, or ribulose-1,5 bisphosphate carboxylase/oxygenase catalyze the initial carbon fixing steps
during this process (Taiz and Zeiger, 2002).
Photosynthesis consists of two stages; the light reactions and the dark reactions. The light
reactions convert light into energy (ATP and NADHP) and the dark reactions use the energy and
carbon dioxide to produce carbohydrates (Taiz and Zeiger, 2002).
Expression of these specific proteins, and others, change through seasonal variations, as
environmental stresses cause certain senescence processes to begin in certain species (Smart,
2006). This consequently results in altered gas exchange as levels of photosynthesis and
transpiration vary. Transpiration influences gas exchange as stomatal pores remain open,
Fig. 1) Changes in atmospheric carbon dioxide (CO2) levels from 1958-2010.
Data collected from Mauna Loa Observatory Hawaii. (Keeling and
Sundquist, 2008)

8
allowing water to leave plants, and CO2 to enter by passing guard cells to be used for
photosynthesis (Taiz and Zeiger, 2002). Since plants do not have membranes that are both
permeable to CO2 and impermeable to water, transpiration is an inevitable consequence of
photosynthesis (Taiz and Zeiger, 2002).
The two types of trees under study are evergreen and deciduous trees. Evergreen trees
conserve energy and nutrients by slowly growing new foliage, or leaves, year-round (Goldstein
et al., 1989). This can be advantageous in regions where nutrients are limited, as an evergreen's
needle shaped structure aids in transpiration and allows them to endure a rough season,
whereas a deciduous tree might fail (Taiz and Zeiger, 2002). Deciduous trees on the other hand
have broad-shaped, color changing, leaves and shed their leaves during the autumn period of
every year (Taiz and Zeiger, 2002). The shedding or genetically programmed death of the
leaves, known as leaf senescence, is a highly ordered process regulated by approximately 30
genes known as senescence associated genes (SAGs) (Smart, 2006). The leaf when young and
mature, accumulates nutrients and exports them to growing parts of the plant during the initial
stages of senescence (Yoshiyuki and Kihachiro, 2006). The chloroplast is the first organelle to
deteriorate during the onset of leaf senescence, with the destruction of thylakoid protein
components and stromal enzymes including LHCIIB and RUBISCO (Wingler et al., 1998).
Previous research conducted by Eamus (1999) on the seasonal changes in
photosynthesis and transpiration rates of evergreen and deciduous species, analyzes the
cost/benefit ratio of deciduous leaf production, in comparison to having year-long evergreen
foliage. This particular study shows that during the drier periods of the summer, deciduous

9
species become drought avoiders as they drop their entire canopy and; therefore, do not
transpire at significant rates in the dry season as their foliage avoids drought (Eamus, 1999).
Deciduous species invest large amounts of nitrogen in leaves to support a very large
assimilation rate each day of the wet season; therefore their short-lived leaves fix large
amounts of carbon for a short time (Eamus, 1999). Ishida et al. (2010) and Golstein et al. (1989)
both show that evergreen species do not invest large amounts of nitrogen into their leaves, and
assimilation rates are consequently lower, but they fix carbon for 12 months and hence the
return to the tree occurs over a longer time.
The purpose of this experiment was to analyze the effect of environmental changes on
the photosynthesis and transpiration rates of the two different tree species. By analyzing the
seasonal changes in the photosynthesis (CO2 uptake and fixation) and transpiration (water loss)
rates of evergreen and deciduous trees, we can determine which trees should be promoted for
future plantation projects, to develop a greener and more sustainable future. Trees exhibiting
higher photosynthesis rates under various environmental conditions and growing seasons could
reduce the rapidly increasing concentration of CO2 in our atmosphere, and global warming.
Other more specific objectives of this research was: to observe and analyze morphological
changes in leaf color/structure through seasonal variation; to compare and contrast
photosynthesis and transpiration rates amongst the 4 tree species; and to analyze/interpret
biochemical changes in expressions of photosynthetic proteins, such as the light harvesting
complex of photosystem II (LHCIIB), which focus energy from photons, and ribulose-1,5
bisphosphate carboxylase/oxygenase (RUBISCO), which is a key enzyme catalyzing the CO2
fixation reaction in the Calvin Cycle.

10
2.0 MATERIALS AND METHODS:
Samples of evergreen and deciduous leaves under were taken from 4 different tree
species; 2 Evergreen Species: Thuja plicata (Western Red Cedar), Chamaecyparis lawsoniana
(Lawson Cypress), and 2 Deciduous Species: Acer rubrum (Red Maple), Quercus rubra (Red Oak)
on UBC Sustainability Street, for a span of 9 months including summer, autumn, and winter
(July 2010 - February 2011). The samples were taken on a weekly basis, with 3 samples coming
from each tree species, combing for a total of 12 samples per day. The samples were taken
from various, lower, reachable, areas on the trees and were approximately 20 cm2 in area. The
light intensity was also recorded using a light meter and pictures were taken from specific
locations for each tree.
The samples were carefully taken back to the lab in a 1000 mL beaker ensuring water
contact is continuous to the stem of the leaf. This will keep functional processes in the leaf to
continue without being disturbed, due to lack of water. After the samples were taken back to
the lab, the photosynthesis and transpiration rates were measured by LI-COR LI-6200 Portable
Photosynthesis System (Refer to Appendix: Section A for detailed LI-COR instructions). Close-up
pictures of the samples were also taken to analyze morphological changes occurring with
seasonal variation. The light intensity was preset to 500 µmol/m2/s and the flow rate was also
around 500 µmol/m2/s. After recording data from the samples, the LI-COR was taken to the
lab's main computer to transfer the data into Microsoft Excel format.

11
The remaining samples were then frozen in liquid nitrogen, folded in aluminum foil, and
placed in the freezer for further protein analysis on ribulose-1,5 bisphosphate
carboxylase/oxygenase (RUBISCO) and light harvesting complex of photosystem II (LHCIIB).
Frozen samples were taken out of the freezer during late February of 2011 for protein profiling
and analysis. Refer to Singh, 2008, Biology 351: Lab 5 for the preparation of the samples. Also,
refer to Singh, 2008, Biology 351: Lab 5 for the synthesis of the separating and stacking gels,
and for the gel electrophoresis apparatus setup. Two samples were taken for each month from
the first and fourth week of the month, from July 2010- January 2011, resulting in a total of 14
samples per gel. A total of 8 gels were run, 4 for the Coomassie blue stain, and 4 for the
Western Blot to identify specific proteins RUBISCO and LHCIIB. For Coomassie blue stained gels
10 µL of each sample and 6 µL of the molecular weight markers were loaded. For the Western
Blots 5 µL of each sample and 5 µL of the molecular weight markers were loaded. Refer to
LI-COR 6200
Leaf Chamber
Leaf sample
Light Box
Temperature adjuster
Fig. 2) Experimental Setup of the LI-COR 6200 Portable Photosynthesis System.

12
AgriSera Educational Tool Kit for the synthesis of the Coomassie blue stained gels and Western
Blots. RUBISCO and Light Harvesting Complex IIB antibodies were used as the 1° antibody and
Grown anti-Rabbit Horseradish Peroxidase as the 2° antibody. Refer to the Antibody Titration
Table in the Appendix for sample dilutions, 1° antibody dilutions, and 2° antibody dilutions.
After subsequent 20 minute washes using TBST, the blots were loaded onto the X-Ray film
apparatus and taken to the dark room for results. 30 second films produced for each protein,
displaying excellent clarity.
13
3.0 RESULTS
3.1. Section A: Morphological Data
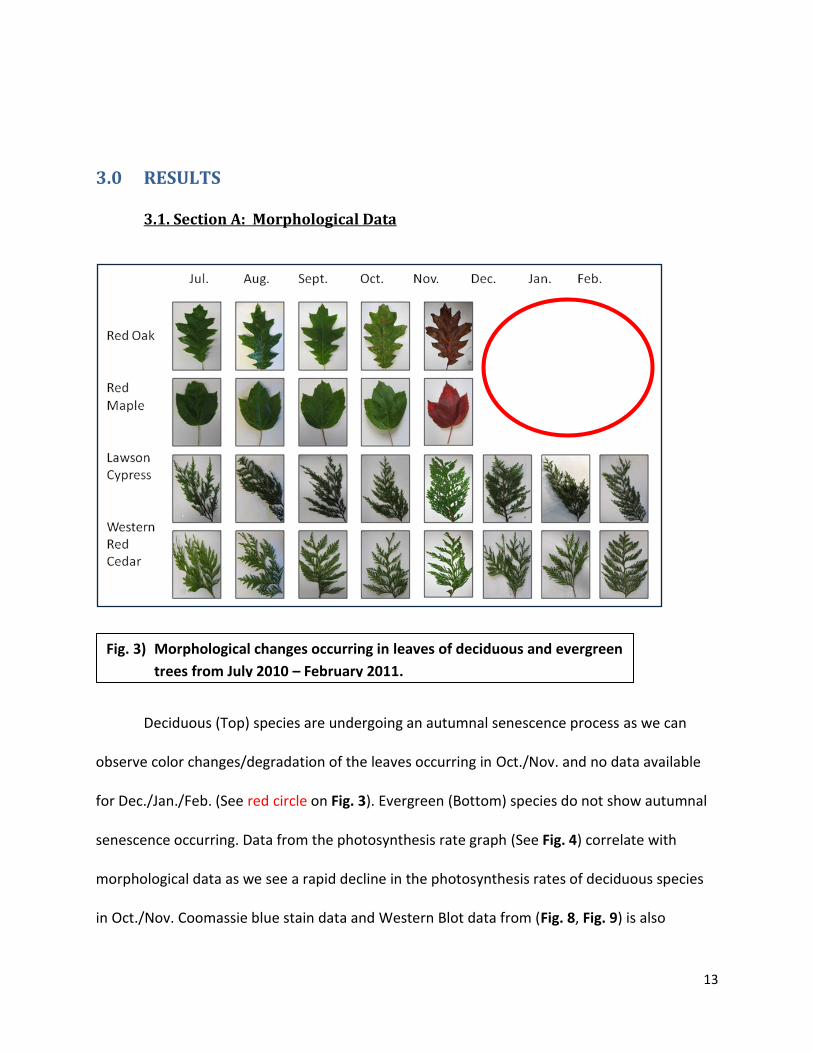
Deciduous (Top) species are undergoing an autumnal senescence process as we can
observe color changes/degradation of the leaves occurring in Oct./Nov. and no data available
for Dec./Jan./Feb. (See red circle on Fig. 3). Evergreen (Bottom) species do not show autumnal
senescence occurring. Data from the photosynthesis rate graph (See Fig. 4) correlate with
morphological data as we see a rapid decline in the photosynthesis rates of deciduous species
in Oct./Nov. Coomassie blue stain data and Western Blot data from (Fig. 8, Fig. 9) is also
Fig. 3) Morphological changes occurring in leaves of deciduous and evergreen
trees from July 2010 – February 2011.

14
concurrent with morphological data as we see protein degradation and lighter bands for
deciduous species in Oct./Nov.
3.2. Section B: Photosynthesis Rate
The Western Red Cedar appears to be the best photosynthesizing tree specie as it
continues to photosynthesize strongly in the fall period where others photosynthetic ability
tends to decline. Deciduous species show negative photosynthesis rates during the fall/winter
period, where they are releasing CO2 and actually contributing to atmospheric warming. There
is also a period in July with intense sunshine and heat may have lead to an effect known as
photo-inhibition resulting in lower rates for all species. During the winter period beginning in
Dec. and ending in Feb. we also see a major decline in the photosynthetic abilities of the two
remaining evergreen species with the Western Red Cedar being impacted the greatest
Fig. 4) Average Photosynthesis Rates (µmol/m2/s) in deciduous and evergreen
samples from June 2010 – February 2011 measured by the LI-COR 6200.

15
potentially due to the colder, harsh temperatures (See Fig. 7), and lower amounts of
precipitation (See Fig. 8).
3,3, Section C: Transpiration Rate
Evergreen species have shown to consistently have higher transpiration rates as
compared to deciduous species throughout the entire time of the data taken (See red/green
lines in Fig. 5). High transpiration rates indicate that their stomates remain open during this
time allowing water to be released, and carbon dioxide to come in. This also allows for better
nutrient circulation as water is continuously lost.
Fig. 5) Average Transpiration Rates (µmol/m2/s) in deciduous and evergreen samples
from June 2010 – February 2011 measured by the LI-COR 6200.

16
3.4. Section D: Environmental Data
- Weather Data provided by Environment Canada On-line Historical Database.
Fig. 6) Light Intensity (µmol/m2/s) VS Time (date)
Fig. 7) Temperature (°C) VS Time (date)

17
Fig. 8) Photoperiod (hr) VS Time (date)
Fig. 9) Precipitation (mm) VS Time (date)

18
3.5. Section E: Biochemical Data
Protein degradation is present throughout the autumn period for the 2 deciduous
species (Bottom) as we can see a decrease in the thickness of bands present on the stained gels
during Oct./Nov. Evergreen species display more consistency with regards to protein expression
as degradation is not as visible.
Fig. 10)A-D) SDS-PAGE Coomassie Brilliant Blue gels of 4 tree species (A-B) Evergreen, (C-D) Deciduous,
showing the protein-profile of the leaf extracts. Two leaf samples were taken each month from
July 2010 – January 2011. 10 µL of each sample were loaded on to the gel.
24-kDa
56-kDa
A) Western Red Cedar B) Lawson Cypress
July <- - - - - - - - - - - - - - - - - - - - - - - - - - - - -> Jan July <- - - - - - - - - - - - - - - - - - - - - - - - - - - - - - - - - - - - - - -> Jan
MW (6µL) I Samples (10 µL) MW (6µL) I Samples (10 µL)
24-kDa
56-kDa
C) Red Oak D) Red Maple
July <- - - - - - - - - - - - - - - - - - - - - - - - - - -> Nov July <- - - - - - - - - - - - - - - - - - - - - - - - > Nov
MW (6µL) I Samples (10 µL) MW (6µL) I Samples (10 µL)

19
We can clearly see higher levels of LHCIIB protein expression during the fall/winter
periods for evergreen species (A-B) when compared to deciduous ones (C-D). RUBISCO levels
are relatively high/constant, and greater than deciduous species throughout the entire time of
the data taken for evergreens. Evergreen species clearly have higher levels of photosynthetic
proteins during the fall/winter months, as deciduous species undergo a senescence process
causing a decline in their relative amounts of photosynthetic proteins. Morphological data (See
Fig. 3) also corresponds with these results.
A) Western Red Cedar
C) Red Oak D) Red Maple
B) Lawson Cypress
Fig. 11) A-D) Western Blots of 4 tree species (A-B) Evergreen, (C-D) Deciduous, showing amounts of
specific proteins LHCIIB and RUBISCO. Two leaf samples were taken each month starting from
July 2010 – January 2011. 5 µL of each sample were loaded on to the gel.
MW
MW MW
MW
MW MW
MW
MW

20
4.0 DISCUSSION
After analyzing and comparing the photosynthesis and transpiration rates of the 4
different tree species (See Fig. 4, Fig. 5), from the period of July 2010 – February 2011, it can be
concluded that the evergreen Western Red Cedar (Thuja plicata) was the most effective
photosynthetic specie at reducing atmospheric carbon dioxide levels during the autumn/winter
period. This was mainly due to the fact that the deciduous species underwent a senescence
process, causing protein degradation and lower observed photosynthesis rates during this time
(See Fig. 3). Studies done by Eaus (1999) on the seasonal changes in the photosynthesis and
transpiration rates of evergreen and deciduous species support my results as similar findings
were concluded. Eaus (1999) and Goldstein et al. (1989) found that evergreen species displayed
higher photosynthetic ability throughout the year, whereas deciduous species were short-lived
and fixed large amounts of carbon during early growth periods. This might be made possible by
a root system that accesses deeper layers of soil than deciduous species (Eaus, 1999).
Photosynthesis rates for all 4 tree species display an initial rapid decline (See Fig. 4) in
CO2 uptake during the high temperature (See Fig. 6, Fig. 7, Fig. 9 –July), drought-like conditions
of July 2010. In high light intensities conditions, photosystem II (PSII) in chlorophyll can be
damaged by the enhanced activity of electrons beyond that which it can process (Baker, 1997).
PSII centers are continuously repaired via degradation and synthesis of the D1 protein in the
photosynthetic reaction centre of PSII (Baker, 1997). Due to rapid repair, most PSII reaction
centers are not photo-inhibited; however, extreme environmental stresses such as extreme
temperature, salinity, or drought, limit the supply of CO2 for carbon fixation which decreases

21
the rate of repair of PSII (Baker, 1997). Therefore less CO2 is taken up & lower photosynthesis
rates are observed. During periods of photo-inhibition we see lower levels of LHCIIB present
(See Fig. 8, Fig. 9 -July), indicating that the deactivation of PSII is most likely the cause of the
observed lower photosynthesis rates.
After July, photosynthesis rates tend to increase for all species as temperatures and light
intensity decline, removing the effect of photo-inhibition (See Fig. 4). During this time, leaves
are allocating resources for growth and photosynthesizing at high rates. Eventually during the
later stage of autumn, lower temperatures, with reduced amounts of sunlight, and biological
limitations on growth size based on nitrogen investment in photosynthetic machinery, leads to
the release of photosynthesis inhibiting hormones marking the beginning of the senescence
process for deciduous species (Sobrado, 1994). In contrast, evergreen species continue to
photosynthesize as they have several adaptations including a covering of waxy foliage which
helps prevent moisture loss and subsequent freezing (Taiz and Zeiger, 2002). These trends on
Fig. 4 are consistent with specific protein gel analysis (Fig. 8, Fig. 9) as evergreen species show
consistently higher levels of photosynthetic proteins such as RUBISCO and LHCIIB compared to
deciduous ones during the autumn/winter. This, in part results in higher photosynthesis rates
and increased uptake of carbon dioxide during the fall/winter periods for these trees. During
the winter period, negative photosynthesis rates for all species are observed as freezing
temperatures limit the circulation of water/nutrients inside the remaining evergreen trees (See
Fig. 4). A very similar study conducted by Ishidia et al. (2010), which also used the LI-COR 6200
Portable Photosynthesis System had similar photosynthesis rate data for evergreen species:
Syzygium cumini, Hopea ferrea and deciduous species: Xylia xylocarpa Vitex peduncularis (See

22
Fig 12). Ishida et al. (2010) also shows how stomatal conductance is linearly correlated with the
net photosynthetic rate. This is because transpiration is an inevitable consequence of
photosynthesis (Taiz and Zeiger, 2002).
Evergreen species also show higher transpiration rates compared to deciduous ones
(See Fig. 5) throughout the summer/autumn/winter periods indicating that their stomates
remain open during these times to allow water to leave cells, and carbon dioxide to enter.
Almost all of the CO2 fixed by terrestrial plants and most of the water transpired pass through
these stomatal pores. The degree of opening of these pores is modulated by variation in the
turgor status of the two surrounding guard cells (Christodoulakis et al. 2002). The regulation of
Fig. 12) Photosynthesis Rates & Stomatal Conductance of 2 Evergreen Species (Syzyglum,
Hopea) VS 2 Deciduous Species (Vitex, Xylia) from a study done by Ishida et al. (2010).

23
stomatal aperture determines the compromise between increasing CO2 fixation and reducing
transpiration to prevent desiccation. Studies done by Goldstein et. al (1989) agree with my
results as evergreen species in their experiments “generally exhibited higher rates of water loss
than deciduous species”. Goldstein et al. (1989) concludes that evergreen species have more
efficient systems for water transport compared to deciduous ones, which is advantageous as it
allows for high stomatal conductance without turgor loss. This becomes particularly important
during the drier periods of summer when evaporate demand is higher. Goldstein et al. (1989)
also proposed that having relatively high stomatal conductances may be critical for the
maintenance of a favorable carbon and nutrient balance in evergreen trees. Compared to
deciduous trees, evergreen trees have a much higher maintenance cost due to the presence of
an extensive root system and waxy leaves (Eamus, 1999). An increased leaf life span increases
the time period for photosynthesis, compensating for higher maintenance costs; however, it
appears that the increased life span cannot compensate for additional maintenance costs if
photosynthesis rates of evergreen species are low (Eamus, 1999).
Some potential experimental errors which may have resulted in variations, or
discrepancies in data could potentially be due to several factors. One factor is that our weather
is constantly changing, with changes in humidity, visibility, etc occurring every second effecting
photosynthesis and transpiration rates. Another factor may be that the time of the day that the
data was taken was not 100% consistent throughout experiment as levels of photosynthesis
change throughout the day due to a plants circadian rhythm.

24
Other studies and previous research conducted in Dr. Singh’s Lab (Department of
Botany, University of British Columbia) show that since deciduous leaves have a larger surface
area to take up CO2, it allows them to collectively have stronger photosynthesis during certain
times of the year (ie. Spring). Studies done by Eamus (1999) agree with this data as he analyzes
the cost/benefit relationships amongst deciduous and evergreen trees. Deciduous species
invest large amounts of nitrogen in leaves to support a very large assimilation rate each day of
the wet season; therefore their short-lived leaves fix large amounts of carbon for a short time
(Eamus 1999).

25
5.0 FUTURE STUDIES
Based on the results of this investigation and previous studies in our laboratory, a
combination of planting both photosynthetically-efficient and environmental stress-resistant
deciduous and evergreen trees could help reduce atmospheric CO2 levels. Future studies
include conducting experiments on several other deciduous and evergreen tree species located
on UBC’s campus and exploring other environmental variables such as humidity and it’s relation
to photosynthetic and transpiration ability.
6.0 ACKNOWLEDGEMENTS
I would like to thank Dr. Singh and Mr. Mehroke for their continuous suggestions and
guidance throughout the whole experiment. I would also like to thank Brenda Sawada of UBC
SEEDS for coordination of this project. Finally, my special thanks to all the volunteer students in
Dr. Singh’s lab who helped me at the various stages of this project.

26
7.0 LITERATURE CITED
Baker, N.R., Nogues, S., and Allen, D.J. 1997. Plants and UV-B: Preston, Lancashire. pp. 95-112.
Christodoulakis, N.S., Menti, J., and Galatis, B. 2002. Structure and development of stomata on the primary root of ceratonia siliqua l. Annals of Botany. 89: pp. 23-29
Eamus, D. 1999. Ecophysiological traits of deciduous and evergreen woody species in the seasonally dry tropics. Trends in Ecology & Evolution. 1: pp. 11-16.
Goldstein, G., Rada, F., Rundel, P., Azocar, A., and Orozco, A. 1989. Gas exchange and water relations of evergreen and deciduous tropical savanna trees. Forest Tree Physiology. 46: pp. 448-453.
Ishida, A., Harayama, H., Yazaki, K., Ladpal, P., Sasrisang, A., Kaewpakasit, K., Panuthai, S., Staporn, D., Maeda, T., Gamo, M., Diloksumpun, S., Puangchit, L., and Ishizuka, M. 2010. Seasonal variations of gas exchange and water relations in deciduous and evergreen trees in monosoonal dry forests of Thailand. Tree Physiology. 30: pp. 935-945.
Keeling, R.F., and Sundquist, E.T. 2008. The mauna loa carbon dioxide record: lessons for long-term earth observations. U.S. Geological Survey. 2: pp. 27-29.
Lehr, J.H. 1992. Rational Readings on Environmental Concerns: Second Edition. Van Nostrand Reinhold, New York. pp. 393-414.
Smart, M. C. 2006. Gene Expression during leaf senescence. New Phytologist. 126: pp. 419-448.
Sobrado, M. A. 1994. Leaf age effects on photosynthetic rate, transpiration rate and nitrogen content in a tropical dry forest. Physiologia Plantarum. 90: pp. 210-215.
Taiz, L., and Zeiger, E. 2002. Plant Physiology: Third Edition. Sinauer Associates, Sunderland, MA. pp. 423-459.
Tans, P. 2006. How can global warming be traced to CO2. Scientific American. 295: pp. 124-124.
Wingler, A., Schaewen, V. A., Leegood, C. R., Lea, P. J. and Quick, W.P. 1998. Regulation of leaf senescence by cytokinin, sugars, and light. Plant Physiology. 116: pp. 329-335.
Yoshiyuki, M., and Kihachiro, K. 2006. Photosynthesis and physiological traits of evergreen broadleafed saplings during winter under different light environments in a temperate forest. Canadian Journal of Botany. 84: pp. 60-69.

27
8.0 APPENDIX
LI-COR 6200 Portable Photosynthesis System Procedure:
To calibrate the LI-COR, first the magnesium perchlorate dessicant (MgClO4) dessicant must be replaced. Calibration of the LI-COR must also be done by establishing the "Zero" baseline and establishing the" Ambient CO2 levels", by using the zero knob, and the span knob respectively, samples can then be placed into the chamber for analysis. The light intensity must be preset to 500 µmol/m2/s and the flow rate must be around 500 µmol/m2/s. The area of the sample should be measured and input into the LI-COR. After these requirements are completed, the PUMP will be turned on and measurements of the photosynthesis and transpiration rates will be taken in 3, 30 second intervals for a total sample period of 90 seconds. After recording data from the samples, the LI-COR can be taken to the lab's main computer to transfer the data into Microsoft Excel format.