the effect of dissolving salts or€¦ · mass flux of 0.5 kg/m2.s. figure 5.6 effect of mass flux...
TRANSCRIPT

THE EFFECT OF DISSOLVING SALTS OR GASES IN WATER SPRAYED ON A HOT
SURFACE
Qiang Cui
A thesis submitted in confonnity with the requirements for the Degree of Doctor of Philosophy
Department of Mechanical ancl Industrial Engineering University of Toronto
O Copyright by Qiang Cui 2001

National Library 8ibliothèque nationale du Canada
Acquisitions and Acquisitions et Bibliographie Services senrices bibliographiques 395 Wellington Street 395. rüe WsYVigrOri Ottawa ON K1A ON4 -ON KlAOCYI Canada can&a
The author has granted a non- exclusive licence dowing the National Library of Canada to reproduce, loan, disbn'bute or sell copies of this thesis in microform, paper or electronic fomats.
The author retains ownership of the copyright in this thesis. Neither the thesis nor substantial extracts fiom it may be printed or otherwise reproduced without the author's permission.
L'auteur a accordé une licence non exclusive permettant à la Bibliothèque nationale du Canada de reproduire' prêter, distribuer ou vendre des copies de cette thèse sous la forme de microfiche/film. de reproduction sur papier ou sur fomat électronique.
L'auteur conserve la propriété du droit d'auteur qui protège cette thèse. Ni la thése ni des extraits substantiels de celle-ci ne doivent être imprimés ou autrement reproduits sans son autorisation.

THE EFFEICT OF DISSOLVING SALTS OR GASES IN WATER
SPRAYED ON A HOT SURFACE
Qiang Cui
A thesis submitted in conformity with the requirements for the Degree of Doctor of Philosophy
Graduate Department of Mechanical Engineering University of Toronto
O Copyright Qiang Cui 2001
A shidy on the effect of dissolved saits and gas on droplet boiling and spray
cooling was conducted. The effect of dissolved salts and gas on droplet boiling was
observed on a hot stainless steel surface at temperatures ranging fiom 100°C to 300°C.
Dissolving small amount of salts in water does not change the properties of water
significantly; it may, however, have a great effect on droplet boiling. Dissolved salts
reduced heat transfer in the evaporation regime since they lower the vapour pressure of
water, while dissolved CO, enhanced the evaporation rate slightly. In the nucleate boiling
regime, dissolved salts (Na2C0,, NqSO,, MgSO,) prevented bubble coalescence in the
liquid and promoted foaming, reducing droplet evaporation time significantly. Heat
transfer was enhanced by increasing salt concentration d l it reached the "transition
concentration". Above this limit, dissolved salts started to reduce droplet evaporation rate

since they lower the vapor pressure of water. Dissolved NaHCO, reduced droplet
Lifetimes even more than Na2C03, because it decomposed when heated to produce CO2,
further augmenthg bubble formation. It was also found that when a droplet impinged on
a surface above the Leidenfrost temperature, dissolved CO2 suppressed heterogeneous
nucieation because CO, escaped from below the drop and prevented it touching substrate.
Experiments on spray cooling of a hot surface were performed with water sprays
containing dissolved salts (NaCl, Na2S04, MgS04). Dissolving salts in water
significantly enhanced heat transfer in the transition and nucleate boiling regimes during
spray cooling. The increase in heat transfer was obsewed at a l l mass fluxes and impact
velocities as weil as concentrations in the range of expeciments conducted. The critical
heat flux was found to increase with increasing molar concentration of dissolved salts in
water until the concentration reached the "transition concentration". Dissolving salts in
water over the transition concentrations reduced spray cooling due to the reduction of
vapor pressure. Precipi tated salt particles on the hot surface increased surface roughness.
improving heat transfer in transition boiling. Furthemore, dissolved salts increased the
Leidenfrost temperature in spray cooling by preventing bubble coalescence and
producing particles which increase surface roughness.
iii

1 would like to take this opportunity to express my heartfelt thanks and
appreciations to my supervisors. Professors S. Chandra and S. McCahan. for their
invaluable guidance, encouragement and financial support durhg my study here at the
University of Toronto
My sincere gratitude goes to both the University of Toronto and the Ontario
govenunent for financial assistance in the forms of University of Toronto Open Doctoral
Fellowship and Ontario Graduate Scholarship in Science and Technology.
1 am deeply indebted to my wife, Lin Chen, for her patience, understanding and
continued support during the long and sometimes challenging joumey of pursuing a
doc torate.
FinaUy 1 thank my coileagues for their support and for making this journey more
pleasant and 1 wish them the best success in their future endeavors.

TABLE OF CONTENTS
ABSTRACT
ACKNOWLEDGEMENTS
LIST OF TABLES
LIST OF FIGURES
NOMENCLATURES
1. INTRODUCTION
1.1 Bac kground
1.2 Literature Review
1.2.1 Heat Transfer During Single Droplet Impact
1.2.2 Spray Cooling of Hot Surfaces
1.2.3 Effect of Dissolved Gases on Boiling
1.2.4 Effect of Dissolved Salts on Boiling
1.2.5 Effect of Additives on Spray Cooling
1.3 Objectives
2. EXPERIMENTAL APPARATUS
2.1 Boiling of Single Droplets on a Hot Surface
2.1.1 Experimental Setup for Boiling of Single Droplets
2.1.2 Photography Techniques
2.1.3 Reparation of Test Water
2.2 Spray Cwling of a Hot Surface
3. EFFECT OF DISSOLVED SALTS ON DROPLET BOILING
3.1 Effect of Dissolved Salts on Droplet Boiling
3.2 Effect of Dissolved Salt Concentration on Droplet Boiling
3.3 Mode1 of Bubble Coalescence in Salt Solutions
ii
iv
vii
viii
?G
1

3.4 Summary 56
4. EFFECT OF SALTS DECOMPOSING AT HIGH TEMPERATURE ON DROPLET
BOILING 58
4.1 Droplet Behavior in the Evaporative Regime 59
4.2 Nucleate Boiling Behavior 69
4.3 Droplet Behavior on a Surface above 210°C 73
4.4 Summary 79
5. EFFECT OF DISSOLVED SALTS ON SPRAY COOLING 80
5.1 Spray Parameters
5.2 Spray Cooling of a Hot Surface
5.3 Effect of Dissolved Salts on Spray Cooling
5.4 Effect of Droplet Velocity on Spray Cooling
5.5 Effect of Dissolved Salt Concentration on Spray Cooling
5.6 Summary
6. CONCLUSIONS
REFERENCES
APPENDICS
Appendix A Data Acquisition and Control System
Appendix B Physicai Properties of Electrolyte Solutions
(Vapor Pressure, Surface Tension, Viscosity, Solubility)
Appendix C Determination of Carbon Dioxide (CO3 Concentration in Water
Appendix D Decomposition Rate of Sodium Bicarbonate (NaHCO,)
Appendix E Cornputer Program

LIST OF TABLES
Table 3.1 Cornparison of the calculated bubble size with the experimental values. 54
Table 5.1 Surnmary of Mudawar and Valentine's spray cooling correlations. 80
Table 5.2 Summary of spray variables. 83
vii

LIST OF FIGURES
Figure 1. I Heat transfer regimes during spray cooling of a hot surface. 3
Figure 1.2 The temperature -tirne curve during spray cooling of a hot surface.
Figure 1.3 Local and bulk thermodynamics States for a gassy saturated liquid.
Figure 2.1 Schematic diagram of single droplet experimental apparatus.
Figure 2.2 Liquid-solid contact angle (0) measurement fiom an image of a
water droplet taken by a video camera.
Figure 2.3 Experirnentai setup for degassing water.
Figure 2.4 Experimental apparatus for spray cooling.
Figure 2.5a Test surface dimensions and thermocouple positions.
Figure 2.5b Dimensions of the copper heater block,
Figure 3.1 Variation of average droplet lifetime for droplets deposited on a stainless steel surface at temperatures ranging from 90°C to 2 10°C. Error bars mark the maximum and minimum evaporation time observed.
Figure 3.2 Evaporation of droplets containing: a) pure water, b) 0.06 M dissolved NaCl solution, c) 0.06 M dissolved Na,S04 solution, once deposited on a hot surface at a temperature of 130°C.
Figure 3.3 Evaporation of droplets containing: a) 0.01 M dissolved MgSO, solution, b) 0.06 M dissolved MgSO, solution, c) 0.40 M dissolved MgSO, solution, once deposited on a hot surface at a temperature of 130°C.
Figure 3.4 Variation of the droplet lifetime with the solution concentration once a droplet containing: a) NaCI, b) N a m , c ) MgSO,, impacted on a hot surface at a temperature of 130°C.

Figure 3.5 The assumed process of bubble coalescence.
Figure 3-6 Variation of the transition concentration versus the radius of coalescing bubbles in a salt solution at a temperature of 100°C.
Figure 4.1
Figure 4.2
Figure 4.3
Figure 4.4
Figure 4.5
Figure 4.6
Figure 4.7
Figure 4.8
Figure 4.9
Figure 4.1 O
Figure 4.1 1
Evaporation of droplets on a hot surface at 100°C: a) pure water, b) water containing dissolved CO,, c) 1% by weight solution of Na2C0,, d) 1% by weight solution of NaHC03.
Variation of Liquid-solid contact diameter with time during evaporation of droplets on a stainless steel surface at 100°C.
Variation of liquid-solid contact angle with time during evaporation of droplets on a stainless steel surface at 100°C.
Diagram of a water droplet with a bubble inside.
Variation of droplet-air interface area with time during evaporation of droplets on a stainless steel surface at 100°C.
Variation of water volume during evaporation of droplets on a stainless steel surface at Iûû°C-
Surface tension driven instability .
Evaporation of 1% by weight solution of NaHC03 droplets on a hot surface at 130°C.
Evaporation of droplets on a hot surface at 130°C: a) pure water, b) water containing dissolved CO,, c) 1% by weight solution of Na2C03.
Variation of droplet Lifetime for droplets deposited on a stainless steel at temperatures ranging îkom 100°C to 2 10°C.
Impact of droplets on a surface at 220°C: a) pure water, b) water containing dissolved CO2, and 1% by weight solution of NaHC03.

Figure 4.12 Variation of droplet metirne for droplets deposited on a stainless steel at temperatures ranging fiom 210°C to 3ûûaC.
Figure 4.13 Impact of droplets on a surface at 300°C: a) pure water, b) water containing dissolved CO,, and 1% 1% by weight solution of NaHCO,.
Figure 5.1 Transient temperature measurements during spray cooling using pure water.
Figure 5.2 The calculated surface heat flux and temperature during spray cooling obtained from intenor temperature measurements of Figure 5.1.
Figure 5.3 Photographs of droplet impact during spray cooling of pure water.
Figure 5.4 Photographs of droplet impact during spray cooling of 0.06 M NaCl solution, 0.06 M Na,SO,, 0.06 M MgSO, solutions.
Figure 5.5 EEect of dissolved sdts on heat transfer in spray cooling at the mass flux of 0.5 kg/m2.s.
Figure 5.6 Effect of mass flux on spray cooling of a surface with water containing dissolved salts.
Figure 5.7 Effect of dissolved salts on the critical heat flux at a mass flux of 3.0 kg/m2s.
Figure 5.8 Effect of dissolved sdts on the heat uansfet rate during spray cooling for pure water and MgSO, (0.06M) at three different droplet veloçities: 17 m/s, 20 mls, and 23 m/s.
Figure 5.9 Effect of salt concentration on heat flux during spray cooling for pure water and MgSO, solution at the mass flux of 3.0 kg/m2.s and droplet velocity of 20 m/s.

Figure 5.10 Effect of dissolved salt concentration on cntical heat flux during spray coolïng. 104
Figure 5.1 1 Effect of dissolved salts on the surface temperature &op during spray cooling. 106
Figure A.1 The VI of the control system for photographing single droplet evaporation. 126
Figure A.2 The DAC system for photographing spray cooling of hot surfaces. 127
Figure A.3 The temperature acquisition system for recording temperature variation with tirne during spray cooling. 128
Figure B.1 Variations of vapor pressures of the electrolyte solutions with increasing mass concentration at 100°C. 134
Figure B.2 Variations of viscosity of the electrolyte solutions with increasing mass concentration at 100°C. 135
Figure B.3 Variations of solubility of the electrolytes with increasing solution temperature.
Figure C.1 Schematic diagram of a Natelson Microgasometer (Mode1 #650), which adapts the classical Van Slyke manometric method to ultra- micro anaiysis.
Figure D.l The amount of NaHCO, decomposing during boiling of a water droplet on a hot surface at temperatures ranging from 100°C to 210°C.
Figure D.2 Production rate of CO, during boiling of a droplet containing NaHCO, on a hot surface at temperatures ranging fiom 100°C to 210°C. 145

constant defined in Eq. 3-12, dimensionless constant defined in EQ. 3.12, dimensionless constant defined in Eq. 3.12, dimensiodess retarded van der Waals coefficient concentration of salt, moVL molar concentration of ionic species i, moVL transition salt concentration, moUL
specific heat, Jkg-OC initiai droplet diameter, m orifice diameter, m m a s median diameter, m
Sauter mean diameter (SMD), m droplet diameter, m droplet contact diameter, m bubble diameter, m acceleration due to gravity, mls2
height of a droplet, m film thickness between coalescing bubbles, cm initiai film thickness between coalescing bubbles, cm
latent heat of vaporation, J/kg ionic strength; moikg or moVL thermal conductivity, W/m
spray mass flux, kgws
Nusselt number pressure in the f h between coalescing bubbles, atm
pressure ciifference between upstream and downstream of a nozzle, N/m2 Prandtl nwnber surface heat flux, W/m2
volumetenc spray flux, m3/s
radius of film between coalescing bubbles, cm
gas constant
Reynold number at the orifice of nozzle
bubble radius, cm
radius of the liquid film between coalescing bubbles, cm
xii

the, s
dimensionless tirne ambient temperature, OC departure from nucleate boiling temperature, OC Leidenfrost temperatwe, OC
surface temperature at the critical heat flux surface temperature, OC
droplet impact velocity, m/s rnean droplet impact velocity, m/s
upstream velocity of the nozzle and relative velocity of the droplet to the
test surface, mis; initial droplet velocity, m/s IJ velocity of liquid between coalescing bubbles, cm/s
v d droplet volume, m3
v b bubble volume, m3 W measured weight of a droplet, kg
We Weber number
We, Weber number at the orifice of nozzle
z coordinate
4 charge number of ionic species i
Greek Sym bols liquid-solid contact angle, O
absolute viscosity, kg/s*m
number of ions formed upon dissociation
density, gkm3 surface tension, g/s2 or mNlm dimensionless filni thickness, Wh,
ambient fluid (air or vapor)
Liquid
gas radial solid; surface
vapor
solid surface

1. INTRODUCTION
1.1 Background
Extremely high heat fluxes, in excess of 10' w/m2, c m be dissipated when a
surface is impacted by a spray of liquid droplets. While techniques such as jet
impingement have shown a capacity for dissipating high heat fluxes, they produce very
uneven cooling because of the large spatial variations in heat flux between the
impingement zone and surrounding surface. Uniike jet impingement, spray boiling
usually provides rnuch more uniform heat transfer over the surface and is therefore
widely used in industries. A spray consists of a dispersion of fine drops formed by either
supplying Liquid at high pressure through a small orifice (plain orifice spray) or by
assisting liquid breakup with a high pressure supply of air (atomized spray). Liquid
breakup results in a drastic increase in particle (drop) interfacial area to volume ratio and
enhances heat transfer. Therefore, droplet cooiing provides significantly higher heat
fluxes than conventional alternatives such as pool boiling, and these high liquid-solid
heat transfer rates allow the size, cost and complexity of equipment to be reduced.
Sprays have been employed effectively to cool hot subjects in many industnal processes.
Applications of sprays include evaporation of fuel droplets in metallurgy,
rnicroelectronics, nuclear plant safety, aerospace engineering, and tire fighting.
In the metallurgical industry, sprays c m be used to cool a preheated metallic
surface in a continuous casting process, in which uniform and rapid cooling is essential
for obtaining good mechanical properties such as the strength and hardness. Slow
quenching may have disastrous consequences in heat treating, as it may allow massive
precipitation of the ailoy solutes dong grain boundaries instead of dispersing them within

the grains. In addition, spray cooling provides much more precise control of the heat
transfer rate over the surface than immersion quenching by adjusting the volumetric flux
or other spray parameters. Spray cooling is also used in electronic cooling processes,
which demand both enhanced heat removal rates and good surface temperature control-
When quenched by a spray of water, the heat transfer fiom a solid surface is
sirnilar to that in pool boiling despite dtastic differences in the liquid-solid contact pattern
between the two cases (Toda, 1974). A hot surface during spray cooling experiences four
heat transfer regimes: film boiling, transition boiling, nucleate boiling, and single-phase
cooiing. The sutface temperature is the most important parameter in spray cooling and is
used to define the four distinct heat transfer regimes of the boiling curve shown in Figure
1.1, in which heat flux is plotted as a function of the surface temperature. The
corresponding temperature-tirne curve is shown in Figure 1.2, which displays the cooling
history for the surface and exhibits the four heat transfer regimes identified on the boiling
curve.
The liquid-solid contact pattern formed dunng spraying and correspondiag heat
transfer are different in each of the four heat transfer regimes. When the surface
temperature initially exceeds the Leidenfrost temperature, spray cooling commences at a
relatively slow rate with film boiling. In the film boiüng regirne, the surface is separated
from the liquid droplets by a continuous thin vapor blanket developed upon droplet
impact (of the order of few rnilliseconds). Heat transfer persists in the film boiling regùne
until the surface temperature drops below a iïmit commonly referred to as the minimum
heat flux or Leidenfiost point (LW). Below this temperature Wt, heat transfer enters the
transition regime, in which the droplets start to partially wet the surface resuiting in a
rapid increase in surface heat flux and a faster decrease in surface temperature. As the
surface temperature decreases from the LFP, the heat transfer rate increases because of
more efficient surface wetting and boiling on the surface untii it reaches a maximum,

Figure 1.1 Boiling curve for pool boiling (Iacopera, F. P. and DeWitt, D. P., 1996)

Figure 1.2 Cooling cuve (Bernardin et al., 1997)

known as the critical heat flux (CHF). The critical heat flux point corresponds to the
inflection point or the steepest portion of the cwling curve (see Figure 1.2). Below the
cntical heat flux point exists the nucleate boiling regime, where bubble nucleation is the
dominant mode of heat transfer. In the nucleate boiLing regime, the heat transfer rate
decreases as the surface temperature decreases and bubble nucleation becomes less
active. The lower boundary of the nucleate boiling regime is govemed by the minimum
surface superheat required for vapor bubble nucleation and bubble growth in the Liquid
film covering the surface. Below this surface temperature, heat transfer enters the single-
phase cooling regime or film evaporation regime, in which heat fiom the surface is
conducted through the liquid film and dissipated by evaporation at the Liquid-air
interface, resulting in a relatively slow cooling rate (see Fig. 1.1). This regime can exist
even at a temperature several degrees above the Liquid saturation temperature, depending
on the surface roughness, surface material, iiquid properties, and droplet parameters
(velocity and droplet size).
The heat transfer associated with spray cooling involves three mechanisms:
droplet-wall impacting heat transfer, air convective heat transfer, and thermal radiative
heat transfer. When the surface temperature is not extremely high, radiative heat transfer
is negligible. The air convective heat transfer consists of convection due to bulk air flow
and local turbulent convection induced by the presence of droplets in the air. While the
convective heat transfer is complicated, it is smaii relative to the droplet impact heat
transfer. Therefore, the heat transfer in spray cooling is mainly determined by the droplct
impact heat transfer, which is dependent on the impact dynamics of the droplets.
Knowledge of the behavior of individual droplets impact and evaporation on hot surfaces
is essential to the prediction of spray cooling heat transfer and the design of the spray
cooling equipment.

When droplets travel through air to strike the hot surface, the droplet impact
behavior is mainly governed by the initial droplet kinetic energy. After impacting on the
surface, the droplet will overcome the surface tension force so that it spreads out.
Droplet impact can be charactenzed by the Weber number, We, which is defined as the
P u 2 d A ratio of droplet inertia forces to surface tension forces ( We = ' O ). W e droplet
impact dynamics affect heat transfer between the surface and impinging droplets, heat
transfer may also affect droplet impact. When droplets approach a surface at very high
temperature, they evaporate, producing vapor- As a droplet moves towards the surface,
the vapor pressure between the surface and the impacting droplet may offset the droplet
momentum, pushing the droplet away from the surface. Consequently the dynamics of
the droplet impact at high surface temperature is different from that at low temperature.
While the droplet Weber number greatly affects the droplet dynamics and heat
transfer, other properties of the liquid, such as the liquid-solid contact angle and bubble
density, also have substantial influence on droplet heat transfer. The Liquid-soiid contact
angle, which determines droplet surface wetting, plays an important role in droplet
dynamics and heat transfer. Low contact angle ailows the liquid to generate bubbles
easily, resulting in higher nudeation rate. Droplets spread out more on the surface,
producing a greater contact area between the liquid and surface. In particular, surface
wetting can be enhanced by dissolving surfactants in spray water to reduce the Liquid-
solid contact angle. Besides the effect of contact angle, nucleation sources and bubble
coalescence are also important in droplet boiling. Dissolving gases in the Liquid is known
to enhance pooling boiling by increasing the nucleation density (You et. al., 1995).
Generally, droplet heat transfer can be altered not only by changing the droplet dynamics
but also by dissolving additives in the spray water to change droplet properties. To date,
many researchers have examined the effect of these additives on pool boiling, however,
no study has been done to investigate the effect of the dissolved gases and salts on droplet

boiling and spray cooling (Pike et al,, 1955, Torikai et. al,, 1970, Muiier-Steinhagen et.
al., 1987).
An extensive reviews of the literature on droplet impact dynamics and spray
cooling has been compiled by Bernardin et al. (1997b). In the next section, the literature
on heat transfer associated with the droplet impinging proçess and spray c w h g will be
briefly reviewed, with particular attention to studies on the effects of dissolved gases and
salts on droplet boiling and spray cooling.
1.2 Literature Review
1.2.1 Heat Transfer During Single Droplet Impact
The study on droplet heat transfer began with the observation of sessile droplets
in film boiling. A German medical doctor, J.G. Leidenfrost (1756) first observed that a
droplet levitated above a surface once the surface was hot enough. The study of the
Leidenfrost phenornenon was continued by many researchers during the nineteenth
century. However, most of these studies performed on droplet boiling were empïrical in
nature and only focused on sessile (stationary) droplets, which exhibit different behavior
from impinging droplets. In the 1950's, widespread application of spray cooling
motivated research into understanding the mechanism of droplet boiling. Tamura and
Tansawa (1959) fust systematically investigated droplet evaporation by plotting a boiiing
curve of the evaporation tirne versus the surface temperature. They found that the boiling
curve of a sessile droplet was very similar to that found for pool boiling. Droplet
evaporation can be categorized into four regimes: evaporation, nucleate boiling, transition
boiling, and film boiling. From then on, many experimental and numencal studies have
been done on droplet impact and modelling of the heat transfer between a droplet and

surface. These studies concentrated on three groups of parameters which influence the
droplet heat transfer effectiveness. The three groups are: the variables related to the
droplet (subcooling, size, impact velocity, impact direction, and thermal properties); the
variables related to the solid surface (shape and dimension, surface condition, and
thermal properties); and the variables related to ambient conditions (ambient aidgas
pressure and temperature, earth gravity).
Due to Limitations of the experimentd instrumentation, studies on droplet heat
transfer started with the film boiling regime and then moved on to other regimes since
droplets were relatively stable once levitated over a surface. Gorton (1953) found
experimentally that the thickness of the water vapor layer separating a liquid dropiet from
the surface during film boiling increased and heat transfer decreased with surface
temperature. An analytical approach was presented by Wachters et al. in 1966 to predict
the thickness of this vapor layer. Baumeister et al. (1966) developed a generalized
correlation of the vaporization t h e of a droplet in film boiling on a flat surface.
Following these studies on film boiling, numerous research studies were also
conducted to investigate heat transfer in other regimes. McGinnis and Holman (1968)
measured the heat transfer per &op landing on a hot surface and correlated this in terms
of variables related to the liquid droplets. Pederson (1970) studied the heat transfer during
impact on a heated surface of water droplets with diameters ranging from 200 to 4ûûpm
and approach velocities from 2.4 to 10.0 d s . The author showed that heat transfer
increased with droplet impact velocity and surface temperature had Little effect on heat
transfer in the film boiling regime. In this study, a definition of the heat transfer
effectiveness was first introduced, which was defined as the ratio of the actual heat
transfer due to the effect of the impinging droplets to the total heat transfer required for
complete evaporation of the Liquid droplets. Michiyoshi and Makino (1978) reported that
the boiling cuve in the nucleate boiling regime was a straight line parailel to the pool

boiling curve for a thin water film, no matter what material was used for the heated
surface and no rnatter what surface conditions were manufactured. Makino and
Michiyoshi (1979) continued this study to investigate the effects of the initial size of
water droplets on the evaporation on heated surfaces. Bolle and Moreau (1982) found that
the heat transfer effectiveness varïed as the inverse of the square root of droplet diameter.
Their findings were iater confirmed by Labeish (1994) and Inada and Yang (1993).
However, Shi et al. (1993) observed an increase in heat transfer effectiveness with
velocity below 350°C, but detected a decrease above the wetting temperature. Chandra
and Avedisian (1992) revealed that no transition from nucleate boiling to film boiiing
was observed on a porous surface at a swface temperature of 2ûû°C, uniike that seen with
a stainless steel surface. Inada and Yang (1993) conducted an experirnental study on the
meclianisms of miniaturization of sessile drops impinging on a heated surface at the
temperatures in the range corresponding to the transition boiling regime. The effect of
gravity on droplet boiling was investigated by Qiao and Chandra (1995). who reported
that nucleate boiling of droplets was not affected by a reduction in gravity but that
droplets could not be maintained in stable film boiling since the pressure of vapor under
droplets pushed them away from the surface.
These studies on heat transfer provided fundamenial insights into droplet boiling.
However, complete modeling of heat transfer in spray cooling process requires better
understanding of droplet impact dynamics. Observation of the impact is generally
accomplished using high speed photography techniques. Savic (1958) observed the
behavior of droplet impact with the aid of high speed cine photography and attributed the
breakup of the droplets during impact on a very hot s ~ a c e to vapor bubbles penetrating
the upper fiee surface of the droplets. Wacheters and Westerling (1966) successfully
investigated the impact and breakup of droplets striking a horizontal surface at 400°C
using a single-shot flash photographie technique. Their observations were confirmed later

by the findings of Boile and Moreau (1976), who investigated variation in the impact
behavior of droplets with varying Weber number striking a surface at temperatures up to
1200°C with the aid of high-speed film-based photography (7000 frames/s). Akao et al.
(1980) found that the criteria for classifying the droplet impact behavior for water in the
terms of Weber number also applied to other liquids (ethanol and acetic acid). Chandra
and Avedisian (1991) investigated the impact behavior of n-heptane droplets with We=43
impinging on a polished stainless steel surface at temperatures ranging fkom 24 to 250°C
with the aid of a single-shot photographic technique. They observed the droplet spreading
behavior, bubble formation, and measured transient contact angle during spreading. In a
fairly recent comprehensive study, Bernardin et al. (1997) built a complete picture of the
impact behavior of water drops impinging on a polished surface using both still and high-
speed photographic techniques.
1.2.2 Spray cooling of hot surfaces
The widespread application of sprays has motivated research with the goal of
predicting heat transfer in spray cooling. Mizikar (1970) investigated the parameters
which influence heat transfer in spray cooling using commercial full cone nozzles. These
parameters include spray mass flux, mean drop diameter, drop velocity, angle of
impingement and wetting. Mass flux was found to have a strong relationship to the heat
transfer. Hoogendoorn and den Hond (1974) snidied impacting water spray heat transfer
in the film boiling regime. They reported that droplet size and impacting velocity did not
have any significant effect on the overail heat transfer. Boue and Moureau (1982) also
studied film boiling heat transfer of water sprays impacting downward or upward on a
horizontal hot plate. Heat transfer correlations at various liquid mass fluxes were
obtained.

Although these studies provided information on impacting spray heat transfer, the
results could not be generalized. This is because each study was performed with specific
combinations of droplet size spectrum, velocity and liquid flux. Mudawa. and Valentine
(1989) developed heat transfer correlations for the transition, nucleate, and single-phase
regions using an electrically heated calonmeter bar exposed at one end to the spray.
Although these correlations were presented as functions of local hydrodynamic
distributions of the spray, they were confirmed later by Deiters and Mudawar (1990) to
be applicable to al l types of sprays (e.g., full cone, hoilow cone, flat). Klinzing et. al.
(1992) extended the studies to the f h and transition boiling regimes, In their study,
droplet diarneter was found to have a weak effect on heat transfer in film boiling for al1
the conditions tested. Sprays were classified into two regimes with respect to volumetric
flux (Q"): low flux sprays (Q"<3.5 kg/m2s), and high flux sprays (Q'53.5 kglm2s). While
mass flux had a significant influence on film boiling in both regimes, drop velocity was
important only for high flux sprays. Most of the experimental studies mentioned above
focused on relatively low mass flow rates less than 2 kg/m2s. Ciofalo et al. (1999)
conducted an experimental study on spray cooling of hot wails with mass fluxes fiom 8
to 80 kg/m2s, mean droplet velocities from 13 to 28 mls, and mean droplet diameter fiom
0.4 to 2.2 mm. The single-phase heat transfer coefficient and the maximum heat flux
were found to be dependent upon the mass flux and the droplet velocity, while the droplet
size had a negligible independent influence.
Pais et al. (1992) assessed the eEect of surface roughness on heat transfer in spray
cooling. In spray cooling of a heated surface, variations in the surface texture were found
to influence the flow field, altering the maximum liquid film thickness, the bubble
diameter, vapor entrapment, bubble departure characteristics, and the ability to transfer
heat. The authors revealed that the maximum heat flux increased with the decreasing
surface roughness. The changes in surface roughness associated with spray quenching

were also studied experimentaliy and statisticaiiy by Bernardin et al. (1996). Pitting and
other small scale roughness features up to about 25pm increased the bubble nucleation
density during the transition and nucleate boiling regimes, while blisters and other large
roughness features on the order of a droplet size (25 to LOO pm) influenced the impact
and spreading of the spray droplets and, consequently, the Leidenfkost temperature.
Choi and Yao (1987) investigated film boiling heat transfer to a horizontaiiy
impacting spray. The authors reported that heat transfer was mainly controlled by the
liquid mass flux. This study was extended by Yao and Choi (1987) to test the nIm boiling
heat transfer of vertically impacting sprays. The surface orientation was found to play an
important role in heat transfer. The film boiling heat flux in the vertically downward
impacting spray was always higher than that in the corresponding horizoataüy impacting
spray. This increase was attributed to secondary impactions due to rebounding droplets.
This was confirrned by the findings of Groendes and Mesler (1982), who reported that
the vertically impacting spray had about 1.5 times greater effectiveness, in terms of liquid
evaporation, than the horizontaily impacting spray. Whiïe the surface orientation was
found to affect the heat transfer in these studies significantly, this effect was not obtained
in a recent study (Qiao and Chandra, 1998). Qiao and Chandra (1998) assessed the effect
of the surface orientation by spray cooling of a surface held in three different
orientations: horizontal facing up; vertical; and horizontal facing down. No significant
difference in heat transfer was observed between the three cases. They believed that the
results were caused by the difference in the operation conditions. Since the test surface
was smaller and the droplet impacting velocities were much higher than those used by
Choi and Yao (1987), most of the impacting droplets rebound off the test surface,
resulting in very few secondary impactions.
1.2.3 Effeet of DissOIved Gases on Boiling

Dissolved gases are known to influence boiling heat transfer. McAdam et al.
(1949) first investigated the effect of dissolved air on forced-convection, subcooled
nucleate boiling of water. A strong enhancement of the boiling curve at the lower heat
fluxes (partially developed nucleate boiling) was observed when air was introduced.
However, the dissolved gas effect was weak in single-phase heat transfer and in fully
developed nucleate boiiing. Similar observations for pool boiling were made by Pike et
al. (1955) from experiments with boiling on a nickel wire in water and by Behar et al.
(1966) for boiling on a stainless steel tube in metaterphenyl. Torikai et. al. (1970)
measured the incipient waU superheat using pIatinum wires immersed in water under
reduced pressure conditions (0.05 to 1.0 bar), showing a decrease in superheat with
increased dissolved air content. Murphy and Bergles (1972) reported decreased wall
superheat at incipience and enhanced heat transfer coefficients during low-heat-flux flow
boiling when a stainless steel tube was heated in R-113 saturated with air.
Gas bubbles were found (Lorenz et. al., 1974) to initiate nucleation in the liquid.
This effect was confiied by the findings of Young and Hummel (1964), who observed
heat transfer enhancement by adding spots of Teflon either on the heated surface or in
pits on the surface. They attributed the enhancement to the gas or vapor trapped and held
in crevices of the Teflon coating. Nucleation was initiated by the presence of the trapped
gas at very low superheat levels. Since there was an abundance of available sites, the
number of active sites increased rapidly as the superheat increased. The observation that
entrapped gas in surface cavities facilitated the initia1 nucleation process was dso
confirmed by the experiments in which steps were taken to eluninate entrapped gas in the
cavities (e.g. Kosky, 1968). In the experiments, the system was pressurized prior to
heating to increase the solubility of gases in the liquid and to drive liquid into crevices in
the surface, thereby eliminating most of the cavities as nucleation sites. When this was

done the superheat required to initiate nucleation was found to be of the same order as
that required for homogeneous nucleation.
More recentiy, You et al. (1995) presented the effects of dissolved gas content on
pool boiling heat transfer fiom a horizontal cylinder in an electronic cooling fluid (FC-
72). They observed that the dissolved gas liberated from the fluid in the vicinity of the
heating element during boiling enhanced pool boiling heat transfer. The authors discussed
the effects of dissolved gas on boiling incipience by considering a surface cavity (show
in Figure 1.3), which had an existing nucleus containing vapor and non-condensable gas.
The effective embryonic bubble size, r,,, under gas-saturated pool boiling was calculated
using a force balance:
I VapodGas Phase
Figure 1.3 Local and bulk thermodynarnics States for
a gassy saturated iiquid

The pressures, P,, and P, indicate, respectively, the gas partial pressure, w i t h the
bubble and within the vapor/gas mixture over the flat interface above the buk Liquid.
Assuming Henry's law to be vaiid for the moderate pressures investigated, the partial
pressure of the dissolved gas in the bubbles was determined in tenns of the liquid
temperature: Pg=xH(TW). The presence of dissolved gases may reduce P,, and, thus,
reduce the inci pient superheat value for the same cntical bubble radius, r,, under the same
total pressure, PPP ,+P , . Although the dissolved gas was proved to promote bubble
nucleation, detailed measurements on the effect of dissolved air content in FC-72 on
incipience showed that only when the dissolved gas content became high (>0.005
moles/mole) would the dissolved air have an effect on boiling. This behavior was
attributed (You et al., 1990) to a localiy degassed fluid layer very near the boiling sites,
in which the gas was convected away fiom the heated wall via departing bubbles during
boiling. For low-to-moderate concentrations, a larger superheat was required to initiate
boiling and a hysteresis was observed between boiling curves taken with increasing and
decreasing heat flux steps.
The influence of the dissolved gases (He, N,, Ar, CO,, GH,) on boiling was aiso
observed by Muller-Steinhagen et. al. (1987) for flow of water and of n-heptane in an
annulus with a heated core. It was found that the heat transfer coefficients were always
increased by the presence of dissolved gases relative to the case without dissolved gases.
The extent of the increase depended on the solubility of the given gas in the given liquid
and couId be as much as severai hundred percent. Carbon dioxide, which has the highest
solubility in water, was found to produce the biggest enhancement of heat transfer. In
addition, the wall superheat required for the inception of bubble formation was reduced
considerably to far below the saturation temperature of the pure liquid. In all these
studies, the enhancement of heat transfer was not attributed to the reduction of surface
tension. This was confirmed by Lubetkin et. al. (1996). They designed and built an
apparatus to ailow the measurement on both contact angle and surface tension under
pressure. The surface tension of water was found to change from about 72 mN/m to about
57 mN/m as the presence of CO2 was increased nom 1 to 11 bar absolute. Therefore, the
presence of dissolved gases did not change the surface tension of water at normal
pressures.
Jeschar et al. (1996) studied the influence of dissolved gas in cooling water on
heat transfer during immersion quenching of a hot metal surface. It was found that high
concentrations of dissolved gases yielded stable vapor films, leading to low Leidenfiost
temperatures. In this study, saits were dissolved in the cooling water to control the
concentration of dissolved carbon dioxide. Salts displaced the dissolved gases from the
water, increasing the Leidenfrost temperature. The higher the salt concentration, the
lower the gas concentration thereby increasing the Leidenfrost temperature. If the salt
concentrations were high enough to reduce the gas concentration to a minimum, or the
cooling water was degassed, the vapor film feu apart just after immersion. While the
dissolved gases affected the heat transfer in this case, the exact effect of the dissolved
gases on heat transfer was not completely understood since the dissolved salts may also
influenced the quenching process. Tinker et. al. (1995) assessed the effect of dissolved
gases on dropwise evaporative cooling in the nucieate boiling regime for surface
temperatures ranging from 110°C to 180°C. Their results also found that the effect of the
dissolved gases was to enhance the heat transfer for small surface temperature drops,
however, the effect was small for large surface temperature drops.
1.2.4 Effect of Dissolved Salts on Boiliag
Dissolved salts in the liquid may have different effects on the heat transfer,
depending on the heat transfer mode. Ranz and Marshali (1952) were the first to snidy

evaporation of an aqueous salt-solution drop suspended from a fiber. Other studies was
conducted by Trommelen and Crosby (1970), Tanno et. al. (1988), and Taniguchi et. al.
(1999) to investigate the heat and mass transfer during evaporation and provide
correlations to predict the evaporation rate. Salts were found in these studies to reduce the
vapor pressure and thus decrease the drop evaporation rate.
While dissolved salts always reduce the droplet evaporation rate, the effect of
salts on boiling heat transfer is complex and extends into many disciplines. Heat transfer
to electrolyte solutions is a common engineering problem in the chernical and
petrochemical industries. Nevertheless, only a few experimental investigations of heat
transfer to electrolyte solutions can be found in the literature. Cryder and GiUüsnd (1932)
reported that heat transfer coefficients were decreased by the addition of Na2S0, to
boiling water for heat fluxes below 50,000 W/m2. Jarnialahmadi et. al. (1990) employed a
precise pool boiling test apparatus together with video equipment to investigate the effect
of dissolved CaSO, on the heat transfer coefficient. The heat transfer coefficient first
sharply decreased with time to a minimum, followed by an increase to a maximum and a
subsequent gradual decrease towards an asymptotic value. This behavior was attributed
to the variation of nucleation sites with t h e . When the experiment started, the nucleation
sites on the surface were few and the heat transfer was reduced by the formation of the
deposits on the surface. The number of nucleation sites increased with increasing
deposits. When the heat transfer coefficient decreased to a minimum, the formation of
deposits started to enhance the heat transfer by increasing the nucleation sites. Finaiiy,
the thermal resistance caused by the deposits offset the increase in nucleation sites,
resulting in a gradual decrease in heat transfer coefficient.
Najibi and Muller-Steinhagen (1996) performed a wide range of expeciments to
determine the effects of various dissolved saits on forced-convective, pool boiling, and
subcooled flow boiling heat transfer. They also investigated the effect of dissolved salts

on bubble size and nucleate site density with aqueous solutions of a number of salts. It
was found that different salts had different effects on boiling heat transfer, depending on
the heat flux and the solubility of the salts in water. Forced convective heat transfer
decreased with increasing ionic strength of the solution and this effect was more
pronounced for salts whose solubiiity in water decreased with increasing temperature,
these salts precipitated on the heater surface fotming a thermal barrier.
The effect of dissolved salts on immersion quenching was investigated by Jeschar
er al. in 1996 using various salts: NaCl, CaCL,, Mgch, Na2S0,, NaHCO,. The authors
observed that dl salts added led to an increase in the Leidenfrost temperature, Mihile
sodium chloride (NaCl) showed a relatively small influence, magnesium chloride
(MgCLJ showed effects even with small concentration. No reason for the clifference in
the effects was presented in this study.
1.2.5 Effect of Additives on Spray C w h g
The effect of additives on spray cooling has been investigated by several
researchers. Qiao and Chandra (1998) examined the effect of surfactants on spray cooling
by adding sodium dodecyl sulfate (SDS) to distilled water. The surfactant was observed
to enhance nucleate boiling heat flux by up to 300 percent at all mass fluxes and impact
velocities. They attributed the enhancement to the promotion of homogeneous vapor
bubbie nucleation and foaming in spray droplets by surfactants.
Salts, as another kind of additives, are known to have the similar effect of
producing foaming in liquid. Addition of salts to water has been applied in fire fighting to
obtain several advantages. Usually, water below 0°C will freeze, thus posing a limitation
in low temperature operations. Certain additives, if selected properly, not only can
suppress the freezing point of water but also can improve its fire suppression

effectiveness (Grove et al., 1962). This enhancement is essential to fue fighting since
water usually is not partïcularly efficient in fire suppression unless it is delivered in the
fonn of a mist, which does not penetrate through air easily. Compared with smaU
droplets, large droplets have less resistance and can travel more easily through air.
Although large droplets of water can be deiivered easily, they are less effective since
their surface-to-volume ratio is small, Besides the effect o f the droplet size on fire
fighting, the characteristics of water also limit its application in f ~ e fighting. First,
because of its low viscosity, water rapidly runs off the hot surface. Second, water's
continued bIanketing ability is lirnited. Third, water has relatively poor reflective powers.
Adding salts in water may change these limitations and reduce them. In addition, the
efficiency of large spray droplets may also be increased by the dissolved salts. Therefore,
the large water droplets might approach the efficiency of the small m i s t droplets in
extinguishing a flame while retaining the ability to penetrate air easily than mist droplets.
Finnerty (1995) reported that some water-based agents, if chosen properly, were
much more effective than pure water when applied to fire fighting. Adding salts to water
may increase the rate of fire suppression by more than 100%, allowing for reduction in
the amount of extinguishing agents used for fire fighting. Thirteen salts were chosen in
his experiments and their effects were thoroughly examined, however the mechanism
associated with the effects of these salts was not explored. The concentration of salts in
water was very high in these experiments, in the range of 5% to 60% by mass. The
evaporation of solutions with high concentration of dissolved salts generated a heavy
residual layer on the buming surface, isolating it from fresh air. The effects of salts on
fire fighting are interrelated, so the effect of salts on nucleate boiling is unclear in this
process.
As mentioned above, foaming may play an important role in heat transfer during
droplet boiling and spray cooling. Foaming, as we know, is caused by prevention of

bubble coalescence. Inorganic electrolytes are known to always reduce the degree of
bubble coalescence in stagnant liquids (Oolman and Blanch, 1986; Lesard and Zieminski,
197 1); and in gas-liquid contactors (Marrucci and Nicoderno, 1967; Rince and Blanch,
1990). Marrucci (1969) was first to construct a theoretical analysis of bubble coalescence
in a gas transfer field. A transition concentration was found to exist in this foaming
process. Once the concentration of a substance in water reaches this threshold, bubble
coalescence will be prohibited completely. This theory has been proven and developed in
investigated gas-transfer processes of chemical engineering. However, the detailed
mechanism involved in this foarning phenornenon during droplet boiiing or spray cooling
has not been investigated thoroughly and needs further study.
1.3 Objectives
The main objectives of the present work are:
1) to determine the effect of the dissolved gases on the boiling heat transfer of a water
droplet impacting on a hot surface,
2) to examine the effect of the selected salts on the boiling heat transfer of a water droplet
impacting on a hot surface,
3) to understand the effect of selected salts on spray cooling effectiveness.
To fûlfil these objectives, the following experiments were carried out:
1) First, we observed the boiling of water droplets in which carbon dioxide was dissolved
to the saturation concentration at the pressure of 1 bar on a hot surface. Surface
temperature was varied fkom 100°C to 330°C, a range covering ai l the heat transfer
regimes from single-phase evaporation to film boiling. Droplet evaporation on a
stainless steel surface after impact was recorded using a video camera. Droplet impact
on the surfaces at high temperatures, in which droplets were in transition or film

boiling, was photographed using a single shot photographie technique. The initial
droplet diameter was held constant (2.02 mmH.02mm). The ambient temperature and
arnbient pressure were kept constant at 22°C and atmosphenc pressure, respectively.
2) Secondly, we performed an experhental investigation of the effect of dissolved salts
on droplet boiling using the same procedures as those used in the f m t study. N a m ,
was first chosen to test the effect of the dissolved sdts. We then investigated the
combined effects of the dissolved gases and salts in water by dissolving NaHCO, in
water, since the NaHCO, will decompose to form CO, when it is heated. Based on the
results obtained fkom these two experiments, we conducted an intensive experirnental
study of the effect of five dissolved salts (Na2C03, NaHC03, NaCl. NqSO,, MgSO,) to
eIucidate the mechanisms associated with the boiling of droplets containhg dissolved
salts.
3) Finally, we conducted experiments on the spray cooling of a hot surface by water
sprays in which salts were dissolved. The effect was measured by testing transient heat
flux during spray cooling of a 25.4 mm diameter hot surface plated with nickel. The
surface was an end of a copper cylinder, in which four thermocouples were inserted
dong the axis. The heat transfer was calculated by solving an inverse heat conduction
problem. The surface was photographed during quenching using a 35 mm camera. The
parameters covered in this study included: the dissolved salts and their concentration
in water (0.06 moVL to OAmoVL), spray mass flux (0.5 to 3.0 kglm2s), droplet impact
velocity (16 to 23 m/s) and mean droplet diameter (0.54 to 0.70 mm).

2. EXPERIhlENTAL APPARATUS
To implement the objectives of this study, two experirnentai systems were setup
to investigate the effect of dissolved additives on droplet boiling and spray cooling. They
are the single droplet experiment system and the spray cooling experiment system.
2.1 Boiling of Single Droplets on a Hot Surface
The effects of dissolved additives on water droplet boiling were investigated by
photographing droplet evaporation with different cameras and measuring lifetimes of
water droplets on a hot surface. ln this study, water was prepared by first puriQing tap
water and then dissolving salts or carbon dioxide into it.
2.1.1 Experimeatal Setup for Boiling of Single Droplets
The apparatus shown in Figure 2.1 was used to record the impact and boiling of a
single droplet on a hot surface. It consisted of a droplet generation and delivery system, a
heated test surface, and a camera. Droplets were formed by allowing water to flow from
the tip of a 33-guage stainless steel needle held 50 mm above the test surface. In the tests,
the needle valve mounted on the upstream of the needle was employed to successfidly
reduce the flow rate of water to a very low value. This adjustment produced uniform
droplets. Droplets detached and fell under their own weight onto the test surface. The
impact velocity of droplets was estimated from the distance between the needle tip and
the test surface to be l d s . The diameter of pure water droplets generated ftom the
needle tip was 2.W0.2 mm, hence the droplets impacted onto the test surface with the

white diffuser
flash unit
needle hypodermic p optical , intempter
w vacuum pump
I I 1 test surfac 35mm
\'A - 1 , '
camera I
0 0 0 0 0 0
1 time delay
Figure 2.1 Schematic diagram of single droplet experimental apparatus

Weber number of 29. The test surface, 50.8 mm square and 6.35 mm thkk, was made of
stainless steel and finished with 600 grit emery cloth and metal polish (Part#1130607,
Eagle One Industries, Irvine, CA.). The test surface was mounted on a copper block that
housed two 125 Watts cartridge heaters (Firerod43AlO8, Waitow, St. Louis, MI).
Chromel-Alumel thermocouples were used to measure surface temperature, which was
held constant to within HS°C by a temperature controller (CN 9000A, Omega
Engineering, Inc., Stamford, CT) regulating power to the cartridge heaters. During
experirnents the surface was cleaned with a cotton swab soaked in distilled water after
each droplet test. The droplet delivery system was cleaned using an ultrasonic cleaner
(Mode1 25 10, Bransoa, CT) before each different salt was tested.
The tests were done within a temperature range from 60°C to 340°C, which
encompassed al1 the heat transfer regimes. During the experiments at temperatures above
the Leidenfrost temperature, radiation fiom the heater block was high enough to warm
the needle significantly. To isolate the needle fiom the radiation heat and prevent the
droplets from striking the surface during heat-up, a stainless steel plate covered with
insulation material, was placed well below the needle. This shield was removed fiom the
test surface just before the droplet detached from the needie in each test.
2.1.2 Photography Techniques
Three cameras were employed in this study to photograph dropiet impact and
evaporation on the hot surface. Droplet impact on the hot surface was photographed using
a digital camera. A video camera was used to record droplet evaporation, while a film
camera was used to obtain consecutive stages of droplet evaporation.
Photographs of droplet impacts were taken using a single-shot flash photographic
technique, which provides much better image quality than c m be obtained using high

speed ciné cameras (Chandra and Avedisian, 1991). To capture crucial instances of the
impact with high resolution, a 35 mm camera (Nikon F3) equipped with a bellows and a
105 mm zoom Lens was employed. Sharp, high contrast photos were possible by using a
high resolution film, TMAX 400, and a high intensity, short pulse flash. The flash with
duration of 8 ps was produced usbg a General Radio Strobotac 1538-A stroboscope. By
varying the time delay between the instant of droplet impact and the triggering of the
flash, different stages of droplet impact could be photographed. The droplet detection
technique used by Qiao and Chandra (1997) was used to tngger the flash.
The detection mechanism was composed of a H21A1 optical interrupter and a
detector circuit. The operation of the detector was as follows. As the droplet feU from the
hypodermic needle and passed through the slot of the optical interrupter placed 5 mm
below the tip of the needle, it scattered the light received by the interrupter's
phototransistor and reduced the voltage of the interrupter's collecter, sending a pulse to a
time delay circuit. The time delay circuit filtered and amplified the signal, sending two
signals to trigger the stroboscope and camera shutter separately. The time delay from the
instant the droplet passed through the beam to the time the stroboscope fued was
controlled by varying the time delay circuit. The reference delay time corresponding to
the commencement of droplet impact was set by trial and error.
The camera switched on upon receiving a trigger. It took 42 rns to open the
shutter. Setting the camera exposure time at 1/8 s and triggering the flash during the
exposure interval gave a fiash deIay t h e variable from a minimum of 42 ms to a
maximum of 167 ms. Droplets took approximately 100 ms to faIl fiom the needle tip to
the test surface. Droplets were photographed up to 20 ms after the instant of impact. The
illumination provided by the flash was much brighter than the ambient light, so that the
film was effectively exposed only during the 8 p flash duration, even though the camera
shutter was open for 1/8 S. Several photographs were taken for a single set of operating

conditions before adjusting the t h e delay to capture a later stage of impact. The droplet
release and impact were sufficiently repeatable that the entire droplet deformation
process could be reconstructed fiom photographs of different droplets, captured at
progressively advancing stages of impact. The flash duration (8ps) was short enough to
elirninate any blumng of photographs due to droplet motion, providing vital information
about such details of impact such as film spreading, bubble formation, and droplet
breakup.
Photographs of droplet evaporation were taken using a flash unit (Nikon F-28)
and a 35 mm camera (Nikon F3) with a motordrive capable of advancing fiames at the
speed of 6 frames per second. The shot tirne was varied by a data acquisition and control
system (DAC). Once the droplet detached and crossed the optical interrupter, it generated
a peak to peak pulse through the tirne delay circuit (the delay tirne was set O ms) to the
data acquisition system. Setting the flash at the speed of 1/10ûûs ailowed the camera to
take high quality photographs of droplet evaporation.
Droplet evaporation was also recorded using a CCD camera (TM-745E High
Resolution CCD Shutter Camera). Droplet iifetime was measured by counting the tirne
from droplet impact to the end of evaporation. Uncertainty in measurement of droplet
lifetime was estimated to be 1/30 s depending on the recording speed of the Video
Cassette Recorder. Droplet-surface contact diameter was measured by importing video
images into a computer-based image analysis package (Image Analyst, Automatix Inc.),
calibrated using the image of 1.6 mm diameter bal1 bearing. The resolution of Our
measurements, corresponding to the size of one video pixel, was f 0.02 mm. We
measured liquid-solid contact angle variation during droplet evaporation by using image
analysis software to detect the liquid-air interface at the edge of a droplet, and
approximate it by a straight line. The contact angle lay between this line and the plane of
the solid surface. The uncertainty in our measurement of contact angle was estimated to

Figure 2.2 Liquid-solid contact angle (8 ) measurement fkom an image of a water droplet taken by a video camera.

be k2'. Figure 2.2 shows measurements of the contact angle and contact diameter of a
droplet evaporating on a hot surface.
2.1.3 Preparation of Test Water
The water used in our experiments was successively distilled, deionized and
degassed to miaimize the presence of dissolved chemicals and gasses. Distilled water was
deionized in a NANûpure Bioresearch Deionization System (Mode1 #D4754, Barnstead
Themolyne Corporation) to an electrical resistivity of 18.3 MQ-cm. The method most
frequently used to degas a liquid is to boil away 10 to 20% of the solvent under vacuum.
This method is effective, but is wastefd of iiquid. In this study, degassed water was
prepared by fieezing the liquid and then pumping down the container. Figure 2.3 shows
the experimental apparatus for degassing the water. A stainless steel chamber (88.9 mm
diameter and 152.4 mm height) was fdled with deionized, distilled water and placed in a
Dewar flask fiiled with dry ice. Once the water fioze the space above it was evacuated for
over an hour. The water was then ailowed to melt, after which the freezing and
evacuation process was repeated two more times.
Salt solutions were prepared by dissolving the required amount of powdered salts
(99.7% pure, ACP Chemicai Inc.) in distilled, degassed water at room temperature, and
then allowing the solution to stand for about 12 hours to ensure complete mixing. The
salts used in this study were: NaCl, Na,SO,, MgSO,, Na,CO,, NaHCO,. The salt solution
concentrations were well below their solubility limits in water. The solubiiity of
dissolved salts used in this study at room temperature can be found in Figure B.3 of
Appendix B (Stephen and Stephen, 1963).
Dissolving salts in the water may change the surface tension. Surface tension
values can be calculated by relating the surface tension to the droplet's weight (Adamson,

vacuum pwnp
Figure 2.3 Experimentai setup for dissolving CO,.

1982); during the droplet generation process, the droplet detaches from the tip of the
needle once its own weight overcomes the surface tension force. The liquid Wm formed
around the tip of the needle prior to detachment was so thin that the surface tension force
was assumed to equal the droplet's weight. The surface tension values of water droplets
were determined using Tate's law, W=zD,a, where W is the measured weight of one
droplet, D, is the outer diameter of the needle (supplied by the manufacturer) and a is the
surface tension of water. Since the droplets in free f d were spherical, the weights of
droplets could be calcuiated fiom measuring the droplet diametter. Our measurements of
the surface tension of pure water agreed well with the data reported in the literature.
Diameters of droplets falling after detachment were found to be 2.0I0.02 mm in ali our
experiments. There was no measurable difference between the diameter of droplets in
which any of the selected salts was dissolved, fiom which we concluded that the salts did
not significantly change surface tension. Revious measurements of the effects of these
additives on the surface tension of water (International Critical Table, 1933) confirm that
they have Little influence at low concentration. During the experiments, the repeatability
of these measurements was verified by photographhg five different droplets at the same
instant after detachment.
The basic setup used to study the boiling of single droplets containing dissolved
gases is the same as the apparatus described for the study of salt additives, see Fig. 2.1.
Once water was distilled and degassed, carbon dioxide was dissolved directly in water
contained in the stainless steel vesse1 used for degassing water by pressurizing it with gas
at 1 bar fiom a carbon dioxide tank for two days. The reservoir was shaken occasionaily
to speed up the diffusion rate of carbon dioxide into water. A Natelson microgasometer
(Mode1 #650, Scientific Industries Inc.) which adapts the classic Van Slyke (1924)
manometeric method, was used to detennine the gas content. Detailed information is
provided in Appendix C. During the measurement process, water was first transferred by

collecting water via the valve at the bottom of the container to a bottle and then m e a s u d
by the Natelson microgasometer. The carbon dioxide content of water measured in these
tests was typicaily 0.74 mm3/mm3 (at STP), which is close to the sahirated value,
0.75 mm3/mm3 (at STP), reported in the Literature (Fogg, et al. 199 1). The diameter of the
droplets containing dissolved carbon dioxide was measured using the same m e h d as
above. The diameter was found to be 2.0.02mm. Dissolving carbon dioxide into water
did not change the surface tension of the water under the pressure of 1 atm. This
measurement agreed weli with the data reported by Jho et al. (1978).
2.2 Spray Cooling of a Hot Surface
Experimental techniques used for measuring heat transfer during spray cooling
can be classified into two categories: steady state and transient methods. In steady state
expenments, heat transfer rates are denved fiom a thermal balance between the (usually
electric) power input into a soIid body and the heat transferred to the spray. This
application is usuaily Limited by the maximum attainable power densities. Moreover, in a
power-controlled system it is very diffkult to maintain steady state conditions in the
unstable region of the heat transfer curve (transition, or partial film boiling). Because of
these limitations, steady state rnethods have usualiy been confined to investigations
involving low heat transfer rates.
In transient experiments, the target is typically heated to a uniforrn high
temperature and then rapidly cooled by the spray while the temperature histories at one or
more locations within the sample are recorded. The surface heat flux and temperature c m
be calculated fiom the raw experimental data by smoothing the data and solving an
inverse heat conduction problem. In the transient method large heating power is not

needed because it is not wcessary to maintah a steady state condition. Therefore, this
method is commonly employed in the study of spray cooliag where the heat flux is high.
Transient spray cooling tests are usually conducted under the assumption that,
despite the the-dependent conditions of the measurements, the relationship between wall
temperature and wall heat transfer rates is the same as that observed under steady state
conditions. This is justified by the fact that the tirne constants characterizkg the impact,
spreading and vaporization of an individual droplet are usually much shorter than the
time constants of the overaii cooiing transient. In addition, previous studies (Mudawar,
1994, Qiao, 1996) show that the boiling cwve associated with transient state spray
cooling is identical to that determined fiom steady-state rneasurements. In the present
study, the transient spray cooling rnethod was used.
The apparatus shown in Fig. 2.4 was constructed to examine the effects of
dissolved salts on spray cooling. The main components of the system setup are a water
delivery system, a spray nozzle, a heat block, and a data acquisition and control system.
The water delivery system consisted of a water supply tank, a turbine pump
(CT9755, Burks Pumps, Pique, OH), a check valve, a needle valve, and a tubing system.
The turbine pump circulated water through the stainless steel tubing and valves to the
spray nozzle. Only a portion of the total flow delivered by the pump was actually
supplied to the nozzle, whiie the balance was bypassed through the release valve to the
supply tank. The flow rate of water supplied to the nozzle was measured by a flow meter
(GF1360, Gilmont Instruments, Barrington, IL). It was controlled by adjusting the
pressure regulator (26 A, Watts Regulator Groups, North Andover, MA) and fine tuning a
micrometer valve. The flowmeter has a resolution of lrnlhin. The nozzle inlet pressure
was measured using a digitai pressure gauge (OMEGA DPG-500) with an accuracy of
7kPa, which was situated just upstream of the spray nozzle. The spray hydtodynarnic
parameters (i.e. volumetric flow rate Q", impact velocity U,,,) were controlied by varying


the flow rate and the nozzle pressure. After impinging upon the heated surface, the vapor
generated was exhausted fiom the test chamber through the front, wtiile the unevaporated
liquid was collected and discharged through a drainage tube at the bottom of the test
chamber.
The heat block and spray nozzle were housed in the aluminum chamber (152 mm
long x 152 mm wide x 254 mm high), which was mounted on a rotation stage. The fiont
of the chamber was open, while a clear plastic window in the rear ailowed the test surface
to be illuminated by a flash unit (Nikon Speedlight 5B-28).
The heat block shown in Figure 2.5 was composed of heated body, two electric
heaters, and insulation wool. The test cylinder shown in Figure 2.5a was made of oxygen
free copper. The surface was polished and nickel-plated to a thickness of 1Opm to
minimize oxidation and corrosion. The bottom of the test cylinder was bolted to a heat
copper block that housed two 5ûûW cartridge heaters (see Figure 2.5b). The test cylinder
was surrounded with silicon rubber to seal ancl insulate the test cylinder, while the heat
copper was insulated with mineral wool to reduce losses. Four 0.5 mm diameter
Chromel-Aumel K-type thermocouples (KMTSS-020G-6, Omega Engineering, Inc.,
Stamford, CT) were inserted into holes drilled 6.35 mm apart dong the a i s of the heated
body, with the f ~ s t thermocouple positioned 0.4rn.cn below the test surface (Figure 2.5 a).
To further enhance the transient response, high thermal conductivity paste was applied
during the installation of the thennocouples to ensure excellent contact between the
copper and the thennocouple bead. The temperature registered at the top thermocoupie
was considered to be the initial surface temperature and held at 240°C (within f l°C) by
regulating the power to the heating cartridge. The heater was turned off dunng spray
cooling. The real surface temperature during the spray cooling processes was
extrapolated from measurements by thermocouples embedded beneath the surface,
assuming one-dimensional heat conduction within the test surface.

4 holes with 4-40 threads, 3mm deep, equally spaced on a 9.5 mm dia circle
I \ 6 holes with 6-32 threads, equally spaced on a 38 mm dia circle
Holes for thermocouptes 4 holes 0.8 mm dia
SECTION A-A
Figure 2.5a Test cylinder dimensions and themocouple positions

1 ' 2 holes, 12 mm deep, 6-32 thread
SECTION A-A
Figure 2.5b Dimensions of the copper heater block
The spray nozzle was located normai to the test surface. Spray mass flux was measured
by collecting water into a lûûml graduated cylinder through a copper tube with the same
intemal diameter as that of the test surface and dividing the volume of collected water by
the product of the f f l tirne and inlet area. The inlet of the collecting tube was ptaced at
the same distance fiom the spray nozzle as the test surface. Uncertainty in measurement
of the flow rate was estimated to be k4%. Since the salt concentration used in the test
water was so low that the density of water did not change significantly, the change in
mass flux due to the additives was found to be less than the uncertainty in measurement.
In the experiments, NaCl, Nago,, NaHCO,, Na,SO,, and MgSO, were chosen as
the test salts. The effects of different dissolved salts on spray cooiing were studied using
0.06 mol/L as the typical concentration, while the effects of the salt solution
concentration on spray cooling was examined using MgSO, with varying concentrations,
specificaily 0.01,0.06,0.2, and 0.4 mol/L. Fresh salt solutions were prepared before each
experiment by weighing and dissolving the selected salt into distilled water, and stirring
the water in the tank with a stainless steel bar by hand for 5 minutes to keep the solution
concentration uniform. The water was distiiied using a distilling system I#MP-1,
Barnstead Mega-Pure System) immediately prior to use to minimize the presence of
dissolved gases.
The test surface was prepared by cleaning it with metal polish (Part #1 l3Oûû5,
Eagle One Industries, Irvine, CA) and washing it first with acetone and then with distilled
water before each test. The water detivery system was purged by disconnecting the
suppIy tube downstream of the pressure regulator and pumping the water out of the
reservoir to an open plastic tank for 30 S. This pumping process was conducted to reduce
the effect of corrosion in the turbine pump. The tube was disconnected to prohibit the
water fiom routing through the release valve back to the supply tank. Mer flushing the
pump with the salt solution, the system was reconnected and the heaters were then

switched on to warm the test surface. This process was continued until the surface
temperature, as measured by the uppemost thermocouple, was stable at 240°C. The
pump was activated to flush the tubing system and the spray nozzle for 30 s, with a
plastic plate held in fiont of the spray nozzle to shield the test surface. Once the nozzle
pressure reached the required steady value, the heaters were tumed off and the plastic
plate was removed to allow the water from the nozzle to spray on the test surface directly.
The test surface was cooled fiom 240°C to 9S°C in a period of 5s to 300s, depending on
the spray parameters. The output fiom the inserted thermocouples was first ampiified and
filtered using a 5B37 thermocouple moduIe, and then recorded using a PCI-MIO-16E4
board (National Instruments) in a Power Macintosh 7200/120 computer. The data
acquisition system was controiled using a LabVIEW program (refer to Appendix A for
details of the program).
Photographs of the spray cwling process were taken using a 35 mm film camera
(Nikon F3) with Kodak TMAX 400 film and the lens aperture set to 22. The camera was
triggered by the user through a SCB-68 board at specific preset surface temperatures. The
signal frorn the uppermost thenaocouple was processed using an OMNI AMP and input
through the SCB-68 to the computer. The uncenainty in the measurement of temperature
with the OMNI AMP was MST. The test surface was iiiuminated through the rear
window of the test chamber using a Nikon 5B-28 flash unit with a speed of 1/2000s,
while the rear window was covered with white paper to diffuse the incoming light.
Different spray cooling regimes can be distinguished by comparing the video images with
the simultaneously measured surface temperature.

3. EFFECT OF DISSOLVED SALTS ON DROPLET BOILING
3.1 Effect of Dissolved Salts on Droplet Boiling
Previous studies (Lessard and Ziemlliski, 197 1) reported that bubble coalescence
in aqueous solutions is largely inhibited above a critical concentration range of
electrolyte, the so-caiied transition concentration. While the transition concentrations of
salts are detennined possibly by many factors such as ionic strength, viscosity, size of
ions, they were found to be rough functions of the valence combinations of salts (Lessard
and Zieminski, 1971). When two 0.36 cm diameter bubbles were brought to contact each
other in a variety of electrolyte solutions, 3-1 and 2-2 electrolytes such as MgSO, and
A12C13 were observed to prevent coalescence in the concentration range 0.030-0*035M, 2-
1 and 1-2 electrolytes such as Na,SO, and MgC12 in the range 0.056-0.060M, and 1-1
electrolytes such as NaCl and NaBr in the range 0.16-0.23M. In this study, we attempted
to apply the results obtained from these previous studies on bubble coalescence in
chernical engineering to droplet boiling. So we chose one salt from each group to
investigate the effect of dissolved salts on droplet boiling. The chosen sale include NaCl,
Na2S0,, and MgSO,. Besides the three salts, sucrose was also used as an additive in this
study to distinguish the effect of ions from the effect of viscosity in that sucrose does not
ionize in soiution.
In order to examine the effect of salts on droplet boiling, we conducted
experiments on these salt solutions in a surface temperature range from 90°C to 220°C.
This temperature range encompasses al1 the droplet evaporation regimes: evaporation,
nucleate boiling, transition boiling, film boiling. The concentration of dissolved salts in
water was nominally 0.06 molK.

Figure 3.1 shows the evolution of droplet lifetimes with increasing surface
temperature. Each data point represents the average of five measured values with error
bars marking the highest and lowest measured vdues. When the surface was heated to
90°C, the droplets were in the evaporation region, al1 the dissolved salts increased the
droplet lifetime by reducing the vapor pressure. Although this reduction of vapor pressure
was small at the beginning, it increased as the droplet evaporated and the salt
concentration increased. Increasing the surface temperature above 130°C led the droplets
to be in a state of nucleate boiling. Dissolved NaCl did not have any obvious effect on the
droplet boiling, however, both dissolved Na,S04 and MgSO, reduced the droplet Wetime
by 50%.
This experiment shows that dissolved salts are able to enhance boiling heat
transfer of droplets significantly. To understand the mechanism associated with this
improvement, we continued this study by examining boiling of droplets containing
different salts deposited on a stainless steel surface at 130°C, which led to nucleate
boiling in a water droplet. The Lifetime of a droplet boiling on a surface at a temperature
of 130°C is in the range of 3 to 12 s (see Fig 3.1), which is long enough for us to
precisely investigate the effects of dissolved salts.
Figure 3.2 shows photographs of the evaporation of droplets of pure water, NaCl
solution and Na,S04 solution on a stainless steel surface at a temperature of 130°C. Each
column in Fig. 3.2 shows successive stages during the droplet lifetime, and each row
shows droplets boiling at the same the (t) measured from the instant of droplet impact
on the surface, as indicated besides each row of photographs. The lower part of image
shows the reflection of the droplets on the surface. By exarnining the video record of
droplet evaporation, it was evident that a number of small bubbles nucleated inside the
droplets immediately after impact, formed by cavities on the heater surface. However,
these bubbles rapidly coalesced, so that by t 4 . S s (the second frame in Fig. 3.2) oniy one

pure water
O NaCl (0.06 m o n )
a Na,SO, (0.06 m o n )
0 MgSO, (0.06 mol/L)
90 110 130 150 170 190 210 surface temperature (OC)
Figure 3.1 Variation of salt solution droplet lifetime with the increasing surface
tempera hue.

pure water NaCl solution Na2S04 solution
Figure 3.2 Evolution of droplets containing: a) Na2S04 (0.06 M), once impacted on 130°C.
pure water, b) NaCl (0.06M), a hot surface at a temperature

large bubble was evident. For pure water, this bubble grew larger as the droplet
evaporated, until it finally broke through the droplet surface. No more bubbles were
produced in droplet; as the liquid evaporated it cooled the stainless steel substrate too
much to support fûrther nucleation. Dissolved NaCl had Little effect on nucleate boiling
of a droplet (Figure 3.2b). The boiling behavior of the droplet coataining dissolved NaCl
was very simiiar to that of a pure water droplet (Figure 3.2a). The bubbles that formed
immediately after the droplet was deposited also coalesced quickly to form a big bubble.
The big bubble grew larger until it burst. Dissolved NaC1 was found to increase the
droplet evaporation tune slightly. This increase in evaporation time was attributed to the
reduction of vapor pressure caused by the dissolved NaCl.
Dissolved Na2S0, had significantly different effects on nucleate boiling from
those of dissolved NaCl. Once a droplet containhg dissolved Na,S04 landed on the hot
surface, many bubbles were produced. These bubbles did not combine very quickly, but
grew larger, greatly expanding the bubble diameter (see Fig. 3.2 c). Consequently the
contact area between the liquid and the hot surface was increased rapidly. The droplet
lifetirne was reduced to about 50% compared to that of pure water.
3.2 EBect of Dissolved Salt Concentration on Droplet Boiling
Dissolved MgSO, had an effect similar to that of Na2S0,. Figure 3.3 shows
variation of the boiling behavior of a droplet of 0.01 M, 0.06 M, and 0.4 M solution,
respectively. When the concentration was very low, the boiling behavior of a droplet was
similar to that of a pure water droplet. However, when the concentration was increased to
0.06 M, the suppression of bubble coalescence became pronounced. When the
concentration was increased to 0.4 M, the behavior of the bubbles was similar to that for
the 0.06 M solution and the liquid-solid contact area was expanded greatly (see Fig. 3.3~).

Figure 3 -3 Evolution of droplets containing: a) MgSO, (O.OlM), b) MgSO, (0.06M), c) MgSO, (0.40 M), once impacted on a hot surface at a temperature of 130°C

The only difference was that the droplet Lifetime was found to increase slightly. We
believed that this was caused by the reduction in vapor pressure. Figure 3.3 suggests that
the dissolved salt concentration plays an important role in enhancing droplet boiling.
Figure 3.4 shows the lifetimes of pure water droplets and droplets containing
dissolved NaCl, N+SO,, MgSO,, and sucrose with different concentrations. Both
dissolved NaCl and sucrose increased the droplet Lifetime (see Fig.3.4). The droplet
Lifetimes increased with the molar concentration in the two solutions. Dissolved Na2S0,
and MgSO, reduced the droplet Lifetime slightly at low concentrations but significantly at
high concentrations. Once the concentration of the dissolved salts in water reached a limit,
the reduction of the droplet Wetime became almost constant; the threshold coacentranons
of dissolved Na,SO, and MgSO, were 0.06 moVL and 0.1 1 m o n , respectively. If the
concentration of these dissolved salts exceeded 0.3 m o n , the droplet lifetime started to
increase with the concentration.
The results shown in Fig. 3.2 and 3.3 demonstrate that bubble coaIescence plays an
important role in droplet boiling. Since the volume of a liquid droplet is fuced, retarding
bubble coalescence expands the droplet diameter and therefore the contact area between
the droplet and the hot surface, improving heat transfer. The ability of dissolved salts to
prevent coalescence of vapor bubbles has been documented by many researchers (e.g.
Marruci and Nicoderno, 1967; Lessard and Zieminiski, 1971; Zieminski and Whitemore,
197 1 ; Keitel and Onken, 198 1 ; Craig et al., 1993; Pashley and Craig, 1997). The merging
of two bubbles is inhibited if the Iiquid film between them is stabilized. Surfactants
achieve this by altering the surface tension of the liquid. Qiao and Chandra (1997)
demonstrated that adding a surfactant to water droplets boiling on a hot surface prevents
bubble coalescence, making the Liquid foam and greatly reducing evaporation time.
Although adding smali amount of salts to water does not change the surface tension of the

Na SO, 2
Sucrose
molar concentration (moV1)
Figure 3.4 Variation of the droplet Metirne with the solution concentration once a droplet containing a) NaCl , 6) Na,SO,, c) MgSO, impacted on a hot surface at a temperature of 130°C.

bulk Liquid significantly, it does cause obvious change in local surface tension where the
salt concentration is high. When two bubbles approach each other, the dissolved salt in the
liquid between the two bubbles may not be able to diffiise quickly away, increashg the
concentration locaiiy and thereby making the surface tension higher which retards bubble
coalescence. This is one of the possible effects of dissolved salts on bubble coalescence.
In fact, inhibition of bubble coalescence may also be attributed to several other effects of
dissolved sdts on water. Electric charge accumulating on the surfaces of bubbles may
produce a repulsive force, preventing them from approaching each other (Keitek and
Onken, 1981). Dissolved saits may also change water structure and hence reduce the
h y drophobic force of attraction.
3.3 Mode1 of Bubble Coaiescence in Sait Solutions
To date, a number of theories to explain the effect of dissolved salts on bubble
coalescence have been proposed. However, none of them gives a full reasonable
explanation of this phenornenon. The only quantitative model was initially proposed by
Marrcui (1969) and then extended by other researchers (Sagert and Quinn, 1978, Oolman
and Blanch, 1986, Prince and Blanch, 1990). This model only includes the effect of
surface tension force on the bubble coalescence process.
Marmci (1967) noted that the efficiency of the inorganic electrolytes in inhibiting
coalescence depends on the valence and the derivatives of the surface tension versus
concentration curve. Marrucci (1969) developed an expression for the concentration of
salt necessary to immobilize the gas-liquid interface in coalescing bubbles. Figure 3.5
shows the proposed coalescence process of two bubbles. Bubble coalescence can be
considered to be a three- step process:

Figure 3.5 The assurned process of bubble coalescence (Marrucci model).

1. The bubbles corne into contact with each other within the liquid phase. The
bubble sucfaces are fiattened against each other, leaving a thin liquid fiIm separating them.
This step is controtled by the hydrodynarnics of the bulk liquid phase.
2. This intemenhg liquid film thins to about IO4 cm (Oolman and Blanch, 1986)
before it will rupture. If this thinning mechanism takes longer than the bubble contact
time, coalescence wiil not occur. This step is controlled by the hydrodynamics of the
Liquid film.
3. Once the film is sufficiently thin it will rupture via an instability mechanism.
This step is very rapid in comparison to the first two.
During a bubble coalescence process, the force dnving the thinning of the film
includes two parts: the capiyary pressure in the f h and the Hamaker force which is the
interrnolecular attraction force. In Mamcci's model, a constant volume element of fluid
between two coalescing bubbles is considered to undergo elongation. As the surface area
increases, a surface tension gradient develops dong the radial direction since the f i salt
concentration increases due to exclusion of salt fkom the increased swface area. Finally, a
force balance between the driving force and the one caused by the surface tension gradient
will develop in the film and immobilize the thinning process. Mamcci's model derives
from a simple force balance, neglecting inertia terms.
Prince et al. (1990) modified the Marucci model with the basic Navier-Stokes
equation (3.1) including the inertia terms. The liquid film between coalescing bubbles is
taken to be a cyiinder of radius R and height h.
In order to solve this equation, the following simplimng assumptions are made for
the thinning process:
1) The flow of the liquid nIm is symmetric, so a l l terms with respect to 8 are eliminated.

2) Plane parailel film geometry.
3) The velocity profile in the thinning film is flat, so h / a z is equal to O.
4) The Glm thinning rate is independent of radial position.
5) No electric force.
Based on the above assumptions, Eq. (3.1) for an incompressible Newtonian fluid
is simplified as:
Since the velocity profile in the plane paralle1 film is flat, qcan be substinited by the
average Liquid velocity in the thin fh. The average liquid phase velocity at an arbitrary
radial position cm be derived from a mass balance on the Liquid:
Considering the flat velocity profile assumption, the viscous term in Eq. (3.2) can be
shown to be zero. The remaining terms in Eq. (3.2) can be integrated with respect to z
over the width of the film to obtain:
where
The shear force term in Eq. (3.4) can be simplified using a force balance on an element of
the film surface:
Taking into consideration that P is independent of z and vr2 = @ in the liquid film, Eq.
(3.4) can be expressed as follows:

Integration over the radial àimension of the film and substiiution of the expression for the
radial velocity yield:
where Ao c m be obtained from Mamcci's mode1 (1969).
1 2c d a , A 0 = --(-)(-)
vh R,T dc
and
where r, is the bubble diameter, B is the retarded van der Waals coefficient, v is the
number of ions formed upon dissociation. R, is the gas constant, and T is the temperature.
Substitution of these terms into Eq. (3.8) yields:
Nondimensionalization of Eq. (3.1 1) gives:
where
The transition concentration, which causes the abrupt change in film thinning behavior,
can be calculated from Eq. (3.12) as foilows:
Ba d a C, = 1.18~(-)"* R,T(-)-~ (3.13)
'b &
Eq. (3.13) shows that, when vapor bubbles are brought into contact with each
other in a sait solution at a specific temperature, the transition concentration is a function

of bubble size. As the radius of coaiescing bubbles increases, the sait transition
concentration requûed for prohibiting bubble coaiescence decreases. The variation of the
transition concentration for the three dissolved salts in this study with the bubble radius
calculated from the equation (3.13) is displayed in Figure 3.6.
In droplet boiling, the bubble size in the droplets varies with wall temperature,
roughness, convection, and bubble growth rate. Once small bubbles nucleate in a droplet
and then coalesce to form big bubbles. these big bubbles may be prohibited fiom
coalescing M e r because of the resdting bubble size. Therefore, there is no fixed bubble
size that can be measured experimentally for calculating the transition concentration. In
this study, the radius of bubbles in a boiling droplet was estimated to be in the range from
0.1 to 0.5 mm by measuring off photographs of droplets (see Fig. 3.2 and Fig. 3.3).
To verify the mode1 derived above, bubble sizes (rJ in boiling droplets were
calculated using the experimental transition salt concentrations obliJned nom Ag. 3.4 and
compared with the experimental values. Calculations of bubble sizes (r,) were performed
by rearranging Eq. (3.13) to the following form.
where surface tension gradients (dddc) for the salts of interest at rmm temperature were
used in the calculations, since no üterature data are available at the temperame of 100°C
and the variations of the gradients with temperature are negligible (Horvath, A. L., 1985).
The values of retarded van der Waals coefficient (B) and surface tension gradients ai room
temperature cm be found in the literature (Prince and Blanch, 1990; ~ntemationd Critical
Tables, 1933). The calculated and expenmental bubble sizes correspondhg to the
experimental transition concentrations are shown in Table 3.1.

MgSO 4
O 0.2 0.4 0.6 0.8 1 1.2 1.4 1.6 1.8 2 radius of coalescing bubbles (mm)
Figure 3.6 Variation of the transition concentration versus the radius of coalescing bubbles in a salt solution at a temperature of 100°C.

Table 3.1 Calculated and experimental bubble sizes corresponding to the experimental transition concentrations (c,)
Table 3.1 shows that the calculated bubble sizes (r,) are larger than what is
observed. This difference is caused possibly by the assumptions made for the model,
which does not consider the special conditions in boiling heat transfer. First, when a
bubble produced by heat grows in the liquid, the dissolved salt will accumulate in the
vicinity of the bubble, therefore, the concentration of the bullc liquid should not be used to
estimate the transition concentration. Second, the electrostatic force caused by the ions
accumulating at the bubble interface may prevent bubbles from coalescing. Third, the
dissolved salts increase the surface tension of the liquid at the interface, and this interface
with higher surface tension can cause Marangoni convection which drags the bulk liquid
toward the film between the two bubbles. The current model is derived from equation
( 3 4 , which does not include the Marangoni effect. Therefore this mode1 can not be
applied directly as such to boiling systems, distillation. etc., where Marangoni effects are
present. If al1 these effects are taken into account in the model, it may be possible to
predict the transition concentration with more accuraçy.
salt
The above model mainly attributes the effect of dissolved salts on bubble
coalescence to changes in surface tension. However, we may also Link this effect to the
bubble radius fÏom experirnents
InIn
bubble radius from EQ. 3.12
mm
d d d c gcm3/s2mol
c, fiom experimen ts
m o n

ionic strength of solutions, which is not directly accounted for in the model. Ionic strength
(Z) is defined as a function of valence, number of ions, and salt concentration in water.
Z = 0.5x c,~,' (3.15)
where:
ci is the molar concentration of iouic species i (moVL), and Zi is the charge number of
ionic species i.
We compared the ionic strength in the solution with the reduction of droplet
lifetime caused by the dissolved saits (Fig. 3.4). It was found that the reduction was Linked
to the ionic strength in the solutions. The higher the ionic strength is, the bigger the
reduction is. This dependence of bubble coalescence on ionic strength was confiied by
the findings of Chang et al. (1986), who reported that increasing the ionic strength of
saline solutions inhibited bubble coalescence and enhanced gas-muid mass transfer. In
fact, the effect of ionic strength is consistent with the effect of changes in surface tension.
The increase of surface tension caused by addition of a strong electrolyte to water may be
considered to be mainly due to the repulsion of ions fkom the surface by the electrostatic
image force (S tairs, 1995).
Dissolved salts not only have an influence on the transition concentration but also
on droplet lifetime (see Fig 3.4). Dissolved MgSO, had a bigger effect on reducing
droplet lifetime than dissolved Na2S04. This difference may be attributed to the reduction
of the vapor pressure caused by the dissolved salts. In a droplet boiling process, vapor
partial pressure is one factor that determines the bubble growth rate and therefore the
expansion of the droplet. Oniy when the pressure inside the growing bubble is high
enough to overcome the liquid-solid surface tension, can the bubbles expand the droplet
size and thereby increase heat transfer. The vapor pressure of a MgSO, solution decreases
with an increase in the concentration of the solution less than that of a Na$O, solution.

Dissolved NaCl increased the droplet iifetime within the concentration range fkom
0.0 to 0.40 moVL (see Fig. 3.4). The boiling behavior of a droplet containhg a dissolved
salt is determioed by three major factors; namely, vapor partial pressure, the capability of
suppressing bubble codescence, and the diffusion coefficient of the sait in water. At low
concentrations, dissolved NaCl reduces the vapor partial pressure of water and has a very
small effect on bubble coalescence. At moderate concentrations, the solutes accumulating
at the bubble interface diffuse rapidly to the bulk liquid, because of the big daerence in
concentration between the interface and the bulk solution. The diffusion coefficient of
NaCl in water is much higher than those of Na,SO, and MgSO, (Zeytsev et aL, 1992). The
diffusion coefficients of the three salts in a 0.1M solution at 100°C are: 1.988~10'~ m2/s
(NaCl), 1.244~ 1 m2/s (Na2SO4), and 0.892~ 10" m2/s (MgS04). So once a bubble is
produced in a droplet containing dissolved NaCl, the Salt accumulating at the interface
during evaporation will difise to the buk liquid much faster than in a N+SO, or MgSO,
solution and thereby reduce the salt concentration. Consequently, the bubbles in NaCl
solution will coalesce much more easily than in Na,SO, and MgSO, solutions. At high
concentrations, the reduction of vapor pressure and the increase in surface tension start to
reduce the bubble growth rate greatly, resulting in an obvious increase in droplet Lifetime.
Dissolving small amount of salts into water does not change the properties of the
bulk water significantl y; however, it may have significant effects on droplet boiling.
Dissolved salts reduce the heat transfer in the evaporation region. Once the droplet is in a
state of nucleation, dissolved salts may enhance the boiiing heat transfer by inhibiting
bubble coalescence. This effect is dependent on many properties of the solution, but the
dominant property is the concentration of ions in the solution. If the coalescence of

growing bubbles is impeded ancl the pressure inside a bubble overcomes the liquid-solid
surface tension, the growing bubbles wiU be able to expand the droplet and thereby
enhance the boiling heat transfer si@icantly. This leads to the observed result that
dissolved Na,SO, and MgSO, can reduce the droplet lifetime with increasing salt
concentration, Once the concentration of a dissolved salt in water reaches its transition
concentration, the reduction will reach its maximum. If the concentration is increased
further, it will produce an adverse effect, reducing droplet evaporation rate, since the
dissolved salt lowers the vapor pressure.

4. EFFECT OF SALTS DECOMPOSING AT HIGH TEMPERATURE ON DROPLET BOILING
The study presented in Chapter 3 demonstrates that adding salts into water can
improve droplet boiiing heat transfer significantly. Those saits tested in Chapter 3 do not
decompose within the surface temperature range used in this investigation; however,
many other salts rnay decompose when heated. Since the dissociation process may
produce gas in some cases, these salts may have the combined effects of both gases and
salts on water droplet boiling when dissolved into water. To investigate the effects of
these salts, sodium bicarbonate (NaHCO,) was chosen as a typical compound because it
decomposes at high temperature to form carbon dioxide (CO3 and sodium carbonate
(Na7CO3).
The decomposing process is:
2NaHCOJs) O Na2C0, (s) + CO2 (g)+ H20 (g) (4- 1)
The decomposition rate can be estimated by using kinetic data from the literature (Hu et.
al. 1986). Details of the calculation c m be found in Appendix D. Since decomposition of
dissolved sodium bicarbonate may produce the combined effects of the gas (carbon
dioxide) and salt (sodium carbonate), both sodium carbonate and carbon dioxide were
also exarnined separately to determine the single effect of each additive.
The study in this section classified droplet evaporation into three regimes based
on the surface temperature. When pure water droplets were deposited on a stainless steel
plate at a temperature below 120°C, the surface temperature was not high enough to
ûigger bubble nucleation and the droplets evaporated without nucleate boiling. When the
surface temperature was increased above 120°C, droplets entered the nucleate boiling
regime, and when the surface temperature was above 210°C droplets were in film boiling.
In this study, the droplets containhg additives were photograph on the hot surface at four

typical temperatures: 10O0C (evaporation), 130°C (nucleate boiling), 210°C (transition
film boiling), and 300°C (film boiling) to provide detailed information on the effects of
these additives. Droplet lifetime within the temperature range from lûû0C to 300°C was
also recorded.
4.1 Droplet Bebavior in the Evaporative Regime
Figure 4.1 shows photographs of water droplets, and those containing the three
different additives considered in this section of the study, evaporating on a surface at
100°C. Each row in Fig. 4.1 shows a consecutive stage during the droplet lifetime.
A small air bubble was trapped at the center of a water droplet when it landed on
the surface (see Fig. 4.la, t a . 7 5 s). The bubble grew larger as the droplet evaprated. As
the volume of Liquid diminished, the liquid-solid contact angle decreased while the
contact area between the droplet and substrate remained constant. Eventually, when the
contact angle reached a lower limit, equal to the receding contact angle, the contact
diameter began to decrease rapidly until the droplet disappeared. We measured the
evolution of contact diameter and contact angle during droplet evaporation, with the
results shown in Figure 4.2 and Figure 4.3 respectively. The contact diameter of pure
water droplets was constant for 1420 s, after which it decreased rapidly.
We also calculated the surface area of the droplet exposed to air (fkorn which
liquid evaponted) by measunng the droplet height and diameter and assuming it to be a
segment of a sphere (see Figure 4.4). In addition, the variation of water volume during
evaporation was also calculated by subtracting the bubble volume fiom the droplet
volume with the bubble simplified as a segment of an ellipse.

a) Deionized water b) Water with CO, c) NazC03 solution d) NaHCQ solution
Figure 4.1 Evaporation of droplets on a surface at lûû°C: a) pure water, b) water containing dissolved CO2, c) 1% by weight solution of N a m , d) 1% by weight solution of NaHCO,

O Pure Water O Water with CO,
A NaHC03 solution (1 %)
10 15 20 25 30 time (s)
Figure 4.2 Variation of iiquid-soiid contact diameter with tirne during evaporation of droplets on a stainless steel surface at 10O0C.

Pure Water 0 Water with CO,
A NaHC03 solution (1%)
5 10 15 20 25 30 evaporation tirne (s)
Figure 4.3 Variation of liquid-solid contact angle with time during evaporation of droplets on a staidess steel surface at 1O0C.

bubble . /Y
Figure 4.4 Diagram of a water droplet with a bubble inside
Volume of a water droplet was given by:
Where Rd (RpD72) is the radius of the sphere, C'and D'are calculated as foilows:
C' = D: - H
Where D, is the contact diarneter and H is the height of the droplet.
Volume of the bubb1e inside was calculated by:

Where D, is the diameter of the bubble, h is the height fiom the top to the center, and c is
the distance fiom the center of the bubble to the surface,
The variations of droplet surface area and water volume are shown in Figure 4.5
and Figure 4.6 respectively, and a steady decrease in area corresponding to a similar
change in water volume is evident as the droplet evaporates. The rate at which the surface
area diminished increased towards the end of the droplet lifetime ( ~ 2 0 s) when the
contact diameter began to shrink.
Addition of NaHCO, to water droplets placed on a surface at 100°C led to an
increase in their lifetime (Fig. 4.1 c and d), in agreement with the findings of King et al.
(1997). Dissolving a salt in water is known to reduce its vapor pressure. The magnitude
of this effect can be calculated using the method described by Cistemas et al. (1991). The
calculation proçess and reference data are given in Appendix C. We estimated that the
reduction of vapor pressure is smali for dilute solutions: dissolving 1% by weight of
NaHCO, and N a , reduces the vapor pressure to 100 kPa at 100°C, only siightly lower
than that of pure water (IO1 kPa). However, as the droplet evaporated and its salt
concentration increased, the reduction in vapor pressure would become more pronounced.
The decrease of vapor pressure would diminish the rate of mass transfer fiom the droplet
surface and increase droplet evaporation time. The reduction of vapor pressure with
increasing salt concentration is shown in Appendix B. King et al. (1997) developed a
mode1 to predict the evaporation rate of a s m d water droplet containing an additive by
taking the droplet as a thin right circular cylinder with a thickness and an equivalent
volume equal to the spherical segment and assuming a Linear temperature profile within
the droplet. They also showed that as the concentration of dissolved salt increased, the
average evaporation rate became slower.
As the droplets of NaHCQ solution evaporated salt crystals precipitated along
their edges, where the evaporation rate was highest (see Fig. 4.1 d at t=3 1.05 s). The ring

Pure Water O Water with CO,
A NaHC03 solution (1 %)
10 15 20 25 evaporation tirne (s)
Figure 4.5 Variation of liquid-air interface area during evaporation of droplets on a stainless steel at 100°C

Figure 4.6
Pure Water Water with CO,
NaHCO, solution (1 %)
10 15 20 evaporation time (s)
Variation of water volume in the droplet on a hot surface at the temperature of 100°C with the evaporation tirne.

of salt prevented inward movement of liquid at the edge of the droplet as they grew
smailer. In fact droplets spread out slightly towards the end of their life, as is evident in
both photographs (see Fig. 4.1 d at k26.55 s) and our measurements of droplet diameter
(Fig. 4.2).
The salt stain left after al1 the water had evaporated was in the form of a circle
dong which there were regularly spaced fingers, perhaps created by a surface tension
driven instability (Zhang et al., 1987). The assumed mechanism is shown Figure 4.7.
During evaporation, vaponzation of water left the salt molecules to accumulate at the
interface between the droplet surface and air. These molecules formed a monolayer,
creating a repulsive pressure that opposes the surface tension force. If the repulsive
pressure exceeded the swfaçe tension, the net effect was to cause the surface to expand,
resulting in rippling of the surface. The effect propagated to the boundary of the drop and
caused the boundary to migrate outward if it was large enough to overcorne the coherence
with the solid surface, as s h o w in Fig. 4.ld.
Dissolved Na,CO, had a sirnilar effect io NaHC03 on droplet evaporation except
the gradua1 spreading of the droplet near the end of evaporation. The droplet diameter
stayed constant during evaporation because the crystals precipitated around the edge of
the droplet prevented the droplet frorn shrinking. It increased droplet evaporation
lifetime slightly by reducing the vapor pressure of the water.
Dissolving CO, in a water droplet placed on a surface a t 100°C slightly reduced
its evaporation time (see Fig. 4.lb). Inspection of videotapes of evaporating droplets
showed that several vapor bubbles nucleated within the &op immediately after it was
deposited on the surface. These rapidly merged with each other, so that by t=0.75 s (the
first frame in Fig. 4.1) there remained a single large bubble. The solubiiity of CO,
decreases with rising temperature and gas escaping from the solution made the bubble
much larger than that in a drop of pure water. The bubble produced little change in the

Figure 4.7 Thennal instability of a droplet induced by the ions accumulated at the liquid-air interface during evaporation of a droplet containhg NaHCO,.

contact diameter (Fig. 4.2), though it did increase the droplet surface area exposed to air
(see Fig. 4.5, OU^ s). The increased area for evaporation produced a small decrease in
droplet lifetime. The effect is not very significant because, as shown by di Marzo and
Evans (1989) and Chandra et al. (1996), most heat transfer to an evaporating droplet
occurs around its edge where the substrate is hottest. Therefore the circumference, rather
than surface area, principally determines droplet evaporation time.
4.2 Nucleate Boiling Behavior
Increasing the surface temperature to 130°C led to the formation of vapor bubbles
in droplets deposited on the surface and the onset of nucleate boiling. Fig. 4.8 shows
photographs of water droplets containing dissolved NaHCO, boiling on a surface at
130°C. To make a cornparison with other additives, Figure 4.9 also shows photographs
of pure water droplets (Fig. 4.9a), droplets containing dissolved CO, (Fig. 4.96) and
droplets with dissolved Na,CO, (Fig. 4 .9~) on a surface at 130°C. By examining the
video record of droplet evaporation it was observed that a number of small bubbles
formed in cavities on the heater surface nucleated inside the droplets immediately after
impact. However, for pure water droplets these bubbles rapidly coalesced, so that by
k0.35 s (the fust frame in Fig. 4.9) only one large bubble was evident, This bubble grew
larger as the droplet evaporated, until it finally broke through the droplet surface. No
more bubbles were produced in the droplet; as the liquid evaporated it cooled the
stainless steel substrate further suppressing nucleation.
Dissolved NaHCO, had two significant effects on nucleate boiling of a water
droplet (Figure 4.8). First, a large number of bubbles were visible in the droplet soon
after impact (Fig. 4.8, t=0.35s), probably because of the CO, released by the
decomposition of NaHCO,. These bubbles did not coalesce but kept growing. Second, at

NaHCO solution (1 Yo)
Figure 4.8 Evaporation of 1% by weight solution of NaHco3 droplets on a hot surface at 130°C

- a) Deionized water b) Waîer with CO2 c) Na2C03 solution
Figure 4.9 Evolution of droplets on a hot surface at 130°C: a) pure water, b) water containhg dissolved CO2, c) 1% by weight solution of Na2C03

approximately t=1.2s, the abrupt nucleation of more bubbles was observed. The bubbles
also did not coalesce but grew larger, greatly expanding the droplet diameter. The
bubbles burst, reducing the droplet evaporation time by over half compared to that for
pure water. The ability of dissolved salts to produce foaming was consistent wîth the
findings in our previous experiments (Chapter 3).
The sudden nucIeation of bubbles in the droplets of NaHCO, solution fragrnented
them and produced a large decrease in evaporation time (see Fig. 4.8 at t=3.55 s). We
believe that this was caused by salt particles precipitating fiom the evaporating droplet,
which s e ~ e d as nuclei to trigger bubble formation. The particles were too smaii to
observe directly, but to test our hypothesis we sprinkled a few salt particles on the hot
surface before a droplet was deposited on it. These produced instantaneous nucleation of
bubbles in water droplets landing on them.
Dissolved NaHCO, decomposed to form carbon dioxide and sodium carbonate
during the droplet lifetime. The variations of decomposition rate and amount of carbon
dioxide during evaporation were estimated using data from the literature (refer to
Appendix D, Figure D.l and Figure D.2). It was found that approximately 10% of the
NaHCO, in a 1% by weight aqueous solution decomposed during the droplet lifetime.
This would produce about 10% of the mass of CO, that could be dissolved in pure water,
i.e. 0.07 mm3 of C0,/mm3 water (at STP). CO2 was known to produce bubbles in the
liquid and sodium carbonate has the ability to produce foaming by preventing bubble
coalescence. So the effects of dissoived NaHCO, may be attributed to both of CO2 and
W O , . To further explore the mechanism, the separate effects of the two products from
the decomposition process were observed from photographs. A sample of these is shown
in Fig.4.9.
The boiling of a droplet of 1% by weight solution of Nago , shown in Fig. 4.9 is
similar to that for NaHC03 solution. Bubbles were produced immediately after the

droplet was deposited. These bubbles did not coalesce, but grew larger. A large number
of new vapor bubbles were again observed at approximately t= 3 s, much later than for
the NaHCO, solution. The bubbles disrupted the droplet so that it evaporated in
approxirnately 3.5 S.
Dissolving CO, in the droplet increased the number of bubbles present
irnrnediately after impact, and they coalesced to produce a large bubble so that by M.35
s (the first frame in Fig. 4.9b) only one large bubble was evident. The bubble grew larger
as CO, came out of solution until it finally broke through the droplet surface. NO more
bubbles were produced in the droplet; as the liquid evaporated it cooled the stainless steel
substrate too much to support further nucleation. Dissolved CO2 increased the droplet
diameter during the droplet boiiing so that droplet evaporation time was, therefore,
slightly reduced.
Our measurements of droplet evaporation t h e on surfaces at temperatures (T,)
ranging from 100°C to 210°C are shown in Fig. 4.10. Each data point represents the
average of five measured values with error bars marking the highest and lowest measured
values. To summarize Our findings, at a low surface temperature (T,,,=lOO°C), CO2
reduced the evaporation time slightly, while the two salts increased it. At higher
temperatures (T>120°C) both salts produced a large reduction in evaporation time,
NaHCO, having a larger effect than Na,CO,.
4.3 Droplet Behavior on a Surface above 210°C
Droplets deposited on a surface at a temperature higher than 210°C went into a
state of transition boiling. Water droplets evaporated so rapidly that the pressure of vapor
generated at the liquid-solid interface was sufficient to lift them off the surface. Fig 4.1 1
shows three sequences of photographs of the impact and recoil of droplets of water (Fig.

pure water water containhg CO,
NaHCO, solution (1%)
N%CO, solution (1%)
100 110 120 130 140 150 160 170 180 190 200 210 surface temperature (OC)
Figure 4.10 Variation of droplet iifetime for droplets deposited on a stainiess steel surface at temperatures ranging fiom 100°C to 2lOeC.

pure water water with CO2 NaHC03 solution (1%)
Figure 4.11 Impact of droplets on a surface at 220°C: a) pure water, b) water containing dissolved CO,, and 1% by weight solution of NaHCO,.

4.1 1 a), water with dissolved CO, (Fig. 4.1 lb), and NaHC03 solution (Fig. 4.1 lc), on a
surface at 220°C. Dissolved NaHC03 solution droplets had a visibly larger number of
bubbles in them (see Fig. 4-1 1, t=l.l ms) whose coalescence was inhibited by the salt.
Bubbles bursting out of the liquid caused the droplet to disintegrate ( H . 3 ms). Since
Na,CO, had an effect similar to that of NaHCO,, a separate set of photographs for
Nago, solution droplets is not shown. Dissolved CO, had no significant effect on
droplet behavior, Le. the droplets with dissolved CO2 behaved much iike the pure water
droplets.
To record the evaporation time of droplets on surfaces with T,,p210°C, the
droplets were deposited on a stainless steel plate machined to make the upper surface
slightly concave, which prevented droplets from rolling off. Measured droplet Lifetimes
for 210°CIT~3000C are shown in Figure 4.12. Data for the two salt solutions is not
shown, since the droplets splattered during impact, and it was not possible to define a
meaningful evaporation tirne. There was Little Merence in measurement for pure water
droplets and those with dissolved CO,. Droplet evaporation times increased with
substrate temperature for 2 1O0CST~4O0C. The surface temperature corresponding to
the maximum droplet evaporation tirne is known as the 'Leidenfiost temperature'. Above
this droplets are fuily levitated on a thin film of their own vapor, and are in a state of
stable film boiling. Droplet evaporation times then decrease with further increases of
temperature.
Figure 4.13 shows photographs of droplets landing on a surface at 300°C.
Dissolved NaEKO, still promoted bubble nucleation, which was vigorous enough to
breakup the droplet (Fig. 4.13c, t=7.5 ms). Droplets containing CO, had far fewer
bubbles than those of pure water (see Fig. 4.13, kL.5 ms). Vapor bubbles are formed by
heterogeneous nucleation when liquid touches the solid surface. When a droplet
approached the heated plate, dissolved CO, quickly escaped from the bulk liquid since

o pure water
O water with CO,
190 200 210 220 230 240 250 260 270 280 290 300 surface temperature (OC)
Figure 4.12 Variation of droplet iifetime for droplets deposited on a stainless steel surface at temperature ranging fiom 210°C to 300°C.

pure water
78
water with CO2 -O3 solution (IYo)
7.5 ms
Figure 4.13 Impact of droplets on a surface at 300°C: a) pure water, b) water containing dissolved CO,, and 1% 1% by weight solution of NaHCQ.

the solubility of CO, decreases sharply with increasing water temperature. Gas emerging
from under the droplet would f o m a f h that prevents liquid fkom contacting the hot
substrate, suppressing nucleation. Jeschar et al (1996) have also noted that dissolved gas
makes the vapor film formed around a heated sphere immersed in water more stable.
We observed the effects of dissolving either a gas (CO3 or a salt (Na2C03 or
NaHCO,), in water droplets impinging on a heated surface. At surface temperatures too
low to initiate nucleate boiling it was found that droplet lifetime was determined by heat
and mass transfer around the periphery of the droplet. In the evaporative regime,
dissolved NaHCO, and Na2C03 both reduced droplet evaporation rates since they lower
the vapor pressure of water. Dissolved CO, enhanced the evaporation rate slightly,
because the gas bubble trapped in the droplet made it swell and increased its
circumference. In the nucleate boiling regime, Na,CO, prevented coalescence of bubbles
in the liquid and promoted foaming, reducing droplet evaporation times. Salt particles
precipitated from the solution during evaporation also triggered vapor nucleation.
Dissolved NaHCO, reduced droplet lifetimes even more than Na,CO,, because it
decomposed when heated to produce CO,, fûrther augrnenting bubble formation. When a
droplet was deposited on a surface above the Leidenfrost temperature, dissolved CO,
escaped from below the drop and prevented it touching the subsaate, suppressing
heterogeneous nucleation. Conversely, both salts promoted bubble nucleation and
foaming so vigorously that droplets disintegrated upon impact.

5. EFFECT OF DISSOLVED SALTS ON
SPRAY COOLING
5.1 Spray Parameters
Nurnerous studies concerning spray cwling have been carried out to deten-e
the main parameters, prior to impingement upon the surface, governing the heat transfer
coefficient in spray cooling. However, there are many disagreements among these studies
conceming the effects of these spray parameters associated with spray cooling.
Brimacombe et al. (1980) revealed that volumetric spray flux Q" had the greatest
influence on the heat transfer coefficient. Other parameters were aiso suggested to
influence the spray heat transfer, namely droplet velocity, and droplet diameter (Boiie
and Moureau, 1982, Yao and Choi, 1987). Recently, Mudawar and Valentine (1989)
performed extensive experimental studies on spray quenching in film boiling, transition
boiling, nucleate boiling, and single-phase cooling regimes. Table 5.1 is a swnmary of
the correlations developed by Mudawar and Valentine (1989).
Table 5.1. Summary of Mudawar and Valentine's spray cooling correlations (1989)
Boiling (quenc hing) regime Correlation
Film boiling regime q"= 63.250~7'1-~lQ"~~" 424.M2
Critical heat flux Pr 114 P ~ c ~ . # K ~ ) 1 + 0.01 18(-) (
P* &h,

Nucleate boiling regime q' = 1.87 x ~o-'(T, - T,)'~'
0.1, 5 0 2 0 Onset of single-phase regime = 13.43~~0-16~ Prf ( 4 2
+ =f
S ingle-p hase regime Nu = 2.5 12 R ~ O - ' ~ RF where q"is in w/rn2, and T, and ?are in OC.
They singIed out three parameters as influencing, to various degree depending on
boiling regime, the heat flux: volumetric spray flux Q", Sauter mean diameter, d3,, and
mean dropIet velocity, Um.
Sauter mean diameter (SMD, 4,) is a means of expressing the fineness of a spray
in terms of the surface area produced by the spray. Sauter mean diameter is defined as the
diameter of a drop having the same volume-to-surface area ratio as the total volume of aii
the drops to the total surface area of al1 the drops. Sauter mean diameter obtained by the
nozzles in this study was predicted using the foIiowing correlation deveIoped by Esters et
al. (1995) for water sprayed from fuli cone nozzles.
The characteristic length and velocity chosen for correlating the SMD in this correlation
were the orifice diameter, do, and liquid velocity at the onfice, defined as (ZAP/p3". The
Weber and Reynold numbers based on the onfice conditions were defined, respectively,
as
and

Re, = ~ ~ ( 2 ~ l p ~ ) ~ ' ~ 4 Pf
where p, is the density of ambient fluid (air or vapor).
Using a simple energy balance analysis, the mean velocity (U,) of droplets
impinging upon the test surface was estimated from the following correlation developed
by Ghodhane et al. (1991) and extended by Qiao (1996).
where Ci, denotes the upstream velocity; 4 the pressure difference between upstream
and downstream (ambient pressure); p the density of the Liquid; g the acceleration of
gravity; Ah distance between the nozzle and test surface and a angle of surface
inclinations which varies from -90" for a dowdoad facing surface, 0" for a vertical
surface to 90" for an upward facing surface. The test surface in this study faced
downward for temperature measurement and upward for photography. do5 represents
mass median diameter most commonly applied in spray heat transfer as a means of
expressing drop size in terms of the volume of liquid sprayed. The mass median diameter
when measured in tenns of volume is a value where 50% of the total volume of the liquid
sprayed is made up of drops with diameters larger than the median value (dm) and 50% of
the drops have diameters smaller than the median value (dos). Mass median diameters
used in this study were provided by the nozzle manufacturer. The equation c m be
simplified by keeping the second term on the right hand side of Eq. (5.4) and neglecting
the other three terms without producing an error of greater than 1%.
Two commercial fuli cone nozzles (Unijet TG 0.6 and TG 0.7, Spray Systems
Co., Wheaton, IL) were employed in this study to achieve two different mass fluxes
sprayed on the surface: 0.5 and 3.0 kg/m2s, respectively. They provided unifom coverage
over the test surface. Table 5.2 surnmarizes the range of experimental variables obtained

by different combinations of spray nozzles, operating pressures and varying the nozzle-
to-surface distance.
Table 5.2 Summary of spray variables
Adding small amount of a salt into water was found to increase surface tension
and viscosity by less than 1% (refer to Appendix C). Therefore, no significant change in
Sauter mean diameter was expected. Mudawar and Valentine (1989) found that the heat
transfer coefficient was ve r - sensitive to variations in volumetric flux over al l regimes;
mean drop velocity was also important in transition boiiing and Sauter mean diameter in
the single-phase regimes. In the nucleate boiling regime, the heat transfer was a function
of surface temperature alone, unaffected by variations in spray hydrodynamics.
Hoogendom and den Hond (1974) also obtained similar results, finding that varying
Sauter mean diameters in the range 0.2 to 1 mm had Little impact on spray cooling. Yao
and Choi (1987), studying spray cwiing using a mono-size spray, came to the same
conclusion. Therefore, any spray cooiing enhancement in the nucleate boiling and
transition boiling regimes can be attributed to the addition of the salts rather than any
change in droplet size and distribution, taking into consideration that Sauter mean

diameter plays a very weak role in spray cooling in the nucleate and transition boilùig
regimes.
5.2 Spray Cooling of a Hot Surface
Figure 5.1 displays typical temperature measurements made during spray cooling
of a surface using pure water with a mass flux m,=0.5 kg/rn2s. The temperature variation
recorded by each of the four thennocouples fl, to T,) is shown. Prior to spray cooting,
the test surface was heated and its temperature held constant at 240°C. Heat conduction
in copper was high enough to give an aimost uniform temperature profile dong the
centeriine. The temperature difference between the top thermocouple and the bottom one
was less than 1°C at the instant that water was sprayed on the test surface, and increased
with spray cooling up to approximately 10°C. The response of the point away from the
quenched surface was considerably delayed relative to the point closer io the surface. The
temperature measured by the themocouple closest to the surface dropped from 240°C to
100°C in approximately 250 s, during which the bottom one dropped from 240°C to
110°C
Figure 5.2 demonstrates the variation of heat flux and surface temperature with
spray cooling. The heat flux was calculated using the sequential method to solve the
inverse heat conduction problem (MCP, Beck et al., 1985), and the surface temperature
was extrapolated fiorn the interior temperature measurements in Figure 5.1 assuming
one-dimensional heat conduction within the test block. The accuracy of the temperature
measurements was estimated to be fO.S°C, and the embedded thermocouples were
positioned within m. 1Smm. The e m in the temperature measurements and positions
of the thermocouples could produce an error in the calculation of heat flux of, at most, up
to 10 percent, with the largest errors occurring at the start and the end of cwling where

-20 20 60 100 140 180 220 260 time (s)
Figure 5.1 Transient temperature measurements during spray cooling using pure
water.

Figure 5.2 Calculated surface heat flux and temperature during spray cooling
obtauied from interior temperature measuremenfs of Figure 5.1.

the relative magnitude of heat flux was smaii (Qiao, 19%). In this spray cooling process,
the hot surface experienced four different heat &ansfer regimes: film boiling, transition
boiling, nucleate boiluig, and single-phase liquid cooling. The cooling commenced in the
film boiling regime, in which a thermaliy insulating vapor layer developed on the surface,
resulting in a relatively slow cooling process (q"=0.03 MW/m2). Better liquid-surface
contact was maintained once the surface temperature dropped below the minimum heat
flux point, leading to the transition boiling regime (220°C to 140°C). Heat transfer
increased significantly in the transition boiling regime until the surface temperature
dropped below the critical heat flux point (qt'=0.26 MW/m2). Heat transfer decreased
quickly with M e r teduction in surface temperature in the nucleate boiling regime
(140°C tolOS°C). Once the surface temperature became too low to sustain bubble
nucleation, cooling was in the slow, single-phase Liquid cooling regime (q"S0.08
M W/mZ) .
5.3 Effect of Dissolved Salts on Spray Coolhg
The effect of dissolved salts on spray cooling was tested using the solutions of
NaCl, Na,SO,, and MgSO, with concentration of 0.6 moVL. Photographs, representatives
of the spray cooling process with different dissolved salts under the same operating
conditions as those used to produce Fig. 5.1 and Fig. 5.2, were taken. They are shown in
Figure 5.3 and Figure 5.4. When the hot surface was quenched with pure water, initidy
at 240°C, heat transfer was in a state of f i b boiling, in which no droplets were seen on
the surface. Since the droplets sprayed on the surface were small (d3,=0.2mm) relative to
the quenched surface (d=25.4mm), they were not visible on the photographs prior to
impinging on the surface. Droplets fiom the nozzle impacted and spread on the hot
surface, and then were lifted off the surface by a thia layer of vapor film. The

pure water 88
Figure 5.3 Photographs of droplet impact during spray cooling of pure water


Figure 5.4 Continued

residence tirne of droplets on the surface was very short. The surface was quenched with
a light spray of water (0.5 kg/m2s) rather than a dense spray, so the interaction among the
droplets sprayed on the surface was very weak. Therefore, droplets were prevented by the
short droplet residence on the surface and weak droplet interaction from coalescing to
form big visible droplets on the surface. The spray cooled the surface relatively slowly
down to the 220°C in 60 s, leading to transition boiling (220°C to 140°C). In the
transition boiling regime, a few separate big droplets, which were estimated to be three
times the spray droplets in size, were first seen on the surface at 160°C (see Fig. 5.3). W e
believe that this was caused by droplet coalescence. Droplets impacted and broke up into
many smailer single droplets, which coalesced to form big visible droplets. Once the
surface temperature decreased below the critical heat flux point (140°C), heat transfer
entered the nucleate boiling regime. Since the liquid/solid contact angle for pure water is
large (-90°), droplets after impact did not spread but recoiled, finally coming to rest as
hemisphencal masses on the surface (see Fig.S.3 at 13S°C) instead of forming a
continuous film on the surface. Droplets agglomerated to form visible masses on the
surface, decreasing the contact area between the droplets and surface. Heat flux was
aggressively reduced by the wall temperature drop and reduction of the contact area.
Finally, as the surface temperature continued to drop below llO°C, which was the
minimum temperature to initiate nucleation, the nucleation was suppressed. Heat transfer
was in a state of single-phase liquid cooling, in which the surface could not evaporate the
water quickly enough, leaving the water to reside on the surface. The surface was
completely covered with a layer of water at L05OC (see Fig. 5.3).
Dissolving salts in water produced several visible changes in the quenching
process. Photographs taken of a surface cooled with dissolved salt solutions are displayed
in Fig. 5.4, in which dxerent effects on spray cooling caused by different salts are also
exhibited. When the surface was quenched with the NaCl solution (row a) initially at

240°C, NaCl particles were first seen on the surface at 160"C, and then accumulated to
form a uniform layer of salt particles. In the film and transition boiling regimes
(T,,,=240°C to 140°C), the droplets sprayed on the surface evaporated quickly, leaving
fine salt particles on the surface, which reduced the reflectivity of the test surface. The
thickness of the particle layer increased until the surface temperature dropped below
140°C, at which point droplets started to rewet the surface and flush the salt particles off
the test cylinder. The accumulation of water, which occurred on the surface cooled with
pure water, was not observed at the same surface temperature (T,,,=13S°C). We believed
that, as dissolved salts in the droplets enhanced heat transfer, droplets evaporated quickly
so that there were not enough droplets to agglomerate.
With the surface temperature decreasing. separate patches of liquid fiim were
observed to occur on the surface and coalesce to form a thin liquid fdm, covenng the
surface. Once the swface was covered with liquid, it becarne brighter because the liquid
film was more reflective than the salt particle film. In the nucleate boiling regime,
dissolved salts inhibited bubble nucleation, producing more vigorous foaming, which was
seen in the temperature range fiom l4O0C to 1 10°C (see Fig 5.4). Bubble nucleation was
suppressed completely when the surface was cooled below the same temperature as in the
case of pure water (1 10°C). The cooling processes with Na,SO, and MgSO, were similar
to that of NaCl, but foaming was more vigorous in the film c o v e ~ g the face. especially
in the case of MgSO,. When the surface was quenched with MgSO,solution, several
spots fast appeared on the surface at 180°C. These spots were caused by agglomeration
of precipitated particles of MgSO,, which has a much lower solubility than the other two
salts (see Figure B.3 in Appendix B). These spots increased the surface roughness,
enhancing spray cooling. Once heat transfer entered the nucleate boiling regime, MgSO,
had more discemable effect on reducing bubble coalescence and produced more vigorous
foaming than NaCl.

Figure 5.5 shows the effect of dissolved salts on spray cooling heat transfer at a
mass flux of 0.5 kg/m2s. The most sieiificant effect the dissolved salts had on boiling
heat transfer was to increase both transition boiling and nucleate boiling heat flux in
spray cooling. The effect of the dissolved salts on heat nansfer in spray cooling was
different from that in pool boiling, where dissolved salts were found to decrease the heat
transfer coefficient. The critical heat flux point (140°C) was not changed greatly, but the
heat transfer rate was increased by up to 20%. This is different from the effect of
surfactants, which enhance nucleate boiling and single phase liquid cooling. As for the
effect of dissolved salts in the film boiling regime (T,=24O0 to 220°C), the boiling curves
are very close except for the MgSO, curve. Dissolved salts had different effects on the
heat transfer rate dunng spray cooling process; MgSO, had the biggest effect, Na2S04 the
second, and NaCl the lowest. These results agree with the earlier experimental study on
the evaporation of single droplets of water containing dissolved salts. In the transition
regime (220°C to l4O0C), dissolved salts were found to inhibit bubble coalescence and
break up the droplets into small droplets, resulting in more contact area between the
droplet and the hot surface. In the nucleate boiling regime (140°C to llO°C), dissolved
salts inhibited bubble coalescence and produced foarning, though the dissolved salts
increased the surface tension of water and reduced the nucleation rate slightly. Dissolved
MgSO, had a more signincant effect on the heat transfer rate in the transition regime (see
Fig. 5.5), where dissolved MgSO, particles stuck to the surface at high surface
temperature (see Fig. 5.4) and increased the surface roughness, enhancing heat transfer.
The effect of dissolved salts on spray cooling heat ~ransfer at high mass flux is
shown in Figure 5.6, where the measured variation of surface heat flux with surface
temperature was plotted for the pure water and the salt solutions at a mass flux of 3.0
kg/m2s. The effect of dissolved salts on heat transfer rate was significantly increased with
the increase in mass flux in the transition and nucleate boiling regimes, although the heat

O pure water
0 NaCl solution
A Na,SO, solution
O MgSO, solution
100 120 140 160 180 200 220 240 surface temperature (OC)
Figure 5.5 The effect of the dissolved sdts on heat transfer in the spray cooling
at the mass flux of 0.5 kglm2s

pure water
NaCl solution
Na,SO, solution
MgSO, solution
100 120 140 160 180 200 220 240 surface temperature (OC)
Figure 5.6 The effect of dissolved salts on spray cooling of a surface with water
containing dissolved salts at a mass flux of 3.0 kg/m's.

transfer rate still did not have a visible effect in the film boiling and the liquid
evaporation regimes. Dissolved NaCI, Na2S04, and MgSO, hcreased the critical heat flux
by up to 40%- 70%, and 80%, respectively. The cntical heat flux point, at which the
droplets started to be levitated by the vapor, was not influenced by the changes in
dissolved salts and mass flux of water sprayed on the test surface. As mentioned earlier,
dissolved salts played an important rote in bubble nucleation, which detennined the heat
transfer rate in the liquid rernaining on the surface. Ions dissociated fiom the saits
accumulated on the interface of the bubbles and retarded bubble coaiescence, producing
foaming which significantly increased heat transfer in the liquid.
The effect of the dissolved salts on the critical heat flux is shown in Figure 5.7,
where the variation of the critical heat flux with the ionic strength of the dissolved salts in
the solution is plotted for the selected salts under the same operation conditions as those
used to produce the data shown in Fig.5.6. The critical heat flux for pure water was
approximately 1.74 M W / ~ : while the critical heat flux for NaCl solution (0.06M) was
2.2 MW/m2, Na2S04 solution 2.5 MW/m2, and MgSO, solution 2.75 MWm2. When spray
cooling a surface, the critical heat flux during the cooling process was approximately
proportional to the ionic strength (Z) of the dissolved salt in the solution. This is
consistent with the results of the single droplet experiments. It is confirmed that dissolved
salts produced foaming and detennined the heat transfer rate during a spray cooling
process in the transition and nucleate boiling regimes.
5.4 Effect of Droplet Velocity on Spray Cooling
The effect of dissolved salts on the heat transfer rate during spray cooling is
shown in Figure 5.8 for pure water and MgSO, (0.06M) at three different droplet
velocities: 17 m/s, 20 mls, and 23 mls. As mentioned before, droplet velocity is an

1 pure water
Na SO MgSO 2 4 4
0.05 0.1 0.15 0.2 ionic strength (moVL)
Figure 5.7 The effect of dissolved salts on the critical heat flux at a mass flux of
3.0 kg/m2s.

ater solution
100 120 140 160 180 200 220 240 surface temperature (OC)
Figure 5.8 The effect of dissolved salis on heat transfer rate during the spray cooling
for pure water and MgSO, (0.06M) at three different droplet velocities: 17
mis, 20 m/s, and 23 m/s.

important factor governing the heat transfer rate (see Table 5.1). Heat transfer rate during
spray cooling was increased with increasing droplet velocity; the cntical heat flux for
pure water was increased fÎom 1.7 MW/m2 to 2.15 M W / ~ ~ when the droplet velocity
increased from 17 m/s to 23 m/s. Increasing droplet velocity even improved the heat
transfer rate in the fïIin and single-phase regimes, in which the boiling curve slope was
higher. At higher velocity, the droplets with higher kinetic energy impacted and spread to
a larger diameter, resulting in more contact area between the droplet and the surface.
The Leidenfiost temperature (LFP), corresponding to the minimum heat flux,
increased (see Fig. 5.8). Due to the limit of the surface temperature used in the
experiments, we had difficulty in clearly determining the change in the Leidenfrost
temperature. We believed that the increase in Leidentiost temperature (LFP) was caused
by the suppression of bubble nucleation at higher droplet velocities. Dissolving salt in the
water significantiy improved the heat transfer rate at a i i the three droplet velocities tested,
making the changes in Leifenfrost temperature more obvious (see Fig. 5.8). Increasing
impact velocity enhanced heat transfer for surface temperatures above llO°C when the
surface was not flooded. At lower temperature, droplets impacted on the iiquid film
covering the surface and had little effect on heat transfer between the liquid and the
surface. Our experiments confirmed the findings of Mudawar and Valentine (1989) and
Klinzing et al. (1992) who reported that nucleate boiling heat transfer during spray
cooling depends o d y on the surface temperature. The correlation proposed by Mudawar
and Valentine (1989) accurately predicted Our measured values of heat flux for pure
water (see Fig. 5.8). However, Our measurement of critical heat flux was dae ren t fiom
the calculated value, although the spray parameters in Our experiments were similar to
theirs. This difference may be due to surface roughness, wettability, and tirne interval.
Surface roughness and wettability are known to greatly influence the critical flux during
spray cooling (Pais et al., 1992). The heat flux from the surface was very sensitive to the

time interval, which may produce uncertainty in measurement of the calculated heat flux
by up to 40%. The heat flux calculated in our experiments increased with as the time
interval was shortened until it reached a limit. However, the smaiier the tirne interval, the
more rough the boiihg curve. For one test the time interval of 0.025 s was employed in
the calculation of heat flux, the boiling c w e was too rough to read. The heat flux
measured in our experiments was calculated using the time interna1 of O. 125s. Dissolving
salts enhanced boiling heat transfer at a i l velocities in the nucleate and transition boiling
regions.
5.5 Effect of Sait Concentration on Spray Coolhg
The effect of salt concentration on heat flux during spray cooling is shown in
Figure 5.9. Pure water and MgS0,solutions at a mass flux of 3.0 kg/m2s and droplet
velocity of 20 mls are shown. We employed four concentrations in Our expenments:
0.01M, O.O6M, 0.2M, and 0.4M. Heat transfer in spray cooling was only slightly
enhanced by the dissolved salt at low concentration (0.01M). while heat transfer rate was
greatly increased by the salt at the concentration of 0.06M. Dissolving more than 0.2M
of salt reduced the heat transfer rate during spray cooling, since the dissolved salt reduced
the vapor pressure of the liquid. Aside from the enhancement of heat flux in the transition
and nucleate boiling regimes, dissolved MgSO, also greatly increased the heat transfer
rate in the film boiling regime (see Fig. 5.9). The slope of the boiling curve for spray
cooling with a MgSO, (0.04M) solution at temperatures near 240°C was higher than that
for spray cooling with pure water. This implies that the dissolved salt significantly
increased the Leidenfkost temperature. It was increased by at least 20°C and thereby heat
transfer at temperature near 240°C was stiii in transition boiling. We believe that this was

100 120 140 160 180 200 220 240 surface temperature('C)
Figure 5.9 The effect of sdt concentration on heat flux during spray cooling for
pure water and MgSO, solution at the mass flux of 3.0 kg/m2s and
droplet velocity of 20 mls.

caused by salt precipitating on the surface and increasing surface roughness. Firstiy, the
dissolved salt vigorously broke up the droplets irnpacting on the surface by inhibithg
bubble coalescence, retarding formation of the vapor layer and thereby increasing the
Leidenfrost temperature. This observation agrees with the conclusion obtained in single
droplet boiling. Secondly, the salt particles left fÏom the previous drops increased the
surface roughness. Surface roughness was reported to greatiy increase the LFP for the
droplet boiling on particle blasted and rough sanded surfaces by up to 90°C (Bernardin et
al. 1999). The surface roughness dependence of the Leidenfrost temperature was
speculated to be related to intermittent liquid-solid contact caused by surface aspirates
poking through the thin vapor layer which, as reported by Labeish (1994), is on the order
of 1p.m. As the surface roughness increased, a thicker vapor layer, and hence a higher
surface temperature, was required to keep the liquid fuiiy separated from the solid
surface. Finally, the surface deposits left from the previous drops tended to serve as
bubble nucleation sites when making contact with newly impacted drops. This finding
was consistent with those of Baumeister et aL (1970) and Bernardin et al. (1999), who
reported that the Leidenfrost temperature for water on a wiped aluminum surface was
171°C, 54°C less than of an unwiped contaminated surface. Our experiments also
confirmed the findings of Bolle and Moreau (1982), who reported that heat flux in film
boiling regime was a weak function of both surface temperature and liquid subcooling. In
addition, heat flux was found to increase only slightly with increasing droplet velocity
and was nearly independent of droplet diameter.
The effect of dissolved salt concentration on cntical heat flux during spray coohg is
shown in Figure 5.10. It is obvious that a transition concentration existed in the inhibition
of bubble coalescence (see Fig. 5.10). Once the concentration reached a limit (transition
concentration), the dissolved salt inhibited most of the bubble coalescence processes in

O 0.05 0.1 0.15 0.2 0.25 0.3 0.35 0.4 molar concentration (mol/L)
Figure 5.10 The effect of dissolved salt concentration on critical heat flux dunng spray
cooling .

the boiling liquid, producing foamùig. This is consistent with the findings in the single
drople t experiments.
The effect of dissolved saIts on the surface temperature drop during spray cooiing
is shown in Figure 5.1 1 for m,=3.0 kg/m2s and LIm=20 d s . The dissolved salt MgSO,
greatly changed the surface temperature response. When quenched with pure water fiom
an initial temperature of 240°C, the cooling rate was relatively slow because spray
droplets were initiaIly in transition boiling and redound off the surface after impact.
Dissolving smaü amounts of MgSO, (0.01M) did not have a visible effect on the surface
temperature drop during spray cooiing (see Fig, 5.1 1). However, dissolving MgSO, to a
high concentration significantly increased the temperature drop rate. No relatively slow
cooling was observed in Fig. 5.1 1. The time for cooling of a surface fiom 240°C to
100CO was reduced by the dissolved sait fiom 10 s to 2 S. This reduction in cooling time
may be very beneficial to fire fighting and metal quenching processes, where the water
consumption is critical. The temperature, below which bubble nucleation was completely
suppressed by the cold surface, was not changed significantly. In fact, the presence of
dissolved salt increased vapor pressure and thereby reduced the heat transfer fiom the
surface. This was confirmed in the experiments of single droplet boiling.
The major findings in this chapter can be sum-zed as foiIows:
1) Dissolving salts in water sigoificantly enhanced the heat transfer rate in the transition
and nucleate boiling regimes during spray cooling. The increase in heat transfer rate
was observed at al1 mass fluxes, impact velocities and concentrations in our
expenments. The enhancement in heat transfer was mainly attributed to the inhibition
of bubble coalescence and foaming caused by the dissolved salts.

pure water
MgSO (0.01M) 4
5 10 15 20 25 30 35 spray cooling time (s)
Figure 5.1 1 The effect of dissolved salts on the surface temperature drop dunng spray
cooling .

2) The enhancement of critical heat flux induced by the dissolved salts increased with
the molar concentration of the dissolved salts in water until the concentration reached
the transition concentration. The measured transition concentration for spray cooling
agreed with that for single droplet boiling very weu.
3) The salt particles remaining on the surface also played a role in enhancement of spray
cooling, because they increased the roughness of the test sudace.
4) Dissolving the salts into water over the transition concentration produced adverse
effect on spray cooling due to the reduction of the vapor pressure.
5) The dissolved salts increased the Leidefiost temperature and thereby improved the
heat transfer in the füm boiling region. The tirne for cooling of a surface fiom 24û°C
to 100°C was reduced to 25% of that for a pure water spray.
6 ) Dissolved sdts had little effect on the heat transfer from the surface in the
evaporation region. Dissolved salts may reduce the spray cooling due to reduction of
vapor pressure.

6. CONCLUSIONS
Experiments were done to: 1) investigate the effect of dissolved salts on boihg of
a droplet on a hot surface, 2) examine the effect of dissolved salts decomposing at high
temperature on droplet boiling, and 3) deterrnine the effect of dissolved salts on spray
cooling.
Several salts were chosen to examine the effect of dissolved salts on droplet
boiling. Dissolving small amounts of salts into water does not change the properties of
the water signiFicantly; however, they may greatly affect droplet boiling. Dissolved salts
reduce heat transfer during evaporation. Once the droplet is in a state of nucleate boiling,
dissolved salts may enhance the boiling heat transfer by inhibiting bubble coalescence.
This effect is dependent on many properties of the solution such as ions, viscosity, and
vapor partial pressure. but the dominant property is the ions in the solution. If the
growing bubbles in a droplet are prevented from coalescing, the pressure inside the
bubbles may overcome the surface tension and the growing bubbles wili be able to
expand the droplet and thereby enhance the boiling heat transfer signifïcantly. Dissolved
Na2S0, and MgSO, can reduce the droplet Lifetime. Once the concentration of dissolved
salt in water reaches its transition concentration, the maximum reduction in droplet
lifetime will be achieved. If the concentration continues to increase, the dropIet Wetime
will increase since the dissolved salts reduce the vapor pressure. Dissolved NaCl has no
obvious effect on droplet boiling at low concentration, while it increases the droplet
boiling at high concentration. Dissolved salts always increase the departure from the
nucleate boiling point by retarding bubble coalescence.
The effect of sodium bicarbonate (NaHCO,), which decomposes to f o m carbon
dioxide (CO,) and sodium carbonate (Na2C03) at high temperature, on droplet boiting
was also investigated. Since decomposition of dissoived sodium bicarbonate may

produce the combined effects of the gas (carbon dioxide) and salt (sodium carbonate),
both sodium carbonate and carbon dioxide were also examined separately to determine
the single effect of each additive. At surface temperatures too low to initiate nucleate
boiling it was found that droplet Lifetime was determined by heat and mass transfer
around the circumference of the droplet- Dissolved NaHCO, and Na$03 both reduced
droplet evaporation rates since they lowered the vapor pressure of the Liquid. Dissolved
C O enhanced the evaporation rate slightly, because the gas bubble trapped in the droplet
made it swell and increased its circumference. In the nucleate boiling regime, Na,CO,
prevented coaiescence of bubbles in the iiquid and promoted foaming, reducing droplet
evaporation times. Salt particles precipitated from the solution during evaporation also
triggered vapor nucleation. Dissolved NaHCO, reduced droplet lifetimes even more than
Na,CO,, because it decomposed when heated to produce CO, m e r augmenthg bubble
formation. When a droplet was deposited on a surface above the Leideofrost temperature,
dissolved C O escaped from below the drop and prevented i t touching the substrate,
suppressing heterogeneous nucleation. Conversely, both salts promoted bubble nucleation
and foaming so vigorously that droplets disintegrated upon impact.
Experiments on spray cooling were conducted in this study to investigate the
effect o f dissolved salts (NaCl, Na2S04, MgS04, NaHC03). The results were compared
with those obtained using pure water sprays. Dissolving salts in water significantly
enhanced the heat transfer rate in the transition and nucleate boiling regimes during spray
cooling. The increase in heat transfer rate was observed at al1 mass fluxes and impact
velocities as weii as concentrations in our experiments. The enhancement of critical heat
flux caused by the dissolved salts increased with the molar concentration of the dissolved
salts in water until the concentration reached the transition concentration. The
enhancement in heat transfer was mainly attributed to the inhibition of bubble
coalescence and foaming caused by the dissolved salts. The s d t particles remaining on

the surface aiso played a role in enhancement of spray cooling, because they increased
the transient roughness of the test surface. Even though the particles covenng the surface
produced thermal resistance between the droplets and the surface, the general effect was
to increase the heat transfer rate. The enhancement of the heat transfer rate by dissolving
the same molar concentration of salts in water was in the order of the ionic strength in the
solution. That is in the order of MgSO,, Na$04, and NaCl from rnost to least
enhancement. Dissolving the salts in water a concentration above the transition
concentration reduced spray cooling heat transfer due to the reduction of the vapor
pressure. The measured transition concentration for spray cooling agreed with that for
single droplet boiling very well. The dissolved salts increased the Leidenfiost
temperature and thereby improved heat transfer in the film boiling region. The time for
cooling of a surface from 240°C to lûû0C was reduced by up to 400%. Once the surface
temperature dropped below 10S°C, below which nucleation was completely suppressed,
dissolved salts had little effect on heat transfer fiom the surface. In the regime, the
dissolved salts may decrease spray cooling due to the reduction of vapor pressure.
Adamson, A. W., 1982, Physical Chemistry of Surfaces, A Wiley-Interscience
Publication, New York, 20-23 -
Akao, F. Araki, K., Mon, S. and Moriyama, A., 1980, Deformation Behavior of a Liquid
Droplet Impinging ont0 a Hot Metal Surface, Transaction of lron and Steel Industry
of Japan, 20, pp. 737-743.
Baumeister, K. H. & Hamil, T. D. and Schoessow, G. J., 1966, A generalized correlation
of vaporization times of drops in film boiling on a flat plate, The 3rd Int. B a t
Transfer Con$, Chicago, IL, Vol. 4, pp. 66-73.
Beck, J. V., Litkouhi, B., and St. Clair, C. R. Jr-, 1982, Efficient Sequential Solution of
The Nonlinear Heat Conduction Problem, Numenlcal Heat Transfer, Vol. 5, pp. 275-
286.
Beck, J. V., Blackwell, B. and St. Clair, Jr., C. R., 1985, Inverse Heat Conduction, A
Willey-Interscience Publication, New York.
Behar, M., Courtaud, M., Rcque, R., and Seneria, R., 1966, Fundamental Aspects of
Subcooled Boiling With and Without Dissolved Gases, Proc. 3rd Int. B a t Trans.
Con$, Vol. IV, pp, 1-1 1.
Bernardin, J. D. and Mudawar, I., 1996, Experimental and statistical investigation of
changes in surface roughness associated with spray quenching, International Journal
of B a t and Mass Transfer, Vol. 39, No. 10, pp. 2023-2037.
Bernardin, J. D. and Mudawar, I., 1997a, Film boiling heat transfer of droplet streams
and sprays, International Journal of Heat and Mass Transfer, Vol. 40, No. 1 1, pp.
2579-2593.

Bernardin, I. D. and Mudawar, I., 1999, The Leidentiost Point: Experimental Study and
Assessrnent of Existing Models, ASME Journal of Ba t Transfer, Vol. 121, pp. 894-
903.
Bernardin, J, D. and Stebbins, C. J. and Mudawar, I., 1997b, Mapping of Impact and Heat
Transfer Regimes of Water Drops Impinging on a Polished Sinface, International
Journal of Heat and Mass Transfer, Vol. 40, NO. 2, pp. 247-267.
Bernardin, J- D. and Stebbins, C, J. and Mudawar, I., 1997, Effect of surface roughness
on water droplet impact history and heat transfer regimes, International Journal of
Heat and Mass Transfer, Vol. 40, No. 1, pp- 73-88.
Bolle, L. and Moreau, J. C., 1982, Spray Cooling of Hot Surfaces, Multiphase Science
and Technology, Vol. 1, Hemisphere Publishing Co., Washington.
Brimacombe, J. K., Agarwal, P. K., Baptista, L. A., Hibbins, S. and Prabhakar, B., 1980,
Spray Cooling in the continuous casting of steel, Proceedings of the National Open
Heavth and Baisc Ocygen Steel Con$erence, Washington, D.C., Vol. 63, pp. 235-252.
Bryan, J. L., 1993, Fire Suppression and Detection Systems, Macmilan Publishing Co.,
New York, pp. 33 1-334.
Chandra, S. and Avedisian, C. T., 1992, Observations of Droplet Impingement on a
Ceramic Porous Surface, international Journal of Heat and Mass Transfer, Vol. 35,
No, 10, pp. 2377-2388.
Chandra, S., d i Marzo, M., Qiao, Y. M., & Tartarini, 1996, Effect of Liquid-Solid
Contact Angle on Droplet Evaporation, Fire Safety Journal, Vol. 27, pp. 14 1 - 158.
Chang, S. K., Kang, Y. and Kim, S. D., 1987, Mass Transfer in Two and Three-Phase
Fluidized Beds, Journal of Chernical Engineering of Japan, Vol. 19, No. 6, pp. 524-
530.
Charlesworth, D. H., and Marshall, W. R., Jr., 1960, Evaporation fiom drops containhg
dissolved solids, A.1Ch.E. Journal, Vol. 6, No. 1, pp. 9-23.

Chaves H,, Kubitzek, A. M-, and Obermeier, F., 1999, Dynarnic processes o c c h g
during the spreading of thin liquid films produced by drop impact on hot walls,
International Journal of Heat and Fluid Flow, 20, pp. 470-476.
Chen, J. C, and Hsu, K. K., 1995, Heat Transfer During Liquid Contact on Superheated
Surfaces, ASME Journal of k t Transfer, Vol. 1 17, pp. 693-697.
Ciofalo, M., Di Piazza, I., and Brucato, V., 1999, Investigation of the cooling of hot waUs
by liquid water sprays, InternationaI Journal of Heat and Mass Transfer, Vol. 42,
N0.7, pp. 1157-1 175,
Cistemas, L. A. and Lam, E. J., 1991, An analytic correlation for the vapor pressure of
aqueous and non-aqueous solutions of single and mixed electrolytes, Part II.
Application and Extension, FIuid Phase Equilibna, Vol. 62, pp, 1 1-27.
Clever H. L. and Rattino, R., 1992, The Solubility of Gases in Liquids, CRC, Chapter
ViI, New York.
Cox, T. L,, and Yao, S. C,, 1999, Heat Transfer of Sprays of Large Water Drops
Irnpacting on High Temperature Surface, ASME Journal of Neat Tiansfer, Vol. 12 1,
May, pp. 446-450,
Craig, V. S. J., Ninham, B. W. and Pashley, R- M., 1993, The Effect of Electrolytes on
Bubble Coalescence in Water., J . Phys. Chem. Vol. 97, pp. 10192- 101 97.
Cryder, D. S. and Gilliland, E. R., 1932, Heat transmisson fiom metal surfaces to boiling
liquids, Ind. Eng. Chem., Vol. 24, pp. 1382-1387.
Del Pczon, M. and Briens, C. L., Eftèct of liquid coalescing properties on mass transfer,
heat transfer and hydrodynamics in a three-phase fluidized bed, The Chernical
Engineering Journal, 55, pp, 1 - 14.
Deiters, T. A. and Mudawar, 1.,1990, Prediction of the Temperature-Time Cooling
C w e s for Three-Dimensional Aiuminum Products during Spray Quenching, Joumal
of Heat Transfer, Vol. 8, pp. 8 1-91.

di Marzo, M., Evans, D. D., 1989, Evaporation of water droplet deposited on a hot high
thermal conductivity solid surface, ASME Journal of Heat Transfer Vol- 1 1 1, pp.
220-213.
di Marzo, M. Tartarini, P. Liao, Y. Evans, D. and Baum, H., 1993, Evaporative cooling
due to a gently deposited droplet, International Journal of Heat and Mass Transfer,
36,4133-4139.
Esters, K. A. and Mudawar, I., 1995, Correlation of Sauter mean diameter and critical
heat flux for spray cooling of small surfaces, International Journal of B a t and Mass
Transfev, Vol. 38, NO. 16, pp, 2985-2996.
Finnerty, A. E., 1995, Water-Based Fire-Extiaguishing Agents, Proceedings of Halon
Opfions Technical Working Conference, Albuquerque, New Mexico, pp. 46 1-47 1.
Fogg, P.G.T. and Gerrand, W., 199 1, Solubility of gases in Iiquids: a critical evaluation
of gasAiquid systems in theory and practice, Chichester, New York: Wiley.
Gorton, C. W., 1953, Ph.D. Thesis, Purdue University
Groendes, V. and Mesler, R., 1982, Measurement of Transient Surface Temperature
Beneath Leidenfios t Water Drops, The 7th International Heat Transfer Con ference,
Munich, Germany, PB20: 1 3 1 - 136.
Grove, C. S., Grove, S. T., Jr. and Aidun, 1962, A. R., Improving the effectiveness of
water for fire fighting, Fire Research, pp. 54-66.
Hey, J. M., ShieId, D. W., Speight, J. M., and Will, M. C., 1981, J. Chem. Soc., Faraday
Trans., Vol. 1, No. 77, pp. 123-128.
Hoogendoom, C. J. and den Hond, R., 1974, Leidenfkost Temperature and Heat Transfer
Coefficients for Water Sprays Impiaging on a Hot Surface, 5th International Heat
Transfer Conference, Tokyo, 13 5- 13 8.
Horvath, A. L., 1985, Handbook of Aqueous Electrolyte Solutions: Physical Properties,
Estimation and Correlation Methods, Ellis Horwood Limited, pp. 299-320.

Hu, W., Smith, J. M., Dogu T., Dogu, G-, 1986, Kinetics of Sodium Bicarbonate
Decomposition, M C . Journal, Vol. 32, No. 9, pp. 1483-1490.
Inada, S. and Yang, W. J., 1993, Mechanisms of miniatutization of sessile drops on a
heated surface, international Journal of Heat und M u s Transfer, Vol. 36, No. 6, pp.
1505-1515.
Incopera, F. P. and DeWitt, D. P., 1996, Fundamental of Heat and Mass Transfer, 4th
edition, John Wiley and Sons Inç.
International Critical Table, 1933, Vol. II and V, McGraw-Hill, New York.
Jarnialahmadi, M- and Muller-Steinhagen, H., 1990, Pool Boiling Heat Transfer to
Electrolyte Solutions, Chem. Eng. Process., Vol. 28, pp. 79-88.
Jarnialahmadi, M., Blochl, R., and Muller-Steïnhagen, H., 1989, Bubble Dynamics and
Scale Formation during Boiling of Aqueous Calcium Sulphate Solutions, Chem. Eng.
Process., 26, pp. 15-26.
Jeschar, R., Kraushaar, H. and Griebel, H., 1996, Influence of gases dissolved in coolhg
water on heat transfer during stable film boiling, Steel Research, Vol. 67, No. 6, pp.
227-234.
Jho, C., Nealon, D., Shogbola, S., and King, A. D., Ir., 1977, Effect of pressure on the
surface tension and water: Adsorption of hydrocarbon gases and carbon dioxide on
water at temperatures between O and 50°C: Journal of Colloid and Interface Science,
Vol. 65, No. 1, pp. 141-154.
Keitei, G, and Onken, U., 1982, Inhibition of bubble coalescence by solutes in aidwater
dispersions, Chernical Engineering Science, Vol. 17, pp. 1635-1 638.
King, M.D., Yang, J.C., Chien, W. S. and Grosshandler, W. L., 1997, Evaporation of a
small water droplet containing an additive, Proceedings of the 32nd National Heat
Transfer Conference, Vol. 4, pp. 45-57.

Klinzing, W. P., Rozzi, J. C. and Mudawar, I., 1992, FiIm and Transition Boiling
Correlations for Quenching of Hot Surfaces with Water Sprays, Journal of Neat
Treating, 9, pp. 9 1-93.
Kosky, P. G., 1968, Nucleation Site Instability in Nuçleate Boiling, Int- J. Heat Mass
Transfer, Vol., 1 1, pp. 929-932.
Kudra, T., Pan, Y-K., and Mujumdar, A. S., 199 1, Evaporation From Single Droplets
Impinging on Heated Surfaces, Dving Technology, 9(3), pp. 693-707.
Labeish, V. G., 1994, Themohydrodynamics Study of a Drop Impact against a Heated
Surface, Experimental mermal and Fluid Science, Vol. 8, pp. 1 8 1 - 1 94.
Lencha, M. M-, Anderko, A., Sanders, S. J., and Young, R. D., 1998, Modeling Viscosity
of Multicomponent Electrolyte Solutions, International Journal of Thermophysics,
Vol. 19, No. 2, pp. 367-379.
Lessard, R, R. and Zieminski, S. A., 1971, Bubble Coalescence and Gas Transfer in
Aqueous Electrolytic Solutions, Ind. Eng. Chem. Fundam., Vol. 10, No. 2, pp. 260-
269.
Li, 2. B., Li, Y. G. and Lu, J. F., 1999, Surface Tension Mode1 for Concentrated
Electrolyte Aqueous Solution by the Pitzer Equation, Ind. Eng. Chmn. Res., Vol. 38,
pp. 1133-1 139.
Leidenfkost, J. G., 1756, De Aquae Cornmunis Nonnullis Qualitatibus Tractatus,
Duisburg on Rhine. (The relevant portion has been translated and pubüshed in Int. J.
Heat Mass Transfer, Vol. 9, pp. 1153-1 166,1966.)
Lorenz, J. J., Mikic, B. B., and Rohsenow, W. M., 1974, The Effect of Swface
Conditions on Boilhg Characteristic, Proc. F@h Int. Heat Transfer ConJ, Vol. IV,
pp. 35-39
Lubetkin, S. D. and Akhtar, M. 1996, The variation of d a c e tension and contact angle
under applied pressure of dissolved gases, and the eEects of these changes on the rate

of bubbie nucleation, Journal of CoiZoid und Inte$ace Science, Vol- 180, No. 1, pp.
43 -60.
Makino, K. and Michiyoshi, I., 1979, Effect of the initial Size of Water Droplet on its
Evaporation on Heated Surfaces, international Journal of Heat and MW Tramfer,
Vol. 22, pp. 979-981.
Marrucci, G., 1969, A theory of coalescence, Chemical Engineering Science, Vol. 24, pp.
975-985.
Marrucci, G. and Nicodemo, L., 1967, Coalescence of gas bubbles in aqueous solution of
inorganic electrolytes, Chemical Engineering Science, Vol. 22, pp. 12574265-
McAdams, W. H., K e ~ e l , W. E., Minden, C. S., C d , R., Picomell, P. M., and Dew, J.
E., 1949, Heat Transfer at High Rates to Water with Surface Boiling, industrial and
Engineering Chemistry, September, pp. 1945- 1953.
McGinnis, F. K. and Hohan, J. P., 1969, Individual Droplet Heat-Transfer Rates For
Splattering on Hot Surfaces, International Journal of Heat and Mass Transfer, Vol.
12, pp. 95-108.
Michiyoshi,I. and Makino, K., 1978, Heat Transfer Characteristic of Evaporation of a
Liquid Droplet on Heated Surfaces, International Journal of Heat and M i s Tranrfer,
Vol. 21, pp. 605-613.
Miyatake, O, Tanaka, I., and Lior, N., 1994, Bubble growth in superheated solutions with
a non-volatile solute, Chemical Engineering Science, Vol. 49, No. 9, pp. 130 1-1 3 12.
Mizikar, E. A., 1970, Spray Cooling Investigation for Continuous Casting of Billets and
Blooms, Iron and Steel Engineer, June, 53-70.
Mudawar, 1. and Valentine, W. S., 1989, Determination of the Local Quench C w e for
Spray-Cooled Metallic Surfaces, Journal Heat Treating, 7, pp. 107- 12 1.

Mudawar, 1. and Deiters, T. A., 1994, A miversal approach to predicting temperature
response of metallic parts to spray quenching, International Journal of Heat and
Mass Transfer, Vol. 37, No. 3, pp. 347-362-
Muller, V. M., 1990, Electroviscous Effect When Charged Surfaces Approach On
Another in Electrolyte Solution, Journal of CoZZoid and Interface Science, Vol. 136,
NOS, April, pp. 61-67,
Muller-Steinhagen, H., Epstein, N. and Watkinson, A. P., 1987, Subcooled Boiling of
Heptane and of Water with Various Dissolved Gases, Proceedings of 1987 ASME-
JSME Bermal Engineering Joint Conference, pp. 125- 13 1.
Murphy, R. W. and Bergles, A. E., 1972, Subcooled Flow Boiling of Fluorocarbons-
Hysteresis and Dissolved Gas Effects on Heat Transfer, Proceedings of Heat Tram
and Fhid Mech. I . t t , Stanford University Press, pp. 400-416.
Najibi, S. H., Muller-Steinhagen, H. and Jarnialahmadi, M., 1996, Boiling and Non-
Boiling Heat Transfer to Electrolyte Solutions, Heat Tramfer Engineering, Vol. 17,
No. 4, pp. 46-63.
Natelson Microgasometer Models # 600 and 650# Manual, Scientific Industries, hc.
Oolman, T. 0. and Blanch, H. W., 1985, Bubble coalescence in stagnant liquids, Chem.
Eng. Commun. Vol. 43, pp. 237-261.
Pais, M. R., Chow, L. C., and Mahekey, E. Tmy 1992, Surface Roughness and Its Effects
on the Heat Transfer Mechanism in Spray Cooling, ASME Journal of Heat Transfer,
Vol. 114, pp. 21 1-219.
Pais, M. R. and Chow, L. C., 1993, Multiple Jet Irnpingement Cooling, Journal of
Thermophysics and Heat Tramfer, Vol. 7, No. 3, pp. 43 5-440.
Parsley, R. M. and Craig, V. S., 1997, Effect of Electrolytes on Bubble Coalescence,
Langmuir, 1 3,4772-4774.

Pedersen, C . O., 1970, An experimental Study of the Dynamic Behavior and Heat
Transfer Charactenstic of Water Droplets Impinging upon a Heated Surface,
International Journal of Heat and Mass Tramfer, Vol. 13, pp. 369-3 8 1.
Pike, F. P., Miller, P. D., Jr. and Beatty, K. O., Jr., 1955, Effect of Gas Evolution on
Surface Boiling at Wie Coils, Chem. Engrg. Prog. Symp. Series, Vol. 5 1, No. 17, pp.
13-19.
Prince, M. J. and Blanch, H. W., 1990, Transition electrolyte concentrations for bubble
coalescence, A.I. CkE. Journal, Vol. 36, No. 9, pp. 1425-1429.
Qiao, Y- M. and Chandra, S., 1996, Boiling of droplets on a hot surface in low gravity,
Int. J , Keut Mass Transfer, Vol. 39, No. 7, pp. 1379-1393.
Qiao, Y. M. and Chandra, S., 1997, Experiments on adding a &actant to water drops
boiling on a hot surface, Proc. R Soc. Lond. A, Vol. 453, pp. 673-689.
Qiao, Y. M. and Chandra, S., 1998, Spray cooling enhancement by addition of a
surfactant, ASMEJournal of Heat Tramfer, Vol. 120, pp. 92-98.
Qiao, Y. M., 1 996, Ph.D. Thesis, University of Toronto, Toronto, ON, Canada.
Ranz, W. E. and Marshall, W. R., 1952, Evaporation fiom Drops, Part 1 Chem Eng.
Prog., Vol. 48, pp. 141-146.
Ranz, W. E. and Marshall, W. R., 1952, Evaporation fiom Drops, Part 2, Chem. Eng.
Prog., Vol. 48, pp. 173-180.
Savic, P., 1958, The Cooling of a Hot Surface by Drops Boiling in Contact with It,
hational Research Council Canada, Rep. No. MT-37.
Sagert, N. H. and M. J. Quinn, 1978, The Coalescence of Gas Bubbles in Dilute Aqueous
Solutions, Chernical Engineering Science, 33, pp. 1087.
Seki, M., Kawamura, H. and Sanokawa, K., 1978, Transient Temperature Profile of a Hot
Wall Due to an Impinging Liquid Droplet, Journal of Heat Tronsfer, Vol, 100, pp.
167-169.

Shi, M. H., Bai, T. C., and Yu, J., 1993, Dynamic Behavior and Heat Transfer
Characteristic of a Liquid Droplet hpinging on a Solid Surface, Experirnentul
Thermal and Fluid Science, Vol. 6, pp. 202-207.
Shiga, S., Huang, Z., Shao, Y., Karasawa, T., Nahamura, and H., Makita, S., 1994,
Investigation of Gas-Dissolving Effect on the Spray-Formation of a Steady-let,
ICLASS-94 Rouren, France, Paper -2.
Smorodin, V. E., 1994, Hydrodynamics Instability of the Wetting Films (Boundary
Layers), Langrnir, Vol. 10, pp. 24192422.
Stairs, R. A., 1995, Calculation of Surface Tension of Salt Solution: Effective
Polarizability of Solvalated Ions, Canadian Journal of Chemistry, Vol. 73, pp. 78 1-
787.
Stephen, H. and Stephen, T., 1963, Solubilities of Inorganic and Organic Compounds,
Vol. 1 Binary Systems Part 1, Pergamon Press, pp. 1 15-1 16.
Tamura, 2. and Tanasawa, Y., 1959, Evaporation and Combustion of a Drop Contacting
with a Hot Surface, 7th Symposium @nt.) on Combustion, London, pp. 509-522.
Taniguchi, L, houe, T., and Asano, K., 1999, Evaporation of a Salt Water Drop with
Crystallization, Atomization and Sprays, Vol. 9, pp. 69-85.
Tanno, S., Fukai, J., Ohtani, S., Daikoku, M., and Aoki, Hm, 1988, Heat and Mass
Transfer on a Droplet of 200-300 pm in Diameter. froc. 5th In. Con$ on Liquid
Atomization and Spray Systems, pp. 369-374.
Tartarini, P., Lorenzini, and Randi, M. R., 1999, Experimental study of water droplet
boiling on hot, non-porous surfaces, Heat and M a s Tramfer, 34, pp. 437-447.
Tinker, S., di Marzo, M., Tartarini, P., Chandra, S., and Qiao, Y. M., 1995, Dropwise
Evaporative Cooling: Effect of Dissolved Gasses and Effect of Surfactants, Fire
sa fety developments fiom around the world: international conference, pp. 9 1-96.

Toda, S., 1972, A Study of Mist Cooling (1st Report: Investigation of Mist Cooling),
Heat Transfer - Jizpanese Research, Vol. 1, No. 3, pp. 39-50.
Toda, S., 1974, A Study of Mist Cooling (2nd Report: Theory of Mist Cooling and Its
Fundamental Experhents), Heat Transfer - Japanese Research, Vol. 3, No. 1, pp. 1-
44.
Torikai, K., Shirnamune, H., and Fujishiro, T., 1970, The Effects of Dissolved Gas
Content Upon Incipient Boiling Superheats, Proceedings of 4th Zizternational Ba t
Transfer Conference, Vol. V , 82.1 1.
Trommelen, A. M. and Crosby, E. J., 1970, Evaporation and Drying of Drops in
Superheated Vapors, AiCHE JI, Vol. 16, pp. 857-867.
Van Slyke, D. D., Neill, LM., 1924, The detennination of gases in blood and other
solutions by vacuum extraction and manometric measurement-I, Journal of
BioZogica l Chemishy, Vol. 6 1, pp. 523-573,
Van Slyke, D. D. and Stadie, W. C., 192 1, The Detemination of the Gases of the Blood,
Journal of Biological Chernistry, Vol. XLIX, pp. 30-3 1.
Wachters, L. H. J. and Westerling, N. A. J., 1966, The Heat Transfer fiom a Hot Wall to
Impinging Water Drops in the Spheroidal State, Chemical Engineering Science, Vol,
21, pp. 1047-1056.
Wachters, L. H. J., Bonne, H. and van Nouhuis, H. J., 1966, The Heat Transfer from a
Hot Horizontal Plate to Sessile Water Drops in SpheropdiaI State, Chemical
Engineering Science, Vol. 21, pp. 923-936.
Wasekar, V. M. and Mmgiik, R. M., 1999, A Review of Enhanced Heat Transfer in
Nucleate Pool Boiling of Aqueous Surfactant and Polymeric Solutions, Enhanced
Heat Transfer, Vol. 6, pp. 135-150.
Wilt, P. M., 1986, Nucleate Rates and Bubbles Stability in Water-Carbon Dioxide
Solutions, Journal of Colloid and Interface Science, VI 12, No. 2, pp. 530-538.

Woodbury, K. A., 1990, Effect of thennocouple sensor dynamics on d a c e heat flux
predictions obtained via inverse heat transfer analysis, International Journal of Heat
and Mass Transfer, Vol, 33, No, 12, pp. 2641-2649.
Wu, W.T., Yang, Y, M. and Maa, J. R., 1998, Nuçleate pool boiling enhancement by
means of surfactant additives, Ejcperimentai Thermal and Fluid Science, Vol. 18, pp.
195-209.
Yao, S- C. and Choi, K. J., 1987, Heat Transfer Experiments of Mono-Dispersed
Vertically hpacting Sprays, Int. J. Muftiphase Flow, Vol. 13, No. 5, pp. 639-648.
Yao, S. C. and Heruy, R. E., 1976, Hydrodynamics instability induced liquid-solid
contacts in film boiling, ASME Paper 76-WA/HT-25.
You, S. M., Simon, T. W., Bar-Cohen, A. and Hong, Y. S., 1995, Effects of Dissolved
Gas Content on Pool Boiling of a Highly Wetting Fluid, Journal of Neat Transfer,
Vol. 1 17, pp, 687-692.
You, S. M., Simon, T. W. and Bar-Cohen, A., 1991, Reduced Incipient Superheats in
Boihg of Fluids Which Holds Dissolved Gas, ASME Phase Change Heat Transfer,
HTD-Vol. 159, pp. 109-1 17.
Young, R. K., and Hummel, R. L., 1964, Improved nucteate boiling heat transfer, Chem.
Eng. Prog., Voi. 60, No. 7, pp. 53-58.
Zaytsev, 1. D. and Aseyev, G. G., 1992, Properties of aqueous solutions of electrolytes,
CRC Press, Inc-
Zhang, N., Wang, B. X. and Xu, Y., 1987, Thermal instability of evaporating droplets on
a flat plate and its effects on evaporation rate, International Jountcll of Heat and Mass
Tramfer, Vol. 30, No. 3, pp. 469-478.
Zieminski, A. S. and Whitemore, R. C., 1971, Behavior of gas bubbles in aqueous
electrolyte solutions, Chem. Eng. Sci., 26, pp. 509-520.

APPENDICES
Appendix A Data Acquisition and Control @AC) System
A.l Single Droplet DAC System
To capture history of droplet impact on a hot surface. an electronic timing circuit
with a droplet detector and a time delay circuit described by Qiao (1996) in greater detail
was used. The timing circuit specifically designed and built for this study detected
detachment of a droplet and triggered the flash unit and camera with a resolution of lps.
Photographs of droplet evaporation were taken using this timing circuit and Labview VIS.
Detachment of a droplet was detected by the timing circuit, and the shot time was varied
by a data acquisition and control system (DAC). Once the droplet detached from the tip
of the hypodermic needle, it generated a peak to peak pulse through the time delay circuit
(the delay time was set O ms) to the data acquisition system. Setting the flash at the speed
of 1/1000s allowed the camera to take high quality photographs of droplet evaporation.
Figure A.1 shows the VI of the control system. This VI works with the PCI-MIO-
16E-4 board and SCB-68. Two built-in counters are used to count the t h e after droplet
impact and vary delay time to send a pulse signal to a bounce free circuit, tnggering the
camera. The Event or Time Counter Config M configures counter 1 to count the number
of rïsing edges of a ïTL signal at its Source INPUT pin. The Counter Start VI begins the
counting operation for counter. The Counter Read VI retums until the STOP button is
pressed or an error occurs. Finally, the Counter Stop VI stops the counter operation. Once
the Event VI received a signal and sent a value to the Generated Delayed Pulse VI, the
Generated Delayed Pulse VI varied the delay time and generated pulse trains. In this VI,

the edges of the interna1 SOURCE signal are counted to generate the output signal, the
GATE is not used (software start) and the pulse signal on the OUT pin gets connected to
the SCB-68 device. The delay time is varied by changing the pulse width. The signal
from the electronic time delay circuit is connected to Channel 1 and the trigger pulse
signal is sent to a bounce fiee circuit,
A.2 Spray Cooüng DAC System
A.2.1 Camera Control System
Figure A.2 shows the DAC system, which receives the temperature signal from
the SB37 input and sends the pulse to the camera, depending on the input temperature.
The AI Read One Scan VI configures the DAQ device (PCI-MIO-16E-4 board) to
acquire data from analog channel O, it performs calculation and evaluation on the data
and detennines whether the Generate Pulse VI (described above) outputs the puise signal
to the camera. Because the itetation count is connected to Ai Read One Scan, the
application configwes the DAQ device for analogy input only on the fust iteration of the
loop. The loop rate as well as the acquisition rate is specified by the loop rate (50 ms).
Since a targe nuinber of large-sized front panel indicators, like charts and graphs, affect
the control rate, only a few front panel indicators are kept to precisely control the loop.
A.2.2 Temperature Acquisition System
Figure A.3 shows the temperature acquisition system designed for recording
temperature variation with time during spray cooling. Signals measured by the inserted

thermocouples are amplified and filtered using a SB37 thennocouple module and passed
to the PCI-MI046E-4 board (National Instruments). The AI Config VI configures the
different parameters of the acquisition, such as the channels to be read and the size of the
buffer to use. The Start VI specines parameters to start the acquisition, such as number of
scans to acquire, the rate at which this VI takes the data, and the trigger setthgs. The AI
Read VI specifies parameters to retrïeve the data fiom the data acquisition buffer. The
retrieved data is passed to the transposed waveform graph and aiso saved in a file on the
hardware of the cornputer. Finally, the AI Clear VI is caiied to dedocate all bufEers and
other sources used for the acquisition by invalidating the tasldl). If an error occus in any
of these VIS, the program passes the error through the remaining VIS to the Simple Error
Handler VI, which notifies the user of the error.


Figure A.2 Diagram of the camera control system for spray cooling.


The study on boiling of droplets containing dissolved salts requires reasonabIy
accurate calculations of the physical properties of the electrolyte solutions. The physical
properties involved in this study include vapor pressure, viscosity, surface tension,
solubility. Variations of these properties are detennined as follow.
B.l Vapor Pressure
A vapor pressure equation for aqueous and non-aqueous solutions of single and
mixed electrolytes proposed by Cistemas & Lam (1991) was used in this study. This
correlation was examined for 176 systems (4157 experimental points). It gives results up
to 44 mol kg-' of ionic strength. Vapor pressure of electrolyte solutions can be calculated
as:
log P = Kl[A - B/(T - Es)] + [C - D/(T - Es)] (Bel)
w here
A = As + 3.605918 - 41 + Ms/2303 (8.2)
B = 8, + 1.3829821 - 0.03 1 18512 03-31
C = Cs - 3.3993348 - 31- 1.1 1614E - 4x2 + M,Z(l- ~ ) / 2 3 0 3 (B -4)
D = D, - 0.13848 11 + 0.0275 1 1z2 - 1.792778 - 313 (B.3
I = 0.5C viz; (B.6)
X = 2(v+ + v- ) / (v+~f + V-Z-~) (B.7)
In eqns. (B. 1) - (B.5) P is the vapor pressure @Pa), T is the temperature (K), I is
the ionic strength (mol kg-'), M, is the molecular weight of solvent, K is an electrolyte
parameter and A,, B,, Cs, D, and Es are solvent parameters. In eqn. (B.7) v+ is the number

of moles of cation and v- is the number of moles of anion produced by the dissociation of
one mole of electrolyte, and Z+ denotes the valency of cation and the valency of anion.
For water, the constants in the above equations are A,=-0.02 13302, Bs=-5.3909 15,
C~7.192959, Dr1730.2857 and E~39.53
The K values of the electrolytes used in this study are s h o w in Table B. 1. In thk
table N is the number of experimental data points, Imax is the maximum ionic strength,
AI shows the maximum and minimum temperatures in kelvins, %Av. Dev. is the average
percentage deviation.
and a is:
Table B.l K values and average percentage deviation of vapor pressure of aqueous solutions of single electrolytes
Electrolyte N AT ~~ K %Av.Dev.
The variations of vapor pressures of the electrolyte solutions used in this study were
calculated and stiown in Figure B.1.

B.2 Surface Tension
Surface tension of a muticomponent electrolyte solution can be caiculated by the
formula:
a = O,, + 0.049(1- a,) (B.11)
where a is the surfaçe tension of the solution of a muticomponent electrolyte in N/m, a,
is the interface tension of water in N/m, a, is water activity in mdticomponent solution.
Surface tension of water can be determined ftom the equation:
Water activity in a multicomponent solution can be calculated as follows:
where Fi, Qi are coefficients, mi is the solution molarity, a mole of substance dissolved in
lkg of solvent.
The Fi and Qi coefficients are calculated by the formula:
q =hi + ~ ~ t + f , , t ' CB - 14)
Qi = q ~ i + 4iir + q2it2 (B-15)
The fni and qni obtained from the experiment data are listed in Table B.2.
Table B.2 Coefficients in Eq. B. 13 for calculation of water activity over 0-100°C
Electrolyte -fa. 106 -f,,.lo6 -fZi.1o6 -g0i.1o6 -gli. log -gZi. 108 A,%

B.3 Viscosity
Dynamical viscosity coefficients cm be calculated by the formula:
where q is the viscosity of a multicomponent solution in Pas; q, is water viscosity in
Pa.s; Di are coef'ficients, ci is the mass content of the component in kilograms of the
substance per lkg of the solution.
Water viscosity can be determined fiom the Slott formula:
q, = 0.59849(43.252 + t ) - lYn
where t=(O, 100°C), S0=2. IO4 Pas
The Di coefficients are calculated fiom dependences
Q = doi + dlit + 4 t 2 (B-18)
The dRi coefficients for the electrolytes used in this study are given in Table B.3.
Variations of viscosity of the salts used in this study with concentration at the
temperature of 100°C are shown in Figure B.2.
Table B -2 Coefficients in Eq. B. 18 for viscosity
Electrolyte &@ 102 d,,. 104 d2plb S,. 104.Pa*c

No practical correlations are available for calculation of viscosity. Variations of
the solubility of the electrolytes used in this study with temperature were obtained fiom
literature and s h o w in Figure B.3.

O 0.02 0.04 0.06 0.08 0.1 0.12 0.14 0.16 0.18 0.2 salt concentration (kgkg)
Figure B. 1 Variations of vapor pressures of the electrolyte solutions with increasing mass concentration at 100°C.

5 10 15 20 25 30 35 concentration (weight %)
Figure B.2 Variation of viscosity of the salts used in the experiments with increasing mass concentration at 100°C.

100 150 200 temperature ( O C )
Figure B.3 Variations of solubility of the electrolytes with increasing solution temperature.

Appendix C Determination of Carbon Dioxide Concentration in Water
Determination of the amount of dissolved gas has been carried out by various
physical and chernical methods. Many different physical methods for determinhg the
solubility of gases in Liquids were described in earlier reviews. Basically, physical
methods may be divided into two broad classification: saturation methods wherein a
previously degasses solvent is saturated with a gas under conditions in which the
necessary pressures, volume, and temperatures may be determined; and extraction
methods wherein the dissolved gas in previously saturated solution is removed under
conditions in which the pressure, volume, and temperature may be determined.
Equilibrium saturation conditions have k e n attained for the gas and iiquid phases by
shaking a mixture of the two, by flowing a thin film of Liquid through the gas, by
bubbling (usually via a fiitted disc) the gas through the Liquid, or by flowing the gas over
the liquid whiie it is held stationary on some supporting medium (as in gas-liquid
partition chromatography).
In this study, a Natelson Microgasometer (Mode1 #650), which is s h o w in Figure
C.l, was employed to measure carbon dioxide concentration in water. This Natelson
Microgasometer adapts the classical Van Slyke manometric method to ultra-micro
analysis. This manorneûic apparatus is based on the principle of extraction of gases from
the liquid by shaking the liquid in a relatively large fiee space in a Tomcellian vacuum
and subsequent measurement of the pressure of the Liberated gas after reducing the
volume of the extracted gas to a limited volume. A certain portion of the dissolved gas
remains unextracted and can be cakulated to correct the total volume of the dissolved gas
measured fiom the extracted gas.

Operation procedures for determination of CO,
Advance the mercury untii a small &op is held on the tip of the pipette. Draw in
from each vial as foilows:
1) Sample - 0.03 ml. of liquid and 0.01 to 0.02 ml. of mercury.
2) Lactic Acid - 0.03. lactic acid and 0.01 ml. of caprylic alcohol followed by 0.1 ml.
of mercury.
3) Water - 0.1 ml. of distiifed and degassed water, foilow with mercury to the 0.12
ml. mark of reaction chamber.
Manipulate controls as foilows:
4) Close the reaction chamber stopcock and retreat with piston until üquid level is
halfway into reaction chamber.
5) Loosen clamping h o b and shake for one minute.
6) Advance piston tiii the top aqueous meniscus is at the 0.12 ml. mark.
7) Record manometer reading P, and temperature.
8) Advance piston till mercury is at top of manometer.
9) Hold NaOH vial under pipette and open reaction chamber stopcock.
10) Adjust mercury if necessary until drop is at tip of pipette.
Draw in from NaOH via1 as follows:
11) 0.03 ml. of NaOH and mercury to O. 12 ml. mark.
Manipulate controls as follows:
12) Close reaction chamber stopcock and retreat with piston. Shake for one minute until
Iiquid level is halfway into reaction chamber.
13) Advance piston till aqueous meniscus is at 0.12 ml. mark.
14) Record manometer reading P,.
Cdculate results:

15) CO2 content = (PL-Pa multiplied by the factor for temperature.
Calculation of CO, concentration
The total CO, content of the solution analyzed is obtained by reducing the volume
of CO, extracted to staodard conditions by multiplication with the usud factor
( B - w)273, and adding the volume to correct the volume x of CO2 remaining in 760T
solution.
where
a = volume of CO, obtained by one extraction and measured at atmospheric
conditions of ta temperature and B mm, barometric pressure. (0.12 ml.)
T = the room temperature in K.
B-w = the barometric pressure corrected for w, the vapor tension of water.
Since the volume x of gas dissolved is proportional to its partial pressure @), solubility
( a,, ), and the volume of the solvent (S), the volume x of CO, remaining in solution can
be expressed as:
where
S = Total volume of solution from which gas is extracted (0.17 ml.).
Since pressure varies inversely with gas volume,
- B - w A - S
a p = ( B - w ) -
A-S
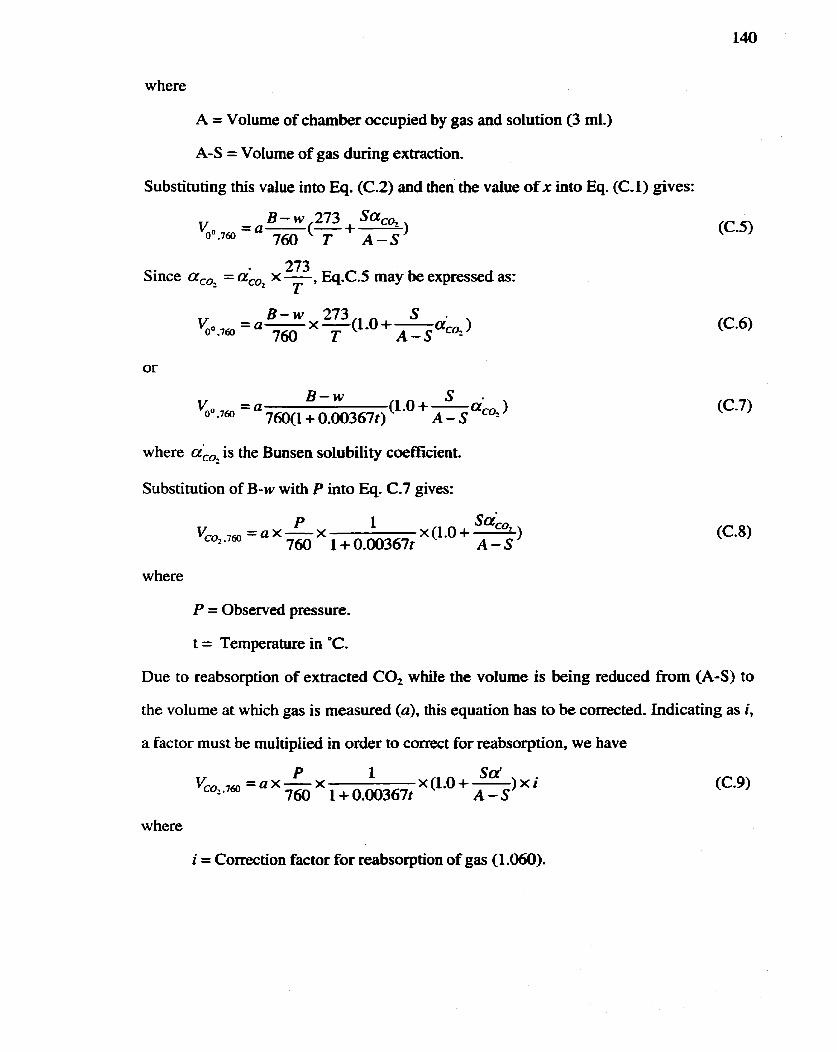
where
A = Volume of chamber occupied by gas and solution (3 ml.)
A-S = Volume of gas during extraction.
Substituting this value into Eq. (C.2) and then the value of x into Eq. (C. 1) gives:
B - w 273 sac% %,*, =a-(-+- 760 T A-S
273 Since a,, = a,, x -, Eq.C.5 may be expressed as: T
where aio2 is the Bunsen solubiiity coefficient.
Substitution of B-w with P into Eq. C.7 gives:
- P 1 S&O2 Vco2.760 - a - ~(1 .0 +- 760 1 + O.ûû367t A - S
1
where
P = Observed pressure.
t = Temperature in OC.
Due to reabsorption of extracted CO2 while the volume is k i n g reduced fiom (A-S) to
the volume at which gas is measured (a), this equation has to be corrected. Indicating as i,
a factor must be mdtipiied in order to correct for reabsorption, we have
P 1 Sa' VCOL.7 = a x - x(l.O+-)xi
760 1 + 0.00367t A - S
w here
i = Correction factor for reabsorption of gas (1.060).

In addition, the temperature effect on the specinc gravity of mercury must be included.
The temperature for reading a bammeaic column on a glass scale, according to Landolt-
Boms tein' s 'Tabeilen", 0,000 lî2t mm. for each millimeter in height of the barometric
column. Inaoducing this correction, Eq. C.9 becmes
P 1 - 0.O00172r sa;& )i vco2 - 7 = a - x(l.O+- 760 1 + 0.00367t A-S
(C. 10)
Simpl@ing Eq. C. 10 by discarding negligible decimals in the resulting coefficients of f
yields:
P 1 vcoz . , = a - 760 1 + O.ûû384t A-S
The concentration of dissolved CO, can be expressed as follows:
- 1 P 1 - 0.000172t C C O = . , - - x a x - )i ( m ~ d ) x (1.0 +-
S 760 1 + O.ûû367t A - S
(C. 1 1 )

,lI.gneÜc Stirrer S u p p t
Guide Bu
P-ion S u p p t Lcrd Sa-
/ /r Fmnt Support
-Hmd Wbtd
- Drive Govcr
Figure C. 1 Natelson Microgasometer (Mode1 #650, Scientific Industries, Inc.)

Appendix D Decomposition rate of Sodium Bicarbonate
The decomposition reaction 2 NaHC03 (s) + Na2C03 (s) + H20 (g) + CO, (g) is
highly dependent on temperature. Hu et al. (1986) reported that the decomposition was
first order in mass of NaHCO,. The decornposition rate can be calculated by the
following correlation (Hu et al., 1986).
where W is the mass of NaHC03 at any time, Wo is the initial mass of NaHC03. t is the
reaction time, and k, is the decomposition rate (s-'). k, can be calculated in Arhenius
equation:
kd = ko exp(-E l RJ) (Da
where k, is the pre-exponential factor of decomposition, 1.43x101' sel; E is the activation
energy, 102 kllmol. The decomposition rate is very fast at temperature above 40K
(123°C). The arnount of NaHC03 decomposing during droplet evaporation and CO2
produced from the decomposition process were calculated and shown in Figure D.l and
Figure D.2, respectively .

NaHCO, decomposing at the end of evaporation (kgkg initial NaHCO )
3

1 + CO, dissolved in water
I
100 120 140 160 180 200 sudace temperature (OC)
Figure D.2 Production rate of CO, (kgkg) during boiling of a droplet containing NaHCO, on a hot surface at temperatures ranging fiom 100% to 210°C.

Appendix E Computer Programs
* Calculate Vapor Partial Pressure, Surface Tension and Viscosity of Electrolyte * Solutions *********************************************************************** *
PARAMETER(ID=18) INTEGER I,IB,IE,IDATI,IDATO REAL T(1D) REAL A, B, C, D, E REAL As, Bs, Cs, Ds, Es, Ms, K, MWS REAL X AL f;D,fl,fl,qO,ql ,q2 REAL d0,dl ,d2 INTEGER VP, VN, ZP, ZN REAL P(ID),CONCENT(ID),ION(ID),STû(ID),ST(D)
= 3 P ( I D ) , ~ S ( ~ ) *
CALL FILDEF(IDAT1,IDATO) CALL INPUT(IB,IE,ID,As, Bs, Cs, Ds, Es, Ms, K, MWS, VP, VN, ZP, ZN,
C ~,fl,Q,q0,ql,q2,do,dl,d2,~ATI) CALL ECHO(IB,IE,ID,As, Bs, Cs, Ds, Es, Ms, K, MWS, VP, VN, ZP, ZN,
C fû,fl ,Q,qO,ql,qZ,dO,dl,d2,IDATO) CALLSURFACETENSION(IB,IE,ID,fD,fl ,fL,qO,q 1 ,q2,MWS,CONCENT,T,STO,
C DATO) CALL VAPPRESSURE(IB,IE,ID,As, Bs, Cs, Ds, Es, Ms, K, MWS, VP, VN, ZP,
C ZN, CONCENT,ION,T,P,IDATO) CALL BOILINGPOINT(IB,IE,LD,~,fi,fS,qO,ql ,q2,MWS, CONCENT,TBP,iDATO) CALL VISCOSITY(IB,IE, lD,dO,dl ,d2,MWS,CONCENT,~) WRITE(IDAT0,lOO) WRITE(IDATO,101)(T(I),ION@),P(I),ST~,ST(I),TBP(I),VIS(I),CONCENT(I),
C I=IB,IE) 1 O0 FORMAT(/,' T',2X,' ION(mo1 kg-l)',ZX,' P(kpa)',ZX,' STO(N/m)',
C 2X,' ST(N/m)',2X,' TBP(Q',SX,' VIS',SX,' CONCENT)%)') 101 FORMAT(l~F7.3,4X,F8.5,4X,F12.5,2XF12.5,2&F12.5,2X,

C STOP END
*
* File:inputf contains 3 surbroutines: FILDEF, INPUT and ECHO ************************************************************************
SUBROUTINE FILDEF(IDAT1, IDATO) * * Subroutine to dehne unit numbers and open data files. * INTERGER DATI unit number for file with formatted input data; input * INTERGER DATO unit number for file with formatted output; output ***********************************************************************
INTEGER IDATI, IDATO * * FILE UNIT NUMBERS *
OPEN(IDATT,FILE='ia.datt) OP EN(IDATO,FILE='out.dat1) RETURN END
*
SUBROUTINE INPUT(IB,IE,ID,As, Bs, Cs, Ds, Es, Ms, K, M\KS, VP, VN, ZP, C ZN, fD,fl,£L,qO,ql,q2,dO,dl,d2,IDATI)
* Subroutine to read input variable from a data file INTEGER IB,E first and last data indices in i; output ïNTEGER ID, the total number of experiment data set REAL T(ID) the temperature of the electrolyte solution; output REAL As, Bs, Cs, Ds, Es the parameters of the solvent; output REAL Ms the molecular weight of the solvent; output REAL K an electrolyte parameter; output REAL CONCENT the concentration (mas) of tht solution; output REAL VP the nurnber of moles of cation produced by dissociation
of one mole of the elecûolyte; output

* REAL VN the number of moles of anion producecl by dissociation * of one mole of the electrolyte; output * REAL ZP the valency of cation; output * REAL ZN the valency of anion; output * INTERGER DATI unit number for file with formatted input data; input ************************************************************************
INTEGER I,FB,IE,IDATI REAL As, Bs, Cs, Ds, Es, Ms, K, MWS INTEGER VP, VN, ZP, ZN REAL ~,fl,f2,qO,ql,q2,dO,dl,dS
* IB=l IE=ID
* * Set the initial values as zero
As=O.O Bs=O.O cs=o.o Ds=O.O Es=O.O Ms=O.O K=O,O VP=o.o VN=o.o ZP=o.o ZN=O.O m=o.o fl =o.o f2=0.0 q e o . 0 ql =o.o q2=0.0 dO=O.O dl=0.0 d2=0.0
*

500 1 FORMAT(6E14.4) READ(IDATI,5002) dO,d 1 ,d2
5002 FORMAT(3 E 14.4) RETURN END
*
* Subroutine to echo the input data read h m file * INTERGER IDATO unit number for flle with formatteâ output; output * See INPUT for other variables definitions ************************************************************************
INTEGER I,IB,IE,IDATO REAL As, Bs, Cs, Ds, Es, Ms, K, MWS INTEGER VP, VN, ZP, ZN REAL fû,fl,f2,qO,ql ,q2,dO,dl,d2 WRITE(IDATO,6000) IB,IE,ID WRITE(IDAT0, 6020) WRITE(IDATO,6030) As, Bs, Cs, Ds, Es, Ms WRITE(LDATO,602 1) WRITE(IDATO,603 1) K, MWS, VP, VN, ZP, ZN WRITE(IDATO,6040) WRITE(IDATO,6041) fO,fl ,EL,qO,ql ,q2 WRITEmATO, 6050) WRITE(IDATO,6051) d0,dl ,dS
6000 FORMAT(' IB=',I3,' iE=',I3,' ID=',U) 602 0 FORMAT(/,' As',' Bs',' Cs1,' Ds',
C ' Est,' Ms') 6021 FORMAT(/, ,' Kr: h4WSt,' VP',' W',' ZPr,' ZN') 6030 FORMAT(2X~F12.9,2X,F12.9,2X,F12.9,2X,F12.6,2X,F9.4,2X,F7.3) 603 1 FORMAT(2xF 10.7,2X,F8.3,3X,I3,3X,I3,3X,I3,3X,I3) 6040 FORMAT(/, ,' fû',' fl',' Q',
C ' q C ' ql'; a') 604 1 FORMAT(6(2X,E 14.4)) 6050 FORMAT(2X d0',2X,' d l , d2') 605 1 FORMAT(3 (2X,E14.4))
RETURN

END *
* File vaporpressure. f ************************************************************************
SUBROUTINE VAPPRESSURE(IB,IE,ID,As, Bs, Cs, Ds, Es, Ms, K, M W S , VP, C VN, ZP, ZN, CONCENT,ION,T,P,IDATO)
* * Subroutine to calculate the vapor partiartid pressure of the electrolyte solution * REAL ION the ionic strenght of the solution; output * REAL Pm) vapor partial pressure of the solution; output * REAL T(ID) the temperature of the solution; output * See INPUT file for other variable parameters ***********************************************************************
INTEGER I,IB,IE,IDATO REAL A, B, C, D,Z,X REAL As, Bs, Cs, Ds, Es, Ms, K,MWS REAL ION@) INTEGER VP, VN, ZP, ZN
EEAL 'wv REAL P(ID),CONCENT(ID)
DO 600 I=IB, IE IF(I.EQ. 1) THEN CONCENTO=O.O 1 ELSE CONCENT(I)=(I- 1) *0.02 END IF ION(I)=O.S*(VP*ZP**2+VN*ZN**2)*CONCENT(I)/MWS* 1000.0 x=2.o*(VP+VN)/(VP*ZP**2+VN*ZN**2) A=As+3.6059 1 E4*ION(I)+Ms/2303 .O B=Bs+l,382982*ION(I)-0.03 1 185*ION(I)**2 C=Cs-3.99334E-3*ION(I)-l. 1 1 ~~~E-~*IONCI)**~+MS*ION~*(~-X)/~~O~.O D-Ds-O. 13848 1 *ION0+0.027511 *ION(I)**2-1.79277E-3*ION(I)**3

200 F ORMAT(SX,X=*,F7.4) RETURN END
* File surfacetension.f ************************************************************************
* Subroutine to calculate the d a c e tension of the electrolyte solution * REAL fQfl ,fl,qO,q 1 ,q2 the parameters of the salt; input * REAL ION the ionic strenght of the solution; output * REAL STO(ID) the surface tension of the solution; output * REAL ST(ID) the surface tension of the solution; output * REAL Tm) the temperature of the solution; output * See INPUT file for other variable parameters ************************************************************************
INTEGER IyIByIE,IDATO w3uJ ~ , f ~ , Q , q O , q l , q 2 , ~ S REAL T(ID) REAL FI,QI,aw REAL STO(ID),ST(ID),CONCENT(ID) REAL m
* DO 700 I=iB, IE IF(I.EQ.1) THEN CONCENT(I)=O.O 1 ELSE CONCENT(I)=(I- 1)*0.02 END IF
* m=CONCENT(T)/MWS* 1000.0 T(I)=273.lS+lOO.O STO0=O.23 58*((647.lS-T(I))/647.15)** 1.256*(1 .0-0.625*(647015-T(I))/647. 15) FI-+fl *(T(I)-273.1 S)+e*(TO-273.l S)**2 QI=qWql *(T(I)-273.l S)+q2* (TO-273.15)**2 aw=EXP((FI+QI*m)%) ST(I)=ST0(I)+O0049*(l -aw)

700 CONTINUE RE- END
* File boi1ingpoint.f ************************************************************************
* Subroutine to calculate the surface tension of the electrolyte solution * REAL fû,fl,EL,qO,ql ,q2 the pitrameters of the salt; input * REAL ION the ionic strenght of the solution; output * REAL STO(ID) the surface tension of the solution; output * REAL ST(ID) the d a c e tension of the solution; output * REAL T(ID) the temperature of the solution; output * REAL TBP(ID) the boiling point of the solution; output * See INPUT file for other variable parameters ************************************************************************
iNTEGER I,IB,IE,IDATO REAL fwl ,B,qO,ql ,qS,MWS REAL FT,QI,aw REAL TBP(ID),CONCENT(ID) REAL m REAL Pp
*
DO 700 I=B, IE IF(I.EQ. 1) THEN CONCENT(I)=O.O 1 ELSE CONCENT(I)-(1- 1)*0.02 END IF
*

Il? (AsS((TBP(r)-BP)/BP).GT.O.005) THEN BP=(TBP(I)+BP)/2.0 GO TO 120 ELSE TBP(I)=BP END IF
700 CONTINUE RETURN END
* File viscosityf ************************************************************************
SUBROUTINE WSCOSITY(IB,IE,ID,dO,dl,d2,MWS,CONCENT,VIS~T,IDATO)
* Subroutine to calculate the viscosity o f the electrolyte solution * REAL dO,dl,d2 the parameters of the salt; input * REAL ION the ionic strenght of the solution; output * REAL STO(ID) the surface tension o f the solution; output * REAL ST(ID) the sucface tension of the solution; output * REAL T(ID) the temperature of the solution; output * REAL TBP(ID) the boiling point of the solution; output * See INPUT file for other variable parameters ************************************************************************
INTEGER I,IB,IE,IDATO REAL dO,dl,d2,MWS REAL VIS0,D REAL VIS(ID)yT(ID)yCONCENT(ID)
* DO 700 I=IB, IE IF(I.EQ. 1) THEN CONCENT(I)=O.O 1 ELSE CONCENT(I)=(I- 1)*0.02 END IF

T(I)=373.15 VISO=O.59849*(43.252+(T~-273.1S))**(-l.5423) D=dO+di *(T(I)-273.1 S)+dP(T(I)-273.15)**2
* VlS(I)=lO**(ALOG1O(VISOtD*CONCENT~))
700 CONTINUE R E r n END

* E.2 TEMPERATCIRE-FOR ************************************************************************ * CONVERT THE ACQUIRED DATA OF VOLTAGES INTO TEMPERATüRES * INTEGER ID, THE MAXIMUM OF DATA; INPUT ************************************************************************ *
PARAMETER(ID-33000) INTEGER I,IB,iE,IDATI,iDATO INTEGER SCANRATE
* REAL VOLT 1 (LD),VOLT2(ID),VOLT3(ID),VOLT4(ID) REAL TEMP 1 (ID),TEMP2@),TEMP3(ID),TEMP4(ID) REAL T 1 (ID)YT2(ID),T3(ID),T4(ID) REAL TIME(1D)
* SCANRATE=lOO
* CALL FILDEFWATI, DATO) CALL INPUT(IB,IE,ID,VOLTl ,VOLT2,VOLT3,VOLT4,IDATI) CALL ECHO(IB,IE,iD,VOLTl ,VOLT2,VOLT3,VOLT4,IDATO) CALL TEMPERATURE(IB,IE,ID,SCANRATE,TIME,VOLTl,VOLT2, C VOLT3 ,VOLT4,TEMP 1 ,TEMP2,TEMP3 ,TEMP4,IDATO)
CALL NOISEREMOVE(IB,IE,ID,SCANRATE,TEMP 1 ,TEMP2,TEMP3, C TEMP4,T 1 ,T2,T3,T4)
WRITE(IDAT0,lO) WRITE(IDAT0,20) (TIMECI),TEMPl(I),TEMP20,TEMP3m,TEMP4(I), I=iB,IE)
10 FORMAT(/,' TIME(s)',' TEMP 1 (C)',' TEMP2(C)', C ' TEMP3(C)',' TEMP4(C)')
20 FORMAT(2XYF5.2,2X,F8.3,2X,F8.3,2X,F8.3 ,îX,F8.3) STOP END

SUBROUTINTE FJLDEF(IDAT1, IDATO) * * Subroutine to define unit numbers and open data fles. * INTERGER IDATI unit number for file with formatted input data; input * INTERGER IDATO unit number for file with forrrratted output; output *
INTEGER IDATI, IDATO * * FILE UNIT NUMBERS *
IDATI=7 1 IDATO=72
* OPEN(IDATI,FILE='in.dat') OPEN(IDATO,FILE='out.dat') RETURN END
*
SUBROUTINE INPUT(IB,IE,ID,VOLTl,VOLT2,VOLT3,VOLT4,~ * * Subroutine to read input variable fiom a data file * * MTEGER IB,E h t and 1s t data indices in i; output * INTEGER ID, the total number of experiment data set * REAL VOLTl(1D) the voltage of the first thennocouple; input * REAL VOLTZ(ID) the voltage of the first thermocouple; input * REAL VOLT3(ID) the voltage of the h t thermocouple; input * REAL VOLT4(ID) the voltage of the first thermocouple; input * INTERGER IDATI unit number for file with formatted input data; input *
MTEGER I,IB,IE,ID,IDATI REAL VOLT 1 (ID),VOLTS(ID),VOLT3(ID),VOLT4(ID)
*

* Set the initial values as zero DO 8 1 I=IB,IE VOLT 1 O=O.O VOLTZ(I)=O.O VOLT3(I)=O.O VOLT4(I)=O.O
81 CONTINUE *
READ(IDAT1, 50) (VOLT 1 (I),VOLT2(I),VOLT3(I),VOLT4(I),I=IB,IE) 50 FORMAT(4(1X, F8.6)) *
SUBROUTINE ECHO(IB,IE,ID,VOLT 1 ,VOLT2,VOLT3,VOLT4,IDATO) * * Subroutine to echo the input data read h m file * INTERGER IDATO unit number for file with fonnattd output; output * * See NPUT for other variables definitions ************************************************************************
INTEGER I,IB,IE,ID,IDATO REAL VOLT1 (ID),VOLT2(ID),VOLT3(ID),VOLT4(ID)
*
WRITE(IDATO,60) IB,IE,ID WRITE(IDATO,62) WRITE(IDATO,63) (VOLTl(I),VOLT2(I),VOLT3(I),VOLT4(I),I=IB,IE)
60 FORMAT(' IB=',I3,' IE=',13,' ID=',13) 62 FORMAT(/,' VOLT 1 (mV)',' VOLT2(mV)',' VOLT3(mV)',' VOLTqrnV)') 63 FORMAT(4(2X,F8.6)) *

INTEGER I,IB,IE,IDATO DOUBLE PRECISION CO,C1,C2,C3,C4,CSYC6,C7,C8 INTEGER SCANRATE REAL V
REAL VOLT 1 (ID),VOLT2(lD),VOLT3(ID),VOLT4(1D) REAL TEMP 1 (ID),TEMP2(ID),TEMP3(ID),TEMP4(ID) REAL TIME(ID)
calibration constant of the temperature vs voltage curve taken from the Omega temperature handbook
END * ************************************************************************ *
SUBROUTINE TEMPERATURE(IB,IE,IDySCANRATEyTIMEyVOLT1 ,VOLT2, C VOLT3 ,VOLT4,TEMP 1 ,TEMP2,TEMP3 ,TEMP4,IDATO)
* Subrouthe to CONVERT VOLTAGE TO TEMPERATURE * DOUBLE PRECISION C0,Cl ,C2,C3,C4,CS,C6.C7,CS; input * INTEGER SCANRATE scan rate ofthe device; input * REAL TEMP 1 (ID),TEMPT2(ID),TEMP3(ID),TEMP4(ID) wnverted * temperature; output * REAL TIME(1D) acquiring t h e ; output ************************************************************************
TEMP l(I)=CO + (C 1 *V) + (C2*V**2) + (C3*V**3) + (C4*V**4) i- + (C5*Ve*5) + (C6*V**6) + (C7*Vf '7) + (C8*Vf *8)
V=(VOLT20/0.086688-3.553-0.05188)/1000.0 TEMPZ(I)=CO + (C14V) + (CS*V**S) + (C3*V**3) + (C4*V**4)
i- + (CS*V**S) + (C6*V**6) + (C7*V**7) + (CS*V**8) V=(VOLT30/0.086688-3 -553-0.05 1 88)/1000.0 TEMP30=CO + (Cl *V) t (CS*V**2) + (C3*V+*3) + (C4*V**4)
+ + (C5*V**5) + (C6*V**6) + (C7*V**7) + (C8*V**8) V=(VOLT4(I)/O.O86688-3.553)/1000.0 TEMP40=CO + (Cl *V) + (C2*V**2) t (C3*V**3) + (C4*V**4)
+ + (C5*V**5) + (C6*V4*6) + (C7*V**7) + (C8*V**8)
RETURN END
SUBROUTINE NOISEREMOVE(IB,IE,ID,SCANRATE,TEMP 1 ,TEMP2,TEMP3, C TEMP4,T 1 ,TZ,T3,T4)
****************************************************************** At each time step, this program will take the average of 10 data points including the current temperature and 9 fhture temperatures and assign the average as the current temperature value to remove any noise and smooth the curve ******************************************************************
INTEGER IB,IE,ID,iJ,k INTEGER n9,nmax REAL swnl,sum2,swn3,sutn4 REAL avg 1 ,avg2,avg3 ,avg4 REAL TEMP 1 (ID),TEMP2(ID),TEMP3(ID),TEMP4(ID) lw AL Tl (IWmD),T3W),T4(ID) REAL tirne INTEGER SCANRATE

c open a new output file
c initiate the moving average routine
max=ID n9=nmax-49 do 2 j=l,n9 suml=O
sLUn2=0 sum3=0
sumA-0 do 4 i=j j+49 suml= sumf + TEMPl(i)
sum2= sum2 + TEMP2(i) s m 3 = sum3 +- TEMP3(i)
sum4= sum4 + TEMP4(i) 4 continue
c taking the average of(10) ten data points at a time
avg l =sum 1/50 avg2=sum2/50
avg3=sum3/50 avg4=sum4/50
TICj)=avgl T2(j)=avg2
T3(j)=avg3 T4(j)=avg4
2 continue
c initiate the tirne table
time=O.O c initiate the routine of writing out the averaged surfa- temperature versus a time table

c format the output file
write (40,5) time, Tl*), T2(k),T3(k),T4&) 5 format(l~,fl2S,2x,f5.1,2x,f5~I,2x,f5~ 1,2x9f5. 1)
c the time step is 10 times the sampling rate
8 continue
c close the output file c l o s e ( ~ n i ~ 0 )
return end
Program name: ihcp-for
This program estimates the d a c e heat flux history using transient temperature measurements inside the heat conducting body. This problem is called the inverse heat conduction problem, in contrast to the direct problem where the information at the siirface is given. The MCP i s ill-posed problem which is characterized b y extreme sensitivity of the surface heat flux fo small variations in the interior temperatures. A hc t ion specification scheme which uses a Duhamel's theorem is utilized.
max--nurnber of t h e steps taken before stopping x(1 )--position of the 1 st thennocouple sensor x(2)--position of the 2nd thermocouple sensor x(3)--position of the 3rd thermocouple sensor x(4)--position of the 4th therrnocouple sensor

c 1--position of the insuiated d a c e c dt--tirne step c ntc--number of thennowuples used c m--themthtimestep c r-number of fùture heat flux involved in the caldation c t0--the initial conditions taken as unifonn over the whole domain c f--the temperature dump due to a unit heat flux at the d a c e c q(rn)--the estimateci surface heat flux at m t h e step c time c timep--dirnensionless tirne defïned as aa*timePf2 c ck(j,i)--the gain coefficients C c
dimension y(4,2500),ck(4,2500), t b ( 4 , 2 5 û û ) , f ( 4 . 2 5 ~ dimension x(4),xp(4), term(l0) real k,l integer r comrnon k,l
c open an existing output file open(uni~ 1 O,file=lin.datl,status='old')
c open an output file open(unii~20,file='output',status='unkIlown')
c thermal diffisivity and conductivity of copper alfa=l 1 7.e-6 k-01.
c positions of thennocouple relative to the top surface
c set grid size, time step etc t0-240.
r=6

c read the temperatwe measurements do 30 m=l ,max
30 10,40)y(l ,m),y(2,m),y(37m),y(4,m) 40 format(l5x,f5.1 ,îx,fS. 1,2x,f3.1,2x,f5.1)
forms gain coefficient ck(i j) sum=o.o
L-0.0 do 50 i= 1 ,r
H+dt tp=alfa*t/l**2
do 60 j=l ,ntc
xpi')=xO')fl cal1 ke~(xp(j),Q?,fU',i)) sum=sum+fG,i)* *2 continue continue do 70 i=l,r
do 80 j=l,ntc ck(j ,i)=fi',i)/sum
continue continue
estirnate the surface flux q(m) following a sequential orda

do 130 n=l,m-1 1 3 0 term(i)=tenn(i)+q(n)*(f;i',m-n+i)-am-n+i-1))
tb(j,m+i- t)=terrn(i)+y(j, 1) q(m)=q(m)+ck(j,i)*(y(j,m+i- 1 )-tb(j,m+i- 1))
120 continue 1 10 continue
qs=q(m)/lOOOûûû. write(20, *) time,q(m)/k*x(l )+y( 1 ,m),qs
100 continue
cIose(unit=lO) close(uniW0) stop End
"
c This subroutine foms the kemel hction f, a temperature jump c due to a unit heat flux at the surface. f can also be refmed c to as the influence fûnction-
subroutine kern(x, t, f) real k,l cornmon k,l pi=2.*asin(l.)
sum==t+l./3 .-x+O.S*x**2 do 10 n=1,200 term=2./pi**2/n**2*exp(-n**2*pi**2*t)*cos(n*pi*x)
sum=sum+ternl if (abs(tedsum).le.O.OOI) go to 50
10 continue write(*,*)'does not converge' stop
50 f-sum* l/k return end