the effect of competency modeling on restaurant employee
TRANSCRIPT

Walden University Walden University
ScholarWorks ScholarWorks
Walden Dissertations and Doctoral Studies Walden Dissertations and Doctoral Studies Collection
2021
The Effect of Competency Modeling on Restaurant Employee The Effect of Competency Modeling on Restaurant Employee
Engagement and Turnover Intent Engagement and Turnover Intent
Erin McLaughlin Vu Walden University
Follow this and additional works at: https://scholarworks.waldenu.edu/dissertations
Part of the Philosophy of Science Commons
This Dissertation is brought to you for free and open access by the Walden Dissertations and Doctoral Studies Collection at ScholarWorks. It has been accepted for inclusion in Walden Dissertations and Doctoral Studies by an authorized administrator of ScholarWorks. For more information, please contact [email protected].

Walden University
College of Social and Behavioral Sciences
This is to certify that the doctoral dissertation by
Erin McLaughlin Vu
has been found to be complete and satisfactory in all respects, and that any and all revisions required by the review committee have been made.
Review Committee
Dr. Robert Haines, Committee Chairperson, Psychology Faculty Dr. Cynthia Loubier-Ricca, Committee Member, Psychology Faculty
Dr. Derek Rohde, University Reviewer, Psychology Faculty
Chief Academic Officer and Provost Sue Subocz, Ph.D.
Walden University 2021

Abstract
The Effect of Competency Modeling on Restaurant Employee Engagement and Turnover
Intent
by
Erin McLaughlin Vu
MA, East Carolina University, 2013
BS, Virginia Polytechnic Institute and State University, 2010
Dissertation Submitted in Partial Fulfillment
of the Requirements for the Degree of
Doctor of Philosophy
Industrial/Organizational Psychology
Walden University
August 2021

Abstract
High turnover and low engagement among restaurant employees cost restaurant owners
thousands of dollars per employee each year due to costs associated with training and lost
productivity. Competency models are used in many industries to improve employee
engagement and reduce turnover, but there is a gap in knowledge surrounding the use of
competency models in restaurant organizations. The purpose of this pretest-posttest
quasi-experimental quantitative study is to examine if the implementation of a
competency model affects turnover intent and employee engagement for restaurant
employees. Employee engagement and turnover intent were measured before and after a
competency model was implemented. Four sample groups were included in this study:
full-time employees at a full-service restaurant, full-time employees at a fast-casual
restaurant, part-time employees at a full-service restaurant, and part-time employees at a
fast-casual restaurant. Paired samples t tests were conducted to determine if there was a
statistically significant difference between the pre- and posttest employee engagement or
turnover intent scores. The competency model implementation had a statistically
significant effect on employee engagement and turnover intent scores for all sample
groups, except for turnover intent scores for full-time employees at a full-service
restaurant. There was also a positive correlation between turnover intent and employee
engagement for part-time employees, and a negative correlation between turnover intent
and employee engagement for full-time employees. The results of this study promote
positive social change through evidence that the use of a competency model positively
affects turnover intent and employee engagement for restaurant employees.

The Effect of Competency Modeling on Restaurant Employee Engagement and Turnover
Intent
by
Erin McLaughlin Vu
MA, East Carolina University, 2013
BS, Virginia Polytechnic Institute and State University, 2010
Dissertation Submitted in Partial Fulfillment
of the Requirements for the Degree of
Doctor of Philosophy
Industrial/Organizational Psychology
Walden University
August 2021

Dedication
This study is dedicated to my loving and supporting family and friends, especially
my husband, Peter. Thank you for your encouragement. This study is also dedicated to
the restaurant owners that provided data for this study. Thank you for caring about your
employees and trying to improve their experiences in the workplace.

Acknowledgments
Thank you, Dr. Robert Haines and Dr. Cynthia Loubier-Ricca, for your
encouragement, patience, guidance, and thoroughness throughout this process.

i
Table of Contents
List of Tables .......................................................................................................................v
List of Figures ................................................................................................................... vii
Chapter 1: Introduction to the Study ....................................................................................1
Background of the Study ...............................................................................................2
Problem Statement .........................................................................................................4
Purpose of the Study ......................................................................................................5
Research Questions and Hypotheses .............................................................................6
Theoretical Framework for the Study ..........................................................................10
Nature of the Study ......................................................................................................13
Operational Definitions ................................................................................................16
Assumptions .................................................................................................................18
Scope and Delimitations ..............................................................................................18
Limitations ...................................................................................................................19
Significance of the Study .............................................................................................19
Summary ......................................................................................................................20
Chapter 2: Literature Review .............................................................................................22
Literature Search Strategy ............................................................................................23
Theoretical Foundation ................................................................................................23
Implicit Person Theory ......................................................................................... 23
Competency Models ....................................................................................................30
Using Competency Models in the Workplace ...................................................... 31

ii
Using Competency Models in the Hospitality Industry ........................................ 40
Employee Engagement ................................................................................................47
Engagement Differences Between Full- and Part-Time Employees .................... 48
Impact of Managerial Style on Employee Engagement ....................................... 49
Effects of Competency Models on Employee Engagement ................................. 50
Employee Engagement in the Restaurant Industry ............................................... 52
Using the JES to Measure Employee Engagement ............................................... 53
Turnover Intent ............................................................................................................53
Turnover Intent Differences Between Full- and Part-Time Employees ............... 54
Impact of Managerial Style on Turnover Intent ................................................... 56
Effects of Competency Models on Turnover Intent ............................................. 57
Turnover Intent in the Restaurant Industry ........................................................... 59
Using the TIS-6 to Measure Turnover Intent ........................................................ 60
Summary and Conclusions ..........................................................................................61
Chapter 3: Research Method ..............................................................................................64
Research Design and Rationale ...................................................................................64
Methodology ................................................................................................................65
Population ............................................................................................................. 66
Sampling and Sampling Procedures ..................................................................... 67
Procedures for Recruitment, Participation, and Data Collection .......................... 68
Instruments ............................................................................................................ 68
Data Analysis Plan .......................................................................................................71

iii
Ethical Procedures .......................................................................................................76
Summary ......................................................................................................................76
Chapter 4: Results ..............................................................................................................78
Data Collection ............................................................................................................79
Description of the Sample ..................................................................................... 80
Results ..........................................................................................................................83
Research Hypothesis Set 1 and 2 .......................................................................... 84
Research Hypothesis Set 3 and 4 .......................................................................... 87
Research Hypothesis Set 5 and 6 .......................................................................... 90
Research Hypothesis Set 7 and 8 .......................................................................... 94
Research Hypothesis Set 9 and 10 ........................................................................ 97
Summary ....................................................................................................................100
Chapter 5: Conclusion......................................................................................................101
Interpretation of the Findings .....................................................................................102
Limitations of the Study.............................................................................................106
Recommendations ......................................................................................................107
Implications................................................................................................................108
Conclusion .................................................................................................................111
References ........................................................................................................................113
Appendix A. Demographics Questionnaire .....................................................................127
Appendix B. Permission to use the TIS-6 ........................................................................128
Appendix C. Permission to use the JES ...........................................................................129

iv
Appendix D. Time One Invitation Letter and Consent Form ..........................................130
Appendix E. Time Two Invitation Letter and Consent Form ..........................................133
Appendix F. G*Power Computation of Effect Size.........................................................136
Appendix G. Instruments .................................................................................................137
Turnover Intention Scale (TIS-6) ...............................................................................137
Job Engagement Scale (JES) .....................................................................................137

v
List of Tables
Table 1. Demographic Characteristics of Participants .......................................................82
Table 2. Participants in Sample Groups .............................................................................83
Table 3. Results for Employee Engagement and Turnover Intent Scores Before and After
Competency Model Implementation – Full-Time Employees, Full-Service
Restaurant ..............................................................................................................86
Table 4. Paired Samples Correlations of Employee Engagement and Turnover Intent
Scores Before and After Competency Model Implementation – Full-Time
Employees, Full-Service Restaurant ......................................................................86
Table 5. Paired Samples Test Results for Employee Engagement and Turnover Intent –
Full-Time Employees, Full-Service Restaurant .....................................................87
Table 6. Results for Employee Engagement and Turnover Intent Scores Before and After
Competency Model Implementation – Full-Time Employees, Fast-Casual
Restaurant ..............................................................................................................89
Table 7. Paired Samples Correlations of Employee Engagement and Turnover Intent
Scores Before and After Competency Model Implementation – Full-Time
Employees, Fast-Casual Restaurant .......................................................................89
Table 8. Paired Samples Test Results for Employee Engagement and Turnover Intent –
Full-Time Employees, Fast-casual Restaurant ......................................................90
Table 9. Results for Employee Engagement and Turnover Intent Scores Before and After
Competency Model Implementation – Part-Time Employees, Full-Service
Restaurant ..............................................................................................................93

vi
Table 10. Paired Samples Correlations of Employee Engagement and Turnover Intent
Scores Before and After Competency Model Implementation – Part-Time
Employees, Full-Service Restaurant ......................................................................93
Table 11. Paired Samples Test Results for Employee Engagement and Turnover Intent –
Part-Time Employees, Full-Service Restaurant .....................................................93
Table 12. Results for Employee Engagement and Turnover Intent Scores Before and
After Competency Model Implementation – Part-Time Employees, Fast-Casual
Restaurant ..............................................................................................................96
Table 13. Paired Samples Correlations of Employee Engagement and Turnover Intent
Scores Before and After Competency Model Implementation – Part-time
Employees, Fast-Casual Restaurant .......................................................................96
Table 14. Paired Samples Test Results for Employee Engagement and Turnover Intent –
Part-Time Employees, Fast-Casual Restaurant ......................................................97
Table 15. Results for Employee Engagement and Turnover Intent Scores Before
Competency Model Implementation – Part-Time and Full-Time Employees .......99
Table 16. Paired Samples Correlations of Employee Engagement and Turnover Intent
Scores Before Competency Model Implementation – Part-Time and Full-Time
Employees ..............................................................................................................99
Table 17. Paired Samples Test Results for Employee Engagement and Turnover Intent –
Part-Time and Full-Time Employees.....................................................................99

vii
List of Figures
Figure 1. Food and Beverage Service Competency Model ...............................................46

1
Chapter 1: Introduction to the Study
The National Restaurant Association (NRA, 2019) estimated that 15 million
people worked in United States restaurant and foodservice jobs in 2019. The Bureau of
Labor Statistics (BLS, 2019) in May 2019 reported 4.8% of employees in the restaurant
and accommodations industry quit their jobs, even when accounting for seasonal
employees. The BLS (2019) defines the “accommodations industry” as hospitality,
hotels, foodservices, and drinking places. “Quits” are defined as voluntary separations
initiated by an employee and do not include involuntary layoffs or discharges originated
by employers (BLS, 2017). By comparison, the U.S. quit rate for all industries was just
2.3% (BLS, 2019). Further, the BLS (2019) estimated the quit (voluntary separation) rate
for this industry is 55%.
Although the BLS does not report restaurant turnover rates independent of that for
the accommodations industry, research from other resources indicated that restaurant
turnover is higher than the accommodations sector in its entirety (DiPietro & Bufquin,
2018; NRA, 2016). Turnover rates in fast food and casual restaurants are even higher
than for fine dining venues, which is attributed to casual restaurants employing more
part-time employees who are less committed to their employers (DiPietro & Bufquin,
2018). Referencing the high cost of turnover, business owners have stated employee
retention is their biggest human resource apprehension (DiPietro & Bufquin, 2018). One
reason employee turnover is costly to business owners is the time and money spent on
training new employees (DiPietro & Bufquin, 2018).

2
High turnover and low engagement among restaurant employees cost restaurant
owners thousands of dollars per employee each year due to the costs associated with
training and lost productivity (Brain, 2019; DiPietro & Bufquin, 2018; DiPietro &
McLeod, 2011). The current study addressed a gap in knowledge surrounding the
effectiveness of competency models to address turnover and engagement issues among
restaurant employees. The gap concerning competency model effectiveness was
addressed by examining turnover intent and employee engagement at a restaurant group
before and after a competency model was implemented. The competency model included
leadership and technical competencies that were identified as critical skills to be
successful in restaurant jobs. In this chapter, a background of the study, problem
statement, purpose of the study, the research questions and hypotheses, a summary of the
theoretical framework of the study, the nature of the study, operational definitions,
assumptions of the study, and the study’s scope, delimitations, limitations, and
significance are discussed.
Background of the Study
Many professional industries have used integrated talent management processes
to reduce turnover intent, improve employee engagement, and thus improve
organizational performance (Omar et al., 2017). Effective talent management processes
typically include the integration of an organization’s recruiting, personnel selection,
onboarding, training, performance management, development, talent planning, pay, and
promotion processes (Omar et al., 2017). For example, a technical competency model
was effectively used to prepare employees in the information technology field for higher-

3
level positions (Nair et al., in press) and to provide employees in the healthcare industry
with leadership skills (Ravichandran & Mishra, 2018). However, leading practices in
talent management have not been implemented in the majority of organizations in the
restaurant industry (Mjongwana & Kamala, 2018).
Many restaurant employees cite poor management, lack of training, and
perceptions that employee well-being is not a priority as the primary reasons for leaving a
restaurant job (DiPietro & McLeod, 2011). Restaurant owners incur high costs due to
employee turnover, and there is a gap in current literature surrounding effective methods
of reducing turnover in the restaurant industry (DiPietro & McLeod, 2011). Applying
methods that have been effective at reducing turnover and increasing employee
performance in other industries may also be beneficial in the restaurant industry, but
additional research needs to be conducted to test this theory (Brain, 2019; DiPietro &
Bufquin, 2018; Pai et al., 2018; Shai et al., 2016). Researchers recommend using
competency models and managerial training strategies to improve employee engagement
and reduce turnover intent (Canning et al., 2019; Derro & Williams, 2009; Dewettinck &
Vroonen, 2017; Fowler, 2018).
Recent studies focused on restaurant employees have produced results showing
that restaurant owners who focus on employee engagement and provide training and
development opportunities to their employees have higher restaurant profitability and
customer satisfaction than restaurant owners who do not emphasize employee
engagement, training, and development (Brain, 2019; Mjongwana & Kamala, 2018; Pai
et al., 2018; Shai et al., 2016). One way to identify employee training and development

4
needs is through the use of competency models (Fowler, 2018; Ravichandran & Mishra,
2018).
A competency model is a structured way to define the skill and knowledge
requirements of a job (Hatala & Hisey, 2011). Competencies are observable and
measurable knowledge, skills, and abilities that define expected job performance. When
all the competencies required for success in specified roles are put together, they are
known as a competency model. Competency models have been used by organizations to
improve employee performance by providing clear guidance about what good
performance entails (Fowler, 2018; Hatala & Hisey, 2011). Competency models also help
managers provide more effective, objective feedback to employees on their performance
because they outline which behaviors should be exhibited by high-performing employees
(Derro & Williams, 2009; Ravichandran & Mishra, 2018; Ross & Stefaniak, 2018).
Competency models are considered a best practice in human resources management
(Fowler, 2018; Ross & Stefaniak, 2018). However, there is a gap in the literature
regarding the use of competency models in the restaurant industry. The purpose of this
pretest-posttest quasi-experimental quantitative study was to examine if the
implementation of a competency model affected turnover intent and employee
engagement for restaurant employees.
Problem Statement
Restaurant owners lose thousands of dollars per employee each year due to the
costs associated with high turnover and low engagement among restaurant employees
(Brain, 2019; DiPietro & Bufquin, 2018; DiPietro & McLeod, 2011). Competency

5
models that include leadership and technical competencies and are integrated into an
organization’s talent management processes are effective ways to improve employee
engagement and reduce turnover intent (Derro & Williams, 2009; Fowler, 2018; Nair et
al., in press; Ravichandran & Mishra, 2018). However, competency models are not
frequently used for employees in the restaurant industry (Shai et al., 2016). This study
was used to address the lack of knowledge surrounding the effectiveness of using
competency models to improve engagement and reduce turnover intent among restaurant
employees.
The gap concerning competency model effectiveness was addressed by examining
turnover intent and employee engagement at a restaurant group before and after a
competency model was implemented. The competency model included leadership and
technical competencies that were identified as critical skills to be successful in restaurant
jobs. The restaurant group that provided data for this study includes two full-service and
four fast-casual restaurants with about 160 employees that are all located in the Mid-
Atlantic region of the United States.
Purpose of the Study
The purpose of this pretest-posttest quasi-experimental quantitative study was to
examine if the implementation of a competency model affected turnover intent and
employee engagement for restaurant employees. Data were collected from employees
who work for a restaurant group with six restaurants located in the Northern Virginia
region. The restaurant group’s ownership team informed their employees of the study and
asked them to voluntarily participate by completing a survey. The survey used for this

6
study measured turnover intent and employee engagement data before and after a
competency model that includes leadership and technical competencies was
implemented. The survey data were collected and analyzed to examine the effects of the
implementation. This study was unique because it addressed an under-researched
employee population (Shai et al., 2016).
Research Questions and Hypotheses
The independent variable included in this study was the competency model. The
dependent variables included in this study were employee engagement and turnover
intent. Paired samples t tests were conducted to determine if there was an existing
relationship between employee engagement and turnover intent before the competency
model implementation took place.
RQ1: Is there a statistically significant difference in employee engagement for
full-time employees at a full-service restaurant, as measured by the Job Engagement
Scale (JES), after the implementation of a competency model?
H01: There is no statistically significant difference in employee engagement
for full-time employees at a full-service restaurant, as measured by the JES,
after the implementation of a competency model.
Ha1: There is a statistically significant difference in employee
engagement for full-time employees at a full-service restaurant, as
measured by the JES, after the implementation of a competency model.

7
RQ2: Is there a statistically significant difference in turnover intent for full-time
employees at a full-service restaurant, as measured by the Turnover Intention Scale (TIS-
6), after the implementation of a competency model?
H02: There is no statistically significant difference in turnover intent for full-
time employees at a full-service restaurant, as measured by the TIS-6, after
the implementation of a competency model.
Ha2: There is a statistically significant difference in turnover intent for
full-time employees at a full-service restaurant, as measured by the TIS-
6, after the implementation of a competency model.
RQ3: Is there a statistically significant difference in employee engagement for
full-time employees at a fast-casual restaurant, as measured by the JES, after the
implementation of a competency model?
H03: There is no statistically significant difference in employee engagement
for full-time employees at a fast-casual restaurant, as measured by the JES,
after the implementation of a competency model.
Ha3: There is a statistically significant difference in employee
engagement for full-time employees at a fast-casual restaurant, as
measured by the JES, after the implementation of a competency model.
RQ4: Is there a statistically significant difference in turnover intent for full-time
employees at a fast-casual restaurant, as measured by the TIS-6, after the implementation
of a competency model?

8
H04: There is no statistically significant difference in turnover intent for full-
time employees at a fast-casual restaurant, as measured by the TIS-6, after
the implementation of a competency model.
Ha4: There is a statistically significant difference in turnover intent for
full-time employees at a fast-casual restaurant, as measured by the TIS-
6, after the implementation of a competency model.
RQ5: Is there a statistically significant difference in employee engagement for
part-time employees at a full-service restaurant, as measured by the JES, after the
implementation of a competency model?
H05: There is no statistically significant difference in employee engagement
for part-time employees at a full-service restaurant, as measured by the JES,
after the implementation of a competency model.
Ha5: There is a statistically significant difference in employee
engagement for part-time employees at a full-service restaurant, as
measured by the JES, after the implementation of a competency model.
RQ6: Is there a statistically significant difference in turnover intent for part-time
employees at a full-service restaurant, as measured by the TIS-6, after the implementation
of a competency model?
H06: There is no statistically significant difference in turnover intent for part-
time employees at a full-service restaurant, as measured by the TIS-6, after
the implementation of a competency model.

9
Ha6: There is a statistically significant difference in turnover intent for
part-time employees at a full-service restaurant, as measured by the TIS-
6, after the implementation of a competency model.
RQ7: Is there a statistically significant difference in employee engagement
for part-time employees at a fast-casual restaurant, as measured by the JES, after
the implementation of a competency model?
H07: There is no statistically significant difference in employee engagement
for part-time employees at a fast-casual restaurant, as measured by the JES,
after the implementation of a competency model.
Ha7: There is a statistically significant difference in employee
engagement for part-time employees at a fast-casual restaurant, as
measured by the JES, after the implementation of a competency model.
RQ8: Is there a statistically significant difference in turnover intent for part-time
employees at a fast-casual restaurant, as measured by the TIS-6, after the implementation
of a competency model?
H08: There is no statistically significant difference in turnover intent for part-
time employees at a fast-casual restaurant, as measured by the TIS-6, after
the implementation of a competency model.
Ha8: There is a statistically significant difference in turnover intent for
part-time employees at a fast-casual restaurant, as measured by the TIS-
6, after the implementation of a competency model.

10
RQ9: Is there a statistically significant correlation between turnover intent and
employee engagement for part-time employees before the implementation of a
competency model?
H09: There is no statistically significant correlation between turnover intent and
employee engagement for part-time employees at a fast-casual or full-service
restaurant before the implementation of a competency model.
Ha9: There is a statistically significant correlation between turnover intent and
employee engagement for part-time employees at a fast-casual or full-service
restaurant before the implementation of a competency model.
RQ10: Is there a statistically significant correlation between turnover intent and
employee engagement for full-time employees before the implementation of a
competency model?
H010: There is no statistically significant correlation between turnover intent and
employee engagement for full-time employees at a fast-casual or full-service
restaurant before the implementation of a competency model.
Ha10: There is a statistically significant correlation between turnover intent and
employee engagement for full-time employees at a fast-casual or full-service
restaurant before the implementation of a competency model.
Theoretical Framework for the Study
The theoretical framework of this study was the implicit person theory (IPT). This
theory was used to develop methods for improving employee engagement and providing
training and development opportunities for restaurant employees in this study. Dweck et

11
al. (1995) defined IPT as a theoretical framework that addresses beliefs about the
malleability of human characteristics (e.g., personality, ability, intelligence, and moral
character). This theory includes two different types of beliefs on whether human
characteristics can be changed: incremental theory and entity theory. Incremental theory
states that human traits such as attitudes and behaviors can be changed, while entity
theory states that these traits are fixed and cannot be changed (Dweck, 1986). Dweck’s
(1986) model attests that individuals’ inherent beliefs about human attributes define the
way they understand and react to human actions and outcomes (Chiu et al., 1997).
Research using the IPT framework has shown that individuals who believe personal
attributes are fixed (defined as entity theory by Dweck) understand outcomes and actions
in terms of these fixed traits (Dweck et al., 1995). For example, individuals who believe
personal attributes are fixed may believe, “I passed the test because I am smart,” or, “She
stole food because she is amoral.” Conversely, individuals who believe personal
attributes can be changed and developed tend to believe that outcomes and actions have
specific behavioral or psychological mediators. For example, individuals who believe
personal attributes can be changed (incremental theory) may believe, “I passed the test
because of the effort I exerted when studying,” or, “She stole the food because she is
unethical.”
In general, incremental theory and entity theory have been applied to many
different factors. The current literature has found that those who believe that they can
change their performance on a specific task are more motivated to improve than those
who do not think they can change (Chiu et al., 1997; El-Alayli & Baumgardner, 2003;

12
Plaks & Chasteen, 2013). Individuals who associate more with incremental theory are
also more likely to be able to recover and find success after experiencing failure than
those who associate with entity theory (Katz & O’Malley, 2016; Renaud & McConnell,
2007; Scott et al., 2014; Teunissen & Bok, 2013).
There is a disagreement among researchers regarding whether incremental and
entity theories should be defined as a single personality construct where one end of the
spectrum is the belief that the individual can change anything about themselves
(consistent with incremental theory) and the other end of the spectrum is that people are
born with a certain set of abilities that cannot be changed (consistent with entity theory;
Lüftenegger & Chen, 2017). However, other researchers have not been able to find a
relationship between these theories and personality traits (Spinath et al., 2003). Some
researchers classify these theories as a measurable personality trait (Lüftenegger & Chen,
2017). Managers who believe employee behaviors can be changed lead teams that are
more engaged and perform at a higher level than managers who do not believe employee
behaviors can be changed (Dewettinck & Vroonen, 2017; Heslin et al., 2005).
Current research results have indicated that restaurant employees who work full-
time and have been in the industry for 5 years or more are more committed to their jobs
than those who work part-time and have been in the industry for fewer than 5 years
(Ogunmokun, 2019; Watson et al., 2018). Additionally, a positive correlation was found
between job commitment and restaurant employees who feel supported by their
colleagues (Watson, 2018). Current research results also indicate that restaurant
employees are intrinsically motivated, so programs focused on motivating employees in
13
this industry should focus on intrinsic characteristics (Harris et al., 2017; Watson et al.,
2018). Focusing on nonfinancial performance measures (e.g., technical training and
initiatives focused on improving employee effectiveness and engagement) increases
restaurant profitability and customer satisfaction when compared to restaurants that do
not engage in these practices (Brain, 2019; Mjongwana & Kamala, 2018; Pai et al., 2018;
Shai et al., 2016).
Researchers have used IPT to design interventions used to change behaviors and
performance (Heslin et al., 2005; Katz & O’Malley, 2016), which made it an appropriate
theoretical framework to use to inform the implementation, a competency model, that
was used in the current study. The term “mindset” is typically used to describe IPT in the
workplace (Dweck, 2006). Specifically, entity theory is described as a fixed mindset, and
incremental theory is described as a growth mindset when applying IPT to employees and
organizations (Caniels et al., 2018). Organizational cultures that are perceived to have a
growth mindset are associated with higher employee engagement, lower turnover intent,
and higher profits than organizations with cultures perceived to have a fixed mindset
(Canning et al., 2019; Murphy & Dweck, 2010). The current study attempted to add to
IPT literature by exploring the use of this theory to create a growth mindset in an
organization in the restaurant industry, which had not been previously studied.
Nature of the Study
The participants in this study were employees at a restaurant group that includes
two full-service and four fast-casual restaurants that are all located in Northern Virginia.
The participants were full and part-time employees, but seasonal and temporary

14
employees were excluded from the study. The participants in this study were divided into
four samples: Sample 1 is full-time, full-service, Sample 2 is full-time, fast-casual,
Sample 3 is part-time full-service, and Sample 4 is part-time fast-casual employees. All
the permanent (excluding seasonal and temporary) full- and part-time employees at each
of the six restaurants were invited to participate in this study voluntarily. The restaurant
group employs an average of 160 permanent employees (excluding seasonal and
temporary employees), and the entire employee population was invited to participate in
this study. For this study to have statistical power, approximately 100 participants needed
to be surveyed in this pretest-posttest study (Faul et al., 2007).
This study used a pretest-posttest quasi-experimental quantitative design to
answer the research questions included in this proposed study. A pretest-posttest quasi-
experimental quantitative design was the most appropriate format to use for this study
because the participants were not randomly assigned to each group as is required for a
true experimental design (Gribbons & Herman, 1997). The participants for this study
were instead selected for each of the four sample groups based on their work status (full-
time or part-time) and the type of restaurant they work in (full-service or fast-casual). The
survey method was used to measure turnover intent and employee engagement both
before and after a competency model was implemented. Paired samples t test analyses
were conducted to determine if there was a statistically significant difference in turnover
intent or employee engagement scores before and after the competency model was
implemented.

15
The ownership team of the restaurant organization that provided data for this
study determined which competencies were critical for the employees in their
organization. This was done using guidelines provided by the U.S. Department of Labor
(2017) using the Food and Beverage Service competency model. Once the competency
model had been defined, the organization’s ownership team outlined a plan for
implementing the critical competencies into their performance management,
compensation, training, development, and succession planning processes. Next, the
pretest survey was be administered to the organization’s full- and part-time employees
(excluding seasonal and temporary employees), and employee engagement and turnover
intent were measured. After collecting the pretest data, the organization’s management
team implemented the competency model into its talent management processes
(performance management, compensation, training, development, and succession
planning). The organization’s ownership team trained the managerial staff on the
competency model and the resulting changes to the organization’s talent management
processes. The managerial staff then trained all the employees on the competency model
and new talent management processes. It was estimated that this training process would
take no more than 2 months to complete (Fowler, 2018). The posttest was conducted
approximately 4 months after the competency model had been implemented to determine
if the competency model affected employee engagement and/or turnover intent.
Executing the training and process changes that were required to fully implement
the competency model for this proposed study required coordination and cooperation
from the restaurant’s managerial staff. To gain support from the restaurant’s ownership

16
and management team, Prosci’s ADKAR change management model was used
(Karambelkar & Bhattacharya, 2017). This model was selected because it has been
effectively used to implement similar changes in other studies (Karambelkar &
Bhattacharya, 2017). As the competency model was being implemented, any resistance to
change was addressed using the tools included in the ADKAR model to gain acceptance
from those who were resisting the changes. For example, the information was shared by
the ownership team with the managerial staff about the negative impacts of low employee
engagement and high turnover, as well as how competency models can be used to
improve employee engagement and reduce turnover intent (Fowler, 2018; Nair et al., in
press; Ravichandran & Mishra, 2018).
Operational Definitions
This study incorporates the following definitions:
Competency model: The competency model is a structure for defining the skill
and knowledge requirements of a job (Hatala & Hisey, 2011). It is a compilation of
competencies, or observable and measurable knowledge, skills, and abilities, that jointly
define effective job performance in specified roles.
Employee engagement: Employee engagement will be measured by the JES (Rich
et al., 2010). The JES was developed using a definition of engagement that includes
employees devoting their physical, emotional, and cognitive energy into their jobs and
the organizations they work for (Kahn, 1990). The JES is an 18-item scale that measures
physical engagement, emotional engagement, and cognitive engagement (Rich et al.,

17
2010). The scale requires respondents to use a five-point Likert scale to indicate their
disagreement or agreement for each item.
Fast-casual restaurant: A fast-casual restaurant is a dining establishment that
does not offer full table service from a server yet claims to offer higher quality food than
a fast-food restaurant (Wheelen & Hunger, 2006).
Full-service restaurant: A full-service restaurant is a dining establishment where
customers sit at tables and order food through a wait staff (Wheelen & Hunger, 2006).
Full-time employee: A full-time employee is an individual employed by the
organization who is paid hourly or salaried wages who works 30 or more hours per week
on a permanent (not seasonal or temporary) basis. This definition was provided by the
restaurant owners whose employees will be included in this study.
Part-time employee: A part-time employee is an individual employed by the
organization who is paid hourly or salaried wages who works 29.9 or fewer hours per
week on a permanent (not seasonal or temporary) basis. This definition was provided by
the restaurant owners whose employees will be included in this study.
Turnover intent: Employee turnover intent will be assessed by the TIS-6 (Roodt,
2004). This scale includes one factor, turnover intention, and requires participants to
respond to whether each of the six items describes them not at all or completely using a
five-point rating scale. Turnover intention is defined in this scale as an employee’s plans
and the likelihood of leaving their position in an organization.

18
Assumptions
The definition of the employee types included in this study are based on the
qualifications identified by the restaurant owners who are surveying their employees and
providing the data for this study. Not all restaurant owners use the same qualifications, so
the definitions of full-time and part-time employees may vary across organizations. It
was assumed that the respondents to the pretest and posttest surveys were honest and
forthcoming with information when answering the survey. It was also assumed that the
survey instruments used are reliable for examining engagement and turnover intent. I also
assumed that the managerial staff included in this study implemented the competency
model as instructed.
Scope and Delimitations
The scope of this study examined employees who worked varying hours at either
fast-casual or full-service restaurants in the Northern Virginia area. Employee
engagement and turnover intent were measured for these employees before and after a
competency model was implemented, and paired t tests were conducted to determine if
there was an existing relationship between employee engagement and turnover intent
before the competency model implementation took place. Temporary and seasonal
employees were not included in this study because they would not have been employed
long enough to measure the effects, if any, of the competency model. Full-time and part-
time employees were separated into two samples to determine if employee engagement,
turnover intent, and/or the effects of the competency model differ depending on the
number of hours worked.

19
Limitations
A limitation of this study was that all the participants came from the same
organization and geographic location. However, two different types of restaurants (full-
service and fast-casual) were included in the study, as well as full- and part-time
employees. This variation helped to make the study more generalizable than if only one
restaurant and employee type had been examined.
A possible challenge and barrier to the success of this study which was considered
during the proposal stage was the implementation of the competency model in each of the
restaurant group’s six restaurants. Implementing a competency model requires
competencies that are critical for each position in the organization to be identified, then
those competencies must be integrated into the personnel selection, onboarding, training,
development, and talent identification processes (Ravichandran & Mishra, 2018). It was
anticipated that this process would be challenging, but this potential barrier was
addressed by gaining buy-in and commitment from the restaurant group’s leadership
team. Prosci’s ADKAR change management model has been effectively used to
implement change in organizations in other studies, so the model was selected to gain
buy-in and commitment to the changes that occurred as part of this proposed study
(Karambelkar & Bhattacharya, 2017).
Significance of the Study
This study addressed a gap in the literature by examining if implementing a
competency model affected employee engagement and turnover intention in restaurant
employees. Learning more about if the implementation of a competency model affected

20
turnover intent and employee engagement for restaurant employees could help to
establish best practices in talent management for this employee population. Employee
turnover is costly to restaurant owners due to the costs associated with selecting and
training new employees (DiPietro & McLeod, 2011).
Research has indicated that employees leave jobs because they have more
opportunities for upward mobility by getting a job at a different restaurant, so more effort
needs to be made to identify, develop, and retain internal talent (NRA, 2016). The current
literature also indicates that restaurant employees become disengaged when they do not
perceive that they have training and development opportunities in a job (DiPietro &
Bufquin, 2018). Researchers recommend that future studies that are focused on
engagement and turnover intent for restaurant employees examine which skills are
required for this population to be successful in their jobs (Brain, 2019; Harris et al.,
2017). It was hoped that a deeper understanding of whether competency models can be
used to improve employee engagement and reduce turnover intent for restaurant
employees would be gained as a result of this study. Another significant outcome of this
study would be that these measures might help restaurant employees to feel more fulfilled
in their jobs.
Summary
This study examined if implementing a competency model affected employee
engagement and turnover intent in restaurant employees. Low employee engagement and
high turnover intent are costly for restaurants due to low employee motivation and costs
associated with training new employees (Fowler, 2018). It was hoped that a deeper

21
understanding of whether competency models can be used to improve employee
engagement and reduce turnover intent for restaurant employees would be gained as a
result of this study. This study used a pretest-posttest quasi-experimental quantitative
design to test 20 hypotheses to show how these variables are related.

22
Chapter 2: Literature Review
Restaurant owners spend thousands of dollars per employee each year on costs
incurred due to high turnover and low engagement among restaurant employees (DiPietro
& Bufquin, 2018). High turnover and low engagement are detrimental to restaurant
owners due to the high costs associated with training and lost productivity (Brain, 2019;
DiPietro & Bufquin, 2018; DiPietro & McLeod, 2011). Competency models that are
integrated into an organization’s talent management processes have been used to improve
employee engagement and reduce turnover intent across many different industries (Derro
& Williams, 2009; Fowler, 2018; Nair et al., in press; Ravichandran & Mishra, 2018).
However, competency models and integrated talent management processes are not widely
used throughout organizations in the restaurant industry (Shai et al., 2016).
This pretest-posttest quasi-experimental quantitative study examined if there are
effects on turnover intent and employee engagement among restaurant employees before
and after a competency model was implemented. The second purpose of this study was to
examine if there was a difference in the effects of implementing a competency model for
full-time and part-time restaurant employees. A survey was used to measure turnover
intent and employee engagement before and after a competency model is implemented.
The competency model was implemented within a restaurant group that includes six
restaurants. All survey participants were employees of the same restaurant group.
In this chapter, existing studies related to competency models, employee
engagement, and turnover intent will be reviewed. The theoretical foundation for this
study, IPT, is reviewed, as well as empirical studies examining how these theories have

23
been used to improve engagement and decrease turnover intent for employees. Studies
related to competency models, employee engagement, and turnover intent for restaurant
employees are also reviewed in this chapter.
Literature Search Strategy
Multiple databases were queried to identify the material for this literature review.
The databases used included ProQuest, PsycARTICLES, PsycInfo, Emerald Research
Journals, SAGE Journals, Business Source Complete, and ScienceDirect. The search
terms used included implicit person theory, entity theory, incremental theory, restaurant
employee turnover, restaurant industry training, performance management, restaurant
employees, talent management best practices, mindsets, growth mindset, fixed mindset,
competency model, employee engagement, turnover intent, and implicit person theory
training. All the literature included in this review came from peer-reviewed sources or
published books. All the articles were found through the Walden Library or Google
Scholar.
Theoretical Foundation
Implicit Person Theory
The theoretical framework of this study is the IPT, which was first introduced by
Dweck and Leggett (1988) and addresses beliefs about the malleability of human
characteristics. This theory includes two different types of beliefs about whether human
characteristics can be changed: incremental theory and entity theory. Incremental theory
states human traits such as attitudes and behaviors can be changed, while entity theory
states these traits are fixed and cannot be changed (Dweck, 1986). Dweck’s (1896) initial

24
model of incremental and entity theories demonstrated how children’s goals when
pursuing various tasks framed their reactions to success or failure on those tasks, as well
as their performance on the tasks. Since its inception, Dweck’s model has been used to
design interventions that are intended to change behaviors, motivation, and performance
(El-Alayli & Baumgardner, 2003; Heslin et al., 2005; Katz & O’Malley, 2016).
Incremental and entity theories were first developed after studying children’s
reactions after experiencing success and failure (Dweck, 1986). Dweck (1986) studied
which psychological factors, rather than ability, predicted how effectively individuals
gained and used skills. It was discovered that children who believed they could improve,
or associated with incremental theory, were willing and able to make the changes needed
to be successful after they had experienced failure (Dweck, 1986). Dweck and Leggett
(1988) defined implicit theories as “fundamental assumptions about human attributes
which individuals develop to explain and understand their world” (p. 269). Implicit
theories are often referred to as “mindsets,” “self-theories,” “lay theories,” or “naïve
theories” by researchers (Lueftenegger & Chen, 2017). The term IPT is preferred by
many researchers because it best describes the fact that the theories are referring to
beliefs that often cannot be observed or are not made explicit. The term IPT is also used
to describe the framework individuals subconsciously use to predict and explain the
meaning behind various events they observe or experience (Yeager & Dweck, 2012).
However, Dweck (2006) published a book titled Mindset: The New Psychology of
Success to bring these theories more effectively to laypersons. The term “mindset” has
often been used to describe IPT in industrial/organizational psychology, where a fixed

25
mindset is used synonymously with entity theory and a growth mindset is used to
describe incremental theory (Caniels et al., 2018; Dweck, 2006).
Effects of Association With Incremental or Entity Theory
Since their inception, implicit theories have been described using two different
conceptual terms (Lueftenegger & Chen, 2017). Specifically, the theory posited that
individuals think of human attributes such as personality, intelligence, or social
characteristics as either unchangeable traits (entity theory) or as changeable qualities
(incremental theory; Dweck, 1986). For example, those who associate with entity theory
likely believe people are born with a certain personality that cannot be changed, while
those who associate with incremental theory likely believe personality traits can be
changed over time (Spinath et al., 2003). Additionally, individuals who associate with
incremental theory likely believe individuals can improve their ability to do mathematics,
while those who associate with entity theory would likely believe an individual’s
mathematics ability is fixed and cannot be improved (Lueftenegger & Chen, 2017).
Dweck and Leggett’s (1988) research found that associates with entity or incremental
theories are not limited to self-beliefs and that they also include beliefs about other
people, places, or phenomena.
While IPT is typically described in terms of beliefs rather than observable
behaviors, empirical studies identified that individuals who associate with entity theory
behave differently than those who associate with incremental theory when faced with
challenges (Dweck, 1986; Dweck & Leggett, 1988). It was observed that children who
believed their ability in mathematics could be improved (incremental theory) put more

26
effort into learning how to solve mathematical problems to which they did not initially
know the answer than children who did not believe their ability in mathematics could be
improved (entity theory). In addition to observable behaviors when experiencing a
challenge, an individual’s association with incremental or entity theories can be measured
using a self-report questionnaire (Dweck, 2000). The questionnaire requires respondents
to rate the degree to which they agree with various statements that are either associated
with entity theory or incremental theory.
Dweck and her colleagues’ research supported incremental and entity theories as
opposite ends of a spectrum (Dweck & Leggett, 1988; Dweck et al., 1995). Studies
conducted since Dweck’s original empirical work have used factor analysis to identify
incremental and entity theories as two distinct factors as opposed to a single bipolar
factor (Chen, 2012). Some researchers categorize incremental theory and entity theory as
two separate constructs that are modeled together (Dai & Cromley, 2014; Tempelaar et
al., 2014). Dweck (2006) also described IPT in terms of “mindsets” so it is more
applicable to laypeople. Dweck described those with a fixed mindset (entity theory) as
individuals who give up when experiencing failure and those with a growth mindset
(incremental theory) as individuals who embrace challenges and critical feedback and
view them as opportunities to learn and improve.
Applying IPT to the Workplace
Although IPT was developed by studying children, the theoretical framework has
also been examined concerning organizational culture and employee behaviors (Canning
et al., 2019; Emerson & Murphy, 2015; Murphy & Dweck, 2010; O’Reilly et al.,

27
2014). Canning et al. (2019) used three research studies with varying methods to evaluate
how organizational mindset can be used to predict organizational culture, employee trust,
and employee commitment. Canning et al. also used IPT to categorize organizational
mindsets as either fixed (entity theory) or growth (incremental theory). Canning et al.
discovered that employees perceive that organizations with growth mindsets have more
favorable organizational cultures than those with fixed mindsets. How employees
perceive an organization’s culture is important because positive perceptions of
organizational culture are positively correlated with high employee satisfaction,
productivity, retention, and company profits (O’Reilly et al., 2014).
Organizations that are perceived to have fixed mindsets are those that
communicate a belief that the abilities and personal qualities of their employees cannot
be developed over time. Such organizations will likely hire employees they believe are
naturally talented and will reward employees who demonstrate individual success
(Murphy & Dweck, 2010). Organizations perceived to have growth mindsets are those
that communicate that they believe their employees can develop and improve their
abilities and offer mentoring and learning opportunities to help their employees develop
(Canning et al., 2019). Organizations with growth mindsets are more likely to reward
employees for learning and developing new skills, and view failure as a learning
opportunity, than organizations with a fixed mindset (Murphy & Dweck, 2010).
Additionally, a study by Emerson and Murphy (2015) found that research participants
were less interested in working for an organization with a fixed mindset when also
presented with the prospect of joining an organization with a growth mindset.

28
Canning et al. (2019) examined the mission statements of all the Fortune 500
companies in the United States from 2013 and used that information to code the
organizations as having either a fixed or growth organizational mindset. The researchers
then used Glassdoor ratings of each company’s “culture and values” to determine
employee satisfaction with the company’s culture. The analysis of these data supported
Canning et al.’s hypothesis that employees who work for companies that appear to have a
fixed organizational mindset have less job satisfaction than employees who work for
companies that are perceived to have a growth organizational mindset. To further validate
their research, Canning et al. conducted a second study requiring participants to read the
mission statements of six Fortune 500 companies–half were coded as having a perceived
fixed mindset and the other half were coded as having a perceived growth mindset. The
results of this study supported Canning et al.’s hypothesis that individuals believe that
companies that appear to have a fixed mindset will be less collaborative, innovative, and
ethical than companies that appear to have a growth mindset, leading participants to
believe that trust and commitment will be lower in companies with fixed mindsets than
those with growth mindsets.
Canning et al. (2019) also conducted a field study with 538 employees from seven
Fortune 1000 companies that required the employees to complete a survey indicating
what they perceived their company’s organizational mindset to be; to what extent
collaboration, innovation, and integrity/ethical behavior were a part of their company’s
culture; their level of trust in the company; and their organizational commitment.
Consistent with the first two studies, the data from Canning et al.’s field study provided
29
evidence that employees who perceived that their company had a fixed mindset also
reported that the company culture was less collaborative, less innovative, and promoted
ethical behavior less than employees who perceived their company had a growth mindset.
Employees of companies perceived as having a growth mindset reported higher levels of
organizational trust and commitment than those at companies with a perceived fixed
mindset.
Having an organizational culture that employees perceive to be aligned with a
growth mindset, or incremental theory, is associated with high employee engagement,
low turnover intent, and a more profitable company (Canning et al., 2019; Murphy &
Dweck, 2010). Companies can create organizational cultures that promote growth
mindsets through their mission statements (Canning et al., 2019; Emerson & Murphy,
2015) and through communications and training that promote learning and development
among people managers and employees (Heslin et al., 2006; Johnston, 2017; Keating &
Heslin, 2015). While programs designed to create growth mindsets have been
implemented in various organizations (Derro & Williams, 2009; Heslin, 2010), there is a
gap in the literature about creating a growth mindset in a company in the restaurant
industry and about the effect that mindset will have on employee engagement and
turnover intent for restaurant employees.
One purpose of the current study was to build upon Dweck’s IPT, or mindset,
theory. This was done by testing research questions related to whether the
implementation of a competency model causes a statistically significant change in
employee engagement and turnover intent among restaurant employees. The competency

30
model implementation included training and development opportunities for employees in
the restaurant organization, which should foster a growth mindset within the organization
(Heslin et al., 2006; Johnston, 2017; Keating & Heslin, 2015). Competency models are
used to provide employees with information about which skills and abilities they need to
improve to succeed in their current roles and to prepare for higher-level roles (Fowler,
2018; Hatala & Hisey, 2011). Organizations perceived to have growth mindsets are those
that communicate the belief that employees can develop and improve their abilities
(Canning et al., 2019), and the use of competency models provide employees with the
tools they need to develop and improve job-related abilities (Fowler, 2018; Hatala &
Hisey, 2011).
Competency Models
A competency is a compilation of observable and measurable knowledge, skills,
and abilities (Hatala & Hisey, 2011). A competency model is a structure used to define
effective job performance by identifying all the competencies required for a specified
role. Competency models are used by organizations to provide clear expectations about
what is required for employees to be successful in their roles, which improves employee
performance (Fowler, 2018; Hatala & Hisey, 2011). Managers who work for
organizations using competency models are also able to provide effective, objective
performance feedback to their employees because the behavioral anchors defined by each
competency clearly state what employees need to do to be considered a high performer
(Derro & Williams, 2009; Ravichandran & Mishra, 2018; Ross & Stefaniak, 2018).

31
Competency models are considered a best practice in human resources
management (Fowler, 2018; Ross & Stefaniak, 2018). Specifically, it is recommended
that organizations use competency models that include both leadership (and “soft skills”
such as collaboration and trustworthiness) and technical competencies (Derro &
Williams, 2009; Ravichadran & Mishra, 2018). Competency models that include
leadership and technical competencies have been used to improve employee engagement
and reduce turnover intent (Fowler, 2018; Nair et al., in press).
After organizations have identified which competencies are required for their
roles, the competency model must be implemented into the organization’s talent
management processes to be effective (Fowler, 2018; Ross & Stefaniak, 2018).
Specifically, competency models should be implemented into an organization’s talent
selection, performance management, learning and development, and succession planning
processes (Ross & Stefaniak, 2018). For example, competency models have been used in
the technology sector to prepare employees for higher-level positions (Nair et al., in
press) and in the healthcare industry to help employees develop leadership skills
(Ravichandran & Mishra, 2018). However, human resources management best practices,
including the creation and implementation of competency models, are often not used by
organizations in the restaurant industry (Mjongwana & Kamala, 2018; Shai et al., 2016).
Using Competency Models in the Workplace
Competency models are often used in organizations to help employees focus on
the knowledge, skills, abilities, and behaviors needed to perform effectively (Campion et
al., 2011; Morgeson et al., 2009; Posthuma & Campion, 2008). Effective competency

32
models should be implemented into an organization’s hiring, evaluation, promotion, and
employee development processes (Campion et al., 2011; Morgeson et al., 2009; Posthuma
& Campion, 2008). The knowledge, skills, and abilities identified through competency
models should be linked to the organization’s overarching objectives for the model to be
effective. Organizations typically require each competency in a competency model to
include a title, a definition describing the behaviors required of an effective performer,
and a description of the proficiency levels required of each competency (Campion et al.,
2011). The specific proficiency levels used in a competency model vary based on the
type of competency development required by an organization (Groves, 2007; Posthuma
& Campion, 2008). For example, a competency model may define proficiency levels by
job levels within the organization, such as “junior engineer,” “staff engineer,” and “senior
engineer,” or by the level of expertise, such as “novice,” “skilled,” and “expert.”
Effective competency models will define the observable behaviors expected for each
competency in each proficiency level (Campion et al., 2011). The behaviors and
proficiency levels included in competency models should focus on good to excellent
performance, rather than including behaviors indicative of bad performance (Campion et
al., 2011; Groves, 2007; Olesen et al., 2007). Using this method will ensure employees
know what they should be doing rather than focusing on what they should not do
(Campion et al., 2011; Groves, 2007; Olesen et al., 2007). This specific level of detail is
required to be able to implement a competency model into all an organization’s human
resources processes (Campion et al., 2011). When behaviors are defined for each

33
competency at each proficiency level in a competency model, more effective interviews,
performance appraisals, and training programs can be created (Campion et al., 2011).
While the majority of competencies included in an organization’s competency
model will be similar to what is required for other organizations in the same industry, it is
also important that competencies that are aligned to a specific organization’s strategy and
competitive advantage are included in the model it implements (Groves, 2007; Posthuma
& Campion, 2008). When competencies specific to an organization’s strategy and
competitive advantage are included in a competency model, the model helps employees
focus on and accomplish organizational goals (Olesen et al., 2007). Including
competencies that are specific to the organization’s strategy often leads to the successful
implementation of the model because senior leaders will have a high level of buy-in
(Olesen et al., 2007). Getting the leaders of an organization to buy into the competency
model being designed and implemented is critical to ensuring lower-level managers use
the model when managing their employees (Campion et al., 2011).
A best practice of competency modeling is to implement the competencies into all
the human resources processes an organization uses so those processes are aligned
(Campion et al., 2011; Posthuma & Campion, 2008). To be implemented across multiple
human resources processes for all the jobs in an organization, the organization’s
competency model must include both technical and fundamental, or leadership,
competencies (Campion et al., 2011). Technical competencies refer to specific job-related
skill or knowledge and leadership or fundamental competencies refer to basic capabilities
(Posthuma & Campion, 2008). For example, Microsoft used a competency model that
34
includes fundamental competencies that apply to every employee in the organization and
technical competencies that were identified for each role in the organization (Olesen et
al., 2007). Implementing competency models into all an organization’s human resources
processes may allow the organization to hire, evaluate, compensate, train, and promote its
employees using the same elements (Campion et al., 2011). Details about how
organizations typically implement competency models into their human resources
processes are provided in the following sections.
Employee Selection
Once an organization has created a competency model, the model can be used in
the employee selection, or hiring, process (Campion et al., 2011). One best practice is to
use the behaviors identified in each competency to create behavioral interview questions
and a structured interview rating scale (Campion et al., 2011). Behavioral interviews that
use rating scales are more effective ways to select candidates who are a good fit for the
organization and the role they are applying for than interviews that do not use behavioral-
based questions or rating scales (Campion et al., 2011; Ravichandran & Mishra, 2018).
After creating an organization-wide competency model, The Boeing Company developed
a structured interview process that included questions based on the behavioral anchors
included in each competency (Campion et al., 2011). The interviews were designed so
hiring managers were able to identify if candidates were describing ineffective to highly
effective behaviors and to identify if candidates are qualified for entry-level or more
advanced job levels.

35
Competency models can also be used to determine which selection assessments
an organization uses, because assessments that measure the competencies will be used
(Campion et al., 2011). By measuring the competencies included in the organization’s
competency model during the selection process, hiring managers can assure they are
selecting candidates who are a good fit for the needs of the role (Campion et al., 2011).
Microsoft used the job-specific competencies the organization identified to determine
which selection assessments to implement (Olesen et al., 2007). Selection assessments
that measured the most critical competencies required for each specific open role were
implemented at Microsoft (Olesen et al., 2007).
Performance and Compensation
Competency models that identify proficiency levels for each competency can be
used in an organization’s performance process and to make compensation decisions by
distinguishing top performers from average performers (Campion et al., 2011; Morgeson
et al., 2009; Posthuma & Campion, 2008). Performance and compensation processes
based on competency models are more objective than processes that do not use
competencies because they allow managers to set clear expectations (Posthuma &
Campion, 2008). Specifically, competency models that use proficiency levels and
behavioral indicators for each competency allow organizations to distinguish between
low, moderate, and high performers, and they can determine how to reward high
performers and develop low and moderate performers (Campion et al., 2011; Morgeson
et al., 2009; Posthuma & Campion, 2008). Performance appraisal processes are often
almost entirely defined by an organization’s competency model because the model

36
contains a description of what effective performance looks like (Morgeson et al., 2009).
To be used in a performance appraisal process, all the competencies in a model should be
defined such that performance on one competency does not conflict with performance on
another (Morgeson et al., 2009).
When competency models are linked to an organization’s objectives and
performance levels, they can be used to make employee compensation decisions
(Campion et al., 2011; Morgeson et al., 2009; Posthuma & Campion, 2008). For example,
Microsoft used competency models to identify and reward high-performing employees
with monetary incentives (Olesen et al., 2007). Another example of an organization
utilizing a competency model to make performance and compensation decisions is
Indiana Precision Technology, which is a subsidiary of Honda (Campion et al., 2011).
Indiana Precision Technology identified competency models for its office staff,
engineering, production, and maintenance roles, and it used the models as a basis for
“pay for skills” programs that integrated the organization’s training, performance
appraisal, promotion, and compensation systems (Campion et al., 2011). Detailed
descriptions of the knowledge, skills, abilities, and behaviors needed at each proficiency
level of the competency models were used to evaluate employees, and training was
offered to those who needed to improve specific skills (Campion et al., 2011). Indiana
Precision Technology also used competency models to create on-the-job skills tests to
determine if employees were ready to be promoted and to differentiate pay by paying
employees with higher skill levels more than those with lower skill levels. Indiana
Precision Technology attributed its competitive advantage in part to the competency

37
models it created, which were then used to align the organization’s human resources
processes (Campion et al., 2011).
A study by Moghaddam et al. (2019) was conducted to create a competency
model that identified and evaluated nontechnical competencies for head nurses.
Moghaddam et al. (2019) were able to successfully identify the nontechnical leadership
competencies head nurses need to be successful in their roles. The researchers also
defined an effective performance process that was created using a competency model that
included all the competencies required to be an effective head nurse (Moghaddam et al.,
2019). Utilizing performance and compensation processes that are objective, efficient,
and effective is critical for achieving organizational goals. Utilizing effective
performance and compensation processes is critical for reducing the costs associated with
turnover and lost production from low performers (Moghaddam et al., 2019).
Identifying Development Needs and Providing Training
An effective way to identify employee training and development needs is through
the use of competency models (Fowler, 2018; Ravichandran & Mishra, 2018). A best
practice within organizations is to train employees using programs that were created to
develop specific competencies (Campion et al., 2011). In addition to using a competency-
based performance process, one way to identify which competencies an employee needs
to develop is through the use of a competency-based 360-degree feedback survey.
Organizations can ask various people with whom an employee works to rate the
employee’s proficiency level on competencies that are specific to the employee’s current

38
role or a role they may be considered for in the future (Campion et al., 2011; Fowler,
2018).
Once an employee’s development needs have been identified through the
performance process and/or a 360-degree feedback survey, the employee can be enrolled
in training programs or on-the-job development opportunities to improve their
proficiency on the competencies identified for development (Ravichandran & Mishra,
2018). Microsoft went beyond only identifying the training and development needs for
individual employees and collected competency-based performance and 360-degree
feedback survey data for all the employees in a specific department or job family (Olesen
et al., 2007). Using the department and job family competency data, Microsoft created
what was internally referred to as “talent schools” to train many employees on the same
competency all at once (Olesen et al., 2007). The Boeing Company used competency
models to align its human resources processes by creating competency models for each
job family (e.g., Information Technology or Finance) (Campion et al., 2011). The job
family-specific competency models contain the competencies that are most critical for
current and future performance in that job family (Campion et al., 2011). Employee
performance is evaluated on each competency using a behaviorally anchored rating scale
(Campion et al., 2011). After the performance evaluations are completed and the
competencies each employee needs to improve are identified, training and development
opportunities that are aligned to each competency are provided to employees (Campion et
al., 2011). Boeing determined this method helped their employees perform better in their
current roles, prepared them for future roles (Campion et al., 2011).

39
Succession Planning
Competency models are a common way to guide succession programs because
they often document the competencies and proficiency levels required not only for
employees’ current roles but for their future roles as well (Campion et al., 2011; Groves,
2007). Competency models utilizing proficiency levels for each competency can use the
models to inform their succession programs because they have already defined the
promotion criteria for each role (Groves, 2007; Morgeson et al., 2009). Microsoft asked
each of their employees and the employee’s manager to complete a competency
assessment that measured the level of proficiency required for roles that are a higher level
than the employee’s current role (Olesen et al., 2007). Microsoft then asked each
employee to use the feedback from the assessment to work with their manager to identify
future roles the employee could be a good fit for based on their competency strengths and
career interests.
The U.S. Department of State also used a succession process based on a
competency model (Campion et al., 2011). The Department of State identified six
foundational competencies applicable to all jobs in the organization and 30 competencies
specific to different roles within the department, all of which were defined using three
levels: junior, middle, and senior (Campion et al., 2011). The department used the
competency model to assess job candidates’ skills during the selection process. Once
hired, all employees in the department were assessed on the six foundational
competencies and any job-specific competencies as part of the annual performance
evaluation process. Promotion panels then reviewed the performance evaluations to

40
determine which employees received promotions. The performance reviews also
determined which competency-based training courses employees were asked to complete.
Some employees were able to complete a job rotation program that allowed them to
develop the competencies required for several different roles. This made the employees
good candidates for promotions because they had the skills necessary to be successors for
several different roles. The Department of State is an example of how organizations can
create competency models and use them to align their human resources processes to
ensure the employees they hire, identify as successors for higher-level roles, and promote
have the knowledge, skills, and abilities required to perform those roles at a high level.
Using Competency Models in the Hospitality Industry
The term “hospitality industry” is used to define fields related to lodging,
restaurants, event planning, and tourism (Bureau of Labor Statistics, 2019). While
competency models are not commonly used in the hospitality industry, some
organizations and researchers have successfully created and implemented them (Chung-
Herrera et al., 2003; Mjongwana & Kamala, 2018; Shai et al., 2016). Chung-Herrera et al.
(2003) discovered that a competency model had not been developed for leadership
positions in the hospitality industry, so the researchers conducted a study to identify the
competencies necessary to be a successful leader in the field. Chung-Herrera et al. (2003)
found it was most critical to identify the competencies needed for leadership positions in
the hospitality industry because those competencies would inform the critical skills
needed throughout the entire field. Identifying competencies needed for leadership
positions would also allow organizations in the hospitality industry to create leadership
41
development programs to help employees advance in hospitality careers (Chung-Herrera
et al., 2003). After surveying 137 participants who were in leadership positions in the
hospitality industry, Chung-Herrera et al. (2003) identified eight critical competency
groups for leadership roles. The critical competency groups for hospitality industry
leaders are communication, critical thinking, implementation, industry knowledge,
interpersonal skills, leadership, self-management, and strategic positioning.
The research conducted by Chung-Herrera et al. (2003) was implemented in two
organizations in the hospitality industry as part of their study: Choice Hotels International
and Marriott International. The researchers found Choice Hotels International used a
competency model to perform readiness assessments that identified which employees had
the leadership capabilities needed to be successful in the organization’s senior-level
positions (Chung-Herrera et al., 2003). It was also noted that Choice Hotels used its
competency model to guide the selection, promotion, and succession planning processes
for its senior-level leadership positions. Marriott used the competency model identified
by Chung-Herrera et al. (2003) to guide its Benchstrength Management System. The
Benchstrength Management System was used by Marriott’s senior leaders to develop
leadership capabilities for employees who had been identified as successors to the senior
leaders. Marriott’s senior leaders were asked to identify possible successors for their
roles, and then the Benchstrength Management System was used to identify which
leadership competencies the successors needed to focus on developing. The use of
competencies in Marriott’s Benchstrength Management System provided the organization

42
with a consistent approach to evaluating and developing its future leaders (Chung-
Herrera et al., 2003).
Chung-Herrera et al.’s (2003) work was later used to inform additional research
surrounding the use of competency models in the restaurant industry (Bharwani & Talib,
2017; Shum et al., 2018). Bharwani and Talib (2017) used the research conducted by
Chung-Herrera et al. (2003) and the job requirements for hotel general managers in the
current era to identify a competency model for hotel general managers. Many of the
leadership competencies identified in Bharwani and Talib’s (2017) research were the
same as the competencies Chung-Herrera et al. (2003) identified, but the technical skills
needed for the hotel general manager position varied. Shum et al. (2018) used Chung-
Herrera et al.’s (2003) research to identify competency models for frontline and director-
level managers in the hospitality industry. Shum et al. (2018) identified 15 competencies
that were necessary for both frontline and director-level managers in the hospitality
industry and grouped them into three categories: business leadership, personal leadership,
and people leadership competencies. A survey of 98 managers in the hospitality industry
was used to conclude that business leadership competencies were the highest priority for
director-level managers, and people leadership competencies were most important for
frontline managers (Shum et al., 2018).
Within the hospitality industry, the restaurant field is especially competitive (Shai
et al., 2016). Restaurants often face difficulties related to labor shortages due to the high
employee turnover, and restaurant owners face high costs associated with hiring and
training new employees (Shai et al., 2016). Restaurant employees cited limited

43
opportunities for training and promotions as reasons for leaving their jobs (Shai et al.,
2016). Shai et al. (2016) determined one way to combat these issues was to focus on
improving the quality of people managers in the restaurant field. One method of
improving managerial quality, according to Shai et al. (2016), was to identify which
managerial competencies were critical for people managers to possess. To identify the
critical competencies, Shai et al. (2016) asked 49 restaurant managers and 131 restaurant
employees to complete a questionnaire, which asked them to rank various technical and
leadership competencies from most to least critical for restaurant managers to exhibit on
the job. After analyzing the results of the questionnaires, Shai et al. (2016) determined
technical competencies such as calculating food costs, serving methods, culinary skills,
and menu development are critical for entry-level restaurant managers. More senior-level
restaurant managers, such as General Managers, needed to be able to motivate employees
in addition to being able to operate day-to-day restaurant activities. The study by Shai et
al. (2016) demonstrated the importance of possessing both technical and leadership skills
to effectively manage a restaurant. When both managers and employees have the
competencies needed to be successful in their roles, their performance and job
satisfaction increase, which leads to positive outcomes for the restaurant (Shai et al.,
2016). This study supported the importance of creating a competency model for jobs in
the restaurant field.
Food and Beverage Service Competency Model
In January of 2015, the U.S. Department of Labor published the Food and
Beverage Service Competency Model, which was the first comprehensive competency

44
model to be created for the restaurant sector (Mannix & Mills, 2015; National Restaurant
Association, 2015). Having a competency model that can be used to attract, develop, and
retain employees in the restaurant industry is critical (Mannix & Mills, 2015). The
industry is comprised of over 980,000 restaurants or foodservice outlets and employs a
workforce of over 13 million people in the United States alone (Mannix & Mills, 2015).
The purpose of creating the competency model was to set clear and consistent standards
for educators and employees in the food and beverage service industry, which includes
the restaurant sector (U.S. Department of Labor, n.d.). The competency model was also
created to provide employees, prospective employees, and business owners in the food
and beverage service industry with detailed information about how to enter, advance in,
and be successful in the industry (U.S. Department of Labor, n.d.).
To ensure the competency model accurately encompassed all the competencies
necessary for the food and beverage service industry, the U.S. Department of Labor
worked with the National Restaurant Association Educational Foundation (NRAEF) and
subject-matter experts in the industry to develop the model and outline best practices for
implementing it (U.S. Department of Labor, n.d.). The NRAEF is a sector of the National
Restaurant Association whose purpose is to “enhance the restaurant and foodservice
industry’s service to the public through education, community engagement, and
promotion of career opportunities” (U.S. Department of Labor, n.d., “Food and Beverage
Service Competency Model,” para. 2). After developing the food and beverage service
competency model, the U.S. Department of Labor and the NRAEF validated the model
with 50 organizations in the food and beverage industry.

45
The Food and Beverage Service Competency Model, shown in Figure 1,
categorized the competencies using tiers: Personal Effectiveness, Academic, Workplace,
Industry-Wide, and Industry-Sector Technical Competencies (U.S. Department of Labor,
2017). The model also included management competencies and allowed organizations to
identify additional occupation-specific requirements to add to their specific
organization’s model. The U.S. Department of Labor (2017) published a guidebook
including an overview of the model and details about the behaviors, knowledge, skills,
and abilities required for each competency, so organizations in the food and beverage
service industry can implement the model for their employees. The U.S. Department of
Labor and the NRAEF also published guidelines for how the Food and Beverage Service
Competency Model can be used (National Restaurant Association, 2015). They
recommended that restaurant owners and operators use the competency model when
hiring, training, promoting, and evaluating employees (National Restaurant Association,
2015). The U.S. Department of Labor (2017) provided worksheets for restaurant owners
and operators to use to identify which competencies in the model are most critical for
their specific organization and to implement the competencies into their hiring, training,
promotion, and performance evaluation processes.

46
Figure 1. Food and Beverage Service Competency Model. From “Food and Beverage Service Competency Model,” by U.S. Department of Labor, n.d. Competency Model Clearinghouse (https://www.careeronestop.org/competencymodel/competency -models/food-service.aspx). In the public domain.

47
Employee Engagement
Employee engagement is a measure of the extent to which employees devote their
physical, emotional, and cognitive energy to their jobs and the organization they work for
(Kahn, 1990). An effective measure of employee engagement will incorporate physical,
emotional, and cognitive engagement (Rich et al., 2010). When employees are engaged,
they will exhibit motivation and discretionary effort because they are passionate about
achieving the organization’s objectives (Heslin, 2010). There is an important distinction
between employee engagement and employee satisfaction. Employee satisfaction
indicates how happy, or content employees are (Omar et al., 2017). Employee satisfaction
does not take an employee’s motivation, emotional commitment, or involvement into
account (Omar et al., 2017). Organizations should focus on employee engagement
because it drives organizational performance (Rich et al., 2010).
Mindset is related to employee engagement (Murphy & Dweck, 2010).
Organizations perceived to have growth mindsets are those that communicate they
believe their employees can develop and improve their abilities (Canning et al., 2019),
and the use of competency models provide employees with the tools they need to develop
and improve job-related abilities (Fowler, 2018; Hatala & Hisey, 2011). Organizational
cultures that are perceived to have a growth mindset are associated with higher employee
engagement and higher profits than organizations perceived to have a fixed mindset
(Canning et al., 2019; Murphy & Dweck, 2010). Engaged employees are more likely to
exhibit prosocial behaviors and to perform tasks that are beyond their job roles, which
benefits the organization as a whole (Canning et al., 2019). Engaged employees are more

48
likely to stay with their current organization longer than unengaged employees, which
reduces organizational costs associated with turnover and training (Canning et al., 2019).
In the restaurant industry, engaged employees perform better and provide better customer
service than unengaged employees (Watson et al., 2018). High performance and customer
service in the restaurant industry are correlated with high customer satisfaction and
increased sales (Watson et al., 2018).
High employee engagement is not only beneficial to organizations, but to the
employees themselves (Hakanen et al., 2019). Engaged employees have better physical
health and mental well-being than their unengaged counterparts (Hakanen et al., 2019;
Rich et al., 2010). Initiatives designed to improve employee engagement will have
positive social impacts by increasing productivity for organizations and improving
employee well-being (Rich et al., 2010).
Engagement Differences Between Full- and Part-Time Employees
Levels of employee engagement have not been found to be statistically different
between full- and part-time employees when examining employees from many different
industries together (Hakenen et al., 2019). For industries where the majority of
employees do not have a college degree, there is a statistically significant difference in
levels of engagement between full- and part-time employees (Hakenen et al., 2019). In
industries where the majority of employees do not have a college degree, part-time
employees are significantly less engaged than full-time employees (Hakenen et al., 2019).
The majority of employees in the foodservice, or restaurant, industry do not have college
degrees (DiPietro & McLeod, 2011; NRAEF, 2014).

49
Researchers have found that part-time foodservice employees are significantly
less engaged than full-time foodservice employees (Jaworski et al., 2018; Joung et al.,
2018). Evidence suggests that part-time foodservice employees may be less engaged
because they receive less training, less recognition, and fewer benefits than their full-time
counterparts do (Jaworski et al., 2018). It was recommended that organizations in the
foodservice industry provide the same training and career development opportunities to
both part- and full-time employees (Joung et al., 2018). This is especially important
because most employees in the foodservice industry are part-time, thus their engagement
level has a significant effect on organizational performance (Jaworski et al., 2018).
Impact of Managerial Style on Employee Engagement
While organization-wide initiatives are effective ways to improve employee
engagement, direct managers also have a major impact on their employees’ engagement
levels (Burris et al., 2008; Heslin, 2010). To be perceived as having a growth mindset,
organizations must employ people managers who motivate their employees to achieve
organizational goals (Canning et al., 2019; Keating & Heslin, 2015). When employees
are not engaged, the organization they work for may be negatively affected because
unengaged employees may not tell their managers about issues that occurred in the
workplace (Burris et al., 2008). Additionally, unengaged employees may not attempt to
resolve the problems they discovered within the organization (Burris et al., 2008).
Employees need to trust that they can tell their manager when they are dealing
with a problem at work or when they discover and issue that could be solved (Burris et
al., 2008). To be engaged, employees also need to believe that their thoughts regarding

50
how the organization should operate will be considered by their manager (Burris et al.,
2008). People managers have been able to keep employees engaged by focusing on
transformational leadership (Nielsen et al., 2008).
Transformational leaders are those who inspire their employees to focus on goals
that are beyond their self-interests (Nielsen et al., 2008). People managers who are
transformational can motivate employees to work toward initiatives that benefit a group
or the organization as a whole (Nielsen et al., 2008). Transformational leaders are often
described as charismatic, influential, inspirational, and motivating (Nielsen et al., 2008).
To become transformational, people managers need to create a vision for their teams and
the organization they support, and then share that vision with their employees (Nielsen et
al., 2008). Transformational leaders help employees connect to the vision and mission by
providing the coaching and training needed to be able to make the vision a reality
(Nielsen et al., 2008).
Employees who have a manager considered a transformational leader are more
engaged than employees who do not feel connected to their manager (Nielsen et al.,
2008; Rich et al., 2010; Watson et al., 2018). This is because transformational leaders
provide employees with information about how the work they do affects the larger
organizational objectives (Rich et al., 2010).
Effects of Competency Models on Employee Engagement
Leaders are typically attracted to the implementation of a competency model
because competency models are used to create positive organizational change (Campion
et al., 2011). Specifically, it is recommended that organizations implement competency

51
models to improve employee engagement (Canning et al., 2019; Derro & Williams, 2009;
Dewettinck & Vroonen, 2017; Fowler, 2018). Competency models are effective ways to
improve employee engagement because they provide employees with details about the
organization’s objectives (Fowler, 2018). Competency models also outline what
employees need to focus on in their roles, and what will be required for employees to
advance their careers in that organization (Fowler, 2018).
To improve employee engagement in an organization, the competency model the
organization implements must contain certain criteria, including both leadership and
technical competencies (Nair et al., in press). Additionally, the competency model must
be integrated into the organization’s talent management processes (e.g., selection,
performance management, compensation, needs analysis, training, and succession
planning; Fowler, 2018). Employees are more engaged when they believe the
organization they work for is committed to helping them perform at a high level and
when they believe the organization is invested in their careers (Heslin, 2010). Employees
are also more engaged when they understand the organization’s objectives (Keating &
Heslin, 2015). By providing information to employees about the organization’s
objectives, what is required for their roles, and what behaviors are needed to advance in
the organization, competency models can be used as a tool for improving employee
engagement (Fowler, 2018; Nair et al., in press; Ravichandran & Mishra, 2018). No peer-
reviewed data were found related to the U.S. Department of Labor’s Food and Beverage
Service Competency Model and its correlation with employee engagement. One purpose
of the current study was to add knowledge to that gap in the literature.

52
Employee Engagement in the Restaurant Industry
The restaurant industry employs over 13 million people in the United States alone
(Mannix & Mills, 2015). However, there is a literature gap surrounding employee
engagement in the restaurant industry (Harris et al., 2017). Most empirical studies that
have examined employee engagement in the restaurant industry were conducted on
employees outside of the United States (Mjongwana & Kamala, 2018; Ogunmokun et al.,
2019; Watson, 2018; Watson et al., 2018). This literature gap could be due to findings
indicating that organizations in the restaurant industry do not often focus on employee
engagement or training and development for employees (Shai et al., 2016).
Restaurant owners who do focus on employee engagement and provide training
and development opportunities to their employees have higher profitability and customer
satisfaction than restaurant owners who do not take these factors into account (Brain,
2019; Mjongwana & Kamala, 2018; Pai et al., 2018; Shai et al., 2016). Engaged
employees in the restaurant industry have higher performance and provide better
customer service than unengaged restaurant employees (Watson et al., 2018). For
organizations in the restaurant industry, high employee performance, and high levels of
customer service are positively correlated with higher customer satisfaction and increased
sales (Watson et al., 2018). When restaurant employees perceive that the organization
they work for supports their development, they are more likely to exhibit behaviors
desired by the organization than employees who do not perceive that the organization
supports their development (Harris et al., 2017). When attempting to engage employees
in the restaurant industry, it is critical to provide them with information about the

53
organization’s objectives and how the work they do helps to achieve those objectives
(Watson et al., 2018).
Using the JES to Measure Employee Engagement
The current study measured employee engagement using the JES. The JES was
developed using Kahn’s (1990) definition of employee engagement. Kahn defined
engagement as a motivational construct that refers to employees’ willingness to invest
their physical, emotional, and cognitive energies into their jobs. Although Kahn
developed this definition 20 years ago, it is still widely regarded as the most
comprehensive definition of job engagement (Basit & Chauhan, 2017).
The JES measures engagement using three factors: physical engagement,
emotional engagement, and cognitive engagement (Rich et al., 2010). Each subscale
includes six items, and the JES is 18 items total. Respondents to the JES read each item
and use a five-point response to indicate their level of agreement or disagreement with
each item. For example, one item used to measure employees’ physical engagement is “I
work with intensity on my job” (Rich et al., p. 634) Emotional engagement is measured
using items such as “I feel positive about my job”, and cognitive engagement is measured
by items such as “At work, I focus a great deal of attention on my job” (Rich et al., 2010,
p. 634). The JES has been used effectively throughout many different regions and
industries to measure employee engagement (Basit & Chauhan, 2017).
Turnover Intent
Turnover intent is a measure of how likely an employee is to leave the
organization they currently work for (Roodt, 2004). The Turnover Intention Scale

54
measures turnover intent by asking employees if they have plans of leaving the
organization they currently work for (Bothma & Roodt, 2013). Organizations need to
measure turnover intent because employees who have plans to leave the organization are
often unengaged and eventually do leave their jobs (DiPietro & McLeod, 2011).
Turnover and loss of productivity due to unengaged employees are costly to
organizations and should be avoided (Burris et al., 2008; Canning et al., 2019).
Organizations in several different industries have used integrated talent
management processes to reduce turnover intent (Omar et al., 2017). Reducing turnover
intent has been negatively correlated with an increase in organizational performance
(Omar et al., 2017). Organizational cultures that are perceived to have a growth mindset
are associated with lower turnover intent and higher profits than organizations perceived
to have a fixed mindset (Canning et al., 2019; Murphy & Dweck, 2010). Research
examining differences in turnover intent between full- and part-time employees and
different managerial styles will be examined throughout this section. The existing
literature related to turnover intent and competency models and turnover intent in the
restaurant industry will also be examined throughout this section.
Turnover Intent Differences Between Full- and Part-Time Employees
Part-time employees have higher turnover intent than full-time employees
(DiPietro & Bufquin, 2018). This is true across all industries, including the restaurant
industry (DiPietro & Bufquin, 2018; Joung et al., 2018). The problem of high turnover
intent among part-time employees is especially pronounced in the restaurant industry

55
because most of the workforce is comprised of part-time employees (DiPietro & Bufquin,
2018).
DiPietro and McLeod (2011) examined turnover intent for employees who either
identified themselves as part- or full-time. All 296 participants in DiPietro and McLeod’s
(2011) study were employees who worked for a fast-casual restaurant chain in the United
States. DiPietro and McLeod (2011) defined part-time employees as those who did not
have permanent hours and were subject to be scheduled according to customer demand
(i.e., during times the restaurant was expected to be busiest). Full-time employees were
defined as those who held permanent positions within the organization with predictable
and regular hours (DiPietro & McLeod, 2011). The researchers found that employees
who identified themselves as part-time had higher turnover intent than those who
identified themselves as full-time. Additionally, employees who identified themselves as
part-time displayed fewer positive customer service behaviors than employees who
identified themselves as full-time (DiPietro & McLeod, 2011).
Restaurant owners often hire part-time employees in part as a cost-savings
measure (DiPietro & Bufquin, 2018). Part-time employees are generally less expensive
than full-time employees because organizations in the United States are not required to
provide the same benefits to part-time employees as to full-time employees (DiPietro &
Bufquin, 2018). However, those costs are often offset by expenses due to high turnover
among part-time employees (DiPietro & Bufquin, 2018). To reduce turnover intent
among part-time employees, it is recommended that organizations in the restaurant

56
industry provide them with managerial support and professional development
opportunities (DiPietro & Bufquin, 2018).
Impact of Managerial Style on Turnover Intent
Managerial style can affect restaurant employees’ turnover intentions. A study by
Burris et al. (2008) examined the effects of voice on employees’ intentions to leave an
organization using data from 269 restaurants located in 21 states throughout the U.S.
(Burris et al., 2008). In Burris et al.’s (2008) study, voice was defined as upward-directed
verbal communication to managers that was identified by research participants as either
intended to improve or criticize. Specifically, the participants in this study were asked
questions about how often they provide feedback and input to their manager, what the
intention of the feedback was (to be critical or to help the manager improve), and about
their intention to leave the organization. Burris et al. (2008) determined intention to leave
was significantly negatively correlated to voice and mediated the relationship between
perceptions of leadership, which was defined as leader-member exchange or abusive
supervision.
When the relationship between an employee and supervisor is poor, employees
often think about leaving the organization and invest less time and effort into improving
the work environment or sustaining high levels of performance (Burris et al., 2008). This
is especially harmful in the restaurant industry because employees may put the
organization at risk if they do not inform their managers about food safety issues.
Additionally, it is common for restaurant employees to find comparable employment at
another organization in a short amount of time, so managers in this industry must develop

57
open and positive relationships with their employees (Burris et al., 2008). When
employees become detached from an organization and stop putting effort into improving
their workplace, the organization will suffer due to the cost of turnover and will not have
the information they need to resolve issues that could prevent turnover (Burris et al.,
2008; DiPietro & Bufquin, 2018).
Effects of Competency Models on Turnover Intent
Competency models and accompanying managerial training on how to use
competencies have been used to effectively reduce turnover intent (Canning et al., 2019;
Derro & Williams, 2009; Dewettinck & Vroonen, 2017; Fowler, 2018). Specifically,
competency models that include both leadership and technical competencies have been
used to reduce employee turnover intent (Derro & Williams, 2009; Nair et al., in press).
The competency model must also be integrated into an organization’s talent management
processes to be used as a tool for reducing turnover intent (Fowler, 2018; Ravichandran
& Mishra, 2018).
Utilizing performance and compensation processes that are objective is critical for
reducing turnover intent (Moghaddam et al., 2019). By creating objective performance
and compensation processes, competency models have been used to reduce employee
turnover intent (Moghaddam et al., 2019). Using competency-based talent management
processes (such as performance and compensation) reduces the organizational costs
associated with both lost production from low performers and from turnover due to
underpaying high performers who later leave the organization (Moghaddam et al., 2019).

58
To successfully design and implement a competency model, buy-in and
involvement from executive leaders, people managers, and employees within the
organization are critical (Campion et al., 2011). Executive leaders need to be educated on
the value of competency models, as well as how they can be used to prevent turnover
(Campion et al., 2011; Moghaddam et al., 2019). Educating executive leaders typically
requires that human resources professionals demonstrate a positive correlation between
the use of the competency model in talent management processes and the effect on job
performance (Campion et al., 2011). Another method of gaining buy-in for a competency
model implementation is to demonstrate the cost reductions that will be realized due to a
decrease in turnover (Campion et al., 2011). These methods can also be used to gain buy-
in from employees at all levels of the organization. Employees are often quick to buy into
a new competency model that has been implemented in the organization they work for
because, as a result of the implementation, employees have more clarity about what to
focus on to be successful in their roles (Moghaddam et al., 2019).
Researchers recommend that additional research be conducted on the use of
competency models in the restaurant industry (Brain, 2019; Harris et al., 2017).
Specifically, additional research related to competency models and their effect on
turnover intent in the restaurant industry is needed (Brain, 2019; Harris et al., 2017).
There are currently no peer-reviewed data on the use of the Food and Beverage Service
Competency Model and its effect on turnover intent. One purpose of the current study
was to add to the literature in this area.

59
Turnover Intent in the Restaurant Industry
High turnover intent among employees is costly to restaurant owners due to low
productivity and costs associated with training new employees (Fowler, 2018). High
turnover intent is correlated with high levels of actual turnover (DiPietro & Bufquin,
2018). In the U.S. accommodations industry, which includes restaurants, the quit rate
(voluntary turnover) is 55% (BLS, 2019). The BLS does not report restaurant turnover
rates independent of the larger accommodations industry. However, research suggests
that voluntary turnover is higher for restaurant employees than the accommodations
sector as a whole (DiPietro & Bufquin, 2018; NRA, 2016). Voluntary turnover rates are
higher for fast food and fast-casual restaurants than for fine dining venues (DiPietro &
Bufquin, 2018). In 2010, the overall turnover rate for fast food and fast-casual restaurants
was 110% (DiPietro & Bufquin, 2018). Restaurant owners have stated that employee
turnover is one of their largest concerns due to high costs associated with acquiring and
training new employees (DiPietro & Bufquin, 2018).
While it is widely accepted that restaurant owners incur high costs due to
employee turnover, there is a literature gap regarding effective methods of reducing
turnover intent and actual turnover in the restaurant industry (Brain, 2019; DiPietro &
McLeod, 2011). Many researchers believe applying methods that have been effective at
reducing turnover intent in other industries will also work well in the restaurant industry
(Brain, 2019; DiPietro & Bufquin, 2018; Pai et al., 2018; Shai et al., 2016). However,
additional research needs to be conducted to determine if this is true. Restaurant
employees cite limited opportunities for training and career advancement as the primary

60
reasons for leaving their jobs (Shai et al., 2016). To provide restaurant employees with
additional training and career advancement opportunities, it is recommended that
organizations in the restaurant industry implement competency models (Canning et al.,
2019; Derro & Williams, 2009; Dewettinck & Vroonen, 2017). After implementing a
competency model, it is recommended that organizations in the restaurant industry create
talent management processes based on the competencies in the model (Canning et al.,
2019; Derro & Williams, 2009; Dewettinck & Vroonen, 2017).
Using the TIS-6 to Measure Turnover Intent
This study measured turnover intent using the TIS-6, which includes only one
factor, turnover intention (Roodt, 2004). Turnover intention is defined as employees’
plans to and likelihood of leaving their position in an organization (Roodt, 2004). The
TIS-6 requires participants to read six items and indicate how well each item describes
their feelings use a five-point rating scale ranging from “never” to “always.” For
example, items included in the TIS-6 are “How often do you look forward to another day
at work?” and “How often have you considered leaving your job?” (Roodt, 2004, p. 4).
The TIS-6 was originally an unpublished 15-item scale developed by Roodt
(2004). However, reliability studies showed that the six-item scale measures turnover
intention as well as the 15-item scale (Bothma & Roodt, 2013). The six-item scale was
selected instead of the 15-item scale because of its brevity and internal consistency
reliability.

61
Summary and Conclusions
Voluntary turnover rates (quits) are higher in the U.S. accommodations industry
than the national average (BLS, 2019). Within the U.S. accommodations industry, the
restaurant and foodservice sector employs 15 million people, so restaurant owners must
focus on retaining these employees (DiPietro & Bufquin, 2018; NRA, 2019). High
turnover is costly to restaurant owners due to costs associated with lost productivity from
unengaged employees and from training new employees (DiPietro & Bufquin, 2018).
Additionally, the mental and physical wellness of restaurant employees is harmed when
the employees are not engaged in their current roles (Hakanen et al., 2019; Rich et al.,
2010).
The theoretical framework of this study is IPT, which addresses beliefs about the
malleability of human characteristics (Dweck & Leggett, 1988). This theory uses two
classifications, incremental theory, and entity theory, to define differing beliefs.
Incremental theory defines the belief that human traits such as attitudes and behaviors can
be changed, and entity theory defines the belief that these traits are fixed and cannot be
changed (Dweck, 1986). In relation to workplaces, IPT has been applied to organizational
mindsets (Canning et al., 2019; Murphy & Dweck, 2010). Organizations that are
perceived to have fixed mindsets (entity theory) are those that communicate a belief that
the abilities of the personal qualities of their employees cannot be developed over time
(Murphy & Dweck, 2010). Organizations perceived to have growth mindsets
(incremental theory) are those that communicate that they believe their employees can
develop and improve their abilities (Canning et al., 2019). Organizations perceived to

62
have growth mindsets often offer mentoring and learning opportunities to help their
employees develop (Canning et al., 2019). Organizational cultures perceived by
employees to be aligned with growth mindsets are associated with high employee
engagement, low turnover intent, and higher profits (Canning et al., 2019; Murphy &
Dweck, 2010).
Organizations use competency models to define effective job performance by
identifying the observable and measurable knowledge, skills, abilities, and behaviors
required for specific roles (Hatala & Hisey, 2011). Competency models can be used to
improve employee engagement and reduce turnover intent when they are implemented
into an organization’s selection, performance, compensation, training, development, and
succession planning processes (Campion et al., 2011; Posthuma & Campion, 2008). In
2015, the U.S. Department of Labor published the Food and Beverage Service
Competency Model, which was the first comprehensive competency model to be created
for the restaurant industry (Mannix & Mills, 2015; NRA, 2015). No peer-reviewed
literature was found regarding the implementation of the Food and Beverage Service
Competency Model. This study examined if employee engagement and turnover intent
were affected after a restaurant organization implemented the Food and Beverage Service
Competency Model into its talent management practices.
Highly engaged employees will work toward achieving organizational goals as
opposed to working only on aspects of their jobs that benefit their interests (Heslin, 2010;
Rich et al., 2010). Within the restaurant industry, engaged employees perform better and
provide better customer service when compared to unengaged employees (Watson et al.,

63
2018). High performance and customer service are positively correlated with high
customer satisfaction and increased sales in the restaurant industry, so it is critical to
focus on initiatives that will increase employee engagement among restaurant employees
(Watson et al., 2018). Restaurant owners also need to focus on decreasing turnover intent
among their employees (Omar et al., 2017). Reducing turnover intent has been negatively
correlated with an increase in organizational performance for organizations in the
restaurant industry (Omar et al., 2017).
There is a gap in the literature regarding the use of competency models and their
effect on employee engagement and turnover intent for employees in the restaurant
industry. This study sought to add information to that literature gap by using a pretest-
posttest quasi-experimental quantitative study to examine if there were effects on
turnover intent and employee engagement among restaurant employees before and after a
competency model was implemented. The current study also examined if there was a
difference in the effects of implementing a competency model between full-time and
part-time restaurant employees.

64
Chapter 3: Research Method
The purpose of this pretest-posttest quasi-experimental quantitative study was to
examine if the implementation of a competency model affected turnover intent and
employee engagement for restaurant employees. Employee engagement was measured
using three subscales: physical, emotional, and cognitive engagement. Four grouping
variables were included in this study to determine if there was a difference in employee
engagement or turnover intent for employee type (full- or part-time) or the type of
restaurant the employee works for (full-service or fast-casual). Data were collected from
employees who work for a restaurant group with six restaurants, two full-service and four
fast-casual, located in the Northern Virginia region.
The restaurant group’s ownership team informed their employees of the study and
asked them to voluntarily participate by completing the JES, TIS-6, and a brief
demographics survey. The survey used for this study measured turnover intent and
employee engagement data before and after a competency model derived from the U.S.
Department of Labor’s (2017) Food and Beverage Service Competency Model was
implemented. The survey data were collected and analyzed to examine the effects of the
implementation. Details about the research design and rationale, methodology,
population, sampling, recruitment, data collection, instrumentation, and ethical
procedures will be detailed throughout this chapter.
Research Design and Rationale
A pretest-posttest quasi-experimental quantitative design was used to answer the
research questions included in this study. This research design was the most appropriate
65
format to use for this study because the participants were not randomly assigned to each
group as is required for a true experimental design (Gribbons & Herman, 1997). The
participants for this study were instead assigned to each of the four sample groups based
on their work status and the type of restaurant they work in.
The survey method was used to measure turnover intention and employee
engagement both before and after a competency model was implemented. The pre- and
posttest survey scores were paired, and paired samples t tests were conducted to
determine if the implementation of the competency model resulted in a difference in
turnover intention or employee engagement and if so if the difference was statistically
significant. The limitation of this design was that some participants were lost due to
turnover or withdrawal from the study between the time the pretest and posttest surveys
were administered.
The independent variable that was included in this study was the competency
model. The dependent variables that were included in this study were turnover intent and
employee engagement.
Methodology
To define the competency model that was used for this study, the ownership team
of the restaurant organization that provided data for this study determined which
competencies are critical for the employees in their organization. This was done using
guidelines provided by the U.S. Department of Labor (2017) surrounding the use of the
Food and Beverage Service competency model. Once the competency model was
defined, the organization’s ownership team outlined a plan for implementing the critical

66
competencies into their performance management, compensation, training, development,
and succession planning processes. Next, the pretest survey was administered to the
organization’s full- and part-time employees (excluding seasonal and temporary
employees), and employee engagement and turnover intent were measured.
After collecting the pretest data, the organization’s management team
implemented the competency model into its talent management processes (performance
management, compensation, training, development, and succession planning). The
organization’s ownership team trained its managerial staff on the competency model and
the resulting changes to the organization’s talent management processes. To avoid a
conflict of interest involving my role in this study, the organization’s managerial staff
trained employees on the new competency model and talent management processes. It
was estimated that this training process would take no more than 2 months to complete
(Fowler, 2018). The posttest was conducted approximately 4 months after the
competency model had been implemented to determine if the competency model affected
employee engagement and/or turnover intent. Additional details about the methodology
that was used to conduct the current study are provided below.
Population
The target population for this study was employees of a restaurant group located
in the Mid-Atlantic region of the United States. The restaurant group that provided data
for this study is comprised of two full-service and four fast-casual restaurants and
employs an average of 160 full- and part-time employees. Seasonal and temporary

67
employees were excluded from this study because they were not employed long enough
to complete the pre- and posttest surveys.
Sampling and Sampling Procedures
The participants included in this study were divided into four samples: Sample 1
was full-time, full-service, Sample 2 was full-time, fast-casual, Sample 3 was part-time,
full-service, and Sample 4 was part-time, fast-casual employees. All the permanent
(excluding seasonal and temporary) full- and part-time employees at each of the six
restaurants were invited to participate in this study voluntarily. The restaurant group’s
ownership team informed their employees of the study being conducted and provided
employees with the Invitation Letter in Appendix D. The participants of this study did not
receive compensation or a reward if they chose to participate in this study.
To have statistical power, 100 participants needed to be surveyed in this pretest
posttest study (Faul et al., 2007). An effect size of 0.5 was used, which is considered to
be a medium effect size (Faul et al., 2007). An alpha of .05 was used, as well as a power
parameter of .8. An equal number of participants were needed for each group (25
participants in each group; Faul et al., 2007). Participants were asked to complete this
study until at least 100 pretest and posttest surveys were collected. The restaurant group’s
ownership team attempted to recruit more than 25 participants in each group to allow the
study to have statistical power if participants dropped out of the study between the pre-
and posttest.

68
Procedures for Recruitment, Participation, and Data Collection
The restaurant group’s ownership team forwarded the Invitation Letter in
Appendix D to their employees via email. Anyone who chose to participate in this study
did so by using a link to the online survey which was included in the Invitation Letter.
The participants were informed that they were being asked to complete the same survey 4
months after they completed the survey the first time. Participants in this study provided
informed consent by acknowledging that they read the Informed Consent statement
included in the Invitation Letter provided to them. Participants were also informed in the
Invitation Letter that they could withdraw from the study at any time. The letter
participants received when asked to complete the survey the second time is provided in
Appendix E.
Participants completed the survey required for this study using the online survey
platform SurveyMonkey. The survey responses were collected by me, and no one in the
restaurant group’s ownership team had access to the survey data. The survey used in this
study asked employees to enter their Employee Identification Numbers so the
participant’s responses on the pretest and posttest surveys could be identified. I did not
have access to the names that accompany the Employee Identification Numbers, and I did
not share the numbers with the restaurant group’s ownership team to ensure
confidentiality.
Instruments
The JES, TIS-6, and a demographic survey were used for this study. The JES
instrument was used to measure the dependent variable of employee engagement. The
69
TIS-6 was used to measure the dependent variable of turnover intent. Last, the
demographic questionnaire was used to collect the information needed for the
independent variables of employee type (part-time or full-time), restaurant type (full-
service or fast-casual), and basic demographic information of the sample.
Job Engagement Scale (JES)
One of the most widely used measures of employee engagement is the JES (Rich
et al., 2010). The JES was developed in 2010 by Rich et al. (2010). Permission to use the
JES for this study was provided by the authors, as shown in Appendix C. The JES is an
18-item scale requiring respondents to use the following five-point response scale to
indicate their level of agreement or disagreement with each item: 1 = strongly disagree, 2
= disagree, 3 = neither agree nor disagree, 4 = agree, 5 = strongly agree (Rich et al.,
2010). The score for employee engagement is obtained by summing the scores of the 18
items.
The JES was appropriate to use in the current study because it has been used on
many different employee populations both internationally and within the United States
(Basit & Chauhan, 2017; Jayanthi et al., 2020; Rich et al., 2010). Additionally, the JES
has high internal consistency. A Cronbach’s alpha equal to .8 indicates the JES is an
acceptable survey measure (Jayanthi et al., 2020). An exploratory factor analysis showed
that the JES has good construct validity if it is used as a three-factor instrument, although
the scale can also be used as a single-factor instrument (Jayanthi et al., 2020). The three
factors included in the JES are physical engagement, emotional engagement, and
cognitive engagement (Rich et al., 2010).

70
Turnover Intention Scale (TIS-6)
The abbreviated version of Roodt’s (2004) TIS-6 has been effectively used to
measure turnover intent among many different types of employees (Bothma & Roodt,
2013). The TIS-6 was originally an unpublished 15-item scale developed by Roodt
(2004). However, reliability studies showed that the six-item scale measured turnover
intention as well as the 15-item scale (Bothma & Roodt, 2013). The six-item scale was
selected instead of the 15-item scale because of its brevity and because it measures
turnover intent as well as the 15-item scale (Bothma & Roodt, 2013). Permission to use
the TIS-6 for this study was provided by the author, as shown in Appendix B. The TIS-6
requires respondents to read six items and indicate how well each item describes their
feelings using Osgood’s (1964) semantic differential technique of bipolar 5-step response
scales defined by two opposites (e.g., 1 = never to 5 = always). The score for turnover
intent is obtained by summing the scores of the six items.
The TIS-6 was appropriate to use for this study because it is a valid, reliable
measure of turnover intent among employees in many different industries (Botham &
Roodt, 2013). A validation study of the TIS-6 confirmed that the scale has high internal
consistency, with Cronbach’s alpha equal to 0.8 (Botham & Roodt, 2013). This is above
the recommended cutoff point to estimate internal consistency and reliability (Nunnally
& Bernstein, 1994). Additionally, an exploratory factor analysis showed that the TIS-6
has good construct validity if it is used to measure the single factor of turnover intention
(Botham & Roodt, 2013).
Demographic Questionnaire

71
A questionnaire was used to collect basic demographic information of the
participants. Participants in this study were asked to provide the following demographic
data: age, sex, employee type (part-time or full-time), restaurant type (fast-casual or full-
service), job type (front of house, back of house, shift lead, or general manager), and
tenure with the organization. The full Demographics Questionnaire is provided in
Appendix A. Employee type and restaurant type were necessary for this study because
that information was used to identify which grouping variable the participant is part of.
The responses to the other demographic data were not used to address the research
questions included in this study, but the data was used to identify the demographics of the
participants in this study. The demographic items were used as descriptive statistics to
detail the participant population. The demographic items are important to include in this
study because they provided information about whether there were differences in the
employee populations at each type of restaurant, which could affect the study results.
Data Analysis Plan
The independent variable included in this study was the competency model. The
dependent variables included in this study were employee engagement and turnover
intent. Paired samples t tests were conducted using SPSS software to determine if there
was an existing relationship between employee engagement and turnover intent before
the competency model implementation took place.
RQ1: Is there a statistically significant difference in employee engagement for
full-time employees at a full-service restaurant, as measured by the Job Engagement
Scale (JES), after the implementation of a competency model?

72
H01: There is no statistically significant difference in employee engagement
for full-time employees at a full-service restaurant, as measured by the JES,
after the implementation of a competency model.
Ha1: There is a statistically significant difference in employee
engagement for full-time employees at a full-service restaurant, as
measured by the JES, after the implementation of a competency model.
RQ2: Is there a statistically significant difference in turnover intent for full-time
employees at a full-service restaurant, as measured by the Turnover Intention Scale (TIS-
6), after the implementation of a competency model?
H02: There is no statistically significant difference in turnover intent for full-
time employees at a full-service restaurant, as measured by the TIS-6, after
the implementation of a competency model.
Ha2: There is a statistically significant difference in turnover intent for
full-time employees at a full-service restaurant, as measured by the TIS-
6, after the implementation of a competency model.
RQ3: Is there a statistically significant difference in employee engagement for
full-time employees at a fast-casual restaurant, as measured by the JES, after the
implementation of a competency model?
H03: There is no statistically significant difference in employee engagement
for full-time employees at a fast-casual restaurant, as measured by the JES,
after the implementation of a competency model.

73
Ha3: There is a statistically significant difference in employee
engagement for full-time employees at a fast-casual restaurant, as
measured by the JES, after the implementation of a competency model.
RQ4: Is there a statistically significant difference in turnover intent for full-time
employees at a fast-casual restaurant, as measured by the TIS-6, after the implementation
of a competency model?
H04: There is no statistically significant difference in turnover intent for full-
time employees at a fast-casual restaurant, as measured by the TIS-6, after
the implementation of a competency model.
Ha4: There is a statistically significant difference in turnover intent for
full-time employees at a fast-casual restaurant, as measured by the TIS-
6, after the implementation of a competency model.
RQ5: Is there a statistically significant difference in employee engagement for
part-time employees at a full-service restaurant, as measured by the JES, after the
implementation of a competency model?
H05: There is no statistically significant difference in employee engagement
for part-time employees at a full-service restaurant, as measured by the JES,
after the implementation of a competency model.
Ha5: There is a statistically significant difference in employee
engagement for part-time employees at a full-service restaurant, as
measured by the JES, after the implementation of a competency model.

74
RQ6: Is there a statistically significant difference in turnover intent for part-time
employees at a full-service restaurant, as measured by the TIS-6, after the implementation
of a competency model?
H06: There is no statistically significant difference in turnover intent for part-
time employees at a full-service restaurant, as measured by the TIS-6, after
the implementation of a competency model.
Ha6: There is a statistically significant difference in turnover intent for
part-time employees at a full-service restaurant, as measured by the TIS-
6, after the implementation of a competency model.
RQ7: Is there a statistically significant difference in employee engagement
for part-time employees at a fast-casual restaurant, as measured by the JES, after
the implementation of a competency model?
H07: There is no statistically significant difference in employee engagement
for part-time employees at a fast-casual restaurant, as measured by the JES,
after the implementation of a competency model.
Ha7: There is a statistically significant difference in employee
engagement for part-time employees at a fast-casual restaurant, as
measured by the JES, after the implementation of a competency model.
RQ8: Is there a statistically significant difference in turnover intent for part-time
employees at a fast-casual restaurant, as measured by the TIS-6, after the implementation
of a competency model?

75
H08: There is no statistically significant difference in turnover intent for part-
time employees at a fast-casual restaurant, as measured by the TIS-6, after
the implementation of a competency model.
Ha8: There is a statistically significant difference in turnover intent for
part-time employees at a fast-casual restaurant, as measured by the TIS-
6, after the implementation of a competency model.
RQ9: Is there a statistically significant correlation between turnover intent and
employee engagement for part-time employees before the implementation of a
competency model?
H09: There is no statistically significant correlation between turnover intent and
employee engagement for part-time employees at a fast-casual or full-service
restaurant before the implementation of a competency model.
Ha9: There is a statistically significant correlation between turnover intent and
employee engagement for part-time employees at a fast-casual or full-service
restaurant before the implementation of a competency model.
RQ10: Is there a statistically significant correlation between turnover intent and
employee engagement for full-time employees before the implementation of a
competency model?
H010: There is no statistically significant correlation between turnover intent and
employee engagement for full-time employees at a fast-casual or full-service
restaurant before the implementation of a competency model.

76
Ha10: There is a statistically significant correlation between turnover intent and
employee engagement for full-time employees at a fast-casual or full-service
restaurant before the implementation of a competency model.
Ethical Procedures
Details about the measures that were taken to protect the participants of this study
were reviewed and approved by the Institutional Review Board before participants were
recruited. An Informed Consent statement was provided to all prospective participants of
this study as part of the Invitation Letter (Appendix D and E). The Invitation Letter
outlined how the information they provided is being kept confidential.
One potential ethical concern was that those invited to participate in this study
may have felt forced to participate because their employer was requesting participation.
This risk was being mitigated by the Informed Consent Form, which clarified the
voluntary nature of this study. Additionally, the restaurant group’s ownership team was
instructed to inform employees that their participation in this study was voluntary.
Anyone who participated in this study was not rewarded or reprimanded.
Summary
One purpose of this proposed study was to add information to the literature
related to the effectiveness of competency models for organizations in the restaurant
industry. This gap was addressed by examining turnover intention and employee
engagement among employees at a restaurant group before and after a competency model
was implemented. This study used a pretest-posttest quasi-experimental quantitative
research design.

77
Data were collected from employees who work for a restaurant group with six
restaurants located in the Northern Virginia region. The restaurant group’s ownership
team informed their employees of the study and asked them to voluntarily participate by
completing a survey. The surveys used for this study measured turnover intent and
employee engagement data before and after a competency model that includes leadership
and technical competencies was implemented. The survey data were collected and
analyzed to examine the effects of the implementation. The results of this study are
presented in Chapter 4.

78
Chapter 4: Results
The purpose of this pretest-posttest quasi-experimental quantitative study was to
examine if the implementation of a competency model affected turnover intent and
employee engagement for restaurant employees. Paired samples t tests were conducted to
determine if there was a statistically significant difference between employee engagement
and turnover intent scores after the competency model was implemented.
This study included the following research questions: RQ1: Is there a statistically
significant difference in employee engagement for full-time employees at a full-service
restaurant, as measured by the JES, after the implementation of a competency model?
RQ2: Is there a statistically significant difference in turnover intent for full-time
employees at a full-service restaurant, as measured by the TIS-6, after the implementation
of a competency model? RQ3: Is there a statistically significant difference in employee
engagement for full-time employees at a fast-casual restaurant, as measured by the JES,
after the implementation of a competency model? RQ4: Is there a statistically significant
difference in turnover intent for full-time employees at a fast-casual restaurant, as
measured by the TIS-6, after the implementation of a competency model? RQ5: Is there a
statistically significant difference in employee engagement for part-time employees at a
full-service restaurant, as measured by the JES, after the implementation of a competency
model? RQ6: Is there a statistically significant difference in turnover intent for part-time
employees at a full-service restaurant, as measured by the TIS-6, after the implementation
of a competency model? RQ7: Is there a statistically significant difference in employee
engagement for part-time employees at a fast-casual restaurant, as measured by the JES,

79
after the implementation of a competency model? RQ8: Is there a statistically significant
difference in turnover intent for part-time employees at a fast-casual restaurant, as
measured by the TIS-6, after the implementation of a competency model?
This study also included research questions regarding the relationship between
turnover intent and employee engagement: RQ9: Is there a statistically significant
correlation between turnover intent and employee engagement for part-time employees
before the implementation of a competency model? RQ10: Is there a statistically
significant correlation between turnover intent and employee engagement for full-time
employees before the implementation of a competency model?
The hypotheses for this study included the null hypotheses that there was not a
statistically significant difference between the variables included in the research
questions before the implementation of a competency model. The alternative hypothesis
was that there is a statistically significant difference between the variables included in
each research question after the implementation of a competency model. The research
questions included in this study were answered below through an explanation of data
collection procedures and methodology, data analysis and results, and a summary of the
findings.
Data Collection
Data collection for the Time 1 (pretest) survey began October 2, 2020 and
concluded October 25, 2020. The owners of the restaurant group distributed the Time 1
survey link using the email provided in Appendix D. Data collections for the Time 2
(posttest) survey began February 15, 2021 and concluded March 10, 2021. The owners of

80
the restaurant group distributed the Time 2 survey link using the email provided in
Appendix E. The survey responses were collected using the SurveyMonkey platform.
After the Time 1 survey opened on October 2, 2020, the ownership team of the
restaurant organization that provided data for this study determined which competencies
are critical for each role group in their organization (Back of House, Front of House,
Shift Lead, and General Manager). The competencies were identified using guidelines
provided by the U.S. Department of Labor (2017) detailing how to use the Food and
Beverage Service competency model.
After defining the competency model, the organization’s ownership team created
a plan to implement the critical competencies into their talent management processes
(performance management, compensation, training, development, and succession
planning). The plan was implemented on October 26, 2020, after the pretest data were
collected. The organization’s ownership team started the implementation process by
training its managerial staff on the competency model and the resulting changes to the
organization’s talent management processes. Data collection for the posttest survey began
February 15, 2021, which allowed enough time to pass for all employees in the
organization to experience the changes associated with the competency model.
Description of the Sample
At the conclusion of the Time 1 collection period, 134 participants started the
survey and indicated they had read the informed consent and parameters of the study.
Fifteen participants had missing data that prevented employee engagement and turnover
intent scores from being calculated and sample groups from being assigned, which

81
changed the final N to 119 valid responses from the Time 1 survey. At the conclusion of
the Time 2 collection period, 110 participants started the survey and indicated they had
read the informed consent and parameters of the study. Five participants had missing data
that prevented employee engagement and turnover intent scores from being calculated or
sample groups from being assigned. Two participants had to be removed from the study
because they did not complete both the Time 1 and Time 2 surveys, which changed the
final N to 103 valid responses. After eliminating responses with missing data and
incomplete Time 1 and Time 2 responses, 64.4% of the organization’s 160 nonseasonal
employees were available for analysis. As detailed in Chapter 3, the target sample size
was at least 100 participants.
Demographic characteristics of the 103 participants are detailed in Table 1. More
women (55, 53.4%) than men (48, 46.6%) participated in this study. This is consistent
with the demographics of the restaurant industry in the United States which is 51%
female (BLS, 2021). The majority of participants were ages 18 to 29 (87, 84.5%). The
median age of restaurant employees in the United States is 29.6 years (BLS, 2021), so the
participants in this study were younger on average than the restaurant employees in the
United States. A higher number of participants were part-time employees (58, 56.3%)
than full-time (45, 43.7%). Participants in each of the four job types (Front of House,
Back of House, Shift Lead, and General Manager) were all represented in this sample,
with the most in the Front of House (43, 41.7%) job group. The majority of participants
in this study (54, 52.4%) had worked for the restaurant group longer than 2 years. The
average tenure of restaurant employees in the United States is 2 years (BLS, 2020).

82
Table 1 Demographic Characteristics of Participants (N = 103)
Characteristic n % Sex Male Female Other Age range 18-23 24-29 30-35 36-41 42-47 48-53 54+ Employee type Part-time (1-30 hours worked/week) Full-time (30.1 hours or more worked/week) Restaurant type Fast-casual Full-service Job type Front of house (Host, Server, Cashier, or Bartender) Back of house (Cook or Chef) Shift lead General manager Tenure with the organization Less than 6 months 6 months to 1 year 1-2 years More than 2 years
48 46.6 55 53.4 0 0.0
44 42.7 43 41.8 11 10.7 3 2.9 2 1.9 0 0.0 0 0.0
58 56.3 45 43.7
54 52.4 49 47.6
43 41.7 29 28.2 25 24.3 6 5.8 5 4.9 18 17.5 26 25.2 54 52.4
The participants in this study were divided into four samples: Sample 1 was full-time
employees at a full-service restaurant, Sample 2 was full-time employees at a fast-casual
restaurant, Sample 3 was part-time employees at a full-service restaurant, and Sample 4
was part-time employees at a fast-casual restaurant. The number of participants in each
sample group is provided in Table 2.

83
Table 2 Participants in Sample Groups (N = 103)
Sample group n % 1: Full-time, full-service 2: Full-time, fast-casual 3: Part-time, full-service
15 14.6 30 29.1 34 33.0
4: Part-time, fast-casual 24 23.3
Results
The research questions included in this study asked if there is a statistically
significant difference in the pre- and posttest turnover intent or employee engagement
scores for each sample group. The TIS-6 was used to measure turnover intent. The TIS-6
uses six survey items measured with a 5-point scale where 1 equals “never” and 5 equals
“always” (Roodt, 2004). Responses to each item are added to get a total score on the TIS-
6. The minimum possible score on the TIS-6 is 6, the midpoint is 18, and the maximum
score is 30. A total score below 18 indicates the participant desires to stay in their current
position in an organization, and a total score above 18 indicates a participant desires to
leave their current position in an organization.
The JES was used to measure employee engagement. The JES uses 18 survey
items measured with a 5-point Likert scale where 1 equals “strongly disagree”, 2 equals
“disagree”, 3 equals “neither agree nor disagree”, 4 equals “agree”, and 5 equals
“strongly agree” (Rich et al., 2010). Responses to each item are added to get a total score
on the JES. The minimum score on the JES is 18, the midpoint is 54, and the maximum
score is 90.
84
Data from the TIS-6 and JES are ordinal but were treated as interval for this
study. Although the difference between Likert scale levels does not meet the requirement
for equal intervals between choices, the instruments used in this study had scores
assigned to each level, making the data in this study interval for testing purposes (Faul et
al., 2007). The findings by hypothesis are reported below.
Research Hypothesis Set 1 and 2
H01: There is no statistically significant difference in employee engagement for
full-time employees at a full-service restaurant, as measured by the JES, after the
implementation of a competency model.
Ha1: There is a statistically significant difference in employee engagement for
full-time employees at a full-service restaurant, as measured by the JES, after the
implementation of a competency model.
H02: There is no statistically significant difference in turnover intent for full-
time employees at a full-service restaurant, as measured by the TIS-6, after the
implementation of a competency model.
Ha2: There is a statistically significant difference in turnover intent for
full-time employees at a full-service restaurant, as measured by the TIS-6, after
the implementation of a competency model.
The data set was analyzed through SPSS using a paired samples t test. The sample
was full-time employees at a full-service restaurant. The variable for hypothesis set 1 was
employee engagement. Employee engagement was measured at two separate times:
before the competency model was implemented and after the competency model was

85
implemented. The mean prior to implementing the competency model, as shown in Table
3, was 44.4. The mean after the competency model implementation was 64.13, indicating
a mean difference of 19.733. The standard deviation, calculated by SPSS to indicate
individual differences in employee engagement scores before and after the competency
model implementation, is shown in Table 5 as 14.124. The t score was 5.411 with a p
value < .001. There was a significant difference in the score before the implementation
(M = 44.4, SD = 11.205) and the scores after the implementation (M = 64.13, SD =
14.352); t(14) = 5.411, p = .000. The competency model implementation had a large
effect on employee engagement, Cohen’s d = 1.397, 95% CI [2.105, 0.665]. Upon
evaluation of the employee engagement score t test, the null hypothesis was rejected, and
the alternative hypothesis was supported.
The variable for hypothesis set 2 was turnover intent. Turnover intent was
measured at two separate times: before the competency model was implemented and after
the competency model was implemented. The mean prior to implementing the
competency model, as shown in Table 3, was 15.80. The mean after the competency
model implementation was 13.40, indicating a mean difference of 2.400. The standard
deviation, calculated by SPSS to indicate individual differences in turnover intent scores
before and after the competency model implementation, is shown in Table 5 as 4.867.
The t score was 1.910 with a p value .077. There was not a significant difference in the
score before the implementation (M = 15.80, SD = 6.073) and the scores after the
implementation (M = 13.40, SD = 4.256); t(14) = 1.910, p = .077. The competency model
implementation had a small effect on turnover intent, Cohen’s d = 0.493, 95% CI [0.052,

86
1.023]. Upon evaluation of the turnover intent score t test, the null hypothesis was not
rejected, and the alternative hypothesis was not supported.
Table 3
Results for Employee Engagement and Turnover Intent Scores Before and After Competency Model Implementation – Full-Time Employees, Full-Service Restaurant
Mean N SD Standard Error Mean
T1 Employee engagement
44.40 15 11.205 2.893
T2 Employee engagement
64.13 15 14.352 3.706
T1 Turnover intent 15.80 15 6.073 1.568 T2 Turnover intent 13.40 15 4.256 1.099
Table 4 Paired Samples Correlations of Employee Engagement and Turnover Intent Scores Before and After Competency Model Implementation – Full-Time Employees, Full-Service Restaurant
N Correlation Significance T1 & T2 Employee engagement scores
15 .411 .129
T1 & T2 Turnover intent scores
15 .606 .017

87
Table 5 Paired Samples Test Results for Employee Engagement and Turnover Intent – Full-Time Employees, Full-Service Restaurant
Mean SD Std. Error Mean
95% CI of the
Difference Lower
95% CI of the
Difference Upper
T Significance (2-tailed)
T1 - T2 Employee engagement scores
19.733 14.124 3.647 27.555 11.912 5.411 .000
T1 – T2 Turnover intent scores
2.400 4.867 1.257 -.295 5.095 1.910 .077
Note. SD = Standard Deviation, CI = Confidence Interval. Research Hypothesis Set 3 and 4
H03: There is no statistically significant difference in employee engagement
for full-time employees at a fast-casual restaurant, as measured by the JES, after the
implementation of a competency model.
Ha3: There is a statistically significant difference in employee
engagement for full-time employees at a fast-casual restaurant, as measured by
the JES, after the implementation of a competency model.
H04: There is no statistically significant difference in turnover intent for full-
time employees at a fast-casual restaurant, as measured by the TIS-6, after the
implementation of a competency model.
Ha4: There is a statistically significant difference in turnover intent for
full-time employees at a fast-casual restaurant, as measured by the TIS-6, after
the implementation of a competency model.

88
The data set was analyzed through SPSS using a paired samples t test. The sample
was full-time employees at a fast-casual restaurant. The variable for hypothesis set 3 was
employee engagement. Employee engagement was measured at two separate times:
before the competency model was implemented and after the competency model was
implemented. The mean prior to implementing the competency model, as shown in Table
6 below, was 45.83. The mean after the competency model implementation was 61.17,
indicating a mean difference of 15.333. The standard deviation, calculated by SPSS to
indicate individual differences in employee engagement scores before and after the
competency model implementation, is shown in Table 8 as 14.155. The t score was 5.933
with a p value < .001. There was a significant difference in the score before the
implementation (M = 45.83, SD = 15.785) and the scores after the implementation (M =
61.17, SD = 17.213); t(29) = 5.933, p = .000. The competency model implementation had
a large effect on employee engagement, Cohen’s d = 1.083, 95% CI [1.530, 0.624]. Upon
evaluation of the employee engagement score t test, the null hypothesis was rejected, and
the alternative hypothesis was supported.
The variable for hypothesis set 4 was turnover intent. Turnover intent was
measured at two separate times: before the competency model was implemented and after
the competency model was implemented. The mean prior to implementing the
competency model, as shown in Table 6 below, was 17.43. The mean after the
competency model implementation was 14.77, indicating a mean difference of 2.667. The
standard deviation, calculated by SPSS to indicate individual differences in turnover
intent scores before and after the competency model implementation, is shown in Table 8

89
as 3.346. The t score was 4.365 with a p value .000. There was a significant difference in
the score before the implementation (M = 17.43, SD = 5.211) and the scores after the
implementation (M = 14.77, SD = 4.500); t(29) = 4.365, p = .000. The competency model
implementation had a medium effect on turnover intent, Cohen’s d = 0.797, 95% CI
[0.380, 1.204]. Upon evaluation of the turnover intent score t test, the null hypothesis was
rejected, and the alternative hypothesis was supported.
Table 6 Results for Employee Engagement and Turnover Intent Scores Before and After Competency Model Implementation – Full-Time Employees, Fast-Casual Restaurant
Mean N SD Standard Error Mean T1 Employee engagement 45.83 30 15.785 2.882 T2 Employee engagement 61.17 30 17.213 3.143 T1 Turnover intent 17.43 30 5.211 .951 T2 Turnover intent 14.77 30 4.500 .822
Table 7 Paired Samples Correlations of Employee Engagement and Turnover Intent Scores Before and After Competency Model Implementation – Full-Time Employees, Fast-Casual Restaurant
N Correlation Significance T1 & T2 Employee engagement scores 30 .635 .000 T1 & T2 Turnover intent scores 30 .772 .000

90
Table 8 Paired Samples Test Results for Employee Engagement and Turnover Intent – Full-Time Employees, Fast-Casual Restaurant
Mean SD Std. Error Mean
95% CI of the
Difference Lower
95% CI of the
Difference Upper
T Significance (2-tailed)
T1 - T2 Employee engagement scores
15.333 14.155 2.584 20.619 10.048 5.933 .000
T1 – T2 Turnover intent scores
2.667 3.346 .611 1.417 3.916 4.365 .000
Note. SD = Standard Deviation, CI = Confidence Interval.
Research Hypothesis Set 5 and 6
H05: There is no statistically significant difference in employee engagement
for part-time employees at a full-service restaurant, as measured by the JES, after
the implementation of a competency model.
Ha5: There is a statistically significant difference in employee
engagement for part-time employees at a full-service restaurant, as measured by
the JES, after the implementation of a competency model.
H06: There is no statistically significant difference in turnover intent for part-
time employees at a full-service restaurant, as measured by the TIS-6, after the
implementation of a competency model.
Ha6: There is a statistically significant difference in turnover intent for
part-time employees at a full-service restaurant, as measured by the TIS-6, after
the implementation of a competency model.

91
The data set was analyzed through SPSS using a paired samples t test. The sample
was part-time employees at a full-service restaurant. The variable for hypothesis set 5
was employee engagement. Employee engagement was measured at two separate times:
before the competency model was implemented and after the competency model was
implemented. The mean prior to implementing the competency model, as shown in Table
9 below, was 46.62. The mean after the competency model implementation was 62.41,
indicating a mean difference of 15.794. The standard deviation, calculated by SPSS to
indicate individual differences in employee engagement scores before and after the
competency model implementation, is shown in Table 11 as 11.625. The t score was
7.922 with a p value < .001. There was a significant difference in the score before the
implementation (M = 46.62, SD = 16.386) and the scores after the implementation (M =
62.41, SD = 13.765); t(33) = 7.922, p = .000. The competency model implementation had
a large effect on employee engagement, Cohen’s d = 1.359, 95% CI [1.822, 0.885]. Upon
evaluation of the employee engagement score t test, the null hypothesis was rejected, and
the alternative hypothesis was supported.
The variable for hypothesis set 6 was turnover intent. Turnover intent was
measured at two separate times: before the competency model was implemented and after
the competency model was implemented. The mean prior to implementing the
competency model, as shown in Table 9 below, was 17.00. The mean after the
competency model implementation was 13.12, indicating a mean difference of 3.882. The
standard deviation, calculated by SPSS to indicate individual differences in turnover
intent scores before and after the competency model implementation, is shown in Table
92
11 as 4.277. The t score was 5.293 with a p value .000. There was a significant difference
in the score before the implementation (M = 17.00, SD = 4.887) and the scores after the
implementation (M = 13.12, SD = 4.212); t(33) = 5.293, p = .000. The competency model
implementation had a large effect on turnover intent, Cohen’s d = 0.908, 95% CI [0.502,
1.304]. Upon evaluation of the turnover intent score t test, the null hypothesis was
rejected, and the alternative hypothesis was supported.
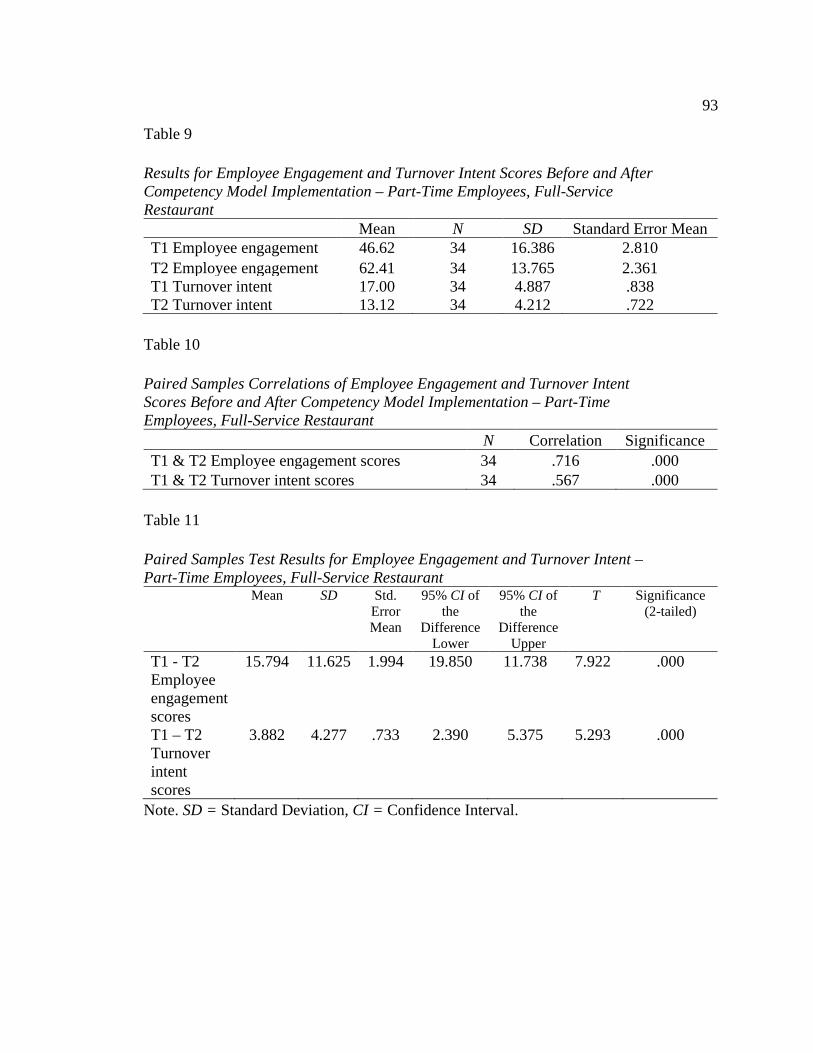
93
Table 9 Results for Employee Engagement and Turnover Intent Scores Before and After Competency Model Implementation – Part-Time Employees, Full-Service Restaurant
Mean N SD Standard Error Mean T1 Employee engagement 46.62 34 16.386 2.810 T2 Employee engagement 62.41 34 13.765 2.361 T1 Turnover intent 17.00 34 4.887 .838 T2 Turnover intent 13.12 34 4.212 .722
Table 10 Paired Samples Correlations of Employee Engagement and Turnover Intent Scores Before and After Competency Model Implementation – Part-Time Employees, Full-Service Restaurant
N Correlation Significance T1 & T2 Employee engagement scores 34 .716 .000 T1 & T2 Turnover intent scores 34 .567 .000
Table 11 Paired Samples Test Results for Employee Engagement and Turnover Intent – Part-Time Employees, Full-Service Restaurant
Mean SD Std. Error Mean
95% CI of the
Difference Lower
95% CI of the
Difference Upper
T Significance (2-tailed)
T1 - T2 Employee engagement scores
15.794 11.625 1.994 19.850 11.738 7.922 .000
T1 – T2 Turnover intent scores
3.882 4.277 .733 2.390 5.375 5.293 .000
Note. SD = Standard Deviation, CI = Confidence Interval.

94
Research Hypothesis Set 7 and 8
H07: There is no statistically significant difference in employee engagement
for part-time employees at a fast-casual restaurant, as measured by the JES, after the
implementation of a competency model.
Ha7: There is a statistically significant difference in employee
engagement for part-time employees at a fast-casual restaurant, as measured by
the JES, after the implementation of a competency model.
H08: There is no statistically significant difference in turnover intent for part-
time employees at a fast-casual restaurant, as measured by the TIS-6, after the
implementation of a competency model.
Ha8: There is a statistically significant difference in turnover intent for
part-time employees at a fast-casual restaurant, as measured by the TIS-6, after
the implementation of a competency model.
The data set was analyzed through SPSS using a paired samples t test. The sample
was part-time employees at a fast-casual restaurant. The variable for hypothesis set 7 was
employee engagement. Employee engagement was measured at two separate times:
before the competency model was implemented and after the competency model was
implemented. The mean prior to implementing the competency model, as shown in Table
12 below, was 45.71. The mean after the competency model implementation was 66.46,
indicating a mean difference of 20.750. The standard deviation, calculated by SPSS to
indicate individual differences in employee engagement scores before and after the
competency model implementation, is shown in Table 14 as 15.002. The t score was

95
6.776 with a p value < .001. There was a significant difference in the score before the
implementation (M = 45.71, SD = 17.005) and the scores after the implementation (M =
66.46, SD = 16.519); t(23) = 6.776, p = .000. The competency model implementation had
a large effect on employee engagement, Cohen’s d = 1.383, 95% CI [1.939, 0.812]. Upon
evaluation of the employee engagement score t test, the null hypothesis was rejected, and
the alternative hypothesis was supported.
The variable for hypothesis set 8 was turnover intent. Turnover intent was
measured at two separate times: before the competency model was implemented and after
the competency model was implemented. The mean prior to implementing the
competency model, as shown in Table 12 below, was 17.21. The mean after the
competency model implementation was 13.67, indicating a mean difference of 3.542. The
standard deviation, calculated by SPSS to indicate individual differences in turnover
intent scores before and after the competency model implementation, is shown in Table
14 as 6.100. The t score was 2.844 with a p value .009. There was a significant difference
in the score before the implementation (M = 17.21, SD = 4.908) and the scores after the
implementation (M = 13.67, SD = 5.164); t(23) = 2.844, p = .009. The competency model
implementation had a medium effect on turnover intent, Cohen’s d = 0.581, 95% CI
[0.142, 1.009]. Upon evaluation of the turnover intent score t test, the null hypothesis was
rejected, and the alternative hypothesis was supported.

96
Table 12 Results for Employee Engagement and Turnover Intent Scores Before and After Competency Model Implementation – Part-Time Employees, Fast-Casual Restaurant
Mean N SD Standard Error Mean
T1 Employee engagement
45.71 24 17.005 3.471
T2 Employee engagement
66.46 24 16.519 3.372
T1 Turnover intent 17.21 24 4.908 1.002 T2 Turnover intent 13.67 24 5.164 1.054
Table 13 Paired Samples Correlations of Employee Engagement and Turnover Intent Scores Before and After Competency Model Implementation – Part-Time Employees, Fast-Casual Restaurant
N Correlation Significance T1 & T2 Employee engagement scores
24 .600 .002
T1 & T2 Turnover intent scores
24 .267 .207

97
Table 14 Paired Samples Test Results for Employee Engagement and Turnover Intent – Part-Time Employees, Fast-Casual Restaurant
Mean SD Std. Error Mean
95% CI of the
Difference Lower
95% CI of the
Difference Upper
T Significance (2-tailed)
T1 - T2 Employee engagement scores
20.750 15.002 3.062 27.085 14.415 6.776 .000
T1 – T2 Turnover intent scores
3.542 6.100 1.245 .966 6.118 2.844 .009
Note. SD = Standard Deviation, CI = Confidence Interval.
Research Hypothesis Set 9 and 10
H09: There is no statistically significant correlation between turnover intent and
employee engagement for part-time employees at a fast-casual or full-service restaurant
before the implementation of a competency model.
Ha9: There is a statistically significant correlation between turnover intent and
employee engagement for part-time employees at a fast-casual or full-service restaurant
before the implementation of a competency model.
H010: There is no statistically significant correlation between turnover intent and
employee engagement for full-time employees at a fast-casual or full-service restaurant
before the implementation of a competency model.
Ha10: There is a statistically significant correlation between turnover intent and
employee engagement for full-time employees at a fast-casual or full-service restaurant
before the implementation of a competency model.

98
The data set was analyzed through SPSS using a correlation analysis. The sample
for hypothesis set 9 was part-time employees. The first variable for hypothesis set 9 was
turnover intent (measured before the competency model was implemented), and the
second variable was employee engagement (measured before the competency model was
implemented). As shown in Table 16, there was a weak positive correlation (.075) for
part-time employees between turnover intent and employee engagement before the
competency model was implemented. Upon evaluation of the part-time employee score
results, the null hypothesis was not rejected, and the alternative hypothesis was not
supported.
The data set was analyzed through SPSS using a correlation analysis. The sample
for hypothesis set 10 was full-time employees. The first variable for hypothesis set 10
was turnover intent (measured before the competency model was implemented), and the
second variable was employee engagement (measured before the competency model was
implemented). As shown in Table 16 below, there was a negative correlation (-.475) for
full-time employees between turnover intent and employee engagement before the
competency model was implemented. Upon evaluation of the full-time employee score
results, the null hypothesis was rejected, and the alternative hypothesis was supported.

99
Table 15 Results for Employee Engagement and Turnover Intent Scores Before Competency Model Implementation – Part-Time and Full-Time Employees
Mean N SD Standard Error Mean PT Turnover intent 17.09 58 4.853 .637 PT Employee engagement 46.24 58 16.502 2.167 FT Turnover intent 16.89 45 5.499 .820 FT Employee engagement 45.36 45 14.305 2.133
Table 16 Paired Samples Correlations of Employee Engagement and Turnover Intent Scores Before Competency Model Implementation – Part-Time and Full-Time Employees
N Correlation Significance PT Turnover intent & employee engagement scores
58 .075 .576
FT Turnover intent & employee engagement scores
45 -.475 .001
Table 17 Paired Samples Test Results for Employee Engagement and Turnover Intent Before Competency Model Implementation – Part-Time and Full-Time Employees
Mean SD Std. Error Mean
95% CI of the
Difference Lower
95% CI of the
Difference Upper
T Significance (2-tailed)
PT Turnover intent - employee engagement scores
29.155 16.849 2.212 33.585 24.725 13.178 .000
FT Turnover intent - employee engagement scores
28.467 17.597 2.623 33.753 23.180 10.852 .000
Note. SD = Standard Deviation, CI = Confidence Interval.

100
Summary
The competency model implementation had a statistically significant effect on
employee engagement and turnover intent scores for all sample groups, except for
turnover intent scores for full-time employees at a full-service restaurant. By
implementing the competency model, the restaurant group desired for mean employee
engagement scores to increase and mean turnover intent scores to decrease. These results
occurred for all four sample groups. The conclusions and recommendations of this study
are presented in Chapter 5.

101
Chapter 5: Conclusion
The purpose of this pretest-posttest quasi-experimental quantitative study was to
examine if the implementation of a competency model affected employee engagement or
turnover intent for restaurant employees. Data were collected from employees who work
for a restaurant group with six restaurants located in the Northern Virginia region. The
restaurant group’s ownership team informed their employees of the study and asked them
to voluntarily participate by completing a survey. The survey used for this study
measured turnover intent and employee engagement before and after a competency
model that included leadership and technical competencies was implemented.
This study was conducted to address a gap in the literature regarding the use of
competency models in the restaurant industry. The null hypotheses included in this study
were that there was not a statistically significant difference in employee engagement or
turnover intent scores before and after the implementation of a competency model. Paired
t-test analyses were used to reject or not reject the null hypotheses included in this study.
The competency model implementation had a statistically significant effect on employee
engagement and turnover intent scores for all sample groups, apart from turnover intent
scores for full-time employees at a full-service restaurant. By implementing the
competency model, the restaurant group desired for mean employee engagement scores
to increase and mean turnover intent scores to decrease. These results occurred for all
four sample groups.
The results of this study are consistent with other research related to IPT and
competency models. For example, Canning et al. (2019) and O’Reilly et al. (2014) used

102
IPT as a framework for developing implementations that improved employee engagement
and reduced turnover. The current study also used IPT as a framework for developing the
competency model that was implemented to improve employee engagement and decrease
turnover intent. Additionally, Fowler (2018) described competency models as an
effective way of improving employee engagement because they provide employees with
details about the organization’s objectives. Derro and Williams (2009) found that
competency models that include both leadership and technical competencies can be used
to reduce turnover intent. In the current study, employee engagement improved, and
turnover intent decreased after a competency model was implemented. The results of the
current study support the findings of Fowler (2018) and Derro and Williams (2009).
Interpretation of the Findings
The percentage of quits (voluntary separations initiated by an employee) are
higher in the accommodations industry than the average turnover rate in the United States
(BLS, 2019). Referencing the high cost of turnover, business owners have stated
employee retention is their biggest human resource apprehension (DiPietro & Bufquin,
2018). Restaurant owners lose thousands of dollars per employee each year due to the
costs associated with high turnover and low engagement among restaurant employees
(Brain, 2019; DiPietro & Bufquin, 2018; DiPietro & McLeod, 2011).
The theoretical framework used in this study was IPT. This theory was used to
develop methods for improving employee engagement and turnover intent scores. Dweck
et al. (1995) defined IPT as a theoretical framework that addresses beliefs about the
malleability of human characteristics (e.g., personality, ability, intelligence, and moral

103
character). This theory includes two different types of beliefs on whether human
characteristics can be changed: incremental theory and entity theory. Incremental theory
states that human traits such as attitudes and behaviors can be changed, while entity
theory states that these traits are fixed and cannot be changed (Dweck, 1986).
Other researchers have applied IPT to design interventions used to change
behaviors and performance (Heslin et al., 2005; Katz & O’Malley, 2016), which made it
an appropriate theoretical framework to inform the competency model that was used in
this study. The term “mindset” is often used to describe IPT in the workplace (Dweck,
2006). Specifically, entity theory is described as a fixed mindset, and incremental theory
is described as a growth mindset when applying IPT to employees and organizations
(Caniels et al., 2018). Organizational cultures that are perceived to have a growth mindset
are associated with higher employee engagement, lower turnover intent, and higher
profits than organizations with cultures perceived to have a fixed mindset (Canning et al.,
2019; Murphy & Dweck, 2010). Organizations perceived to have growth mindsets are
those that communicate the belief that employees can develop and improve their abilities
(Canning et al., 2019), and competency models provide employees with the tools they
need to develop and improve job-related abilities (Fowler, 2018; Hatala & Hisey, 2011).
Many professional industries have used integrated talent management processes
to reduce turnover intent, improve employee engagement, and thus improve
organizational performance (Omar et al., 2017). For example, competency models have
been used to effectively provide employees with leadership skills (Ravichandran &
Mishra, 2018). However, leading practices in talent management have not been

104
implemented in most organizations in the restaurant industry (Mjongwana & Kamala,
2018). Current research results indicate that restaurant employees are intrinsically
motivated, so programs focused on motivating employees in this industry should focus on
intrinsic characteristics (Harris et al., 2017; Watson et al., 2018). The literature examined
as part of this study indicated that competency models that are integrated into an
organization’s talent management processes can be used to improve employee
engagement and reduce turnover intent (Omar et al., 2017; Ravichandran & Mishra,
2018). The findings in this study are consistent with the existing literature. In this study, a
competency model was implemented to increase employee engagement scores and
decrease turnover intent scores for employees of an organization in the restaurant
industry. Those results were achieved, and this study extends the existing knowledge
surrounding the use of IPT and competency models concerning employee engagement
and turnover intent in organizations.
The research questions explored in this study were used to address whether
employees’ devotion to their work and desire to change jobs was different after changes
were made to an organization’s training and retention processes. More specifically, the
questions addressed whether scores for employee engagement and turnover intent
significantly change for four sample groups after aspects of the Food and Beverage
Service competency model (U.S. Department of Labor, 2017) were implemented.
Employee engagement scores significantly increased for all four sample groups, which
was the intended outcome. Turnover intent scores decreased for all four sample groups,
which was the intended outcome. For one group, full-time employees in a full-service
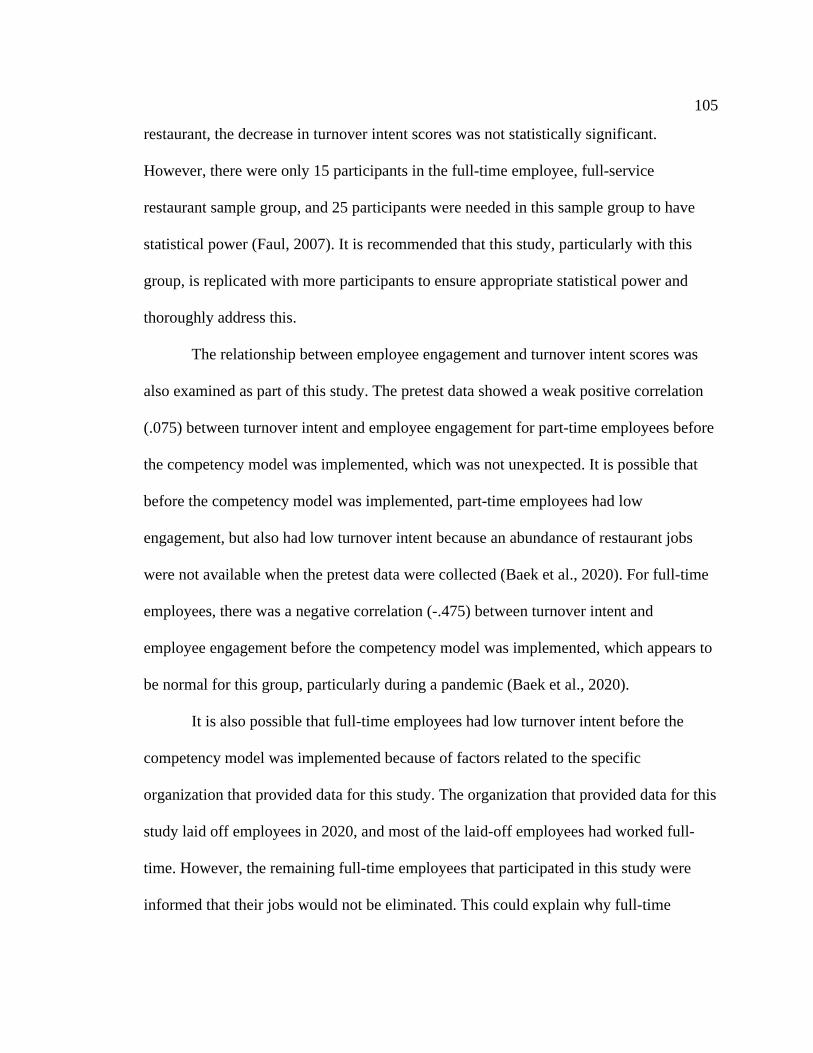
105
restaurant, the decrease in turnover intent scores was not statistically significant.
However, there were only 15 participants in the full-time employee, full-service
restaurant sample group, and 25 participants were needed in this sample group to have
statistical power (Faul, 2007). It is recommended that this study, particularly with this
group, is replicated with more participants to ensure appropriate statistical power and
thoroughly address this.
The relationship between employee engagement and turnover intent scores was
also examined as part of this study. The pretest data showed a weak positive correlation
(.075) between turnover intent and employee engagement for part-time employees before
the competency model was implemented, which was not unexpected. It is possible that
before the competency model was implemented, part-time employees had low
engagement, but also had low turnover intent because an abundance of restaurant jobs
were not available when the pretest data were collected (Baek et al., 2020). For full-time
employees, there was a negative correlation (-.475) between turnover intent and
employee engagement before the competency model was implemented, which appears to
be normal for this group, particularly during a pandemic (Baek et al., 2020).
It is also possible that full-time employees had low turnover intent before the
competency model was implemented because of factors related to the specific
organization that provided data for this study. The organization that provided data for this
study laid off employees in 2020, and most of the laid-off employees had worked full-
time. However, the remaining full-time employees that participated in this study were
informed that their jobs would not be eliminated. This could explain why full-time

106
employees had high employee engagement scores and low turnover intent scores when
they completed the pretest survey.
Limitations of the Study
A limitation of this study was that all the participants came from the same
organization and geographic location. However, two different types of restaurants (full-
service and fast-casual) were included in the study, as well as full- and part-time
employees. This variation helped to make the study more generalizable than if only one
restaurant and employee type had been examined.
Before this study was implemented, one anticipated barrier to the success of the
study was that the restaurant group’s ownership team may not take the steps needed to
successfully implement the competency model. Implementing a competency model that
was integrated into talent management processes required buy-in and commitment from
the restaurant group’s ownership team. The restaurant group’s ownership team was very
dedicated to this initiative, and they spent the time and effort needed to identify
competencies critical to each position, develop an implementation plan, and effectively
communicate the competency model to their employees.
This study was conducted during the COVID-19 pandemic, which forced many
restaurants to lay off employees. The restaurant group that participated in this study
closed its six restaurants from March 16, 2020 through May 3, 2020. During that time, all
the employees in the restaurant group were laid off. The restaurant group was able to
reopen all six restaurants on May 4, 2020, and they rehired 160 of their original 250
employees. After reopening, the restaurant group that provided data for this study

107
changed the way their employees interact with customers, the way their food is made, and
the operations of their restaurants after reopening. However, the data collection for this
study did not begin until October 2, 2020, so the changes made due to the COVID-19
pandemic should not have affected the results of this study. The pretest and posttest data
used in this study were both collected during the COVID-19 pandemic, which improves
the validity and generalizability of the results of this study.
Recommendations
One purpose of this study was to address the gap in the literature surrounding the
use of IPT and competency models for organizations in the restaurant industry. It is
recommended that this study is replicated with other restaurant organizations that have
different geographical locations. It is also recommended that this study is replicated on a
larger scale with more than one restaurant group and ownership team to identify whether
the results of this study are generalizable.
For a competency model to effect employee engagement and turnover intent, the
competency model must be integrated into an organization’s talent management
processes (Fowler, 2018; Ravichandran & Mishra, 2018). Therefore, the competency
model used in this study may have increased employee engagement scores and decreased
turnover intent scores because it was integrated into the talent management processes of
the organization that provided data for this study. Additionally, gaining buy-in and
involvement from the executive leaders, people managers, and employees within an
organization is critical to successfully designing and implementing a competency model
(Campion et al., 2011). Executive leaders need to be educated about the value of

108
competency models, as well as how they can be used to prevent turnover and improve
employee engagement (Campion et al., 2011; Moghaddam et al., 2019). The competency
model that was implemented in the current study may be correlated with a significant
increase in employee engagement, and decrease in turnover intent, because the ownership
team, people leaders, and employees that work for the organization that provided data for
this study fully supported the usefulness of the competency model and were involved in
its implementation. It is recommended that future studies involving competency models
focus on gaining buy-in and involvement from the organization’s leaders and employees
at all stages of the implementation process.
The original design of this study included implementing the competency model
into the restaurant group’s hiring processes. However, due to COVID-19, the
organization that provided data for this study was not hiring employees during the data
collection period, so this aspect of the study was not included. It is recommended that
future studies of this nature implement competency models into a restaurant
organization’s hiring processes because competency models have been used to improve
the quality of hires in other organizations (Campion et al., 2011; Morgeson et al., 2009;
Posthuma & Campion, 2008). Finally, it is recommended that this study is replicated after
the COVID-19 pandemic has ended to gain knowledge about the generalizability of the
results of the current study.
Implications
This study was unique because it addressed an under-researched employee
population (Shai et al., 2016). The current study addressed a gap in the literature by
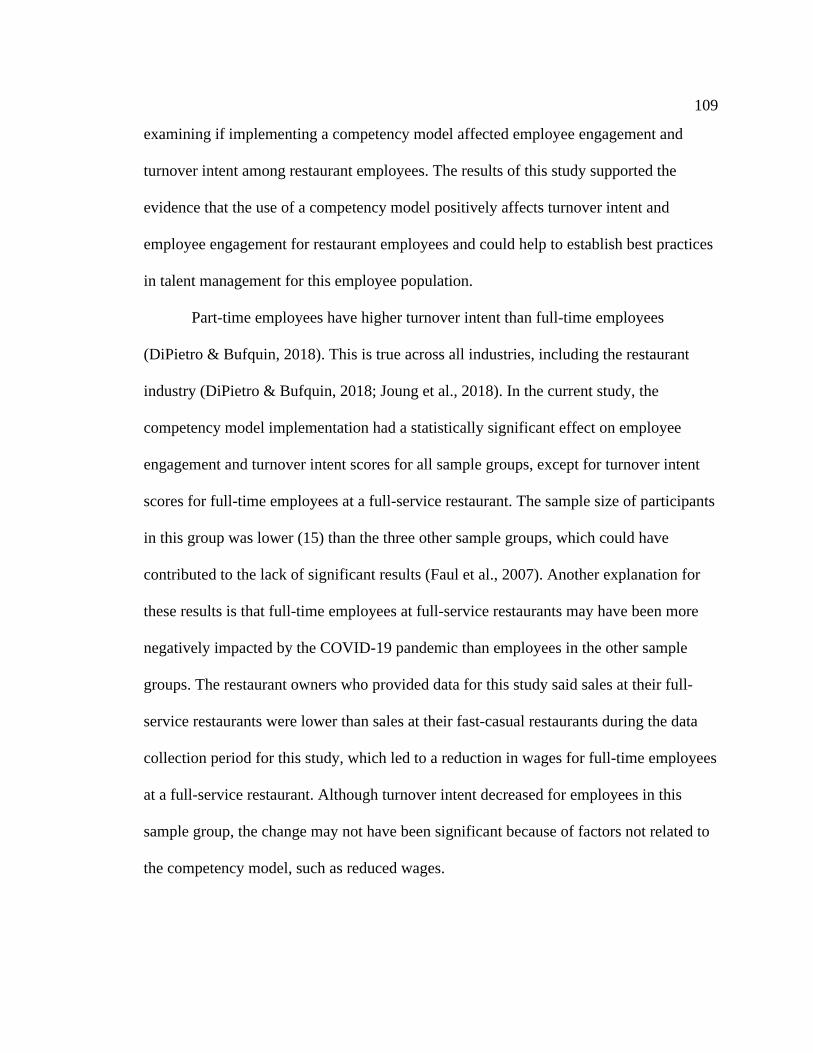
109
examining if implementing a competency model affected employee engagement and
turnover intent among restaurant employees. The results of this study supported the
evidence that the use of a competency model positively affects turnover intent and
employee engagement for restaurant employees and could help to establish best practices
in talent management for this employee population.
Part-time employees have higher turnover intent than full-time employees
(DiPietro & Bufquin, 2018). This is true across all industries, including the restaurant
industry (DiPietro & Bufquin, 2018; Joung et al., 2018). In the current study, the
competency model implementation had a statistically significant effect on employee
engagement and turnover intent scores for all sample groups, except for turnover intent
scores for full-time employees at a full-service restaurant. The sample size of participants
in this group was lower (15) than the three other sample groups, which could have
contributed to the lack of significant results (Faul et al., 2007). Another explanation for
these results is that full-time employees at full-service restaurants may have been more
negatively impacted by the COVID-19 pandemic than employees in the other sample
groups. The restaurant owners who provided data for this study said sales at their full-
service restaurants were lower than sales at their fast-casual restaurants during the data
collection period for this study, which led to a reduction in wages for full-time employees
at a full-service restaurant. Although turnover intent decreased for employees in this
sample group, the change may not have been significant because of factors not related to
the competency model, such as reduced wages.
110
Referencing the high cost of turnover, business owners have stated employee
retention is their biggest human resource apprehension (DiPietro & Bufquin, 2018). One
reason employee turnover is costly to business owners is the time and money spent on
training new employees (DiPietro & Bufquin, 2018). High turnover and low engagement
among restaurant employees cost restaurant owners thousands of dollars per employee
each year due to the costs associated with training and lost productivity (Brain, 2019;
DiPietro & Bufquin, 2018; DiPietro & McLeod, 2011). The current study addressed a gap
in knowledge surrounding the effectiveness of competency models to address turnover
and engagement issues among restaurant employees. The results of this study indicated
that positive social change occurred by improving the employee engagement and
turnover intent scores of the restaurant employees who participated in this study, which
should lead to a cost savings for the restaurant owners. The results of this study have
theoretical implications relative to IPT and competency models. Studies related to the use
of IPT in the workplace do not often use restaurant employees as research participants
(Canning et al., 2019; Emerson & Murphy, 2015; Murphy & Dweck, 2010; O’Reilly et
al., 2014). However, the current study demonstrates that the assumptions made by IPT
applied to the employees in this setting. This theory includes two different types of
beliefs on whether human characteristics can be changed: incremental theory (states that
human traits such as attitudes and behaviors can be changed) and entity theory (states that
these traits are fixed and cannot be changed; Dweck, 1986; Dweck et al., 1995). The
current study used incremental theory as a framework for identifying the implementation
of a competency model used to increase employee engagement and decrease turnover
111
intent. Researchers have used IPT to design interventions used to change behaviors and
performance (Heslin et al., 2005; Katz & O’Malley, 2016), which made it an appropriate
theoretical framework to use to inform the implementation of the competency model that
was used in this study.
Organizational cultures that are aligned with incremental theory (those that
believe their employee’s attitudes and behaviors can change) are associated with higher
employee engagement, lower turnover intent, and higher profits than organizations with
cultures perceived to be aligned with entity theory (Canning et al., 2019; Murphy &
Dweck, 2010). The current study added to IPT literature by exploring the use of this
theory to create a growth mindset in an organization in the restaurant industry, which had
not been previously studied.
Conclusion
The ownership team of the restaurant group that provided data for this study was
extremely satisfied with the outcome of the competency model implementation.
Employee engagement scores significantly increased and turnover intent scores
significantly decreased, which was the intended result, for all sample groups included in
this study except full-time employees in a full-service restaurant. Implementing the
competency model did not require any monetary resources. The competencies were
available online for free, and the identification of the critical competencies for each role
was completed by the restaurant group’s employees and ownership team. The
implementation and communication of the competency model were also completed by
the restaurant group’s employees and ownership team.

112
Restaurant owners lose thousands of dollars per employee each year as a result of
high turnover and low engagement (Brain, 2019; DiPietro & Bufquin, 2018; DiPietro &
McLeod, 2011). Many restaurants have struggled to remain viable and profitable
organizations during the COVID-19 pandemic, so avoiding the costs associated with
training and lost productivity is more important now than ever. The results of this study
indicate that providing employees with the clarity, direction, skills, and career
opportunities competency models offer can help restaurant owners improve employee
engagement and reduce turnover intent among their employees.

113
References
Baek, C. W., McCrory, P., Messer, T., & Mui, P. (2020). Unemployment effects of stay-
at-home orders: Evidence from high frequency claims data. The Review of
Economics and Statistics, 102(4), 1-72. https://doi.org/10.1162/rest_a_00996
Basit, A. A., & Chauhan, M. A. H. (2017). Psychometric properties of the job
engagement scale: A cross-country analysis. Journal of Management and
Research, 4(1), 1-18. https://core.ac.uk/download/pdf/270259259.pdf
Bharwani, S., & Talib, P. (2017). Competencies of hotel general managers: A conceptual
framework. International Journal of Contemporary Hospitality Management,
29(1), 393-418. https://doi.org/10.1108/IJCHM-09-2015-0448
Bothma, C. F. C., & Roodt, G. (2013). The validation of the turnover intention scale.
South African Journal of Human Resources Management, 11(1), 1-12.
https://sajhrm.co.za/index.php/sajhrm/article/view/507/602
Brain, A. D. (2019). Increasing wine sales through customized wine service training-A
quasi-experiment. International Journal of Wine Business Research, 31(1), 29-47.
https://www.ingentaconnect.com/content/mcb/ijwbr/2019/00000031/00000001/art
00004
Bureau of Labor Statistics. (2017, March 22). Quits rise while layoffs and discharges fall
in 2016. The Economics Daily. https://www.bls.gov/opub/ted/2017/quits-rise-
while-layoffs-and-discharges-fall-in-2016.htm
Bureau of Labor Statistics. (2019, July 9). News release: Job openings and labor
turnover - May 2019. https://www.bls.gov/news.release/pdf/jolts.pdf

114
Bureau of Labor Statistics. (2020, September 22). Employee Tenure in 2020.
https://www.bls.gov/news.release/pdf/tenure.pdf
Bureau of Labor Statistics. (2021, January 22). Labor force statistics from the current
population survey. https://www.bls.gov/cps/cpsaat18.htm
Burris, E. A., Detert, J. R., & Chiaburu, D. S. (2008). Quitting before leaving: The
mediating effects of psychological attachment and detachment on voice. Journal
of Applied Psychology, 93(4), 912-922.
https://doi.org/10.1037/00219010.93.4.912
Campion, M. A., Fink, A. A., Ruggeberg, B. J., Carr, L., Phillips, G. M., & Odman, R. B.
(2011). Doing competencies well: Best practices in competency modeling.
Personnel Psychology, 64(1), 225-262.
http://www.workitect.com/PDF/Competency-Modeling-Best-Practices.pdf
Caniels, M. C. J., Semeijn, J. H., & Renders, I. H. M. (2018). Mind the mindset! The
interaction of proactive personality, transformational leadership and growth
mindset for engagement at work. Career Development International, 23(1), 48-
66. https://doi.org/10.1108/CDI-11-2016-0194
Canning, E. A., Murphy, M. C., Emerson, K. T. U., Chatman, J. A., Dweck, C. S., &
Kray, L. J. (2019). Cultures of genius at work: Organizational mindsets predict
cultural norms, trust, and commitment. Personality & Social Psychology Bulletin,
45(4), 1-17. https://doi.org/10.1177/0146167219872473

115
Chen, J. A. (2012). Implicit theories, epistemic beliefs, and science motivation: A person-
centered approach. Learning and Individual Differences, 22(6), 724-735.
https://doi.org/10.1016/j.lindif.2012.07.013
Chiu, C.-Y., Hong, Y.-Y., & Dweck, C. S. (1997). Lay dispositionism and implicit
theories of personality. Journal of Personality and Social Psychology, 73(1), 19-
30. https://doi.org/10.1037/0022-3514.73.1.19
Chung-Herrera, B. G., Enz, C. A., & Lankau, M. J. (2003). Grooming future hospitality
leaders: A competencies model. Cornell Hotel and Restaurant Administration
Quarterly, 44(3), 17-25. http://scholarship.sha.cornell.edu/articles/366/
Dai, T., & Cromley, J. G. (2014). Changes in implicit theories of ability in biology and
dropout from STEM majors: A latent growth curve approach. Contemporary
Educational Psychology, 39(3), 233-247.
https://doi.org/10.1016/j.cedpsych.2014.06.003
Derro, M. E., & Williams, C. R. (2009). Behavioral competencies of highly regarded
systems engineers at NASA. 2009 IEEE Aerospace Conference, 1-17.
https://doi.org/10.1109/AERO.2009.4839712
Dewettinck, K., & Vroonen, W. (2017). Antecedents and consequences of performance
management enactment by front-line managers: Evidence from Belgium. The
International Journal of Human Resource Management, 28(17), 2473-2502.
https://doi.org/10.1080/09585192.2015.1137608
DiPietro, R., & Bufquin, D. (2018). Effects of work status congruence and perceived
management concern for employees on turnover intentions in a fast-casual

116
restaurant chain. Journal of Human Resources in Hospitality & Tourism, 17(1),
38-59. https://doi.org/10.1080/15332845.2017.1328260
DiPietro, R. B., & McLeod, B. (2011). Perceived work status and turnover intentions of
casual-dining restaurant employees. FIU Hospitality Review, 29(2), 70-87.
https://digitalcommons.fiu.edu/hospitalityreview/vol29/iss2/5/
Dweck, C. S. (1986). Motivational processes affecting learning. American Psychologist,
41(10), 1040-1048. https://doi.org/10.1037/0003-066X.41.10.1040
Dweck, C. S. (2000). Self-theories: Their role in motivation, personality and
development. Psychology Press.
Dweck, C. S. (2006). Mindset: The new psychology of success. Random House.
Dweck, C. S., Chiu, C.-Y., & Hong, Y.-Y. (1995). Implicit theories and their role in
judgments and reactions: A word from two perspectives. Psychological Inquiry,
6(4), 267-285. https://doi.org/10.1207/s15327965pli0604_1
Dweck, C. S., & Leggett, E. L. (1988). A social-cognitive approach to motivation and
personality. Psychological Review, 95(2), 256-273. https://doi.org/10.1037/0033-
295X.95.2.256
El-Alayli, A., & Baumgardner, A. (2003). If at first you don’t succeed, what makes you
try, try again? Effects of implicit theories and ability feedback in a performance-
oriented climate. Self and Identity, 2(2), 119-135.
https://doi.org/10.1080/15298860309031

117
Emerson, K. T. U., & Murphy, M. C. (2015). A company I can trust? Organizational lay
theories moderate stereotype thread for women. Personality and Social
Psychology Bulletin, 41(2), 295-307. https://doi.org/10.1177/0146167214564969
Faul, F., Erdfelder, E., Lang, A.-G., & Buchner, A. (2007). G*Power 3: A flexible
statistical power analysis program for the social, behavioral, and biomedical
sciences. Behavior Research Methods, 39(2), 175-191.
https://pubmed.ncbi.nlm.nih.gov/17695343/
Fowler, S. (2018). Toward a new curriculum of leadership competencies: Advances in
motivation science call for rethinking leadership development. Advances in
Developing Human Resources, 20(2), 182-196.
https://doi.org/10.1177/1523422318756644
Gribbons, B., & Herman, J. (1997). True and quasi-experimental designs. Practical
Assessment, Research & Evaluation, 5(1), 1-3.
https://files.eric.ed.gov/fulltext/ED421483.pdf
Groves, K. S. (2007). Integrating leadership development and succession planning best
practices. Journal of Management Development, 26(3), 239-260.
https://doi.org/10.1108/02621710710732146
Hakanen, J. J., Ropponen, A., Schaufeli, W. B., & De Witte, H. (2019). Who is engaged
at work? A large-scale study in 30 European countries. Journal of Occupational
and Environmental Medicine, 61(5), 373-381.
https://doi.org/10.1097/JOM.0000000000001528

118
Harris, K. J., Murphy, K. S., DiPietro, R. B., & Line, N. D. (2017). The antecedents and
outcomes of food safety motivators for restaurant workers: An expectancy
framework. International Journal of Hospitality Management, 63(1), 53-62.
https://doi.org/10.1016/j.ijhm.2017.02.004
Hatala, J. P., & Hisey, L. (2011). Toward the development and validation of a career
coach competency model. Performance Improvement Quarterly, 24(3), 101-122.
https://doi.org/10.1002/piq.20117
Heslin, P. A. (2010). Mindsets and employee engagement: Theoretical linkages and
practical interventions. In S. L. Albrecht (Ed.), Handbook of employee
engagement: Perspectives, issues, research and practice (pp. 219-226). Edwin
Elgar Publishing.
Heslin, P. A., Latham, G. P., & Vandewalle, D. (2005). The effect of implicit person
theory on performance appraisals. Journal of Applied Psychology, 90(5), 842-856.
https://doi.org/10.1037/0021-9010.90.5.842
Heslin, P. A., Vandewalle, D., & Latham, G. P. (2006). Keen to help? Managers’ implicit
person theories and their subsequent employee coaching. Personnel Psychology,
59(4), 871-902. https://doi.org/10.1111/j.1744-6570.2006.00057.x
Jaworski, C., Ravichandran, S., Karpinski, A. C., & Singh, S. (2018). The effects of
training satisfaction, employee benefits, and incentives on part-time employees’
commitment. International Journal of Hospitality Management, 74(1), 1-12.
https://doi.org/10.1016/j.ijhm.2018.02.011

119
Jayanthi, D., Kowsalya, N., & Manju. S. (2020). Perception of the JES (Job Engagement
Scale) among IT/ITES employees: A study. International Journal of Scientific
and Technology Research, 9(1), 4256-4261. https://www.ijstr.org/final-
print/jan2020/Perception-Of-Jes-job-Engagement-Scale-Among-Itites-
Employees-A-Study.pdf
Johnston, I. (2017). Creating a growth mindset. Strategic HR Review, 16(4), 155-160.
https://doi.org/10.1108/SHR-04-2017-0022
Joung, H.-W., Choi, E.-K., Taylor, J. J. (2018). Investigating differences in job-related
attitudes between full-time and part-time employees in the foodservice industry.
International Journal of Contemporary Hospitality Management, 30(2), 817-835.
https://doi.org/10.1108/IJCHM-03-2016-0129
Kahn, W. A. (1990). Psychological conditions of personal engagement and
disengagement at work. Academy of Management Journal, 33(4), 692-724.
https://doi.org/10.5465/256287
Karambelkar, M., & Bhattacharya, S. (2017). Onboarding is a change. Human Resource
Management International Digest, 25(7), 5-8. https://doi.org/10.1108/HRMID-
04-2017-0073
Katz, I. M., & O’Malley, A. L. (2016). Implicit person theory and feedback environment
interact to shape undergraduate research relationships. Psi Chi Journal of
Psychological Research, 21(4), 261-268. https://doi.org/10.24839/b21.4.261

120
Keating, L. A., & Heslin, P. A. (2015). The potential role of mindsets in unleashing
employee engagement. Human Resource Management Review, 25(4), 329-341.
https://doi.org/10.1016/j.hrmr.2015.01.008
Lüftenegger, M., & Chen, J. A. (2017). Conceptual issues and assessment of implicit
theories. Zeitschrift fur Psychologie (Journal of Psychology), 225(2), 99-106.
https://doi.org/10.1027/2151-2604/a000286
Mannix, E., & Mills, A. (2015, January 15). National Restaurant Association
Educational Foundation develops first-ever food and beverage service
competency model. PR Newswire. https://www.prnewswire.com/news-
releases/national-restaurant-association-educational-foundation-develops-first-
ever-food-and-beverage-service-competency-model-300021262.html
Mjongwana, A., & Kamala, P. N. (2018). Non-financial performance measurement by
small and medium sized enterprises operating in the hotel industry in the city of
Cape Town. African Journal of Hospitality, Tourism, and Leisure, 7(1), 1-26.
https://www.ajhtl.com/uploads/7/1/6/3/7163688/article_29_vol_7__1__2018.pdf
Moghaddam, N. M., Balaye Jame, S. Z., Rafiei, S., Sarem, A. A., Ghamchili, A., &
Shafii, M. (2019). Managerial competencies of head nurses: A model and
assessment tool. British Journal of Nursing, 28(1), 30-37.
https://doi.org/10.12968/bjon.2019.28.1.30
Morgeson, F. P., Campion, M. A., & Levashina, J. (2009). Why don’t you just show me?
Performance interviews for skill-based promotions. International Journal of

121
Selection and Assessment, 17(2), 203-218. https://doi.org/10.1111/j.1468-
2389.2009.00463.x
Murphy, M. C., & Dweck, C. S. (2010). A culture of genius: How and organization’s lay
theory shapes people’s cognition, affect, and behavior. Personality and Social
Psychology Bulletin, 36(3), 283-296. https://doi.org/10.1177/0146167209347380
Nair, S., Kaushik, A., & Dhoot, H. (in press). Conceptual framework of a skill-based
interactive employee engaging system: In the context of upskilling the present IT
organization. Applied Computing and Informatics.
https://doi.org/10.1016/j.aci.2019.05.001
National Restaurant Association. (2015, November 17). Four applications of the food
and beverage service competency model.
https://www.restaurant.org/articles/operations/food-and-beverage-service-
competency-model
National Restaurant Association. (2016, March 22). Employee turnover rate tops 70% in
2015https://www.nrn.com/blog/hospitality-turnover-rose-721-rate-2015
National Restaurant Association. (2019). 2019 state of the restaurant industry report.
https://restaurant.org/research/reports/state-of-restaurant-industry
National Restaurant Association Educational Foundation. (2014). Who works in the U.S.
restaurant industry: A nationwide survey of the restaurant workforce.
https://chooserestaurants.org/NewsFeed/WHO-WORKS-IN-THE-U-S-
RESTAURANT-INDUSTRY-A-NATIONW

122
Nielsen, K., Randall, R., Yarker, J., & Brenner, S.-O. (2008). The effects of
transformational leadership on follower’ perceived work characteristics and
psychological well-being: A longitudinal study. Work and Stress, 22(1), 16-32.
https://doi.org/10.1080/02678370801979430
Nunnally, J., & Bernstein, I. H. (1994). Psychometric theory (3rd ed.). McGraw-Hill.
Ogunmokun, O. A., Eluwole, K. K., Avci, T., Lasisi, T. T., Ikhide, J. E. (2019).
Propensity to trust and knowledge sharing behavior: An evaluation of importance-
performance analysis among Nigerian restaurant employees. Tourism
Management Perspectives, 33(1), 1-11.
https://doi.org/10.1016/j.tmp.2019.100590
Olesen, C., White, D., & Lemmer, I. (2007). Career models and culture change at
Microsoft. Organizational Development Journal, 25(1), 31-36.
https://www.researchgate.net/publication/294703623_Career_models_and_culture
_change_at_microsoft
Omar, A., Salessi, S., & Urteaga, F. (2017). Impact of management practices on job
satisfaction. Revista de Administração Mackenzie, 18(5), 92-115.
https://doi.org/10.1590/1678-69712017/administracao.v18n5p92-115
O’Reilly, C. A., Caldwell, D. F., Chatman, J. A., & Doerr, B. (2014). The promise and
problems of organizational culture: CEO personality, culture, and firm
performance. Group & Organization Management, 39(6), 595-625.
https://doi.org/10.1177/1059601114550713

123
Osgood, C. E. (1964). Semantic differential technique in the comparative study of
cultures. American Anthropologist, 66(3), 171-200.
https://doi.org/10.1525/aa.1964.66.3.02a00880
Pai, F.-Y., Yeh, T.-M., & Tang, C.-Y. (2018). Classifying restaurant service quality
attributes by using Kano model and IPA approach. Total Quality Management &
Business Excellence, 29(3), 301-328.
https://doi.org/10.1080/14783363.2016.1184082
Plaks, J. E., & Chasteen, A. L. (2013). Entity versus incremental theories predict older
adults’ memory performance. Psychology and Aging, 28(4), 948-957.
https://doi.org/10.1037/a0034348
Posthuma, R. A., & Campion, M. A. (2008). Twenty best practices for just employee
performance reviews. Compensation and Benefits Review, 40(1), 47-55.
https://doi.org/10.1177/0886368707312139
Ravichandran, N., & Mishra, R. (2018). Toward building HR competencies: A shift from
the non-learning toward the learning organization. International Journal of
Healthcare Management, 11(3), 233-238.
https://doi.org/10.1080/20479700.2017.1336835
Renaud, J. M., & McConnell, A. R. (2007). Wanting to be better but thinking you can’t:
Implicit theories of personality moderate the impact of self-discrepancies on self-
esteem. Self and Identity, 6(1), 41-50.
https://doi.org/10.1080/15298860600764597

124
Rich, B. L., Lepine, J. A., & Crawford, E. R. (2010). Job engagement: Antecedents and
effects on job performance. Academy of Management Journal, 53(3), 617-635.
https://doi.org/10.5465/AMJ.2010.51468988
Roodt, G. (2004). Turnover intentions. Unpublished document. Johannesburg, South
Africa: University of Johannesburg.
Ross, M., & Stefaniak, J. (2018). The use of the behavioral engineering model to examine
the training and delivery of feedback. Performance Improvement, 57(8), 7-20.
https://doi.org/10.1002/pfi.21786
Scott, D., Johnson, Y. R., Spitzer, B. J., Trzesniewski, K. H., Powers, J., & Dweck, C. S.
(2014). The far-reaching effects of believing people can change: Implicit theories
of personality shape stress, health, and achievement during adolescence. Journal
of Personality and Social Psychology, 106(6), 867-884.
https://doi.org/10.1037/a0036335
Shai, M. P., Kleynhans, I. C., & Roeloffze, A. (2016). Technical competencies of
restaurant managers in Pretoria: Employees’ and managers’ perceptions. African
Journal of Hospitality, Tourism and Leisure, 5(1), 1-12.
http://www.ajhtl.com/uploads/7/1/6/3/7163688/2016_article_31_vol_5__1__2016
Shum, C., Gatling, A., & Shoemaker, S. (2018). A model of hospitality leadership
competency for frontline and director-level managers: Which competencies
matter more? International Journal of Hospitality Management, 74(1), 57-66.
https://doi.org/10.1016/j.ijhm.2018.03.002

125
Spinath, B., Spinath, F. M., Riemann, R., & Angleitner, A. (2003). Implicit theories about
personality and intelligence and their relationship to actual personality and
intelligence. Personality and Individual Differences, 35(4), 939-951.
https://doi.org/10.1016/S0191-8869(02)00310-0
Teunissen, P. W., & Bok, H. G. J. (2013). Believing is seeing: How people’s beliefs
influence goals, emotions and behaviour. Medical Education, 47(11), 1064-1072.
https://doi.org/10.1111/medu.12228
United States Department of Labor. (n.d.). Food and beverage service competency model.
Competency Model Clearinghouse.
https://www.careeronestop.org/competencymodel/competency-models/food-
service.aspx
United States Department of Labor. (2017, October). Food and beverage service
competency model. Competency Model Clearinghouse.
https://www.careeronestop.org/CompetencyModel/competency-models/pyramid-
download.aspx?industry=food-beverage-service
Watson, A. (2018). Why do restaurant staff go with the flow? International Journal of
Business & Management Science, 8(1), 41-65.
https://ro.uow.edu.au/dubaipapers/1025
Watson, A. W., Taheri, B., Glasgow, S., & O’Gorman, K. D. (2018). Branded restaurants
employees’ personal motivation, flow and commitment. International Journal of
Contemporary Hospitality Management, 30(3), 1845-1862.
https://doi.org/10.1108/IJCHM-02-2017-0075

126
Wheelen, T. L., & Hunger, J. D. (2006). Strategic management and business policy:
Cases (10th ed). Pearson Prentice Hall.
Yeager, D. S., & Dweck, C. S. (2012). Mindsets that promote resilience: When students
believe that personal characteristics can be developed. Educational Psychologist,
47(4), 302-314. https://doi.org/10.1080/00461520.2012.722805

127
Appendix A. Demographics Questionnaire
1. Employee ID:
2. Age: 18-23 __ 24-29 __ 30-35 __ 36-41 __ 42-47 __ 48-53 __ 54+ __
3. Sex: Female __ Male __ Other __
4. Employee Type: Part-time (1-30 hours worked/week) __ Full-time (30.1 hours or
more worked/week) __
5. Restaurant Type: Fast-casual* __ Full-service** __
*Full-Service Restaurant: A dining establishment where customers sit at
tables and order food through a wait staff (Wheelen & Hunger, 2006).
**Fast-Casual Restaurant: A dining establishment that does not offer full
table service from a server yet claims to offer higher quality food than a fast-
food restaurant (Wheelen & Hunger, 2006).
6. Job Type: Front of house (Host, Server, Cashier, or Bartender) __ Back of house
(Cook or Chef) __ Shift lead __ General manager __
7. Tenure with the organization: Less than 6 months __ 6 months to 1 year __ 1-2
years __ More than 2 years __

128
Appendix B. Permission to use the TIS-6

129
Appendix C. Permission to use the JES
130
Appendix D. Time One Invitation Letter and Consent Form
You are invited to take part in a research study about the implementation of a
competency model and its effects, if any, on employee engagement and turnover intent.
All permanent (nonseasonal) employees are being invited to be in the study. This form is
part of a process called “informed consent” to allow you to understand this study before
deciding whether to take part. This study is being conducted by a researcher named Erin
Vu, who is a doctoral student at Walden University.
Background Information:
The purpose of this study is to identify if the implementation of a competency model
affects employee engagement or turnover intent.
Procedures:
If you agree to participate in this study, you will be asked to complete the following
surveys once in the next two weeks and again in four months:
• The Turnover Intention Scale-6 (approximately three minutes);
• The Job Engagement Scale (approximately five minutes); and
• A short demographic questionnaire (approximately two minutes).
Here are some sample questions:
• To what extent is your current job satisfying your personal needs?
• At work, I focus a great deal of attention on my job
Voluntary Nature of the Study:
This study is voluntary. You are free to accept or turn down the invitation. No one at
Happy Endings Hospitality will treat you differently if you decide not to be in the study.

131
If you decide to be in the study now, you can still change your mind later. You may stop
at any time.
Risks and Benefits of Being in the Study:
Being in this type of study involves some risk of the minor discomforts that can be
encountered in daily life, such as concern about how your employer will use the results of
the surveys you complete. Being in this study would not pose risk to your safety or
wellbeing.
Identifying the effects of the competency model that has been implemented by your
employer on your engagement and turnover intent will contribute to the overall research
related to competency models.
Payment:
No compensation is offered or will be paid as a result of your participation in this study.
Privacy:
Reports coming out of this study will not share the identities of individual participants.
Details that might identify participants, such as the location of the study, also will not be
shared. The researcher will not use your personal information for any purpose outside of
this research project. Data will be kept secure by storing the data gathered in a password-
protected computer. Data will be kept for a period of at least 5 years, as required by the
university.
Contacts and Questions:
You may ask any questions you have now. Or if you have questions later, you may
contact the researcher via [email protected], 434-944-2163. If you want to talk

132
privately about your rights as a participant, you can call the Research Participant
Advocate at my university at 612-312-1210. Walden University’s approval number for
this study is 09-01-20-0752172 and it expires on August 31st, 2021.
Please print or save this consent form for your records.
Obtaining Your Consent
If you feel you understand the study well enough to make a decision about it, please
indicate your consent by clicking https://www.surveymonkey.com/r/LP2939M to
complete the questionnaire.
Thank you,
Erin Vu

133
Appendix E. Time Two Invitation Letter and Consent Form
Four months ago, you were invited to participate in a research study about the
implementation of a competency model and its effects, if any, on employee engagement
and turnover intent. If you decided not to participate in the study (if you did not complete
the survey four months ago) please disregard this email.
If you elected to participate in the study four months ago, you were informed
that you would be asked to complete a survey on two different occasions. Thank you
for participating in the first stage of this study. You are now invited to participate in
the second and final stage of this study by completing the following surveys:
• The Turnover Intention Scale-6 (approximately three minutes);
• The Job Engagement Scale (approximately five minutes); and
• A short demographic questionnaire (approximately two minutes).
All permanent (nonseasonal) employees are being invited to be in the study. This
form is part of a process called “informed consent” to allow you to understand this study
before deciding whether to take part. This study is being conducted by a researcher
named Erin Vu, who is a doctoral student at Walden University.
Background Information
The purpose of this study is to identify if the implementation of a competency model
affects employee engagement or turnover intent.
Voluntary Nature of the Study:
This study is voluntary. You are free to accept or turn down the invitation. No one at
Happy Endings Hospitality will treat you differently if you decide not to be in the study.

134
If you decide to be in the study now, you can still change your mind later. You may stop
at any time.
Risks and Benefits of Being in the Study:
Being in this type of study involves some risk of the minor discomforts that can be
encountered in daily life, such as concern about how your employer will use the results of
the surveys you complete. Being in this study would not pose risk to your safety or
wellbeing.
Identifying the effects of the competency model that has been implemented by your
employer on your engagement and turnover intent will contribute to the overall research
related to competency models.
Payment:
No compensation is offered or will be paid as a result of your participation in this study.
Privacy:
Reports coming out of this study will not share the identities of individual participants.
Details that might identify participants, such as the location of the study, also will not be
shared. The researcher will not use your personal information for any purpose outside of
this research project. Data will be kept secure by storing the data gathered in a
password-protected computer. Data will be kept for a period of at least 5 years, as
required by the university.
Contacts and Questions:
You may ask any questions you have now. Or if you have questions later, you may
contact the researcher via [email protected], 434-944-2163. If you want to talk

135
privately about your rights as a participant, you can call the Research Participant
Advocate at my university at 612-312-1210. Walden University’s approval number for
this study is 09-01-20-0752172 and it expires on August 31st, 2021.
Please print or save this consent form for your records.
Obtaining Your Consent
If you feel you understand the study well enough to make a decision about it, please
indicate your consent by clicking https://www.surveymonkey.com/r/LP2939M to
complete the questionnaire.
Thank you,
Erin Vu

136
Appendix F. G*Power Computation of Effect Size

137
Appendix G. Instruments
Turnover Intention Scale (TIS-6)
Scale: 1 = Never to 5 = Always
1. How often do you dream about getting another job that will better suit your personal needs?
2. How often are you frustrated when not given the opportunity at work to achieve your personal work-related goals?
3. How often have you considered leaving your job? 4. How likely are you to accept another job at the same compensation level should it
be offered to you? 5. To what extent is your current job satisfying your personal needs? 6. How often do you look forward to another day at work?
Job Engagement Scale (JES)
Scale: 1 = Strongly disagree, 2 = Disagree, 3 = Neither agree nor disagree, 4 = Agree, 5 = Strongly agree Physical engagement
1. I work with intensity on my job 2. I exert my full effort to my job 3. I devote a lot of energy to my job 4. I try my hardest to perform well on my job 5. I strive as hard as I can to complete my job 6. I exert a lot of energy on my job
Emotional engagement
7. I am enthusiastic in my job 8. I feel energetic at my job 9. I am interested in my job 10. I am proud of my job 11. I feel positive about my job 12. I am excited about my job
Cognitive engagement
13. At work, my mind is focused on my job 14. At work, I pay a lot of attention to my job 15. At work, I focus a great deal of attention on my job 16. At work, I am absorbed by my job 17. At work, I concentrate on my job 18. At work, I devote a lot of attention to my job