the effect of cash, vouchers and food transfers on ... · 2 1. introduction and motivation recent...
TRANSCRIPT

1
The effect of cash, vouchers and food transfers on intimate partner violence: Evidence from a
randomized experiment in Northern Ecuador
Melissa Hidroboa,d, Amber Petermanb, Lori Heisec
a International Food Policy Research Institute, 2033 K St, NW,
Washington, DC 20006, USA; Email: [email protected]
b Department of Public Policy, University of North Carolina, Chapel Hill,
NC 27599, USA; Email: [email protected]
c London School of Hygiene and Tropical Medicine, Keppel Street,
London WC1E 7HT, UK; Email: [email protected]
Abstract
Despite the pervasive and far reaching consequences of intimate partner violence (IPV),
there is little conclusive evidence on policy instruments to reduce or prevent violence.
Using a randomized experiment in Northern Ecuador, this study provides evidence on
whether cash, vouchers and food transfers targeted to women in poor urban areas and
intended to reduce poverty and food insecurity also affected IPV. Results indicate that
overall transfers reduce controlling behaviors and multiple forms of IPV including
moderate physical and any physical or sexual violence by 6-7 percentage points. Impacts
do not vary by transfer modality, which combined with the overall negative impacts on
IPV, suggests that violence is not being used to forcefully extract resources. Instead,
initial conditions and power dynamics between partners is important in determining the
magnitude and significance of reductions in IPV.
Keywords: Intimate partner violence, cash transfers, Ecuador
JEL Classification Code: I10, D13
_____________________
d Corresponding author: Poverty, Health and Nutrition Division, International Food Policy Research Institute, 2033
K St. NW, Washington D.C., 20006; USA. T: 202-862-4612; Email: [email protected].

2
1. Introduction and motivation
Recent multi-country studies show that intimate partner violence (IPV) is widespread and common. One
in three women globally have experienced physical and/or sexual violence by a partner during their
lifetime (Devries et al. 2013; WHO 2013). In Ecuador, the country examined in this analysis, the lifetime
prevalence of IPV is estimated at 35% for physical violence, 14.5% for sexual violence, and 43.4% for
psychological violence (INEC 2011). Although regional variation exists across provinces within Ecuador,
as well as within and between countries globally, the prevalence of partner violence remains high in most
parts of the world.
Violence against women hinders development, including progress towards the achievement of the
Millennium Development Goals (García-Moreno et al. 2005). The consequences of IPV are extensive,
ranging from the direct physical and mental harm of women and their children to economic losses at the
community and national level. Women who are victims of IPV are more likely to have poor health,
acquire HIV infections, and develop chronic disease, mental illness, and substance abuse problems
(Ackerson and Subramanian 2008; Coker et al. 2002; Jewkes et al. 2010; Ellsberg et al. 2008).
Consequently, they are less able to work and contribute productively to society (Sabia, Dills, and
DeSimone 2013). The ultimate consequence of IPV is suicide (Devries et al. 2011) and homicide (Stöckl
et al. 2013). IPV has also been linked to negative health outcomes among the children of abused women,
including low birth weight (Aizer 2011), elevated rates of morbidity (Karamagi et al. 2007), increased
risk of acute malnutrition (Hasselmann and Reichenheim 2006), and increased risk of infant and child
mortality (Åsling-Monemi et al. 2003; Ahmed, Koenig, and Stephenson 2006). Children who are exposed
to intimate partner violence are also more likely to have lower IQs and develop emotional and behavioral
problems (Koenen et al. 2003; Sternberg et al. 1993; Wolfe et al. 2003). Although the detrimental effects
are well documented, there is less evidence on public policies and programs that could help reduce the
prevalence of IPV.
Many poverty alleviation and gender programs throughout the developing world aim at
empowering women through economic means such as labor, assets, microfinance, or cash transfers. Yet,
across and within disciplines as varied as sociology, psychology, and economics, there is no consensus on
the theories and predicted association between female economic empowerment and IPV (Heise 2012).
While long researched in the other fields, the contribution of economics on the relationship between a
woman’s income and IPV has been fairly recent and depends on how violence is modeled in household
bargaining models. In classic household bargaining models, individual control of resources matters
because bargaining outcomes depend on threat points such as divorce (Manser and Brown 1980; McElroy
and Horney 1981) or non-cooperative equilibriums (Lundberg and Pollak 1993). The more promising an
individual's opportunities are outside the household, the more credible the threat point, and therefore, the

3
more likely that the intra-household distribution of resources will align more closely with that individual's
preferences. In these bargaining models, an increase in a woman’s income decreases violence by
improving her threat point and thus her bargaining power within the household (Farmer and Tiefenthaler
1997). However, when violence is either instrumental and used to control the victim’s behavior or
allocation of resources within the household (Eswaran and Malhotra 2011; Tauchen, Witte, and Long
1991), or extractive and used to extract monetary transfers from the victim or her family (Bloch and Rao
2002), an increase in her income may in fact increase violence.
Given the lack of consensus on theories related to a woman’s income and IPV, it is no surprise
that the empirical evidence is also mixed. To add to the ambiguity, few studies have accounted for the
endogeneity of economic status or income, and thus most of the evidence consists of basic associations
that tell us little about the casual mechanisms (Heise 2011). For example, a recent study by Bajracharya
and Amin (2013) finds that previous analysis that suggested that IPV increased in Bangladesh as a result
of micro-credit membership was likely a result of selection bias where micro-credit participants were
systematically more disadvantaged with respect to poverty and socioeconomic status as compared to non-
members, and thus had a higher level of IPV risk. Once properly accounted for, the authors find a
negative relationship between micro-credit membership and IPV. Other studies that have attempted to
account for the endogeniety of income or economic status have used exogenous variation in either
demand or supply of labor (Aizer 2010; Chin 2011) or randomized allocation of either job offers or
microfinance (Hjort and Villanger 2011; Pronyk et al. 2006). However, there is still no conclusive
direction of the relationship between economic empowerment and IPV and this may be due to contextual
factors.
Building off a robust literature on the social impacts of cash transfer (CT) programs, a number of
papers have examined linkages between CTs and IPV (Bobonis and Castro 2010; Bobonis, Gonzalez-
Brenes, and Castro 2013; Hidrobo and Fernald 2013; Perova 2010; Angelucci 2008; Haushofer and
Shapiro 2013). Over the last two decades, CTs have become one of the most popular policy interventions
to tackle poverty and increase human capital in developing countries. Although the details of program
design vary, all such programs transfer monetary resources to poor households, often conditional on them
taking active measures to improve the human capital of their children (such as enrolling their children in
school or taking them for regular health care visits). In the vast majority of cases, transfers are made to
women because they are more likely to re-invest resources into the family’s wellbeing (Thomas 1997;
Quisumbing and Maluccio 2000; Hoddinott and Haddad 1995). While the impact of CTs on poverty,
education, and health have been well studied, there is growing interest in understanding how such
transfers impact intrahousehold dynamics. Of special interest is whether transfers have any consequences
with respect to IPV.

4
Evidence on the relationship between IPV and CT programs is concentrated in Latin America. In
Peru, Perova (2010) uses difference-in-difference and matching techniques to isolate the effect of Peru’s
conditional cash transfer (CCT) program, Juntos, on IPV, and finds that Juntos decreases physical and
emotional violence by 9 and 11 percentage points, respectively. These impacts are concentrated among
women who have fewer children, cash paying jobs and report not having been exposed to violence
between their parents in childhood. Hidrobo and Fernald (2013) take advantage of the randomized roll out
of Ecuador’s national unconditional cash transfer (UCT) program, the Bono Desarollo Humano (BDH),
and find that for women with more than primary education, transfers decrease emotional violence by 8
percentage points and controlling behaviors by 14 percentage points, but have no effect on physical or
sexual partner violence. For women with primary education or lower, the effect depends on her education
relative to her partners. Specifically, for women that have at least as much education as their partners,
transfers increase emotional violence by 9 percentage points. Using non-experimental estimators Bobonis
and colleagues (2013), find that after two to five years in the program, women in Mexico’s CCT,
Oportunidades, are 5 to 7 percentage points less likely to experience physical abuse in the last year, but
are more likely to receive violent threats with no associated physical abuse. They also explore variations
by women’s bargaining power and find that these impacts are concentrated among women with low
expected gains to marriage, as proxied by the interaction of an indicator for female secondary education
with the education level of her partner. When longer-term impacts (five to nine years) of Oportunidades
are examined, the previously mentioned program impacts are found to have dissipated, which is attributed
largely to marital selection – or the types of couples that remain in a relationship as a result of the
program (Bobonis and Castro, 2010). Finally, in the only study we are aware of outside Latin America,
Haushofer and Shapiro (2013) examine the GiveDirectly cash transfer programme in Western Kenya and
find that transfers lead to a 7-11 percentage point reduction in physical violence and a 5 percentage point
reduction in sexual violence, but no impact on emotional violence. Additionally, they find that these
reductions occur both in treatment households regardless of the sex of the recipient and in “spillover”
households in treatment communities.
Using a randomized experiment conducted in 2011 in Northern Ecuador, this study evaluates
whether cash, vouchers and food transfers targeted to women and intended to reduce poverty and food
insecurity among the urban poor, also impact IPV. The design of the study is novel and contributes to the
existing knowledge surrounding transfers and IPV in a number of important ways. First, the randomized
study design and panel data on women’s experience with IPV provide the most robust evidence on how
transfers impact IPV. The randomization avoids issues of bias due to the endogeneity of income or
selection into the program, and the panel data allows us to control for baseline patterns of violence.

5
Second, comparison of the three transfer modalities—cash, vouchers or food—provide evidence
on whether the mode of transfer matters to impact. Economic theory predicts that cash and in-kind
transfers of equal size will have similar impacts on a household’s utility and consumption if the value of
the in-kind transfer is less than what a household would have spent on that particular good (“infra-
marginal”) and if there are no transaction costs. Indeed, Hidrobo et al. (2014) find that the transfers from
this study were infra-marginal and thus had similar impacts on the value of food, non-food, and total
consumption. However, differences across modalities could emerge in who controls the transfer or the
likelihood of it being commandeered by one partner. Descriptive statistics from endline suggest that food
is significantly more likely to be controlled by the female spouse than cash or vouchers (60% for food
compared to 50% and 48% for cash and voucher respectively), while cash and vouchers are significantly
more likely than food to be controlled by household head and spouse together. Moreover, restrictions on
how transfers can be used vary by modality. The food transfer, which is composed mainly of staple
goods, is expected to be consumed by the household and thus presents little opportunity for generating
conflict within the household.1 Similarly, the food voucher is redeemable for only a predetermined list of
nutritious foods at a specified supermarket within each urban center. The voucher is nontransferable and
thus cannot be extracted and used for anything other than the pre-approved list of food items. Cash on the
other hand can be utilized by the household to spend without restrictions and thus has more opportunity to
lead to conflict over its use. Consequently, if partners use IPV as a tool to extract resources, then we
should observe a larger increase in IPV among the cash households in comparison to the food and
voucher households. Thus, comparison of transfer modalities provides further insight into theories on
IPV, especially with regards to extraction theories, and addresses policy makers’ fear that cash is more
likely to lead to conflict over spending decisions and potential confiscation by partners.
Finally, we collect direct measures of women’s bargaining power in the household, which allows
us to explore whether baseline bargaining power influences the direction or size of impact. Economic
models that predict an ambiguous relationship between a woman’s income and IPV assert that the
relationship between income and IPV depends on a woman’s baseline bargaining power or autonomy. In
Tauchen and colleagues model (1991), the relationship between a woman’s income and IPV depends on
whether her utility from marriage equals her out-of-marriage utility. In Eswaran and Malhotra (2011), the
equilibrium level of violence depends on a woman’s exercise of autonomy and whether an increase in her
income or reservation utility leads her to allocate resources more in line with her preferences—so much
so that it increases violence. Empirically, studies on CTs and IPV have found that impacts vary by a
woman’s bargaining power. However, these studies typically utilize indirect measures of bargaining
1 Although it is possible that food could be extracted and sold for cash, there is little evidence that this occurred in
this study.

6
power, such as education or age, which may be correlated with other outside factors, including household
poverty. In contrast, we collect questions on women’s decisionmaking within the household, which we
use to operationalize her relative bargaining power.
Consistent with evidence on IPV from other studies, we find that transfers decrease the
probability that women experience controlling behaviors, moderate physical, and any physical/sexual
violence by 6 to 7 percentage points (or approximately a 38-43 percent). This effect does not vary
significantly by treatment modality, a fact that combined with the observed reductions in IPV, suggests
that violence is not being used to forcefully extract resources. Instead, we find that initial conditions and
particularly power dynamics between partners determine the magnitude and significance of impacts. In
particular, we find that the decrease in IPV is concentrated among woman with low decisionmaking
power at baseline. We attempt to uncover the mechanism through which transfers decrease violence and
find suggestive evidence that overall reductions in IPV may be due to decreases in poverty related stress
and conflict.
The rest of this paper is structured in the following way. Section 2 introduces the program and
study area; Section 3 presents the study design and data; Section 4 discusses the empirical methods used
to evaluate the impact of transfers on IPV; Section 5 presents the impact results; Section 6 discusses the
possible pathways that could explain our results, and Section 7 concludes with discussion of limitations
and research implications for expanding the body of evidence.
2. Study area and intervention
In the last three decades, Ecuador’s economic and political transitions have improved women’s
opportunity and rights. The first legislation specifically criminalizing violence against women in
Ecuador, the Law Against Violence Towards Women and the Family was drafted in 1995 and
accompanied in subsequent years, by revisions to the Constitution to guarantee equal rights for men and
women (IACHR 2011). In addition, to facilitate reporting by women, female operated police stations
offering a host of women-centered services, “Comisarías de la Mujer y la Familia,” were established in
major urban centers throughout the country. Currently, Ecuadorian law criminalizes rape, including
marital rape, with penalties of up to 25 years in prison (USDS 2011).
Despite progressive legislation and institutional action to address gender inequities and violence,
prosecutions are rare and violence and discrimination against women remains high across socioeconomic
groups in Ecuador. Women in Ecuador receive lower pay, have less access to social services, have less
decisionmaking power, and experience high rates of violence and harassment (Vega 2004). The most
recent national survey estimates lifetime prevalence of IPV among women aged 15 and older at nearly

7
48.7%2 (INEC 2011). The prevalence of IPV varies across provinces from 36.1% in Manabí to 63.7% in
Morano Santiago. In the study provinces of Carchi and Sucumbíos, the prevalence of lifetime IPV is
approximately 49% and 41% respectively. In addition, IPV is highest among indigenous women, women
with no formal education, and women with children.
In April 2011, the World Food Programme (WFP) expanded its assistance to address the food
security and nutrition needs of Colombian refugees and poor Ecuadorians, and to support the integration
of refugees into Ecuadorian communities. The new program was designed as a prospective randomized
control trial and consisted of six monthly transfers of cash, vouchers, or food transfers to Colombian
refugees and poor Ecuadorian households. In addition to improving the food consumption of poor
households, a goal of the program was to improve the role of women in household decisionmaking,
particularly related to food and nutrition.3 Consequently, the program specifically targeted women within
households. Although the program was not intended to impact IPV, there were concerns that transfers,
and specifically cash, intended to improve the food security of poor households, could unintentionally
increase conflict within the household.
The experiment was conducted in seven urban centers with large Colombian refugee populations
in the provinces of Carchi and Sucumbíos in Northern Ecuador (Figure A.1 in Appendix). Despite sharing
administrative borders, Carchi and Sucumbíos have markedly different economic, geographic, and agro-
ecological characteristics. Carchi is located in the high-altitude highlands characterized by an industrial
and agricultural-based economy including production of tobacco, dairy, floriculture and staple crops such
as potatoes and maize. Sucumbíos is located in the Amazonian lowlands and its economy is driven by
natural resource extraction, primarily oil, making it one of the most important economic areas in Ecuador.
The seven urban centers were selected by WFP based on the following criteria: 1) the percent of refugees
in the population exceeded 10%; 2) the poverty index exceeded 50%; 3) the presence of implementing
partners for food distribution; and 4) the presence of financial institutions to distribute cash disbursements
via ATMs. Neighborhoods (or barrios) within these urban centers were then pre-selected for the
intervention by the WFP in consultation with the United Nations High Commissioner for Refugees
(UNHCR) as areas that had large numbers of Colombian refugees and relatively high levels of poverty.
As part of the enrollment exercise to determine program qualification status, all households within the
pre-chosen barrios were visited, mapped and administered a short census survey. Households were
ranked according to a proxy means test based on asset ownership, employment, food security,
2 This includes physical, sexual, psychological, and patrimonial violence. Patrimonial violence is defined as the
obstruction or retention of personal objects, properties, or values. 3 Formally, the objectives of the program were threefold: 1) to improve food consumption by facilitating access to
more nutritious foods, 2) to increase the role of women in household decisionmaking related to food consumption,
and 3) to reduce tensions between Colombian refugees and host Ecuadorian populations.

8
demographics and nationality and a cut off score was determined based on project budget constraints.
Based on point scores by nationality, the decision was made to automatically enroll all Colombian and
mixed-nationality households. In addition, households were excluded from eligibility if they were current
recipients of the government’s social safety net, the BDH, which targeted poor households with school
age and young children. The “Cash, Food, and Voucher” program targeted women as participants,
although men were also allowed to participate if there was not a qualifying adult woman in the household
at the time of enrollment. Among all beneficiary households, approximately 79% of registered beneficiary
cardholders in Carchi and 73% of registered beneficiary cardholders in Sucumbíos were women (WFP-
Ecuador 2011).
Participating households received benefits from April 2011 to September 2011. The value of the
monthly transfer was standardized across all treatment arms and was equivalent to $40 per month per
household for a total of $240 over the six month study period. The monthly value was approximately 11%
of a household’s pre-transfer monthly consumption. The food transfer contained rice (24 kg), lentils (8
kg), vegetable oil (4 liters) and canned sardines (8 cans each 0.425 kg). The food voucher was redeemable
at local supermarkets for a pre-approved list of nutritious foods. The cash was distributed though
preprogrammed ATM cards. The transfers were conditional on attendance of monthly nutrition trainings,
which were standardized across treatment arms. Particular attention was given to ensure beneficiaries’
experiences with the program would be similar across modalities. For example, the timing of
disbursement, frequency and value of transfers were equalized across modalities to ensure that differences
in outcomes were attributable to the modality and not to other confounding factors. Evaluation of the
transfer program showed significant improvements in food consumption and dietary diversity across all
transfer modalities thus demonstrating that the program met its goal of improving overall food security
(Hidrobo et al. 2014).
3. Study design and key indicators
3.1 Study design
The program evaluation was based on random assignment. Due to the differences in socioeconomic and
geographic characteristics of the study provinces, Sucumbíos and Carchi, the randomization was stratified
at the province level. Randomization was conducted in two stages: first neighborhoods within the urban
centers were randomized to either treatment or control groups; and second, clusters within the
neighborhoods were randomized to either: cash, voucher or food. The two-stage randomization was done
to ensure that households in control neighborhoods were in geographically distinct locations from those in
treatment neighborhoods to help mitigate possible discontent among neighbors. The randomization into

9
modalities was assigned using percentages of 20/20 for the control and food arms, and 30/30 for the cash
and food voucher arms, based on funding availability for each modality. In total 80 neighborhoods and
145 clusters were randomized into the four intervention arms – control, cash, vouchers and food.4 Figure
1 depicts the randomization and sampling process. Analysis on the full sample of households that
participated in the study indicates that the randomization was in general successful, with few differences
on socio economic and demographic indicators at baseline across treatment and control groups, or across
treatment modalities (Hidrobo et al. 2014).5
In order to evaluate the transfer program, baseline (March 2011) and follow-up surveys (October-
November 2011) were conducted by IFPRI in collaboration with a local survey firm, Centro de Estudios
de Población y Desarrollo Social (CEPAR). Twenty-seven households per control and food clusters and
20 households per food voucher and cash clusters were randomly selected to be interviewed in the
baseline survey. In addition, since a main objective of the evaluation was to compare differences across
nationalities, Colombian and Columbian-Ecuadorian households were oversampled to ensure a sufficient
sample for comparative analysis. In total, 2,357 households were surveyed at baseline and 2,122 at
follow-up. Household surveys collected information on household characteristics, demographics, food
consumption, labor, education, and health. The survey also collected detailed information on women’s
status in the household, decisionmaking within the household, and IPV. Neighborhood and market
questionnaires were also implemented to provide information on market access, food prices and other
community-level factors. Further details about the sampling strategy, evaluation sample and intervention
can be found in Hidrobo et al. (2014, 2012).
3.2 Violence and empowerment variables
Violence indicators were collected in accordance with the WHO protocol on ethical guidelines for
conducting research on IPV (WHO 2001). In particular, we ensured adequate training of interviewers,
enacted safety measures that guaranteed privacy during interviews, and interviewed only one woman per
household to ensure that no other household member was aware that survey questions involved disclosing
IPV. In addition, enumerators provided all women with de-identified contact information for local IPV
support services for referral, regardless of disclosure of IPV. These services were woman centered and
woman staffed “Comisarías de la Mujer y la Familia,” in each urban center and included female police
4 Initially 81 neighborhoods and 146 clusters were surveyed for the census, but subsequently one cluster and
neighborhood was dropped from the study given that the majority of households in the areas were receiving the
BDH. 5 Across 132 difference-in-means tests between the treatment and control groups, only four are statistically different
at the 5 percent level, which reveals that randomization was, for the most part, effective at balancing baseline
characteristics (Hidrobo et al. 2014).

10
officers and social services.6 To be eligible for interview of the IPV module, the woman had to be 15
years or older, been in a relationship in the last 6 months, and be either the household head or partner of
the household head. Only women who could be interviewed in private were administered the IPV
module.7
In order to elicit accurate assessments of violence, we administered multiple behaviorally specific
questions on a range of abusive acts, a technique shown to maximize disclosure (Ellsberg et al. 2001).
Indicators of internationally validated standardized IPV measures modified from the WHO Violence
Against Women Instrument (Ellsberg and Heise 2005) and the Conflict Tactics Scales (CTS) (Straus
1979; Hindin, Kishor, and Ansara 2008) were administered and included three types of violence
(physical, sexual, emotional) and controlling behaviors. To correspond with the length of the transfer
period, we asked about violent acts experienced over the past 6 months as well as any violence
experienced by the respondent.
Following WHO and Demographic and Health Survey (DHS) protocol, we construct binary
indicators for the following five behaviors experienced in the last six months: 1) controlling behaviors, 2)
emotional violence only, 3) moderate physical violence, 4) severe physical violence, and 5) any
physical/sexual violence. In the follow-up survey there are six questions that are categorized as
“emotional violence,” four that are categorized as “controlling behavior,” two that are categorized as
“moderate physical violence,” five that are categorized as “severe physical violence,” and two that are
categorized as “sexual violence” (see Appendix Table B.1) for questions and corresponding categories).8
For controlling behaviors, moderate physical violence, and severe physical violence, we create indicators
that equal one if the respondent answered yes to any of the corresponding violence questions within each
category in the last six months. For physical or sexual violence we create an indicator that equals one if
the respondent experienced any of the seven physical violence indicators (two moderate violence
indicators in addition to the five severe violence indicators) or any of the two sexual violence indicators.
Given that emotional violence generally co-occurs with physical and sexual violence, we construct an
emotional violence only indicator for women who experienced one or more acts of emotional aggression
6 Although we were not able to track specific women, or the number of women who accessed services, there were
no adverse events reported by the survey teams in relation to implementation of the IPV module during the baseline
or follow-up survey. 7 Women who were not alone at the time of the interview could not be administered the IPV module. Instead
enumerators were instructed to either find a place where they could be alone, or to come back to the household at
another time when the woman would be alone. If neither of these two options were feasible, then the women was not
administered the IPV module. 8 The baseline survey only had 2 questions on controlling behaviors and 3 on emotional violence.

11
in the past six months but did not experience physical or sexual violence by a partner in the past 6
months.9
A strength of our analysis is that we collected information on direct measures of women’s
empowerment. Although empowerment can be defined in a number of ways across different disciplines,
conceptualization generally refers to “women’s ability to make decisions and affect outcomes of
importance to themselves and their families” (Malhotra, Schuler, and Boender 2002). Within this
definition, researchers have focused on both direct and indirect measures of empowerment. Direct
measures generally focus on the expansion of a woman’s set of available choices and the ability to
transition these choices into desirable outcomes. Indirect, or proxy, measures generally focus on the
possession of resources, both tangible such as assets, or intangible, such as education or social capital,
which may then lead to or facilitate empowerment. Although there are numerous measures and proxies
for women’s empowerment, such as women’s absolute and relative education, age, or security of marital
arrangements, we use a direct measure of women’s decisionmaking within the household.
To measure women’s decisionmaking, we follow the approach used by the DHS, which asks
women to consider their relative decisionmaking power across a number of domains. In both baseline and
follow-up surveys we ask the same woman who answers the IPV module, who in the household generally
has the final say in decisions across eight domains: 1) whether or not the woman works for pay, 2)
children’s education, 3) children’s health, 4) woman’s own health, 5) small daily food purchases, 6) large
food purchases, 7) large asset purchases (such as furniture, TV, etc.), and 8) whether or not to use
contraceptives. The responses to these questions could be the following: (a) the woman herself, (b) her
spouse or partner, (c) the woman and spouse/partner together, (d) someone else in the household, (e) the
woman and someone else together, (d) the decision is not applicable (for example, questions (2) and (3) in
a household without children). We construct an indicator for high sole or joint decisionmaking if the
respondent reports having sole or joint decisionmaking power across all applicable domains. Thus women
with low decisionmaking are those that have no say in one or more decision domains i.e. only the man (or
someone else) can decide regardless of her preferences.
3.3 Study sample and attrition
Of the 2,357 households interviewed at baseline, 2,101 had a female head of household or spouse eligible
to be administered the household decisionmaking or IPV module. From these households, we restrict our
9 We also conducted our analysis using an emotional violence indicator that equals one if a woman experienced one
or more acts of emotional aggression regardless of whether she experienced physical and or sexual violence. Given
that changes in emotional violence may be picking up changes in physical violence which tend to co-occur, we
report impacts on emotional violence only indicator, but results are robust to an emotional violence indicator.

12
analysis to women 15 to 69 years who are married or in unions at baseline, for a total of 1,445 women.10
We exclude women over the age of 69 (18 observations) because IPV is rare among this group and many
of the indirect measures of empowerment, such as employment and labor income, no longer apply. Of the
1,445 women 15 to 69 years in relationships at baseline, 1,425 (or 98.6%) were alone at the time of the
interview and thus administered the IPV module. Of these women, 1,266 were resurveyed at follow-up
and 1,231were alone at the time of the interview and thus administered the IPV module. Thus, the sample
for this analysis consists of 1,231 women ages 15 to 69 years in a relationship at baseline, with baseline
and follow-up data on IPV.
As a consequence of the sensitivity and requirements for being administered the IPV questions
described above, attrition in our sample is relatively high. Of the eligible baseline sample of 1,445 women
age 15-69 years in a relationship, 85% (or 1,231) were administered the IPV questionnaire at baseline and
follow-up. While most of the attrition is due to not finding the same household or women from baseline to
follow-up, 4% is due to the woman not being alone at the time of the interview (either at baseline or
follow-up). If attrition is correlated with treatment assignment, then this could potentially bias the
estimates of the impact of a transfer on IPV. As Table 1 reveals, there are no significant differences in
attrition rates between the control arm and any of the treatment arms.
Although attrition rates are similar across arms, differential attrition across treatment and control
arms could threaten the internal validity of the study. In particular, if women who experience more IPV
leave the treatment arm in greater proportions than the control arm, then our treatment estimates would be
biased because any decrease in IPV would be due to both treatment and differential attrition. Table 2
examines baseline characteristics of eligible women who were administered the IPV module at both
baseline and follow-up (“In study”) and eligible women who were not (“Attrited”). Given the
requirements for being administered the IPV, differences between those in the study sample and those not
in the study sample may exist; however, the internal validity of the study is only threatened if
characteristics of those that attrited are different between treatment and control arms. In order to examine
if differential attrition threatens the internal validity of the study, we focus on columns 7 and 8 of Table 2.
With the exception of the asset index and lifetime prevalence of any violence, there are no significant
differences in baseline characteristics for those who attrited across treatment and control arms. However,
both the asset index and any violence are balanced across treatment and control arms for those who stay
in the study, thus, we conclude that attrition is not a meaningful source of bias in our analysis.
10 Although IPV decreases with age, we do not restrict our sample to the more common age range of 15-49 years
because we are interested in the impact on program participants and not a subsample of participants. Our results,
however, are robust to restricting the analysis to women 15-49 years.

13
3.4 Baseline analysis
To ensure that the success of the initial randomization still holds for the sample of 1,231 women used in
this analysis, we compare baseline characteristics across treatment and control women. Table 3 shows that
randomization was largely effective at balancing baseline characteristics. Across 23 difference-in-means
tests between treatment and control women, only two are statistically different at the 5 percent level. In
particular, women in the control group have significantly larger households and are significantly less
likely to have experienced moderate physical violence from their partner at baseline. While this
imbalance in our outcome variable would most likely lead to an underestimate of our impact results, our
empirical specifications minimize any bias by controlling for baseline levels of violence. Similar balance
tests are conducted across the control arm and each treatment arm and across treatment arms, and again,
show that randomization was in general successful (Appendix Table B.2). Across 138 (23 x 6) difference-
in means tests, 6 are statistically different at the 5 percent level.
Table 3 also reveals that the baseline prevalence of IPV is high among the study sample, with
16% of women experiencing combined physical and/or sexual violence and 13% experiencing emotional
violence only in the previous six months. With regards to severity of physical violence, a higher
percentage of women at baseline experience moderate physical violence as compared to severe physical
violence in the last 6 months (14% versus 7%). Similar to the national prevalence rate of IPV of 48.7%,
lifetime prevalence rate of any violence – emotional, physical, or sexual – in our sample is 49 %. Women
in the study sample have a mean age of 35 years, 39% have at least some secondary education or higher,
and 42% are married. In addition, 36% of women were born in Colombia and 32% report working in the
last 6 months. Almost half (46%) of the women in the sample have high decisionmaking power as defined
by having sole or joint decisionmaking power across all applicable domains. Male partners in the sample
are similar to women in terms of education (38% have at least some secondary education or higher),
however, they are on average four years older and 96% report working in the last 6 months.
Given our interest in investigating whether impacts on IPV are mediated by a woman’s
bargaining power within the household we present cross tabulations of baseline decisionmaking variables
and other indirect measures of empowerment in addition to IPV indicators. Table 4 shows that women
with high decisionmaking power are significantly more likely to have some secondary education, have
worked in the last 6 months, and significantly less likely to have experienced controlling behaviors and
moderate, severe or sexual violence. Interestingly, women with high decisionmaking power are similar to
those with low decisionmaking power in terms of age, marital status, and household poverty, as measured
by the value of monthly per capita consumption.
Finally, since our sample is a unique group of urban and peri-urban residents, we compare key
baseline descriptive statistics in Table 3 to those for women in marriages or partnerships of key age

14
ranges within two other data sources. The first is the baseline data from the government BDH evaluation
collected in 2003-04 and the second is from the fifth round of the national Encuestas de Condiciones de
Vida (ECV) collected in 2005-06 (Appendix Table B.3). For the latter, we report both national statistics
as well as those for the provinces of Carchi and Sucumbíos. Although exact indicators and samples vary,
in general we find that the average woman in our analysis sample is younger than the average woman in
the national ECV data, however older than the average woman in the BDH data. Women in our sample
have comparable education and likelihood of being indigenous and afro-Ecuadorian as in the ECV
province specific sample; however, they are less likely to be married. In comparison to the BDH data,
they reside in households with fewer young children ages 0 to 5 and are more likely (by definition) to be
in urban or peri-urban locations.
4. Methodology
To estimate the impact of transfers on IPV, we take advantage of the randomized experimental design and
conduct an intent-to-treat analysis. This approach avoids bias that may occur due to selection into and out
of the program. Also, with random assignment, the probability that a household is assigned to a treatment
arm is independent of baseline household characteristics. Consequently, systematic differences between
beneficiaries and non-beneficiaries should be eliminated, leaving little risk of bias due to selection effects.
As a result, we can interpret average differences in outcomes across the groups post intervention as being
truly caused by the program.
Moreover, we take advantage of baseline data and estimate the treatment effect using Analysis of
Covariance (ANCOVA), which controls for the lagged outcome variable. ANCOVA estimates are
preferred over difference-in-difference estimates when the autocorrelation of outcomes is low (McKenzie
2012). Intuitively, if autocorrelation is low, then difference-in-difference estimates will overcorrect for
baseline imbalances. ANCOVA estimates on the other hand will adjust for baseline imbalances according
to the degree of correlation between baseline and follow-up and lead to a more efficient estimation of
impact. Given that the autocorrelation between baseline and follow-up of our IPV outcomes is relatively
low (between 0.18 to 0.36) and that the indicators of interest are binary, we estimate the treatment effect
using the following ANCOVA probit model for pooled treatment11:
(1) 𝑃𝑟𝑜𝑏(𝑌𝑖𝑗1 = 1) = Φ(∝ +𝛽𝑇𝑇𝑟𝑒𝑎𝑡𝑗 + 𝛾𝑌𝑖𝑗0 + 𝛿𝑃𝑖𝑗)
where Yij1 is the IPV outcome of interest for woman i from cluster j at follow-up and Yij0 is the IPV
outcome of interest at baseline. As previously mentioned, our five outcomes are measures within the last
11 Results are robust to using a linear probability model.

15
6 months of: 1) any controlling behaviors, 2) emotional violence only, 3) any moderate physical violence,
4) any severe physical violence, and 5) any physical/sexual violence. Φ is the cumulative distribution
function of the standard normal distribution. Treatj is an indicator that equals one if cluster j is in any
treatment arm, and T represents the intent-to-treat estimator, or the effect of being assigned to any
treatment arm. 𝑃𝑖𝑗 is an indicator for the level of stratification or province and equals one if a woman
resides in Carchi at baseline. In all regressions we adjust standard errors for clustering.
Given the relative success of the random assignment, the inclusion of baseline controls is not
necessary to obtain unbiased estimates of . For most estimates, however, we account for baseline
socioeconomic characteristics in order to increase the precision of the estimates and control for any minor
differences between treatment and control arms at baseline. The core group of baseline control variables
are: woman’s age (years), partner’s age (years), indicator for whether woman has at least some secondary
education, indicator for whether partner has at least some secondary education, indicator for whether she
was born in Colombia, indicator for whether woman is married, indicators for whether she is indigenous
or Afro Ecuadorian, indicator for whether she worked in the last 6 months, indicator for whether she has
high sole or joint decisionmaking power, number of children 0–5 years old in the household, number of
children 6–15 years old in the household, household wealth indicators, and indicators for province of
residence. The household wealth indicators (4 indicators, or one for each wealth quartile) are constructed
from a wealth index that is created using the first principal from a principal components analysis (PCA).
Variables used to construct the index are housing infrastructure indicators (for example, type of floor,
roof, toilet, light, fuel, water source) and 11 asset indicators (for example, refrigerator, mobile phone, TV,
car, computer).
To estimate whether the impact on IPV varied by modality, we estimate the following equation:
(2) 𝑃𝑟𝑜𝑏(𝑌𝑖𝑗1 = 1) = Φ(∝ +𝛽𝑓𝑓𝑜𝑜𝑑𝑗 + 𝛽𝑐𝑐𝑎𝑠ℎ𝑗 + 𝛽𝑣𝑣𝑜𝑢𝑐ℎ𝑒𝑟𝑗 + 𝛾𝑌𝑖𝑗0 + 𝛿𝑃𝑖𝑗)
The indicators foodj, cashj, and voucherj are equal to 1 if cluster j is in the corresponding treatment arm.
Coefficients 𝛽𝑓 , 𝛽𝑐 , 𝛽𝑣 represent the intent-to-treat estimators, or the effect of being assigned to the
specific treatment arm. To test whether the estimators are statistically different by treatment arm, we
conduct tests of equality and report the p-values.
Lastly, we estimate the differential effect of treatment by a woman’s baseline decisionmaking
power by creating an interaction term of the pooled treatment indicator (Treatj) with the indicator for
whether or not a woman has high sole or joint decisionmaking power (Di). Specifically, we estimate:
(3) 𝑃𝑟𝑜𝑏(𝑌𝑖𝑗1 = 1) = Φ(∝ +𝛽1𝑇𝑟𝑒𝑎𝑡𝑗 + 𝛽2𝑇𝑟𝑒𝑎𝑡𝑗 ∗ 𝐷𝑖 + 𝜎𝐷𝑖 + 𝛾𝑌𝑖𝑗0 + 𝛿𝑃𝑖𝑗)

16
In this equation, 𝛽1 corresponds to the impact of being in the treatment arm for women with low
decisionmaking power at baseline, while 𝛽1 + 𝛽2 corresponds to the impact of being in the treatment arm
for women with high decisionmaking power at baseline. Thus, 𝛽2 is the differential impact with respect to
decisionmaking of the pooled treatment.
5. Results
5.1 Impact of pooled treatment
Table 5 presents ANCOVA estimates (Equation 1) of the pooled treatment on controlling behaviors and
IPV outcomes. The first column for each outcome presents coefficients controlling only for the level of
stratification (or province) and baseline prevalence, whereas the second column includes the full set of
control variables. Coefficients from probit models are converted to marginal effects evaluated at the mean
of the independent variable. Table 5 reveals that there are significant program impacts leading to
decreases in controlling behaviors, moderate physical, and physical/sexual violence ranging from 6 to 7
percentage points. Compared to baseline averages, these are decreases ranging from 38% for any physical
and/or sexual violence to 43% for moderate physical violence. There are no significant impacts on
emotional violence or severe physical violence. In all cases, the inclusion of control variables has very
little impact on the size or significance of coefficients.
Table 5 also reveals that women who are older, have at least some secondary education, are
married, and did not work in the last 6 months, are less likely to experience controlling behaviors by their
partner. Similarly, women who are married and have fewer children 0-5 years old, are less likely to
experience emotional violence only. Married women are also less likely to experience any physical or
sexual violence in comparison to women in cohabiting unions or other partnerships.
5.2 Impact by treatment modality
Table 6 explores whether there are differences in impact across modalities (Equation 2). For all
estimations we include a full set of control variables, however, we only present the marginal effects of
program impact. P-values from tests of differences on the size of impact across modalities are presented
at the bottom of the table. We find that food transfers result in significant and negative impacts on
moderate physical violence, and physical/sexual violence; cash results in significant and negative impacts
on controlling behaviors and moderate physical violence; and vouchers result in significant and negative
impacts on all three (controlling behaviors, moderate physical, and physical/sexual violence). Impacts for
these three outcomes are similar in magnitude to the pooled treatment effect, ranging from 5 to 8
percentage point reductions. As shown by the p-values at the bottom of the table, the effects across

17
transfer modality are not statistically distinguishable from each other, thus, revealing no significant
differences in impact across modalities.
5.3 Heterogeneous effects
Although we find that on average transfers lead to large decreases in IPV, past research suggests that the
initial condition of bargaining power between the woman and her partner may be an important factor in
realizing impacts. We test for the importance of initial bargaining power by analyzing the interaction
between women’s decisionmaking power and the treatment indicator (Equation 3). Results indicate that
the marginal effect of pooled treatment for women with low sole or joint decisionmaking is large and
significant for 4 out of 5 outcomes. In particular, women with low decisionmaking are 11 percentage
points less likely to experience controlling behaviors, 10 percentage points less likely to experience
moderate physical violence, 5 percentage points less likely to experience severe physical violence, and 11
percentage points less likely to experience any physical/sexual violence (Table 7). The interaction term,
between decisionmaking and the treatment indicator is positive and significant for three out of the five
outcomes, which reveals that the impact on IPV for women with high decisionmaking is significantly
smaller in magnitude than that for women with low decisionmaking. For women with high
decisionmaking, the impact on controlling behaviors and IPV is close to zero across all outcomes.
To demonstrate that these heterogeneous impacts are not a function of other factors related to
decisionmaking, including education, employment or province of residence, we replicate the analysis
controlling simultaneously for interactions between these three additional factors and the pooled treatment
(Table 8). While there is a small decrease in the size of the coefficient of the treatment indicator, the same
general relationship holds for program impact across outcomes and decisionmaking status. In particular,
the decrease in IPV is significantly smaller in magnitude for women with high decisionmaking power.
Finally, we replicate the analysis on heterogeneity with respect to baseline decisionmaking power
by treatment modality (Table 9). In general the food and voucher arms reveal the same pattern: among
low decisionmaking women, transfers lead to large and statistically significant decreases in IPV and this
impact is significantly different from that of women with high decisionmaking power. However, among
women with low decisionmaking power the impact of cash is only significant for moderate physical
violence and any physical/sexual violence. Across controlling behaviors and three IPV outcomes the
impact of cash is smaller than that of food or vouchers and the difference is statistically significant for
controlling behavior. In particular, women with low decisionmaking power who receive vouchers
experience a 15 percentage point reduction in controlling behaviors, while women in households
receiving cash experience a nonsignificant 7 percentage point reduction. For the cash group, the
differential effect with respect to baseline decisionmaking power is not significant for any outcome.

18
6. Possible Mechanisms
While our results provide strong evidence that transfers reduce IPV among the study population,
the pathway or mechanism through which this occurs is unclear. There are a couple of plausible
explanations for why we might see a negative impact of transfers on IPV and no difference across
modalities. The first is related to economic household bargaining models. In these models transfers
improve a woman’s reservation utility, or options outside of marriage, thus strengthening her bargaining
power within the household. In order to keep the woman from leaving the relationship, theory predicts
that her partner would respond to the improvement in her reservation utility by reducing the amount of
violence inflicted on her. If the pathway through which we observe a decrease in IPV is through
improvements in her bargaining power, then we would also expect to see an improvement in other
domains of bargaining such as decisionmaking within the household. However, table 10 reveals that the
transfers did not improve a woman’s decisionmaking as measured by sole/joint decisionmaking across
any of the 8 domains or the high decisionmaking indicator, and in fact worsened decisionmaking with
respect to family planning. One potential reason for a lack of impact on decisionmaking is that the
transfers were short term and beneficiaries understood that the period of transfers was only 6 months.
Consequently, any change in her reservation utility due to an increase in her income is temporary, and
thus may only weakly improve her threat point and bargaining power within the household. Another
possible explanation is that the decisionmaking domains included in the survey do not capture the specific
areas that are most likely to be affected by the transfer, or that the decisionmaking questions in general do
not capture all aspects of empowerment or improvements in bargaining.
Alternatively, the decrease in IPV may be due to reductions in conflict and conflict–related stress
in the relationship. Absolute resource theory and stress theory from sociology predict that IPV decreases
with transfers by improving a household’s economic situation and food security thereby reducing
poverty-related stressors on couples and households (Fox et al. 2002; Vyas 2012). Since arguments over
money is a frequent trigger for violence, reducing poverty-related stress, could reduce IPV. If this is the
case, then we would expect transfers to men or women to have similar impacts on IPV. To further explore
this hypothesis we estimate the impact of transfers on IPV by sex of the household member who usually
received the transfer, however, we do so with the caveat that the sex of the recipient is not exogenous, and
thus should be interpreted with caution. Since the intervention was explicitly targeted and publicized as a
woman-centered program, households in which men receive the transfer are arguably different than those
with female recipients. However if we believe that male recipients are more likely to be controlling, then
we would expect the impact of treatment for male beneficiary households to be biased towards zero.
Results indicate that transfers to both males and females decrease IPV and that there are no significant

19
differences across gender (Table 11), which suggests that decreases in poverty-related stress is a plausible
mechanism through which transfers decrease IPV.
7. Discussion and conclusion
Important policy questions around linkages between IPV and women’s income remain unanswered due to
lack of evidence and consensus on theories and mechanisms. With one in three women experiencing
lifetime IPV globally, and one in three female homicides perpetrated by an intimate partner, it is essential
to better understand how wealth and economic development contribute to declines in prevalence (Stöckl
et al. 2013; WHO 2013). Further, it is crucial that programs and policies that transfer cash or other in-kind
assets or assistance understand how their programs may affect intrahousehold dynamics, including
potential conflict in both intended and unintended ways. The majority of current evidence linking poverty
or wealth and IPV is from cross-sectional analysis and few studies are able to identify casual impacts.
This study uses a randomized design to investigate whether cash, vouchers and food transfers
targeted to women in poor urban areas and intended to reduce poverty and food insecurity also impact
IPV. We find that transfers decrease the probability that a woman experiences controlling behaviors,
moderate physical, and any physical/sexual violence by 6 to 7 percentage points or approximately a 38%-
43% decrease from baseline means. These results are similar in magnitude to studies in Peru, Mexico and
Kenya which find that CTs decreased physical IPV by 5-11 percentage points (Bobonis, Gonzalez-
Brenes, and Castro 2013; Haushofer and Shapiro 2013; Perova 2010). Unlike in Mexico where decreases
in physical violence were accompanied by increases in threats of violence, we find no evidence that
partners use violence to forcefully extract transfers. Instead, we find decreases in violence that are similar
in magnitude across transfer modality. Results from our study provide promising evidence that transfers
not only have the potential to decrease multiple forms of IPV in the short-term, but also that cash – that is
intended to reduce food insecurity - is just as effective as inkind transfers in decreasing IPV.
We also find that initial conditions and power dynamics between partners is important in
determining the magnitude and significance of impacts. In particular, we find that decreases in IPV are
concentrated among woman with low sole or joint decisionmaking power at baseline. These findings are
in contrast to heterogeneous effects found in Ecuador and Peru where impacts are stronger among women
who are relatively advantaged in terms of proxy measures for empowerment (education, fewer children,
and cash paying jobs) (Hidrobo and Fernald 2013; Perova 2010). However, it is clear from the sensitivity
analysis that included interactions for other proxy measures (education and employment in Table 8), that
direct measures such as those used in this study and indirect indicators used in previous studies are
measuring different factors. Further, the large differential effect with respect to baseline decisionmaking
is more pronounced in the food and voucher arms, and not the cash arm. To our knowledge, only one

20
other study uses decisionmaking as a direct measure of bargaining power, and finds that increases in
threats of violence are concentrated among women with moderate or high decisionmaking power in
Mexico’s Oportunidades CCT (Bobonis, Gonzalez-Brenes, and Castro 2013). However, they are unable
to statistically distinguish these impacts from the group of women with low decisionmaking power. Taken
together, the results from our analysis indicate that transfers in certain settings may work to equalize
power dynamics in household with high levels of initial inequity.
Although we cannot isolate the mechanism leading to a decrease in IPV, it is unlikely that the
decrease is due primarily through strengthening a woman’s bargaining power since we find no evidence
of improvements in a woman’s decisionmaking within the household as a result of the transfer. Instead,
we find support for theories related to stress and that by improving a household’s food security and
economic situation, transfers reduced poverty-related stress and conflict, and consequently IPV. Although
we are not able to validate this mechanism due to lack of stress indicators in our data, preliminary
evidence from Kenya’s GiveDirectly evaluation on stress suggest that this is a potential pathway through
which some transfer programmes may affect IPV.
While we find no evidence that transfers are being extracted or leading to conflict within
relationships, we cannot dismiss extraction or male backlash theories completely. The program’s transfers
were framed as part of a wider food security intervention and did not challenge traditional gender roles.
Evidence from our qualitative study supports findings that show that how the intervention is framed and
labeled affects subsequent behavior (Benhassine et al. 2013). Consequently, transfers may not have led to
extraction or conflict because they were perceived to be for the benefit of the entire household and
household nutrition is typically thought of as being a domain traditionally controlled by women and
mothers.
Our study’s uniqueness must be taken into account when generalizing results to other contexts.
First, the sample is a select population of urban poor living in Northern Ecuador, with a high percentage
of Colombian born nationals. Moreover, since households receiving the government social protection
program, BDH, are excluded from the program, the demographics of the study sample exclude many
households with young children. Second, the intervention and period of study was 6 months. The
shortness of the intervention may have led beneficiaries to behave differently than they would have under
a longer term program. Unfortunately, we are limited in our ability to measure anything but short term
impacts of increases in income, although the short 6 month intervention period minimizes the possibility
that impacts are due to selection into marriage or marriage dissolution through divorce. Third, we only
measure violence that is perpetrated by an intimate partner where the aggressor is male and the victim
female. The contribution of violence by a female partner or by other household members is likely to vary
by context and in some regions may result in very different findings and conclusions. Fourth, all transfer

21
recipients participated in monthly nutrition education sessions, which may have had an empowering effect
due to increased information and social networking with fellow recipients in their neighborhoods.
Although we are not able to directly model the potential contribution of these nutrition sessions, our
conclusions by modality would not be affected since all participants received identical exposure and
information. Finally, as previously mentioned, the transfer was labeled and perceived by beneficiaries to
be a transfer intended to improve the nutrition and health of families, which is typically in the domain of
females. A differently framed transfer such as a transfer tied to more male dominated domains, may have
very different impacts.
Although evaluations of CT programs are a promising starting place for research on IPV and
female income, further experiments exploring dynamics with employment, micro-credit and other
economic empowerment programs are equally important. Impacts from employment and micro-credit
programs are likely to differ from those from CT programs, given that employment and micro-finance
may have additional psychological and time allocation effects (Heath 2012). In addition, there is need for
evidence on medium and long-term impacts of transfer programs, carefully accounting for changes in
partnership dynamics, as evidence has shown that the relationship between IPV and income may reverse
over time. Lastly, better data on conflict within the household, stress, and bargaining power are needed in
order to better understand the pathway through which transfers impact IPV.
When designing and implementing transfer programs, it should not be assumed that giving cash
to women will a priori cause larger increases in intrahousehold violence, as compared to inkind transfers.
Indeed, evidence from this study as well as others indicates that on average IPV is likely to decrease as a
result of a transfer. However, there is a lack of understanding on the theories and mechanisms
surrounding IPV and income. Quantitative as well as qualitative work is needed that will validate and
triangulate findings and pathways through which receipt of transfers translate into changes in IPV.
Acknowledgements
We are grateful to the Centro de Estudios de Población y Desarrollo Social (CEPAR) for assistance in
data collection and to WFP (Rome and Quito) for excellent collaboration and program implementation
and in particular to Deborah Hines, Marcelo Moreano, Luis Fernandez, Veronica Molina, Ines Lopez,
Carmen Galarza, and Luis Romero. We would like to thank Ana Buller, Erin Fletcher, Tia Palermo, Dan
Gilligan, and all seminar participants at IFPRI, SVRI Forum, and NEUDC for helpful comments. We
gratefully acknowledge funding from the International Initiative for Impact Evaluation (3ie), the CGIAR
Research Program on Policies, Institutions and Markets, and an anonymous donor. All errors are our own.

22
References
Ackerson, L.K., and SV Subramanian. 2008. Domestic violence and chronic malnutrition among women
and children in India. American journal of epidemiology 167 (10):1188.
Ahmed, Saifuddin, Michael A Koenig, and Rob Stephenson. 2006. Effects of domestic violence on
perinatal and early-childhood mortality: evidence from north India. Journal Information 96 (8).
Aizer, A. 2010. The Gender Wage Gap and Domestic Violence. American Economic Review 100
(4):1847-59.
Aizer, A. 2011. Poverty, Violence, and Health The Impact of Domestic Violence During Pregnancy on
Newborn Health. Journal of Human Resources 46 (3):518-538.
Angelucci, Manuela. 2008. Love on the rocks: Domestic violence and alcohol abuse in rural Mexico. The
BE Journal of Economic Analysis & Policy 8 (1).
Åsling-Monemi, Kajsa, Rodolfo Peña, Mary Carroll Ellsberg, and Lars Åke Persson. 2003. Violence
against women increases the risk of infant and child mortality: a case-referent study in Nicaragua.
Bulletin of the World Health Organization 81 (1):10-16.
Bajracharya, Ashish, and Sajeda Amin. 2013. Microcredit and Domestic Violence in Bangladesh: An
Exploration of Selection Bias Influences. Demography:1-25.
Benhassine, Najy, Florencia Devoto, Esther Duflo, Pascaline Dupas, and Victor Pouliquen. 2013. Turning
a Shove into a Nudge? A “Labeled Cash Transfer” for Education. National Bureau of Economic
Research.
Bloch, F., and V. Rao. 2002. Terror as a bargaining instrument: A case study of dowry violence in rural
India. The American Economic Review 92 (4):1029-1043.
Bobonis, G., and R. Castro. 2010. The role of conditional cash transfers in reducing spousal abuse in
Mexico: Short term vs long term effects.
Bobonis, G., M. Gonzalez-Brenes, and R. Castro. 2013. Public Transfers and Domestic Violence: The
Roles of Private Information and Spousal Control. American Economic Journal: Economic Policy
5 (1):179-205.
Chin, Yoo-Mi. 2011. Male backlash, bargaining, or exposure reduction?: women’s working status and
physical spousal violence in India. Journal of Population Economics 25 (1):175-200.
Coker, A.L., K.E. Davis, I. Arias, S. Desai, M. Sanderson, H.M. Brandt, and P.H. Smith. 2002. Physical
and mental health effects of intimate partner violence for men and women. American Journal of
Preventive Medicine 23 (4):260-268.

23
Devries, K, J Mak, C García-Moreno, M Petzold, J Child, G Falder, S Lim, L Bacchus, R Engell, L
Rosenfeld, C Pallitto, T Vos, N Abrahams, and C Watts. 2013. The Global Prevalence of Intimate
Partner Violence Against Women. Science 340 (6140):1527-1528.
Devries, Karen, Charlotte Watts, Mieko Yoshihama, Ligia Kiss, Lilia Blima Schraiber, Negussie
Deyessa, Lori Heise, Julia Durand, Jessie Mbwambo, and Henrica Jansen. 2011. Violence against
women is strongly associated with suicide attempts: evidence from the WHO multi-country study
on women’s health and domestic violence against women. Social Science & Medicine 73 (1):79-
86.
Ellsberg, M., and L. Heise. 2005. Researching violence against women: a practical guide for researchers
and activists. Washington, DC: World Health Organization, PATH.
Ellsberg, M., L. Heise, R. Peña, S. Agurto, and A. Winkvist. 2001. Researching domestic violence against
women: methodological and ethical considerations. Studies in family planning 32 (1):1-16.
Ellsberg, M., H.A.F.M. Jansen, L. Heise, C.H. Watts, and C. Garcia-Moreno. 2008. Intimate partner
violence and women's physical and mental health in the WHO multi-country study on women's
health and domestic violence: an observational study. The Lancet 371 (9619):1165-1172.
Eswaran, M., and N. Malhotra. 2011. Domestic violence and women's autonomy in developing countries:
theory and evidence. Canadian Journal of Economics/Revue canadienne d'économique 44
(4):1222-1263.
Farmer, A., and J. Tiefenthaler. 1997. An economic analysis of domestic violence. Review of Social
Economy 55:337-358.
Fox, Greer Litton, Michael L Benson, Alfred A DeMaris, and Judy Wyk. 2002. Economic distress and
intimate violence: Testing family stress and resources theories. Journal of Marriage and Family
64 (3):793-807.
García-Moreno, C., H.A.F.M. Jansen, M. Ellsberg, L. Heise, and C. Watts. 2005. WHO multi-country
study on women's health and domestic violence against women: initial results on prevalence,
health outcomes and women's responses: World Health Organization.
Hasselmann, Maria H, and Michael E Reichenheim. 2006. Parental violence and the occurrence of severe
and acute malnutrition in childhood. Paediatric and perinatal epidemiology 20 (4):299-311.
Haushofer, Johannes, and Jeremy Shapiro. 2013. Welfare Effects of Unconditional Cash Transfers:
Evidence from a Randomized Controlled Trial in Kenya. Unpublished Working Paper.
Heath, R. 2012. Women's access to labor market opportunities, control of household resources, and
domestic violence. World Bank Policy Research Working Paper (6149).

24
Heise, L. 2012. Determinants of partner violence in low and middle-income countries:Exploring variation
in individual and population-level risk, Department of Global Health and Development, London
School of Hygiene and Tropical Medicine, London.
Heise, Lori L. 2011. What Works to Prevent Partner Violence? An Evidence Overview. STRIVE Research
Consortium, London School of Hygiene and Tropical Medicine, London, UK.
Hidrobo, M., and L. Fernald. 2013. Cash transfers and domestic violence. Journal of Health Economics
32 (1):304-319.
Hidrobo, M., J. Hoddinott, A. Peterman, A. Margolies, and V. Moreira. 2012. Impact evaluation of cash,
food vouchers, and food transfers among Colombian refugees and poor Ecuadorians in Carchi
and Sucumbios: Final Report. Washington, DC: International Food Policy Research Institute.
Hidrobo, M., J. Hoddinott, A. Peterman, A. Margolies, and V. Moreira. 2014. Cash, Food, or Vouchers?
Evidence from a randomized experiment in northern Ecuador. Journal of Development
Economics 107:144-156.
Hindin, M.J., S. Kishor, and D.L. Ansara. 2008. Intimate partner violence among couples in 10 DHS
countries: Predictors and health outcomes. In DHS Analytical Studies 18. Calverton, Maryland:
Macro International Inc.
Hjort, J. , and E. Villanger. 2011. Backlash: Female employment and domestic violence. Unpublished
manuscript.
Hoddinott, John, and Lawrence Haddad. 1995. Does female income share influence household
expenditures? Evidence from Côte d'Ivoire. Oxford Bulletin of Economics and Statistics 57
(1):77-96.
IACHR. 2011. Report on the Situation of Human Rights in Ecuador. Organization of American States.
INEC. 2011. Encuesta nacional de relaciones familiares y violencia de genero contra las mujeres. Quito,
Ecuador.
Jewkes, Rachel K, Kristin Dunkle, Mzikazi Nduna, and Nwabisa Shai. 2010. Intimate partner violence,
relationship power inequity, and incidence of HIV infection in young women in South Africa: a
cohort study. The Lancet 376 (9734):41-48.
Karamagi, Charles AS, James K Tumwine, Thorkild Tylleskar, and Kristian Heggenhougen. 2007.
Intimate partner violence and infant morbidity: evidence of an association from a population-
based study in eastern Uganda in 2003. BMC pediatrics 7 (1):34.
Koenen, K.C., T.E. Moffitt, A. Caspi, A. Taylor, and S. Purcell. 2003. Domestic violence is associated
with environmental suppression of IQ in young children. Development and Psychopathology 15
(02):297-311.

25
Lundberg, S, and RA Pollak. 1993. Separate spheres bargaining and the marriage market. Journal of
Political Economy 101 (6):988-1010.
Malhotra, Anju, Sidney Ruth Schuler, and Carol Boender. 2002. Measuring Women’s Empowerment as a
Variable in International Development. Background paper prepared for the World Bank
workshop on poverty and gender.
Manser, M, and M Brown. 1980. Marriage and household decision-making: A bargaining analysis.
International Economic Review 21 (1):31-44.
McElroy, MB, and MJ Horney. 1981. Nash-bargained household decisions: Toward a generalization of
the theory of demand. International Economic Review 22 (2):333-349.
McKenzie, D. 2012. Beyond baseline and follow-up: the case for more T in experiments. Journal of
Development Economics 99 (2):210-221.
Perova, E. 2010. Buying out of abuse: how changes in women's income affect domestic violence.
Pronyk, P.M., J.R. Hargreaves, J.C. Kim, L.A. Morison, G. Phetla, C. Watts, J. Busza, and J.D.H. Porter.
2006. Effect of a structural intervention for the prevention of intimate-partner violence and HIV
in rural South Africa: a cluster randomised trial. The Lancet 368 (9551):1973-1983.
Quisumbing, Agnes R, and John A Maluccio. 2000. Intrahousehold allocation and gender relations: New
empirical evidence from four developing countries: International Food Policy Research Institute
Washington, DC.
Sabia, Joseph J, Angela K Dills, and Jeffrey DeSimone. 2013. Sexual Violence against Women and Labor
Market Outcomes. American Economic Review 103 (3):274-78.
Sternberg, K.J., M.E. Lamb, C. Greenbaum, D. Cicchetti, S. Dawud, R.M. Cortes, O. Krispin, and F.
Lorey. 1993. Effects of domestic violence on children's behavior problems and depression.
Developmental psychology 29 (1):44.
Stöckl, Heidi, Karen Devries, Alexandra Rotstein, Naeemah Abrahams, Jacquelyn Campbell, Charlotte
Watts, and Claudia Garcia Moreno. 2013. The global prevalence of intimate partner homicide: a
systematic review. The Lancet.
Straus, M.A. 1979. Measuring intrafamily conflict and violence: The conflict tactics (CT) scales. Journal
of Marriage and the Family:75-88.
Tauchen, H.V., A.D. Witte, and S.K. Long. 1991. Domestic Violence: A Nonrandom Affair.
International Economic Review 32 (2):491-511.
Thomas, Duncan. 1997. Incomes, expenditures, and health outcomes: Evidence on intrahousehold
resource allocation. In Intrahousehold resource allocation in developing countries: Models,
methods, and policy, edited by L. Haddad, J. Hoddinott and H. Alderman. Baltimore: John
Hopkins University Press.

26
USDS. 2011. 2011 Country Reports on Human Rights Practices: Ecuador. US Department of State.
Vega, C. 2004. Ecuador: Questionnaire to Governments on Implementation of the Beijing Platform for
Action (1995) and the Outcome of the Twenty-Third Special Session of the General Assembly
(2000). Quito: National Council for Women, CONAMU.
Vyas, Seema. 2012. Assessing the implications of women’s economic status on intimate partner violence
in urban and rural Tanzania, Department of Global Health and Development, London School of
Hygiene and Tropical Medicine, London.
WFP-Ecuador. 2011. Report on the Cash and Voucher project: Quarterly Report of Monitoring, May-July
2011. Quito: World Food Programme.
WHO. 2001. Putting women first: Ethical and safety recommendations for research on domestic violence
against women.: Department of Gender and Women’s Health, Geneva, Switzerland.
———. 2013. Global and regional estimates of violence against women: Prevalence and health effects of
intimate partner violence and non-partner sexual violence. Geneva: World Health Organization.
Wolfe, D.A., C.V. Crooks, V. Lee, A. McIntyre-Smith, and P.G. Jaffe. 2003. The effects of children's
exposure to domestic violence: A meta-analysis and critique. Clinical Child and Family
Psychology Review 6 (3):171-187.

27
Figures
Figure 1: Flow of Participants and Randomization
80 neighborhoods randomized into treatment and control [1st stage]*
Treatment group
Neighborhoods: n=61
Clusters: n=110
Clusters randomized into food (n=26),
cash (n=40) and voucher (n=44) [2nd
stage]
Control group
Neighborhoods: n=19
Clusters: n=35
Baseline survey (March 2011)
Households: n=1,705
Baseline survey (March 2011)
Households: n=652
Women who were administered the IPV module at baseline
Women: n=1,014
Women who were administered the IPV module at baseline
Women: N=411
Women who were administered the
IPV module at follow-up
Women: n=886
Women who were administered the
IPV module at follow-up
Women: n=345
Baseline women 15-69 years married or
in a union (for analysis)
Women: n=1,031
Baseline women 15-69 years married
or in a union (for analysis)
Women: n=414
Households with female head or
spouse
Households: n=1,517
Households with female head or
spouse
Households: n=584

28
Tables
Table 1: Attrition analysis
Means P-value of difference
Control Pooled Food Cash Voucher Control-
Pooled
Control-
Food
Control-
Cash
Control-
Voucher
Attrition rates 0.17 0.14 0.13 0.15 0.14 0.31 0.28 0.70 0.32
N 414 1,031 289 355 387 P-values are reported from Wald tests on the equality of means of control and different treatment arms. Pooled treatment refers to all three treatment arms. Standard errors are clustered at the cluster level.

29
Table 2: Attrition analysis by baseline characteristics
Control Treatment Difference among attrited
Attrited In study P-value Attrited In study P-value Col(1)-Col(4) P-value
(1) (2) (3) (4) (5) (6) (7) (8)
Mother characteristics
Born in Colombia 0.59 0.39 0.00 0.47 0.34 0.01 0.13 0.15
Age 35.52 35.19 0.84 33.37 34.60 0.29 2.15 0.26
Some secondary education or higher 0.36 0.38 0.73 0.40 0.39 0.84 -0.04 0.64
Married 0.36 0.41 0.50 0.36 0.43 0.14 0.00 0.96
Indigenous 0.06 0.03 0.44 0.08 0.04 0.18 -0.02 0.63
Afro-Ecuadorian 0.07 0.06 0.78 0.03 0.07 0.04 0.04 0.33
Worked in the last 6 months 0.41 0.30 0.06 0.43 0.33 0.01 -0.02 0.74
High sole or joint decisionmaking 0.51 0.51 0.98 0.50 0.44 0.24 0.01 0.88
Partner characteristics
Some secondary education or higher 0.40 0.36 0.53 0.44 0.39 0.30 -0.04 0.64
Age 39.63 39.14 0.74 37.22 38.40 0.40 2.41 0.22
Worked in the last 6 months 0.95 0.96 0.85 0.92 0.96 0.06 0.04 0.30
Household characteristics
Male household head 0.97 0.97 1.00 0.92 0.98 0.03 0.05 0.11
Household size 4.48 4.57 0.72 4.17 4.29 0.38 0.31 0.27
Number of children 0-5 years 0.67 0.72 0.64 0.66 0.76 0.14 0.00 0.97
Number of children 6-15 years 0.72 1.02 0.02 0.83 0.88 0.57 -0.10 0.43
Asset index 0.61 0.69 0.81 -0.25 0.34 0.00 0.86 0.03
Value of total monthly consumption per capita
(USD)
111.85 107.83 0.67 109.30 109.02 0.97 2.56 0.83
IPV indicators
Controlling behavior 0.21 0.17 0.52 0.25 0.17 0.05 -0.04 0.57
Emotional only 0.20 0.15 0.40 0.13 0.13 0.80 0.06 0.28
Moderate physical 0.18 0.11 0.15 0.17 0.15 0.60 0.01 0.85
Severe physical 0.11 0.06 0.28 0.12 0.07 0.17 -0.01 0.81
Physical and or sexual 0.21 0.13 0.15 0.20 0.18 0.45 0.01 0.88
Lifetime any violence 0.59 0.52 0.16 0.45 0.48 0.41 0.15 0.02 P-values are reported from Wald tests on the equality of means of Treatment and Control for each variable. Standard errors are clustered at the cluster level. High sole or joint decisionmaking equals one if a woman has sole or joint decisionmaking over all applicable domains. Lifetime any violence is an indicator that equals one if a women has experienced lifetime emotional, physical, or sexual
violence.

30
Table 3: Baseline means by pooled treatment arm
N All Control Treatment P-value of
diff.
Mother characteristics
Born in Colombia 1,231 0.36 0.39 0.34 0.40
Age 1,231 34.77 35.19 34.60 0.46
Some secondary education or higher 1,231 0.39 0.38 0.39 0.86
Married 1,231 0.42 0.41 0.43 0.77
Indigenous 1,231 0.04 0.03 0.04 0.54
Afro-Ecuadorian 1,231 0.07 0.06 0.07 0.67
Worked in the last 6 months 1,231 0.32 0.30 0.33 0.49
High sole or joint decisionmaking 1,229 0.46 0.51 0.44 0.16
Partner characteristics
Some secondary education or higher 1,224 0.38 0.36 0.39 0.45
Age 1,224 38.61 39.14 38.40 0.37
Worked in the last 6 months 1,224 0.96 0.96 0.96 0.66
Household characteristics
Male household head 1,231 0.98 0.97 0.98 0.51
Household size 1,231 4.37 4.57 4.29 0.02
Number of children 0-5 years 1,231 0.75 0.72 0.76 0.52
Number of children 6-15 years 1,231 0.92 1.02 0.88 0.06
Asset index 1,231 0.44 0.69 0.34 0.10
Value of total monthly consumption per capita (USD) 1,228 108.69 107.83 109.02 0.84
IPV indicators
Controlling behavior 1,231 0.17 0.17 0.17 0.82
Emotional only 1,231 0.13 0.15 0.13 0.29
Moderate physical 1,231 0.14 0.11 0.15 0.04
Severe physical 1,231 0.07 0.06 0.07 0.56
Physical and or sexual 1,231 0.16 0.13 0.18 0.06
Lifetime any violence 1,231 0.49 0.52 0.48 0.25 P-values are reported from Wald tests on the equality of means of Treatment and Control for each variable. Standard errors are clustered at the cluster level. High sole or joint decisionmaking equals one if a woman has sole or joint decisionmaking over all applicable domains. Lifetime any violence is an indicator
that equals one if a women has experienced lifetime emotional, physical, or sexual violence.
Table 4: Baseline means on women’s empowerment and IPV indicators, by decisionmaking status
Low decisionmaking High decisionmaking P-value of
difference
Age 34.53 35.09 0.45
Some secondary education or higher 0.33 0.45 0.00
Married 0.41 0.44 0.31
Worked in the last 6 months 0.27 0.38 0.00
Value of total monthly consumption per capita (USD) 94.61 100.57 0.11
IPV indicators
Controlling behavior 0.21 0.13 0.00
Emotional only 0.15 0.12 0.15
Moderate physical 0.17 0.10 0.00
Severe physical 0.09 0.05 0.01
Physical and or sexual 0.20 0.11 0.00 P-values are reported from Wald test on the equality of means of low and high decisionmaking for each variable. Standard errors are clustered at the cluster
level.

31
Table 5: Impact of pooled treatment on IPV measures
Controlling Emotional Only Moderate physical Severe physical Physical or Sexual
Pooled Treatment -0.06 -0.07 0.00 0.00 -0.06 -0.06 -0.02 -0.02 -0.06 -0.06 (0.03)** (0.03)** (0.02) (0.02) (0.02)** (0.02)** (0.02) (0.02) (0.03)** (0.03)**
Born in Colombia -0.04 -0.01 -0.02 -0.02 -0.04
(0.03) (0.03) (0.02) (0.02) (0.02)*
Age -0.00 0.00 0.00 0.00 -0.00
(0.00)** (0.00) (0.00) (0.00) (0.00)
Some secondary education or higher -0.07 -0.03 0.00 -0.02 0.01 (0.03)** (0.03) (0.02) (0.02) (0.03)
Married -0.07 -0.05 -0.04 -0.02 -0.05
(0.03)** (0.02)** (0.02) (0.02) (0.02)**
Indigenous 0.04 0.00 -0.08 -0.02 -0.01
(0.07) (0.05) (0.05) (0.04) (0.05)
Afro-Ecuadorian -0.05 -0.05 0.00 0.02 0.01 (0.06) (0.04) (0.04) (0.03) (0.04)
Worked in the last 6 months 0.06 0.02 -0.00 0.01 0.01
(0.03)** (0.02) (0.02) (0.02) (0.02)
High sole or joint decisionmaking -0.02 -0.02 -0.02 -0.02 -0.02
(0.03) (0.02) (0.02) (0.02) (0.02)
Partner has some secondary education or higher 0.03 0.02 -0.01 -0.03 -0.01 (0.03) (0.02) (0.02) (0.02)* (0.02)
Partner's age 0.00 0.00 -0.00 -0.00 -0.00
(0.00) (0.00) (0.00) (0.00) (0.00)
Number of children 0-5 years in household 0.02 0.03 -0.00 0.02 0.00
(0.02) (0.01)** (0.01) (0.01)* (0.01)
Number of children 6-15 years in household 0.01 0.00 0.00 0.00 0.01 (0.01) (0.01) (0.01) (0.01) (0.01)
Wealth index: 2nd quartile -0.00 0.00 -0.06 -0.03 -0.06
(0.04) (0.04) (0.03)* (0.03) (0.03)*
Wealth index: 3rd quartile 0.05 -0.01 -0.03 -0.01 -0.02
(0.04) (0.03) (0.03) (0.03) (0.03)
Wealth index: 4th quartile 0.05 0.03 -0.05 -0.00 -0.02 (0.04) (0.03) (0.03) (0.03) (0.03)
Carchi -0.06 -0.05 -0.08 -0.07 0.01 0.01 0.01 0.00 0.00 0.01
(0.03)** (0.03) (0.02)*** (0.02)*** (0.02) (0.02) (0.02) (0.02) (0.03) (0.03)
Baseline controlling 0.30 0.28
(0.03)*** (0.03)***
Baseline emotional only 0.16 0.15 (0.02)*** (0.02)***
Baseline moderate physical violence 0.22 0.21
(0.02)*** (0.02)*** Baseline severe physical violence 0.21 0.20
(0.02)*** (0.02)***
Baseline physical and or sexual 0.26 0.25 (0.02)*** (0.02)***
N 1,231 1,224 1,231 1,224 1,231 1,224 1,231 1,224 1,231 1,224
Pseudo R2 0.06 0.09 0.04 0.06 0.11 0.12 0.11 0.13 0.12 0.13
Standard errors in parenthesis clustered at the cluster level. * p<0.1 ** p<0.05; *** p<0.01

32
Table 6: Impact of treatment modalities on IPV measures
Controlling Emotional
Only
Moderate
Physical
Severe
Physical
Physical or
sexual
Treatment==Food -0.06 0.01 -0.06 -0.02 -0.07
(0.04) (0.03) (0.03)** (0.03) (0.04)**
Treatment==Cash -0.08 -0.02 -0.05 -0.01 -0.05
(0.04)** (0.03) (0.03)* (0.03) (0.03)
Treatment==Voucher -0.06 0.01 -0.05 -0.03 -0.06
(0.03)* (0.03) (0.03)* (0.02) (0.03)*
N 1,224 1,224 1,224 1,224 1,224
Pseudo R2 0.09 0.06 0.12 0.13 0.13
P-value: Food=Voucher 0.97 0.94 0.75 0.86 0.60
P-value: Cash=Voucher 0.60 0.21 0.94 0.53 0.86
P-value: Food=Cash 0.65 0.30 0.69 0.67 0.51
Standard errors in parenthesis clustered at the cluster level. * p<0.1 ** p<0.05; *** p<0.01. All estimations control for women characteristics (age, education, ethnicity, race, marital status, employment status, decision-making power); partner characteristics (age and education), household characteristics (number of children 0-5, number of children 6-
15, wealth quartiles), baseline outcome variable, and contain province fixed effects.

33
Table 7: Differential impact with respect to baseline decisionmaking power
Controlling Emotional
Only
Moderate
Physical
Severe
Physical
Physical or
sexual
Pooled Treatment -0.11 0.00 -0.10 -0.05 -0.11
(0.04)*** (0.03) (0.03)*** (0.02)** (0.04)***
Pooled Treatment X High sole or joint decisionmaking 0.08 -0.01 0.10 0.08 0.10
(0.06) (0.05) (0.04)*** (0.03)*** (0.04)**
High sole or joint decisionmaking -0.07 -0.02 -0.09 -0.08 -0.10
(0.05) (0.04) (0.03)*** (0.03)*** (0.04)***
N 1,224 1,224 1,224 1,224 1,224
Pseudo R2 0.09 0.06 0.13 0.14 0.14
Treatment effect for women with high sole or joint decisionmaking -0.03 -0.00 0.00 0.03 -0.00
(0.04) (0.04) (0.03) (0.03) (0.03) Standard errors in parenthesis clustered at the cluster level. * p<0.1 ** p<0.05; *** p<0.01. All estimations control for women characteristics (age, education, ethnicity, race, marital
status, employment status, decision-making power); partner characteristics (age and education), household characteristics (number of children 0-5, number of children 6-15, wealth
quartiles), baseline outcome variable and contain province fixed effects.

34
Table 8: Differential impact with respect to baseline decision making power, controlling for confounding factors
Controlling Emotional
Only
Moderate
Physical
Severe
Physical
Physical or
sexual
Pooled Treatment -0.11 -0.01 -0.07 -0.03 -0.07
(0.05)** (0.04) (0.03)** (0.03) (0.04)*
Pooled Treatment X High sole or joint decisionmaking 0.08 0.01 0.09 0.08 0.08
(0.06) (0.05) (0.04)** (0.03)** (0.04)*
High sole or joint decisionmaking -0.07 -0.02 -0.08 -0.08 -0.08
(0.05) (0.04) (0.03)** (0.03)*** (0.04)**
Pooled Treatment X Some secondary education or higher 0.08 -0.02 0.06 0.06 0.07
(0.07) (0.07) (0.04) (0.04) (0.05)
Some secondary education or higher -0.13 -0.02 -0.04 -0.07 -0.04
(0.06)** (0.06) (0.04) (0.04)* (0.04)
Pooled Treatment X Worked in the last 6 months -0.09 -0.02 -0.01 -0.09 -0.05
(0.06) (0.05) (0.04) (0.03)** (0.04)
Worked in the last 6 months 0.12 0.03 0.01 0.07 0.05
(0.06)** (0.05) (0.04) (0.03)** (0.04)
Pooled treatment X Carchi 0.00 0.06 -0.09 -0.03 -0.11
(0.07) (0.05) (0.05)* (0.04) (0.06)*
Carchi -0.05 -0.11 0.07 0.02 0.08
(0.07) (0.05)** (0.05) (0.04) (0.06)
N 1,224 1,224 1,224 1,224 1,224
Pseudo R2 0.09 0.06 0.14 0.15 0.15
Standard errors in parenthesis clustered at the cluster level. * p<0.1 ** p<0.05; *** p<0.01. All estimations control for women characteristics (age, education, ethnicity, race, marital status, employment status, decision-making power); partner characteristics (age and education), household characteristics (number of children 0-5, number of children 6-15, wealth quartiles),
baseline outcome variable, and contain province fixed effects.

35
Table 9: Differential impact with respect to baseline decisionmaking power, by treatment modalities
Controlling Emotional
Only
Moderate
Physical
Severe
Physical
Physical or
sexual
Treatment==Food -0.10 0.01 -0.11 -0.06 -0.14
(0.06)* (0.04) (0.04)*** (0.03)* (0.05)***
Treatment==Cash -0.07 -0.02 -0.09 -0.03 -0.07
(0.05) (0.04) (0.04)** (0.03) (0.04)*
Treatment==Voucher -0.15 0.02 -0.10 -0.08 -0.11
(0.05)*** (0.04) (0.04)*** (0.03)** (0.04)***
Food Treatment X High sole or joint decisionmaking 0.07 0.01 0.12 0.09 0.15
(0.07) (0.06) (0.05)** (0.04)** (0.05)***
Cash Treatment X High sole or joint decisionmaking -0.04 -0.00 0.08 0.04 0.04
(0.07) (0.06) (0.05) (0.04) (0.05)
Voucher Treatment X High sole or joint decisionmaking 0.20 -0.02 0.12 0.12 0.13
(0.07)*** (0.06) (0.05)** (0.04)*** (0.05)**
High sole or joint decisionmaking -0.08 -0.02 -0.09 -0.08 -0.10
(0.05) (0.04) (0.03)*** (0.03)*** (0.04)***
N 1,224 1,224 1,224 1,224 1,224
Pseudo R2 0.09 0.06 0.13 0.14 0.14
P-value: Food=Voucher 0.33 0.78 0.82 0.61 0.54
P-value: Cash=Voucher 0.06 0.35 0.57 0.11 0.28
P-value: Food=Cash 0.58 0.54 0.44 0.31 0.11
Standard errors in parenthesis clustered at the cluster level. * p<0.1 ** p<0.05; *** p<0.01.All estimations control for women characteristics (age, education, ethnicity, race, marital status, employment status, decision-making power); partner characteristics (age and education), household characteristics (number of children 0-5, number of children 6-15, wealth quartiles),
baseline outcome variable, and contain province fixed effects.
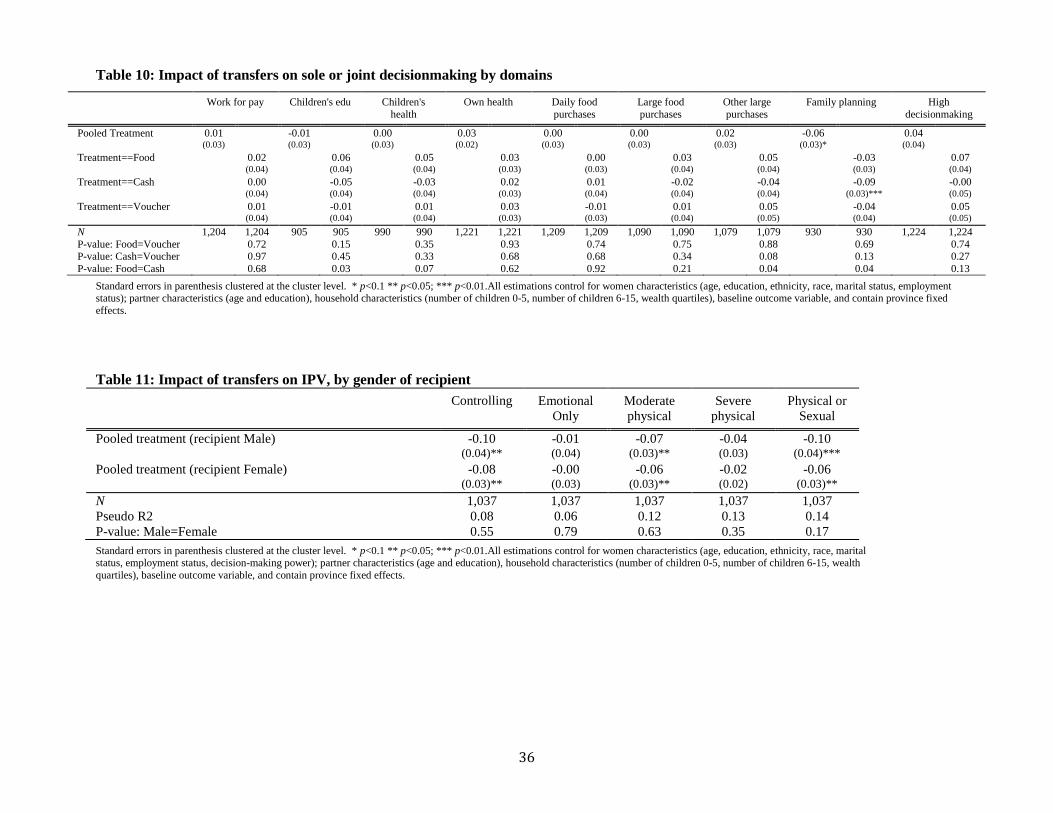
36
Table 10: Impact of transfers on sole or joint decisionmaking by domains
Work for pay Children's edu Children's
health
Own health Daily food
purchases
Large food
purchases
Other large
purchases
Family planning High
decisionmaking
Pooled Treatment 0.01 -0.01 0.00 0.03 0.00 0.00 0.02 -0.06 0.04 (0.03) (0.03) (0.03) (0.02) (0.03) (0.03) (0.03) (0.03)* (0.04)
Treatment==Food 0.02 0.06 0.05 0.03 0.00 0.03 0.05 -0.03 0.07
(0.04) (0.04) (0.04) (0.03) (0.03) (0.04) (0.04) (0.03) (0.04)
Treatment==Cash 0.00 -0.05 -0.03 0.02 0.01 -0.02 -0.04 -0.09 -0.00
(0.04) (0.04) (0.04) (0.03) (0.04) (0.04) (0.04) (0.03)*** (0.05)
Treatment==Voucher 0.01 -0.01 0.01 0.03 -0.01 0.01 0.05 -0.04 0.05 (0.04) (0.04) (0.04) (0.03) (0.03) (0.04) (0.05) (0.04) (0.05)
N 1,204 1,204 905 905 990 990 1,221 1,221 1,209 1,209 1,090 1,090 1,079 1,079 930 930 1,224 1,224
P-value: Food=Voucher 0.72 0.15 0.35 0.93 0.74 0.75 0.88 0.69 0.74 P-value: Cash=Voucher 0.97 0.45 0.33 0.68 0.68 0.34 0.08 0.13 0.27
P-value: Food=Cash 0.68 0.03 0.07 0.62 0.92 0.21 0.04 0.04 0.13
Standard errors in parenthesis clustered at the cluster level. * p<0.1 ** p<0.05; *** p<0.01.All estimations control for women characteristics (age, education, ethnicity, race, marital status, employment status); partner characteristics (age and education), household characteristics (number of children 0-5, number of children 6-15, wealth quartiles), baseline outcome variable, and contain province fixed
effects.
Table 11: Impact of transfers on IPV, by gender of recipient
Controlling Emotional
Only
Moderate
physical
Severe
physical
Physical or
Sexual
Pooled treatment (recipient Male) -0.10 -0.01 -0.07 -0.04 -0.10
(0.04)** (0.04) (0.03)** (0.03) (0.04)***
Pooled treatment (recipient Female) -0.08 -0.00 -0.06 -0.02 -0.06
(0.03)** (0.03) (0.03)** (0.02) (0.03)**
N 1,037 1,037 1,037 1,037 1,037
Pseudo R2 0.08 0.06 0.12 0.13 0.14
P-value: Male=Female 0.55 0.79 0.63 0.35 0.17
Standard errors in parenthesis clustered at the cluster level. * p<0.1 ** p<0.05; *** p<0.01.All estimations control for women characteristics (age, education, ethnicity, race, marital status, employment status, decision-making power); partner characteristics (age and education), household characteristics (number of children 0-5, number of children 6-15, wealth
quartiles), baseline outcome variable, and contain province fixed effects.

37
Appendix
A. Figures
Figure A.1 Map of intervention provinces and urban centers

38
B. Tables
Table B.1 Intimate Partner Violence questions
Cuando dos personas se casan o viven juntas, ellos usualmente comparten los buenos y los malos
momentos.
¿Su esposo (compañero/pareja) alguna vez:
1 = Si,
2 = No, >> Siguiente
pregunta
¿En los últimos 6
meses?
1 = Si
2 = No
Su esposo (compañero) alguna vez: 1 = Si,
2 = No >> Siguiente
pregunta
En los últimos
6 meses?
1 = Si
2 = No
A B A B
T10 Le acusó de serle infiel? (Controlling
behaviors)
T28 Le humilló o insulto en frente de otras
personas? (Emotional violence)
T11 Trató de limitarle sus contactos con su familia
con el objeto de hacerla sentir mal?
(Controlling behaviors)
T19 La trató de estrangularla o quemarla? (Severe
physical violence)
T20 La atacó/agredió con un cuchillo, pistola u
otro tipo de arma? (Severe physical violence)
T12 La humilló o insultó en términos como “no
sirves para nada,” “nunca haces nada,” o “eres
una bruta.” (Emotional violence)
T21 La amenazó con un cuchillo, pistola u otro
tipo de arma? (Severe physical violence)
T13 La amenazó con abandonarla? (Emotional
violence)
T22 Ha utilizadó la fuerza física para obligarla a
tener relaciones sexuales aunque usted no
quería? (Sexual violence)
T14 La amenazó con quitarle a sus hijos?
(Emotional violence)
T23 La obligó a realizar actos sexuales que usted
no aprueba? (Sexual violence)
T24 La amenazó con hacerle daño a usted o a
alguien que sea importante para usted?
(Emotional violence)
T15 La empuja, sacude o le tira algo? (Moderate
physical violence)
T25 Trató de limitar sus contactos con amigos(as)?
(Controlling behaviors)
T16 La abofeteó le retorció el brazo? (Moderate
physical violence)
T26 Quiso saber en donde esta en todo momento?
(Controlling behaviors)
T17 La golpeó con el puño o con algo que pudo
hacerle daño? (Severe physical violence)
T27 Le ignoró o fue indiferente con usted?
(Emotional violence)
T18 La ha pateadó o arrastradó? (Severe physical
violence)

39
Table B.2 Baseline means by intervention arms
Means P-value of diff.
N Control Food Cash Voucher Food -
Control
Cash -
Control
Voucher
-Control
Food -
Cash
Food -
Voucher
Cash -
Voucher
(1) (2) (3) (4) (5) (6) (7) (8) (9) (10) (11)
Mother characteristics
Born in Colombia 1,231 0.39 0.32 0.37 0.33 0.35 0.76 0.36 0.46 0.87 0.47
Age 1,231 35.19 34.08 34.91 34.72 0.32 0.79 0.66 0.50 0.62 0.88
Some secondary education or higher 1,231 0.38 0.35 0.39 0.42 0.61 0.94 0.45 0.57 0.22 0.52
Married 1,231 0.41 0.43 0.41 0.43 0.75 0.98 0.73 0.74 0.98 0.72
Indigenous 1,231 0.03 0.04 0.05 0.04 0.95 0.40 0.69 0.46 0.74 0.69
Afro-Ecuadorian 1,231 0.06 0.03 0.10 0.07 0.18 0.18 0.70 0.01 0.13 0.39
Worked in the last 6 months 1,231 0.30 0.33 0.34 0.31 0.47 0.43 0.86 0.94 0.61 0.56
High sole or joint decisionmaking 1,229 0.51 0.47 0.46 0.41 0.46 0.35 0.06 0.86 0.22 0.26
Partner characteristics
Some secondary education or higher 1,224 0.36 0.39 0.39 0.40 0.60 0.62 0.42 0.97 0.82 0.78
Age 1,224 39.14 37.66 38.11 39.21 0.24 0.30 0.95 0.73 0.25 0.32
Worked in the last 6 months 1,224 0.96 0.96 0.97 0.97 0.84 0.50 0.59 0.41 0.46 0.84
Household characteristics
Male household head 1,231 0.97 0.96 0.98 0.98 0.66 0.29 0.30 0.21 0.20 0.90
Household size 1,231 4.57 4.36 4.36 4.19 0.21 0.14 0.00 0.97 0.32 0.21
Number of children 0-5 years 1,231 0.72 0.81 0.72 0.75 0.25 0.98 0.72 0.28 0.44 0.74
Number of children 6-15 years 1,231 1.02 0.86 0.92 0.85 0.18 0.34 0.05 0.60 0.93 0.42
Asset index 1,231 0.69 0.31 0.22 0.49 0.21 0.05 0.35 0.75 0.50 0.16
Value of total monthly consumption per
capita (USD) 1,228 107.83 110.35 108.83 108.18 0.79 0.89 0.96 0.87 0.81 0.91
IPV indicators
Controlling behavior 1,231 0.17 0.17 0.15 0.18 0.98 0.50 0.92 0.48 0.94 0.41
Emotional only 1,231 0.15 0.13 0.11 0.13 0.49 0.17 0.61 0.65 0.80 0.40
Moderate physical 1,231 0.11 0.15 0.15 0.16 0.12 0.19 0.06 0.80 0.82 0.62
Severe physical 1,231 0.06 0.05 0.07 0.10 0.43 0.90 0.12 0.38 0.02 0.17
Physical and or sexual 1,231 0.13 0.17 0.16 0.19 0.20 0.26 0.04 0.83 0.54 0.39
Lifetime any violence 1,231 0.52 0.49 0.46 0.49 0.49 0.17 0.50 0.52 0.96 0.48
Columns 2-5 report baseline means by intervention arm for women in the study analysis. Columns 6-11 report p-values from tests on the equality of means for each variable. Standard errors are clustered at the cluster level. High sole or joint decisionmaking equals one if a woman has sole or joint decisionmaking over all applicable domains. Lifetime any violence is an indicator that equals one
if a women has experienced lifetime emotional, physical, or sexual violence

40
Table B.3: Comparison of baseline means of women in marriage or partnership within key age
ranges by data source
(A) (B) (C)
Cash and
voucher
evaluation
baseline data
among women
aged 15 to 69
(2011)
Bono Desarollo
Humano
evaluation
baseline data
among mothers of
eligible pre-school
aged children
(2003-04)
Encuestas de Condiciones de Vida
5th round data among women aged
15 to 69 (2005-06)
National sample
Carchi and
Sucumbíos
Provinces
N Mean N Mean N Mean N Mean
Woman's characteristics
Born in Colombia 1,231 0.36 NA NA NA NA NA NA
Age 1,231 34.77 1,250 23.6 9,017 39.74 509 40.03
Some secondary education or higher 1,231 0.39 1,250 7.54a 9,017 0.46 509 0.39
Married 1,231 0.42 1,250 0.45 9,017 0.69 509 0.74
Indigenous 1,231 0.04 1,250 0.05 9,017 0.11 509 0.04
Afro-Ecuadorian 1,231 0.07 1,250 0.10 9,017 0.05 509 0.06
Partner characteristics
Some secondary education or higher 1,224 0.38 1,250 7.31a 9,017 0.46 509 0.36
Age 1,224 38.61 NA NA 9,017 43.69 509 44.14
Household characteristics
Male household head 1,231 0.98 NA NA 9,017 0.99 509 0.98
Household size 1,231 4.37 NA NA 9,017 4.68 509 4.54
Number of children 0-5 years 1,231 0.75 1,250 1.78 9,017 0.71 509 0.62
Number of children 6-15 years 1,231 0.92 NA NA 9,017 1.15 509 1.17
Urban or peri-urban 1,231 1.00 1,250 0.51b 9,017 0.58b 509 0.49b
Sample A comes from the evaluation data and is equal to the descriptive statistics reported in Table 3. Sample B comes from the
Bono Desarollo Humano evaluation data as reported in Hidrobo and Fernald (2013). Sample C data are author’s calculations from
the fifth round of the Encuestas de Condiciones de Vida from 2005-06.
a Reported as years of schooling; b Defined as urban only