the effect of availability and distance from school on … effect of availability and distance from...
TRANSCRIPT

1.
The effect of availability and distancefrom school on children’s time allocation in Ghana and Guatemala
D. Vuri
May 2007
Und
erst
andi
ng C
hild
ren’
s Wor
k Pr
ojec
t Wor
king
Pap
er S
erie
s, M
ay 2
007


The effect of availability and distance from school on children’s time allocation in Ghana and Guatemala
D. Vuri*
Working Paper May 2007
Understanding Children’s Work (UCW) Project
University of Rome “Tor Vergata” Faculty of Economics
V. Columbia 2 00133 Rome Tor Vergata
Tel: +39 06.7259.5618 Fax: +39 06.2020.687
Email: [email protected]
As part of broader efforts toward durable solutions to child labor, the International Labour Organization (ILO), the United Nations Children’s Fund (UNICEF), and the World Bank initiated the interagency Understanding Children’s Work (UCW) project in December 2000. The project is guided by the Oslo Agenda for Action, which laid out the priorities for the international community in the fight against child labor. Through a variety of data collection, research, and assessment activities, the UCW project is broadly directed toward improving understanding of child labor, its causes and effects, how it can be measured, and effective policies for addressing it. For further information, see the project website at www.ucw-project.org.
This paper is part of the research carried out within UCW (Understanding Children's Work), a joint ILO, World Bank and UNICEF project. The views expressed here are those of the authors' and should not be attributed to the ILO, the World Bank, UNICEF or any of these agencies’ member countries.
* University of Rome Tor Vergata, CHILD, IZA and CESifo

The effect of availability and distance from school on children’s time allocation in Ghana and Guatemala
Working Paper May 2007
ABSTRACT
In this paper we present evidence on the impact of distance to school and school availability on households’ decisions concerning primary age children’s time allocation between work, schooling and household chores activities using data from the Ghana Living Standard Survey 1998-99 (GLSS) and the Guatemalan Living Standards Measurement Survey 2000 (ENCOVI). Overall, our results indicate that the increased and eased access to school has a well-defined impact on children’s time use with both similarities and striking dissimilarities between the chosen countries. In particular, in Ghana the availability and the travel distance from schools (both primary and middle) in the community influence children’s work in both economic activities and household chores and school attendance. The longer the travel time to school the more difficult is for children to reconcile work and school attendance. In Guatemala, secondary school access constraints have almost no effect on children’s time allocation. In addition, reducing the cost of access to primary education has an effect only on children’s school attendance but it does reduce neither child work nor time spent in household chores. Our results are robust to control for the endogeneity of school placement and per capita expenditures.


The effect of availability and distance from school on children’s time allocation in Ghana and Guatemala
Working Paper May 2007
CONTENTS
1. Introduction ..................................................................................................................................... 1 2. Review of the literature .................................................................................................................. 3 3. Theoretical Framework .................................................................................................................. 4 4. Empirical strategy ............................................................................................................................ 5 5. Data and variables ........................................................................................................................... 7
5.1 The Ghana Living Standard Survey 1998-99 (GLSS) ......................................................... 7 5.2 The Guatemalan Living Standards Measurement Survey 2000 ....................................... 10
6. Child work, schooling and household chores activities: some descriptive evidence .......... 12
6.1 Ghana ........................................................................................................................................ 12 6.2 Guatemala................................................................................................................................. 19
7. Regression results .......................................................................................................................... 27
7.1 The working and schooling decisions in Ghana ................................................................ 27 7.2 The working and schooling decisions in Guatemala ......................................................... 32 7.3 The working, schooling and household chores decisions in Ghana ............................... 37 7.4 The working, schooling and household chores decisions in Guatemala ....................... 42
8. Robustness checks ......................................................................................................................... 45
8.1 Ghana ........................................................................................................................................ 45 8.2 Guatemala................................................................................................................................. 49
9. Conclusion ...................................................................................................................................... 51 References .................................................................................................................................................... 53 Appendix ...................................................................................................................................................... 56
1 UCW WORKING PAPER SERIES, MAY 2007
1. INTRODUCTION 1. There is almost universal agreement that child labor is undesirable because it negatively affects a child’s future welfare in exchange of immediate benefit. The benefits to the household of sending children to work are the income of the child and the reduced schooling expenditures for not sending him/her to school. However, work early in life has a cost for children in terms of lower future earnings when entering the labor market as adults due to the lower educational attainment obtained during childhood. In addition, there are clear spillover effects: more educated children once adults will raise healthier children affected by lower morbidity and lower mortality rates. 2. Despite the acknowledgment that work by children may be harmful for them, child work is a widespread phenomena in the developing word. The International Labor Office (2006) estimates that about 191 million children aged 5-14 years were working in 2004. Of these working children, 74 million were in “hazardous” work, and 108 million were below the age of 12 years. Moreover, the UNESCO estimates that about one out of five primary school aged children were not enrolled in school. Regionally, the ILO estimates that Asia has the largest number of child workers, but the incidence is highest in Africa (about 1 in 4 children younger than 15 years are economically active in Africa, as compared to 1 in 5 in the Asia-Pacific region, and 1 in 20 in Latin America and the Caribbean). For these children, the primary cost of child work is the reduction in investment in their human capital and this occurs mainly because child work interferes with schooling, yielding to not-attendance or early drop-out and entry into full-time work. 3. School represents the most important means of drawing children away from the labor market (ILO 1992). Two channels have been mainly used to improve access to education for poor households in developing countries: investments in infrastructure on one side (supply side) and subsidies to investment in education by the poor and school quality improvement on the other (demand side). The relative importance of school supply versus household demand factors has serious implications for education policy.2 In many developing countries, especially in rural areas, supply constraints, such as difficult access to schools in terms of high distance from the nearest school or high travel cost, might have a non negligible effect on children's time allocation. Furthermore, schooling costs may not be constant throughout the education cycle, and supply constraints on middle and secondary education could be part of the reason why so many children in developing countries do not attend school at all or drop out of the primary school. In addition, not only direct costs (tuition fees and travel time) but also the indirect costs of schooling (the opportunity costs of time spent in school instead of working), can vary in the course of the schooling cycle. In this context, it is important to understand the dynamics of the households’ decision making concerning children’s activities. If not, public investments in education are not likely to reach the
2 For example, if children enrollment and attendance rates do not depend on local school infrastructure, the construction of new schools will have negligible effect on overall schooling levels and working rates and it would lead to a waste of resources. In this case, policymakers would make it better to direct the marginal efforts on the demand side of the problem.
2 THE EFFECT OF AVAILABILITY AND DISTANCE FROM SCHOOL ON CHILDREN’S TIME ALLOCATION IN GHANA AND GUATEMALA
goal to get children into classrooms and to reduce children work (both in economic activities and in household chores).3 4. In this paper we exploit the role of specific supply side factors (and in particular availability and distance-to-school) in determining households’ decisions about children’s time use. We focus on primary school age children in Ghana and in Guatemala and we examine cross-country differences on these categories. The two chosen countries, Ghana and Guatemala, provide considerable heterogeneity through their datasets to make the results interesting. We are not the first ones to investigate empirically the effect of availability and distance-to-school on children’s work and schooling, but we will extend previous work by including children’s household chores activity in the parental decision set. We explicitly recognize that, although the definition of child work used in the literature and explained in footnote 2 usually excludes household chores such as fetching wood, water, cooking, cleaning and child care and similar activities undertaken by a boy or girl in the household, the implication for child welfare of being engaged in these activities might not be less important than work and they could interfere with formal education as much as work, especially for girls.4 Therefore, in our analysis we ask how households respond to the presence of schools and variations in the travel distance to schools when deciding about children’s time allocation between schooling, work and household chores activities. We also explore whether family choices differ by children’s sex. Finally, we deal with two important problems related to the endogeneity of school placements and per-capita expenditure and we check the robustness of our results once we control for these two potential sources of bias in our estimates. 5. Our empirical analysis shows there is substantial heterogeneity in household responses across the two countries. In particular, reducing the distance from primary school encourages children school attendance in both Ghana and Guatemala, but it reduces child work and household chores activities only in Ghana. Similarly, improved access to middle schools through shorter travel distances helps to reduce child work only in Ghana. When looking at the availability of primary school, school attendance increases in both countries but it discourages household chores activities only in Ghana. In addition, increasing the availability of secondary schools in the villages would reach the goal of reducing child work only in Guatemala. Finally, effects of availability and distance to schools on children’s time allocation are differentiated by gender, pointing to the need for different policy approaches for reducing girls’ and boys’ work and household chores activities and for increasing girls’ and boys’ school attendance.
3 In this paper, work is defined in terms of economic activity as derived by the System of National Accounts (SNA, 1993), which sets the international statistical standards for the measurement of the market economy. Economic activity covers all market production (paid work) and some types of non-market production (unpaid work). The economic activity can be pursued in either the formal or informal sector and in either urban or rural areas. The SNA also provides a definition for non-economic activity as any productive activity falling outside the SNA production boundary for measuring the GDP. It consists mainly of work activities, usually referred to as household chores, performed for the production of goods and services by the household members for their own consumption, using their own capital and their own unpaid labor (ILO, 2006). For a detailed discussion on the distinction between family and non-family work and economic and non-economic productive activity the reader should refer to UCW (2007), which also discusses some of the issues arising when attempting to define a statistical standard for child work in the specific context of Cambodia. 4 For a detailed discussion refer to UCW (2005): http://www.ucw-project.org/pdf/publications/noneconomicactivities2.pdf

3 UCW WORKING PAPER SERIES, MAY 2007
6. The structure of this paper is as follows. Section 2 briefly reviews the relevant literature on this topic in less developed countries. Section 3 discusses the theoretical framework, while section 4 presents the econometric models used in this paper to analyze the joint probability and trade-off of child work, school attendance and household chores activities among primary-aged children. Section 5 presents the data used for Ghana and Guatemala and describes the selected variables. Section 6 shows descriptive evidence on child work (both as economic activity and in household chores) and school attendance. Section 7 presents the regression results, while Section 8 discusses some robustness checks. Section 9 offers a provisional conclusion.
2. REVIEW OF THE LITERATURE
7. Starting from the pioneering work of Rosenzweig and Evenson (1977), where the joint family decision regarding fertility and children’s time allocated to schooling and work are analyzed by fitting a simultaneous equations model to Indian data, a large number of other papers have followed on the subject analyzing parts or the whole of the relationship between child work, school attendance, fertility and other household characteristics (Patrinos and Psacharopoulos 1995; Psacharopoulos and Yang 1991; Rodgers and Standing 1981 a, b; Rosenzweig 1981; Silva 1981; Singh and Schuh 1986; Tienda 1979; among others. See also Cigno and Rosati 2005 for a book review on child labor, Brown, Deardorff and Stern 2002 and Edmonds 2007 for article reviews on child labor, and Orazem and Gunnarsson 2003 for an article review on the impact of child work on school attainment). 8. There is no lack of empirical evidence on the effect of supply constraints on young children’s labor supply and school enrollment or attendance in developing countries. Several studies find a link between measured schooling costs and child work. Hazarika and Bedi (2003) show that in Pakistan children are more likely to work outside the family in communities where schooling costs are higher. Similar results are found in Shafiq (2006) for boys in Bangladesh. Moreover, Hazarika and Bedi (2003) examine the separate effects of schooling costs upon child work within the household (intra-household) and child work in the labor market (extra-household) in rural Pakistan. They find that extra-household child work and schooling costs are positively related whereas intra-household child work is insensitive to changes in the costs of schooling. Given that intra-household labor is a relevant part of child work, these findings cast doubt on the efficacy of a policy of school cost reduction in reducing child work. In urban Bolivia, Cartwright and Patrinos (1999) find a strong positive relationship between schooling costs and child work participation. In contrast, Cartwright (1999) shows that higher school costs are associated with a lower probability of working in Colombia. Edmonds, Pavcnik, and Topalova (2007) demonstrate that the relative declines in schooling and increases in work associated with India’s tariff reforms are smaller in areas where schooling is less expensive. School characteristics are found to have a strong impact also on achievements of middle school students (Glewwe and Jacoby, 1994). Interestingly, investments on school buildings (in particular reparations) are more effective than investment on instruction materials or teacher quality. Of all teacher quality variables measured, only teacher experience matters to educational attainment. Experienced teachers are more skilled at inducing students to remain in school.
4 THE EFFECT OF AVAILABILITY AND DISTANCE FROM SCHOOL ON CHILDREN’S TIME ALLOCATION IN GHANA AND GUATEMALA
9. There are few papers that have specifically looked at one dimension of schooling costs, namely the effect of travel time or distance to school on children educational and work outcomes. Grootaert (1999) reports that child work force participation in rural Cote d’Ivoire is responsive to distance to school but the same effect is not found when urban Cote d’Ivoire is considered. Akabayashi and Psacharopoulos (1999) report that children work more and longer in areas with lower school concentration. In particular, distance from the closest public primary school is negatively related to hours of work. Lavy (1996) finds that supply constraints on middle and secondary schools are as important as supply constraints on primary schools in increasing school enrollment and children attainment. This highlights the importance of improving not only the quality of primary schools but also the access and the quality of higher-order schools. Analyzing both the supply and the demand factors affecting primary school enrollment, Handa (2002) finds that school access on the supply side and adult education on the demand side are the most important determinants of primary school enrollment. In particular, reducing the travel time to school seems to be particularly effective among poorer households. Kondylis and Manacorda (2006) are among the firsts to study the effect of distance to school on the children’s joint decisions of working and school attendance in Tanzania, but they do not consider household chores activities. They find that once controlled for unobserved differences across villages and observed determinants of child work, higher distance to schools discourages school attendance but not work activities. Considering explicitly all the possible combinations of work and school choices, they find that the above result is mainly driven by the individual shift from a combination of work and schooling to full-time work. Therefore, improving access to schools in rural areas will most likely increase school attendance but it is unlikely to reduce children's employment. Differently from the previous study, Hazarika and Bedi (2006) find that an increase in schooling costs (both in terms of direct costs and distance to schools) impacts positively children's propensity to work and negatively children's probability to attend school (but the two choices are not jointly analyzed).
3. THEORETICAL FRAMEWORK
10. The theoretical framework for this analysis is derived from a standard Becker (1965) household production model, which has found an application in Rosenzweig and Evenson (1977), where multiple activities of children in developing countries are taken into account.5 Empirical work originating from this framework highlights the importance of factors related to: individual characteristics of the child such as gender and age; family structure and the relative position in terms of age of the child within the family; family income and parental labor force participation; labor market conditions such as the wages of children and adults; community infrastructure, such as the supply of school, the presence of water, electricity, market, road, postal office, telephone, etc. We use this utility-maximizing framework to model the household choices regarding children school and work activities as a function of individual, parental, household and community characteristics. 11. In particular, when analyzing the factors influencing household decisions concerning children’s time use, it is assumed that parents make their choices on the basis of the relative costs and benefits of their children labor (or alternatively children 5 For a reference theoretical model see also Cigno and Rosati (2005).
5 UCW WORKING PAPER SERIES, MAY 2007
education).6 The returns to child labor have to be found in the learning by doing process and skill accumulation. This has especially been in rural areas where formal education is not attractive for households due to the lack of opportunities in the formal sector, while most skills can be acquired directly on the job. In addition, for households that are resource-constrained, child labor is often used as a buffer against insecurity and uncertainty, and in general returns to child labor may constitute a substantial contribution to household income, up to 20 per cent of total household income (Nepal UCW 2003). Grootaert and Kanbur (1995) also mention that child labor can be perceived as a process of socialization, and working rather than education provides a child the skills required for being employable. 12. Concerning the benefits from education, there are several factors expected to increase the benefits from education, those directly aimed to increase the returns to education (school quality, employment prospects, etc) and those aimed at reducing the costs of education (fees, distance from school, etc.). In particular, school accessibility represents an indirect cost of education and it greatly affects household decisions concerning children’s time use. Therefore, school expansion seems to be a necessary condition to reduce child labor. At the same time, secondary school availability might be also relevant in determining parents’ decisions about time allocation of primary school age children, with the effect of increasing school attendance and educational attainment and at the same time reducing children work. These effects are likely to be differentiated depending on the characteristics of the household and of the child. For example, parental choices over their children’s time use and returns to education, as well as child productivity, can depend on children’s age and gender, but also on parental characteristics (parents’ education and presence in the household). Similarly, the level of household income and wealth is likely to influence the relative size of the income and substitution effects. Also household composition has an important effect on children’ time use but the sign of this effect is indeterminate a priori. In general, the presence of very young children in the household may lead to a higher probability of working (either performing economic activity if it is necessary to increase household income or doing household chores if child care activities are needed). On the contrary, the presence of older children may increase child’s work if more work is created, or increase school attendance if older children act as substitutes. Differences in labor market and educational opportunities across regions may also affect household decisions concerning children’s time use.
4. EMPIRICAL STRATEGY
13. This paper aims to estimate the effects of availability and distance to school upon both children's propensity to work and to attend school, controlling for a set of demand and supply side variables. If improving access to school is found to increase the probability of school attendance while decreasing the probability of child work, we might argue that children's work and school attendance are substitutes so that a policy of improving access to school, for example by increasing the number of schools in rural areas, might be effective in pushing away children from work towards school.
6 This is an extreme simplification of the scheme followed by the households to make choices about their children’s time use. The interested reader can refer to Cigno and Rosati (2005) and to the literature cited therein for a detailed discussion.

6 THE EFFECT OF AVAILABILITY AND DISTANCE FROM SCHOOL ON CHILDREN’S TIME ALLOCATION IN GHANA AND GUATEMALA
14. We initially focus on child economic activity and school attendance and we estimate the child's probability of choosing to work and to attend school in a reduced form model using a simultaneous probit model. We assume that a child specializes either in school, or in work, or combines both work and schooling, or does neither activities, and we use a definition of work which includes both paid and unpaid labor force work (see Section 1). We treat schooling and work possibilities as interdependent choices and we employ a bivariate probit model to test the likelihood of children working and going to school, given several individual, household characteristics and community variables.
15. In the bivariate probit, let the latent variable *iwork represents the decision of
working in economic activity and *iattend represents the decision of attend school.
Therefore, the specification for a two-equation model is:
111211* **** iciiii FXdistmiddistprimwork εδγββα +++++= work=1 if *
iwork > 0 (1)
222432* **** iciiii FXdistmiddistprimattend εδγββα +++++= attend=1 if *
iattend > 0 (2)
where distprimi and distmidi measure the travel distance from primary school and middle schools respectively,7 Xi indicates individual control variables and Fc indicates dummies for the presence of primary, middle and secondary schools in the community plus other variables measured at community level; finally εi1 and εi2 are i.i.d. error term. Assuming that εi1 and εi2 are jointly normally distributed, the equations (1) and (2) can be estimated simultaneously by maximum likelihood. Coefficients β1, β2, β3, β4, are of primary interest and we expect β1 and β2 to be positive, and β3 and β4 to be negative. 16. However, as mentioned in Section 1, we recognize that household chores might be not less demanding or less important for families and can conflict with formal education as much as, or even more in case of girls, work activities. As a matter of fact, a consistent part of child work in rural areas consists of household chores and ignoring this type of work may lead one to the erroneous conclusion that the problem of child work in rural areas is marginal. For this reason, we analyze children’s time allocation in school, in work and in household chores. 17. When household chores are taken into account, the following equation is estimated jointly with equations 1 and 2:
222432* **** iciiii FXdistmiddistprimchores εδγββα +++++= chores=1 if *
ichores >0 (3)
18. In order to account for the dichotomous nature of iwork , iattend , and ichores variables, we use a trivariate probit model. It is assumed that εi1, εi2, and εi3 are error terms distributed as multivariate normal, each with a mean of zero and a variance-covariance matrix V, which has unit diagonal elements and off-diagonal elements equal to ρjk=ρkj. The evaluation of the likelihood function requires the computation of trivariate normal integrals, which are approximated via the Geweke-Hajivassiliou-
7 In section 5, we explain why the distance to secondary school has not been included among the regressors for Ghana, instead in Guatemala it is not possible to distinguish between middle and secondary schools in the data.

7 UCW WORKING PAPER SERIES, MAY 2007
Keane smooth recursive simulator, denoted as GHK in what follows. The GHK simulator belongs to the class of importance sampling simulators where one draws from some distribution other than the considered joint distribution, and then re-weights to obtain an unbiased simulator. In this way the importance sampling can reduce the simulation error by over sampling parts of the error distribution that are most informative. In the case of a multinomial probit model, the main characteristic of the GHK simulator here employed is that it splits the joint normal probability density function into a series of conveniently simulated conditional probabilities from a truncated normal distribution, where the joint probability can be written as the product of each of the conditional simulated probabilities coming from the truncated normal. Hajivassiliou, McFadden and Ruud (1996) found the GHK simulator to generally outperform 12 other simulators. 19. There are two problems that could arise in our estimates and could potentially bias our results. One is the use of travel distances to proxy the costs of education, which may create a problem of endogeneity if the schools are not randomly allocated over the country. The second one is the endogeneity of household per capita expenditure. We use total per-capita household consumption expenditures since, for households that cannot borrow, consumption should be highly correlated with income. However, consumption may be endogenous in a regression explaining human capital investment.8 We will deal with both these problems in section 8 using an instrumental variable approach to estimate our models.
5. DATA AND VARIABLES
5.1 The Ghana Living Standard Survey 1998-99 (GLSS) 20. The study's empirical analyses are conducted upon data from the Ghana Living Standard Survey 1998-99 (GLSS) covering a random sample of 6000 households and more than 17000 household members. The present study focuses on 3699 rural household providing information on demographic characteristics, health and fertility behavior, education, employment and time use, income, consumption and expenditure. The GLSS also includes information on family structure and dwelling characteristics. The survey is complemented by a community questionnaire identifying the economic infrastructure, education, and health facilities existing in the villages. Since community data were collected only in rural areas, we focus on households living in those areas. According to Ghana's educational system children should start elementary school when 6 years old, middle school when 12 years old and secondary school when 15 years old, thus lasting respectively 6, 3, and 3 years. An interesting aspect of the GLSS dataset is that it has information on children’s activity, especially whether they went to school, worked or performed household chores. This information is available for all individuals aged 7 and above.9 We restrict our sample to children between the ages of 7 and 12, which corresponds to the age children should be enrolled in primary school. This represents the most critical period for children dropping out of school and this explains why we focus on primary aged school children. As Gleewe (1990) has shown, in Ghana the lowest rates of returns to
8 Imperfect credit markets are one reason why educational choices might depend on household income; moreover, wealthier parents may value education more and this would explain why children from poorer households tend to quit earlier. 9 The school variables are also available for children aged 5 and 6, but they are not used because work information are not recorded for children in the same age group.
8 THE EFFECT OF AVAILABILITY AND DISTANCE FROM SCHOOL ON CHILDREN’S TIME ALLOCATION IN GHANA AND GUATEMALA
schooling are found at the primary school level. The low return to primary education can be explained by the low achievement scores in primary schools. As a consequence households, in particular those with budget constrain, may be prevented from investing in human capital accumulation of their primary school aged children. Moreover. Levy (1996) has shown that removing supply constraints on middle and secondary education is at least as important as removing the supply of primary schools in discouraging early dropout of students from the education system. However, we also extend the sample to include children between 7 and 15 years of age, in order to make allowance for late entry and grade repetitions and to test the robustness of our results. The findings of the empirical section are very similar to what obtained with children aged 7-12.10 21. After deleting observations with missing values in the main covariates, we end up with a sample of 3354 primary-school age children, belonging to 1917 households. 22. Regarding the dependent variables, school attendance has been identified whenever a child has declared to have attended school at any time during the past 12 months. As mentioned in Section 1, for child work, this study uses the definition of economic activity and non-economic activity as derived from the System of National Accounts (1993). In particular, child work has been identified whenever, during the past 12 months, a child has declared to have worked receiving a salary or in-kind payment, or has worked unpaid for an enterprise belonging to a member of the household. Non-economic activity (household chores hereafter) has been identified whenever a child has declared to have spent time on housekeeping activities including fetching woods, fetching water, ironing clothes, taking care of children, washing motor vehicles, sweeping, disposing of garbage, cooking, marketing or shopping, or finally running errands for at least two hours a day.11 23. We are interested in identifying the effect of school distance and school availability on households’ decisions concerning their children school attendance and work (both production work and household duties). The data provide two measures of school distance that can be both considered as a measure of travel costs. The first measure is collected at community level and gives information on distances in kilometers to the nearest primary, middle and secondary schools for those communities which do not have a school.12 Out of the 223 communities in the survey, about 84% declare to have a primary school in the community, 60% have a middle school and only 11% have a secondary or technical school in the village. Given that the distance in kilometers is provided only for the communities that do not have a school inside (16% of the primary schools, 40% of the middle schools and 89% of the secondary schools), the distance measure has to be assumed zero for these communities with a school inside. As a consequence, this variable has very small variability across individuals of primary-school age belonging to the same community, and only slightly more for middle school aged children. For this reason, we rather prefer to use the second measure of school distance described below. 24. The second measure is collected at individual level and in particular each household member declaring to have attended school at any time during the past 12
10 Results are not reported but available on request from the author. 11 We have chosen the threshold of two hours because enough children declare to do housework for at least two hours a day while few children do household chores for at least three or four hours a day (see Section 6.1); at the same time, two hours a day spent in household chores may interfere with school and work activities. 12 Levy (1996) analyses the correlation between school availability and school enrollment for Ghana in 1987 using community distance variables augmented by information on the quality of primary and middle schools obtained by a follow-up survey in 1988. Unfortunately, the survey currently used in this paper (GLSS 1998) does not provide school quality information.

9 UCW WORKING PAPER SERIES, MAY 2007
months is asked the daily timing to reach school in hours and minutes. Using individual travel school distance rather than community distance from school we can capture the fact that, within communities, households may live in rather widespread areas around schools, which is extremely important in rural areas. For 83% of children we have information on travel distance to school. For the remaining 17% who do not attend school, we build a measure of potential travel distance by attributing the actual travel distance of the same age sibling(s) if there is at least one sibling attending school. If there are no siblings of the same age group in the household or none of them is attending school, we impute the average distance of the children of similar age in the community (or in the district if no children living in the same community attend school). Moreover, we also build a potential travel distance from middle school for primary age children. In order to do that, we select children aged between 13 and 17 years and we use the same procedure to attribute the potential travel distance from middle school to primary-school aged children.13 25. The other explanatory variables include measures of the children’s characteristics, characteristics of the children’s parents, household characteristics and family structure, community characteristics and area dummies. 26. The children’s characteristics include his/her age, age-squared, and whether or not the youth is the son or the daughter (vs. other relative) of the household head. For parental characteristics, we include four dummy educational variables corresponding to no education, up to primary school, up to middle school, and secondary school or beyond. Dummy variables indicate whether the father and the mother reside in or are absent from the household.14 27. Household characteristics include several proxies for the wealth and standard of living of the household. These include the per-capita expenditure (in log) and variables for the existence of private bathroom, electricity, drink water in the dwelling, and cement walls. 28. Household composition variables are included because, as mentioned in Section 3, different family members may act as substitutes for the children in the household duties or may create more work for the household. In particular, we have variables for the number of siblings aged between 0 and 6, number of additional siblings aged between 7 and 12, number of siblings aged between 13 and 17, number of male adults aged between 18 and 59, number of female adults aged between 18 and 59, number of elderly aged over 60 or more. We also include 6 dummies for religion, namely Catholic, Protestant, Other Christian, Muslim, Animist, and no religion, and 4 dummies for area of residence, namely urban area, rural costal, rural forest, and rural Savannah in order to control for regional fixed effects. Among the communities variables we include having a motorable road, a pipe-borne water, public transport, having an agricultural extension centre, tractors, an agricultural extension officer, a cooperative, and using chemical fertilizer or insecticides. Since, as observed by Lavy (1996), the majority of workers in Ghana are farmers, the return to human capital in rural areas is strictly linked to the presence of machinery, chemical inputs and extension services. Therefore, by including these variables we should be able to control for regional variation in the returns to human capital. Ideally, we would like to
13 We could have computed the potential travel distance from secondary school in a similar way, but too few children attend secondary school in our sample and the imputation procedure would have produced a variable heavily affected by measurement error and in addition with small variability. 14 In a less parsimonious specification of the model we have included three variables indicating whether the father is employed in farming activity, whether he is employed in non farming activities, or he is not working. However, they never turned out to be either jointly or singularly significant and therefore they were excluded from the analysis. The same dummies for the mother were not included since they could be endogenous to children work decisions.

10 THE EFFECT OF AVAILABILITY AND DISTANCE FROM SCHOOL ON CHILDREN’S TIME ALLOCATION IN GHANA AND GUATEMALA
include the market child wage rate (at community level) in order to capture the opportunity cost of time spent at school. However, since not many children work for pay in the sample and we have many missing values in this variable, we include the adult male wage rate collected at community level as a proxy for child's wage. 29. Table A1 in Appendix presents the mean and standard deviations of the variables used in the empirical analysis.
5.2 The Guatemalan Living Standards Measurement Survey 2000 30. The second study's empirical analyses are conducted upon data from the 2000 Guatemala Living Standards Measurement Survey (ENCOVI, 2000). The survey follows a probabilistic design, covering 7,276 households (3,852 rural and 3,424 urban) and almost 38,000 household members. The survey is representative at the national and regional level as well as in urban and rural areas. ENCOVI includes questions to elicit a unique level of detail on household conditions, demographic characteristics, health and fertility behavior, education, employment and time use, income and consumption. It also provides information on family structure and dwelling characteristics. Like the GLSS for Ghana, the survey is complemented by a community questionnaire identifying the infrastructure, community services, education (both on primary and secondary schools), health facilities, community security, labor migration and work in the villages. Unfortunately, not all the communities have been interviewed and we restrict our sample to the households living in communities with valid responses to the community questionnaire in order to build a sample comparable to Ghana. Given that the selection of communities has not been done randomly, this restriction implies that our results have validity limited to our sample and they cannot be extended to the entire population. According to the Guatemala’s educational system, children start elementary school when 7 years old, middle school when 13 years old and secondary school when 16 years old, lasting respectively 6, 3 and 2 years. Like the GLSS, ENCOVI collects information on children school enrollment, school attendance, working in the labor market and household chores activities. We restrict our sample to children between the ages of 7 and 14, one year above the end of compulsory schooling since repetition rates are quite high in Guatemala (UCW, 2003).15 After deleting observations with missing values in the main covariates and focusing on indigenous children for which school attendance problem is more relevant, we end up with a sample of 2503 primary-school age children, belonging to 1176 households. Indigenous children have been identified using the question regarding the ethnic group the individual belongs to. The children are divided into Mayan (K’iche, Q’eqchi, Kaqchikel, Mam, and other Maya), Non Mayan (Garifuna and Xinka) and non indigenous. Children belonging to Mayan and Non Mayan ethnic groups have been grouped together and classified as indigenous, all the rest are identified as non indigenous. There is some heterogeneity in terms of time allocation among indigenous and non indigenous children, which justify our choice to look only to the group of indigenous (in Section 7.2, the implication of selecting only indigenous children will be discussed in more details). Indigenous children represents 47% of the population in the age range 7-14 and they are less involved in school and more involved in the other activities. In particular, among the indigenous only 50% attend school on a full-time basis vs. 67.2% of the non indigenous, 7.5% of them work full-time vs. 7.45% of the non indigenous, 16.6 of the indigenous combine school and work vs. 11.0 of the non-indigenous, and 15 The motivation for looking at primary aged children has been explained in Section 5.1.

11 UCW WORKING PAPER SERIES, MAY 2007
finally a much higher fraction of the indigenous children are engaged in house works than non indigenous (22.2 vs. 14.2). 31. Regarding the dependent variables, school attendance has been identified whenever a child has declared to be registered for school year 2000 in adult education, in primary, secondary, university or postgraduate even if she/he has withdrawn previously and to attend it. Child work has been identified whenever a child has declared to have worked for a salary or wages, for him/herself, or providing paid work to other persons or helping in a family business in the last week or had any job or business from which they were absent for leave, illness, vacation, maternity leave or other reasons. Since the employment variable used for Ghana refers to the last 12 months, in order to have comparable samples we consider as employed also those children who declare to have worked for a salary or wage or help with a family business or for other persons in the last 12 months. Finally, household chores have been identified whenever a child has declared to have spent time (the day before the interview) on housekeeping activities including cleaning the house, cooking, washing or ironing clothes, throw away the trash, haul water, and look after children for at least two hours.16 32. As for Ghana, we use two indicators for school proximity also for Guatemala. The first one is collected at community level and is given by the presence of primary and secondary schools in the community;17 the second measure is collected at individual level and in particular each household member declaring to have attended school at any time during 2000 is asked the daily timing to reach school in hours and minutes. From this information, we build the potential travel distances from primary and secondary schools for primary age children, as described for Ghana in Section 5.1. 33. For the choice of the other covariates, as far as possible we select similar variables to those used in the analysis for Ghana. They include children’s characteristics (age, age-squared, and whether or not the youth is the son or the daughter vs. other relative of the household head, if living in rural area), characteristics of the children’s parents (three dummy educational variables corresponding to no education, up to primary school and above primary school, and dummy variables indicating whether the father and the mother resides in or are absent from the household), household characteristics (the per-capita expenditure (in log), variables for the existence of private bathroom in the dwelling, concrete walls and cement floor, and value of livestock), family structure (number of siblings aged between 0 and 6, number of additional siblings aged between 7 and 14, number of siblings aged between 15 and 17, number of male adults aged between 18 and 59, number of female adults aged between 18 and 59, number of elderly aged over 60 or more), community characteristics (having a post office, a mail, a bank, a cooperative, a police station, a market, public lighting in the street, protective service and public transportation in the community, community service for the collection of trash, pipe waters, telephone, and electricity in the dwellings) and area dummies (Metropolitan, Norte, Nororiente, Suroriente, Central, Surroccidente, Noroccidente, Peten). 34. Table A2 in Appendix presents the mean and standard deviations of the variables used in the empirical analysis.
16 It should be noted that in Guatemala the question on household chores refers to the day before the interview, while in Ghana it refers to a normal day of the week and consequently it could be more representative of the true house work hours performed by children during the day. 17 Unlike Ghana, in Guatemala there is no distinction between middle school and secondary schools at community level; in what follows we indicate as secondary school any type of school different from the primary one.
12 THE EFFECT OF AVAILABILITY AND DISTANCE FROM SCHOOL ON CHILDREN’S TIME ALLOCATION IN GHANA AND GUATEMALA
6. CHILD WORK, SCHOOLING AND HOUSEHOLD CHORES ACTIVITIES: SOME DESCRIPTIVE EVIDENCE
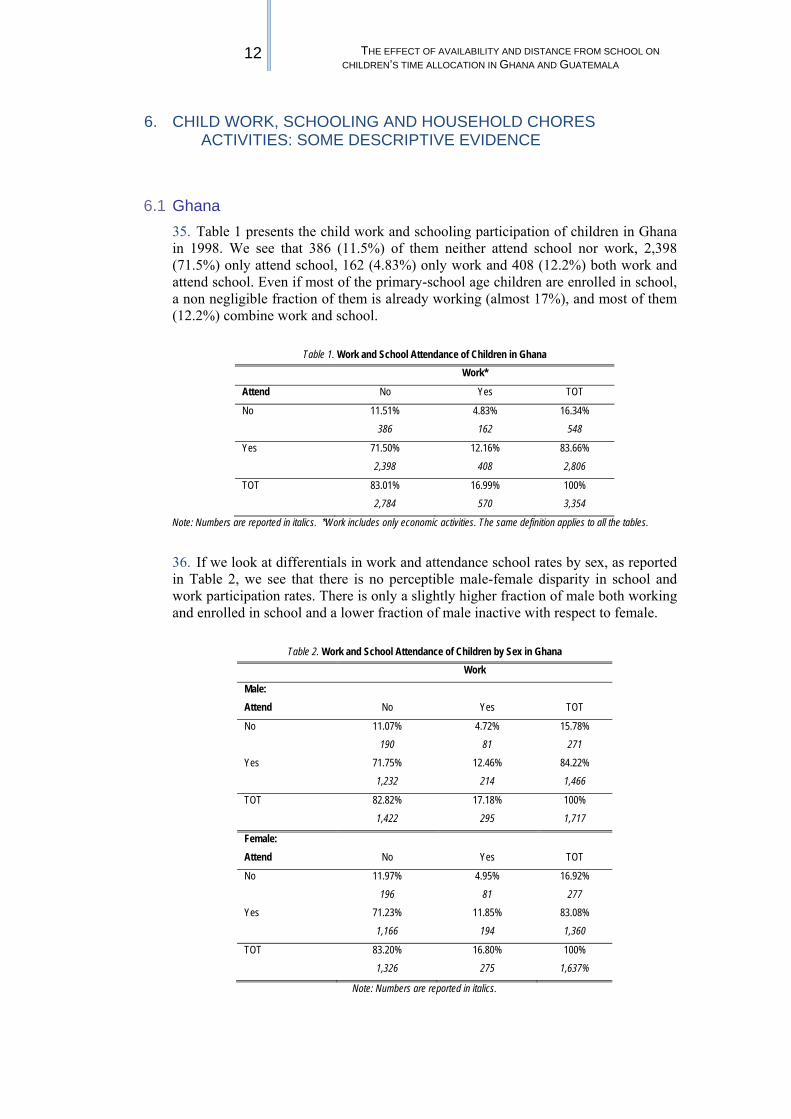
6.1 Ghana 35. Table 1 presents the child work and schooling participation of children in Ghana in 1998. We see that 386 (11.5%) of them neither attend school nor work, 2,398 (71.5%) only attend school, 162 (4.83%) only work and 408 (12.2%) both work and attend school. Even if most of the primary-school age children are enrolled in school, a non negligible fraction of them is already working (almost 17%), and most of them (12.2%) combine work and school.
Table 1. Work and School Attendance of Children in Ghana
Work*
Attend No Yes TOT
No 11.51% 4.83% 16.34% 386 162 548
Yes 71.50% 12.16% 83.66% 2,398 408 2,806
TOT 83.01% 16.99% 100% 2,784 570 3,354
Note: Numbers are reported in italics. *Work includes only economic activities. The same definition applies to all the tables.
36. If we look at differentials in work and attendance school rates by sex, as reported in Table 2, we see that there is no perceptible male-female disparity in school and work participation rates. There is only a slightly higher fraction of male both working and enrolled in school and a lower fraction of male inactive with respect to female.
Table 2. Work and School Attendance of Children by Sex in Ghana
Work
Male: Attend No Yes TOT
No 11.07% 4.72% 15.78% 190 81 271
Yes 71.75% 12.46% 84.22% 1,232 214 1,466
TOT 82.82% 17.18% 100% 1,422 295 1,717
Female: Attend No Yes TOT
No 11.97% 4.95% 16.92% 196 81 277
Yes 71.23% 11.85% 83.08% 1,166 194 1,360
TOT 83.20% 16.80% 100% 1,326 275 1,637%
Note: Numbers are reported in italics.

13 UCW WORKING PAPER SERIES, MAY 2007
37. As mentioned in Section 1, the households may not view the decision to let children participate in work or to do other activities, mainly household chores, as the same and household chores might have implication for child welfare similar to those of work in terms of conflict with formal education. For this reason, we analyze the relationships between school attendance, work and house chores activities. In Table 3, we report the fraction of children employed in household chores and attending school. The table shows that a large fraction of children is employed in household chores, about 20%. Almost 16% combine school with household duties and 3.6% perform only house works. This implies that about 67% of children are exclusively enrolled in school. 38. Comparing Table 1 with Table 3, we can see that most children attend school without working (almost 72%), slightly more than those who study without performing household chores (about 67%). The fraction of children working is only slightly lower than the fraction of those performing household chores (about 20%). This suggests that household chores activities are an important component of children’s time allocation and disregarding it from the analysis could lead to underestimate the negative impact of time spent outside school on educational outcomes.
Table 3. Household Chores Activities and School Attendance of Children in Ghana
Household Chores
Attend No Yes TOT
No 12.70% 3.64% 16.34% 426 122 548
Yes 66.77% 15.89% 83.66% 2,273 533 2,806
TOT 80.47% 19.53% 100% 2,699 655 3,354
Note: Numbers are reported in italics.
39. If we look at the differentials in household chores activity and school attendance rates by sex (Table 4), striking differences turn out. In fact, a much lower fraction of boys performs household chores with respect to girls (14.6% vs. 24.7%). In addition, girls are more likely than boys to combine household chores activities and school (19.7% vs. 12.3%), while the fraction of girls not attending school but doing household chores more than doubles the fraction of boys (5.0% vs. 2.2%).

14 THE EFFECT OF AVAILABILITY AND DISTANCE FROM SCHOOL ON CHILDREN’S TIME ALLOCATION IN GHANA AND GUATEMALA
Table 4. Household Chores Activities and School Attendance of Children by Sex in Ghana Household Chores
Male: Attend No Yes TOT
No 13.51% 2.27% 15.78% 232 39 271
Yes 71.93% 12.29% 84.22% 1,235 211 1,466
TOT 85.44% 14.56% 100% 1,467 250 1,717
Female: Attend No Yes TOT
No 11.85% 5.07% 16.92% 194 83 277
Yes 63.41% 19.67% 83.08% 1,038 322 1,360
TOT 75.26% 24.74% 100% 1,232 405 1,637
Note: Numbers are reported in italics.
40. In Table 5 we look contemporaneously at the three decisions of working, doing house works and attending school. We see that the most interesting differences are among children performing household chores. In fact, among children not attending school, more than 11% of children both work and perform household chores (Panel A), but this fraction decreases to 4.1% for those attending school (Panel B). Quite surprisingly, the fraction of children doing household chores but not working is lower for those not attending school than for those attending it (11.1% vs. 14.9%). Instead, as expected, the fraction of children neither working nor doing household chores is higher among those attending school than among the so-called “idle” (or inactive) (70.6% vs. 59.3%).
Table 5. Work and Household Chores Activities by School Attendance of Children in Ghana Household Chores
Attend=0 (Panel A) Work: No Yes TOT
No 59.31% 11.13% 70.44% 325 61 386
Yes 18.43% 11.13% 29.56% 101 61 162
TOT 77.74% 22.26% 100% 426 122 584
Attend=1 (Panel B) Work: No Yes TOT
No 70.60% 14.86% 85.46% 1,981 417 2,398
Yes 10.41% 4.13% 14.54% 292 116 408
TOT 81.00% 19.00% 100% 2,273 533 2,806
Note: Numbers are reported in italics

15 UCW WORKING PAPER SERIES, MAY 2007
41. If we look at the activity status of children by type of household chores in Table 6, we see that ironing, caring for younger children, cooking, washing motor and sweeping are most common among those only working and those combining work and school, while marketing and run errands is more frequent among children only attending school, and less frequent among those only working or attending school and working.
Table 6. Activity Status of Children by Type of Household Chores in Ghana (in percent) Activity Status
Type of Household Chores Work only School only Work & School None TOT
Fetching wood or water 5.58 69.94 15.89 8.59 100.00 Ironing, care, cooking* 8.83 63.32 18.26 9.59 100.00 Sweeping 7.60 66.14 18.08 8.18 100.00 Disp. garbage 6.10 69.95 15.62 8.33 100.00 Marketing, run errands 5.31 73.24 12.29 9.16 100.00
Note: *It includes also washing motor vehicles.
42. We then look at the activity status of children by household chores activities and presence of primary school in the community in Table 7. In Panel A we consider children who do not perform household chores and we report the activity status rates of children (only work, only attend school, combine work and school or are inactive) by presence of primary school in the community; Panel B is similar to Panel A except that the activity status rates by presence of primary schools are computed for children performing household chores. We notice that the presence of primary school increases the fraction of children attending school and working at the same time, while it reduces the fraction of children only working. This result holds both for children not doing household chores (Panel A) and those performing them (Panel B). It confirms that having a school nearby makes it easier for children to reconcile work and school. When we look at children only attending school or inactive and not busy in household chores (Panel A), we do not see main differences between children living in villages with primary schools and those in villages without. The situation is completely reversed when looking at children doing household chores (Panel B). In this case, there are huge differences among children who have a school in the village and those who do not have it. For instance, for children only attending school, 66 percent attend primary school if it is nearby vs. 52 percent among those who do not have a primary school in the village. Similarly, only 7 percent of children are inactive if they have a primary school in the village, but the fraction more than doubles (19 percent) if a primary school is not nearby. 43. Similar results are found when we consider the presence of middle school in the community (Table 8). The only relevant difference with respect to Table 7 is to be found for children not performing household chores (Panel A). For instance, while in Table 7- Panel A there are not sizeable differences for children attending school by presence of primary school, in Table 8 – Panel A the fraction of children attending school with a middle school nearby is about 15 percent higher than the fraction of those not having it.

16 THE EFFECT OF AVAILABILITY AND DISTANCE FROM SCHOOL ON CHILDREN’S TIME ALLOCATION IN GHANA AND GUATEMALA
Table 7. Activity Status of Children by Household Chores Activities and Presence of Primary School in Ghana (in percent)
Activity Status
Panel A Household Chores=0 Work only School only Work & School None TOT No primary school 8.52 71.29 6.31 13.88 100.00 Presence primary school 3.11 73.68 11.42 11.80 100.00
TOT 3.74 73.40 10.82 12.04 100.00
Panel B Household Chores=1 Work only School only Work & School None TOT No primary school 15.65 52.17 13.04 19.13 100.00 Presence primary school 7.96 66.11 18.70 7.22 100.00
TOT 9.31 63.66 17.71 9.31 100.00
Table 8. Activity Status of Children by Household Chores Activities and Presence of Middle School in Ghana (in percent)
Activity Status
Panel A Household Chores=0 Work only School only Work & School None TOT No middle school 7.77 67.61 7.77 16.85 100.00 Presence middle school 1.41 76.76 12.59 9.25 100.00
TOT 3.74 73.40 10.82 12.04 100.00
Panel B Household Chores=1 Work only School only Work & School None TOT No middle school 16.48 55.17 16.09 12.26 100.00 Presence middle school 4.57 69.29 18.78 7.36 100.00
TOT 9.31 63.66 17.71 9.31 100.00
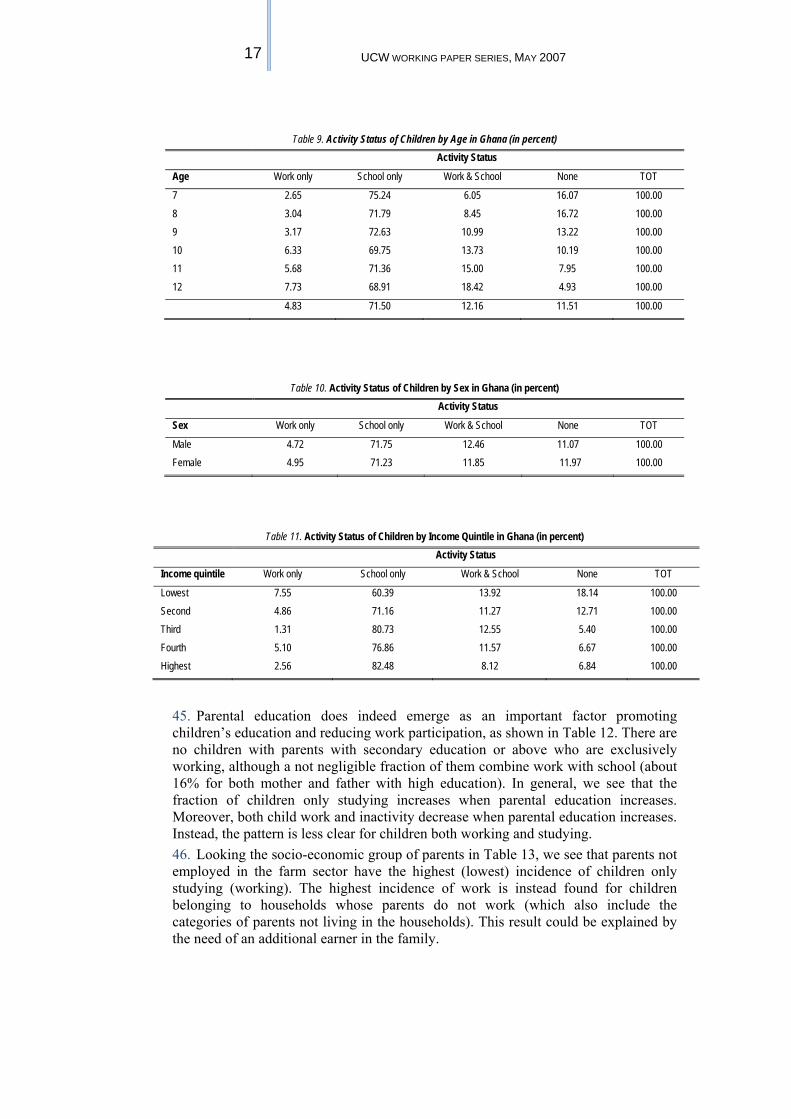
44. In the rest of this section we focus on the economic activity of children and look at the child work and school participation patterns of children in Ghana by various disaggregations. First, child work plays an increasing role in communities as children age (Table 9). This phenomenon is particularly evident for children combining work and attending school, whose fraction increases with age, while the fraction of inactive children tends to decrease as age increases. Confirming what already found in Table 2, Table 10 shows that there are not sex disparities in the activity status of children. In terms of income quintiles, the patterns of children exclusively working or attending school are not conclusive, but the fractions of children working and attending school on one side or inactive on the other show a steady decrease with higher level of income (see Table 11). However, it is evident that richer households have a higher percentage of their children in school and a lower percentage in employment as compared to those with lower levels of prosperity. In other words, poorer families seem to be unable to support children’s schooling while encourage children’s work.
17 UCW WORKING PAPER SERIES, MAY 2007
Table 9. Activity Status of Children by Age in Ghana (in percent)
Activity Status
Age Work only School only Work & School None TOT
7 2.65 75.24 6.05 16.07 100.00 8 3.04 71.79 8.45 16.72 100.00 9 3.17 72.63 10.99 13.22 100.00 10 6.33 69.75 13.73 10.19 100.00 11 5.68 71.36 15.00 7.95 100.00 12 7.73 68.91 18.42 4.93 100.00
4.83 71.50 12.16 11.51 100.00
Table 10. Activity Status of Children by Sex in Ghana (in percent) Activity Status
Sex Work only School only Work & School None TOT
Male 4.72 71.75 12.46 11.07 100.00 Female 4.95 71.23 11.85 11.97 100.00
Table 11. Activity Status of Children by Income Quintile in Ghana (in percent) Activity Status
Income quintile Work only School only Work & School None TOT
Lowest 7.55 60.39 13.92 18.14 100.00 Second 4.86 71.16 11.27 12.71 100.00 Third 1.31 80.73 12.55 5.40 100.00 Fourth 5.10 76.86 11.57 6.67 100.00 Highest 2.56 82.48 8.12 6.84 100.00
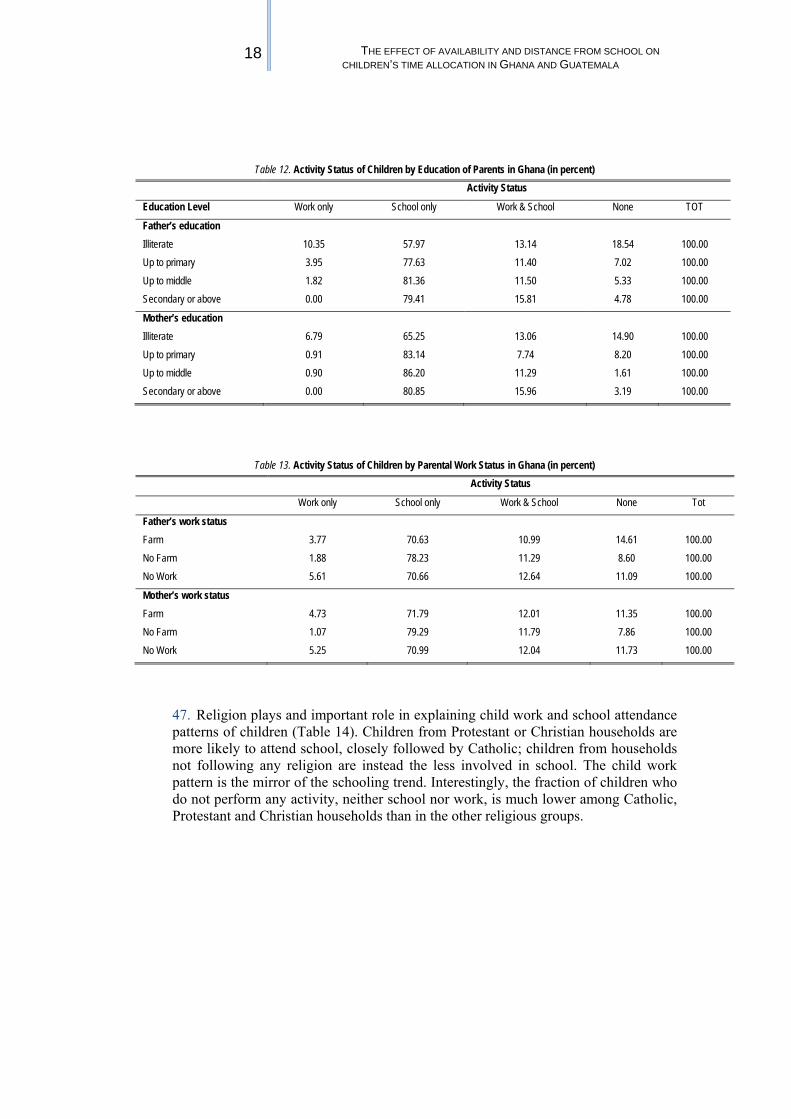
45. Parental education does indeed emerge as an important factor promoting children’s education and reducing work participation, as shown in Table 12. There are no children with parents with secondary education or above who are exclusively working, although a not negligible fraction of them combine work with school (about 16% for both mother and father with high education). In general, we see that the fraction of children only studying increases when parental education increases. Moreover, both child work and inactivity decrease when parental education increases. Instead, the pattern is less clear for children both working and studying. 46. Looking the socio-economic group of parents in Table 13, we see that parents not employed in the farm sector have the highest (lowest) incidence of children only studying (working). The highest incidence of work is instead found for children belonging to households whose parents do not work (which also include the categories of parents not living in the households). This result could be explained by the need of an additional earner in the family.
18 THE EFFECT OF AVAILABILITY AND DISTANCE FROM SCHOOL ON CHILDREN’S TIME ALLOCATION IN GHANA AND GUATEMALA
Table 12. Activity Status of Children by Education of Parents in Ghana (in percent)
Activity Status
Education Level Work only School only Work & School None TOT
Father’s education Illiterate 10.35 57.97 13.14 18.54 100.00 Up to primary 3.95 77.63 11.40 7.02 100.00 Up to middle 1.82 81.36 11.50 5.33 100.00 Secondary or above 0.00 79.41 15.81 4.78 100.00
Mother’s education Illiterate 6.79 65.25 13.06 14.90 100.00 Up to primary 0.91 83.14 7.74 8.20 100.00 Up to middle 0.90 86.20 11.29 1.61 100.00 Secondary or above 0.00 80.85 15.96 3.19 100.00
Table 13. Activity Status of Children by Parental Work Status in Ghana (in percent) Activity Status
Work only School only Work & School None Tot
Father’s work status Farm 3.77 70.63 10.99 14.61 100.00 No Farm 1.88 78.23 11.29 8.60 100.00 No Work 5.61 70.66 12.64 11.09 100.00
Mother’s work status Farm 4.73 71.79 12.01 11.35 100.00 No Farm 1.07 79.29 11.79 7.86 100.00 No Work 5.25 70.99 12.04 11.73 100.00
47. Religion plays and important role in explaining child work and school attendance patterns of children (Table 14). Children from Protestant or Christian households are more likely to attend school, closely followed by Catholic; children from households not following any religion are instead the less involved in school. The child work pattern is the mirror of the schooling trend. Interestingly, the fraction of children who do not perform any activity, neither school nor work, is much lower among Catholic, Protestant and Christian households than in the other religious groups.

19 UCW WORKING PAPER SERIES, MAY 2007
Table 14. Activity Status of Children by Religion in Ghana (in percent) Activity Status
Religion Work only School only Work & School None TOT
Catholic 3.59 73.53 13.07 9.80 100.00 Protestant 1.99 78.28 11.68 8.05 100.00 Other Christian 2.33 77.41 11.46 8.80 100.00 Muslim 7.52 54.90 14.71 22.88 100.00 Animist 16.34 50.98 12.16 20.59 100.00 None 20.16 47.58 10.48 21.77 100.00
48. If we look at the inter-area disparities in children’s school attendance and work participation, it turns out that work and school combination is predominantly a rural phenomenon, with a marked prevalence in Rural Coastal (see Table 15). In other urban areas, the majority of children attend school, while in Rural Savannah we find the highest fraction of children only working and not attending school.
Table 15. Activity Status of Children by Region in Ghana (in percent) Activity Status
Region Work only School only Work & School None TOT
Other Urban 1.41 97.18 0.00 1.41 100.00 Rural Coastal 2.74 65.80 21.21 10.25 100.00 Rural Forest 1.99 81.97 9.29 6.76 100.00 Rural Savannah 11.70 55.15 11.48 21.67 100.00
49. Finally, fraction of children attending school on a full-time basis and not working is higher in the communities with a motorable road, public transportation, an agriculture extension centre, a rice-husking, pipe-borne water, and among those using chemical fertilizer, insecticides or herbicides, while children combining work and school are more frequent in communities with a cooperative (results shown in Table A3 in the Appendix). 50. From this descriptive evidence, it turns out that many primary-aged children in Ghana are involved not only in school but also in productive activity and in household chores activities. The fact that many children are not full-time students might be due to the low returns in education, especially in rural areas where formal sector opportunities are scarce and most skills are acquired by a process of learning by doing, which make education less attractive for parents. In particular, parents could believe that working rather than studying allows children to obtain the skills useful for their future.
6.2 Guatemala 51. Similarly to Section 6.1, this section replicates the descriptive evidence on child work, school attendance and household chore activities in Guatemala. Table 16 presents the children work and schooling participation rates. 556 (22.2%) of children neither attend school nor work, 1,250 (49.9%) only attend school, 281 (11.2%) only

20 THE EFFECT OF AVAILABILITY AND DISTANCE FROM SCHOOL ON CHILDREN’S TIME ALLOCATION IN GHANA AND GUATEMALA
work and 416 (16.6%) both work and attend school. With respect to Ghana, a lower fraction of children is exclusively attending school (almost 20% less), while the fraction of children only working and the fraction of inactive more than doubles.
Table 16. Work and School Attendance of Children in Guatemala
Work*
Attend No Yes TOT
No 22.2% 11.2% 33.4% 556 281 837
Yes 49.9% 16.6% 66.6% 1,250 416 1,666
TOT 72.2% 27.8% 100% 1,806 697 2,503
Note: Numbers are reported in italics. *Work includes only economic activities. The same definition applies to all the tables.
52. If we look at differentials in work and school attendance rates by sex, as reported in Table 17, differently from Ghana, there seems to be some male-female disparity in school and work participation rates. In particular, girls are much more likely to be inactive and less likely to combine work and school with respect to boys. 53. In Table 18, we report the fraction of children employed in household chores and attending school. The table shows that a large fraction of children perform household chores, about 49% (against 20% found for Ghana). Almost 32.7% combine school with household duties (in Ghana it is half) and 16.5% perform only house works (3.6% in Ghana). Only 33.9% of children are exclusively attending school. This means that household chores activity is more widespread in Guatemala than in Ghana and almost one out of two children performs house chores.
Table 17. Work and School Attendance of Children by Sex in Guatemala Work
Male: Attend No Yes TOT
No 16.55% 13.99% 30.54% 213 180 393
Yes 46.85% 22.61% 69.46% 603 291 894
TOT 63.40% 36.60% 100% 816 471 1,287
Female: Attend No Yes TOT
No 28.21% 8.31% 36.51% 343 101 444
Yes 53.21% 10.28% 63.49% 647 125 772
TOT 81.41% 18.59% 100% 990 226 1,216%
Note: Numbers are reported in italics.

21 UCW WORKING PAPER SERIES, MAY 2007
54. Comparing Table 16 with Table 18, we can see that almost 50% of children attend school without working, but only 33.9% study without performing household chores. The fraction of children working is much lower than the fraction of children performing household chores (27.8% vs. 49.2). This result confirms that also in Guatemala it is important to consider explicitly household chores activities when estimating the effect of time spent outside school on educational outcomes. 55. If we look at the differentials in household chores activities and school attendance rates by sex (Table 19), we notice that a lower fraction of boys perform household chores than girls (45.1% vs. 53.4%). Moreover, the fraction of children not attending school but doing household chores is higher for girls than for boys (19.7% vs. 13.5%), while more boys than girls exclusively attend school (37.8% vs. 29.7%).
Table 18. Household Chores Activities and School Attendance of Children in Guatemala Household Chores
Attend No Yes TOT
No 16.9% 16.54% 33.44% 423 414 837
Yes 33.88% 32.68% 66.56% 848 818 1,666
TOT 50.78% 49.22% 100% 1,271 1,232 2,503
Note: Numbers are reported in italics.
Table 19. Household Chores Activities and School Attendance of Children by Sex in Guatemala
Household Chores
Male: Attend No Yes TOT
No 17.02% 13.52% 30.54% 219 174 393
Yes 37.84% 31.62% 69.46% 487 407 894
TOT 54.86% 45.14% 100% 706 581 1,287
Female: Attend No Yes TOT
No 16.78% 19.74% 36.51% 204 240 444
Yes 29.69% 33.80% 63.49% 361 411 772
TOT 46.46% 53.54% 100% 565 651 1,216
Note: Numbers are reported in italics.
56. Finally, we look at the three decisions contemporaneously in Table 20. In Panel A, we report the four combinations of work and household chores activities for children not attending school; in Panel B the four combination of work and household chores activities for children attending school are reported. The fraction of children neither working nor doing house works is higher among those not attending school than among those attending it (38% vs. 32%). Symmetrically, the fraction of children
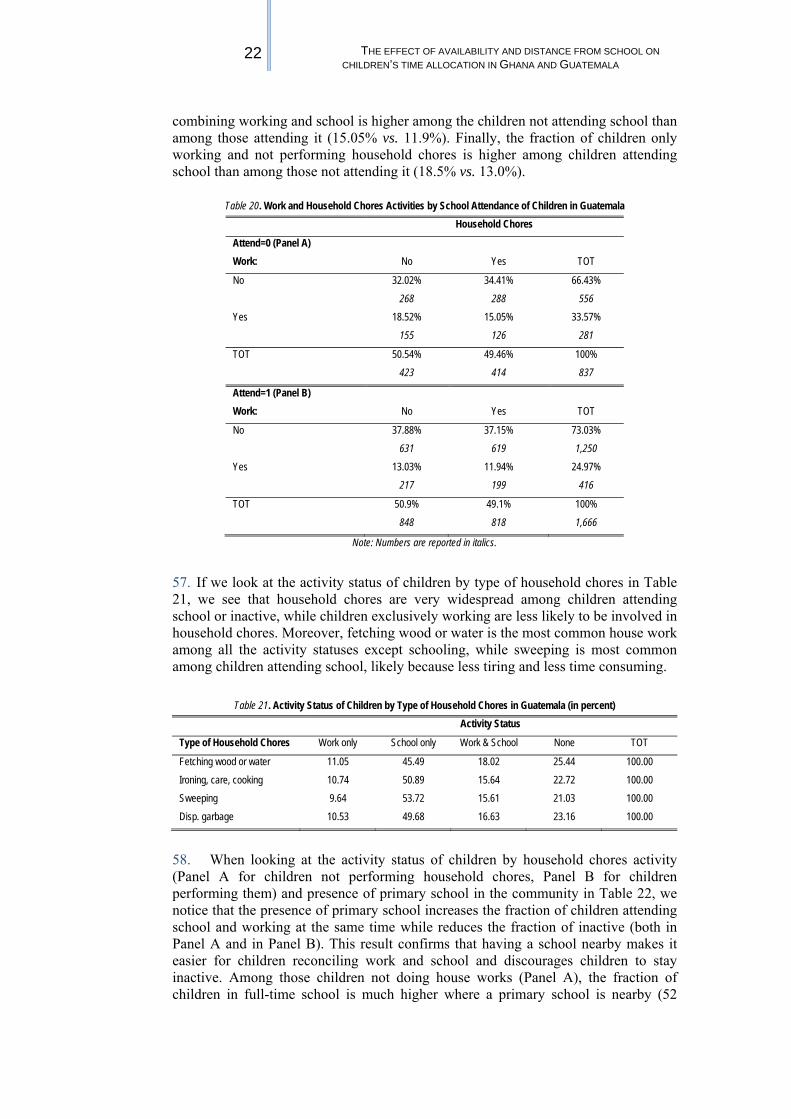
22 THE EFFECT OF AVAILABILITY AND DISTANCE FROM SCHOOL ON CHILDREN’S TIME ALLOCATION IN GHANA AND GUATEMALA
combining working and school is higher among the children not attending school than among those attending it (15.05% vs. 11.9%). Finally, the fraction of children only working and not performing household chores is higher among children attending school than among those not attending it (18.5% vs. 13.0%).
Table 20. Work and Household Chores Activities by School Attendance of Children in Guatemala
Household Chores
Attend=0 (Panel A) Work: No Yes TOT
No 32.02% 34.41% 66.43% 268 288 556
Yes 18.52% 15.05% 33.57% 155 126 281
TOT 50.54% 49.46% 100% 423 414 837
Attend=1 (Panel B) Work: No Yes TOT
No 37.88% 37.15% 73.03% 631 619 1,250
Yes 13.03% 11.94% 24.97% 217 199 416
TOT 50.9% 49.1% 100% 848 818 1,666
Note: Numbers are reported in italics.
57. If we look at the activity status of children by type of household chores in Table 21, we see that household chores are very widespread among children attending school or inactive, while children exclusively working are less likely to be involved in household chores. Moreover, fetching wood or water is the most common house work among all the activity statuses except schooling, while sweeping is most common among children attending school, likely because less tiring and less time consuming.
Table 21. Activity Status of Children by Type of Household Chores in Guatemala (in percent) Activity Status
Type of Household Chores Work only School only Work & School None TOT
Fetching wood or water 11.05 45.49 18.02 25.44 100.00 Ironing, care, cooking 10.74 50.89 15.64 22.72 100.00 Sweeping 9.64 53.72 15.61 21.03 100.00 Disp. garbage 10.53 49.68 16.63 23.16 100.00
58. When looking at the activity status of children by household chores activity (Panel A for children not performing household chores, Panel B for children performing them) and presence of primary school in the community in Table 22, we notice that the presence of primary school increases the fraction of children attending school and working at the same time while reduces the fraction of inactive (both in Panel A and in Panel B). This result confirms that having a school nearby makes it easier for children reconciling work and school and discourages children to stay inactive. Among those children not doing house works (Panel A), the fraction of children in full-time school is much higher where a primary school is nearby (52

23 UCW WORKING PAPER SERIES, MAY 2007
percent vs. 43 percent). When we look at children only working and not busy in household chores (Panel A), we do not see main differences between children in villages with primary schools and those living in villages without. Some differences emerge when we look at children doing household chores (Panel B). In this case, quite surprisingly the fraction of children exclusively working increases when a primary school is nearby. 59. Similar results are found when we consider the presence of secondary school in the community (Table 23). The only relevant difference with respect to Table 22 is that the presence of a secondary school nearby increases the fraction of children only studying and reduces the fraction of inactive children (both in Panels A and B). This could suggest that parents are more willing to send their children to primary school if there is the possibility to have access to secondary education, when the investment in human capital starts to be fruitful. Moreover, the presence of a secondary school nearby does not make any difference for children who perform household chores and work exclusively or combine work and school (Panel B), while for children not performing household chores the fraction of children attending school on a full-time basis or combining school and work increases when a secondary school is nearby (Panel A). Table 22. Activity Status of Children by Household Chores Activity and Presence of Primary School in Guatemala (in
percent) Activity Status
Panel A Household Chores=0 Work only School only Work & School None TOT No primary school 12.23 42.95 14.11 30.72 100.00 Presence primary school 12.18 51.89 18.07 17.86 100.00
Panel B Household Chores=1 Work only School only Work & School None TOT No primary school 8.22 50.93 13.79 27.06 100.00 Presence primary school 11.11 49.94 17.19 21.75 100.00
Table 23. Activity Status of Children by Household Chores Activity and Presence of Secondary School in Guatemala (in percent)
Activity Status
Panel A Household Chores=0 Work only School only Work & School None TOT No secondary school 11.71 47.66 16.70 23.93 100.00 Presence secondary school 13.84 56.40 18.34 11.42 100.00
Panel B Household Chores=1 Work only School only Work & School None TOT No secondary school 10.26 48.57 16.08 25.08 100.00 Presence secondary school 10.10 55.75 16.38 17.77 100.00
60. As for Ghana, in the rest of this section we focus on children economic activity and look at the work and school participation patterns of children in Guatemala by various disaggregations. As already found in Ghana, also in Guatemala age plays an important role in children’s time allocation (Table 24). The pattern is clear for working children whose fraction increases with age. On the contrary, the fraction of

24 THE EFFECT OF AVAILABILITY AND DISTANCE FROM SCHOOL ON CHILDREN’S TIME ALLOCATION IN GHANA AND GUATEMALA
children attending school on a full-time basis reaches a peak at age 9 (64.9%) and then decreases until 26.1% at age 14 when some children could have already finished the primary school. The trend is less clear for children combining work and school and inactive children, even if in this last case it is possible to detect a downward general trend: fewer children stay inactive as age increases. Table 25 shows that there are some sex disparities in the activity status of children. Girls are more likely to be at school full-time or to be inactive even if we should keep in mind that this last figure does not take into account household chores activities. On the contrary, boys are more likely to work full-time or to combine work and school. 61. In terms of income quintiles, the patterns of children exclusively working, attending school or inactive show a steady decrease with higher level of income (see Table 26). It is evident that richer households have a higher percentage of children in school on a full-time basis and a lower percentage working or being inactive compared to those households with lower levels of prosperity. Instead, the trend is less clear for children combining school and work.
Table 24. Activity Status of Children by Age in Guatemala (in percent) Activity Status
Age Work only School only Work & School None TOT
7 2.26 54.24 6.50 37.01 100.00 8 1.69 62.71 6.50 29.10 100.00 9 4.72 64.78 12.89 17.61 100.00 10 8.71 53.75 20.12 17.42 100.00 11 12.07 50.69 18.62 18.62 100.00 12 12.31 46.85 25.23 15.62 100.00 13 20.96 30.51 28.31 20.22 100.00 14 36.14 26.10 18.88 18.88 100.00
Table 25. Activity Status of Children by Sex in Guatemala (in percent) Activity Status
Sex Work only School only Work & School None TOT
Male 13.99 46.85 22.61 16.55 100.00 Female 8.31 53.21 10.28 28.21 100.00
Table 26. Activity Status of Children by Income Quintile in Guatemala (in percent) Activity Status
Income quintile Work only School only Work & School None TOT
Lowest 12.76 41.21 13.52 32.51 100.00 Second 11.56 50.88 20.41 17.14 100.00 Third 8.82 60.78 14.46 15.93 100.00 Fourth 8.85 62.83 21.24 7.08 100.00 Highest 6.58 65.79 21.05 6.58 100.00
62. Parental education does indeed emerge as an important factor in explaining household decisions about children’s education and work (Table 27). In particular, we notice that the higher the level of parental education, the higher the fraction of

25 UCW WORKING PAPER SERIES, MAY 2007
children studying full-time and the lower the fraction of working or inactive children. Most of the change happens when going from parents’ primary education to more than primary education. Instead the pattern is less clear for children both working and studying, as also found for Ghana. Overall, we find that child work and inactivity (school attendance) decrease (increases) when parental education increases. 63. When considering the socio-economic group of parents in Table 28, we see that parents in wage employment have the highest (lowest) incidence of children studying (working and studying together). The highest incidence of child work is instead found for children belonging to households whose mother works but is unpaid and whose father has a daily employment. The precariousness of family financial resources could foster children work.
Table 27. Activity Status of Children by Education of Parents in Guatemala (in percent) Activity Status
Education Level Work only School only Work & School None TOT
Father’s education Illiterate 12.40 45.28 15.94 26.38 100.00 Up to primary 11.37 49.84 16.86 21.93 100.00 Above primary 4.13 71.07 15.70 9.09 100.00
Mother’s education Illiterate 11.76 48.82 13.53 25.88 100.00 Up to primary 9.90 49.59 16.91 22.16 100.00 Above primary 0.00 81.25 12.50 6.25 100.00
Table 28. Activity Status of Children by Parental Work Status in Guatemala (in percent) Activity Status
Work only School only Work & School None Tot
Father’s work status Unpaid 13.17 43.39 37.04 7.41 100.00 Self employment 14.21 50.84 20.37 14.58 100.00 Daily employment 15.32 37.10 29.03 18.55 100.00 Wage employment 13.24 66.18 8.82 11.76 100.00 No Work (or missing) 9.46 51.14 11.42 27.98 100.00
Mother’s work status Unpaid 17.39 43.48 17.39 21.74 100.00 Self employment 12.30 49.29 18.65 19.76 100.00 Daily employment 10.89 47.38 16.13 25.60 100.00 Wage employment 6.11 61.94 9.17 22.78 100.00 No Work (or missing) 12.64 44.23 17.58 25.22 100.00
64. Looking at children’s time allocation across areas in Table 29, we can see that there are huge inter-area disparities in children’s school attendance and work participation rates. The Metropolitan area has the highest fraction of children working, Suroriente has over 70% of children in full-time education, in Central area over 25% of children combine work and school, and Nororiente has the highest fraction of inactive children (almost 33%).

26 THE EFFECT OF AVAILABILITY AND DISTANCE FROM SCHOOL ON CHILDREN’S TIME ALLOCATION IN GHANA AND GUATEMALA
Table 29. Activity Status of Children by Region in Guatemala (in percent)
Activity Status
Region Work only School only Work & School None TOT
Metropolitan 18.52 35.19 9.26 21.89 100.00 Norte 11.50 44.71 16.14 27.64 100.00 Nororiente 14.55 47.27 5.45 32.73 100.00 Suroriente 5.26 71.05 7.89 15.79 100.00 Central 16.20 47.89 25.35 10.56 100.00 Suroccidente 5.62 58.92 20.54 14.91 100.00 Noroccidente 11.29 49.10 12.75 26.86 100.00 Peten 7.29 59.38 13.54 19.79 100.00
65. As reported in Table A4 in the Appendix, the presence of facilities in the community seems to affect mainly the children‘s full-time schooling and inactivity, increasing the first and decreasing the second (with the exception of having public light and transportation which affect the choice of combining work and school). 66. As for Ghana, also in Guatemala primary-aged children are involved in schooling, in work and in household chores activities. Moreover, in Guatemala children are less involved in full-time education and spend more time doing household chores than in Ghana. Also the presence of inactive children seems to be a relevant problem in Guatemala. 67. In what follows, we investigate the determinants of households’ choices concerning their children’s time allocation with a particular focus on the effect of distance from and availability of schools on children’s behavior in Ghana and in Guatemala.
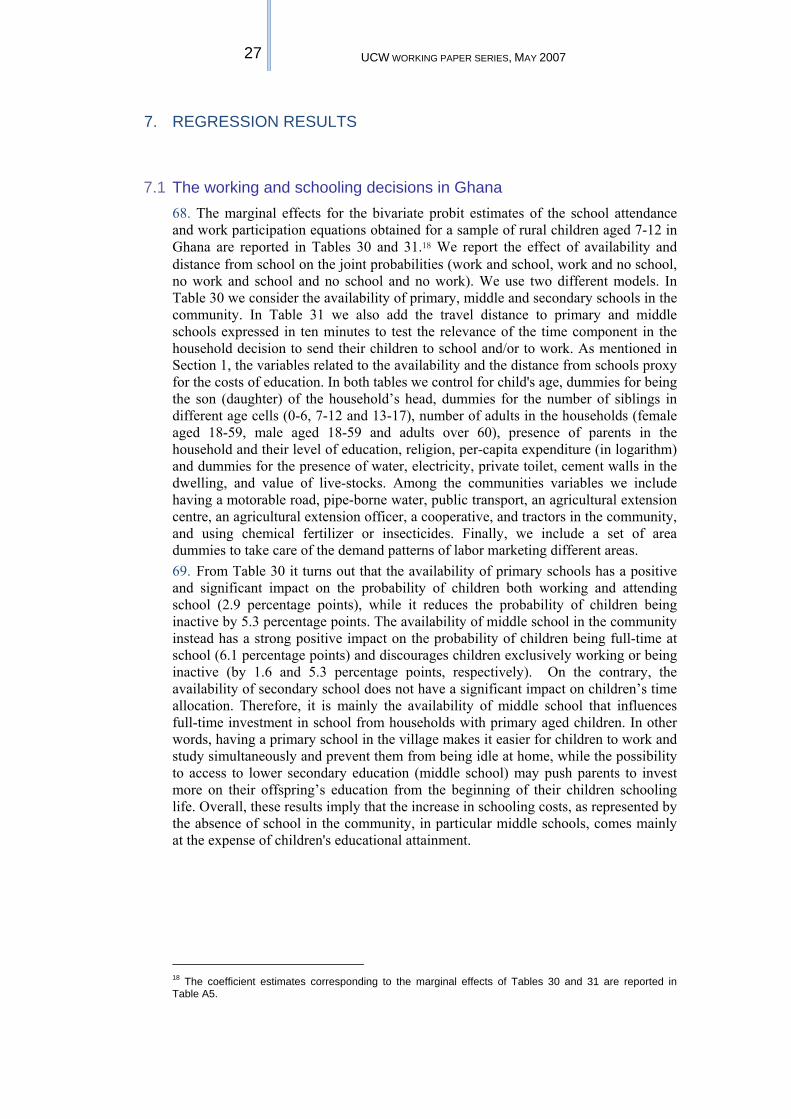
27 UCW WORKING PAPER SERIES, MAY 2007
7. REGRESSION RESULTS
7.1 The working and schooling decisions in Ghana 68. The marginal effects for the bivariate probit estimates of the school attendance and work participation equations obtained for a sample of rural children aged 7-12 in Ghana are reported in Tables 30 and 31.18 We report the effect of availability and distance from school on the joint probabilities (work and school, work and no school, no work and school and no school and no work). We use two different models. In Table 30 we consider the availability of primary, middle and secondary schools in the community. In Table 31 we also add the travel distance to primary and middle schools expressed in ten minutes to test the relevance of the time component in the household decision to send their children to school and/or to work. As mentioned in Section 1, the variables related to the availability and the distance from schools proxy for the costs of education. In both tables we control for child's age, dummies for being the son (daughter) of the household’s head, dummies for the number of siblings in different age cells (0-6, 7-12 and 13-17), number of adults in the households (female aged 18-59, male aged 18-59 and adults over 60), presence of parents in the household and their level of education, religion, per-capita expenditure (in logarithm) and dummies for the presence of water, electricity, private toilet, cement walls in the dwelling, and value of live-stocks. Among the communities variables we include having a motorable road, pipe-borne water, public transport, an agricultural extension centre, an agricultural extension officer, a cooperative, and tractors in the community, and using chemical fertilizer or insecticides. Finally, we include a set of area dummies to take care of the demand patterns of labor marketing different areas. 69. From Table 30 it turns out that the availability of primary schools has a positive and significant impact on the probability of children both working and attending school (2.9 percentage points), while it reduces the probability of children being inactive by 5.3 percentage points. The availability of middle school in the community instead has a strong positive impact on the probability of children being full-time at school (6.1 percentage points) and discourages children exclusively working or being inactive (by 1.6 and 5.3 percentage points, respectively). On the contrary, the availability of secondary school does not have a significant impact on children’s time allocation. Therefore, it is mainly the availability of middle school that influences full-time investment in school from households with primary aged children. In other words, having a primary school in the village makes it easier for children to work and study simultaneously and prevent them from being idle at home, while the possibility to access to lower secondary education (middle school) may push parents to invest more on their offspring’s education from the beginning of their children schooling life. Overall, these results imply that the increase in schooling costs, as represented by the absence of school in the community, in particular middle schools, comes mainly at the expense of children's educational attainment.
18 The coefficient estimates corresponding to the marginal effects of Tables 30 and 31 are reported in Table A5.
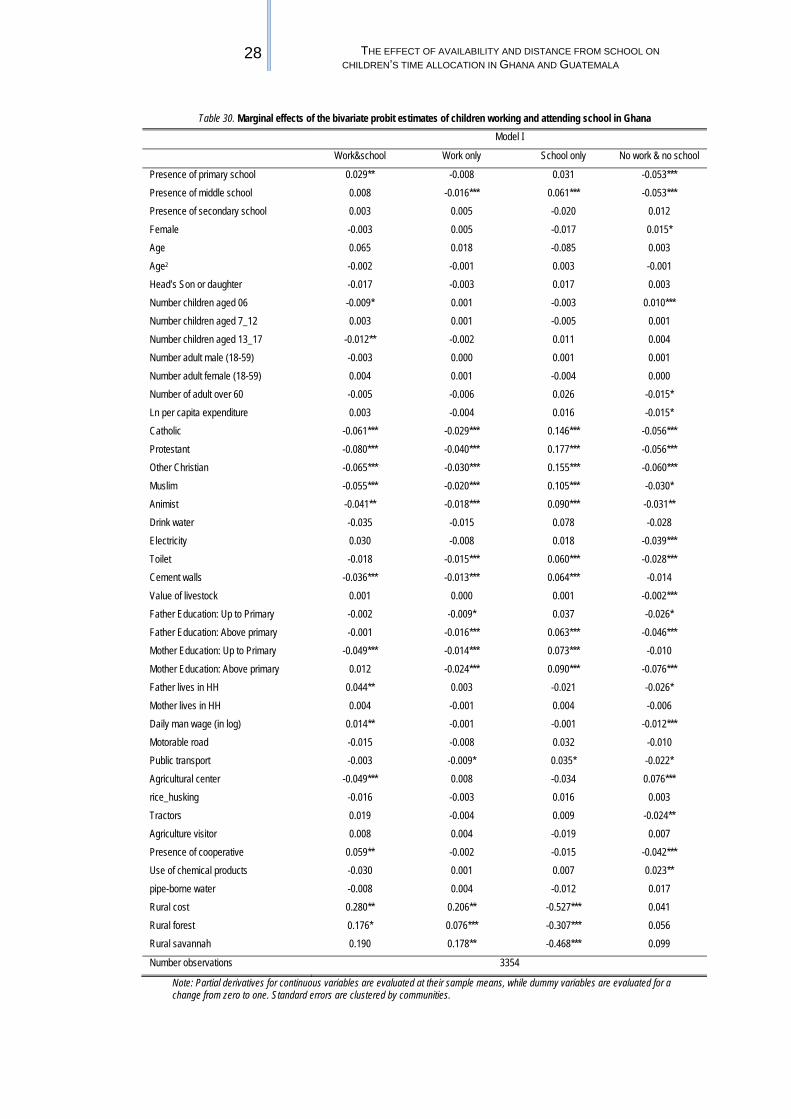
28 THE EFFECT OF AVAILABILITY AND DISTANCE FROM SCHOOL ON CHILDREN’S TIME ALLOCATION IN GHANA AND GUATEMALA
Table 30. Marginal effects of the bivariate probit estimates of children working and attending school in Ghana
Model I
Work&school Work only School only No work & no school
Presence of primary school 0.029** -0.008 0.031 -0.053*** Presence of middle school 0.008 -0.016*** 0.061*** -0.053*** Presence of secondary school 0.003 0.005 -0.020 0.012 Female -0.003 0.005 -0.017 0.015* Age 0.065 0.018 -0.085 0.003 Age2 -0.002 -0.001 0.003 -0.001 Head’s Son or daughter -0.017 -0.003 0.017 0.003 Number children aged 06 -0.009* 0.001 -0.003 0.010*** Number children aged 7_12 0.003 0.001 -0.005 0.001 Number children aged 13_17 -0.012** -0.002 0.011 0.004 Number adult male (18-59) -0.003 0.000 0.001 0.001 Number adult female (18-59) 0.004 0.001 -0.004 0.000 Number of adult over 60 -0.005 -0.006 0.026 -0.015* Ln per capita expenditure 0.003 -0.004 0.016 -0.015* Catholic -0.061*** -0.029*** 0.146*** -0.056*** Protestant -0.080*** -0.040*** 0.177*** -0.056*** Other Christian -0.065*** -0.030*** 0.155*** -0.060*** Muslim -0.055*** -0.020*** 0.105*** -0.030* Animist -0.041** -0.018*** 0.090*** -0.031** Drink water -0.035 -0.015 0.078 -0.028 Electricity 0.030 -0.008 0.018 -0.039*** Toilet -0.018 -0.015*** 0.060*** -0.028*** Cement walls -0.036*** -0.013*** 0.064*** -0.014 Value of livestock 0.001 0.000 0.001 -0.002*** Father Education: Up to Primary -0.002 -0.009* 0.037 -0.026* Father Education: Above primary -0.001 -0.016*** 0.063*** -0.046*** Mother Education: Up to Primary -0.049*** -0.014*** 0.073*** -0.010 Mother Education: Above primary 0.012 -0.024*** 0.090*** -0.076*** Father lives in HH 0.044** 0.003 -0.021 -0.026* Mother lives in HH 0.004 -0.001 0.004 -0.006 Daily man wage (in log) 0.014** -0.001 -0.001 -0.012*** Motorable road -0.015 -0.008 0.032 -0.010 Public transport -0.003 -0.009* 0.035* -0.022* Agricultural center -0.049*** 0.008 -0.034 0.076*** rice_husking -0.016 -0.003 0.016 0.003 Tractors 0.019 -0.004 0.009 -0.024** Agriculture visitor 0.008 0.004 -0.019 0.007 Presence of cooperative 0.059** -0.002 -0.015 -0.042*** Use of chemical products -0.030 0.001 0.007 0.023** pipe-borne water -0.008 0.004 -0.012 0.017 Rural cost 0.280** 0.206** -0.527*** 0.041 Rural forest 0.176* 0.076*** -0.307*** 0.056 Rural savannah 0.190 0.178** -0.468*** 0.099
Number observations 3354
Note: Partial derivatives for continuous variables are evaluated at their sample means, while dummy variables are evaluated for a change from zero to one. Standard errors are clustered by communities.

29 UCW WORKING PAPER SERIES, MAY 2007
70. In Table 31, we include an additional measure of educational costs, namely the travel distance from primary and middle schools. The variables related to travel distance from primary school yield interesting results: the further the school the less likely children are to attend school or to combine work and school and more likely are to work (by -0.3, -0.2 and 0.1 percentage points respectively for each additional 10 minutes of travel). The distance from middle school has no effect on the probability of a child attending school or working, while it has a significant negative effect on the probability of combining work and school (-0.2 percentage points), even if only weakly significant (a similar result can be found in Deb and Rosati 2004). The results concerning the availability of schools in the community do not change with respect to Table 30. 71. Overall these results suggest that the distance to primary school is an important component together with the school availability in the simultaneous households’ decisions of sending children to work and to school. The higher the distance from primary school the more difficult for children is to reconcile both activities, but the presence of schools (especially middle) encourages school attendance on a full-time basis. The distance from middle school instead does not play any role in household’s decisions. When doing a long term investment on their primary aged children, parents look at the availability of infrastructures (both primary and middle schools) but they care less about travel distance, at least from middle schools. Given that the returns to education tend to be higher for secondary than for primary education, parents may have an incentive to send their children to primary school rather than to work if children may also have access to higher education.
Table 31. Marginal effects of the bivariate probit estimates of children working and attending school in Ghana
Model II
Work & school Work only School only No work & no school
Distance to primary school * -0.002*** 0.001*** -0.003*** 0.001 Distance to middle school * -0.002* 0.000 0.002 0.000 Presence of primary school 0.031** -0.007 0.026 -0.05*** Presence of middle school 0.008 -0.016*** 0.060*** -0.053*** Presence of secondary school 0.003 0.005 -0.020 0.012 Female -0.003 0.005 -0.018 0.016* Age 0.067* 0.017 -0.085 0.001 Age2 -0.002 -0.001 0.003 -0.001 Head’s Son or daughter -0.019 -0.004 0.020 0.003 Number children aged 06 -0.009* 0.001 -0.002 0.010*** Number children aged 7_12 0.004 0.001 -0.006 0.001 Number children aged 13_17 -0.0125** -0.002 0.010 0.004 Number adult male (18-59) -0.003 0.000 0.001 0.002 Number adult female (18-59) 0.004 0.001 -0.005 0.000 Number of adult over 60 -0.005 -0.006** 0.026* -0.015* Ln per capita expenditure 0.001 -0.005 0.020 -0.016** Catholic -0.061*** -0.028*** 0.147*** -0.057*** Protestant -0.080*** -0.039*** 0.176*** -0.056*** Other Christian -0.065*** -0.030*** 0.155*** -0.060***

30 THE EFFECT OF AVAILABILITY AND DISTANCE FROM SCHOOL ON CHILDREN’S TIME ALLOCATION IN GHANA AND GUATEMALA
Muslim -0.056*** -0.020*** 0.106*** -0.031* Animist -0.040* -0.017*** 0.089*** -0.031** Drink water -0.036 -0.015 0.078 -0.027 Electricity 0.029 -0.008 0.018 -0.038*** Toilet -0.018 -0.015*** 0.061*** -0.029*** Cement walls -0.035*** -0.013*** 0.063*** -0.015 Value of livestock 0.002 0.000 0.001 -0.002*** Father Education: Up to Primary -0.005 -0.01*** 0.041 -0.026* Father Education: Above primary -0.002 -0.016*** 0.065*** -0.046*** Mother Education: Up to Primary -0.047*** -0.013*** 0.069*** -0.008 Mother Education: Above primary 0.012 -0.024*** 0.087*** -0.076*** Father lives in HH 0.047*** 0.003 -0.024 -0.026* Mother lives in HH 0.004 -0.001 0.004 -0.006 Daily man wage (in log) 0.013* -0.001 -0.001 -0.012** Motorable road -0.010 -0.005 0.023 -0.007 Public transport -0.006 -0.009* 0.037* -0.021* Agricultural center -0.049*** 0.007 -0.033 0.075*** rice_husking -0.013 -0.002 0.009 0.006 Tractors 0.016 -0.005 0.012 -0.024** Agriculture visitor 0.005 0.003 -0.013 0.005 Presence of cooperative 0.059*** -0.001 -0.018 -0.040*** Use of chemical products -0.029* 0.002 0.003 0.024*** pipe-borne water -0.009 0.003 -0.010 0.016 Rural cost 0.282** 0.203** -0.526*** 0.041 Rural forest 0.177* 0.074** -0.304*** 0.053 Rural savannah 0.189 0.169** -0.455*** 0.097
Number observations 3354
Note: Partial derivatives for continuous variables are evaluated at their sample means, while dummy variables are evaluated for a change from zero to one. Standard errors are clustered by communities.
72. Concerning the other variables,19 we find that girls are more likely to be at home neither working nor attending school (1.6 percentage points). However, the data could tell us a different story about the effect of gender when the household chores are explicitly taken into account (see section 7.3). 73. It has been argued in the past that the age, presence and gender of siblings have a strong effect on schooling and working patterns of households’ members (Chernichovsky, 1985). In our context, age has an effect only on the probability of children combining work and school (3.1 percentage points). Among the variables included to capture the household composition, the variables that turn out to be significant on the children’s probability of working and attending school are only the number of siblings aged 0-6, which reduces the probability of primary-age school age children to combine work and school by 0.9 percentage points, and the number of siblings aged 13-17 which has a negative effect of 1.3 percentage points. Moreover, each additional sibling aged 0-6 increases the probability that a child is inactive by 1.0 percentage points, likely due to the need of child care provision. Finally, adults over 60 years of age reduce the probability of a children being inactive by 1.5
19 We only comment on the coefficients in Table 31; however, the effects of all the covariates both in size and in sign are very similar across Tables 30 and 31.

31 UCW WORKING PAPER SERIES, MAY 2007
percentage points, likely because they could act as substitutes of young children at least for light house works, and the probability of exclusively working (-0.6 percentage points), while it encourages full-time school attendance (2.6 percentage points). 74. The income effect captured through the per-capita expenditure variable is negative and significant (about 1.5 percentage points) on the probability of being inactive, suggesting that richer families tend to keep their children busy in some other activities. Quite surprisingly, we do not find a positive income effect on child schooling, as instead observed in other countries (see Behrman and Knowles 1999 and Duraisamy 2000, among others). 75. Religious dummies do matter both for child work force participation and child school attendance. In particular, all religious group dummies are significantly different from the reference group (being no religious). Protestant are 18 percentage points, Other Christian 16 percentage points, Catholic 15 percentage points, Muslim 11 percentage points and Animist 9.0 percentage points more likely to send their children full-time to school. In a symmetric way, all the religious groups are less likely to make their children working, combining school and work or being inactive at home. This suggests that religious groups may have a significant influence not only on the values of education in societies but also on the facilities that they provide through fees or subsidized education facilities, which represent an incentive for parents to send their children to school. Not by chance, primary schools in Ghana are often run by Churches or Church organization, which play a leading role in encouraging school participation behavior. 76. When looking at the wealth proxies, we find that in general wealthier families prefer to send their children to school and discourage children from working or being inactive. 77. Our estimations also show that father’s education influences children work and schooling participation with an effect increasing with educational level. In particular, having a father with more than a primary school diploma increases the probability of a child attending full-time school by 6.5 percentage points; on the contrary, the effect is not significant when the father has attended up to the primary school (the reference category is being illiterate or missing). Moreover, educated fathers are less likely to make their children exclusively work or be inactive. If the father is present in the household, children are 4.7 percentage points more likely to combine work and school and 2.6 percentage points less likely to be inactive. This effect could be due to the fact that, as mentioned above, most workers are farmers in Ghana and children may work unpaid for an enterprise belonging to the household. Concerning mothers’ educational status, we see that children with mothers having a (more than) primary school diploma are 6.9 (8.7) percentage points more likely to go full-time to school, children whose mothers have primary school education are 4.7 percentage points less likely to work and attend school, while children whose mothers have more than primary school are 7.6 percentage points less likely to be inactive. Finally, the higher the mother’s educational level, the lower the probability that a child works full-time. In general, parental education has a stronger positive effect on children school participation than on children work decisions and mother’s education has a bigger effect than father’s education. There are at least two explanations for these results: i) more educated mothers have bigger bargaining power inside the households; it could have a positive effect on children welfare if mothers care more for their children than fathers (Thomas 1990); ii) more educated parents know better the returns to education and this could lead them helping their children to pursue this choice (Guarcello et al. 2005).

32 THE EFFECT OF AVAILABILITY AND DISTANCE FROM SCHOOL ON CHILDREN’S TIME ALLOCATION IN GHANA AND GUATEMALA
78. Concerning the variables that measure the variations across regions in the return to human capital, the existence of a cooperative in the village is positively correlated with children attending school and working (5.9 percentage points) and negatively correlated with children being inactive (-4.0 percentage points). This result is consistent with the view that many children work in the household's enterprise which makes it easier for them to reconcile school and work. The adult agricultural wage rates increases the children’s probability of jointly attending school and working by 1.3 percentage points, and it decreases children’s probability of being inactive by 1.2 percentage points. This result is easily explained if the adult wage rate is considered as a proxy for children’s opportunity cost of spending their time at school. As expected, having a public transport passing by the community increases the probability of a child attending school on a full-time basis by 3.7 percentage points, and it decreases the probability of a child working or being inactive by 0.9 and 2.2 percentage points, respectively. Having an agricultural extension officer affects negatively the probability of a child working and attending school by 4.9, and it increases his/her probability of being inactive by 7.5 percentage points. Despite the fact that the intensive use of chemicals in agriculture might be interpreted as a proxy of technological progress in the community, surprisingly we find that it has a positive effect on the probability on being inactive 2.4 percentage points, while it does not affect children working and schooling choices. Finally, having tractors discourages children inactivity by 2.4 percentage points. 79. Area dummies show coefficients that are in general significantly different from the reference category, the urban area. In particular, leaving away from urban area decreases the probability that children attend school on a full-time basis and it increases the probability that a child only works or combines work and school. In general, these effects are stronger in Rural Coastal area than in Rural Savannah likely because agricultural opportunities are more limited and weather dependent in rural Savannah as opposed to Rural Coastal. 80. Finally, the coefficients of correlation between the errors of the two equations in both models as reported in Table A5 are both negative and strongly significant, thus indicating a trade-off between the unobservable components of the households’ decisions concerning their primary-age children’s employment and school attendance, whereas these two activities seem to compete with each others.
7.2 The working and schooling decisions in Guatemala 81. The marginal effects for the bivariate probit estimates of the school attendance and work participation equations obtained for a sample of indigenous children aged 7-14 are reported in Tables 32 and 33.20 As mentioned in Section 5.2, we focus on the sample of indigenous children in Guatemala, because it represents the most critical group among primary-age school children. Looking at the fraction of children by ethnic group with a primary or a secondary school nearby, we see that the same fraction of indigenous and non indigenous children has a primary school nearby (slightly more than 70%), while the fraction of children with a secondary school nearby is much lower for the indigenous than for the non indigenous children (23.1 vs. 31.4). Not significantly differences in terms of distance from primary and secondary schools emerge between indigenous and non-indigenous children. 82. In Table A6 we report the activity status rates of children by availability of primary and secondary schools in the community and the average distance from 20 The coefficient estimates corresponding to the marginal effects of Tables 32 and 33 are reported in Table A7.
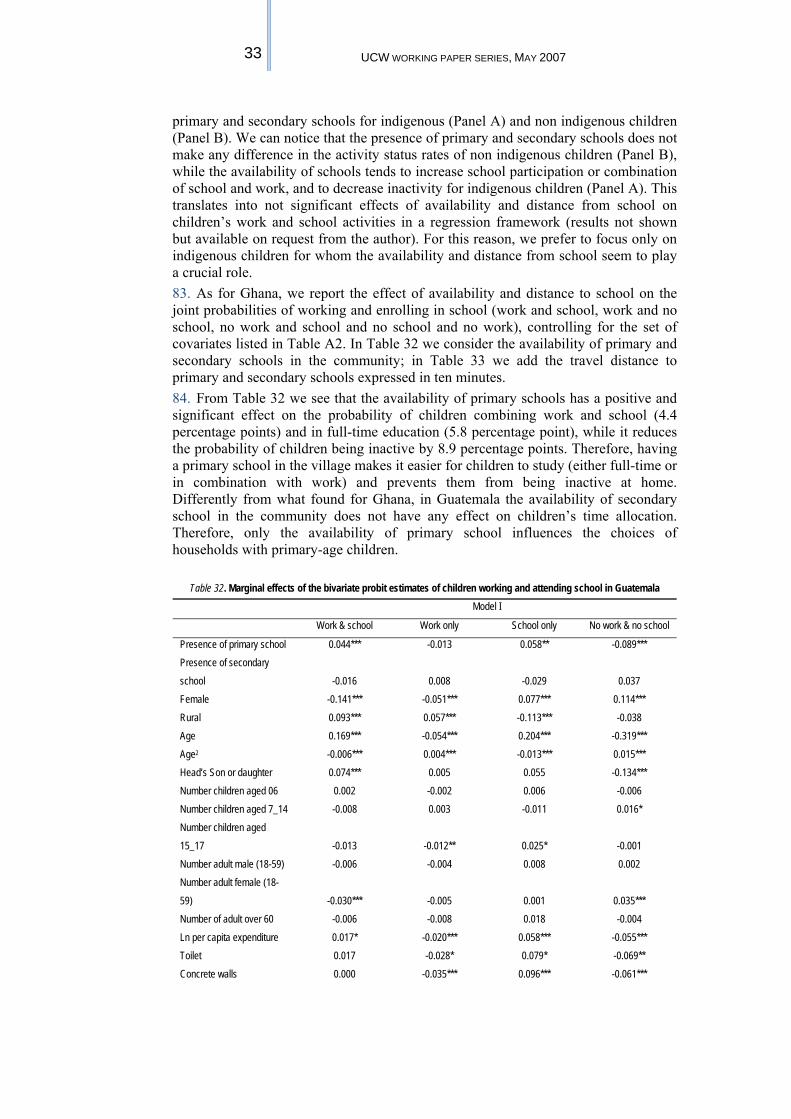
33 UCW WORKING PAPER SERIES, MAY 2007
primary and secondary schools for indigenous (Panel A) and non indigenous children (Panel B). We can notice that the presence of primary and secondary schools does not make any difference in the activity status rates of non indigenous children (Panel B), while the availability of schools tends to increase school participation or combination of school and work, and to decrease inactivity for indigenous children (Panel A). This translates into not significant effects of availability and distance from school on children’s work and school activities in a regression framework (results not shown but available on request from the author). For this reason, we prefer to focus only on indigenous children for whom the availability and distance from school seem to play a crucial role. 83. As for Ghana, we report the effect of availability and distance to school on the joint probabilities of working and enrolling in school (work and school, work and no school, no work and school and no school and no work), controlling for the set of covariates listed in Table A2. In Table 32 we consider the availability of primary and secondary schools in the community; in Table 33 we add the travel distance to primary and secondary schools expressed in ten minutes. 84. From Table 32 we see that the availability of primary schools has a positive and significant effect on the probability of children combining work and school (4.4 percentage points) and in full-time education (5.8 percentage point), while it reduces the probability of children being inactive by 8.9 percentage points. Therefore, having a primary school in the village makes it easier for children to study (either full-time or in combination with work) and prevents them from being inactive at home. Differently from what found for Ghana, in Guatemala the availability of secondary school in the community does not have any effect on children’s time allocation. Therefore, only the availability of primary school influences the choices of households with primary-age children.
Table 32. Marginal effects of the bivariate probit estimates of children working and attending school in Guatemala
Model I
Work & school Work only School only No work & no school
Presence of primary school 0.044*** -0.013 0.058** -0.089*** Presence of secondary school -0.016 0.008 -0.029 0.037 Female -0.141*** -0.051*** 0.077*** 0.114*** Rural 0.093*** 0.057*** -0.113*** -0.038 Age 0.169*** -0.054*** 0.204*** -0.319*** Age2 -0.006*** 0.004*** -0.013*** 0.015*** Head’s Son or daughter 0.074*** 0.005 0.055 -0.134*** Number children aged 06 0.002 -0.002 0.006 -0.006 Number children aged 7_14 -0.008 0.003 -0.011 0.016* Number children aged 15_17 -0.013 -0.012** 0.025* -0.001 Number adult male (18-59) -0.006 -0.004 0.008 0.002 Number adult female (18-59) -0.030*** -0.005 0.001 0.035*** Number of adult over 60 -0.006 -0.008 0.018 -0.004 Ln per capita expenditure 0.017* -0.020*** 0.058*** -0.055*** Toilet 0.017 -0.028* 0.079* -0.069** Concrete walls 0.000 -0.035*** 0.096*** -0.061***
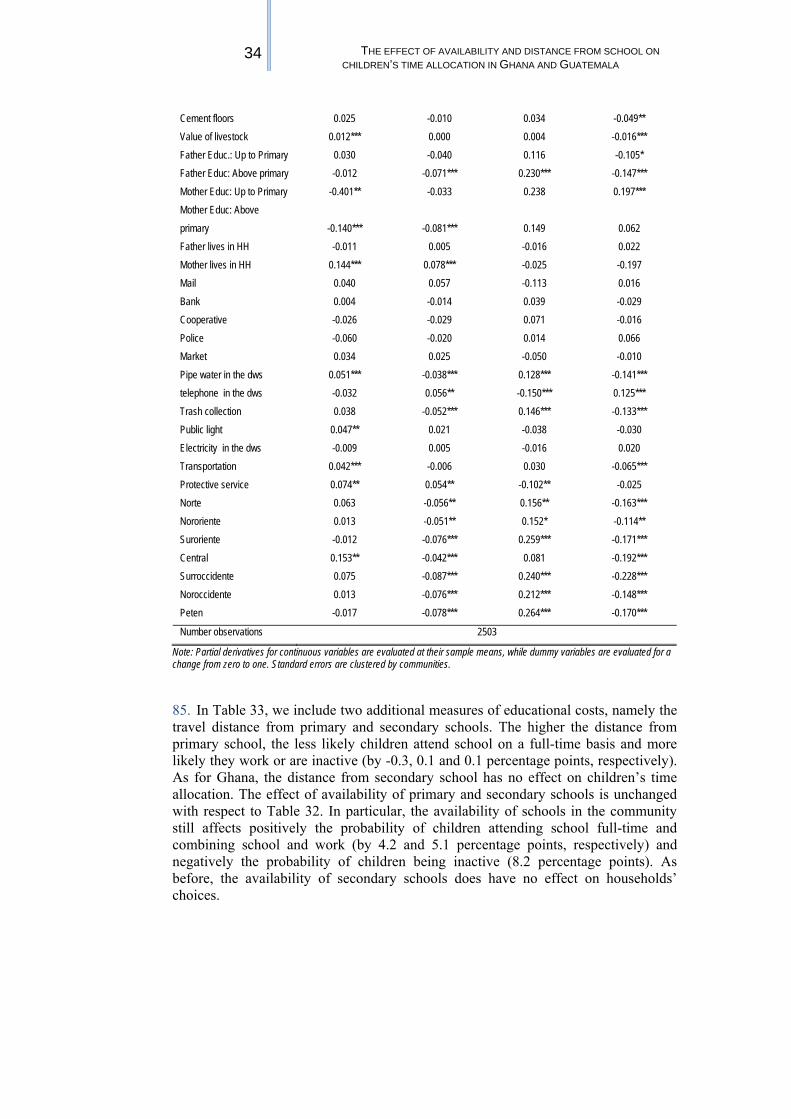
34 THE EFFECT OF AVAILABILITY AND DISTANCE FROM SCHOOL ON CHILDREN’S TIME ALLOCATION IN GHANA AND GUATEMALA
Cement floors 0.025 -0.010 0.034 -0.049** Value of livestock 0.012*** 0.000 0.004 -0.016*** Father Educ.: Up to Primary 0.030 -0.040 0.116 -0.105* Father Educ: Above primary -0.012 -0.071*** 0.230*** -0.147*** Mother Educ: Up to Primary -0.401** -0.033 0.238 0.197*** Mother Educ: Above primary -0.140*** -0.081*** 0.149 0.062 Father lives in HH -0.011 0.005 -0.016 0.022 Mother lives in HH 0.144*** 0.078*** -0.025 -0.197 Mail 0.040 0.057 -0.113 0.016 Bank 0.004 -0.014 0.039 -0.029 Cooperative -0.026 -0.029 0.071 -0.016 Police -0.060 -0.020 0.014 0.066 Market 0.034 0.025 -0.050 -0.010 Pipe water in the dws 0.051*** -0.038*** 0.128*** -0.141*** telephone in the dws -0.032 0.056** -0.150*** 0.125*** Trash collection 0.038 -0.052*** 0.146*** -0.133*** Public light 0.047** 0.021 -0.038 -0.030 Electricity in the dws -0.009 0.005 -0.016 0.020 Transportation 0.042*** -0.006 0.030 -0.065*** Protective service 0.074** 0.054** -0.102** -0.025 Norte 0.063 -0.056** 0.156** -0.163*** Nororiente 0.013 -0.051** 0.152* -0.114** Suroriente -0.012 -0.076*** 0.259*** -0.171*** Central 0.153** -0.042*** 0.081 -0.192*** Surroccidente 0.075 -0.087*** 0.240*** -0.228*** Noroccidente 0.013 -0.076*** 0.212*** -0.148*** Peten -0.017 -0.078*** 0.264*** -0.170***
Number observations 2503
Note: Partial derivatives for continuous variables are evaluated at their sample means, while dummy variables are evaluated for a change from zero to one. Standard errors are clustered by communities.
85. In Table 33, we include two additional measures of educational costs, namely the travel distance from primary and secondary schools. The higher the distance from primary school, the less likely children attend school on a full-time basis and more likely they work or are inactive (by -0.3, 0.1 and 0.1 percentage points, respectively). As for Ghana, the distance from secondary school has no effect on children’s time allocation. The effect of availability of primary and secondary schools is unchanged with respect to Table 32. In particular, the availability of schools in the community still affects positively the probability of children attending school full-time and combining school and work (by 4.2 and 5.1 percentage points, respectively) and negatively the probability of children being inactive (8.2 percentage points). As before, the availability of secondary schools does have no effect on households’ choices.

35 UCW WORKING PAPER SERIES, MAY 2007
Table 33. Marginal effects of the bivariate probit estimates of children working and attending school in Guatemala Model II
Work & school Work only School only No work & no school
Distance primary school -0.001 0.001* -0.003** 0.003** Distance secondary school 0.000 0.000 0.000 0.000 Presence of primary school 0.042*** -0.011 0.051** -0.082*** Presence of secondary school -0.016 0.008 -0.027 0.035 Female -0.140*** -0.051*** 0.078*** 0.113*** Rural 0.094*** 0.058*** -0.114*** -0.039 Age 0.169*** -0.053*** 0.203*** -0.317*** Age2 -0.006*** 0.004*** -0.013*** 0.015*** Head’s Son or daughter 0.075*** 0.005 0.057 -0.137*** Number children aged 06 0.002 -0.002 0.006 -0.006 Number children aged 7_14 -0.008 0.003 -0.010 0.016* Number children aged 15_17 -0.013 -0.012** 0.026* -0.002 Number adult male (18-59) -0.005 -0.004 0.008 0.001 Number adult female (18-59) -0.031*** -0.005 0.000 0.036*** Number of adult over 60 -0.006 -0.008 0.018 -0.004 Ln per capita expenditure 0.017* -0.020*** 0.057*** -0.054*** Toilet 0.017 -0.028* 0.079* -0.068** Concrete walls 0.001 -0.036*** 0.098*** -0.063*** Cement floors 0.025 -0.010 0.032 -0.047*** Value of livestock 0.012*** 0.000 0.004 -0.016*** Father Educ.: Up to Primary 0.031 -0.042 0.120* -0.108* Father Educ: Above primary -0.011 -0.071*** 0.232*** -0.149*** Mother Educ: Up to Primary -0.410** -0.027 0.237 0.200*** Mother Educ: Above primary -0.131*** -0.080*** 0.134 0.078 Father lives in HH -0.012 0.006 -0.020 0.026 Mother lives in HH 0.145*** 0.077*** -0.011 -0.212 Mail 0.037 0.063 -0.124* 0.025 Bank 0.001 -0.010 0.026 -0.017 Cooperative -0.024 -0.033* 0.084 -0.028 Police -0.061 -0.020 0.015 0.066 Market 0.037 0.024 -0.046 -0.014 Pipe water in the dws 0.052*** -0.038*** 0.130*** -0.144*** telephone in the dws -0.030 0.056** -0.149*** 0.123*** Trash collection 0.040 -0.053*** 0.151*** -0.137*** Public light 0.046** 0.021 -0.038 -0.029 Electricity in the dws -0.008 0.004 -0.014 0.018 Transportation 0.042*** -0.006 0.028 -0.065*** Protective service 0.070** 0.057** -0.108*** -0.018 Norte 0.062 -0.055** 0.153** -0.160*** Nororiente 0.014 -0.048** 0.144 -0.109*** Suroriente -0.013 -0.076*** 0.258*** -0.169*** Central 0.153** -0.042*** 0.081 -0.192*** Surroccidente 0.075 -0.087*** 0.240*** -0.228*** Noroccidente 0.013 -0.075*** 0.209*** -0.146***

36 THE EFFECT OF AVAILABILITY AND DISTANCE FROM SCHOOL ON CHILDREN’S TIME ALLOCATION IN GHANA AND GUATEMALA
Peten -0.018 -0.077*** 0.260*** -0.165***
Number observations 2503 2503
Note: Partial derivatives for continuous variables are evaluated at their sample means, while dummy variables are evaluated for a change from zero to one. Standard errors are clustered by communities.
86. Concerning the other variables listed in Table 33, we find that child’s gender is very important in understanding households’ choices: girls are more likely to be at home neither working nor attending school (11.3 percentage points) but surprisingly they also more likely to attend school on a full-time basis (7.8 percentage points). At the same time, girls are less likely to work either in combination with school or full-time (respectively -5.1 and -14.0 percentage points). As for Ghana, the picture these estimates provide could be very different if household chores are taken explicitly into account (see section 7.4). 87. Age is an important determinant of households’ decisions; being the head’s son or daughter increases the probability of jointly attending school and working by 7.5 percentage points and reduces the probability of children being inactive by 13.7 percentage points. Among the variables included to capture the household composition, only the number of children aged 15-17 affects negatively (positively) the probability that a child works full-time (attends school full-time); this effect could be due to the reduced need of child care provision in presence of older children. Moreover, having an additional sibling aged 7-14 makes it more likely for a child to be inactive (but the effect is only slightly significant). Finally, the number of female adults aged 18-59 years of age reduces the probability of a child combining work and school by 3.1 percentage points and it increases the probability of a child being inactive by 3.6 percentage points, but it is hard to provide an explanation for this effect. 88. The income effect captured through the per-capita expenditure variable is negative and significant on the child’s probability of being inactive (5.4 percentage points) and on the child’s probability of working full-time (2.0 percentage points). Differently from what found in Ghana, there is a positive income effect on children school attendance (either full-time or in combination with work activity). This could suggest that richer families tend to value more human capital accumulation. 89. When looking at wealth proxies, as for Ghana, we find that wealthier families are more likely to send their children to school on a full-time basis and less likely to let them inactive at home or working full-time. Finally, the value of livestock discourages children inactivity and makes it more likely that children combine work and school. 90. Our estimations also show that parental education is an important determinant of children’s time allocation, in particular when parents hold more than primary education. Having a father with more than primary school diploma increases the probability of a child attending school on a full-time basis by 23.2 percentage points, while it discourages full-time work or inactivity by 7.1 and 14.9 percentage points respectively (the reference category is being illiterate or missing). Concerning mothers’ educational status, we see that children with mothers having less than primary school diploma are 41.0 (20.0) percentage points less (more) likely to combine work and school (to be inactive), while children whose mothers have more than primary school education are 13.1 and 8.0 percentage points less likely to jointly work and attend school or to work. In general, the higher the mother’s educational level, the lower the probability that a child works. Surprisingly, if the mother lives in the household, it makes more likely that a child works.

37 UCW WORKING PAPER SERIES, MAY 2007
91. Concerning the variables that measure the variations across regions in the returns to human capital accumulation, namely the community variables, we find that some of them are correlated with children school attendance and working decisions. Among others, we find interesting that having a public transport in the community increases the probability that a child combines school and work by 4.2 percentage points and decreases the child’s probability of being inactive by 6.5 percentage points. 92. Area dummies show coefficients that are in most cases significantly different from the reference category, the metropolitan area. In particular, leaving away from metropolitan area decreases the probability that a child works or is inactive, and it increases the probability that a child attends school on a full-time basis. 93. Finally, the coefficients of correlation between the errors of the two equations as reported in Table A7 are negative and strongly significant. As for Ghana, this suggests the existence of a trade-off between the unobservables of primary-age children employment and school attendance equations. 94. Overall these results convey the message that the distance and the availability of primary schools are important determinants of children’s time use. In particular, the availability of primary schools seems to encourage children’s school attendance (either on a full-time basis or in combination with work activities), while a higher distance from schools shifts children away from school towards inactivity or full-time work. Secondary schools do not seem to play any role in understanding households’ decisions. This result could be explained by the fact that indigenous households tend to behave myopically (for example, because of financial constrains) and do not consider the long term potential returns to investment in secondary education when deciding about their children’s time allocation.
7.3 The working, schooling and household chores decisions in Ghana 95. So far we have considered only children's economic activity. However, as mentioned before, in developing countries an important part of children's work is represented by household chores. In order to analyze the effect of schooling costs upon children's work, school attendance and household chores activities, we estimate equations 1, 2 and 3 simultaneously through a multivariate probit model. In Table 34 we report the marginal effect of the school availability variables (in Model I) and the travel distance variables (in Model II) on children’s time allocation, while controlling for all the covariates listed in Table A1 for Ghana.21 As dependent variable for household chores we use a dummy equal to one if a child does household domestic work for more than two hour per day, as defined in Section 5. 96. Model I in Table 34 shows that the availability of primary schools increases the probability of a child to attend school by 6.1 percentage points and it decreases the probability of a child of performing household chores by 6.9 percentage points, while the effect on the working decision is not statistically significant. Therefore there seems to be some substitutability only between schooling and household chores. Instead, a middle school in the village increases the probability of a child attending school by 6.9 percentage points, but neither working nor household chores activities are influenced by the presence of middle schools. Looking at Model II in Table 34 where the travel distances from schools are considered, it turns out that the effect of the
21 The coefficient estimates corresponding to the marginal effects of Table 34 are reported in Table A8.
38 THE EFFECT OF AVAILABILITY AND DISTANCE FROM SCHOOL ON CHILDREN’S TIME ALLOCATION IN GHANA AND GUATEMALA
travel distance variables on both children’s work in the labor market and in household chores is positive and significant. In particular, 10 additional minutes of travel time to primary school increase the child’s probability of working and doing household chores by respectively 0.24 and 0.18 percentage point. On the contrary, school attendance probability decreases by 0.15 percentage points. Therefore, distance from school plays a conflicting effect on children’s time allocation in that a higher distance from school seems to force households to choose between working and studying. Instead, the distance to middle school (in ten minutes) has a conflicting impact on children’s working and household chores activities. It is positive for household chores (0.41 percentage points) and negative for working (-0.27 percentage points). Finally, as found in Model I, the presence of schools of any type (primary, middle and secondary) does have no effect on children’s work but the presence of primary school discourages children household chores by 6.4 percentage points. The effect of the availability of schools (both primary and middle) on children school attendance is still positive (5.7 percentage points for primary school and 6.9 percentage points for middle school). However, the magnitude of the availability effect is much larger that the travel distance effect. In other words, what matters most in household’s decisions concerning their children’s time allocation is availability of schools in the community rather than travel distance from schools. We have also compared the marginal effects of the availability and distance from schools on the working and the schooling decisions obtained from the multivariate probit model and reported in Table 34 with the corresponding marginal effects obtained from the bivariate probit model (these last effects obtained from the marginal probabilities are not reported but available on request from the authors). The results are very similar across the two models. In other words, household chores activity is an important component of the children’s time allocation but including it in the model does not alter the impact of the other variables.

39 UCW WORKING PAPER SERIES, MAY 2007
Table 34. Marginal Effects of the trivariate probit estimates of children working, attending school and doing household chores in Ghana
Model I Model II
Work Schooling Household
Chores
Work Schooling Household Chores
Distance to primary school - - - .002*** -.001** .002** Distance to middle school - - - -.003** .000 .004*** Presence of primary school .021 .061*** -.069*** .024 .057*** -.064*** Presence of middle school -.007 .069*** -.011 -.007 .069*** -.011 Presence of secondary school .009 -.016 .025 .009 -.015 .025 Female .002 -.020* .092*** .0020 -.021* .094*** Age .082* -.018 .096* .083* -.016 .089* Age2 -.002 .002 -.002 -.003 .001 -.002 Head’s Son or daughter -.017 .001 -.023 -.020 .002 -.019 Number children aged 06 -.008 -.012** .029*** -.008 -.011** .028*** Number children aged 7_12 .005 -.002 -.006 .005 -.002 -.004 Number children aged 13_17 -.0148** -.002 -.044*** -.0150** -.002 -.044*** Number adult male (18-59) -.0028 -.001 -.019** -.003 -.002 -.017* Number adult female (18-59) .0050 -.002 -.007 .006 -.001 -.009 Number of adult over 60 -.0105 .021* .011 -.011 .021* .014 Ln per capita expenditure -.001 .020* .087*** -.003 .023** .080*** Catholic -.090*** .085*** -.079** -.090*** .086*** -.083*** Protestant -.122*** .096*** -.088*** -.120*** .096*** -.088*** Other Christian -.097*** .090*** -.085*** -.096*** .090*** -.088*** Muslim -.076*** .049** -.111*** -.076*** .051** -.115*** Animist -.060** .049** -.082** -.058** .049** -.085** Drink water -.050 .039 -.043 -.050 .038 -.034 Electricity .022 .048** -.008 .020 .046** -.001 Toilet -.032** .042*** -.026* -.031** .043*** -.032** Cement walls -.051*** .028** .023 -.049*** .028** .019 Value of livestock .001 .003*** -.002 .001 .002** -.001 Father Educ.: Up to Primary -.012 .035 .054* -.015 .036* .058* Father Educ: Above primary -.016 .063*** .001 -.018 .063*** .005 Mother Educ: Up to Primary -.063*** .024 -.040* -.061*** .022 -.034 Mother Educ: Above primary -.012 .100*** -.043** -.011 .100*** -.044** Father lives in HH .047** .022 .020 .050** .022 .016 Mother lives in HH .002 .008 -.030 .002 .008 -.032 Daily man wage (in log) .014 .013** -.000 .013 .013** .001 Motorable road -.024 .016 -.013 -.017 .012 -.007 Public transport -.012 .033** .002 -.015 .032** .009 Agricultural center -.042** -.084*** .030 -.041** -.083*** .030 rice_husking -.021 .001 -.051** -.017 -.004 -.045* Tractors .015 .028* -.033 .012 .028* -.027 Agriculture visitor .012 -.011 -.028* .008 -.007 -.034** Presence of cooperative .058*** .043*** .057*** .059*** .041*** .065*** Use of chemical products -.029* -.023* -.012 -.027 -.025** -.005 pipe-borne water -.003 -.021 .008 -.005 -.020 .013

40 THE EFFECT OF AVAILABILITY AND DISTANCE FROM SCHOOL ON CHILDREN’S TIME ALLOCATION IN GHANA AND GUATEMALA
Rural cost .473*** -.243** .098 .473*** -.240** .097 Rural forest .245** -.130* .168*** .245** -.125* .156** Rural savannah .358*** -.272*** .230*** .348** -.261*** .208***
Rho12 -0.23*** -0.22*** Rho13 0.18*** 0.17*** Rho23 -0.063 -0.056 Number observations 3354 3354
Note: Partial derivatives for continuous variables are evaluated at their sample means, while dummy variables are evaluated for a change from zero to one. Standard errors are clustered by communities.
97. Concerning the other covariates in Model II, as expected female are 9.4 percentage points more likely to perform household chores, and 2.1 percentage points less likely to attend school. When there are young siblings aged 0-6, children are 2.8 percentage points more likely to do house works (which include child care), probably because they take care of younger siblings and 1.1 percentage points less likely to attend school. In a symmetric way, having older siblings aged 13-17 decreases the probability of a child of doing household chores by 4.4 percentage points and the probability of a child of working by 1.5 percentage points. Surprisingly, an increase in per-capita expenditure increases children’s probability of specializing in house works by 8.0 percentage points and it is not easy to provide an explanation for this result, but it also increases children’s probability of attending school by 2.3 percentage points. The wealth proxy variables have a weak effect on children’s probability to be engaged in housework activity (only having a toilet in the dwelling reduces the children probability of performing household chores by 3.2 percentage points), while in general they have a positive effect on children’s probability of attending school and a negative one on children’s probability of working. Religion (of any groups) discourages children from doing household chores and working, but it increases their probability of attending school. Interestingly, the higher the mother educational level the lower the probability that a child specializes in household chores, while having a father with a primary school diploma increases this probability by 5.8 percentage points. As expected, parental education encourages children investment in schooling and discourages children working. 98. Very few community variables have a significant effect on children’s time allocation. Only having an agricultural visitor affects negatively by 3.4 percentage points and the presence a cooperative affects positively by 6.5 percentage points the probability of a child of performing house works. In most cases, community variables have a positive effect on children school attendance, apart from having an agricultural center which has a negative effect on children school attendance. Finally, children living in rural areas are more likely to work or to do household chores and less likely to attend school. These effects are largely expected since these areas have few infrastructures and facilities which make children more likely to be employed in any type of work. 99. When looking at the coefficients of correlation among the working, school attendance and household chores equations at the bottom of Table 34, we see that the unobservables of the schooling and work decisions are negatively correlated, while the error term of the working equation is positively correlated with the error term of the household chores equation. On the contrary, the error terms of the schooling and household chore equations are not correlated. In other words, in terms of unobservable factors, a child who is more likely to work is also more likely to perform household chores, but only work in economic activity seems to be in conflict with formal education.

41 UCW WORKING PAPER SERIES, MAY 2007
100. Overall our results convey the message that the reduction in schooling costs will have a certain degree of success in discouraging both children’s work and involvement in household chores and in enforcing children’s school attendance in Ghana, with an effect being much stronger for the increase in the availability of school than for the reduction in travel time distance from school. 101. As descriptive evidence has shown in Table 4, boys and girls are differently involved in household chores activities. Therefore, we investigate in a regression analysis whether there are systematic differences across gender concerning the effect of availability and distance to schools on children’s time allocation (Table 35). We notice that for girls the travel distance to primary school has a significant and positive impact on the probability of working and performing household chores and at the same time it discourages significantly school attendance. Interestingly, the distance from middle school does have no effect on schooling, but it has a negative effect on working and a positive one on household works. Moreover, when looking at the availability of schools, we see that the presence of primary school does have no effect on girls’ time allocation but the availability of middle school encourages investment in schooling (5.9 percentage points) and discourages time spent in household chores (-4.5 percentage points). The results for boys are substantially different. The distance from schools (primary, middle or secondary) does exert no effect on boys’ time use, except for a positive effect of the distance from middle school on household chores activities. Instead, the availability of primary and middle schools increase the probability of boys of attending school (by 8.9 and 6.6 percentage points, respectively), and the presence of primary school decreases household chores activities probability by 11.6 percentage points. 102. Overall, our results suggest that distance from school has a stronger impact on girls than on boys while availability of primary schools matters only for boys. Moreover, there is a clear substitution effect for girls among schooling and household chores when middle school is present in the community; in other words, it is only when girls may have access to the most remunerative type of schools (above primary) that parents have some incentive to send their daughters to school and to discourage their involvement in household chores. For boys instead the availability of middle school encourages school attendance but it does not create substitution effect, like instead does the availability of primary school. Gender difference in the returns to schooling, social, cultural and religious norms or simply parental preferences may be advocated to explain the sex-based differences in households’ choices about their children’s time allocation.22 This result suggests that girls may be differently responsive to policy measures addressing the issues of children time allocation, and points to the need for different policy approaches for reducing girls’ and boys’ work and household chores activities and for increasing girls’ and boys’ school attendance.
22 It is beyond the scope of this paper to investigate the causes of sex-based differences in households’ decisions about children’s activities.
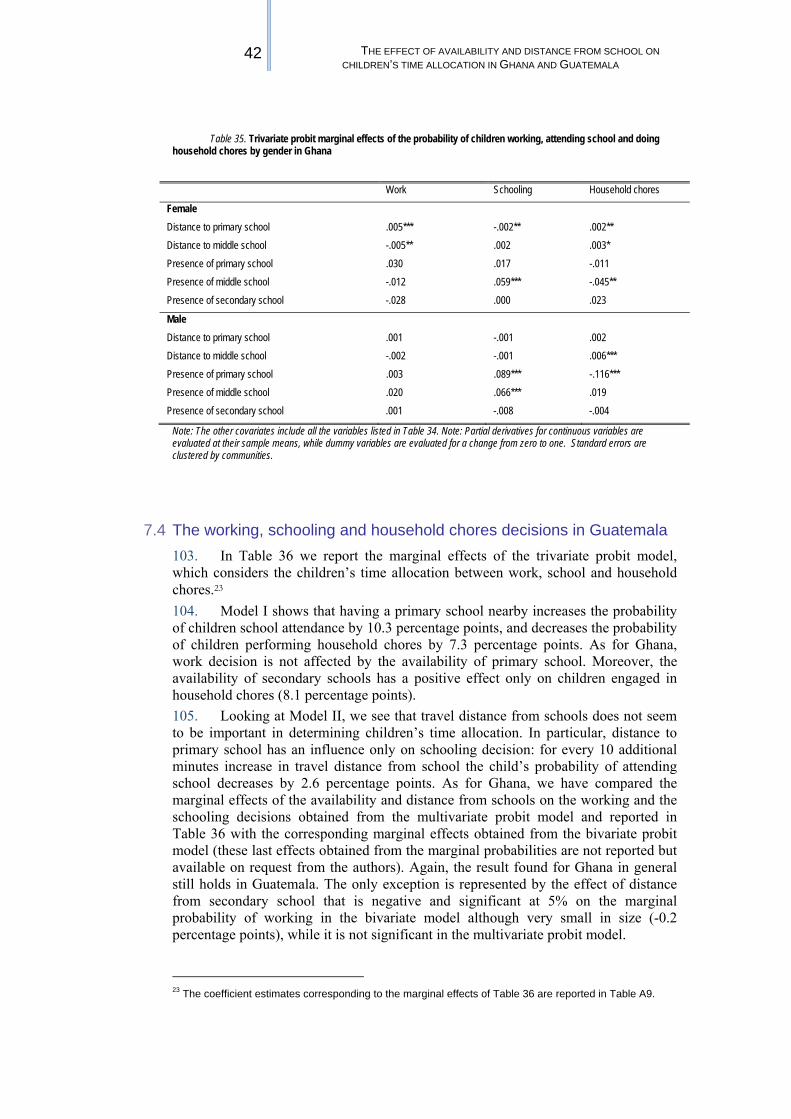
42 THE EFFECT OF AVAILABILITY AND DISTANCE FROM SCHOOL ON CHILDREN’S TIME ALLOCATION IN GHANA AND GUATEMALA
Table 35. Trivariate probit marginal effects of the probability of children working, attending school and doing
household chores by gender in Ghana
Work Schooling Household chores
Female Distance to primary school .005*** -.002** .002** Distance to middle school -.005** .002 .003* Presence of primary school .030 .017 -.011 Presence of middle school -.012 .059*** -.045** Presence of secondary school -.028 .000 .023
Male Distance to primary school .001 -.001 .002 Distance to middle school -.002 -.001 .006*** Presence of primary school .003 .089*** -.116*** Presence of middle school .020 .066*** .019 Presence of secondary school .001 -.008 -.004
Note: The other covariates include all the variables listed in Table 34. Note: Partial derivatives for continuous variables are evaluated at their sample means, while dummy variables are evaluated for a change from zero to one. Standard errors are clustered by communities.
7.4 The working, schooling and household chores decisions in Guatemala 103. In Table 36 we report the marginal effects of the trivariate probit model, which considers the children’s time allocation between work, school and household chores.23 104. Model I shows that having a primary school nearby increases the probability of children school attendance by 10.3 percentage points, and decreases the probability of children performing household chores by 7.3 percentage points. As for Ghana, work decision is not affected by the availability of primary school. Moreover, the availability of secondary schools has a positive effect only on children engaged in household chores (8.1 percentage points). 105. Looking at Model II, we see that travel distance from schools does not seem to be important in determining children’s time allocation. In particular, distance to primary school has an influence only on schooling decision: for every 10 additional minutes increase in travel distance from school the child’s probability of attending school decreases by 2.6 percentage points. As for Ghana, we have compared the marginal effects of the availability and distance from schools on the working and the schooling decisions obtained from the multivariate probit model and reported in Table 36 with the corresponding marginal effects obtained from the bivariate probit model (these last effects obtained from the marginal probabilities are not reported but available on request from the authors). Again, the result found for Ghana in general still holds in Guatemala. The only exception is represented by the effect of distance from secondary school that is negative and significant at 5% on the marginal probability of working in the bivariate model although very small in size (-0.2 percentage points), while it is not significant in the multivariate probit model.
23 The coefficient estimates corresponding to the marginal effects of Table 36 are reported in Table A9.

43 UCW WORKING PAPER SERIES, MAY 2007
Table 36. Marginal Effects of the trivariate probit estimates of children working, attending school and doing household chores in Guatemala
Model I Model II
Work Schooling Household
Chores
Work Schooling Household
Chores
Distance primary school - - - .001 -.026*** .001 Distance secondary school - - - -.004 -.001 .006 Presence of primary school .032 .103*** -.073*** .030 .094*** -.071*** Presence of secondary school -.009 -.046 .081** -.009 -.044 .081** Female -.191*** -.062*** .084*** -.191*** -.061*** .084*** Rural .150*** -.020 .045 .153*** -.017 .041 Age .118*** .375*** .021 .115*** .370*** .020 Age2 -.002 -.019*** -.001 -.002 -.019*** -.001 Head’s Son or daughter .080* .129*** .084* .080* .134*** .084* Number children aged 06 -.000 .008 .032*** -.000 .008 .032*** Number children aged 7_14 -.006 -.019* -.043*** -.006 -.018* -.043*** Number children aged 15_17 -.024* .013 -.013 -.024 .013 -.014 Number adult male (18-59) -.036 -.030 -.038 -.036 -.030 -.037 Number adult female (18-59) -.009** .003* .017** -.008** .003* .015** Number of adult over 60 -.015 .012 .034 -.014 .012 .033 Ln per capita expenditure -.003 .075*** .013 -.003 .074*** .013 Toilet -.010 .098** .038 -.011 .096** .038 Concrete walls -.034 .095*** -.005 -.034 .098*** -.004 Cement floors .0151 .059** -.045 .015 .057** -.044 Value of livestock .0120*** .016*** -.006* .012*** .016*** -.006* Father Educ.: Up to Primary -.011 .146** -.093 -.011 .151** -.092 Father Educ: Above primary -.082 .219*** -.176** -.082 .223*** -.176** Mother Educ: Up to Primary -.434 -.160 -.493*** -.434** -.175 -.492*** Mother Educ: Above primary -.211 .029 -.428** -.211** .006 -.428** Father lives in HH -.006 -.027 .118 -.005 -.034 .117 Mother lives in HH .221** .116 .479*** .222** .135 .479*** Mail .094 -.077 -.244*** .097 -.091 -.246*** Bank -.011 .046 -.031 -.011 .031 -.033 Cooperative -.054 .044 .069 -.055 .059 .071 Police -.077 -.042 .104 -.079 -.044 .106 Market .059 -.019 -.018 .061 -.010 -.019 Pipe water in the dws .013 .180*** .017 .015 .181*** .015 telephone in the dws .024 -.183*** .014 .026 -.180*** .012 Trash collection -.012 .187*** .0181 -.013 .192*** .017 Public light .068** .010 -.006 .068** .009 -.004 Electricity in the dws -.004 -.024 -.048 -.003 -.024 -.050 Transportation .036 .071*** .005 .036 .072*** .004 Protective service .128*** -.029 .063 .127*** -.039 .065 Norte .005 .222*** -.002 .007 .216*** -.003 Nororiente -.037 .166** -.172* -.034 .158** -.177* Suroriente -.089 .248*** -.119 -.089 .244*** -.117 Central .108 .237*** .094 .109 .236*** .094
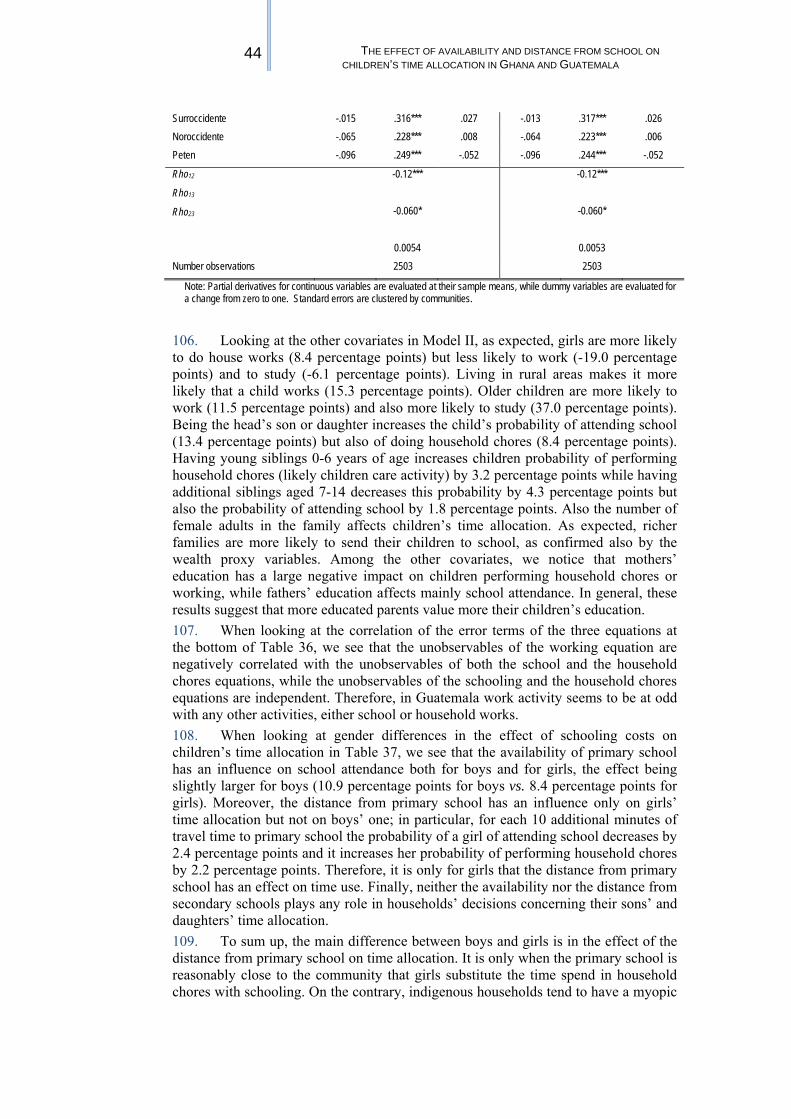
44 THE EFFECT OF AVAILABILITY AND DISTANCE FROM SCHOOL ON CHILDREN’S TIME ALLOCATION IN GHANA AND GUATEMALA
Surroccidente -.015 .316*** .027 -.013 .317*** .026 Noroccidente -.065 .228*** .008 -.064 .223*** .006 Peten -.096 .249*** -.052 -.096 .244*** -.052
Rho12 -0.12***
-0.060*
0.0054
-0.12***
-0.060*
0.0053
Rho13
Rho23
Number observations 2503 2503
Note: Partial derivatives for continuous variables are evaluated at their sample means, while dummy variables are evaluated for a change from zero to one. Standard errors are clustered by communities.
106. Looking at the other covariates in Model II, as expected, girls are more likely to do house works (8.4 percentage points) but less likely to work (-19.0 percentage points) and to study (-6.1 percentage points). Living in rural areas makes it more likely that a child works (15.3 percentage points). Older children are more likely to work (11.5 percentage points) and also more likely to study (37.0 percentage points). Being the head’s son or daughter increases the child’s probability of attending school (13.4 percentage points) but also of doing household chores (8.4 percentage points). Having young siblings 0-6 years of age increases children probability of performing household chores (likely children care activity) by 3.2 percentage points while having additional siblings aged 7-14 decreases this probability by 4.3 percentage points but also the probability of attending school by 1.8 percentage points. Also the number of female adults in the family affects children’s time allocation. As expected, richer families are more likely to send their children to school, as confirmed also by the wealth proxy variables. Among the other covariates, we notice that mothers’ education has a large negative impact on children performing household chores or working, while fathers’ education affects mainly school attendance. In general, these results suggest that more educated parents value more their children’s education. 107. When looking at the correlation of the error terms of the three equations at the bottom of Table 36, we see that the unobservables of the working equation are negatively correlated with the unobservables of both the school and the household chores equations, while the unobservables of the schooling and the household chores equations are independent. Therefore, in Guatemala work activity seems to be at odd with any other activities, either school or household works. 108. When looking at gender differences in the effect of schooling costs on children’s time allocation in Table 37, we see that the availability of primary school has an influence on school attendance both for boys and for girls, the effect being slightly larger for boys (10.9 percentage points for boys vs. 8.4 percentage points for girls). Moreover, the distance from primary school has an influence only on girls’ time allocation but not on boys’ one; in particular, for each 10 additional minutes of travel time to primary school the probability of a girl of attending school decreases by 2.4 percentage points and it increases her probability of performing household chores by 2.2 percentage points. Therefore, it is only for girls that the distance from primary school has an effect on time use. Finally, neither the availability nor the distance from secondary schools plays any role in households’ decisions concerning their sons’ and daughters’ time allocation. 109. To sum up, the main difference between boys and girls is in the effect of the distance from primary school on time allocation. It is only when the primary school is reasonably close to the community that girls substitute the time spend in household chores with schooling. On the contrary, indigenous households tend to have a myopic

45 UCW WORKING PAPER SERIES, MAY 2007
behavior concerning their offspring’ time allocation with no differences between boys and girls, given that they do not include secondary school variables in their decision set.
Table 37. Trivariate probit marginal effects of the probability of children working, attending school and doing household
chores by gender in Guatemala Work Schooling Household chores
Female Distance to primary school -.001 -.024* .0022*** Distance to secondary school -.003 -.004 .001** Presence of primary school .023 .084** -.110 Presence of secondary school .030 -.036 .098
Male Distance to primary school -.001 -.020 -.001 Distance to secondary school -.006 .002 .011 Presence of primary school .031 .109*** -.047 Presence of secondary school -.039 -.028 .057
Note: The other covariates include all the variables listed in Table 36. Note: Partial derivatives for continuous variables are evaluated at their sample means, while dummy variables are evaluated for a change from zero to one. Standard errors are clustered by communities.
8. ROBUSTNESS CHECKS24
8.1 Ghana
110. The estimates presented so far show that in Ghana the distance to primary-school discourages children school attendance and makes children more likely to work or to do household chores. Interestingly, the distance from middle school has a negative effect on work decision and a positive one on household chores activities. This result could be due to the fact that having a middle school nearby increases the likelihood that parents invest in their children’s full-time education (although the effect on schooling is not significant), whereas education is perceived incompatible with work activities but not with household chores. Moreover, the availability of both primary and middle schools has a positive effect on schooling decisions. 111. However, there are two potential sources of bias that could affect our estimates. 112. The first problem we have to deal with is the potential endogeneity of household per capita expenditure, as mentioned in section 4. The instruments used to identify per-capita expenditure are community mean per-capita expenditures, household head characteristics, household composition variables, acres of land owned by the household, value of agricultural business assets, income from remittances and other unearned income (Lavy 1996, and Glewwe et al 1993). Following Glewwe et al (1993), we first regress log per-capita expenditures on this set of instruments and then
24 For completeness, the robustness checks described in this section have been also computed for the bivariate estimates, but for the sake of brevity they are not reported. They are available on requests from the author.

46 THE EFFECT OF AVAILABILITY AND DISTANCE FROM SCHOOL ON CHILDREN’S TIME ALLOCATION IN GHANA AND GUATEMALA
include the residuals from this stage along with actual log per-capita expenditures in the trivariate probit model. From Table 38 it turns out that the coefficients on the residuals in the three equations are significant, suggesting that the consumption expenditures might be actually endogenous and we need to control for it in our estimates (Smith and Blundell, 1986). Notwithstanding, the results are not sensitive to this procedure and the coefficients of interest on the travel distance variables and the availability of schools hardly change.25 Table 38. Trivariate probit marginal effects of the probability of children working, attending school doing household
chores correcting for the endogeneity of expenditure in Ghana Work Schooling Household chores
Distance to primary school .002*** -.001** .002** Distance to middle school -.003** .000 .004*** Presence of primary school .027 .053*** -.061*** Presence of middle school -.006 .068*** -.012 Presence of secondary school .011 -.019 .028 Ln per capita expenditure -.075** .082*** .015 Ln per capita expend. -predicted .078** -.066** .073**
Rho12 -0.229*** Rho13 0.165*** Rho23 -0.0314
Number observations 3354
Note: The other covariates include: child's age and squared age, dummies for the number of siblings in different age cells (0-6, 7-12 and 13-17), number of adults in the households by sex and different age cells, presence of parents in the household and their level of education, religion and per-capita expenditure in logarithm, dwelling variables (drink water, electricity, toilet, cement walls in the house, value of livestock, community variables (daily man wage, dummy for having a motorable road, public transport, having an agricultural extension centre, rice-husking, having tractors, an agricultural extension officer, a cooperative, using chemical fertilizer or insecticides, a pipe-borne water) and area fixed effects. The per capita expenditure has been instrumented using as instrument community mean per-capita expenditures, household head characteristics, household composition variables, acres of land owned by the household, value of agricultural business assets, income from remittances and other unearned income. Standard errors are bootstrapped in order to take into account of the generated variable and clustered by communities. Partial derivatives for continuous variables are evaluated at their sample means, while dummy variables are evaluated for a change from zero to one.
113. The second problem we have to deal with is that using travel distances to proxy the costs of education may create a problem of endogeneity if schools are not randomly allocated over the country. This problem could arise if households with a greater preference for schooling are more able to move towards areas with better provision of schools. Moreover, in many poor countries, allocation of infrastructures like schools and health services might be determined by local demand. In both cases, estimations that do not take into account the non-random placement of schools will yield inconsistent estimates of the impact of school characteristics on household choices for their children. In the context of rural Ghana the placement of primary schools can be considered exogenous since the government policy is to place a primary school in each community. Moreover, secondary schools are mainly concentrated in large towns or rural centers, and it is very unlikely that a rural community may attract a secondary school (Lavy, 1996). Therefore, the endogeneity problem should arise only with respect to middle schools. However, in order to evaluate the endogenous placement of the three types of schools, we regress the 25 The coefficients corresponding to the marginal effects of Table 38 are reported in Table A10.
47 UCW WORKING PAPER SERIES, MAY 2007
availability of primary, middle and secondary schools on average village characteristics (respectively in columns 1, 2 and 3 of Table 39). As covariates, we include the presence of a motorable road passing by the community and its distance from the village in kilometers, the presence of electricity, pipe-borne water, post office, public transport, rice-husking, tractors, a cooperative, an agricultural extension centre in the community, an agent visiting the farmers and finally use of chemical substances by farmers. It turns out that none of these village characteristics have a statistically significant effect on the probability of having a primary school in the village except for the presence of agricultural visitor (column 1). On the contrary, the presence of electricity, post office and public transport increases the probability of having a middle school in the community (column 2). Finally, the presence of electricity and public transport increases the probability of having a secondary school in the community (but the effect of public transport is weakly significant); however, this last result should be interpreted with caution since the effect on the secondary school placement could not be estimated for some covariates. Overall these results suggest that the endogeneity should be less than a problem for primary and secondary schools; on the contrary, three village level variables, which can be considered as a proxy of "modernity", are positively related to the presence of middle schools in the community. 114. We could use the previous result to perform an instrumental variable estimation.26 In particular, we instrument the access to middle schools using as exclusion restrictions village characteristics that we have proved to be correlated with middle school placement but that should not be correlated with work, school and housework decisions. In particular, we use as instruments the presence of electricity, post office and public transport in the community. We estimate a simultaneous multivariate probit model which analyzes the joint decisions of a household concerning children’s work, school attendance, and household chores activities and of living in a community with middle school. As expected, the instruments reported in column 4 turn out to be strongly significant. Table 40 shows that the results are not qualitatively different from those reported in Table 34 and the main conclusions drawn in the previous section still hold.
26 We are aware of the fact that these variables are far from being perfect instruments since they are not randomly assigned to the population of interest, but this is the best we can do with the data at hand.

48 THE EFFECT OF AVAILABILITY AND DISTANCE FROM SCHOOL ON CHILDREN’S TIME ALLOCATION IN GHANA AND GUATEMALA
Table 39. Marginal effects of community variables on the presence of schools in the community in Ghana Primary school Middle school Secondary school
Motorable road 0.113 0.207 - Distance from motorable road 0.010 0.001 - Electricity 0.006 0.283** 0.064*** pipe-borne water 0.171 0.347* 0.008 Public transport 0.058 0.194 ** 0.034* Post-office - 0.417** - rice_husking 0.021 0.082 0.004 Tractors 0.030 0.016 0.002 Agriculture visitor 0.108** 0.083 -0.018 Presence of cooperative 0.041 0.121 0.004 Use of chemical products 0.005 0.135 -0.011
Number observations 223 223 223 Pseudo R2 0.1252 0.3023 0.513
Table 40: Multivariate probit marginal effects of the probability of children working, attending school and doing household chores correcting for the endogeneity of middle school placement in Ghana
Work Schooling Household chores Middle school
Distance to prim. school .002*** -.0014** .002** - Distance to middle school -.003* .000 .004*** - Presence of prim. school .026 .052*** -.058** - Presence of middle school -.036 .088*** -.043 - Presence of secondary school .0111 -.024 .036 - Public transport - - - .211*** pipe-borne water - - - .311*** Distance from road (in km) - - - -.001* Electricity in community - - - .239*** Telephone/postal office - - - .230***
Rho12 -.206*** Rho13 .174*** Rho14 .089 Rho23 -.042 Rho24 -.044 Rho34 .058
Number observations 3354
Note: The presence of middle school has been instrumented using as instruments the presence of electricity, post office and public transport in the community. The other covariates include: child's age and squared age, dummies for the number of siblings in different age cells (0-6, 7-12 and 13-17), number of adults in the households by sex and different age cells, presence of parents in the household and their level of education, religion and per-capita expenditure in logarithm, dwelling variables (drink water, electricity, toilet, cement walls in the house), value of livestock, community variables (daily man wage, dummy for having a motorable road, public transport, having an agricultural extension centre, rice-husking, having tractors, an agricultural extension officer, a cooperative, using chemical fertilizer or insecticides, a pipe-borne water) and area fixed effects. Standard errors are bootstrapped in order to take into account of the generated variable and clustered by communities. Partial derivatives for continuous variables are evaluated at their sample means, while dummy variables are evaluated for a change from zero to one.
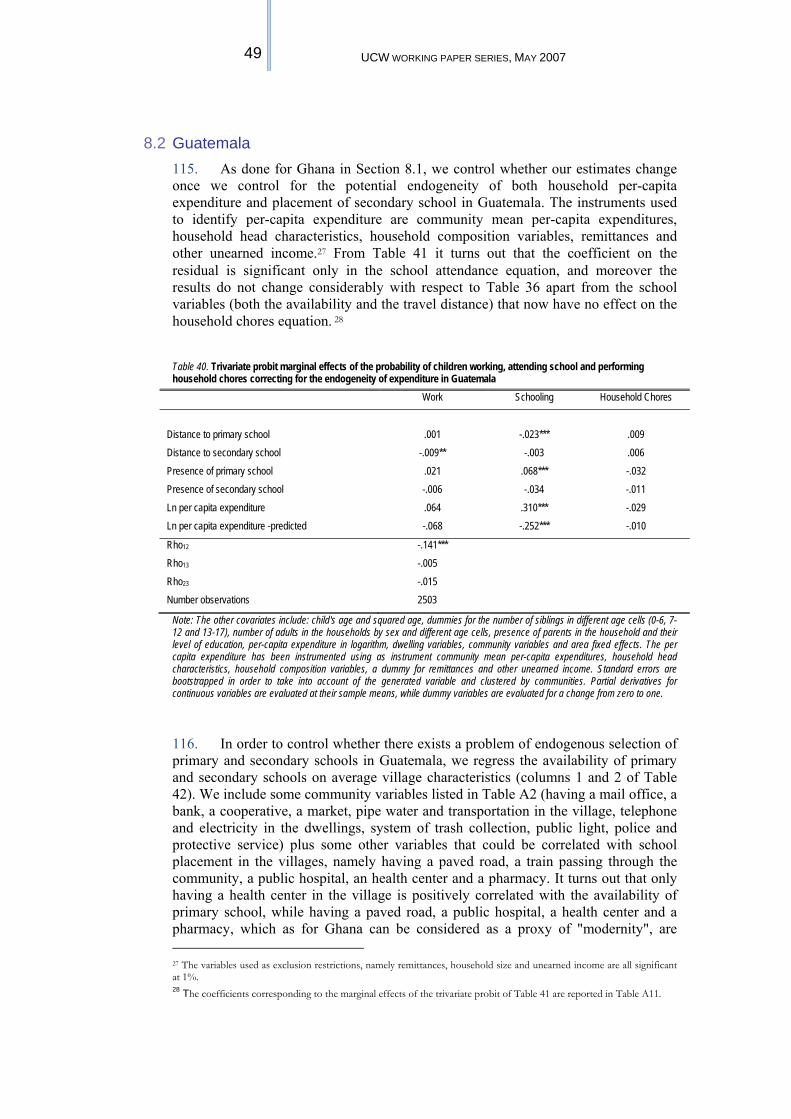
49 UCW WORKING PAPER SERIES, MAY 2007
8.2 Guatemala 115. As done for Ghana in Section 8.1, we control whether our estimates change once we control for the potential endogeneity of both household per-capita expenditure and placement of secondary school in Guatemala. The instruments used to identify per-capita expenditure are community mean per-capita expenditures, household head characteristics, household composition variables, remittances and other unearned income.27 From Table 41 it turns out that the coefficient on the residual is significant only in the school attendance equation, and moreover the results do not change considerably with respect to Table 36 apart from the school variables (both the availability and the travel distance) that now have no effect on the household chores equation. 28
Table 40. Trivariate probit marginal effects of the probability of children working, attending school and performing household chores correcting for the endogeneity of expenditure in Guatemala
Work Schooling Household Chores
Distance to primary school .001 -.023*** .009 Distance to secondary school -.009** -.003 .006 Presence of primary school .021 .068*** -.032 Presence of secondary school -.006 -.034 -.011 Ln per capita expenditure .064 .310*** -.029 Ln per capita expenditure -predicted -.068 -.252*** -.010
Rho12 -.141*** Rho13 -.005 Rho23 -.015 Number observations 2503
Note: The other covariates include: child's age and squared age, dummies for the number of siblings in different age cells (0-6, 7-12 and 13-17), number of adults in the households by sex and different age cells, presence of parents in the household and their level of education, per-capita expenditure in logarithm, dwelling variables, community variables and area fixed effects. The per capita expenditure has been instrumented using as instrument community mean per-capita expenditures, household head characteristics, household composition variables, a dummy for remittances and other unearned income. Standard errors are bootstrapped in order to take into account of the generated variable and clustered by communities. Partial derivatives for continuous variables are evaluated at their sample means, while dummy variables are evaluated for a change from zero to one.
116. In order to control whether there exists a problem of endogenous selection of primary and secondary schools in Guatemala, we regress the availability of primary and secondary schools on average village characteristics (columns 1 and 2 of Table 42). We include some community variables listed in Table A2 (having a mail office, a bank, a cooperative, a market, pipe water and transportation in the village, telephone and electricity in the dwellings, system of trash collection, public light, police and protective service) plus some other variables that could be correlated with school placement in the villages, namely having a paved road, a train passing through the community, a public hospital, an health center and a pharmacy. It turns out that only having a health center in the village is positively correlated with the availability of primary school, while having a paved road, a public hospital, a health center and a pharmacy, which as for Ghana can be considered as a proxy of "modernity", are 27 The variables used as exclusion restrictions, namely remittances, household size and unearned income are all significant at 1%. 28 The coefficients corresponding to the marginal effects of the trivariate probit of Table 41 are reported in Table A11.

50 THE EFFECT OF AVAILABILITY AND DISTANCE FROM SCHOOL ON CHILDREN’S TIME ALLOCATION IN GHANA AND GUATEMALA
positively correlated with the availability of secondary school in the community. Therefore, as already for Ghana, these results could suggest that endogeneity should be less than a problem for primary school, while the placement of secondary school could be not random across villages. In other words, the villages with more infrastructures are also more likely to have a secondary school nearby.
Table 41. Marginal effects of community variables on the presence of schools in the community in Guatemala
Primary school Secondary school
Paved road .037 .173***
Train .036 .396
Public hospital -.152 .484***
Health center .331*** .417***
Pharmacy .116 .283***
Mail .133 .207
Bank -.113 -.022
Cooperative .083 .233*
Police -.037 -.119
Market .056 .045
Pipe water -.070 .032
Telephone in dwellings -.023 -.090
Trash collection -.019 .173*
Public Light -.006 .129
Electricity in dwellings -.097 .004
Transportation .012 .014
Protective service -.105 .043
Number observations 440 440 Pseudo R2 0.192 0.526
117. We use these results to perform an instrumental variable estimation. In particular, we instrument the access to secondary schools using as instruments the village characteristics mentioned above. We estimate a simultaneous multivariate probit model which analyzes jointly children’s work, school attendance, household chores activity and household’s decision of living in a community with secondary school. The instruments reported in column 4 turn out to be strongly significant. Table 43 shows that the results are slightly different from those reported in Table 36. In particular, the availability and the distance from both primary and secondary schools do have no impact on household chores activities, while, as in Table 36, the availability of primary school increases children’s school attendance probability and the distance from primary school negatively affects children’s school attendance. Finally, the availability of secondary schools reduces the probability that a child works. This could suggest that families discourage their children to work when higher order education is available.
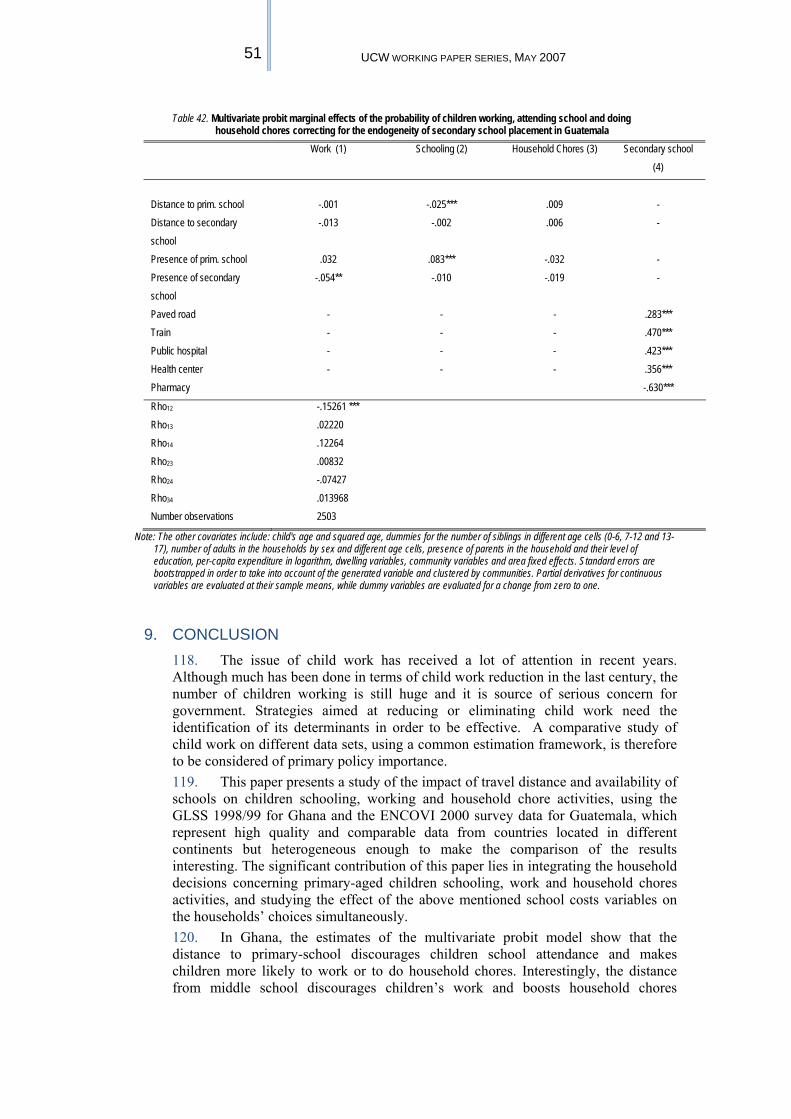
51 UCW WORKING PAPER SERIES, MAY 2007
Table 42. Multivariate probit marginal effects of the probability of children working, attending school and doing household chores correcting for the endogeneity of secondary school placement in Guatemala
Work (1) Schooling (2) Household Chores (3) Secondary school (4)
Distance to prim. school -.001 -.025*** .009 - Distance to secondary school
-.013 -.002 .006 -
Presence of prim. school .032 .083*** -.032 - Presence of secondary school
-.054** -.010 -.019 -
Paved road - - - .283*** Train - - - .470*** Public hospital - - - .423*** Health center - - - .356*** Pharmacy -.630***
Rho12 -.15261 *** Rho13 .02220 Rho14 .12264 Rho23 .00832 Rho24 -.07427 Rho34 .013968 Number observations 2503
Note: The other covariates include: child's age and squared age, dummies for the number of siblings in different age cells (0-6, 7-12 and 13-17), number of adults in the households by sex and different age cells, presence of parents in the household and their level of education, per-capita expenditure in logarithm, dwelling variables, community variables and area fixed effects. Standard errors are bootstrapped in order to take into account of the generated variable and clustered by communities. Partial derivatives for continuous variables are evaluated at their sample means, while dummy variables are evaluated for a change from zero to one.
9. CONCLUSION 118. The issue of child work has received a lot of attention in recent years. Although much has been done in terms of child work reduction in the last century, the number of children working is still huge and it is source of serious concern for government. Strategies aimed at reducing or eliminating child work need the identification of its determinants in order to be effective. A comparative study of child work on different data sets, using a common estimation framework, is therefore to be considered of primary policy importance. 119. This paper presents a study of the impact of travel distance and availability of schools on children schooling, working and household chore activities, using the GLSS 1998/99 for Ghana and the ENCOVI 2000 survey data for Guatemala, which represent high quality and comparable data from countries located in different continents but heterogeneous enough to make the comparison of the results interesting. The significant contribution of this paper lies in integrating the household decisions concerning primary-aged children schooling, work and household chores activities, and studying the effect of the above mentioned school costs variables on the households’ choices simultaneously. 120. In Ghana, the estimates of the multivariate probit model show that the distance to primary-school discourages children school attendance and makes children more likely to work or to do household chores. Interestingly, the distance from middle school discourages children’s work and boosts household chores

52 THE EFFECT OF AVAILABILITY AND DISTANCE FROM SCHOOL ON CHILDREN’S TIME ALLOCATION IN GHANA AND GUATEMALA
activities. This result could be due to the fact that having a middle school nearby increases the likelihood that parents invest in their offspring’s full-time education (the coefficient on full-time attendance is positive although not significant), sending them to primary school rather than to work. This last activity could be perceived from parents as incompatible with schooling, while household chores could instead be still compatible with school attendance or at least not interfere with it. Moreover, the availability of both primary and middle schools has a positive effect on schooling decisions, and having a primary school nearby also discourages household chores activity. The results do not change significantly after controlling for the endogeneity of household expenditures and for the endogeneity of middle school placement. When looking at the magnitude of the effects, it turns out that availability of school exerts a larger influence on children’s time use rather than the travel distance to schools. This result suggests that policy should be targeted to improving access to school by providing schools in each community rather than creating, for example, a more efficient transportation system to reach schools (buses, roads, trains, etc.) 121. Results are quite different in Guatemala where both the availability and the travel distance from secondary schools do have no effect on children’s time use (only household chores activity is positively influenced by the presence of secondary school). On the contrary, both distance from and availability of primary schools have a significant effect on children school attendance. Moreover, the magnitude of these effects is larger than in Ghana. Once controlled for the endogeneity of household expenditures and the endogeneity of secondary school placement, the effect of child cost variables on school attendance hardly change but now the availability of secondary school has a significant effect on child work reduction and no effect on household chores. To sum up, in Guatemala the child cost variables seem to affect mainly children school attendance and only slightly work. Moreover, households seem to behave myopically since only school variables related to primary education matter for their decisions on children’s school attendance. 122. We also find that household decisions about children’s time use differ by children’s sex both in Ghana and in Guatemala, suggesting that girls may be differently responsive to policy measures aimed at reducing girls’ and boys’ work and household chores activities and at increasing girls’ and boys’ school attendance. 123. Comparing the results from the two countries, the main lesson we can learn is that one needs to recognize the regional diversity in the nature of child work in formulating policies to reduce or eliminate it. For example, while reducing the distance from primary school encourages children school attendance in both countries, it reduces child work and household chores only in Ghana. In addition, improved access to middle schools through shorter travel distances helps to reduce child work only in Ghana. Similarly, the availability of primary school encourages school attendance in both countries, but discourages household chores activities only in Ghana. Finally, increasing the availability of secondary schools in the villages would reach the goal of reducing child work only in Guatemala.
53 UCW WORKING PAPER SERIES, MAY 2007
REFERENCES Akabayashi H. and G. Psacharopoulos (1999). The Trade-Off Between Child Labor and Human Capital Formation. A Tanzanian Case Study. The Journal of Development Studies, vol 35 (5), pp. 120-140
Becker, G. S. (1965). A theory of the allocation of time. Economic Journal, 75, pp. 493-517.
Behrman J.R. and J.C.Knowles (1999), Household Income and Child Schooling in Vietnam, The World Bank Economic Review, 13(2): 211-256.
Brown D.K., A. V. Deardorff and R.S. Stern (2002): The Determinants of Child Labor: Theory and Evidence, Discussion Paper No. 486, University of Michigan
Chernichovsky D. (1985). Socioeconomic and Demographic Aspects of School Enrollment and Attendance in Rural Botswana. Economic Development and Cultural Change 33, pp.319-332
Cigno, A and Rosati, F.C. (2005), The economics of child labor, Oxford University Press
Deb, P. and F. Rosati (2004): Determinants of Child Labor and School Attendance: The Role of Household Unobservables, mimeo
Edmonds E.V. (2007), Child Labor, IZA Discussion paper 2606, Forthcoming in the Handbook of Development Economics, Volume 4, Edmonds, E. (2006), “Child labor and schooling responses to anticipated income in South Africa”, Journal of Development Economics 81: 386-414. Edmonds, E., N. Pavcnik, and P. Topalova (2007), "Trade adjustment and human capital investments: Evidence from Indian tariff reform", Working paper no. 12884 (National Bureau of Economic Research, Inc, USA). Glewwe P. and H. Jacoby, (1994): Student Achievement and Schooling Choice in Low-Income Countries. Evidence from Ghana, Journal of Human Resources vol. 29 (3): pp 843-864
Grootaert C. and R. Kanbur (1995): Child Labor: A Review, Background paper for the 1995 World Development Report on Labor, World Bank, Washington D.C.
Guarcello L, F.C. Rosati, L.Scott and C. Valdivia (2005): Impact of Children’s Work on School Attendance and Performance: A Review of School Survey Evidence from Five Countries”, UCW working paper

54 THE EFFECT OF AVAILABILITY AND DISTANCE FROM SCHOOL ON CHILDREN’S TIME ALLOCATION IN GHANA AND GUATEMALA
Cartwright K. (1999). Child Labor in Colombia. In Grootaert C and Partinos H. (eds.) 1999. The Policy Analysis of Child Labor. A Comparative Analysis, New York St Martin’s Press
Cartwright K and H.A. Patrinos (1999). Child Labor in Urban Bolivia. In Grootaert C and Partinos H. (eds.) 1999. The Policy Analysis of Child Labor. A Comparative Analysis, New York St Martin’s Press
Hajivassiliou, V., D. McFadden and P. Ruud. 1996. Simulation of Multivariate Normal Rectangle Probabilities and Their Derivatives: Theoretical and Computational Results. Journal of Econometrics 72, 85-134.
Hazarika, G. and A. Bedi (2003), “Schooling Costs and Child Work in Rural Pakistan” Journal of Development Studies 39: 29-64.
Hazarika, G. and A. Bedi (2006), Child Work and Schooling Costs in Rural Northern India. IZA DP 2136.
Knaul F.M., Levison D and K.S. Moe (2001). Youth education and work in Mexico. World Development vol.29 (1), pp167-188
Kondylis F. and M. Manacorda, (2006): School Proximity and Child Labor Evidence from Rural Tanzania, mimeo
Handa S. (2002): Raising primary school enrolment in developing countries. The relative importance of supply and demand. Journal of Development Economics 69: 103-128
Lavy V. (1996). School supply constraints and children’s educational outcomes in rural Ghana. Journal of Development Economics 51: 291-314
Orazem, P. and L. Gunnarsson (2004) "Child labour, school attendance, and performance: A review", Working Paper no. 11177 (Department of Economics, Iowa State University).
Patrinos HA, Psacharopoulos G (1995) Educational Performance and Child Labor in Paraguay. International Journal of Educational Development 15(1):47–60
Psacharopoulos G, Yang H (1991) Educational Attainment among Venezuelan Youth: An Analysis of Its Determinants. International Journal of Educational Development 11(4):289–294
Rosenzweig MR, Evenson R (1977) Fertility, Schooling, and the Economic Contribution of Children in Rural India: An Econometric Analysis. Econometrica 45(5):1065–1079
55 UCW WORKING PAPER SERIES, MAY 2007
Rodgers G, Standing G (1981a) Economic Roles of Children in Low-Income Countries. International Labour Review 120(1):31–47
Rodgers G, Standing G (1981b) Child Work, Poverty and Underdevelopment. International Labour Office, Geneva
Shafiq, M. (2006b) "Household schooling and child labor decisions in rural Bangladesh," Unpublished Paper (Washington and Lee University). Silva de la Luz M (1981) Urban Poverty and Child Work: Elements for the Analysis of Child Work in Chile. In: Rodgers G, Standing G (eds) Child Work, Poverty and Underdevelopment. International Labour Office, Geneva
Singh RD, Schuh GE (1986) The Economic Contribution of Farm Children and the Household Fertility Decisions: Evidence from a Developing Country, Brazil. Indian Journal of Agricultural Economics 41(1):29–41
Smith R. and Blundell R. (1986): An exogeneity test for a simultaneous equation tobit model with an application to labor supply, Econometrica, vol. 54(2): 679-85.
Thomas D (1990): Intra-household resource allocation: an inferential approach. The Journal of Human Resources, volume 25 (4): 635-664.
Tienda M (1979) Economic Activity of Children in Peru: Labor Force Behavior in Rural and Urban Contexts. Rural Sociology 44(2): 370–391
UCW (2003) Understanding Children’s Work in Guatemala
UCW (2003) Understanding Children’s Work in Nepal
UCW (2005) - Guarcello L, F.C. Rosati, L. Scott and C. Valdivia (2005a): Towards Statistical Standards for Children’s Non Economic Work: A Discussion based on Household Survey Data.
UCW (2007), Measuring child labour: Discussion note for country consultation in Cambodia

56 THE EFFECT OF AVAILABILITY AND DISTANCE FROM SCHOOL ON CHILDREN’S TIME ALLOCATION IN GHANA AND GUATEMALA
APPENDIX
Table A1: Summary statistics for Ghana Mean Standard Deviation
School attendance 0.84 0.37 Work 0.17 0.37 Household chores 0.19 0.40 Distance to primary school * 4.37 9.01 Distance to middle school * 4.41 5.80 Presence of primary school 0.87 0.33 Presence of middle school 0.63 0.48 Presence of secondary school 0.11 0.32 Child characteristics female 0.49 0.50 Age 9.51 1.70 Age2 93.29 32.57 Head’s Son or daughter 0.76 0.42 Household Characteristics Number children aged 06 1.24 1.16 Number children aged 7_12 1.01 0.98 Number children aged 13_17 0.94 1.02 Number adult male (18-59) 1.01 0.90 Number adult female (18-59) 1.29 0.79 Number of adult over 60 0.34 0.58 Ln per capita expenditure 13.14 0.61 Religion:
Catholic 0.18 0.39 Protestant 0.42 0.49 Other Christian 0.18 0.38 Muslim 0.09 0.29 Animist 0.09 0.29 no religion 0.04 0.19 Dwelling variables Drink water 0.03 0.16 Electricity 0.16 0.36 Toilet 0.51 0.50 Cement walls 0.27 0.44 Value of livestocks 7.93 6.17 Parent characteristics Father Education:
Missing 0.27 .44 Illiterate 0.33 0.47 Up to Primary 0.07 0.25 Up to Middle 0.25 0.43 Secondary and above 0.08 0.27 Mother Education:
Missing 0.04 0.20 Illiterate 0.63 0.48

57 UCW WORKING PAPER SERIES, MAY 2007
Up to Primary 0.13 0.33 Up to Middle 0.17 0.37 Secondary and above 0.03 0.16 Father lives in HH 0.60 0.49 Mother lives in HH 0.76 0.43 Community variables Daily man wage (in log) 9.16 1.11 Motorable road 0.86 0.34 Public transport 0.67 0.47 Agricultural center 0.18 0.39 Rice_husking 0.08 0.28 Tractors 0.17 0.38 Agriculture visitor 0.60 0.49 Presence of cooperative 0.32 0.46 Use of chemical products 0.79 0.41 Pipe-borne water 0.18 0.39 Electricity 0.30 0.46 Telephone/post office 0.15 0.36 Area variables Urban area 0.03 0.14 Rural cost 0.21 0.40 Rural forest 0.49 0.50 Rural savannah 0.28 0.45
Number observation 3354
Note: * expressed in ten minutes
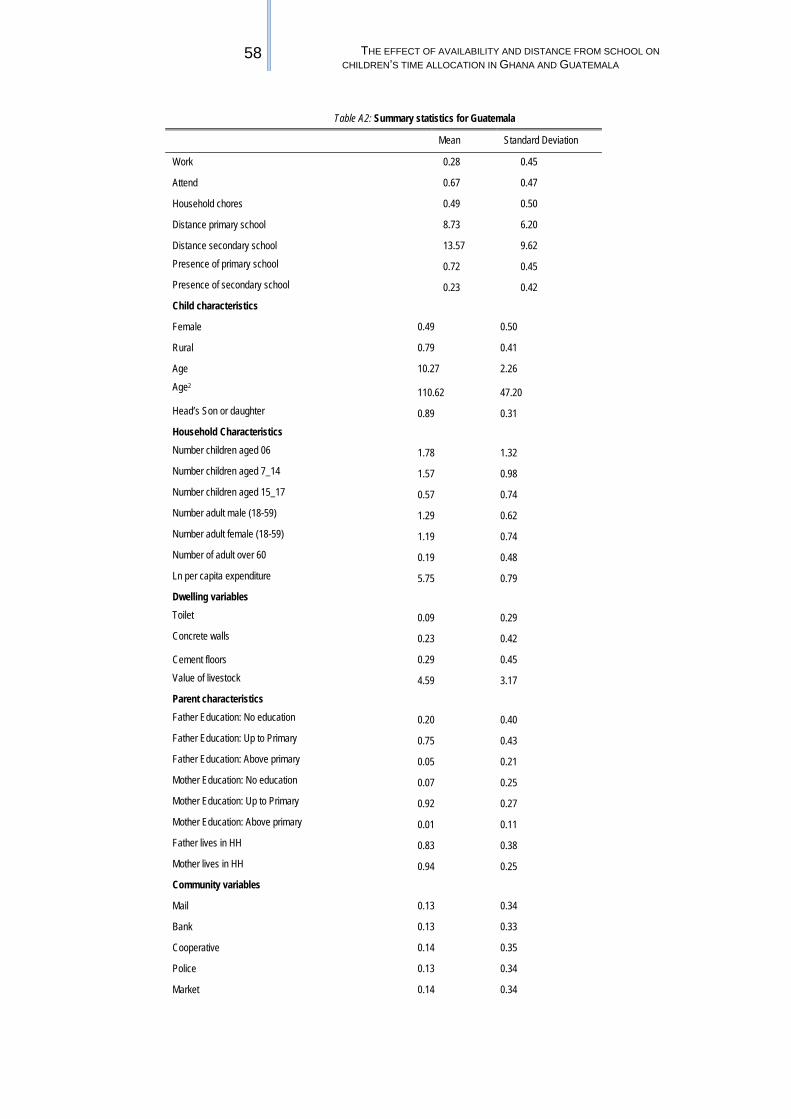
58 THE EFFECT OF AVAILABILITY AND DISTANCE FROM SCHOOL ON CHILDREN’S TIME ALLOCATION IN GHANA AND GUATEMALA
Table A2: Summary statistics for Guatemala
Mean Standard Deviation
Work 0.28 0.45
Attend 0.67 0.47
Household chores 0.49 0.50
Distance primary school 8.73 6.20
Distance secondary school 13.57 9.62 Presence of primary school 0.72 0.45 Presence of secondary school 0.23 0.42 Child characteristics
Female 0.49 0.50
Rural 0.79 0.41
Age 10.27 2.26 Age2 110.62 47.20 Head’s Son or daughter 0.89 0.31 Household Characteristics Number children aged 06 1.78 1.32 Number children aged 7_14 1.57 0.98 Number children aged 15_17 0.57 0.74 Number adult male (18-59) 1.29 0.62 Number adult female (18-59) 1.19 0.74 Number of adult over 60 0.19 0.48 Ln per capita expenditure 5.75 0.79 Dwelling variables Toilet 0.09 0.29 Concrete walls 0.23 0.42
Cement floors 0.29 0.45 Value of livestock 4.59 3.17 Parent characteristics Father Education: No education 0.20 0.40 Father Education: Up to Primary 0.75 0.43 Father Education: Above primary 0.05 0.21 Mother Education: No education 0.07 0.25 Mother Education: Up to Primary 0.92 0.27 Mother Education: Above primary 0.01 0.11 Father lives in HH 0.83 0.38 Mother lives in HH 0.94 0.25 Community variables
Mail 0.13 0.34
Bank 0.13 0.33
Cooperative 0.14 0.35
Police 0.13 0.34
Market 0.14 0.34

59 UCW WORKING PAPER SERIES, MAY 2007
Pipe water in the dws 0.77 0.42
telephone in the dws 0.11 0.32
Trash collection 0.08 0.27
Public light 0.41 0.49
Electricity in the dws 0.68 0.47
Transportation 0.39 0.49
Protective service 0.08 0.27 Area variables
Metropolitan 0.02 0.14
Norte 0.22 0.41
Nororiente 0.02 0.15
Suroriente 0.02 0.12
Central 0.17 0.38
Surroccidente 0.16 0.37
Noroccidente 0.35 0.48
Peten 0.04 0.19
Number observation 2503

60 THE EFFECT OF AVAILABILITY AND DISTANCE FROM SCHOOL ON CHILDREN’S TIME ALLOCATION IN GHANA AND GUATEMALA
Tab A3. Activity Status of Children by Community Facilities Indicators in Ghana (in percent)
Activity Status
Community Facilities Work only School only Work & School None TOT
Road 3.90 73.64 12.18 10.28 100.00 No road 10.75 57.89 12.06 19.30 100.00
Pub. transportation 3.37 75.78 11.65 9.21 100.00 No Pub. Transp. 7.85 62.68 13.23 16.24 100.00
Agriculture center 1.96 75.35 10.13 13.56 100.00 No Agric. centre 5.74 70.86 12.62 11.05 100.00
Rice husking 1.07 78.93 12.50 7.50 100.00 No Rice husking 5.17 70.82 12.13 11.87 100.00
Tractors 4.44 73.55 12.80 9.22 100.00 No Tractors 4.91 71.06 12.03 11.99 100.00
Agriculture Visit 4.11 71.35 13.06 11.48 100.00 No Agriculture Visit 5.93 71.72 10.80 11.55 100.00
Cooperative 1.78 71.86 17.45 8.91 100.00 No Cooperative 6.25 71.33 9.70 12.72 100.00
Chemical 4.06 73.32 11.20 11.42 100.00 No Chemical 7.65 64.81 15.72 11.82 100.00
Water 1.80 78.07 12.16 11.51 100.00 No Water 5.50 70.03 12.03 12.43 100.00
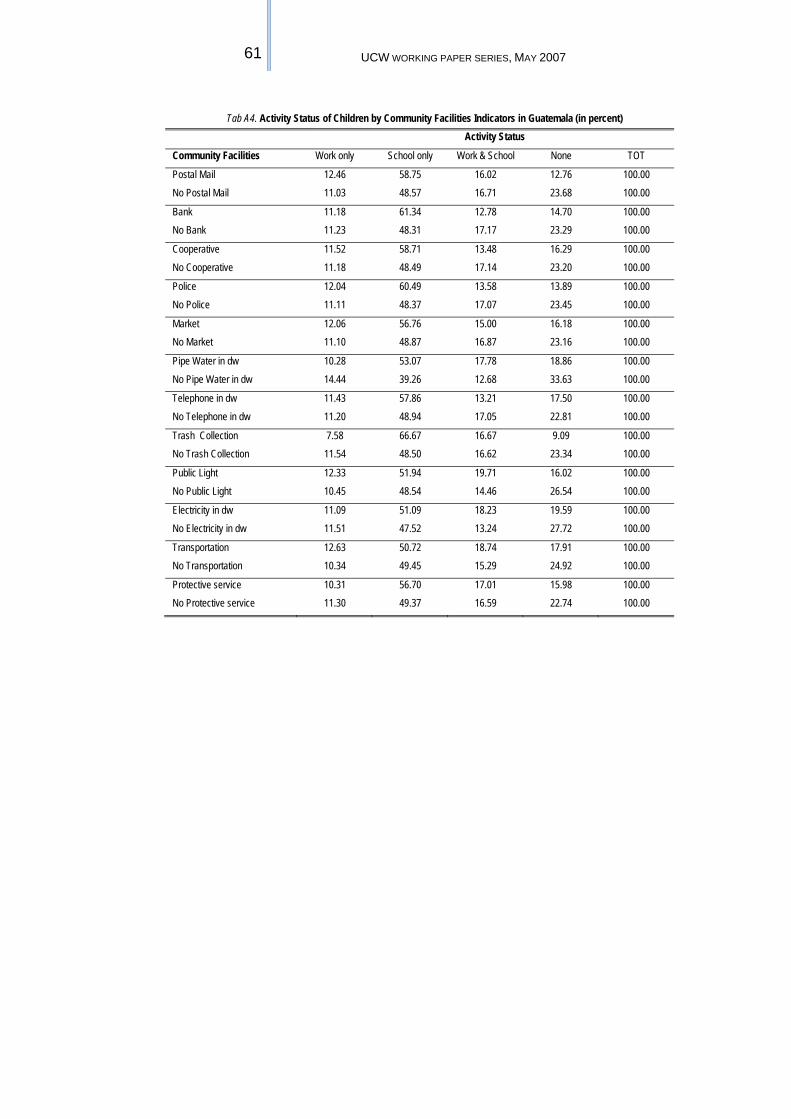
61 UCW WORKING PAPER SERIES, MAY 2007
Tab A4. Activity Status of Children by Community Facilities Indicators in Guatemala (in percent) Activity Status
Community Facilities Work only School only Work & School None TOT
Postal Mail 12.46 58.75 16.02 12.76 100.00 No Postal Mail 11.03 48.57 16.71 23.68 100.00
Bank 11.18 61.34 12.78 14.70 100.00 No Bank 11.23 48.31 17.17 23.29 100.00
Cooperative 11.52 58.71 13.48 16.29 100.00 No Cooperative 11.18 48.49 17.14 23.20 100.00
Police 12.04 60.49 13.58 13.89 100.00 No Police 11.11 48.37 17.07 23.45 100.00
Market 12.06 56.76 15.00 16.18 100.00 No Market 11.10 48.87 16.87 23.16 100.00
Pipe Water in dw 10.28 53.07 17.78 18.86 100.00 No Pipe Water in dw 14.44 39.26 12.68 33.63 100.00
Telephone in dw 11.43 57.86 13.21 17.50 100.00 No Telephone in dw 11.20 48.94 17.05 22.81 100.00
Trash Collection 7.58 66.67 16.67 9.09 100.00 No Trash Collection 11.54 48.50 16.62 23.34 100.00
Public Light 12.33 51.94 19.71 16.02 100.00 No Public Light 10.45 48.54 14.46 26.54 100.00
Electricity in dw 11.09 51.09 18.23 19.59 100.00 No Electricity in dw 11.51 47.52 13.24 27.72 100.00
Transportation 12.63 50.72 18.74 17.91 100.00 No Transportation 10.34 49.45 15.29 24.92 100.00
Protective service 10.31 56.70 17.01 15.98 100.00 No Protective service 11.30 49.37 16.59 22.74 100.00
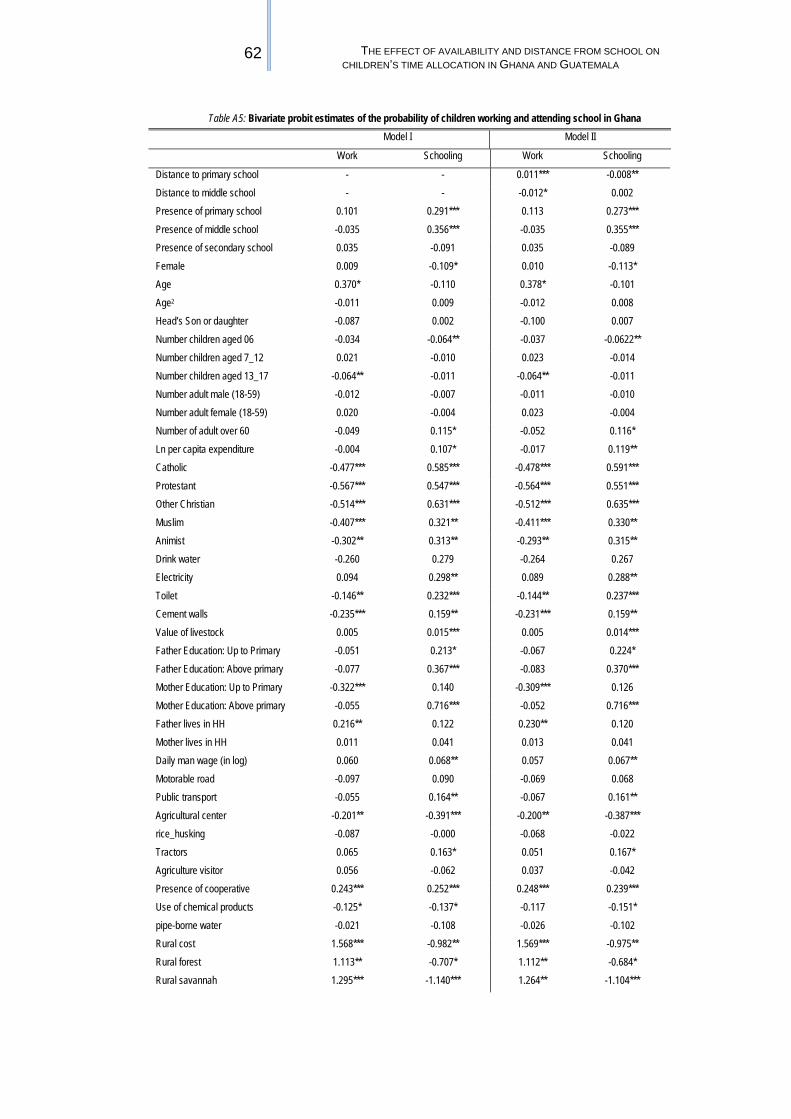
62 THE EFFECT OF AVAILABILITY AND DISTANCE FROM SCHOOL ON CHILDREN’S TIME ALLOCATION IN GHANA AND GUATEMALA
Table A5: Bivariate probit estimates of the probability of children working and attending school in Ghana Model I Model II
Work Schooling Work Schooling
Distance to primary school - - 0.011*** -0.008** Distance to middle school - - -0.012* 0.002 Presence of primary school 0.101 0.291*** 0.113 0.273*** Presence of middle school -0.035 0.356*** -0.035 0.355*** Presence of secondary school 0.035 -0.091 0.035 -0.089 Female 0.009 -0.109* 0.010 -0.113* Age 0.370* -0.110 0.378* -0.101 Age2 -0.011 0.009 -0.012 0.008 Head’s Son or daughter -0.087 0.002 -0.100 0.007 Number children aged 06 -0.034 -0.064** -0.037 -0.0622** Number children aged 7_12 0.021 -0.010 0.023 -0.014 Number children aged 13_17 -0.064** -0.011 -0.064** -0.011 Number adult male (18-59) -0.012 -0.007 -0.011 -0.010 Number adult female (18-59) 0.020 -0.004 0.023 -0.004 Number of adult over 60 -0.049 0.115* -0.052 0.116* Ln per capita expenditure -0.004 0.107* -0.017 0.119** Catholic -0.477*** 0.585*** -0.478*** 0.591*** Protestant -0.567*** 0.547*** -0.564*** 0.551*** Other Christian -0.514*** 0.631*** -0.512*** 0.635*** Muslim -0.407*** 0.321** -0.411*** 0.330** Animist -0.302** 0.313** -0.293** 0.315** Drink water -0.260 0.279 -0.264 0.267 Electricity 0.094 0.298** 0.089 0.288** Toilet -0.146** 0.232*** -0.144** 0.237*** Cement walls -0.235*** 0.159** -0.231*** 0.159** Value of livestock 0.005 0.015*** 0.005 0.014*** Father Education: Up to Primary -0.051 0.213* -0.067 0.224* Father Education: Above primary -0.077 0.367*** -0.083 0.370*** Mother Education: Up to Primary -0.322*** 0.140 -0.309*** 0.126 Mother Education: Above primary -0.055 0.716*** -0.052 0.716*** Father lives in HH 0.216** 0.122 0.230** 0.120 Mother lives in HH 0.011 0.041 0.013 0.041 Daily man wage (in log) 0.060 0.068** 0.057 0.067** Motorable road -0.097 0.090 -0.069 0.068 Public transport -0.055 0.164** -0.067 0.161** Agricultural center -0.201** -0.391*** -0.200** -0.387*** rice_husking -0.087 -0.000 -0.068 -0.022 Tractors 0.065 0.163* 0.051 0.167* Agriculture visitor 0.056 -0.062 0.037 -0.042 Presence of cooperative 0.243*** 0.252*** 0.248*** 0.239*** Use of chemical products -0.125* -0.137* -0.117 -0.151* pipe-borne water -0.021 -0.108 -0.026 -0.102 Rural cost 1.568*** -0.982** 1.569*** -0.975** Rural forest 1.113** -0.707* 1.112** -0.684* Rural savannah 1.295*** -1.140*** 1.264** -1.104***

63 UCW WORKING PAPER SERIES, MAY 2007
Constant -4.546*** -1.319 -4.407*** -1.474
Rho12 -0.273*** -0.265*** Number observations 3354 3354
Note: omitted categories are: father no education or missing, mother no education or missing, no religion, other urban area. Standard errors are clustered by communities.

64 THE EFFECT OF AVAILABILITY AND DISTANCE FROM SCHOOL ON CHILDREN’S TIME ALLOCATION IN GHANA AND GUATEMALA
Tab A6. Activity status of children by presence of primary and secondary schools and distances from school for indigenous and non indigenous children in Guatemala (in percent)
Activity Status
Panel A Indigenous Work only School only Work & School None TOT No primary school 10.07 47.34 13.96 28.63 100.00 Presence primary school 11.63 50.99 17.70 19.68 100.00 No secondary school 11.01 48.13 16.41 24.45 100.00 Presence secondary school 11.84 56.09 17.50 14.58 100.00 Distance primary school 1.42 1.39 1.50 1.58 - Distance secondary school 2.19 2.39 2.29 2.59 -
Panel B Non indigenous Work only School only Work & School None TOT No primary school 7.12 69.54 9.99 13.36 100.00 Presence primary school 7.58 66.37 11.53 14.52 100.00 No secondary school 7.80 66.30 11.71 15.18 100.00 Presence secondary school 6.69 69.39 11.90 12.02 100.00 Distance primary school 1.62 1.50 1.64 1.60 - Distance secondary school 2.15 2.28 2.46 2.34 -

65 UCW WORKING PAPER SERIES, MAY 2007
Table A7: Bivariate probit estimates of the probability of children working and attending school in Guatemala Model I Model II
Work Schooling Work Schooling
Distance primary school - - 0.001 -0.012*** Distance secondary school - - -0.002 -0.001 Presence of primary school 0.105 0.284*** 0.104 0.258*** Presence of secondary school -0.027 -0.127 -0.028 -0.121 Female -0.642*** -0.181*** -0.641*** -0.177*** Rural 0.572*** -0.057 0.582*** -0.055 Age 0.381*** 1.062*** 0.380*** 1.059*** Age2 -0.006 -0.054*** -0.006 -0.054*** Head’s Son or daughter 0.289* 0.348*** 0.290* 0.355*** Number children aged 06 -0.001 0.024 -0.001 0.023 Number children aged 7_14 -0.017 -0.053* -0.019 -0.052* Number children aged 15_17 -0.082* 0.036 -0.082* 0.039 Number adult male (18-59) -0.032 0.007 -0.029 0.008 Number adult female (18-59) -0.117** -0.085* -0.118** -0.088* Number of adult over 60 -0.048 0.033 -0.047 0.034 Ln per capita expenditure -0.011 0.214*** -0.010 0.211*** Toilet -0.035 0.295** -0.037 0.293** Concrete walls -0.118 0.286*** -0.119 0.295*** Cement floors 0.050 0.172** 0.049 0.165** Value of livestock 0.039*** 0.044*** 0.039*** 0.046*** Father Educ.: Up to Primary -0.035 0.398* -0.038 0.412** Father Educ: Above primary -0.306 0.804*** -0.304 0.819*** Mother Educ: Up to Primary -1.184** -0.538 -1.193** -0.579 Mother Educ: Above primary -1.279** 0.0560 -1.288** 0.008 Father lives in HH -0.022 -0.078 -0.017 -0.093 Mother lives in HH 1.208** 0.322 1.213** 0.360 Mail 0.298 -0.201 0.304 -0.241 Bank -0.034 0.127 -0.028 0.079 Cooperative -0.193 0.132 -0.197 0.179 Police -0.287 -0.128 -0.293 -0.127 Market 0.188 -0.045 0.190 -0.027 Pipe water in the dws 0.0428 0.486*** 0.047 0.495*** telephone in the dws 0.080 -0.483*** 0.084 -0.479*** Trash collection -0.045 0.626*** -0.046 0.655*** Public light 0.222** 0.026 0.221** 0.022 Electricity in the dws -0.014 -0.071 -0.012 -0.064 Transportation 0.116 0.205*** 0.119 0.205*** Protective service 0.380*** -0.079 0.378*** -0.109 Norte 0.024 0.713*** 0.025 0.698*** Nororiente -0.130 0.561** -0.120 0.531** Suroriente -0.332 1.026*** -0.336 1.015*** Central 0.340 0.799*** 0.340 0.797***

66 THE EFFECT OF AVAILABILITY AND DISTANCE FROM SCHOOL ON CHILDREN’S TIME ALLOCATION IN GHANA AND GUATEMALA
Surroccidente -0.040 1.210*** -0.039 1.220*** Noroccidente -0.215 0.686*** -0.212 0.678*** Peten -0.359 0.993*** -0.360 0.959*** Constant -4.402*** -7.537*** -4.396*** -7.394***
Rho12 -0.176*** -0.176*** Number observations 2503 2503
Note: omitted categories are: father no education or missing, mother no education or missing, metropolitan area. Standard errors are clustered by communities.

67 UCW WORKING PAPER SERIES, MAY 2007
Table A8: Trivariate probit estimates of the probability of children working, attending school, and doing household chores in Ghana
Model I Model II
Work Schooling Household
Chores
Work Schooling Household
Chores
Distance to primary school * - - - 0.011*** -0.008** 0.008** Distance to middle school * - - - -0.012** 0.0019 0.017*** Presence of primary school 0.095 0.28*** -0.26*** 0.11 0.26*** -0.24*** Presence of middle school -0.026 0.36*** -0.052 -0.025 0.36*** -0.052 Presence of secondary school 0.034 -0.084 0.10 0.034 -0.082 0.10 Female 0.0053 -0.11* 0.38*** 0.0062 -0.11* 0.39*** Age 0.37* -0.12 0.40* 0.37* -0.11 0.38* Age2 -0.011 0.0092 -0.010 -0.011 0.0088 -0.0091 Head’s Son or daughter -0.075 -0.00015 -0.093 -0.088 0.0050 -0.077 Number children aged 06 -0.034 -0.065** 0.12*** -0.036 -0.063** 0.12*** Number children aged 7_12 0.019 -0.0070 -0.023 0.022 -0.011 -0.017 Number children aged 13_17 -0.067** -0.010 -0.18*** -0.067** -0.010 -0.18*** Number adult male (18-59) -0.012 -0.0071 -0.077** -0.012 -0.010 -0.069* Number adult female (18-59) 0.022 -0.0041 -0.033 0.026 -0.0039 -0.041 Number of adult over 60 -0.051 0.11* 0.045 -0.053 0.12* 0.057 Ln per capita expenditure -0.0022 0.11* 0.36*** -0.015 0.12** 0.33*** Catholic -0.48*** 0.59*** -0.37** -0.48*** 0.60*** -0.39*** Protestant -0.57*** 0.55*** -0.37*** -0.56*** 0.55*** -0.38*** Other Christian -0.52*** 0.64*** -0.41*** -0.52*** 0.64*** -0.42*** Muslim -0.41*** 0.32** -0.59*** -0.41*** 0.33** -0.62*** Animist -0.31** 0.31** -0.39** -0.30** 0.31** -0.41** Drink water -0.24 0.26 -0.19 -0.25 0.24 -0.15 Electricity 0.094 0.29** -0.032 0.089 0.28** 0.001 Toilet -0.15** 0.23*** -0.11* -0.14** 0.24*** -0.14** Cement walls -0.24*** 0.16** 0.088 -0.24*** 0.16** 0.072 Value of livestock 0.0049 0.014*** -0.0075 0.0051 0.014** -0.0042 Father Educ.: Up to Primary -0.054 0.20 0.20* -0.069 0.22* 0.21* Father Educ: Above primary -0.076 0.37*** 0.0024 -0.081 0.38*** 0.019 Mother Educ: Up to Primary -0.32*** 0.12 -0.17* -0.30*** 0.11 -0.14 Mother Educ: Above primary -0.054 0.71*** -0.19** -0.052 0.71*** -0.19** Father lives in HH 0.22** 0.12 0.078 0.23** 0.12 0.062 Mother lives in HH 0.0091 0.045 -0.12 0.011 0.045 -0.13 Daily man wage (in log) 0.060 0.066** -0.0024 0.057 0.065** 0.0029 Motorable road -0.10 0.087 -0.052 -0.073 0.066 -0.027 Public transport -0.052 0.17** 0.011 -0.066 0.16** 0.037 Agricultural center -0.20** -0.39*** 0.12 -0.20** -0.39*** 0.12 rice_husking -0.096 -0.0065 -0.22** -0.076 -0.029 -0.19* Tractors 0.072 0.16* -0.14 0.056 0.16* -0.12 Agriculture visitor 0.057 -0.062 -0.11* 0.039 -0.042 -0.14** Presence of cooperative 0.24*** 0.25*** 0.22*** 0.25*** 0.24*** 0.25*** Use of chemical products -0.12* -0.14* -0.036 -0.12 -0.15** -0.010 pipe-borne water -0.014 -0.11 0.033 -0.020 -0.11 0.050

68 THE EFFECT OF AVAILABILITY AND DISTANCE FROM SCHOOL ON CHILDREN’S TIME ALLOCATION IN GHANA AND GUATEMALA
Rural cost 1.54*** -0.98** 0.40 1.54*** -0.98** 0.39 Rural forest 1.09** -0.71* 0.71*** 1.10** -0.69* 0.66** Rural savannah 1.27*** -1.14*** 0.83*** 1.24** -1.10*** 0.77*** Constant -4.53*** -1.23 -8.29*** -4.40*** -1.38 -8.05***
Rho12 -0.23*** -0.22*** Rho13 0.18*** 0.17*** Rho23 -0.063 -0.056 Number observations 3354 3354
Note: omitted categories are: father no education or missing, mother no education or missing, no religion, other urban area. Standard errors are clustered by communities.

69 UCW WORKING PAPER SERIES, MAY 2007
Table A9: Trivariate probit estimates of the probability of children working, attending school and doing household chores
in Guatemala Model I Model II
Work Schooling Household
Chores
Work Schooling Household
Chores
Distance primary school - - 0.001 -0.012*** 0.000 Distance secondary school - - -0.002 -0.001 0.003 Presence of primary school 0.11 0.28*** -0.18*** 0.11 0.26*** -0.18*** Presence of secondary school -0.028 -0.12 0.21** -0.028 -0.12 0.21** Female -0.64*** -0.18*** 0.21*** -0.64*** -0.18*** 0.21*** Rural 0.57*** -0.056 0.11 0.58*** -0.055 0.10 Age 0.39*** 1.06*** 0.050 0.39*** 1.06*** 0.051 Age2 -0.006 -0.054*** -0.002 -0.007 -0.054*** -0.002 Head’s Son or daughter 0.29* 0.35*** 0.21* 0.29* 0.36*** 0.21* Number children aged 06 -0.0013 0.024 0.082*** -0.001 0.023 0.081*** Number children aged 7_14 -0.018 -0.052* -0.11*** -0.020 -0.050* -0.11*** Number children aged 15_17 -0.081* 0.033 -0.035 -0.081* 0.037 -0.035 Number adult male (18-59) -0.031 0.0056 0.041 -0.029 0.007 0.037 Number adult female (18-59) -0.12** -0.083* -0.094** -0.12** -0.086* -0.093** Number of adult over 60 -0.050 0.033 0.085 -0.049 0.034 0.084 Ln per capita expenditure -0.010 0.21*** 0.033 -0.0093 0.21*** 0.032 Toilet -0.035 0.29** 0.090 -0.037 0.29** 0.094 Concrete walls -0.12 0.28*** -0.011 -0.12 0.29*** -0.011 Cement floors 0.052 0.17** -0.11* 0.051 0.17** -0.11 Value of livestock 0.039*** 0.044*** -0.016* 0.039*** 0.045*** -0.016* Father Educ.: Up to Primary -0.040 0.40** -0.23 -0.043 0.41** -0.23 Father Educ: Above primary -0.30 0.81*** -0.45** -0.30 0.82*** -0.45** Mother Educ: Up to Primary -1.19** -0.55 -1.66*** -1.19** -0.59 -1.65*** Mother Educ: Above primary -1.29** 0.057 -1.48** -1.30** 0.010 -1.47** Father lives in HH -0.019 -0.084 0.30 -0.013 -0.098 0.29 Mother lives in HH 1.21** 0.33 1.69*** 1.21** 0.37 1.69*** Mail 0.30 -0.19 -0.63*** 0.31 -0.23 -0.64*** Bank -0.039 0.13 -0.078 -0.034 0.083 -0.083 Cooperative -0.19 0.12 0.17 -0.19 0.17 0.18 Police -0.29 -0.13 0.26 -0.29 -0.13 0.26 Market 0.19 -0.051 -0.044 0.19 -0.033 -0.048 Pipe water in the dws 0.043 0.49*** 0.043 0.047 0.50*** 0.037 telephone in the dws 0.079 -0.48*** 0.037 0.083 -0.48*** 0.031 Trash collection -0.044 0.63*** 0.044 -0.044 0.66*** 0.043 Public light 0.22** 0.021 -0.019 0.22** 0.018 -0.015 Electricity in the dws -0.012 -0.070 -0.12 -0.010 -0.063 -0.12 Transportation 0.12 0.20*** 0.013 0.12* 0.20*** 0.0083 Protective service 0.38*** -0.076 0.16 0.38*** -0.11 0.16 Norte 0.026 0.71*** -0.013 0.026 0.70*** -0.011 Nororiente -0.12 0.56** -0.45* -0.11 0.53** -0.46* Suroriente -0.32 1.03*** -0.30 -0.33 1.02*** -0.29
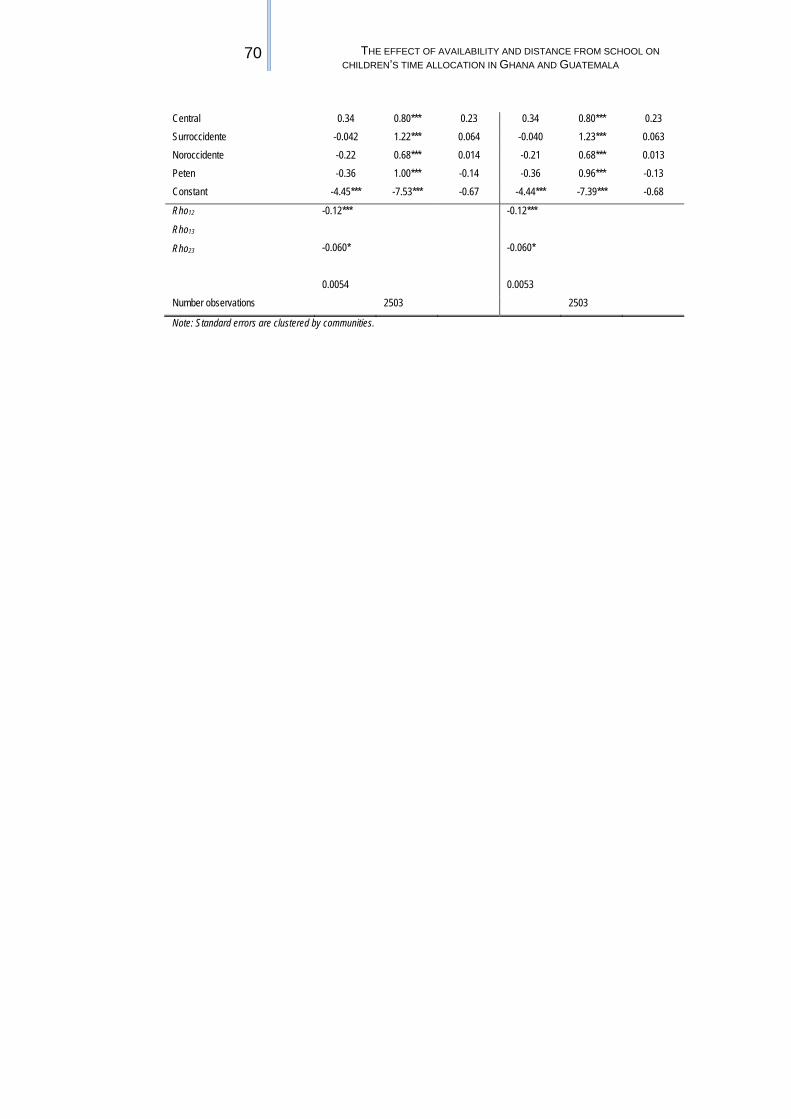
70 THE EFFECT OF AVAILABILITY AND DISTANCE FROM SCHOOL ON CHILDREN’S TIME ALLOCATION IN GHANA AND GUATEMALA
Central 0.34 0.80*** 0.23 0.34 0.80*** 0.23 Surroccidente -0.042 1.22*** 0.064 -0.040 1.23*** 0.063 Noroccidente -0.22 0.68*** 0.014 -0.21 0.68*** 0.013 Peten -0.36 1.00*** -0.14 -0.36 0.96*** -0.13 Constant -4.45*** -7.53*** -0.67 -4.44*** -7.39*** -0.68
Rho12 -0.12***
-0.060*
0.0054
-0.12***
-0.060*
0.0053
Rho13
Rho23
Number observations 2503 2503
Note: Standard errors are clustered by communities.

71 UCW WORKING PAPER SERIES, MAY 2007
Table A10: Trivariate probit estimates of the probability of children working, attending school and doing household works correcting for the endogeneity of expenditure in Ghana
Work Schooling Household
Chores
Distance to primary school * 0.011*** -0.008** 0.008** Distance to middle school * -0.012** 0.003 0.016*** Presence of primary school 0.128 0.256*** -0.232*** Presence of middle school -0.026 0.364*** -0.054 Presence of secondary school 0.049 -0.09 0.115 Female 0.006 -0.109* 0.387*** Age 0.374* -0.091 0.380* Age2 -0.011 0.008 -0.009 Head’s Son or daughter -0.074 0.001 -0.071 Number children aged 06 -0.071** -0.025 0.083*** Number children aged 7_12 0.009 -0.003 -0.027 Number children aged 13_17 -0.071** -0.006 -0.188*** Number adult male (18-59) -0.017 -0.005 -0.073* Number adult female (18-59) 0.020 -0.003 -0.043 Number of adult over 60 -0.057 0.122** 0.056 Ln per capita expenditure -0.335** 0.444*** 0.066 Catholic -0.472*** 0.592*** -0.380*** Protestant -0.558*** 0.554*** -0.366*** Other Christian -0.518*** 0.634*** -0.407*** Muslim -0.403*** 0.318** -0.612*** Animist -0.307** 0.334** -0.426*** Drink water -0.188 0.210 -0.116 Electricity 0.116 0.277** 0.019 Toilet -0.148** 0.241*** -0.137** Cement walls -0.225*** 0.149* 0.084 Value of livestock 0.004 0.016*** -0.005 Father Educ.: Up to Primary -0.061 0.216* 0.222** Father Educ: Above primary -0.068 0.355*** 0.034 Mother Educ: Up to Primary -0.300*** 0.122 -0.154* Mother Educ: Above primary -0.052 0.706*** -0.190** Father lives in HH 0.219** 0.132 0.051 Mother lives in HH -0.004 0.051 -0.133 Daily man wage (in log) 0.058 0.065** 0.007 Motorable road -0.102 0.099 -0.054 Public transport -0.074 0.166** 0.032 Agricultural center -0.200** -0.387*** 0.121 rice_husking -0.084 -0.004 -0.214* Tractors 0.044 0.171* -0.116 Agriculture visitor 0.043 -0.045 -0.134** Presence of cooperative 0.249*** 0.242*** 0.247*** Use of chemical products -0.108 -0.157** -0.01 pipe-borne water -0.026 -0.108 0.052

72 THE EFFECT OF AVAILABILITY AND DISTANCE FROM SCHOOL ON CHILDREN’S TIME ALLOCATION IN GHANA AND GUATEMALA
Rural cost 1.562*** -1.013** 0.402 Rural forest 1.127** -0.734* 0.683** Rural savannah 1.250** -1.129*** 0.775*** Predicted expenditure 0.349** -0.359** 0.297** Constant -0.146 -5.824** -4.513**
Rho12 -0.229*** Rho13 0.165*** Rho23 -0.0314 Number observations 3354
Note: Standard errors are bootstrapped in order to take into account of the generated variable and clustered by communities.

73 UCW WORKING PAPER SERIES, MAY 2007
Table A11: Multivariate probit estimates of the probability of children working, attending school and doing household works, controlling for the endogeneity of middle school in Ghana
Work Schooling Household Chores
Middle school
Distance to primary school * 0.011*** -0.008** 0.008** - Distance to middle school * -0.012* 0.0013 0.016*** - Presence of primary school 0.13 0.26*** -0.23** - Presence of middle school -0.17 0.43*** -0.13 - Presence of secondary school 0.056 -0.12 0.13 - Female 0.0034 -0.11* 0.39*** - Age 0.370* -0.084 0.37* - Age2 -0.011 0.007 -0.009 - Head’s Son or daughter -0.065 -0.002 -0.060 - Number children aged 06 -0.071** -0.024 0.083*** - Number children aged 7_12 0.010 -0.004 -0.028 - Number children aged 13_17 -0.071** -0.005 -0.19*** - Number adult male (18-59) -0.017 -0.005 -0.073** - Number adult female (18-59) 0.017 0.008 -0.042 - Number of adult over 60 -0.056 0.12** 0.054 - Ln per capita expenditure -0.33** 0.44*** 0.065 - Catholic -0.47*** 0.58*** -0.37** - Protestant -0.56*** 0.55*** -0.36** - Other Christian -0.52*** 0.62*** -0.40*** - Muslim -0.41*** 0.32** -0.60*** - Animist -0.31** 0.35** -0.42*** - Drink water -0.20 0.20 -0.091 - Electricity 0.13 0.25** 0.046 - Toilet -0.16** 0.25*** -0.15** - Cement walls -0.22*** 0.14* 0.084 - Value of livestock 0.004 0.015*** -0.006 - Father Educ.: Up to Primary -0.062 0.22* 0.23** - Father Educ: Above primary -0.071 0.37*** 0.028 - Mother Educ: Up to Primary -0.31*** 0.13 -0.15* - Mother Educ: Above primary -0.057 0.71*** -0.19** - Father lives in HH 0.21** 0.14 0.050 - Mother lives in HH -0.009 0.043 -0.14 - Daily man wage (in log) 0.061 0.063* 0.007 - Motorable road -0.098 0.17* -0.005 0.44*** Agricultural center -0.21** -0.37*** 0.14 - rice_husking -0.070 0.0020 -0.21* 0.48*** Tractors 0.072 0.14 -0.13 0.45*** Agriculture visitor 0.042 -0.037 -0.13** - Presence of cooperative 0.27*** 0.19*** 0.25*** - Use of chemical products -0.11 -0.15** -0.015 - Rural cost 1.56*** -1.00** 0.37 - Rural forest 1.12** -0.71* 0.65** - Rural savannah 1.25*** -1.11*** 0.71** -

74 THE EFFECT OF AVAILABILITY AND DISTANCE FROM SCHOOL ON CHILDREN’S TIME ALLOCATION IN GHANA AND GUATEMALA
Predicted expenditure 0.35** -0.35** 0.30** - Public transport - - - 0.61*** pipe-borne water - - - 1.35*** Distance from road (in km) - - - -0.003* Electricity in community - - - 0.82*** Telephone/postal office - - - 0.90*** Constant -0.18 -5.88** -4.39** -0.90***
Rho12 -.2061*** Rho13 .17412*** Rho14 .08916 Rho23 -.0423 Rho24 -.0437 Rho34 .05843 Number observations 3354
Note: Standard errors are bootstrapped in order to take into account of the generated variable and clustered by communities.

75 UCW WORKING PAPER SERIES, MAY 2007
Table A12: Trivariate probit estimates of the probability of children working, attending school and doing household chores, controlling for the endogeneity of per capita expenditure in Guatemala
Work Schooling Household Chores
Distance primary school 0.0034 -0.077*** 0.023 Distance secondary school -0.042** -0.0093 0.015 Presence of primary school 0.099 0.24*** -0.081 Presence of secondary school -0.029 -0.12 -0.027 Female -0.64*** -0.18*** 0.15*** Rural 0.60*** -0.057 0.014 Age 0.39*** 1.06*** -0.13 Age2 -0.0064 -0.054*** 0.0058 Head’s Son or daughter 0.28* 0.33** 0.10 Number children aged 06 0.047 0.15*** 0.058 Number children aged 7_14 -0.0020 -0.0030 -0.12*** Number children aged 15_17 -0.096** 0.028 0.010 Number adult male (18-59) -0.037 -0.028 0.082* Number adult female (18-59) -0.12** -0.12** -0.12*** Number of adult over 60 -0.060 0.0057 -0.076 Ln per capita expenditure 0.29 1.05*** -0.073 Toilet -0.069 0.24* -0.060 Concrete walls -0.14 0.27*** 0.0083 Cement floors 0.042 0.17** 0.12* Value of livestock 0.044*** 0.057*** -0.009 Father Educ.: Up to Primary -0.067 0.39* -0.001 Father Educ: Above primary -0.33 0.81*** -0.086 Mother Educ: Up to Primary -1.18** -0.56 -0.17 Mother Educ: Above primary -1.26** 0.070 -0.26 Father lives in HH 0.020 -0.064 -0.026 Mother lives in HH 1.19** 0.37 0.15 Mail 0.33 -0.25 -0.12 Bank -0.018 0.048 -0.34* Cooperative -0.21 0.21 0.14 Police -0.28 -0.067 0.48** Market 0.17 -0.058 -0.27* Pipe water in the dws 0.063 0.49*** -0.074 telephone in the dws 0.077 -0.50*** -0.045 Trash collection -0.059 0.65*** 0.20 Public light 0.22** 0.025 -0.11 Electricity in the dws -0.013 -0.051 -0.053 Transportation 0.12* 0.20*** 0.013 Protective service 0.37*** -0.12 -0.058 Norte -0.0074 0.67*** -0.18 Nororiente -0.13 0.49* -0.29 Suroriente -0.39 0.95*** 0.11 Central 0.31 0.78*** 0.22 Surroccidente -0.066 1.18*** -0.056 Noroccidente -0.23 0.64*** 0.028

76 THE EFFECT OF AVAILABILITY AND DISTANCE FROM SCHOOL ON CHILDREN’S TIME ALLOCATION IN GHANA AND GUATEMALA
Peten -0.40 0.93*** -0.24 Predicted expenditure -0.31 -0.86*** -0.024 Constant -6.22*** -12.5*** 1.26
Rho12 -0.14***
-0.0048
-0.015
Rho13
Rho23
Note: Standard errors are bootstrapped in order to take into account of the generated variable and clustered by communities.
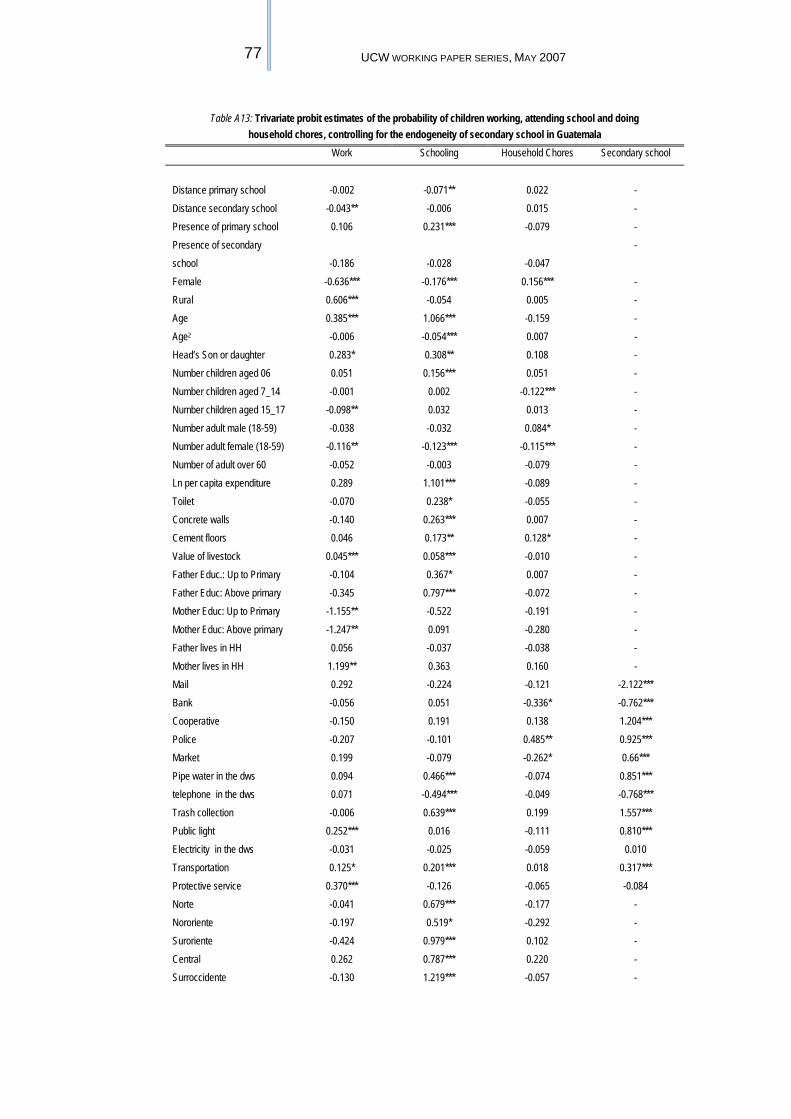
77 UCW WORKING PAPER SERIES, MAY 2007
Table A13: Trivariate probit estimates of the probability of children working, attending school and doing household chores, controlling for the endogeneity of secondary school in Guatemala
Work Schooling Household Chores Secondary school
Distance primary school -0.002 -0.071** 0.022 - Distance secondary school -0.043** -0.006 0.015 - Presence of primary school 0.106 0.231*** -0.079 - Presence of secondary school -0.186 -0.028 -0.047
-
Female -0.636*** -0.176*** 0.156*** - Rural 0.606*** -0.054 0.005 - Age 0.385*** 1.066*** -0.159 - Age2 -0.006 -0.054*** 0.007 - Head’s Son or daughter 0.283* 0.308** 0.108 - Number children aged 06 0.051 0.156*** 0.051 - Number children aged 7_14 -0.001 0.002 -0.122*** - Number children aged 15_17 -0.098** 0.032 0.013 - Number adult male (18-59) -0.038 -0.032 0.084* - Number adult female (18-59) -0.116** -0.123*** -0.115*** - Number of adult over 60 -0.052 -0.003 -0.079 - Ln per capita expenditure 0.289 1.101*** -0.089 - Toilet -0.070 0.238* -0.055 - Concrete walls -0.140 0.263*** 0.007 - Cement floors 0.046 0.173** 0.128* - Value of livestock 0.045*** 0.058*** -0.010 - Father Educ.: Up to Primary -0.104 0.367* 0.007 - Father Educ: Above primary -0.345 0.797*** -0.072 - Mother Educ: Up to Primary -1.155** -0.522 -0.191 - Mother Educ: Above primary -1.247** 0.091 -0.280 - Father lives in HH 0.056 -0.037 -0.038 - Mother lives in HH 1.199** 0.363 0.160 - Mail 0.292 -0.224 -0.121 -2.122*** Bank -0.056 0.051 -0.336* -0.762*** Cooperative -0.150 0.191 0.138 1.204*** Police -0.207 -0.101 0.485** 0.925*** Market 0.199 -0.079 -0.262* 0.66*** Pipe water in the dws 0.094 0.466*** -0.074 0.851*** telephone in the dws 0.071 -0.494*** -0.049 -0.768*** Trash collection -0.006 0.639*** 0.199 1.557*** Public light 0.252*** 0.016 -0.111 0.810*** Electricity in the dws -0.031 -0.025 -0.059 0.010 Transportation 0.125* 0.201*** 0.018 0.317*** Protective service 0.370*** -0.126 -0.065 -0.084 Norte -0.041 0.679*** -0.177 - Nororiente -0.197 0.519* -0.292 - Suroriente -0.424 0.979*** 0.102 - Central 0.262 0.787*** 0.220 - Surroccidente -0.130 1.219*** -0.057 -

78 THE EFFECT OF AVAILABILITY AND DISTANCE FROM SCHOOL ON CHILDREN’S TIME ALLOCATION IN GHANA AND GUATEMALA
Noroccidente -0.284 0.668*** 0.029 - Peten -0.465 0.970*** -0.238 - Predicted expenditure -0.312 -0.901*** -0.013 - Paved road - - - 0.729*** Public hospital - - - 2.096*** Health center - - - 1.302*** Pharmacy - - - 0.949***
Rho12 -.153812*** Rho13 .0222 Rho14 .12327 Rho23 .00832 Rho24 -.074411 Rho34 .01396 Number observations 2503
Note: Standard errors are bootstrapped in order to take into account of the generated variable and clustered by communities.