the effect of alloying elements on the ductility of al-mg
TRANSCRIPT

The Effect of Alloying Elements on the Ductility of Al-Mg-Si Alloys
Magnus Sætersdal Remøe
Materials Science and Engineering
Supervisor: Knut Marthinsen, IMTECo-supervisor: Ketill Pedersen, SINTEF
Ida Westermann, SINTEF
Department of Materials Science and Engineering
Submission date: June 2014
Norwegian University of Science and Technology

The Influence of Alloying Elements on the Ductility of Al-Mg-Si Alloys Remøe, M. S.
iii
Abstract
Experiments were conducted to attempt to understand the effect of different alloying elements on
the ductility of Al-Mg-Si alloys. Four alloys with different concentrations of Si, Mg, Fe, Mn and
Cu were selected for examination. The strength-ductility relationship was evaluated by tensile tests,
and microscopic analysis in light optical microscope, SEM and TEM was conducted to investigate
grain-, constituent-, precipitatation- and fracture characteristics.
Excess-Si (Mg/Si>1.73) was found to have a detrimental effect on the ductility of Al-Mg-Si
alloys, without the presence of additional alloying elements. This alloy had an elongation to
fracture of 23.1%, where failure occurred partly intergranularly, and was seemingly due to poor
grain boundary characteristics. Adding Fe and Cu improved the ductility (and strength) to
42.9% elongation, and the change was related to the formation of secondary-phase particles,
resulting in less free Si for embrittlement of grain boundaries. The best ductility, 79.2%
elongation, was found by introducing Mn, which in addition to the above-mentioned changed
the recrystallization behavior.
The most desirable combination of tensile strength (456 MPa) and ductility (64.6%) was found
in a balanced alloy (Mg/Si~1.73) with an addition of both Mn and Cu. Primarily, Cu was
associated with an increase in strength, by changing the precipitation behavior and precipitate
characteristics. Mn contributed to both an increase in strength and ductility, by forming
dispersoids which influenced the recrystallization behavior, resulting in a fine subgrain
structure.

The Influence of Alloying Elements on the Ductility of Al-Mg-Si Alloys Remøe, M. S.
iv

The Influence of Alloying Elements on the Ductility of Al-Mg-Si Alloys Remøe, M. S.
v
Sammendrag
Eksperimenter ble utført for å forsøke å forstå effekten av forskjellige legeringselementer på
duktiliteten til Al-Mg-Si legeringer. Fire legeringer med forskjellig innhold av Mg, Si, Fe, Mn
og Cu ble valgt for undersøkelse. Styrke-duktilitet forholdet ble evaluert med strekktester, og
mikroskopiske analyser i lysmikroskop, SEM og TEM ble utført for å undersøke korn-,
partikkel-, presipiterings- og bruddkarakteristikker.
Overskudd av Si (Mg/Si=1.73) viste seg å ha en skadelig effekt på duktiliteten til Al-Mg-Si
legeringer, ved mangel av andre legeringselementer. Denne legeringen hadde en forlengelse til
brudd på 23.1%, og feilet delvis interkrystallinsk, noe som tilsynelatende skyltes ufordelaktige
korngrensekarakteristikker. Et tillegg av Fe og Cu, førte til en betydelig forbedring av
duktiliteten (og styrken) med 42.9% forlengelse, og dette ble relatert til dannelsen av sekundære
partikler som resulterte i mindre fri Si til forsprøing av korngrenser. Den beste duktilite ten,
79.2% forlengelse, ble funnet ved å introdusere Mn, som i tillegg til det ovennevnte endret
rekrystalliseringsatferden.
Den mest fordelaktige kombinasjonen av bruddseihet (456 MPa) og duktilitet (64.6%) ble
observert i en balansert legering (Mg/Si=1.73) med et tillegg av Mn og Cu. Cu ble først og
fremst forbundet med økning i styrke ved å endre presipiteringsatferd og
presipitatskarakteristikker. Mn bidro til både en økning i styrke og duktilitet, ved å danne
dispersoider som påvirket rekrystalliseringsatferden og førte til en finkornet mikrostruktur.

The Influence of Alloying Elements on the Ductility of Al-Mg-Si Alloys Remøe, M. S.
vi

The Influence of Alloying Elements on the Ductility of Al-Mg-Si Alloys Remøe, M. S.
vii
Preface
This thesis comprises studies conducted during the final semester of the 5 year Master’s Degree
Programme in Materials Science and Engineering at the Norwegian University of Science and
Technology (NTNU). It was carried out at the Department of Materials Science and
Technology, NTNU, in collaboration with SINTEF and Hydro.
It is related to a larger Hydro-project called “Smart 6xxx Alloy Development for Rolling and
Extrusion” (RolEx), in which they have an R&D-collaboration with NTNU and SINTEF.
RolEx is a four year project with the aim to develop new alloys and thermo-mechanica l
processes for extruded products and rolled plates in the 6xxx-series. These alloys are to be
designed to exhibit a formability and final property balance currently not available on today’s
market.
The main aim of this study has been to contribute to a better understanding of the effect alloying
elements have on the mechanisms controlling ductility, and in this way provide supplementary
results for the RolEx project.

The Influence of Alloying Elements on the Ductility of Al-Mg-Si Alloys Remøe, M. S.
viii
The Influence of Alloying Elements on the Ductility of Al-Mg-Si Alloys Remøe, M. S.
ix
Acknowledgment
The accomplishment of this thesis would never have been possible without the support of
several individuals, which will be presented in the following.
A special gratitude is directed at my supervisor, Professor Knut Marthinsen, for always doing
his utmost with respects to the various challenges encountered during the execution of this
thesis. His commitment and knowledge, along with the essential insights from my co-
supervisors Ketill Pedersen and Ida Westermann, provided me with the necessary tools to carry
out a study with satisfactory quality.
My appreciation goes to Morten Myren (Finmekanisk Verksted, NTNU) for his help in
machining tensile specimens, and Vidar Hjelmen (SINTEF) for executing the tensile tests. I
would like to thank Birgitte Karlsen (SINTEF) for her help in preparing specimens for use in
TEM, and Trygve Schanche (NTNU) for his help with various needs and difficult ies
encountered in the metallurgical laboratory.
I am particularly grateful for the vast support I received from Yingda Yu (NTNU) in the art of
operating a TEM. His dedication to educate and guide students to higher levels of understand ing
in the use of equipment at the SEM laboratory (NTNU) is greatly appreciated.
Finally, my gratitude goes to my fellow students for their contribution to the excellent academic
and pleasant environment that has been vital for my enjoyment and development throughout
these five interesting years. It is often stated that the best time of your life is experienced while
you are a student, and this period of my life will certainly not be forgotten.

The Influence of Alloying Elements on the Ductility of Al-Mg-Si Alloys Remøe, M. S.
x
The Influence of Alloying Elements on the Ductility of Al-Mg-Si Alloys Remøe, M. S.
xi
Table of Contents
1 INTRODUCTION .............................................................................................................................................................. 1
2 THEORETICAL BACKGROUND ...................................................................................................................................... 3
2.1 THE 6XXX-SERIES ............................................................................................................................................................ 3
2.2 PROCESSING ROUTE ........................................................................................................................................................ 3
2.2.1 Thermo-mechanical processing (TMP) ....................................................................................................... 3
2.2.2 Microstructure development ........................................................................................................................ 6
2.2.3 Age hardening ............................................................................................................................................... 11
2.3 TENSILE TESTS ............................................................................................................................................................... 16
2.3.1 Stress-strain curves....................................................................................................................................... 16
2.3.2 Fractography ................................................................................................................................................. 19
2.4 SCANNING ELECTRON MICROSCOPE (SEM) .................................................................................................................... 21
2.4.1 Backscatter electron imaging (Z-contrast)............................................................................................... 21
2.4.2 Fractography ................................................................................................................................................. 22
2.4.3 Energy dispersive spectrum (EDS) .............................................................................................................. 22
2.5 TRANSMISSION ELECTRON MICROSCOPE (TEM) ............................................................................................................. 23
2.5.1 Diffraction and imaging............................................................................................................................... 24
2.5.2 Contrast .......................................................................................................................................................... 26
3 EXPERIMENTAL PROCEDURE AND SETUP............................................................................................................... 29
3.1 MATERIALS................................................................................................................................................................... 29
3.2 HARDNESS TESTING AND DETERMINATION OF ELECTRICAL CONDUCTIVITY ........................................................................ 29
3.3 TENSILE TESTS ............................................................................................................................................................... 30
3.4 MICROSCOPY AND SAMPLE PREPARATIONS..................................................................................................................... 31
3.4.1 Light optical microscopy and microstructure characterization ............................................................ 31
3.4.2 Scanning electron microscopy .................................................................................................................... 32
3.4.3 Transmission electron microscopy ............................................................................................................. 34
4 RESULTS ......................................................................................................................................................................... 37
4.1 AGEING ........................................................................................................................................................................ 37
4.1.1 Ageing behavior ............................................................................................................................................ 37
4.1.2 Electrical conductivity evolution ................................................................................................................ 38
4.2 TENSILE TESTS ............................................................................................................................................................... 39
4.2.1 Aged specimens ............................................................................................................................................ 39
4.2.2 Aged vs. non-aged specimens .................................................................................................................... 40
4.2.3 Pre-strained specimens................................................................................................................................ 42
4.3 CONSTITUENT ANALYSIS ................................................................................................................................................ 44

The Influence of Alloying Elements on the Ductility of Al-Mg-Si Alloys Remøe, M. S.
xii
4.3.1 Constituent distribution ............................................................................................................................... 44
4.3.2 Chemical analysis .......................................................................................................................................... 46
4.4 GRAIN STRUCTURE ........................................................................................................................................................ 48
4.5 FRACTURE SURFACE CHARACTERIZATION ........................................................................................................................ 49
4.6 TRANSMISSION ELECTRON MICROSCOPY......................................................................................................................... 53
4.6.1 Precipitate distribution, shapes and sizes ................................................................................................ 54
4.6.2 Grain boundary precipitates ....................................................................................................................... 55
4.6.3 Precipitation free zone (PFZ) ....................................................................................................................... 56
4.6.4 Dispersoids ..................................................................................................................................................... 57
4.6.5 Sub-grain structure....................................................................................................................................... 59
5 DISCUSSION ................................................................................................................................................................... 61
5.1 AGEING BEHAVIOR AND ELECTRICAL CONDUCTIVITY ........................................................................................................ 61
5.2 CONSTITUENTS ............................................................................................................................................................. 62
5.2.1 Chemical composition .................................................................................................................................. 62
5.2.2 Distribution and size..................................................................................................................................... 63
5.3 GRAIN STRUCTURE ........................................................................................................................................................ 64
5.4 FRACTOGRAPHY ............................................................................................................................................................ 64
5.4.1 Decrease in cross-sectional area after fracture ...................................................................................... 64
5.4.2 Fracture surfaces .......................................................................................................................................... 65
5.5 TRANSMISSION ELECTRON MICROSCOPE........................................................................................................................ 66
5.5.1 Precipitate distribution ................................................................................................................................ 66
5.5.2 Precipitate sizes and shapes ....................................................................................................................... 67
5.5.3 Grain boundaries .......................................................................................................................................... 67
5.5.4 Dispersoids ..................................................................................................................................................... 68
5.6 TENSILE TESTS ............................................................................................................................................................... 68
5.6.1 Aged specimens ............................................................................................................................................ 68
5.6.2 The effect of pre-straining from T5 ........................................................................................................... 69
5.7 SUGGESTIONS FOR FUTURE WORK.................................................................................................................................. 70
6 CONCLUSION ................................................................................................................................................................. 73
7 REFERENCES .................................................................................................................................................................. 75
APPENDIX A CONSTITUENT DISTRIBUTION IN 250X............................................................................................... 79
APPENDIX B EDS ANALYSIS .......................................................................................................................................... 81
APPENDIX C ADDITIONAL TEM IMAGES ................................................................................................................... 85

The Influence of Alloying Elements on the Ductility of Al-Mg-Si Alloys Remøe, M. S.
xiii
List of figures
Figure 2.1: Production process................................................................................................... 5
Figure 2.2: Extrusion process..................................................................................................... 5
Figure 2.3: Temperature/time profile ......................................................................................... 6
Figure 2.4: An image of the deformed microstructure during extrusion ................................... 9
Figure 2.5: A phase diagram showing the solubility of Mg and Si in the Al-matrix ............... 12
Figure 2.6: The precipitation sequence of an Al-Mg-Si alloy.................................................. 13
Figure 2.7: Stress-strain curves ................................................................................................ 16
Figure 2.8: The necking region ................................................................................................ 18
Figure 2.9: Illustration of the development of a ductile fracture ............................................. 20
Figure 2.10: The pathway of the electron beam through the TEM .......................................... 24
Figure 2.11: An illustration of Braggs' law .............................................................................. 25
Figure 2.12: The pathway of the electron beam through the intermediate lens ....................... 25
Figure 2.13: The diffraction pattern ......................................................................................... 26
Figure 2.14: Image formation in bright field (a) and dark field (b) image mode ..................... 27
Figure 2.15: Contrast achievement of particles........................................................................ 27
Figure 2.16: Contrast mechanism for coherent precipitates ..................................................... 28
Figure 3.1: The dimensions of the tensile test specimens ........................................................ 30
Figure 3.2: Illustration of the microscopy sample geometry and directions ............................ 31
Figure 3.3: An illustration of the Feret diameter...................................................................... 33
Figure 4.1: Hardening behavior ............................................................................................... 37
Figure 4.2: The electrical conductivity evolution during ageing ............................................. 38
Figure 4.3: Stress-strain curves in temper T6 .......................................................................... 40
Figure 4.4: Stress-strain curves comparing aged (T6) alloys with non-aged (T5)................... 41
Figure 4.5: The stress-strain curves of 6082 as pre-strained from T5...................................... 42
Figure 4.6: The stress-strain curves of KK13 as pre-strained from T5.................................... 43
Figure 4.7: SEM images of constituents .................................................................................. 45

The Influence of Alloying Elements on the Ductility of Al-Mg-Si Alloys Remøe, M. S.
xiv
Figure 4.8: Particle distribution charts ..................................................................................... 46
Figure 4.9: Plot of the chemical composition of a selection of constituents ............................ 48
Figure 4.10: Light microscope images of the grain structure .................................................. 49
Figure 4.11: Fracture surface images ....................................................................................... 50
Figure 4.12: SEM images of the fracture surfaces at 200X ..................................................... 51
Figure 4.13: SEM images of intergranular fracture ................................................................. 52
Figure 4.14: SEM images showing the presence of particles inside the dimples .................... 52
Figure 4.15: Dimples on facets ................................................................................................ 53
Figure 4.16: Deep dimples ....................................................................................................... 53
Figure 4.17: The precipitate distribution.................................................................................. 54
Figure 4.18: Precipitate distribution and sizes ......................................................................... 55
Figure 4.19: Grain boundary precipitates................................................................................. 56
Figure 4.20: TEM images of the precipitation free zone (PFZ)............................................... 57
Figure 4.21: TEM images of dispersoids ................................................................................. 58
Figure 4.22: TEM images of dispersoids and grain boundary pinning .................................... 58
Figure 4.23: Images with diffraction patterns revealing the presence of sub-grains ............... 59
Figure A.1: The images (250X magnification) used for the particle distribution analysis. Each
row displays the three images used for each alloy. Row 1: 6181. Row 2: KFC. Row 3: 6082.
Row 4: KK13. .......................................................................................................................... 79
Figure B.1: EDS analysis of constituents in 6181. ................................................................... 81
Figure B.2: EDS analysis of constituents in KFC. ................................................................... 82
Figure B.3: EDS analysis of constituents in 6082.................................................................... 83
Figure B.4: EDS analysis of constituents in KK13. ................................................................. 84
Figure C.1: Grain boundary in KK13 at 40 kX magnification................................................. 85
Figure C.2: Moirée fringes in KK13. The red lines (same angle) illustrates the small orientation
difference between the grains. .................................................................................................. 85
Figure C.3: Precipitates in 6082 at 30kX ................................................................................. 86
Figure C.4: Dispersoid on a grain boundary in 6181 at 20 kX magnification. ........................ 86

The Influence of Alloying Elements on the Ductility of Al-Mg-Si Alloys Remøe, M. S.
xv
Figure C.5: Dispersoid in 6181 at 10 kX magnification. ......................................................... 87
Figure C.6: Dispersoid in KFC at 40 kX magnification. ......................................................... 87
Figure C.7: Precipitates in KFC at 80kX magnification. ......................................................... 88
The Influence of Alloying Elements on the Ductility of Al-Mg-Si Alloys Remøe, M. S.
xvi
The Influence of Alloying Elements on the Ductility of Al-Mg-Si Alloys Remøe, M. S.
xvii
List of Tables
Table 3.1: Alloys investigated in this thesis............................................................................. 29
Table 3.2: The settings used for the different SEM investigations .......................................... 32
Table 3.3: The composition of electrolyte A2.......................................................................... 34
Table 3.4: Settings in Struers Tenupol-5.................................................................................. 35
Table 4.1: Peak hardness values............................................................................................... 38
Table 4.2: Values extracted from the tensile tests.................................................................... 40
Table 4.3: Important values extracted from the tensile tests of non-aged specimens .............. 42
Table 4.4: Pre-strained 6082 specimens................................................................................... 43
Table 4.5: Pre-strained KK13 specimens ................................................................................. 44
Table 4.6: Result from the particle distribution analysis ......................................................... 46
Table 4.7: Fracture area diameter............................................................................................. 50

The Influence of Alloying Elements on the Ductility of Al-Mg-Si Alloys Remøe, M. S.
xviii

The Influence of Alloying Elements on the Ductility of Al-Mg-Si Alloys Remøe, M. S.
1
1 Introduction
Aluminum and its alloys have been known and utilized for over a century, but is still regarded
as a material for the future. Its attractive properties in terms of e.g. specific strength and
corrosion resistance, combined with an excellent potential for recycling, makes it appealing for
numerous applications. A constant stream of innovations within the industry predicts a bright
future for the light metal, and it is expected that as the alloys grow more advanced, it will
increasingly take over for steel in applications formerly regarded to be out of bounds for
aluminum alloys. An example is the offshore industry, which is expected to increase the use of
aluminum alloys in construction applications [1].
The Al-Mg-Si series is already widely used in the automotive industry, but there is still room
to improve in terms of the strength and ductility of the alloys, e.g. to ensure that they absorb a
sufficient amount of the energy related to a collision. Investigations into the effect of different
alloying content and thermo-mechanical processes may provide information to improve these
properties.
The ductility of a material is dependent on a number of factors, which are mainly associated
with microscopic characteristics. As a consequence of this, advanced instruments must be
employed to examine the small-scale variations leading to different behavior. By understand ing
the effect alloying elements have on these characteristics it may be possible to adjust the
composition and processing to obtain optimal properties.
Four alloys with different concentrations of Mg, Si, Fe, Mn and Cu were selected for
experiments in this study. Tensile tests were executed to obtain the strength-ducti lity
relationship of every alloy, and the fracture surfaces of the specimens were examined in SEM
to determine the fracture mechanisms involved. In addition, it was attempted to reveal grain,
constituent, and precipitatation characteristics in light optical microscope, SEM and TEM.

The Influence of Alloying Elements on the Ductility of Al-Mg-Si Alloys Remøe, M. S.
2
The Influence of Alloying Elements on the Ductility of Al-Mg-Si Alloys Remøe, M. S.
3
2 Theoretical Background
2.1 The Al-Mg-Si alloys
Aluminum alloys are separated into two main classes, cast aluminum and wrought aluminum
alloys, where the latter are the most used with around 75-80% of the production quantity [2].
While cast aluminum alloys get all their strengthening through alloying elements, by solid
solution and/or age hardening, wrought aluminum alloys can, in addition to this, obtain a
strengthening effect through deformation hardening. The Al-Mg-Si alloys are wrought
aluminum alloys with the main alloying elements being magnesium and silicon, usually with a
content in the region of 0.5-1.3 wt% Mg and 0.4-1.4 wt% Si.[3]
Additional alloying elements may be added to further enhance the properties, the most
commonly used being Mn (0.5-0.7 wt%), Cr (0.1-0.3 wt%) and Cu (0.3-0.9 wt%). Mn and Cr
are normally introduced to prevent recrystallization and/or control grain growth during
processing while the introduction of Cu increases the strength. However, using concentrations
of Cu above 0.5 wt% reduces the corrosion resistance of this otherwise corrosion-resistant alloy
system.[4]
The Al-Mg-Si alloys have a relatively high strength compared to the other aluminum alloy
series, with a tensile strength lying in the region of 220-390 MPa. As is usual with other
materials the elongation decreases with increasing strength and the tensile strain is normally in
the region of 17-12% related to the above mentioned tensile strength.[3]
2.2 Processing route
Alloys from the 6xxx-series receive heat treatment after casting, and are therefore designated
to temper state TX, where T indicates “thermally treated”, and X is a number from 1-10
describing any possible additional treatments. The Al-Mg-Si alloys are commonly applied in
temper state T6, which indicates that mechanical processing, solution heat treatment and
artificial ageing to peak temper has been performed. Various events occur during these steps,
and they will be properly introduced in the following subchapters.
2.2.1 Thermo-mechanical processing (TMP)
2.2.1.1 General
Thermo-mechanical processing is a collective term for processes in which the material goes
through mechanical deformation at elevated temperatures; this being extrusion, rolling, forging

The Influence of Alloying Elements on the Ductility of Al-Mg-Si Alloys Remøe, M. S.
4
etc. Its origin dates all the way back to approximately 3000 B.C., when forging of bronze was
used to create tools and decorative applications.[5]
The excellent mechanical properties that can be obtained in wrought aluminum alloys are highly
dependent on thermo-mechanical processing to convert the material from a basic alloy with
mediocre properties to one with vastly improved qualities [5]. Over 75% of all industr ia l
aluminum alloys have in some way been through this type of processing after casting and
homogenization to produce a finished or semi-finished product.[6]
Common to these processes is the creation of a complex sequence of deformation in the
material, which along with prior and subsequent heat treatment steps, changes both the
microstructure and texture of the material. As these characteristics have a great effect on the
material properties, it is of vital importance to understand their mechanisms to be able to predict
the final properties of the alloy.[7]
2.2.1.2 Extrusion
All the alloys involved in this thesis have been extruded from a billet after casting and
homogenization. Extrusion is generally a cheap process which has relatively short operating
times and a variety of alloys may be formed into complex shapes. As an effect of this, around
30% of aluminum alloys consumed world-wide are extruded products, and over 90% of these
are estimated to come from the 6xxx-system.[6]
As depicted in Figure 2.1, the course of a typical Al-Mg-Si alloy from molten aluminum to
finished product goes through many steps. After casting, the material is heated and kept at an
elevated temperature to level out local differences in e.g. concentration and particle distribution
caused by solidification, and is therefore referred to as homogenization. Thereafter, the billet is
preheated to the desired extrusion temperature, extruded, and consequently cooled. Finally the
product is heat-treated to increase the hardness of the product by age hardening.

The Influence of Alloying Elements on the Ductility of Al-Mg-Si Alloys Remøe, M. S.
5
Figure 2.1: Production process. A schematic description of the production process of a 6xxx-alloy from casting to
finished product [6].
The extrusion process itself is illustrated in Figure 2.2, where a billet is placed in a chamber
with a die in one end and a ram in the other. The billet is forced through the relatively narrow
die and is converted into extended profiles with dimensions defined by the geometry of the die.
To reduce the load and wear of the dies, extrusion is normally performed at elevated
temperatures where the materials usually exhibit better formability [5]. The extrusion
temperature typically ranges between 500-550oC for aluminum alloys.[8]
Figure 2.2: Extrusion process. An illustration of how an extrusion process is executed [5].
The heat-treatment process varies from alloy to alloy, as the temperatures and holding times
chosen are dependent on the characteristics of the material. Wrought aluminum alloys are
typically solution heat treated after TMP and thereafter age-hardened at a lower temperature
[6]. A qualitative description of the different heating stages an alloy as the ones involved in this

The Influence of Alloying Elements on the Ductility of Al-Mg-Si Alloys Remøe, M. S.
6
project follows is given in Figure 2.3. An alloy following this type of processing is said to be
in the temper state T6 after ageing.[9]
Figure 2.3: Temperature/time profile. A qualitative description of the different temperature and time intervals a given 6xxx alloys follows [6].
2.2.2 Microstructure development
2.2.2.1 Formation of second phase constituents during casting
As a result of the solidification process, second-phase constituents, in the form of intermetallics,
may be found in the material after casting. The constituents may be divided further into two
categories, depending on their ability to dissolve during homogenization.
Non-soluble constituents are mainly Fe-containing, as Fe has an almost negligible solubility in
the aluminum matrix (~0.04 wt% at 655oC [10]). They may therefore not dissolve, but during
homogenization they may transform into different phases. Fe is usually an unwanted element
in aluminum, but is almost always present as an impurity in Al-Mg-Si alloys, due to the
difficulty associated with removing it completely from the molten metal.[11]
Compounds without Fe may be highly soluble, depending on the alloying content. One of the
purposes of homogenization prior to thermo-mechanical processing is to dissolve these
constituents. During homogenization, equilibrium phases grow by diffusion from a super-
saturated matrix, and due to the liberation of alloying elements from the soluble constituents,
while metastable particles are transformed to equilibrium particles.[11]
Typically, these particles are broken and divided into smaller pieces during mechanica l
processing, and aligned with the working direction. In tension, they are known to be damaging

The Influence of Alloying Elements on the Ductility of Al-Mg-Si Alloys Remøe, M. S.
7
to the fracture toughness of the materials, due to their cracking at low strains. Commonly 25-
50% of these particles crack after 7% plastic strain in tension for high-strength alloys.[11]
Depending on the solidification rate and alloying content, different types of constituents may
form during the casting of 6xxx alloys. G. Sha et.al. discovered both cubic α-AlFeSi and β-
AlFeSi after solidification of a 6082 alloy, where the former seemed to be observed at a higher
frequency at higher growth rates, and the latter at lower growth rates [10]. The α-AlFeSi was
found to have a composition close to Al12Fe3Si, while the β-particle is assumed to be Al5FeSi.
The latter is known to result in poor ductility and formability.[10, 12]
The introduction of Mn has been shown to change the conditions for constituent formation in
6xxx alloys, leading to the formation of α-Al15(FeMn)3Si and Al9Mn3Si, in addition to the above
mentioned. In the Al-Mg-Si-Cu alloy system, other constituents have been observed after
casting, these mainly being Al1.9CuMg4.1Si3.3, Al5FeMnSi and Al8(FeMn)2Si for an alloy
containing 0.3 wt% Fe. The Al1.9CuMg4.1Si3.3 was found to completely dissolve during
homogenization, while it was also found that increasing the Mn content leads to an increasing
amount of AlFeMnSi particles on the expense of Al1.9CuMg4.1Si3.3.[13, 14]
2.2.2.2 Deformation structure
The microstructure of the material will be subject to drastic changes during mechanica l
processing, due to the substantial forces involved. The microstructure of a material may be
generalized into two categories, one being the phase and grain structure, and the other the defect
structure.
The defect structure may be broken down into different types of defects, with some of them
summarized below.[5]
Composition defects: Segregation of alloy elements and local differences in
composition.
Point defects: Vacancies and interstitial/substitutional atoms.
Line defects: Dislocations.
Planar defects: Grain and phase boundaries and stacking faults.
Volume defects: Pores and inclusions.
Most of the energy that is generated during the deformation process is released as heat, but
anything from 1-10% of the energy may be stored in the structure of the material, as point
defects or dislocations [5]. Point defects are of less importance here as the mobility of vacancies
is high at higher temperatures, which allows them to continuously annihilate point defects like

The Influence of Alloying Elements on the Ductility of Al-Mg-Si Alloys Remøe, M. S.
8
interstitials through diffusion. As a consequence, almost all the energy stored is related to the
accumulation of dislocations, and their orientation and distribution is the most vital difference
between the material prior to, and after annealing.[15]
The amount of dislocations increase if the dislocation generation and multiplication occurs
faster than dynamic recovery is able to annihilate them. The increase in dislocation density is
due to a continuous obstruction of newly formed mobile dislocations, and the way these
dislocations interact with the deformation structure. The grains change shape according to the
macroscopic change in the subject’s dimensions during extrusion, causing the grains to become
elongated and the grain boundary area to increase. This area needs to be created during the
extrusion process, which is done by the inclusion of some of the dislocations generated during
deformation. The increased energy stored may therefore be associated with the increase in grain
boundary area.[15]
During deformation the dislocations may move an average distance L, and the dislocation
density is related to the true strain by the following expression:
bL 1
Where ε represents strain, b the burgers vector, and ρ the dislocation density. There is no
unambiguous determination of what to use as a value of L, but it may be justified in some cases
to relate it to e.g. the grain size or the average particle distance.[15]
The microstructure that develops during extrusion normally consists of elongated grains with a
high defect density, which are generally more deformed near the surface than in the middle.
The grains contain an internal substructure, which again are finer in regions subjected to larger
strains. An illustration of how and why the deformation varies across the cross-section may be
seen in Figure 2.4, where the deformation structure is captured at some stage during the
extrusion process.[16]

The Influence of Alloying Elements on the Ductility of Al-Mg-Si Alloys Remøe, M. S.
9
Figure 2.4: An image of the deformed microstructure during extrusion (Printed with the permission of Trond Furu, Hydro Aluminum)
Different substructures may arise during deformation, depending on the material and the
parameters of the process. Aluminum has a high stacking fault energy (170 mJ/m2), leading to
the creation of cellular substructures rather than twins and stacking faults. The substructures
that develop are temperature dependent. At low temperatures cellular structures are likely to
form, while at higher temperatures sub-grains with narrow well-defined walls are the most
likely.[2]
2.2.2.3 Recovery and recrystallization
The deformation structures during or after thermo-mechanical processing are
thermodynamically unstable, such that subsequent annealing of the subject leads to an evolut ion
in the sub-structure. This is controlled by thermally activated processes, which decrease the
stored energy of the structure and thereby also decrease the hardness. This evolution of the sub-
structure may also take place during deformation, and is typical for aluminum. It is then called
dynamic recovery and dynamic recrystallization.
The processes leading to the changes during heat-treatment (or extrusion) may be separated into
three categories.[5]

The Influence of Alloying Elements on the Ductility of Al-Mg-Si Alloys Remøe, M. S.
10
Recovery is driven by the stored energy in the structure and is related to micro-
mechanisms which move and annihilate point defects and dislocations, e.g. arranging
them in sub-grains.
Recrystallization is also a process driven by the stored energy in the structure, but is
related to the movement of high-angle boundaries.
Grain growth is driven by the surface energy of the grain boundaries and is, as for
recrystallization, related to the movement of high-angle boundaries to reduce the total
stored energy.
The relationship between the relative amount of recovery and recrystallization occurring is
dependent on several factors, e.g. strain, annealing temperature and material. In general,
recovery is the dominant mechanism at lower temperatures and as the temperature increases
recrystallization becomes more dominant. However, even at high temperatures some recovery
will occur prior to recrystallization.[5]
Recovery in aluminum proceeds with most of the dislocations being annihilated or rearranged
into walls which lead to the creation of well-defined sub-grain boundaries within each grain.
The amount of recovery is highly dependent on the stacking-fault energy of the material, where
a higher stacking fault energy, as is the case for aluminum, increases the likelihood of recovery.
This is an effect of the ease by which cross-slip and local annihilations in the material may
occur.[2]
At higher temperatures recrystallization is more dominant and involves the nucleation and
growth of new grains within one and the same phase. The most common sites for nucleation in
aluminum are particles and transition bands.[5]
Transition bands are created when two neighboring volumes within a grain deform on different
slip systems and rotate to give different orientations. Particles, preferably with sizes above 1
μm, create a deformation zone that surrounds it, and which may trap mobile dislocations. The
dislocation density (ρ) associated with such deformation zones is given by,
3 vF s
rb 2
where Fv is the volume fraction of particles, r the size of the particles, and s and b the shear
strain and burgers vector respectively. The phenomenon is called particle-stimulated nucleat ion
(PSN), and it’s the large differences of stored energy in these zones that stimula te
recrystallization.[5]

The Influence of Alloying Elements on the Ductility of Al-Mg-Si Alloys Remøe, M. S.
11
2.2.2.4 Dispersoids
When transition metals, such as manganese, are present in 6xxx-alloys, they tend to form small
particles or precipitates during casting or homogenization. Due to their slow diffusivity in the
aluminum matrix, these particles, or dispersoids, are usually smaller than 1 µm and widely
dispersed. Depending on factors such as size and distribution, which are mainly effects of
alloying content and homogenization treatment, they may have beneficial effects on the
recrystallization and deformation behavior [11]. At lower temperatures, for shorter times, the
dispersoids tend to be small and widely dispersed, while at higher temperatures, for longer times
the relation is reversed.[17]
Dispersoids are known to delay or hinder recrystallization during processing and as they are
often oriented in the direction of working, they tend to pin grain boundaries, aiding to retain the
fibrous grain morphology. Their ability to control the grain structure is highly dependent on
size, spacing and coherency, e.g. small dispersoids of less than 0.4 µm may hamper
discontinuous recrystallization by pinning of subgrains, and thus preventing recovery. Coherent
dispersoids are more effective in this regard, as they force the necessity to change the
dispersoid-matrix interface from coherent to semi-coherent or incoherent, a process requiring
high energies.[11]
In high-purity Al-Mg-Si-Mn alloys, the formation of AlMnSi dispersoids is known to occur,
while the presence of iron leads to the formation of a quaternary Al(Mn, Fe)Si phase. It has
been suggested that they tend to nucleate on β’-Mg2Si particles via an intermediate secondary
phase, and precipitate from around 400oC. Strobel et.al found that the dispersoid phases seem
to be α-Al12(MnFe)3Si when the Mn/Fe ratio is less than 1.6, and if larger, α-Al15(MnFe)3Si2
[17]. In another research Matsuda et.al identified the presence of coarse AlFeSi dispersoids in
transition metal bearing alloys with and without Cu [18].
2.2.3 Age hardening
2.2.3.1 Hardening by precipitation
In addition to strengthening effects caused by grain size, dislocation density, texture etc., the
alloy may be further strengthened by age hardening. This involves the precipitation of finely
distributed particles into the matrix from a super-saturated state. For this to occur the material
must have a decreasing solubility of alloy elements with decreasing temperatures. A phase
diagram showing the decreasing solubility of Mg and Si with temperature, represented by the
phase Mg2Si, is given in Figure 2.5 below. [2]
The Influence of Alloying Elements on the Ductility of Al-Mg-Si Alloys Remøe, M. S.
12
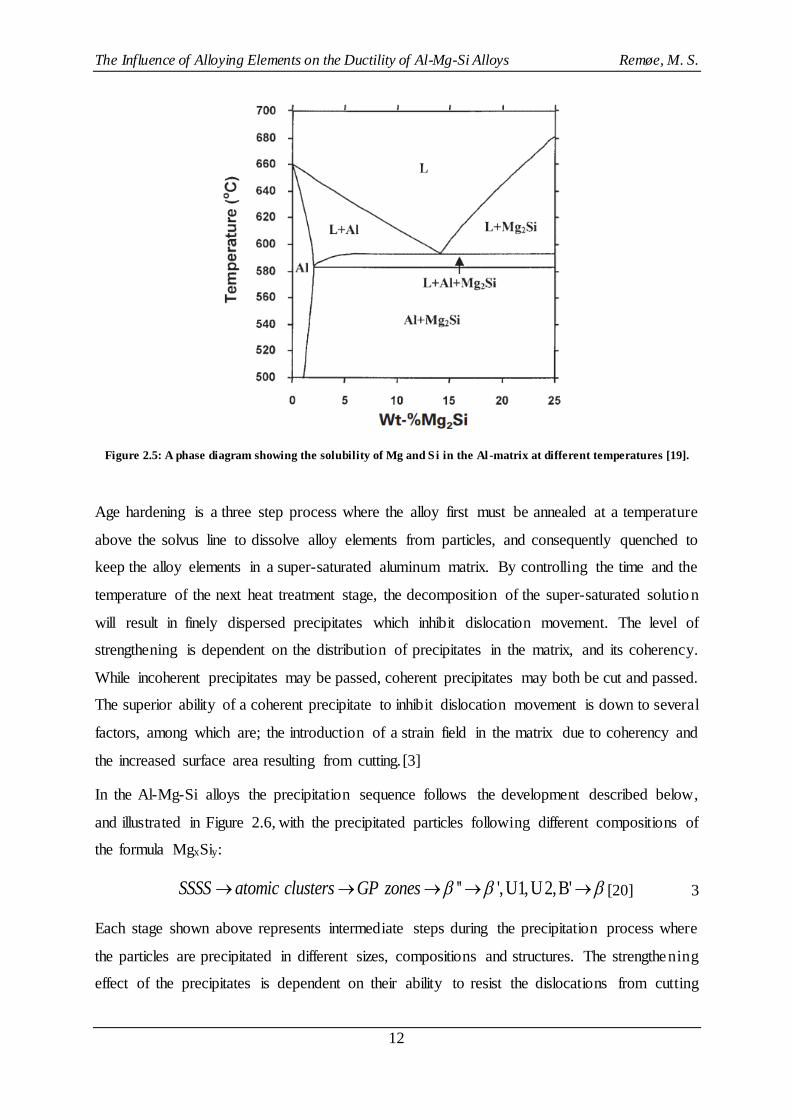
Figure 2.5: A phase diagram showing the solubility of Mg and Si in the Al -matrix at different temperatures [19].
Age hardening is a three step process where the alloy first must be annealed at a temperature
above the solvus line to dissolve alloy elements from particles, and consequently quenched to
keep the alloy elements in a super-saturated aluminum matrix. By controlling the time and the
temperature of the next heat treatment stage, the decomposition of the super-saturated solution
will result in finely dispersed precipitates which inhibit dislocation movement. The level of
strengthening is dependent on the distribution of precipitates in the matrix, and its coherency.
While incoherent precipitates may be passed, coherent precipitates may both be cut and passed.
The superior ability of a coherent precipitate to inhibit dislocation movement is down to several
factors, among which are; the introduction of a strain field in the matrix due to coherency and
the increased surface area resulting from cutting. [3]
In the Al-Mg-Si alloys the precipitation sequence follows the development described below,
and illustrated in Figure 2.6, with the precipitated particles following different compositions of
the formula MgxSiy:
'' ',U1,U2,B'SSSS atomic clusters GP zones [20] 3
Each stage shown above represents intermediate steps during the precipitation process where
the particles are precipitated in different sizes, compositions and structures. The strengthening
effect of the precipitates is dependent on their ability to resist the dislocations from cutting

The Influence of Alloying Elements on the Ductility of Al-Mg-Si Alloys Remøe, M. S.
13
through their structure. The GP-zones and β’’ phases are partially coherent, meaning they are
shearable, with a needle shape. β’ has also been found to be partially coherent, but precipitates
in the shape of a rod. The equilibrium phase β precipitates as incoherent plates, and is thus non-
shearable and dislocations are forced to loop around the precipitates.[3]
The strengthening effect is thought to be strongest for the β’’, and has been proposed to be
caused by the high energy of which is needed to break the Mg-Si bands, along with the shape
and size effects [3]. There may be various other intermediate phases present at different ageing
times, but these are the most common.
Figure 2.6: The precipitation sequence of an Al-Mg-Si alloy related to strength and time [21].
2.2.3.2 The influence of the Mg:Si ratio
The ratio of the Mg- and Si-content is of importance in the 6xxx-series. The properties may be
optimized by adjusting the content ratio of Mg and Si. A balanced 6xxx alloy usually exhibits
the best balance of properties given the alloy mainly consist of only these two elements. These
balanced alloys have a ratio of Mg on Si approximately equal to 1.73, and if the concentration
of Si increases in relation to this it is called an excess Si alloy.[22]
In alloys for automotive applications, excess Si alloys have been widely used to improve the
age hardening response [23, 24]. The presence of excess Si has not been found to change the
precipitation sequence, structure and lattice parameters of the metastable precursor phases in
Al-Mg-Si alloys. However, studies have shown that it may result in a modification of the
composition, especially in the early stages of precipitation, and change the density of

The Influence of Alloying Elements on the Ductility of Al-Mg-Si Alloys Remøe, M. S.
14
precipitated particles. Gupta et.al found that excess Si alloys had reduced times to initiate a
strengthening response during ageing as compared to that of the balanced alloys [23]. This was
concluded to be due to the amplified precipitation of fine, widely dispersed β’’. The reduction
in Mg/Si ratio in zones and clusters was found to lead to increased precipitation and
strengthening [23, 25]. The presence of excess Si has, however, been found to reduce the
ductility of Al-Mg-Si alloys. Aucote and Evans found that a significant amount of the excess
Si participated in the formation of pure Si particles on the grain boundaries, leading to
intergranular fracture [25].
2.2.3.3 The effect of Cu on precipitation
Due to the increased importance of 6xxx alloys in the automotive industry, various studies have
been conducted on the precipitation behavior of Al-Mg-Si alloys in the presence of Cu.
Although many of the mechanisms and intermediate phases involved are still unclear, there is
evidence that the presence of Cu changes the precipitation behavior significantly.[26]
As mentioned above, an increase in the strength of Cu-free excess-Si alloys has often been
observed for increasing Si-content, and the strengthening effect has been ascribed to an increase
in the volume fraction of β’’-particles. In excess-Si alloys containing Cu however, TEM
imaging has shown that with an addition of 0.3 wt% Cu the β’’-precipitates observed at peak
strength only amounted to 20-30% of the total amount of particles. The remaining particles had
needle or plate morphologies and consisted of Cu-containing GP zones and precursory phases
for Q’, a phase observed at later stages in ageing with the presence of Cu. These precursory
phases were present in the shape of needles and plates, and are assumed to give a significant
strengthening effect to Cu-containing Al-Mg-Si alloys at peak strength, especially the lath or
needle shaped L phase [26, 27]. At early stages in the ageing process, needle-shaped and fully
coherent GP zones have been observed, and that did not have the pre-β’’ monoclinic structure
typical for GP zones in excess-Si alloys without Cu.[27]
The presipitation sequence with an addition of Cu is currently assumed to be
'', ', , , , 'SSSS atomic clusters GP zones Q L S C QC Q Q [28] 4
where L, S, C and QC are all precursory phases for Q’. The chemical composition of both Q’
and Q is expected to be Al3Cu2Mg9Si7, while it is still unknown for the precursory phases.[27]

The Influence of Alloying Elements on the Ductility of Al-Mg-Si Alloys Remøe, M. S.
15
2.2.3.4 The effect of age hardening on electrical conductivity
There is a relation between the amount of solute that has been precipitated, and the electrica l
conductivity of a material. In general, defects and impurities in the matrix decrease the electrica l
conductivity of a material as the disturbances makes it more difficult for electrons to move. As
particles are precipitated from the super-saturated matrix, the amount of impurities decreases,
and thus the electrical conductivity generally increases. The conductivity may therefore be used
as a measure of the precipitation development during ageing, and should follow a similar
behavior as what would be observed when measuring the strength of the specimen as a function
of ageing time.
With the presence of Mg, Si, Fe and Cu, the effect on the electrical conductivity by these foreign
elements in solid solution may be given by Matthiessen’ rule:
1
0.0267 0.032 % 0.0068 % 0.0051 % 0.0033 %ss ss ss ssFe Si Mg Cu 5
where κ is the electrical conductivity, and Fess%, Siss%, Mgss% and Cuss%, the weight percent
of the respective elements in solid solution.[29, 30]
2.2.3.5 Precipitate free zone (PFZ)
Precipitation free zones emerge in all age-hardenable alloys and appear as zones drained of
precipitates, along the grain boundaries. They occur mainly due to mainly two reasons.
1. As a result of the easy diffusion of alloying elements to the grain boundaries, a narrow
zone of ~50 nm is formed on either side of the boundary. The alloying elements
subsequently combine to form relatively coarse particles on the grain boundaries.
2. There is a depletion of vacancies near a grain boundary, which retards the nucleation of
precipitates at a given ageing temperature, due to the difficulty for alloying elements to
diffuse. Some precipitates, such as GP-zones, may be less dependent on the vacancy
concentration, and will thus not be significantly affected.
There are ways in which one may reduce the effect of the depletion of vacancies. At higher
solution heat treatment temperatures and with faster quenching the excess vacancy
concentration increases and leads to a reduction in the width of the PFZ. Ageing at lower
temperatures may also have a positive effect, as it allows for smaller nuclei to be stable.[2]
Apart from the detrimental effect of the grain boundary particles, the presence, and the width
in particular, of the PFZ is an important property in age-hardenable alloys. Plastic flow may
occur with more ease along PFZ’s since these areas are softer than the surrounding matrix [31,

The Influence of Alloying Elements on the Ductility of Al-Mg-Si Alloys Remøe, M. S.
16
32]. Deformation in the PFZ may lead to the pile-up of dislocations at grain boundary
precipitates or grain boundaries and form microvoids leading to cracks and fracture.[33]
2.3 Tensile tests
2.3.1 Stress-strain curves
To evaluate the mechanical properties of a material, the uni-axial tensile test is commonly used.
The tensile test applies a uniaxial force to the material to measure the strength and ductility in
a given direction. As the work hardening of the material increases as the material is stretched,
resulting in a higher resistance to tension, the tensile force is increased with a quantity related
to the strain rate. The observed stress is plotted against the observed strain in the well-known
stress-strain curve, illustrated in Figure 2.7 below.
Figure 2.7: Stress-strain curves. The stress-strain relationship, illustrated both by the engineering stress-strain curve
and the true stress-strain curve [21].
2.3.1.1 Engineering vs. true stress
As is shown in Figure 2.7, there are two ways to look at the stress strain relationship of a
material. When calculating the engineering stress (s), the applied force (P) is related to the
original cross-sectional area (A0) of the specimen.[21]

The Influence of Alloying Elements on the Ductility of Al-Mg-Si Alloys Remøe, M. S.
17
0
Ps
A 6
As the cross-sectional area in fact decreases as the material is strained, a more precise
relationship is given by the true stress-strain curve (σ-ε), where the cross-sectional area (A) is
updated continuously during the tension test. The true stress may be calculated and related to
the engineering stress and strain by the following expression
(1 )P
s eA
7
where e is the engineering strain. Similarly, the true strain is calculated and related to the
engineering strain through
0
ln ln( 1)L
eL
8
where L is the length of the specimen at a given time, and L0 the original length. Initially, when
strains are low, there is no plastic deformation occurring in the material. This elastic region of
the curve is indicated by the straight line at low strains. The transition to plastic deformation is
shown by the point where the curve abruptly becomes non-linear, and work hardening is
initiated. The two curves, for s and σ, deviate more and more as the cross-sectional area
decreases. [21]
The maximum strength of the material is related to the point of maximum load. After this point
a neck will develop in the tensile specimen, and the cross-sectional area will now start to deform
non-uniformly. Neither of these graphs show the true development after this point as the stress
and strain must be corrected for this deviant behavior [21].
2.3.1.2 Bridgman correction
A triaxial stress state is introduced in the necked region, resulting in a higher registered stress
than what would actually be present if uniaxial stress conditions still prevailed. An expression
keeping in mind this new stress state was provided through the Bridgman analysis [34]. The
analysis is based on four main assumptions, being
the arc of a circle may approximate the outline of the neck.
the necking region’s cross-section stays circular during the test.
von Mises’ stress yield criterion is applicable.
the strains along the cross-section are constant.

The Influence of Alloying Elements on the Ductility of Al-Mg-Si Alloys Remøe, M. S.
18
which lead to the following corrected stress equation
( )
(1 2 / )[ln(1 / 2 ]
x avg
R a a R
9
where σ is the corrected stress, (σx)avg is the measured stress in the axial direction, R is the
curvature and ‘a’ is the radius of the neck [21]. These parameters are illustrated in Figure 2.8
below.
Figure 2.8: The necking region. a) An illustration of the geometry of a necking region. b) A triaxial stress distribution
[21].
Due to the relative difficulty with which one is able to measure the radius and the curvature of
the neck, an approximation to the ratio of a/R has been modelled [35]. Le Roy et.al proposed
the following relationship
1.1( )p u
a
R 10
where εp is the plastic strain at a given point after necking, and εu the strain at necking [36].
2.3.1.3 Laser extensometry
In the stages of a tensile test preceding necking, the strain may be measured using standard
contact extensometers, e.g. clip-on extensometers. The extensometer arms are clipped on to the
tensile specimen, and the distance between the arms increases as the specimen is stretched, thus
measuring the strain through elongation. However, after necking occurs, the decreasing area in

The Influence of Alloying Elements on the Ductility of Al-Mg-Si Alloys Remøe, M. S.
19
the neck induces a larger stress in this region relative to the original cross-sectional area. A laser
extensometer may be used to measure the increase in strain after necking as it gives a
measurement of the decrease in cross-sectional area, or more precisely, its diameter [37]. The
diameter at a given time or strain during the tensile test is compared to the original diameter,
and the average true axial strain may be calculated through
0lnx avg
A
A
11
where (εx)avg is the strain, A the area at a given time, and A0 the original area [38]. The shape
of the neck is usually assumed to be elliptic [39, 40], and the area is calculated through two
diameters measured perpendicular on one another, leading to
1 2
4A D D
12
2.3.1.4 Toughness
A measure of the toughness of the material may also be extracted from the stress-strain curve.
The toughness may be defined as the ability to endure occasional stresses above the yield stress
without fracturing [21]. The area under the curve in the stress-strain plot gives a measure of the
amount of work per unit volume that the material may be exposed to without fracturing. For a
ductile material this property may be approximated by the following expression.
0
2
uT f
s sU e
13
Where UT is the toughness, s0 the engineering yield stress, su the engineering tensile stress and
ef the engineering strain at fracture.[21]
2.3.2 Fractography
After performing a tensile test one is often interested in obtaining a better understanding of the
mechanisms behind the fracture. Fractography is the study of the nature of a fracture from the
microscopic investigation of the fracture surface. The examination is most commonly
performed with the use of a scanning electron mictroscope (SEM), due to its impressive depth
of field. The use of SEM for fractography will be presented in section 2.4.
Several fracture modes may be observed through the effect they have on the fracture surface
characteristics. The mechanisms and resulting surface characteristics of cleavage, intergranular
fracture, and dimpled rupture are summarized below.

The Influence of Alloying Elements on the Ductility of Al-Mg-Si Alloys Remøe, M. S.
20
Cleavage fracture is a brittle fracture mode occurring along specific crystallographic
planes. They may be observed as facets generally of the same size as the grain in which
it has propagated. “River markings” are often observed in such fractures, and may be
discovered as plateaus and connecting ledges caused by the crack moving along a
number of parallel planes.
Intergranular fracture may occur at weak grain boundaries with the presence of
impurities such as second phase particles at grain boundaries, grain boundary corrosion,
a wide PFZ etc. The crack moves along the grain boundaries and intergranular fracture
is characterized by a “rock candy” surface appearance.
Ductile rupture creates cup-like pits on the surface, due to the formation of micro-
voids. Its mechanisms will be explained in the following section.[21]
2.3.2.1 Ductile fracture
Ductility may be defined as the extent to which a material may be deformed prior to fracturing
[41]. This property is thus directly affected by factors that influence plastic flow, such as stra in
rate, temperature, particles, grain sizes etc. One usually refers to fracture types as being ductile
or brittle.
Ductile fractures occur at deformations significantly higher than the tensile elongation, the
beginning of neck formation. It usually starts by the nucleation of voids in the center of the
neck where the stress is the largest, and as deformation continues the internal voids grow and
eventually coincide by the necking and rupture of areas between them. This internal fracture
grows until the outer rim fails to support the load, and the edges collapse by sudden shear,
creating the “cup and cone” geometry of the specimens’ fracture surfaces. The voids are usually
nucleated at particles as the interfaces between particle and matrix are weak or the particle itself
is weak or brittle.
Figure 2.9: Illustration of the development of a ductile fracture [21, 42].

The Influence of Alloying Elements on the Ductility of Al-Mg-Si Alloys Remøe, M. S.
21
The more particles in the alloy, the shorter the distance between them, and thus the ease by
which the voids may link up, normally causing a decrease in ductility. Another factor that may
be important is the presence of an alignment of particles in forged materials which may cause
failure along “flow lines”, though this is not assumed to be a significant problem if the loading
occurs in the extrusion or rolling direction.[43]
2.3.2.2 Brittle fracture
Brittle fractures give a different surface texture than the ductile fractures with the presence of
facets as a result of e.g. cleavage or grain boundary fracture.
Cleavage occurs by slip on certain crystallographic planes unique for a given material and
crystal structure. It initiates when the stress exceeds the following limit
2/ cosa c 14
where σa is the applied tensile stress, σc is the critical normal stress across the cleavage plane,
and ϕ is the angle between the tensile axis and the plane normal. However, fracture in
polycrystals may not happen exclusively by cleavage, as the cleavage planes in one grain does
not necessarily link up with one in a neighboring grain. This contributes to explaining the
preference of small grains in the material.
Brittle grain boundaries may be susceptible to fracture as they form easy fracture paths. This
brittleness may be inherent in the material or caused by other factors such as the segregation of
impurities to the grain boundaries or the presence of a thin film of a brittle second phase.[43]
2.4 Scanning electron microscope (SEM)
2.4.1 Backscatter electron imaging (Z-contrast)
When the electron beam hits the sample surface, a number of signals may be detected, such as
secondary electrons, backscattered electrons, x-ray radiation, auger electrons etc. The electron
scattering may be separated into two groups, namely elastic and inelastic scattering. Backscatter
electrons belong to the former, and results from the interaction of incident electrons with atom
cores. The energy loss related to this scattering mode is found to be negligible, thus the name
elastic.
The probability of elastic scattering is proportional to (Z/E)2, where Z is the atomic number of
the scattering atom, and E the energy of the incident atom. The so-called Z-contrast is a
consequence of this relationship, as atoms with a higher atomic number is more likely to scatter,

The Influence of Alloying Elements on the Ductility of Al-Mg-Si Alloys Remøe, M. S.
22
giving a stronger signal in the detector. Due to the higher number of electrons hitting the
detector from an area with a higher atomic number, this area will appear brighter than its
surroundings.[44]
2.4.2 Fractography
The depth of field of the microscope is vital when studying fracture surfaces, and this is the
reason why SEM is the preferred choice. It has a far superior depth of field than e.g. a light
microscope due to a smaller beam divergence, among other important variables. The depth of
field may be defined as the maximum height difference in the sample where the image may be
in focus. The depth of field in SEM is often denoted as D, and as long as the height difference
in the sample is smaller than D the different areas of the sample may be in focus. This height
difference may be calculated through
1
pD dM
15
Where δ is the resolution of the eye, M the magnification, dp the electron optical resolution, and
α the beam divergence.
The depth of field and resolution of the SEM improves on the expense of one another, and one
is forced to compromise. An increase in the working distance improves D as it causes a decrease
in α, but this will in turn worsen the resolution. Another way to increase D is to choose a smaller
aperture, although this may require the use of a higher current. As the resolution (Eq. 16) is
proportional to the square root of the beam current, it will increase, leading to poorer
resolution.[44]
2.4.3 Energy dispersive spectrum (EDS)
EDS makes use of the X-ray radiation emitted when the electron beam penetrates the sample
surface, to quantify the chemical composition of the sample area. X-ray radiation is emitted in
two ways; the retardation of electrons in the electro-static field around the atoms, or from the
ionization of the atoms. The former results in a continuous spectrum regarded as noise, while
the latter yields a characteristic spectrum which provides information about the specific atoms
present.
The energy associated with the emitted x-ray is dependent on both the atomic number and the
electron shell it originates from. As the energy of a photon is inversely proportional to its
wavelength, the relation may be written as

The Influence of Alloying Elements on the Ductility of Al-Mg-Si Alloys Remøe, M. S.
23
/ ( )K Z 16
where λ is the wavelength, and K and σ constants related to the shell the radiation origina tes
from.
To achieve precise results, one must be aware of the actual volume analyzed. The area of the
surface interacting with the electron beam is given by the resolution
0
1id k
E 17
where k is a constant related to the cathode material, i is the beam current, and E0 the energy of
the incident electrons. As a lower atomic number results in a deeper penetration depth of the
incident electrons, Z is part of the expression for the depth from which x-rays may be emitted
from. The penetration depth may be approximated through
3 1.67 0.889
08.3 10 / ( )BSR A E Z [44] 18
where Z is the mean atomic number, A the atomic weight, and ρ the density of the material. [44]
2.5 Transmission electron microscope (TEM)
Equal to the SEM, TEM uses electrons instead of light to form an image. As is indicated in the
name, the electrons are required to pass through the sample, to enable the microscope to yield
results. The ability of an electron to pass through the sample is dependent on its energy, and
thus the acceleration voltage of the microscope (Eq. 18). The resolution is also dependent on
the acceleration voltage, as an increase in its value results in a smaller wavelength of the
electron. In general, the TEM is usually applied in diffraction mode or microscope mode,
although it has other possible functions.
As the electrons pass through the sample, they get scattered by elastic or inelastic processes,
similar to what happens with backscattered electrons and secondary electrons in SEM,
respectively. While using diffraction and microscope mode, the inelastic electrons only
contribute to create background noise in the image, and are therefore not of particular interest
[45]. The TEM is built up of several levels of focusing lenses, and a schematic illustration of
the electron pathway from filament to screen in a conventional TEM is shown in Figure 2.10.

The Influence of Alloying Elements on the Ductility of Al-Mg-Si Alloys Remøe, M. S.
24
Figure 2.10: The pathway of the electron beam through the TEM in a) microscopy mode, and b) diffraction mode [45].
2.5.1 Diffraction and imaging
Due to the systematic way in which the atoms are oriented in the crystal, the scattered electrons
will interfere constructively and destructively in certain directions. In analogy with what
happens to a laser beam scattered by an optical grid, the atomic planes in the crystal lattice
induce constructive and destructive interference on the electron beam in directions where the
path difference is equal to an integer multiplication of the electron’s wavelength. This path
difference amounts to the interplanar distance in the lattice, and the relation may be expressed
mathematically through Bragg’s law:
2 sind n 19
where d is the interplanar distance, θ the incident angle, λ the wavelength and n the order of
diffraction.[45]
In diffraction mode the diffraction pattern is magnified on to a fluorescent screen, and may
reveal important information about e.g. the nature of the material or the orientation of the grain
relative to the incident beam. As illustrated in Figure 2.11, the parallel beams resulting from
diffraction conditions satisfying Braggs’ law, are focused in the focal plane by the objective
lens, thus creating a diffraction pattern.[45]
The Influence of Alloying Elements on the Ductility of Al-Mg-Si Alloys Remøe, M. S.
25
Figure 2.11: An illustration of Braggs' law [45].
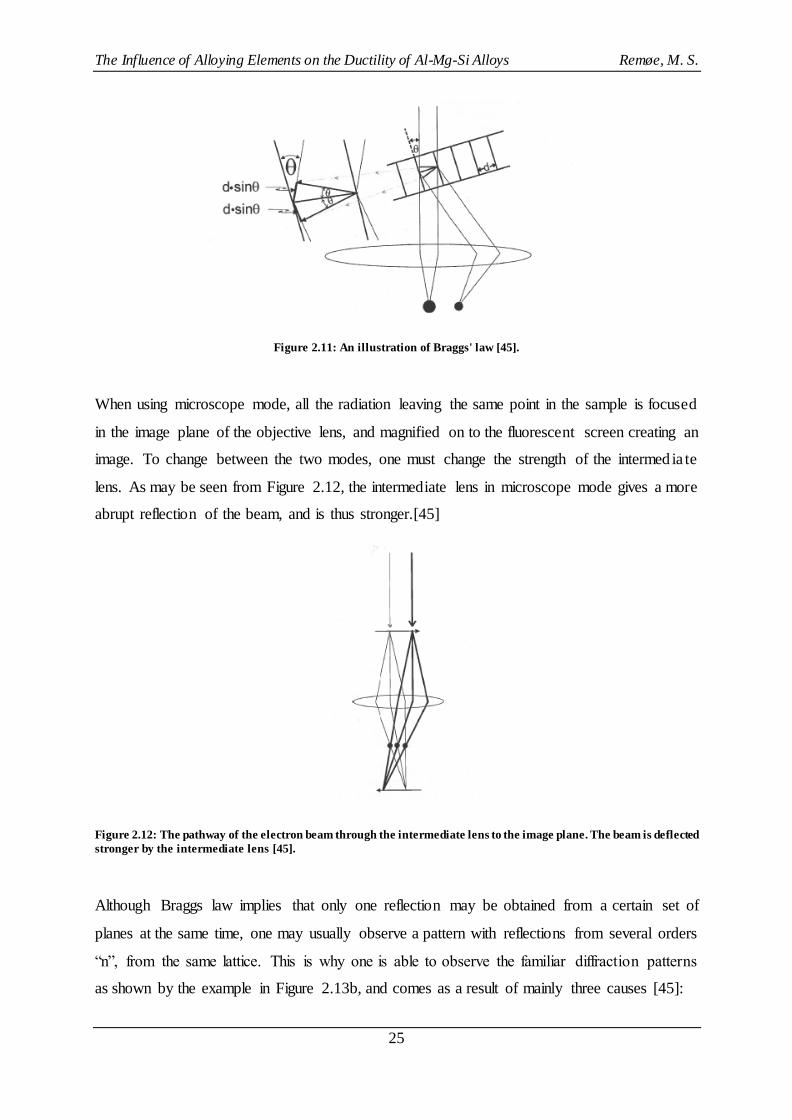
When using microscope mode, all the radiation leaving the same point in the sample is focused
in the image plane of the objective lens, and magnified on to the fluorescent screen creating an
image. To change between the two modes, one must change the strength of the intermed ia te
lens. As may be seen from Figure 2.12, the intermediate lens in microscope mode gives a more
abrupt reflection of the beam, and is thus stronger.[45]
Figure 2.12: The pathway of the electron beam through the intermediate lens to the image plane. The beam is deflected
stronger by the intermediate lens [45].
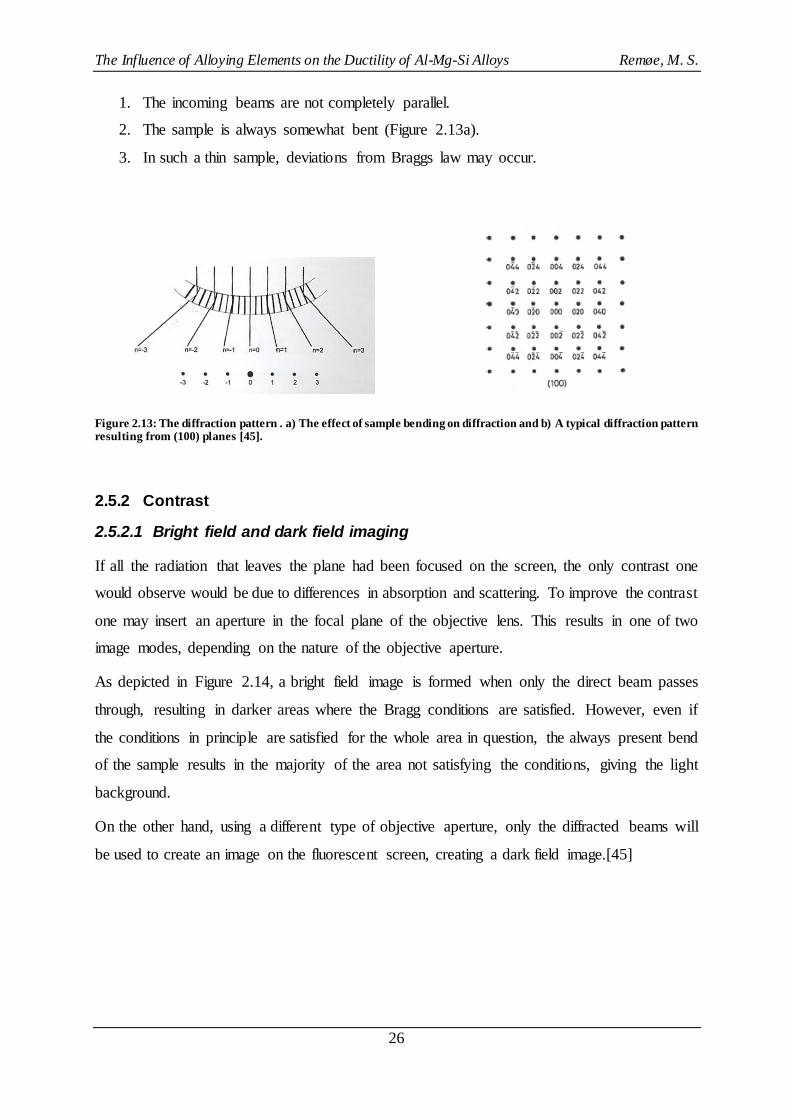
Although Braggs law implies that only one reflection may be obtained from a certain set of
planes at the same time, one may usually observe a pattern with reflections from several orders
“n”, from the same lattice. This is why one is able to observe the familiar diffraction patterns
as shown by the example in Figure 2.13b, and comes as a result of mainly three causes [45]:
The Influence of Alloying Elements on the Ductility of Al-Mg-Si Alloys Remøe, M. S.
26
1. The incoming beams are not completely parallel.
2. The sample is always somewhat bent (Figure 2.13a).
3. In such a thin sample, deviations from Braggs law may occur.
Figure 2.13: The diffraction pattern . a) The effect of sample bending on diffraction and b) A typical diffraction pattern resulting from (100) planes [45].
2.5.2 Contrast
2.5.2.1 Bright field and dark field imaging
If all the radiation that leaves the plane had been focused on the screen, the only contrast one
would observe would be due to differences in absorption and scattering. To improve the contrast
one may insert an aperture in the focal plane of the objective lens. This results in one of two
image modes, depending on the nature of the objective aperture.
As depicted in Figure 2.14, a bright field image is formed when only the direct beam passes
through, resulting in darker areas where the Bragg conditions are satisfied. However, even if
the conditions in principle are satisfied for the whole area in question, the always present bend
of the sample results in the majority of the area not satisfying the conditions, giving the light
background.
On the other hand, using a different type of objective aperture, only the diffracted beams will
be used to create an image on the fluorescent screen, creating a dark field image.[45]

The Influence of Alloying Elements on the Ductility of Al-Mg-Si Alloys Remøe, M. S.
27
Figure 2.14: Image formation in bright field (a) and dark field (b) image mode [45].
2.5.2.2 Contrast from particles
TEM is an excellent instrument for the investigation of smaller particles and precipitates in the
sample, due to the large magnification which may be obtained, and the use of diffraction. There
are mainly two ways to do this, depending on the coherency or incoherency of the particle.
Incoherent particles have a different crystal structure and is oriented differently than the lattice
of its surrounding matrix, and will satisfy different diffraction conditions. In this case, the
contrast may be obtained by tilting the sample until the angle satisfies the diffraction conditions
of the particle. In this way, given the use of bright field, the particle will diffract the electron
beam and be imaged darker than its surrounding matrix.[45]
Figure 2.15: Contrast achievement of particles in bright field (a) and dark field (b) image mode [45].
In age-hardenable alloys such as Al-Mg-Si, the hardening precipitates β’’ are semi-coherent
with the matrix, meaning that the atomic planes of matrix and precipitate have a more or less
continuous transition. This implies that the above mentioned technique may not be applied, as
both matrix and particle will satisfy the same diffraction conditions. However, due to small
differences in planar distances, a stress field is induced around the precipitates, resulting in local

The Influence of Alloying Elements on the Ductility of Al-Mg-Si Alloys Remøe, M. S.
28
reflections. When imaging coherent particles, the contrast is likely to originate from the stress
field around the precipitates, imaged darker than its surroundings. [45]
Figure 2.16: Contrast mechanism for coherent precipitates [45].

The Influence of Alloying Elements on the Ductility of Al-Mg-Si Alloys Remøe, M. S.
29
3 Experimental procedure and setup
3.1 Materials
Four Al-Mg-Si alloys with varying concentrations of silicon, iron, copper, magnesium and
manganese were received as extruded round bars, and formed the basis of this thesis. The three
first alloys in Table 3.1 below, 6181, KFC and 6082, contained a similar amount of Si (~1 wt%)
and Mg (0.65-0.8 wt%), which is reflected by their Mg/Si ratio. KK13 contained only 0.52 wt%
Si, while the Mg-content in turn was higher relative to the other alloys, resulting in an Mg/Si
ratio corresponding to the Mg2Si phase, and with excess Mg relative to the common hardening
phase Mg5Si6 (β").
6181 and 6082 have an almost identical alloying content, except for the introduction of 0.55
wt% Mn in 6082. KFC and KK13 were the only alloys containing Cu, with 0.8 wt% and 0.4
wt% respectively, and where the former had more than twice as high an Fe-content as the other
materials with 0.5 wt%.
Table 3.1: Alloys investigated in this thesis. The Mg/Si ratio of the expected hardening phase is shown in the last column.
Alloy Si Fe Cu Mg Mn Mg/Si Mg5Si6
6181 0.95 0.22 - 0.75 - 0.79
0.83 KFC 1.00 0.50 0.80 0.80 - 0.80
6082 1.00 0.20 - 0.66 0.55 0.66
KK13 0.52 0.21 0.40 1.01 0.55 1.94
3.2 Hardness testing and determination of electrical conductivity
Hardness tests were performed to determine the ageing time necessary to reach peak hardness
in each alloy. Slices of the extrusion bars were cut in Struers’ Discotom-5 with Struers’ 20A25
cut-off wheel and thereafter solution heat treated in a salt bath at 530 oC for 10 minutes, before
being water quenched. After ageing naturally in room temperature for 4 hours, they were placed
in an oil bath at 170 oC, and held for 0 min, 5 min, 20 min, 1 hour, 2.5 hours, 6 hours, 15 hours,
35 hours, and 75 hours, respectively. The samples were immediately water quenched after
artificial ageing. To ensure a satisfactory level surface for testing, the samples were ground
manually in Struers Rotor-Knuth with grinding papers 320P, 500P, 800P and finally 1200P.

The Influence of Alloying Elements on the Ductility of Al-Mg-Si Alloys Remøe, M. S.
30
The hardness tests were conducted in Matsuwa DVK-1S with 1kp load, a holding time of 15 s,
and a loading speed of 100 μm/s. Five indentations were taken per sample, for which the
diamond indentation diameters were measured and converted to Vickers Hardness.
For measurements of the electrical conductivity, the samples from the hardness tests were
reused, except for the 0 min sample, which was solution heat treated again to avoid effects of
an extended natural ageing. The measurements were performed with Foerster Sigmascope
2.069 in a closed room, to minimize air circulation and temperature differences. Prior to testing,
the apparatus was first calibrated with standards having a conductivity of 58.5 MS/m and 4.415
MS/m. The frequency was set to 120 Hz and the probe had a length of 7 mm.
3.3 Tensile tests
Three tensile test specimens were prepared from each alloy, and machined into the dimens ions
illustrated in Figure 3.1, at Finmekanisk Verksted, NTNU. After machining, heat treatment was
performed according to the findings from the hardness tests to induce peak hardness conditions,
T6.
Figure 3.1: The dimensions of the tensile test specimens .
The testing was performed at SINTEF’s laboratory in Perleporten, NTNU. A laser extensometer
was used with the tensile test instrument Instron 100 kN at a nominal strain rate of 1.2 mm/min.
When necking initiated, the lasers were continuously moved around the neck to ensure that the
region with the smallest cross-section was measured. The data from the tensile tests, recieved
in true stress and true strain, was adjusted by Bridgman correction, as explained in 2.3.1 Stress
strain curves.
An additional set of tensile tests were performed to compare the effect of work hardening in
6082 and KK13 as-extruded, with its aged counterparts. First, three parallels of each alloy were
tested in the laser extensometer and compared to the results from the aged specimens. The

The Influence of Alloying Elements on the Ductility of Al-Mg-Si Alloys Remøe, M. S.
31
results indicated that a pre-straining of 8.2% would be beneficial to obtain a desired basis of
comparison between the aged and the as-extruded specimens.
Six new parallels of 6082 and KK13 were machined and pre-strained to 8.2% in MTS-810
100kN at Department of Materials Technology and Engineering, NTNU. Out of these, three
parallels of each alloy were tested directly in Instron 100kN with a laser extensometer after
resting for one week, while the three remaining specimens were aged for a time corresponding
to peak hardness conditions prior to testing. The latter rested for six days before ageing was
initialized, and were tested on day 7.
3.4 Microscopy and sample preparations
3.4.1 Light optical microscopy and microstructure characterization
Slices were cut from the extrusion bars in Struers’ Discotom-5, as for the hardness tests, but
these slices were also cut in half across the center of the cross-section. This was done to obtain
images of the RD-ED plane, corresponding to the radial and extrusion direction respectively,
and displayed in Figure 3.2.
Figure 3.2: Illustration of the microscopy sample geometry and directions.
After solution heat treatment in a salt bath at 530oC, and water quenching, the samples were
cold mounted in Struers Clarocit solution. Thereafter, they were ground in the same manner as
the samples for the hardness tests, but with two additional grinding steps, using Struers’
grinding paper 2000P and 4000P. Polishing with a fabric with diamond spray of grain sizes
down to 6, 3 and 1 µm was executed with Struers’ TegraPol-31, and finally they were anodized
in an HBF4 solution for 90 seconds. The power supply, TTi QL355, was set to 20 V.
After anodizing, the microstructure of the alloys were investigated in Leica MEF4M. To
achieve a satisfactory contrast the polarizer was set to the crossed position and a sub-parallel γ-

The Influence of Alloying Elements on the Ductility of Al-Mg-Si Alloys Remøe, M. S.
32
plate was inserted. The γ-plate was manipulated manually until the desired contrast was
achieved. The images used in this thesis were taken with a magnification of 25X.
3.4.2 Scanning electron microscopy
All the samples prepared for SEM microscopy, except the ones used for fracture surface
inspection, were prepared as for the light optical microscopy samples, bar the anodizing step.
Any additional steps executed for the different analyses will be presented in the following sub-
chapters.
Different investigations and operation modes in SEM require different settings to obtain
optimal results. The settings applied in this thesis are specified in Table 3.2 below.
Table 3.2: The settings used for the different SEM investigations.
Setting Particle analysis Chemical analysis Grain sizes Fractography
Operation mode BSE EDS EBSD SE
Acceleration voltage 15 kV 20 kV 20 kV 20 kV
Working distance 15 mm 12.5 mm ca 23 mm 10-30 mm
Current mode High current High current High current High current
Aperture diameter 60 μm 120 μm 300 μm 30 μm
T ilting angle 0o 0
o 70
o 0
o
3.4.2.1 Primary particle investigation
To investigate the primary particle distribution, samples identical to the ones employed in the
light optical microscope were produced. Except for the anodizing step, the rest of the
preparation was identical to what was performed on the above mentioned samples.
The particle analysis in Zeiss Ultra 55 Limited Edition was conducted using backscatter
electrons to get a Z-contrast which would separate the iron-based particles, with a higher mean
atomic number, from the aluminum matrix. The settings used for the particle analysis are shown
in Table 3.2 above. Three images of each alloy were taken at a magnification of 250X.
The images for the particle analysis required further treatment in an image processing software.
The software used was a freeware called ImageJ, where the images were loaded and processed.
First the images were converted to 8-bit, before they were sharpened using an automatic setting
in the software. The background was then substracted, before the color threshold was adjusted
manually to give as precise a representation of the particle size and distribution as possible. The
last step was done by visually comparing the manipulated image with the original.

The Influence of Alloying Elements on the Ductility of Al-Mg-Si Alloys Remøe, M. S.
33
The resulting data from ImageJ was given further treatment in Excel, to find averages of the
particle distribution and characteristics between the three images of each alloy. To achieve an
intuitive representation of the particle size, the area of each particle was converted to the
Equivalent Circle Diameter (ECD) through the following equation
4
ECD A
20
where A is the area of a given particle [46]. The ECD was also chosen as it would make it easier
to obtain a basis of comparison with the Feret diameter, which was calculated automatically by
the software. The Feret diameter represents the largest distance between two points in the
particle, and by comparing it with the ECD, one would get an idea of the particle shape. An
illustration of the Feret diameter is provided in Figure 3.3.[47]
Figure 3.3: An illustration of the Feret diameter.
3.4.2.2 Chemical analysis (EDS)
For the chemical analysis, an additional polishing step was applied on the samples from the
primary particle investigation. They were chemically polished with an OP-S suspension
solution with an MD Chem polishing plate for 2 minutes, in an attempt to separate them from
the matrix and thus ensure superior signals with less noise from the surroundings. Prior to
inserting them in the SEM, they were placed in plasma cleaner Fishione Instruments’ Model
1020 for 6 minutes to remove contaminations, such as carbon, from the surface.
While operating the SEM, random particles were selected and analyzed in each alloy, using the
settings mentioned in Table 3.2. To obtain a satisfactory signal an aperture of 120 µm was
employed, even though this increases the area, or volume, analyzed.

The Influence of Alloying Elements on the Ductility of Al-Mg-Si Alloys Remøe, M. S.
34
3.4.2.3 Fracture surface characterization
Due to the limited possibilities and necessity to clean the fracture surfaces, the specimens were
merely rinsed in ethanol, before being placed in the plasma cleaner Fishione Instruments’
Model 1020 for 6 minutes prior to SEM investigation.
The small aperture size of 30 µm along with the large working distance of 30 mm were used to
achieve a desired depth of field in the low magnification images. While increasing the
magnification, the working distance was reduced to 10-15 mm to obtain a superior resolution.
3.4.2.4 Grain size detection through EBSD
In addition to the sample preparation scheme mentioned in the introduction to this section,
EBSD samples of aluminum require electro-polishing to attain good diffraction patterns for the
calibration of the indexing process. For 6181 and KFC this was performed in Struers Lectropol-
5, using an A2 electrolyte kept at -25oC. The contents of A2 are shown in Table 3.3 below.
Table 3.3: The composition of electrolyte A2.
Substance Amount
Percloric acid 78 ml
Water 120 ml
Ethanol 700 ml
Butycellosolve 100 ml
EBSD scanning is sensitive to irregularities in the samples surface and thus plasma cleaning in
Fishione Instruments’ Model 1020 was required to ensure adequate precision. As with the
former samples, they were held for 6 minutes each.
3.4.3 Transmission electron microscopy
The name Transmission Electron Microscope suggests that the electron beam is required to
pass, or transmit, through the sample. This implies a certain limitation with respect to the sample
thickness. The maximum sample thickness is commonly defined to be 100 nm, but depends on
the specific material at hand [48].
To obtain the desired thickess, a slice of each alloy was cut as thin as possible with Struers
Accutom-5, using Struers 10S25 cut-off wheel at a speed of 0.04 mm/s. After this, the slice was
attached with double sided tape to a piece of plexiglass, and ground with Struers grinding paper
P120, P500, P1200 and P2000. The sample was turned and reattached to the plexiglass to
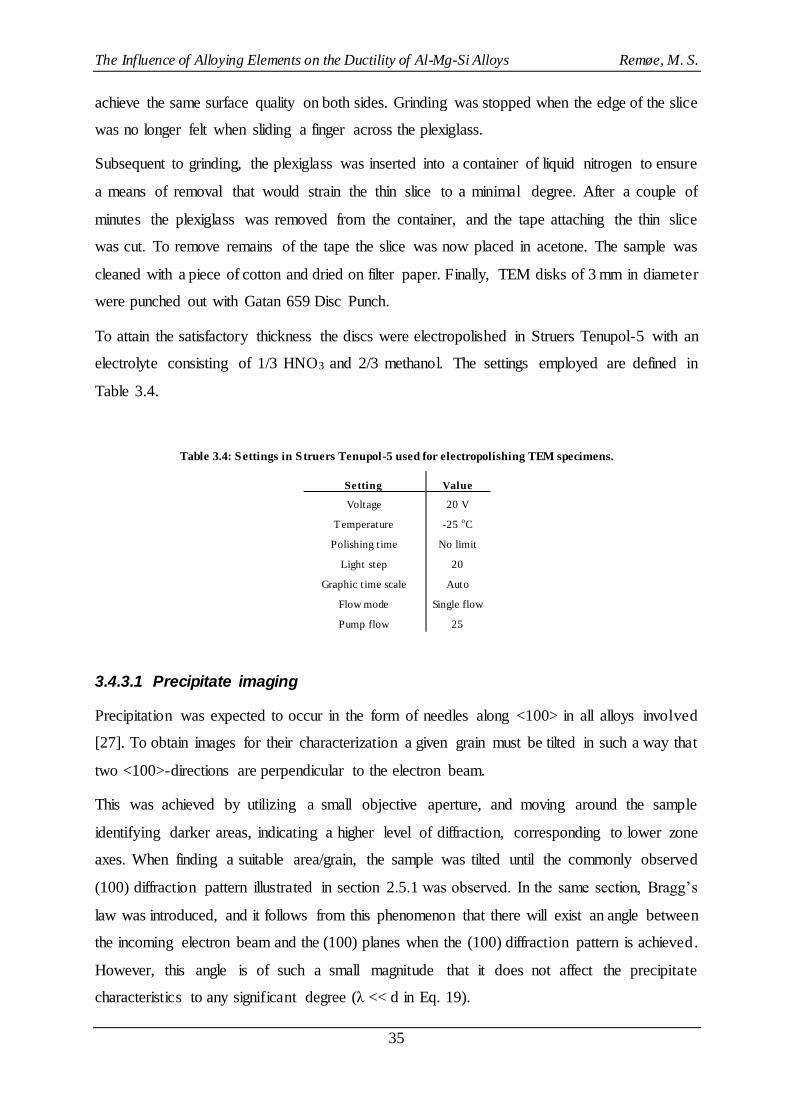
The Influence of Alloying Elements on the Ductility of Al-Mg-Si Alloys Remøe, M. S.
35
achieve the same surface quality on both sides. Grinding was stopped when the edge of the slice
was no longer felt when sliding a finger across the plexiglass.
Subsequent to grinding, the plexiglass was inserted into a container of liquid nitrogen to ensure
a means of removal that would strain the thin slice to a minimal degree. After a couple of
minutes the plexiglass was removed from the container, and the tape attaching the thin slice
was cut. To remove remains of the tape the slice was now placed in acetone. The sample was
cleaned with a piece of cotton and dried on filter paper. Finally, TEM disks of 3 mm in diameter
were punched out with Gatan 659 Disc Punch.
To attain the satisfactory thickness the discs were electropolished in Struers Tenupol-5 with an
electrolyte consisting of 1/3 HNO3 and 2/3 methanol. The settings employed are defined in
Table 3.4.
Table 3.4: Settings in Struers Tenupol-5 used for electropolishing TEM specimens.
Setting Value
Voltage 20 V
Temperature -25 oC
Polishing time No limit
Light step 20
Graphic time scale Auto
Flow mode Single flow
Pump flow 25
3.4.3.1 Precipitate imaging
Precipitation was expected to occur in the form of needles along <100> in all alloys involved
[27]. To obtain images for their characterization a given grain must be tilted in such a way that
two <100>-directions are perpendicular to the electron beam.
This was achieved by utilizing a small objective aperture, and moving around the sample
identifying darker areas, indicating a higher level of diffraction, corresponding to lower zone
axes. When finding a suitable area/grain, the sample was tilted until the commonly observed
(100) diffraction pattern illustrated in section 2.5.1 was observed. In the same section, Bragg’s
law was introduced, and it follows from this phenomenon that there will exist an angle between
the incoming electron beam and the (100) planes when the (100) diffraction pattern is achieved.
However, this angle is of such a small magnitude that it does not affect the precipitate
characteristics to any significant degree (λ << d in Eq. 19).
The Influence of Alloying Elements on the Ductility of Al-Mg-Si Alloys Remøe, M. S.
36
3.4.3.2 Grain boundary and PFZ inspection
To obtain the best possible conditions for observing the grain boundary particles and
precipitation free zone, it was attempted to tilt the specimen until the grain boundary was
parallel with the electron beam. When this was achieved, the grain boundary could be observed
at minimum width, and jagged, according to the existing disorder. Tilting in this way would
also ensure a more reliable characterization of the precipitation free zone.

The Influence of Alloying Elements on the Ductility of Al-Mg-Si Alloys Remøe, M. S.
37
4 Results
4.1 Ageing
To obtain a satisfactory presentation of the ageing behavior, the hardness values were plotted
against the holding times. It was also of interest to get an additional view on the ageing rate,
which was achieved by plotting the electrical conductivity of the same samples, against the
holding times.
4.1.1 Ageing behavior
The ageing curves shown in Figure 4.1 were found to be consistent with each other, although
KFC required 35 hours (2100 min) to reach peak hardness, compared to the 15 hours (900 min)
required for the other three alloys. The two Cu-containing alloys, KFC and KK13, showed a
more rapid ageing behavior in the initial stages, where 6181 and 6082 had only a moderate
increase in hardness until passing 1 hour. After this point, the excess-Si alloys increased more
rapidly than KK13. KFC was the only alloy to stand out in terms of peak hardness value, with
163 ± 2.8 HV1. The other three alloys all peaked in the region 120-135 HV1. The peak hardness
values are displayed in Table 4.1 below. Based on these finding, the ageing times to peak
hardness throughout this thesis were chosen to be 35 hours for KFC, and 15 hours for the three
other alloys.
Figure 4.1: Hardening behavior.

The Influence of Alloying Elements on the Ductility of Al-Mg-Si Alloys Remøe, M. S.
38
Table 4.1: Peak hardness values.
Alloy Vickers hardness [HV1]
6181 133.3 ± 4.1
KFC 163.1 ± 2.8
6082 119.9 ± 1.9
KK13 129.6 ± 2.3
4.1.2 Electrical conductivity evolution
The electrical conductivity of the samples from the hardness tests was measured, and is
illustrated in Figure 4.2. The results obtained from the 0 min samples are assumed to be
unrepresentative, due to contamination of the samples or other possible effects, and their
relatively large value will be ignored in the rest of this thesis.
In terms of electrical conductivity, the alloys are ordered more or less according to their alloying
content. The least alloyed of the materials, 6181, consequently displayed the largest electrica l
conductivity. The three excess-Si alloys exhibited a rapid increase after 1-2.5 hours had passed,
which correlates with the ageing curves. After this point, 6082 increased in almost exactly the
same manner as 6181, while the two Cu-containing alloys had a lower increase in conductivity.
KK13 displayed an almost linear increase during the entire ageing scheme, while the other Cu-
containing alloy (with excess-Si), KFC, increased more rapidly between 1 and 15 hours, and
thereafter developed more or less in parallel with the KK13 graph. Neither KK13 nor KFC
replicated the rapid increase found in the early stages of the ageing curves.
Figure 4.2: The electrical conductivity evolution during ageing.

The Influence of Alloying Elements on the Ductility of Al-Mg-Si Alloys Remøe, M. S.
39
4.2 Tensile tests
The graphs presented in this section are all shown in terms of true stress and strain. After
initiation of necking, the curves have been adjusted with Bridgman correction, but the non-
treated graphs are also plotted (in black), where their point of separation identifies neck
initiation.
4.2.1 Aged specimens
The tensile tests aged to T6, and displayed in Figure 4.3, revealed interesting contrasts to the
ageing curves. While KFC showed the highest peak hardness value, it was KK13 which
displayed the highest tensile strength, with 465 MPa. The Mn-containing alloys seemed to have
a more superior behavior in tension than 6181 and KFC, relative to the hardness tests. While
KK13 performed superior in terms of stress, it also displayed the second best ductility with an
elongation of 64.6% to fracture. 6082 was the weakest of the alloys in the hardness tests, but
performed better in the tensile test compared to 6181, with its tensile strength being 29 MPa
higher. It also displayed the best ductility of all the alloys by far, with an elongation to fracture
of 79.2%.
The 6181 alloy went to fracture at the lowest strain, of 23.1% elongation, and also showed the
lowest tensile strength with 358 MPa. In comparison, KFC displayed a significantly higher
tensile strength than 6181, which was to be expected from the hardness tests, but also a notably
larger strain at fracture with an elongation of 42.9%.

The Influence of Alloying Elements on the Ductility of Al-Mg-Si Alloys Remøe, M. S.
40
Figure 4.3: Stress-strain curves in temper T6, calculated with Bridgman correction. The black curves represent
each alloys non-corrected curve, indicating the initiation of necking in the point in which they separate.
Table 4.2 below quantifies the results from the tensile tests. 6181 yielded at the lowest stress
with 307 MPa, and also had the second highest strain at necking, though the lowest strain at
fracture. As mentioned above, 6082 had the highest strain at fracture, but also the lowest strain
at neck initiation, going to necking with an elongation of 7.4%. Both of the Cu-containing alloys
showed an impressive strength/ductility relationship with tensile strengths of 434 MPa for KFC
and 456 MPa for KK13, and with elongations to fracture of 42.9% and 64.6%, respectively.
Table 4.2: Values extracted from the tensile tests. All values are given in terms of true stress and strain. Peak true stress
is the maximum stress achieved prior to fracture, adjusted with Bridgman correction.
Alloy Yield strength
[MPa] Tensile strength
[MPa] Strain at max. load [mm/mm]
Peak true stress [MPa]
True strain at fracture [mm/mm]
6181 307 358 0.096 372 0.231
KFC 347 434 0.112 473 0.429
6082 353 387 0.074 421 0.792
KK13 376 456 0.095 490 0.646
4.2.2 Aged vs. non-aged specimens
Additional tensile tests were performed on the two Mn-containing alloys 6082 and KK13 to
investigate their behavior without additional heat treatment after extrusion, that is, in temper
T5. The results are shown in Figure 4.4 and suggest that a yield strength, similar to the ones

The Influence of Alloying Elements on the Ductility of Al-Mg-Si Alloys Remøe, M. S.
41
after ageing, could be achieved by straining the tensile samples by 8.2% prior to testing in the
laser extensometer. The observation was based on the similar work hardening exhibited by the
alloys, indicated by their parallel graphs after necking. This implied that straining prior to
tensile testing would merely shift the graphs of the non-heat treated alloys to the left, eventua lly
ending up with a very similar result. With an elongation to necking of 14.7% for non-aged 6082
and 14.8% for non-aged KK13, the ductility was not expected to suffer dramatically compared
to the aged samples, with an expected result of 6.4% in strain at necking for the pre-strained
specimens of both alloys.
Figure 4.4: Stress-strain curves comparing aged (T6) alloys with non-aged (T5).
Table 4.3 below shows the expected poor yield strength of the non-aged alloys at just above
200MPa, compared to 353 MPa and 376 MPa of aged 6082 and KK13, respectively. However,
the tensile strength of 6082 was identical in both states, and also close in value for KK13,
implying a rapid work hardening. The peak true stress was in fact higher for the non-aged 6082,
and closer in value for the aged and non-aged KK13 specimens compared to their gap in tensile
strength.

The Influence of Alloying Elements on the Ductility of Al-Mg-Si Alloys Remøe, M. S.
42
Table 4.3: Important values extracted from the tensile tests of non-aged specimens, compared to T6.
Alloy Yield strength
[MPa] Tensile strength
[MPa] Strain at max. load [mm/mm]
Peak true stress [MPa]
True strain at fracture [mm/mm]
6082 (T6) 353 387 0.074 387 0.792
6082 (T5) 213 386 0.147 440 0.827
KK13 (T6) 376 456 0.095 479 0.646
KK13 (T5) 213 413 0.148 462 0.717
4.2.3 Pre-strained specimens
The stress-strain curves for the pre-strained specimens of 6082 (Figure 4.5) proved to obtain a
quite similar shape as compared to the T6 curves. In fact, the results indicated a stronger work
hardening for the pre-strained specimens as compared to the T6 specimens, which was also
suggested in Figure 4.4. However, it also seems to have resulted in over-ageing of the specimens
which were artificially aged after pre-straining. They displayed a vastly inferior strength, but
had a ductility just slightly superior to the non-aged specimens. In fact, all specimens showed
the same level of ductility regardless of strength.
Figure 4.5: The stress-strain curves of 6082 as pre-strained from T5, pre-strained and aged, and only aged to T6.
Table 4.4 shows the most important material properties extracted from these tensile tests.
Interestingly, the pre-strained sample, subjected to natural ageing for approximately one year,
displays the same tensile strength as the T6 sample at 385-7 MPa, while displaying a superior
elongation to necking at 8.4% compared to 7.4% for T6. However, the yield strength as pre-
strained (338 Mpa) was slightly lower in comparison with T6 (353 Mpa). This was also the case

The Influence of Alloying Elements on the Ductility of Al-Mg-Si Alloys Remøe, M. S.
43
for the specimens which had been aged after pre-straining, showing poorer results for all
properties, except true strain at fracture.
Table 4.4: Pre-strained 6082 specimens. Important values extracted from the tensile tests of 6082 specimens that had been pre-strained from T5, pre-strained from T5 and aged, and aged to T6.
Name Yield strength
[MPa] Tensile strength
[MPa] Strain at max. load [mm/mm]
Peak true stress [MPa]
True strain at fracture [mm/mm]
6082 (pre-strained) 338 385 0.084 430 0.762
6082 (pre+aged) 307 335 0.052 361 0.810
6082 (T6)) 353 387 0.074 421 0.792
The results from the KK13 curves in Figure 4.6 displayed a different behavior for the pre-
strained and pre-strained and aged specimens. The ageing of the pre-strained sample seems to
have had a beneficial effect on strength, showing the same yield strength as the T6 samples, but
a much inferior work hardening with respects to the T6 samples. As for the 6082 specimens,
the pre-strained samples showed a slightly lower yield strength than for T6. The ductility was
similar in all states, with the pre-strained and aged specimens showing a slightly larger
elongation to fracture.
Figure 4.6: The stress-strain curves of KK13 as pre-strained from T5, pre-strained and aged, and only aged to T6.
The results in Table 4.5 further suggests a beneficial effect of ageing after pre-straining with
respects to the strength, although the elongation to necking has been reduced. It is obvious
though, that the T6 sample has better properties on most points, having an elongation to necking
of 2-3% more than for the other two states. Its ductility is somewhat lower at 64.6% elongatio n,

The Influence of Alloying Elements on the Ductility of Al-Mg-Si Alloys Remøe, M. S.
44
but its tensile strength and peak true stress was ~35-40 MPa larger than for the specimens in
the two other states.
Table 4.5: Pre-strained KK13 specimens. Important values extracted from the tensile tests of KK13 specimens that had been pre-strained from T5, pre-strained and aged, and aged to T6.
Name Yield strength
[MPa] Tensile strength
[MPa] Strain at max. load [mm/mm]
Peak true stress [MPa]
True strain at fracture [mm/mm]
KK13 (pre-strained) 359 409 0.077 452 0.670
KK13 (pre+aged) 378 420 0.066 459 0.709
KK13 (T6) 376 456 0.095 490 0.646
4.3 Constituent analysis
The constituents were analyzed in SEM to investigate their spatial distribution, size, shape, and
composition. Electron backscatter imaging was employed to achieve a satisfactory contrast for
the constituent distribution images, while EDS was used to find the chemical composition of
the particles.
4.3.1 Constituent distribution
By visual inspection of the images in Figure 4.7 it seemed evident that 6181 contained the
fewest constituents, while the other three images are more difficult to tell apart. However, all
alloys seemed to contain elongated constituents aligned in the direction of extrusion, which was
to be expected from the nature of the extrusion process. In addition, one could observe that the
particles were not homogenously dispersed, as some areas seemed to contain a higher density
of particles than others.

The Influence of Alloying Elements on the Ductility of Al-Mg-Si Alloys Remøe, M. S.
45
Figure 4.7: SEM images of constituents in 6181 (a), KFC (b), 6082 (c), and KK13 (d), at 500X magnification.
The result of the analysis of the primary particle size distribution in ImageJ is shown in Figure
4.8. 6082 and KK13 contained a larger number of smaller particles than what was the case for
6181 and KFC. Additionally, less coarse particles were found in the KK13 alloy, where the
largest particles had a spherical diameter of 4.5 µm. Constituents with a spherical diameter of
6 µm were observed in 6181 and 6082, while the largest constituents in KFC had a size of 6.5
µm. It must be stressed however, that not all three images of each alloy contained some of the
larger constituents, resulting in the vast standard deviation seen for the feret diameter in Figure
4.8.
The most observed constituents in 6181 and KFC had ECDs between 1 and 1.5 µm, while
constituents between 0.5 and 1 µm were the most common in the Mn-containing alloys. The
feret diameter was, for all alloys, approximately twice as large as their respective ECDs in each
interval, giving evidence of highly elongated particle shapes.

The Influence of Alloying Elements on the Ductility of Al-Mg-Si Alloys Remøe, M. S.
46
Figure 4.8: Particle distribution charts. Grey bars indicate the number of particles in each size interval, while black
dots indicate the corresponding average feret diameter. Note: The analysis was taken from images at 250X to ensure sufficient statistics. These may be found in 0.
From Table 4.6 one can see average values from the analysis. The iron-rich KFC alloy
contained by far the most primary particles with more than twice the amount found in 6181. It
also contained the largest average constituent size at 1.764 ± 0.029 µm. This is not too surprising
seeing that it contained 0.5% Fe compared to around 0.2% Fe in the other three alloys. There
were no significant differences between the other alloys, though it is noticeable how the Si-
depleted KK13 alloy had a lower average constituent size than 6082, while they also covered a
smaller fraction of the total area.
6181 was the alloy with the lowest total alloying content, and had the lowest number of
particles, covering the smallest area. It should be noted however, that its average particle size
was only slightly lower than what was the case for KFC.
Table 4.6: Result from the particle distribution analysis.
6181 KFC 6082 KK13
Number of particles 519 ± 19 1192 ± 25 712 ± 31 849 ± 94
ECD [µm] 1.647 ± 0.060 1.764 ± 0.029 1.593 ± 0.015 1.314 ± 0.060
%Area 0.796 ± 0.083 2.090 ± 0.055 1.019 ± 0.046 0.836 ± 0.161
Feret [µm] 3.325 ± 0.097 3.359 ± 0.036 2.405 ± 0.037 2.074 ± 0.121
4.3.2 Chemical analysis
The results from the EDS analysis may not be taken too literally as the analyzed volume is
likely to reach beyond the particle and bring in signals from the matrix. However, ignoring the
exact concentration of each element, evaluations may be made as to the type of primary particles

The Influence of Alloying Elements on the Ductility of Al-Mg-Si Alloys Remøe, M. S.
47
involved by comparing their relative differences. Comparing the concentration of Mg in the
particles of all alloys in Figure 4.9, with its corresponding point analysis from the matrix,
indicated that Mg was not involved in the composition of any of the constituents. The same
applies for Cu in KFC, which showed more or less similar values in the particles and the matrix.
In KK13 however, Cu seemed to be present in the constituents as its Cu peaks were consistent ly
higher for these, as compared to their corresponding surroundings.
Although the results were somewhat ambiguous, the composition of some of the 6181
constituents seemed to correspond to a β-Al5FeSi phase (particle 2, 3 and 7) and an α-Al12Fe3Si
phase (particle 1, 5 and 8). Taking the case of the β-Al5FeSi phase, and assuming some noise
from the matrix in the particle spot analysis, it makes sense that the Fe content is slightly lower
relative to the Si-content as the matrix contains some Si, but no observed iron. As for the α-
Al12Fe3Si phase, it could also be assumed that the signal has been diluted by additional signal
from the matrix, returning a higher Si signal compared to Fe, than what is actually present in
the particle.
KFC, having a higher Fe content than 6181, seemed to contain a similar amount of the α-
(particle 2,3 and 8) and β-phase (particle 1,5 and 7). The other particles are more difficult to
place, and could correspond to any of the above-mentioned phases, or others.
The constituents in 6082 and KK13 clearly include Mn in addition to Fe and Si for all particles.
As mentioned in section 2.2.2.1, the literature suggests the presence of Al9Mn3Si, Al5FeMnSi,
Al8(FeMn)2Si and α-Al15(FeMn)3Si, for aluminum alloys of the same composition. It is
reasonable to assume that Al9Mn3Si is not the corresponding phase for any of the constituents
analyzed as they all clearly contain Fe. In 6082, if one again assumes a large quantity of the
matrix has been included in the spot analysis of the constituent, Al5FeMnSi, Al8(FeMn)2Si or
α-Al15(FeMn)3Si could be the corresponding phases, but the results did not yield a suffic ient
precision to draw any conclusions. This is also the case for KK13, although here Cu seems to
be involved in all cases, with a significantly higher value than what is the case in the matrix.
The Mn peaks were also lower than the Fe peaks for the constituents in this alloy, which
suggests that other phases may be present.

The Influence of Alloying Elements on the Ductility of Al-Mg-Si Alloys Remøe, M. S.
48
Figure 4.9: Plot of the chemical composition of a selection of constituents. The bars in the figure are pairs, with the two
bars most to the left representing particle 1, its neighboring pair to the right particle 2, and so on. Aluminum balances the particle composition. Images of the particles and their respective composition may be found in 0.
4.4 Grain structure
Light microscope imaging revealed a fibrous microstructure for the two Mn-containing alloys,
while 6181 and KFC were completely recrystallized after extrusion. The grain sizes of the latter
two were estimated to be 67.2 ± 62.7 and 75.9 ± 64.7 µm respectively, with the large standard
deviation indicating a vastly inhomogeneous microstructure. The microstructures are shown in
Figure 4.10 below. 6082 and KK13 contained much smaller (sub-)grains in comparison with
an average of 4.6 ± 5.7 and 4.4 ± 7.1, respectively.

The Influence of Alloying Elements on the Ductility of Al-Mg-Si Alloys Remøe, M. S.
49
Figure 4.10: Light microscope images of the grain structure. 6181 (a) and KFC (b) were fully recrystallized , while the
two Mn-containing alloys 6082 (c) and KK13 (d) display a fibrous microstructure.
4.5 Fracture surface characterization
The fracture surfaces were imaged in SEM, and by visual inspection in Figure 4.11 one can see
a clear correlation between the ductility shown in the stress-strain curves and the decrease in
surface area. In 6181, a decrease in surface area is hardly visible, while for KFC it has become
pronounced. The two fibrous alloys displayed a vastly superior behavior in terms of ductility
than the above mentioned, and thus exhibit an even larger decrease in surface area. An
additional interesting factor is the way these two alloys seem to have been deformed, i.e. in
such a way that a spiral has been formed inside, the more conspicuous case being that of KK13.

The Influence of Alloying Elements on the Ductility of Al-Mg-Si Alloys Remøe, M. S.
50
Figure 4.11: Fracture surface images of 6181 (a), KFC (b), 6082 (c) and KK13 (d).
The decrease in surface area was measured from the SEM images, and compared to the last
diameter registered by the laser extensometer. The former measurements proved to deviate
considerably from the latter, consistently being 10-30% lower. The results are shown in Table
4.7. 6082 and KK13 showed the largest deviation from the fracture diameter registered by the
laser extensometer, indicating that this may be related to the total decrease in diameter.
However, no such correlation was seen while comparing 6181 and KFC.
Table 4.7: Fracture area diameter calculated from SEM images, compared with the fracture diameter registered by the laser extensometer.
dSEM [mm] dlaser [mm] dSEM/dlaser
6181 4.68 5.24 0.89
KFC 4.28 4.74 0.90
6082 2.92 4.07 0.72
KK13 3.55 4.29 0.83
Going higher up in magnification in Figure 4.12, there was a notable difference in dimple
fraction between 6181 and KFC, which was to be expected from the stress-strain curves. The
more ductile Cu-containing KFC alloy had fewer facets, while these were more prominent in

The Influence of Alloying Elements on the Ductility of Al-Mg-Si Alloys Remøe, M. S.
51
the more brittle 6181 alloy. In the case of 6082 and KK13, they both showed a highly ductile
behavior, and the lack of visible facets surely give indications of a purely ductile fracture
mechanism.
Figure 4.12: SEM images of the fracture surfaces at 200X, showing variations in dimple fractions of 6181 (a), KFC (b),
6082 (c) and KK13 (d).
The 6181 alloy showed clear signs of intergranular fracture, as seen in Figure 4.13a, with dimple
formations also present between the faceted “rock candy” formations. KFC displayed the same
behavior, but in addition to this, a surface texture similar to “river lines” was present on some
grain surfaces. These are often found as a result of fracture by cleavage (section 2.3.2.2).

The Influence of Alloying Elements on the Ductility of Al-Mg-Si Alloys Remøe, M. S.
52
Figure 4.13: SEM images of intergranular fracture. a) Intergranular fracture mode with dimples between the facets in
6181 at 500X. b) Intergranular fracture and a formation similar to cleavage mode, with parallel lines along the fracture surface in KFC at 1000X.
Figure 4.14 displays the presence of primary particles inside some of the dimples, and shows
their highly elongated shapes. This was quite easy to observe in the case of 6181 and KFC, due
to their more shallow dimples. In the case of 6082 and KK13 it proved to be more difficult, as
they were often hidden in the deeper dimples.
Figure 4.14: SEM images showing the presence of particles inside the dimples. Note: 6181 (a), 6082 (c) and KK13 (d) were taken at 5 kX, and KFC (b) at 7 kX.
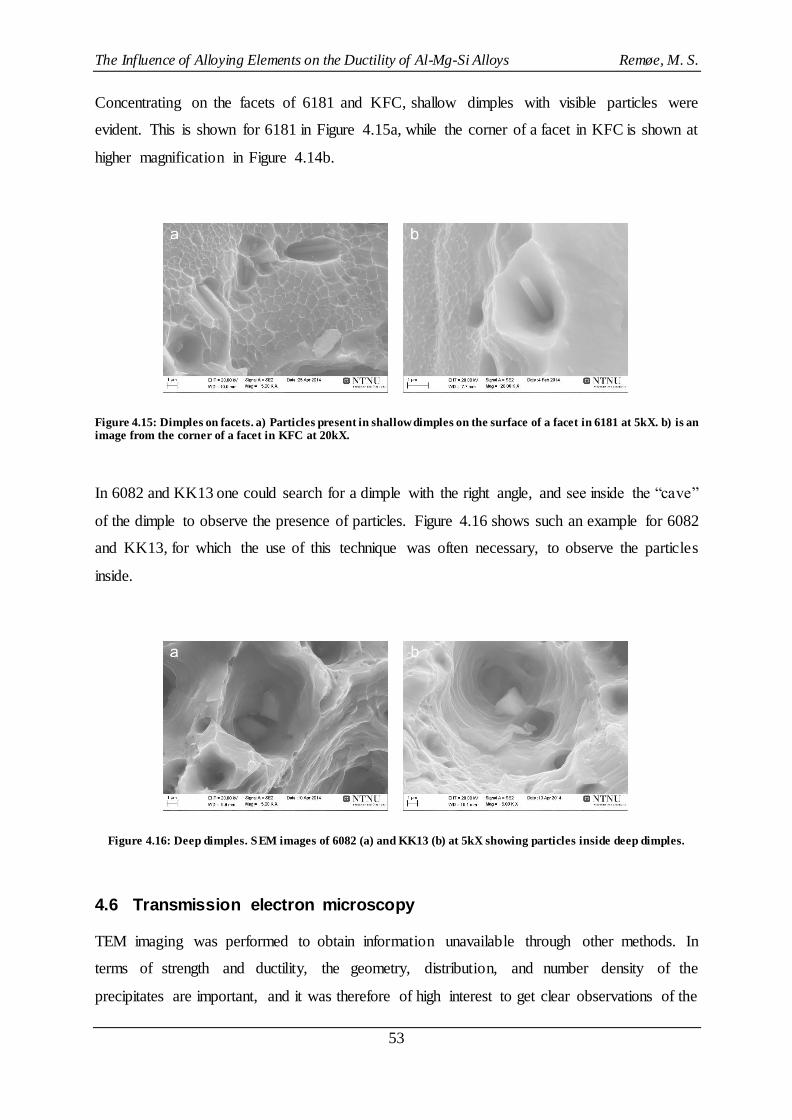
The Influence of Alloying Elements on the Ductility of Al-Mg-Si Alloys Remøe, M. S.
53
Concentrating on the facets of 6181 and KFC, shallow dimples with visible particles were
evident. This is shown for 6181 in Figure 4.15a, while the corner of a facet in KFC is shown at
higher magnification in Figure 4.14b.
Figure 4.15: Dimples on facets. a) Particles present in shallow dimples on the surface of a facet in 6181 at 5kX. b) is an image from the corner of a facet in KFC at 20kX.
In 6082 and KK13 one could search for a dimple with the right angle, and see inside the “cave”
of the dimple to observe the presence of particles. Figure 4.16 shows such an example for 6082
and KK13, for which the use of this technique was often necessary, to observe the particles
inside.
Figure 4.16: Deep dimples. SEM images of 6082 (a) and KK13 (b) at 5kX showing particles inside deep dimples.
4.6 Transmission electron microscopy
TEM imaging was performed to obtain information unavailable through other methods. In
terms of strength and ductility, the geometry, distribution, and number density of the
precipitates are important, and it was therefore of high interest to get clear observations of the

The Influence of Alloying Elements on the Ductility of Al-Mg-Si Alloys Remøe, M. S.
54
differences in these factors. In addition, it was desirable to examine the possible presence of
grain boundary precipitates and of a sub-grain structure, along with dispersoid characterist ics,
and the presence and width of the PFZ. Quantitative measurements were not executed, as the
main target of this investigation was to obtain a qualitative impression of the respective
characteristics. Additional images may be found in Appendix C.
4.6.1 Precipitate distribution, shapes and sizes
The precipitate distribution is displayed in Figure 4.17, and shows clear contrasts in terms of
precipitate geometry and density. The width or thickness of the precipitates seemed to be larger
in 6181 and 6082 compared to the two Cu-containing alloys. Both KFC and KK13 had a thinner
shape, while in KFC the precipitates were more elongated than for the KK13 alloy. The latter
also had a denser particle distribution compared to the other alloys. It may seem as if 6082 had
the lowest precipitate density, while 6181 and KFC were hard to tell apart.
Figure 4.17: The precipitate distributionof 6181 (a), KFC (b), 6082 (c) and KK13 (d), shown at 40kX.
Figure 4.18 demonstrates more clearly the differences in precipitate size and shape. From these
images it seems safe to assume that the precipitates of the non-Cu alloys are thicker compared

The Influence of Alloying Elements on the Ductility of Al-Mg-Si Alloys Remøe, M. S.
55
to KFC and KK13. The two latter are hard to tell apart in terms of thickness, but it seems as if
the precipitates in KK13 are both somewhat thinner and shorter in length.
Another interesting observation from the 100kX images is the shape of the precipitates
orientated along the beam axis, represented as dark spots. For both 6181 and 6082, these have
a more or less circle-shaped cross-section. This type of cross-section is also found in the two
Cu-containing alloys, though in a lesser amount. For these, there is clear a indication of the
presence of a different shape, more precisely a rectangular cross-section, corresponding to lath-
shaped precipitates [26].
Figure 4.18: Precipitate distribution and sizesof 6181 (a), KFC (b), 6082 (c) and KK13 (d), imaged at 100kX.
4.6.2 Grain boundary precipitates
Grain boundary precipitates were found in KFC, 6082 and KK13. It was not successful to
observe these in 6181, though it does not exclude their presence.
The grain boundary precipitates found in KFC, and displayed in Figure 4.19, appeared coarser
than for 6082 and KK13, but for all alloys they were numerous and easily observed. In KK13,

The Influence of Alloying Elements on the Ductility of Al-Mg-Si Alloys Remøe, M. S.
56
they seemed to have a certain directional preference, oriented in more or less the same direction
as the precipitates in the grain on the left hand side in Figure 4.19c. The grain boundary also
seemed to be affected by this, obtaining a jagged shape.
Figure 4.19: Grain boundary precipitates of KFC (a), 6082 (b) and KK13 (c), visualized at 100kX.
4.6.3 Precipitation free zone (PFZ)
The characteristics of the PFZs are shown in Figure 4.20. A rough measurement of the widths
of the PFZs in 6181 and 6082 resulted in 29.5 and 38 nm, respectively, while the PFZ in KK13
was the narrowest, with 21 nm. In the case of KFC it was not successful to obtain a clear view
of the PFZ by any grain boundaries investigated, and is likely to be due to an unsuitable tilting
angle.
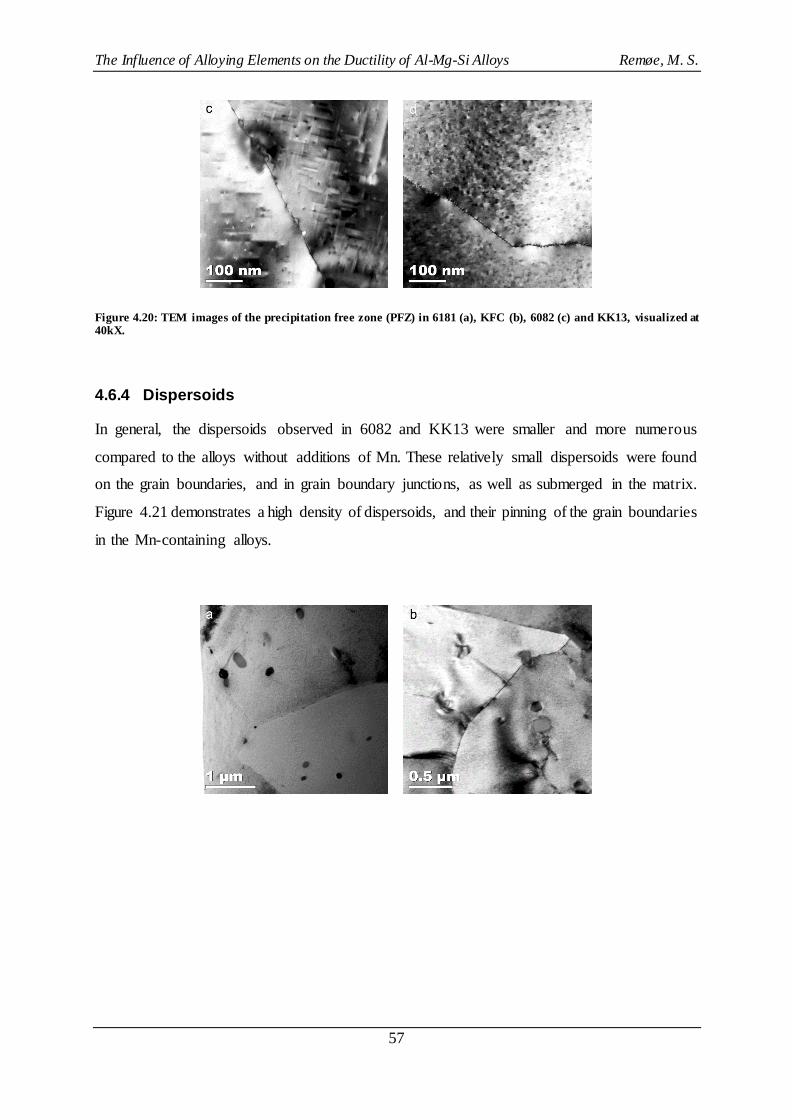
The Influence of Alloying Elements on the Ductility of Al-Mg-Si Alloys Remøe, M. S.
57
Figure 4.20: TEM images of the precipitation free zone (PFZ) in 6181 (a), KFC (b), 6082 (c) and KK13, visualized at 40kX.
4.6.4 Dispersoids
In general, the dispersoids observed in 6082 and KK13 were smaller and more numerous
compared to the alloys without additions of Mn. These relatively small dispersoids were found
on the grain boundaries, and in grain boundary junctions, as well as submerged in the matrix.
Figure 4.21 demonstrates a high density of dispersoids, and their pinning of the grain boundaries
in the Mn-containing alloys.

The Influence of Alloying Elements on the Ductility of Al-Mg-Si Alloys Remøe, M. S.
58
Figure 4.21: TEM images of dispersoids in 6082 at 5kX (a) and 20kX (c), and KK13 at 10kX (b) and 20kX (d).
In the case of 6181 and KFC the amount of small particles or dispersoids observed were fewer
in number, and generally coarser in character. Some of these larger dispersoids were found on
grain boundaries and are displayed in Figure 4.22.
Figure 4.22: TEM images of dispersoids and grain boundary pinning. a) Small dispersoids on a grain boundary in 6181
(20 kX). b) A coarse dispersoid in 6181 (10 kX). c) and d) Dispersoids in KK13 (10 kX and 5 kX, respectively).

The Influence of Alloying Elements on the Ductility of Al-Mg-Si Alloys Remøe, M. S.
59
4.6.5 Sub-grain structure
A sub-grain structure was not found in all the alloys, and it was, as expected, only observed for
the two Mn-containing alloys, 6082 and KK13. These generally displayed a small grain size,
and a high density of low-angle grain boundaries. Low-angle grain boundaries are illustrated in
Figure 4.23c and d, where the diffraction patterns taken at the grain boundary between the two
top grains clearly indicate a small orientation difference. KFC also displayed a similar behavior,
with a larger amount of grains observed, including low-angle grain boundaries, as compared to
the 6181 alloy. However, it was not successful to obtain a clear diffraction pattern at these grain
boundaries. Even so, Figure 4.23a shows the relatively small orientation difference between
two grains in KFC.
Figure 4.23: Images with diffraction patterns revealing the presence of sub-grains in 6082 (b) and KK13 (c), and a low-angle grain boundary in KFC (a). a) A low-angle grain boundary for which the diffraction patterns are taken from the
top right and left grains respectively. In b) and c) the diffraction images are taken from the grain boundaries.

The Influence of Alloying Elements on the Ductility of Al-Mg-Si Alloys Remøe, M. S.
60

The Influence of Alloying Elements on the Ductility of Al-Mg-Si Alloys Remøe, M. S.
61
5 Discussion
5.1 Ageing behavior and electrical conductivity
The ageing curves in Figure 4.1 may be divided in two stages, in relation to what occurred
between 0 min and 1 hour, and the development after 1 hour had passed. A rapid increase in
hardness for the Cu-containing alloys was observed in the initial stages, and is expected to be
due to the formation of a different type and density of atomic clusters and GP-zones [27]. As
mentioned in section 2.2.3.3, Cu has been observed to form needle-shaped and fully coherent
GP-zones in the initial stages of ageing, which may contribute in explaining this behavior.
Excess-Si is also expected to have a catalytic effect on the nucleation of GP-zones, but no
hardening effect from the two excess-Si alloys without Cu (6181 and 6082) was seen until 1
hour had passed. The fact that the Mg-rich KK13 alloy increased in hardness at a much higher
rate than 6181 and 6082 indicates that Cu has a much larger importance in this early stage than
excess-Si. However, the relation is reversed after 1 hour, when the KK13 graph flattens, and
increases very slowly in hardness until peak hardness is reached. In this stage, the excess-Si
alloys display their largest hardening rate, including the Cu-containing excess-Si alloy KFC.
The Mn-containing excess-Si alloy 6082 has a somewhat lower increase than 6181 and KFC
after 1 hour, which could be due to a depletion of Si in the formation of dispersoids. Based on
these observations, a hardening effect due to an addition of excess-Si therefore only seems to
be associated with the later stages of ageing, although the basis may have originated from earlier
ageing times, through the formation of a finer dispersion of atomic clusters and GP-zones [23,
25].
The electrical conductivity of the alloys, in Figure 4.2, shows a certain correspondence to the
ageing curves. The excess-Si alloys 6181, 6082, and KFC display a sharp increase in
conductivity after approximately 1 hour, which coincides with the hardness increase in the
ageing curves. The order in which the curves of these alloys are positioned in relation to one
another in terms of electrical conductivity also corresponds well with their alloying content.
6181 consistently displays the largest conductivity, and is also the least alloyed of the materia ls
involved. KFC contains the same amount of Mg and Si as 6181, but the addition of Fe and Cu
has resulted in a lower conductivity. However, according to Equation 5, Cu does not have a
large effect on this property, and although Fe does, more or less all of the Fe is expected to be
removed from solid solution in the formation of constituents. Although the constituents are not
likely to be coherent, they may still create deformation fields [5], leading to a larger reduction

The Influence of Alloying Elements on the Ductility of Al-Mg-Si Alloys Remøe, M. S.
62
in electron mobility in KFC, although it is uncertain to which degree this applies. Perhaps a
more likely explanation is the possible presence of a different precipitation structure or
coherency of the atomic clusters and GP-zones, as KK13 also has a very low conductivity in
the initial stages.
The 6082 alloy has an addition of 0.55 wt% Mn, and its graph is consequently positioned below
6181. Even if most of the Mn is bound in dispersoids and constituents, a certain amount will
remain in solid solution. The afore-mentioned deformation field caused by particles may
contribute in explaining its lower conductivity as compared to 6181.
5.2 Constituents
5.2.1 Chemical composition
In addition to the uncertainty related to the actual volume analyzed in the EDS analysis, which
was discussed in section 4.3.2, one should keep in mind that a selection of 6-8 particles of an
alloy does not provide a statistically reliable representation of the alloy as a whole. Nonetheless,
it does provide an indication of what may be present, as the constituents were chosen at random.
At least half of the constituents in both 6181 and KFC seemed to be of the β-AlFeSi type, which,
as discussed in section 2.2.2.1, is known to be of negative consequence to the formability and
ductility of 6xxx alloys. Results suggesting the presence of the usually less detrimental α-
Al12Fe3Si could perhaps account for the other half of the constituents, but the signals obtained
were somewhat diffuse and it is difficult to affirm with any certainty. In a study performed by
Kato et.al, an increase in ductility was found for an increasing Fe-content in 6xxx alloys with
excess-Si [22]. It could be suggested that by increasing the Fe content, a larger amount of
smaller α constituents could be formed during casting, on the expense of coarse β-constituents,
due to a difference in diffusivity of Fe and Si, but no such relation was found from the results
in Figure 4.9. The KFC alloy did display a larger ductility than 6181, but this is expected to be
due to changes in the ageing behavior with the addition of Cu. Additionally, in a recent study
executed to confirm the findings of Kato et.al, no positive effect was found increasing the Fe-
content [49].
The compositions of the constituents found in 6082 and KK13 were somewhat ambiguous, and
did not give a sufficient match to constituents suggested by the literature to be found in these
alloys (section 2.2.2.1). With the strong signal from Fe, one could expect a correspondence to
α-Al15(FeMn)3Si or Al8(FeMn)2Si, but the weak signal from Mn suggests the presence of
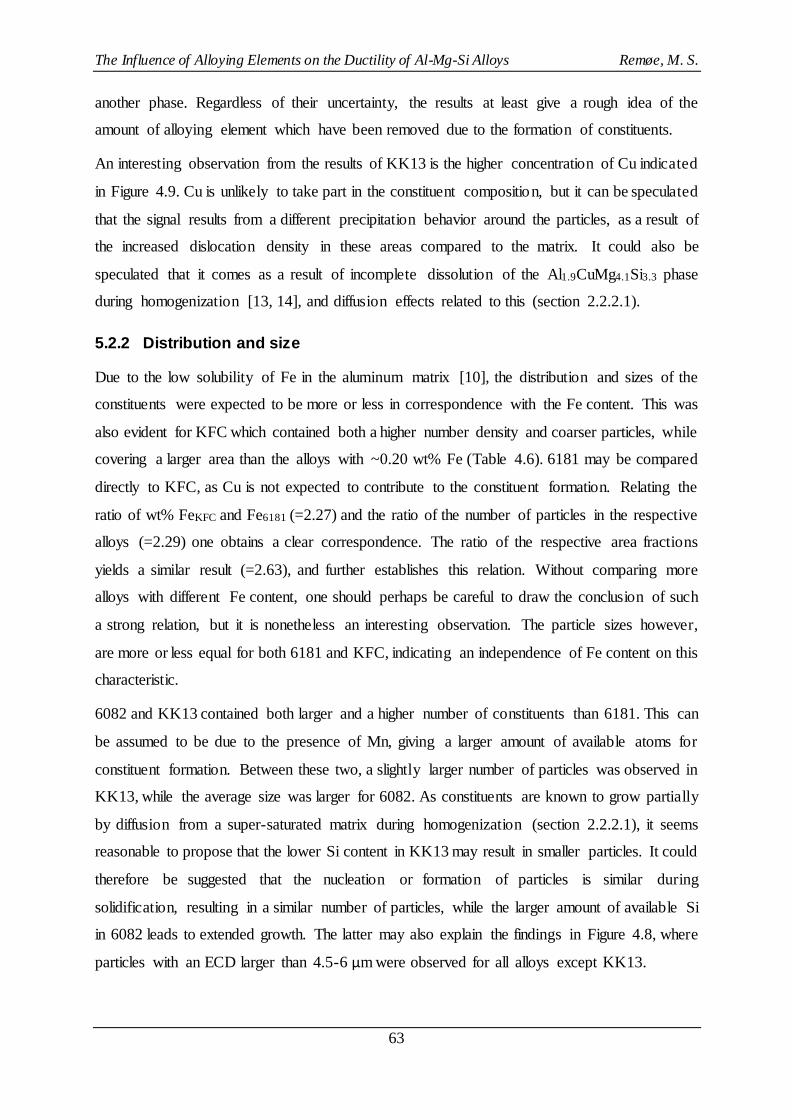
The Influence of Alloying Elements on the Ductility of Al-Mg-Si Alloys Remøe, M. S.
63
another phase. Regardless of their uncertainty, the results at least give a rough idea of the
amount of alloying element which have been removed due to the formation of constituents.
An interesting observation from the results of KK13 is the higher concentration of Cu indicated
in Figure 4.9. Cu is unlikely to take part in the constituent composition, but it can be speculated
that the signal results from a different precipitation behavior around the particles, as a result of
the increased dislocation density in these areas compared to the matrix. It could also be
speculated that it comes as a result of incomplete dissolution of the Al1.9CuMg4.1Si3.3 phase
during homogenization [13, 14], and diffusion effects related to this (section 2.2.2.1).
5.2.2 Distribution and size
Due to the low solubility of Fe in the aluminum matrix [10], the distribution and sizes of the
constituents were expected to be more or less in correspondence with the Fe content. This was
also evident for KFC which contained both a higher number density and coarser particles, while
covering a larger area than the alloys with ~0.20 wt% Fe (Table 4.6). 6181 may be compared
directly to KFC, as Cu is not expected to contribute to the constituent formation. Relating the
ratio of wt% FeKFC and Fe6181 (=2.27) and the ratio of the number of particles in the respective
alloys (=2.29) one obtains a clear correspondence. The ratio of the respective area fractions
yields a similar result (=2.63), and further establishes this relation. Without comparing more
alloys with different Fe content, one should perhaps be careful to draw the conclusion of such
a strong relation, but it is nonetheless an interesting observation. The particle sizes however,
are more or less equal for both 6181 and KFC, indicating an independence of Fe content on this
characteristic.
6082 and KK13 contained both larger and a higher number of constituents than 6181. This can
be assumed to be due to the presence of Mn, giving a larger amount of available atoms for
constituent formation. Between these two, a slightly larger number of particles was observed in
KK13, while the average size was larger for 6082. As constituents are known to grow partially
by diffusion from a super-saturated matrix during homogenization (section 2.2.2.1), it seems
reasonable to propose that the lower Si content in KK13 may result in smaller particles. It could
therefore be suggested that the nucleation or formation of particles is similar during
solidification, resulting in a similar number of particles, while the larger amount of available Si
in 6082 leads to extended growth. The latter may also explain the findings in Figure 4.8, where
particles with an ECD larger than 4.5-6 µm were observed for all alloys except KK13.

The Influence of Alloying Elements on the Ductility of Al-Mg-Si Alloys Remøe, M. S.
64
The way the distribution in Figure 4.8 is shifted slightly towards smaller particles for 6082 and
KK13, as compared to 6181 and KFC, indicates that a slower diffusion of Mn relative to Si
results in a slower growth rate of the constituents, leading to smaller particles.
5.3 Grain structure
The inhomogeneous grain sizes found in the recrystallized alloys in Figure 4.10 would be
expected to result in a more inhomogeneous deformation behavior, leading to a reduction in
ductility. The differences in grain sizes could be due to the non-uniform spatial distribution of
constituents, as indicated by Figure 4.7, assuming the main recrystallization mechanism is PSN.
However, with the latter being the case, smaller grain sizes would be expected in KFC as
compared to 6181. EBSD scans indicated similar grain sizes, with the average grain size of
6181 being slightly lower, which suggests that another recrystallization mechanism also
operates, perhaps by nucleation from transition bands, or due to impurities leading to a
difference in the formation of dispersoids in the two alloys, which may hinder nucleation and
slow down recrystallization kinetics. Dispersoids were found in investigation by TEM (Figure
4.22), and some of these did seem to have had a pinning effect on the grain boundaries.
The grain structure was clearly fibrous in 6082 and KK13, i.e. not recrystallized, resulting from
the addition of Mn, forming dispersoids. TEM images (Figure 4.21) revealed a large amount of
small dispersoids pinning grain boundaries and grain junctions. The presence of these
dispersoids has obviously given a strong resistance against recrystallization, and resulted in the
subgrain-structure illustrated in Figure 4.23, with much smaller average sizes (section 4.4).
5.4 Fractography
5.4.1 Decrease in cross-sectional area after fracture
The difference in cross-sectional area measured before and after fracture, with laser
extensometer and SEM, respectively, showed a larger difference for 6082 and KK13 than for
6181 and KFC. This could suggest a coherence with the grain morphology, as the former
contained vastly elongated grains. However, as 6181 and KFC displayed a far lower ductility
than 6082 and KK13, it is also possible that it comes as an effect of ductility, or total elongation.
Literature does not provide any studies on the reduction in cross-sectional area observed after
fracture, perhaps due to the lesser use or unavailability of laser extensometers in earlier years.
The elastic region of the stress-strain curve could explain a very small increase in cross-
sectional area, but what is observed is a relatively large decrease. A possible theory to explain
The Influence of Alloying Elements on the Ductility of Al-Mg-Si Alloys Remøe, M. S.
65
the behavior arises from the Bridgman analysis [34], which suggests the presence of tri-axia l
stresses in the specimen in tension. It could be imagined that a driving force for contraction is
inherent in the neck during tension, as voids increase in number and size, but that the material
is held back from contracting due to the presence of the larger axial stresses in the tension
direction. As the tensile specimen finally fractures, the axial forces let up, and the necking
region is forced inwards.
5.4.2 Fracture surfaces
The fracture surface images provided in Figure 4.12 revealed a combined effect of intergranular
and ductile fracture mode as the cause for fracture in 6181 and KFC. The dimple fraction
however, was notably smaller for 6181, which made the failure to observe grain boundary
precipitates in this alloy somewhat surprising. The relatively low ductility was expected from
what is known about excess-Si alloys in the literature [25], and one would expect to relate this
to the precipitation of coarse particles at grain boundaries. Whether it comes as an effect of
grain boundary precipitates, or a different deformation behavior of the PFZ remains unknown,
but the larger fraction of intergranular fracture surfaces is assumed to be due to one of the afore-
mentioned theories.
Although more common in brittle materials, KFC showed suggestion of cleavage mode in
addition to ductile and intergranular fracture modes. The image in Figure 4.13 displays a texture
of the fracture surface similar to what is known as “river lines”. There are visible parallel lines
along the surface, which could originate from slip on parallel planes if the critical cleavage
stress had been reached [43]. This was seen for many facet surfaces in KFC, while absent in
6181. The evidence is not sufficient to conclude that cleavage is the source of these lines, but
in the very least it indicates a different fracture/deformation behavior of KFC with respects to
6181.
The completely ductile behavior of 6082 and KK13 clearly suggests that a more homogeneous
deformation has been caused by the presence of a sub-structure due to the addition of Mn.
Additionally, the smaller grain boundary precipitates found in these alloys reduces the risk of
intergranular fracture.
Figure 4.14-16 display visible particles which were found inside the dimples of all alloys. The
deeper dimples in the two Mn-containing alloys is likely to be due to the larger ductility,
resulting in an extended elongation of the dimple/void walls. In 6181 and KFC, the small and
The Influence of Alloying Elements on the Ductility of Al-Mg-Si Alloys Remøe, M. S.
66
shallow dimples found on the fracture surfaces, suggests a void formation has taken place prior
to intergranular fracture.
5.5 Transmission Electron Microscope
5.5.1 Precipitate distribution
If one assumes the precipitates of the same type, size and shape are involved, a larger precipitate
density would result in a larger degree of hindering dislocation movement, and thus increase in
strength. The images in Figure 4.17 indicate a clear difference in precipitate number density,
although it may not be a completely reliable impression due to the thickness factor. A larger
sample thickness would result in a larger amount of visible precipitates as a larger volume is
involved, leading to a false impression. The sample thickness was not measured for these
specimens, and the precipitate density must therefore be evaluated with caution.
From Figure 4.17 it seems that 6082 contains the lowest density of precipitates, while KK13
the highest. As Mn and Fe does not contribute to precipitate formation, their differences must
be an effect of wt% Si, wt% Mg, and wt% Cu. Excess Si is expected to contribute to a finer
distribution of precipitates [23, 25], but it seems evident that Cu has had a larger effect, when
comparing these two alloys. However, this is not clear from KFC, containing both excess-Si
and Cu. Although the image quality is not optimal, there does not seem to be a large difference
in precipitate number density as compared to 6181- The differences seem to be mainly with
respects to the size and shape of the precipitates. This suggests the addition of excess-Si in the
Cu-containing alloys does not have a large effect on the spatial precipitate distribution, while
on the contrary, the large amount of Mg in KK13 seems to have had a positive effect. A possible
reason may be that the precursory phases to Q’ (Al3Cu2Mg9Si7) have a similar stoichiometry,
and that they consequently require higher levels of Mg for their formation, as compared to β’’
(Mg5Si6) [27].
The lower precipitate density suggested for 6082, compared to 6181, seems surprising due to
the similar amount of hardening alloying elements in both alloys. This may however be
explained by the involvement of Si in the formation of dispersoids and constituents, leaving
less Si available for precipitation after casting and homogenization in 6082. On the other hand,
this would also result in a further depletion of Si in KK13, although Table 4.6 indicated a
somewhat lower volume fraction of constituents are present here.

The Influence of Alloying Elements on the Ductility of Al-Mg-Si Alloys Remøe, M. S.
67
5.5.2 Precipitate sizes and shapes
The size and shape factors are also important for the resulting strength, as smaller coherent
precipitates at high densities usually give the most desirable mechanical properties. In Figure
4.18, it is clear that the presence of Cu has resulted in different precipitate sizes and shapes.
KFC and KK13 both seem to contain much thinner precipitates than 6181 and 6082, while KFC
had a larger extension in the <100>-direction of the two Cu-containing alloys. The distinct
needle shaped precipitates observed in KFC were not observed in the other alloys, but may also
have been overlooked in KK13 as small needles are somewhat more difficult to spot. The larger
extension of the precipitates in KFC as compared to KK13, and in 6181 as compared to 6082,
may be due to the larger amount of Cu and/or Si available for their growth. A rectangular cross-
section in some of the precipitates in KFC and KK13, could possibly belong to the L phase,
contributing to additional hardening in these alloys [26, 27].
Needle shaped particles were expected in all alloys, in the form of either β’’ or precursory
phases to Q’. The reason for their absence is unknown, but could be due to various factors, such
as over-ageing or different precipitate types at peak strength.
5.5.3 Grain boundaries
Due to the obvious intergranular fracture facets frequently observed on the 6181 fracture
surface, it was a surprise that no grain boundary precipitates were found in this alloy. Figure
4.20 clearly shows a PFZ in 6181, with more or less the same width as in the other alloys. From
what was presented in section 2.2.3.5, two mechanism may explain the formation of PFZs. The
PFZ in 6181 may have mainly resulted from the formation of grain boundary precipitates, but
they were not found to any significant degree. It may therefore be suggested that the absence
of sufficient vacancies after solid solution heat treatment has given the larger contribution to
the formation of the PFZ for 6181, leading to a supersaturated PFZ instead of one depleted of
alloying elements. However, this alternative seems unlikely to be the cause of intergranular
fracture as the reason for the latter has often been related to the relative ease by which one may
deform a depleted PFZ [33]. A super-saturated matrix would result in more resistance to
deformation, and a larger degree of work-hardening as compared to one that is depleted. The
intergranular fracture mode associated with this alloy is therefore assumed to have come as an
effect of fewer, but coarser grain boundary precipitates, or perhaps coarse dispersoids/partic les
on the grain boundaries.
The Influence of Alloying Elements on the Ductility of Al-Mg-Si Alloys Remøe, M. S.
68
In KFC, relatively large grain boundary precipitates were found, and could be due to the larger
amount of excess-Si available for diffusion to grain boundaries. No satisfactory image of the
PFZ was obtained, but this is likely to be due to coincidences, rather than its complete absence.
In comparison, the KK13 alloy contained far smaller grain boundary precipitates, which were
also partially oriented with the neighboring grain. The small amount of Si available seemed to
be favorable for the avoidance of coarse grain boundary precipitates.
The precipitates found at the grain boundaries in 6082 were less coarse than in KFC, which is
likely to be due to the participation of Si in dispersoid formation.
5.5.4 Dispersoids
Figure 4.22 revealed small particles or dispersoids on the grain boundaries in 6181 and KFC,
some of which were of such a nature that it gives rise to a speculation of the possible presence
of impurities, such as transitions metals like Cr or Mn. If present, they are in such a small
concentration that they have not affected recrystallization to any large degree, but they could
have had an effect on the grain growth. An inhomogeneous distribution of dispersoids and
particles could contribute to explaining the inhomogeneous grain sizes for the recrystallized
alloys. The intentional addition of Mn in 6082 and KK13 has led to the formation of numerous
smaller dispersoids, which have effectively resisted grain boundary movement (Figure 4.21),
resulting in a fibrous structure with small (sub-)grains.
5.6 Tensile tests
5.6.1 Aged specimens
When comparing the ageing curves (Figure 4.1) with the stress-strain curves (Figure 4.3), a
superior performance in terms of strength/hardness is revealed from the Mn-containing alloys
in tension, relative to the hardness tests. Their elongated grain morphology, is suspected to be
one of the reasons for this, as the hardness tests were taken in the RD-RD plane. If taken in the
RD-ED plane, one could perhaps expect their peak hardness values to correlate better with the
strength displayed in the stress-strain curves, relative to 6181 and KFC. These alloys also
displayed the best ductility, which is likely to be attributed to their inherent sub-grain structure
resulting in a more homogeneous deformation distribution. The fact that these alloys also had
smaller constituent sizes and smaller grain boundary precipitates aids in explaining this
behavior.

The Influence of Alloying Elements on the Ductility of Al-Mg-Si Alloys Remøe, M. S.
69
As an excess-Si alloy, 6082 displayed a far better property balance than 6181, which is quite
evidently due to the addition of Mn. The combination of a subgrain structure, smaller and less
harmful particles/dispersoids at grain boundaries, and the lower availability of free Si for the
detoriation grain boundaries is the expected reason for their deviant performance.
It is also apparent that the addition of Cu has improved the balance of mechanical properties in
the respective alloys. The cause for this however, is somewhat less evident. KFC did not display
decisively preferable characteristics in the microscopic analysis to explain its superior ductility
with respect to 6181. The assumption is that the different precipitate size, shape and structure
revealed by TEM imaging, along with the observed differences in grain boundary
characteristics are the decisive factors.
With the above-mentioned, one would not be too surprised to see KK13 displaying by far the
best properties of all the alloys involved, in terms of both strength and ductility. This result
emphasizes the positive effects of a combined addition of Mn and Cu on the mechanica l
properties, although it partially contradicts earlier findings on the significance of excess-Si in
Al-Mg-Si alloys [23, 25]. In any case, the balanced alloy had the best balance of properties in
this study.
Even if precipitates in Cu-containing alloys at peak strength contained a larger amount of Mg
than what is common in conventional Al-Mg-Si alloys, the KK13 alloy seems to contain Mg in
excess relative to the expected hardening phases. It could therefore be suggested that some Mg
remains in solid solution, resulting in a strength contribution. The rapid work hardening at lower
strains suggest this, but the relation may not be confirmed by the investigations performed in
this thesis.
5.6.2 The effect of pre-straining from T5
The tensile specimens which had not received additional heat treatment after extrusion were
labeled with temper T5. The results of the tensile tests from the pre-strained T5 specimens
showed an interesting behavior in 6082. They had only been subjected to natural ageing, and
displayed a larger work hardening than the T6 specimens, resulting in a superior strength
without the loss of ductility. The presence of alloying elements in solid solution is expected to
generate more dislocations than in the T6 alloy, resulting in the different work hardening
observed in the initial stages. Even though these alloys have been naturally aged for
approximately one year after extrusion, the effect of natural ageing is expected to saturate after

The Influence of Alloying Elements on the Ductility of Al-Mg-Si Alloys Remøe, M. S.
70
a few weeks [50]. Pre-straining could therefore be an interesting prospective in the production
of 6082 alloys, as an alternative to artificial ageing, without a loss of strength and ductility.
The same behavior was not observed for KK13, where both the pre-strained T5 specimen, and
its aged parallel, displayed a lower toughness than for T6. A possible explanation could be the
differences in diffusion rates of the elements in the respective alloys, resulting in different type
of atomic clusters and GP-zones during natural ageing. This is partially indicated by the
hardening and electrical conductivity curves, where the precipitation characteristics are highly
different in the two alloys.
The specimens that were aged after pre-straining in T5 all seemed to have over-aged both for
6082 and KK13. As the natural ageing was 1 year, as compared to 4 hours for the T6 alloys,
this is not surprising as they were given the same artificial ageing treatment. It could therefore
be interesting to see the possible effects of lowering the artificial ageing times and/or
temperature, to find peak hardness. The dislocations generated by pre-straining could give a
finer precipitate distribution due to the preferred nucleation of precipitates on dislocation, which
could improve the mechanical properties.
5.7 Suggestions for future work
The results of this thesis has given a basis for considering several additional experiments or
studies. The most interesting prospects are considered to be the following:
It is not certain if the balanced Mg/Si ratio in KK13 is beneficial for the strength and
ductility of the alloy. The results indicate such a correspondence, but as the Cu-
containing alloy with excess-Si, KFC, does not contain Mn it is uncertain if the superior
strength of KK13 is contributed by the balanced Mg/Si ratio. Varying the content of Si,
and holding the other alloying content constant, should yield a better understanding of
this relationship.
The effect of Cu on the ductility of Al-Mg-Si alloys is not revealed from this thesis. The
strengthening effect of Cu is well established, but the mechanisms for an increase are
not quite clear. To observe its effect, similar experiments could be conducted on alloys
with a varying Cu-content, looking at variations in precipitation, grain boundary,
constituent characteristics etc.
The pre-strained tensile test samples which had been artificially aged all seemed to have
over-aged. Ageing curves should be produced after pre-straining to find the holding

The Influence of Alloying Elements on the Ductility of Al-Mg-Si Alloys Remøe, M. S.
71
time to peak hardness, so that new tensile tests may be performed to give an improved
answer to the effect of ageing.
Pre-straining could also be performed on T5 samples which only ages naturally for a
few weeks. This ageing time would give a better answer to the practical benefit of pre-
straining.

The Influence of Alloying Elements on the Ductility of Al-Mg-Si Alloys Remøe, M. S.
72

The Influence of Alloying Elements on the Ductility of Al-Mg-Si Alloys Remøe, M. S.
73
6 Conclusion
Experiments were conducted to attempt to understand the effects of different alloying content on
the ductility of Al-Mg-Si alloys. Mechanical testing along with examinations of grain, constituent,
precipitatation and fracture characteristics was performed on four alloys with different
concentrations of Si, Mg, Fe, Mn and Cu. On the basis of these results the following conclusions
may be drawn:
The Cu-containing alloys increased rapidly in hardness during the first hour of ageing. After
this point, the excess-Si alloys displayed the most rapid increae in hardness.
A clear correspondence between Fe-content and constituent number density and area
fraction was found. However, no difference in average constituent size was observed with
dissimilar Fe-content.
The presence of excess-Si, without additional alloying elements, resulted in a significa nt
reduction in ductility, leading to the observation of intergranular fracture. The introduct ion
of Fe and Cu improved this behavior, possibly due to the formation of secondary phases
with Fe and Si, leaving less free Si available for detoriation of grain boundaries.
Mn had the largest positive effect on ductility, which was related to a resistance to
recrystallization and grain growth, induced by Mn-containing dispersoids, resulting in a fine
subgrain structure. The introduction of Mn also reduced the average constituent sizes by
formation of different constituents and dispersoids. The latter is assumed to have resulted
in smaller and less damaging micro-voids.
The introduction of Cu gave a significant increase in strength, without a serious reduction
in ductility. This confirms previous studies, and is likely to be due to a change in
precipitation behavior. Lath shaped precipitates were observed, which could correspond to
the hardening L-phase previously observed in Al-Mg-Si-Cu alloys. A finer precipitat ion
size and distribution was also observed for these alloys.
Adding Mn and Cu to a balanced alloy gave the best combined properties in terms of
strength and ductility. The combination of a fine subgrain structure, precipitation size and
distribution, and smaller secondary phases is considered to be the likely cause.

The Influence of Alloying Elements on the Ductility of Al-Mg-Si Alloys Remøe, M. S.
74

The Influence of Alloying Elements on the Ductility of Al-Mg-Si Alloys Remøe, M. S.
75
7 References
1. Ø. Breivik, K.W. Mener aluminium er framtidens offshore-metall. 2013 03.12.13; Available from: http://www.hydro.com/no/Hydro-i-Norge/Pressesenter/Nyheter/2013/Mener-aluminium-er-framtidens-offshore-metall/.
2. Polmear, I.J., Light Alloys: From Traditional Alloys to Nanocrystals. 4 ed. 2006: Elsevier.
3. Solberg, J.K., Teknologiske metaller og legeringer, NTNU, Editor. 2010.
4. Graeve, I. and J. Hirsch. 6xxx Series Alloys. 04.06.14; Available from: http://aluminium.matter.org.uk/content/html/eng/default.asp?catid=214&pageid=2144417085.
5. Verlinden, B., Thermo-Mechanical Processing of Metallic Materials. Pergamon Materials Series, ed. R.W. Cahn. 2007: Pergamon.
6. Reiso, O., Extrusion of AlMgSi Alloys. Materials Forum, 2004. 28: p. 32-46.
7. Lorimer, F.J.H.G.W., Thermomechanical Processing of Aluminum Alloys, in Light Metals and Composites, R. Ciach, Editor. 1998, Nato Science Partnership Subseries. p. 343-353.
8. Snilsberg, K.E., Anisotropi i bøyeegenskaper hos utherdbare ekstruderte aluminiumslegeringer. 2008, Norwegian University of Science and Technology.
9. Graeve, I. and J. Hirsch. Tempers Overview. 02.06.14; Available from: http://aluminium.matter.org.uk/content/html/eng/default.asp?catid=214&pageid=2144417057.
10. G. Sha, e.a., Characterization of Fe-rich Intermetallic Phases in a 6xxx Series Al Alloy. Materials Science Forum, 2006. 519-521: p. 1721.
11. Murat, S. and T.T.l. James, Physical Metallurgy and the Effect of Alloying Additions in Aluminum Alloys, in Handbook of Aluminum. 2003, CRC Press.
12. G. Mrówka-Nowotnik, J.S., M. Wierzbiñska, Intermetallic phase particles in 6082 aluminum alloy. Archives of Aluminum Science and Engineering, 2007. 28(2): p. 69-76.
13. H. Liu, e.a., Effects of Mn on constituents of Al-Mg-Si-Cu alloys. The Chinese Journal of Non-Ferrous Metals, 2004. 14(11): p. 1906-1911.
14. Liu, H., et al., Effects of magnesium content on phase constituents of Al-Mg-Si-Cu alloys. Transactions of Nonferrous Metals Society of China, 2006. 16(2): p. 376-381.
15. Humphreys, F.J. and M. Hatherly, Recrystallization and related annealing phenomena. 1995: Elsevier.
16. McQueen, Hot Deformation and Processing of Aluminum Alloys. 2011: Taylor and Francis Group.
17. K. Strobel, e.a., Dispersoid Phases In 6xxx Aluminum Alloys. Materials Science Forum, 2010. 654-656: p. 926-929.
18. K. Matsuda, e.a., Effects of Cu and Transition Metals on the Precipitation Behaviors of Metastable Phases in Al-Mg-Si. Materials Transactions, 2002. 43(11): p. 2789-2795.
19. Zhang, J., Equilibrium pseudobinary Al–Mg2Si phase diagram. Materials Science and Technology, 2001. 17(5): p. 494-496.
20. Edwards, G.A., et al., The precipitation sequence in Al–Mg–Si alloys. Acta Materialia, 1998. 46(11): p. 3893-3904.
21. Dieter, G.E., Mechanical Metallurgy. 1988: McGraw-Hill.

The Influence of Alloying Elements on the Ductility of Al-Mg-Si Alloys Remøe, M. S.
76
22. Kato, Y., et al., Effect of Alloy Elements on Microstructure and Mechanical Properties of Al-Mg-Si Alloys. 13th International Conference on Aluminum Alloys, 2012.
23. A.K. Gupta, D.J.L., S.A. Court, Precipitation hardening in Al-Mg-Si alloys with and without excess Si. Materials Science and Engineering A, 2001. 336: p. 11-17.
24. Lynch, J.P., L.M. Brown, and M.H. Jacobs, Microanalysis of age-hardening precipitates in aluminium alloys. Acta Metallurgica, 1982. 30(7): p. 1389-1395.
25. J. Aucote, D.W.E., Effects of excess silicon addition on ductility of Al-0.95%Mg2Si Alloy. Materials Science and Technology, 1978. 12(2): p. 57-63.
26. Chakrabarti, D., Y. Peng, and D.E. Laughlin. Precipitation in Al-Mg-Si alloys with Cu additions and the role of the Q'and related phases. in Materials Science Forum. 2002. Transtec Publications; 1999.
27. Marioara, C., et al., The effect of Cu on precipitation in Al–Mg–Si alloys. Philosophical Magazine, 2007. 87(23): p. 3385-3413.
28. Matsuda, K., et al., Precipitation sequence of various kinds of metastable phases in Al-1.0mass% Mg2Si-0.4mass% Si alloy. Journal of Materials Science, 2000. 35(1): p. 179-189.
29. Altenpohl, D., Aluminium und Aluminiumlegierungen. 1965, Berlin: Springer-Verlag. XIX, 899 s. : ill.
30. Tangen, S., Deformation and annealing behavior of commercial non-heat treatable aluminium alloys: an experimental investigation. Vol. 2004:123. 2004, Trondheim: Norges teknisk-naturvitenskapelige universitet. X, 266 s. : ill.
31. Abe, M., K. Asano, and A. Fujiwara, Influence of the precipitate-free zone width on the tensile properties of an Al-6 Wt pct Zn-1.2 Wt pct Mg alloy. Metallurgical Transactions, 1973. 4(6): p. 1499-1505.
32. Kuramoto, S., G. Itoh, and M. Kanno, Intergranular fracture in some precipitation-hardened aluminum alloys at low temperatures. Metallurgical and Materials Transactions A, 1996. 27(10): p. 3081-3088.
33. Ogura T., H.A., Sato T., Effect of PFZ and Grain Boundary Precipitate On Mechanical Properties and Fracture Morphologies in Al-Zn-Mg(Ag) Alloys. Materials Science Forum, 2010. 638-642: p. 297-302.
34. Bridgman, P.W., Studies in large plastic flow and fracture with special smphasis on the effects of hydrostatic pressure. Metallurgy and metallurgical engineering series. 1952: McGraw. 362p.illus.,bibl.
35. Chuong J. M., C.S.R., Study on true stress correction from tensile tests. Materials Science and Technology, 2008. 22: p. 1039-1051.
36. G. Le Roy., J.D.E., G. Edward, M. F. Ashby, A Model of Ductile Fracture Based on the Nucleation and Growth of Voids. Acta Metallurgica, 1981. 29: p. 1509-1522.
37. T. Hirose, H.T., M. Ando, T. Suzuki, A. Kohyama, Y. Katoh, M. Narui, Evaluation of Fatigue Properties with Miniature Hourglass Specimen. Small Specimen Test Techniques, 2002. 4.
38. Ling, Y., Uniaxial True Stress-Strain after Necking. AMP Journal of Technology, 1996. 5: p. 37-48.
39. Gilat, A., T.E. Schmidt, and A.L. Walker, Full Field Strain Measurement in Compression and Tensile Split Hopkinson Bar Experiments. Experimental Mechanics, 2009. 49(2): p. 291-302.
40. G. Owolabi, D.O., A. Peterson, A. Odeshi, H. Whitworth, Measurement of the Deformation of Aluminum Alloys under High Strain Rates Using High Speed Digital Cameras. World Journal of Mechanics, 2013. 3: p. 112-121.

The Influence of Alloying Elements on the Ductility of Al-Mg-Si Alloys Remøe, M. S.
77
41. Askeland, D.R., The Science and Engineering of Materials. 2008: Cengage Learning.
42. Illustration of a ductile fracture. 10.06.14; Available from: http://www.weck.ca/figs/NucleationGrowthCoalescence.jpg.
43. Hosford, W.F., Mechanical behavior of materials. 2010: Cambridge University Press.
44. Hjelen, J., Scanning elektron-mikroskopi. 1989: Metallurgisk institutt, NTH.
45. J. K. Solberg, V.H., Innføring i transmisjon elektronmikroskopi, N. Department of Materials Science and Engineering, Editor. 2007.
46. Feature-Specific Measurements, in The Image Processing Handbook, Fifth Edition, J.C. Russ, Editor. 2006, CRC Press. p. 544-597.
47. T. Ferreira, W.R., ImageJ User Guide IJ 1.46r. 2012.
48. Williams, D. and C.B. Carter, The Transmission Electron Microscope, in Transmission Electron Microscopy. 1996, Springer US. p. 3-17.
49. Remøe, M.S., The Influence of Fe on the Strength and Ductility of 6xxx Al-Mg-Si Alloys. 2013, NTNU.
50. Cuniberti, A., et al., Influence of natural aging on the precipitation hardening of an AlMgSi alloy. Materials Science and Engineering: A, 2010. 527(20): p. 5307-5311.

The Influence of Alloying Elements on the Ductility of Al-Mg-Si Alloys Remøe, M. S.
78
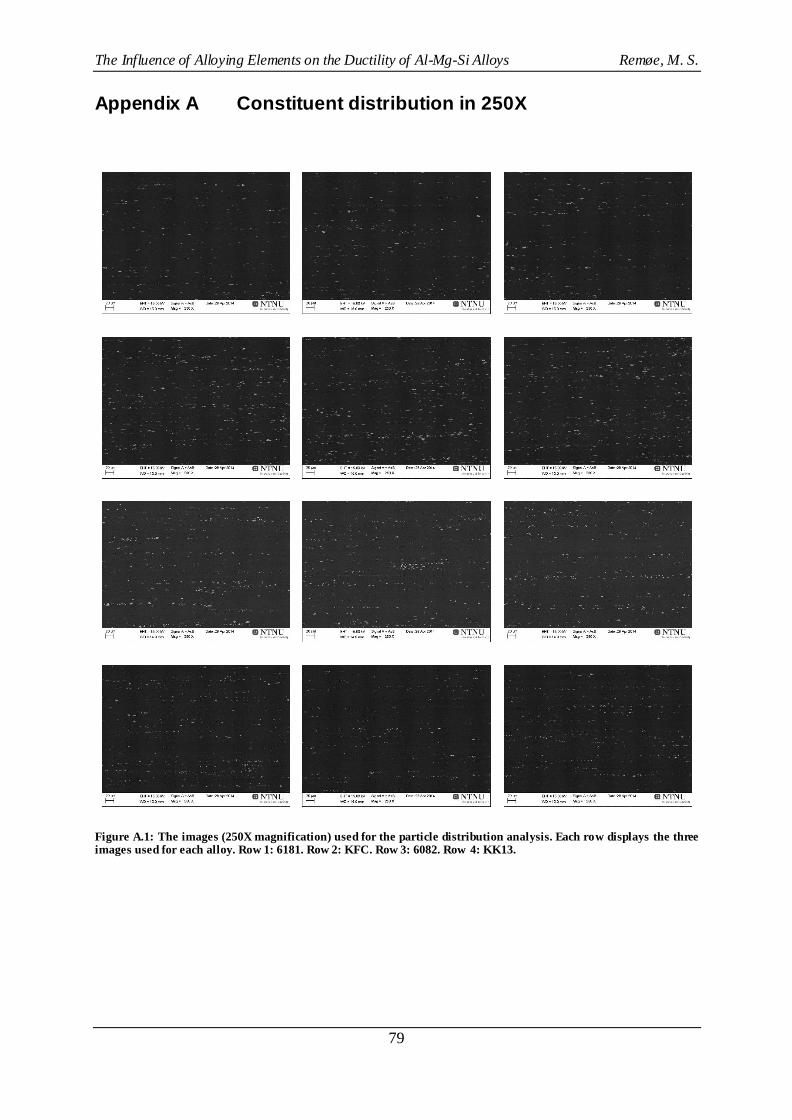
The Influence of Alloying Elements on the Ductility of Al-Mg-Si Alloys Remøe, M. S.
79
Appendix A Constituent distribution in 250X
Figure A.1: The images (250X magnification) used for the particle distribution analysis. Each row displays the three images used for each alloy. Row 1: 6181. Row 2: KFC. Row 3: 6082. Row 4: KK13.

The Influence of Alloying Elements on the Ductility of Al-Mg-Si Alloys Remøe, M. S.
80

The Influence of Alloying Elements on the Ductility of Al-Mg-Si Alloys Remøe, M. S.
81
Appendix B EDS analysis
1.
Element Mg Al Si Fe
Particle 1.25 85.95 4.86 7.94
Matrix 1.50 97.64 0.84 0.01
5.
Element Mg Al Si Fe
Particle 1.41 87.42 6.18 4.99
Matrix 1.53 97.67 0.80 0.00
2.
Element Mg Al Si Fe
Particle 1.57 78.16 11.01 9.26
Matrix 1.47 97.58 0.85 0.10
6.
Element Mg Al Si Fe
Particle 1.60 83.71 7.06 7.63
Matrix 1.53 97.65 0.81 0.01
3.
Element Mg Al Si Fe
Particle 1.14 75.89 11.93 11.03
Matrix 1.52 97.66 0.81 0.01
7.
Element Mg Al Si Fe
Particle 1.71 82.87 8.95 6.46
Matrix 1.53 97.65 0.81 0.00
4.
Element Mg Al Si Fe
Particle 1.34 84.39 7.01 7.26
Matrix 1.52 97.67 0.80 0.01
8.
Element Mg Al Si Fe
Particle 2.34 81.87 6.86 8.93
Matrix 1.55 97.64 0.81 0.01
Figure B.1: EDS analysis of constituents in 6181.

The Influence of Alloying Elements on the Ductility of Al-Mg-Si Alloys Remøe, M. S.
82
1.
Element Mg Al Si Fe Cu
Particle 1.22 83.72 7.96 6.60 0.50
Matrix 1.63 97.37 0.77 0.01 0.22
5.
Element Mg Al Si Fe Cu
Particle 1.39 86.64 6.47 5.11 0.39
Matrix 1.55 97.44 0.67 0.02 0.31
2.
Element Mg Al Si Fe Cu
Particle 1.52 83.40 6.86 7.84 0.38
Matrix 1.59 97.37 0.71 0.02 0.31
6.
Element Mg Al Si Fe Cu
Particle 1.49 82.84 7.98 7.14 0.54
Matrix 1.55 97.43 0.70 0.01 0.30
3.
Element Mg Al Si Fe Cu
Particle 1.29 77.98 9.31 10.71 0.71
Matrix 1.56 97.42 0.69 0.02 0.31
7.
Element Mg Al Si Fe Cu
Particle 1.40 84.38 6.85 6.81 0.55
Matrix 1.56 97.42 0.70 0.01 0.31
4.
Element Mg Al Si Fe Cu
Particle 1.29 81.01 8.42 8.77 0.52
Matrix 1.57 97.41 0.70 0.01 0.31
8.
Element Mg Al Si Fe Cu
Particle 1.43 83.96 6.67 7.55 0.38
Matrix 1.57 97.43 0.69 0.01 0.30
Figure B.2: EDS analysis of constituents in KFC.

The Influence of Alloying Elements on the Ductility of Al-Mg-Si Alloys Remøe, M. S.
83
1.
Element Mg Al Si Mn Fe
Particle 1.41 84.20 5.25 4.69 4.45
Matrix 1.48 97.51 0.82 0.15 0.03
4.
Element Mg Al Si Mn Fe
Particle 1.45 88.93 4.03 3.37 2.22
Matrix 1.50 97.62 0.80 0.07 0.02
2. No image
Element Mg Al Si Mn Fe
Particle 1.41 83.12 5.53 4.16 5.77
Matrix 1.42 96.41 0.98 0.71 0.48
5.
Element Mg Al Si Mn Fe
Particle 1.14 82.06 5.66 4.94 6.20
Matrix 1.50 97.56 0.78 0.12 0.04
3.
Element Mg Al Si Mn Fe
Particle 1.11 81.06 6.06 5.88 5.88
Matrix 1.50 97.61 0.80 0.07 0.02
6.
Element Mg Al Si Mn Fe
Particle 1.20 83.90 5.08 4.74 5.07
Matrix 1.50 97.41 0.84 0.19 0.05
Figure B.3: EDS analysis of constituents in 6082.

The Influence of Alloying Elements on the Ductility of Al-Mg-Si Alloys Remøe, M. S.
84
1.
Element Mg Al Si Mn Fe Cu
Particle 1.76 86.75 3.93 2.67 4.33 0.56
Matrix 1.90 97.25 4.10 0.00 0.17 #N/A
5.
Element Mg Al Si Mn Fe Cu
Particle 1.74 85.04 4.11 3.12 5.35 0.64
Matrix 1.91 97.14 0.53 0.22 0.03 0.18
2.
Element Mg Al 0.00 Mn Fe Cu
Particle 1.71 85.11 0.00 3.34 5.14 0.60
Matrix 1.89 97.29 0.50 0.16 0.02 0.15
6.
Element Mg Al Si Mn Fe Cu
Particle 1.67 85.14 3.98 3.49 5.13 0.58
Matrix 1.84 97.45 0.46 0.09 0.02 0.14
3.
Element Mg Al Si Mn Fe Cu
Particle 1.68 83.79 4.59 4.14 5.17 0.63
Matrix 1.90 97.22 0.52 0.18 0.03 0.17
7.
Element Mg Al Si Mn Fe Cu
Particle 1.61 83.17 4.38 3.73 6.42 0.69
Matrix 1.91 97.20 0.51 0.19 0.02 0.17
4.
Element Mg Al Si Mn Fe Cu
Particle 1.69 85.28 4.00 3.16 5.24 0.63
Matrix 1.90 97.22 0.52 0.18 0.02 0.16
8.
Element Mg Al Si Mn Fe Cu
Particle 1.45 81.64 5.50 4.04 6.67 0.70
Matrix 1.90 97.24 0.52 0.15 0.03 0.17
Figure B.4: EDS analysis of constituents in KK13.

The Influence of Alloying Elements on the Ductility of Al-Mg-Si Alloys Remøe, M. S.
85
Appendix C Additional TEM images
Figure C.1: Grain boundary in KK13 at 40 kX magnification.
Figure C.2: Moirée fringes in KK13. The red lines (same angle) illustrates the small orientation difference between the grains.

The Influence of Alloying Elements on the Ductility of Al-Mg-Si Alloys Remøe, M. S.
86
Figure C.3: Precipitates in 6082 at 30kX
Figure C.4: Dispersoid on a grain boundary in 6181 at 20 kX magnification.

The Influence of Alloying Elements on the Ductility of Al-Mg-Si Alloys Remøe, M. S.
87
Figure C.5: Dispersoid in 6181 at 10 kX magnification.
Figure C.6: Dispersoid in KFC at 40 kX magnification.

The Influence of Alloying Elements on the Ductility of Al-Mg-Si Alloys Remøe, M. S.
88
Figure C.7: Precipitates in KFC at 80kX magnification.