the economics of addressing behavioral health issues...
TRANSCRIPT
11
The Economics of The Economics of Addressing Behavioral Addressing Behavioral
Health Issues in the Health Issues in the WorkplaceWorkplace
Karen E. Philbrick, Ph.D.Karen E. Philbrick, Ph.D.University of DenverUniversity of Denver
October 29, 2008October 29, 2008
22
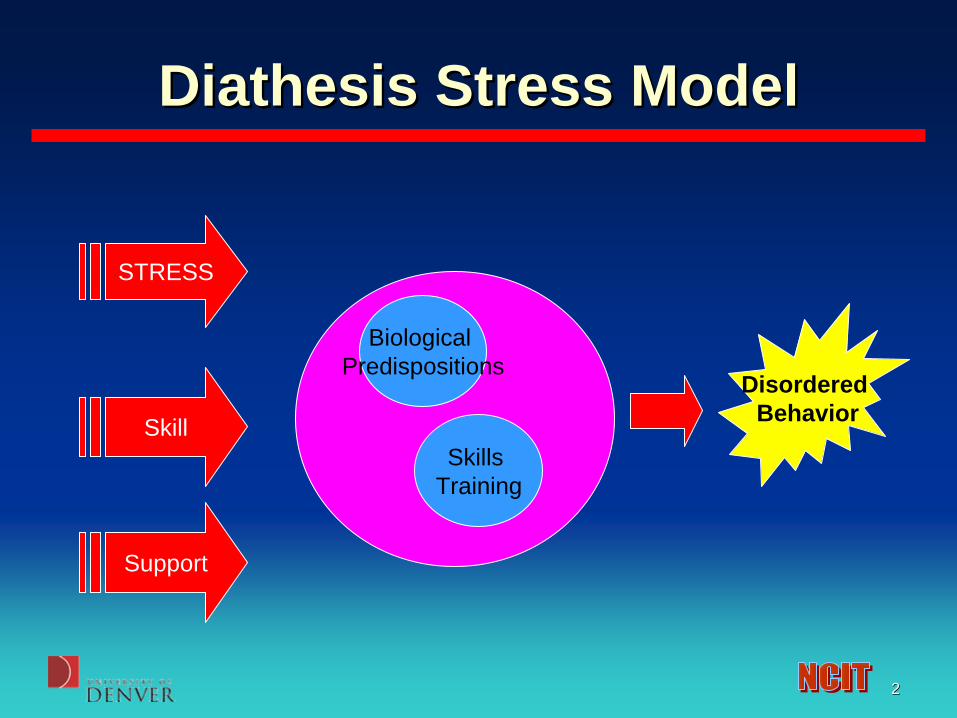
Diathesis Stress ModelDiathesis Stress Model
STRESS
Skill
Support
Biological Predispositions
Skills Training
Disordered Behavior

33
Consequences of VulnerabilityConsequences of Vulnerability
• Depression• Stress• Fatigue• Reduced Vigilance• Increased Safety Risk• Stress Symptoms

44
DepressionDepression
• Concern with Depression in the Workplace Increasing:– Lack of vigilance– Risk of unsafe behavior– Fatigue– Lack of concentration– Weight gain
55
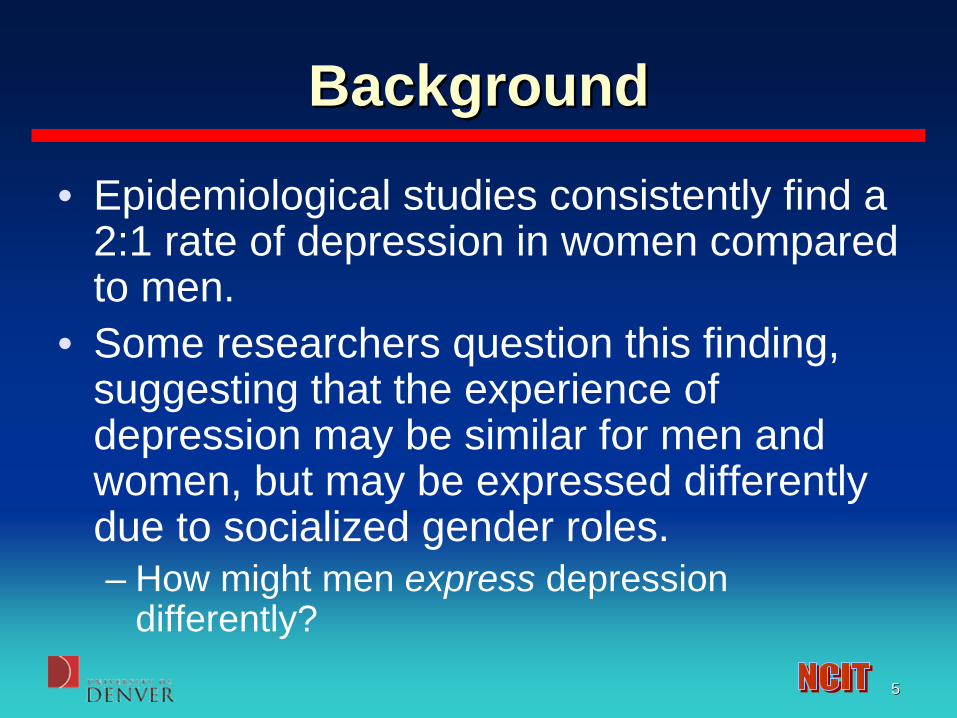
BackgroundBackground
• Epidemiological studies consistently find a 2:1 rate of depression in women compared to men.
• Some researchers question this finding, suggesting that the experience of depression may be similar for men and women, but may be expressed differently due to socialized gender roles. – How might men express depression
differently?

66
Railroad Railroad Health and Wellness SurveyHealth and Wellness Survey
For the purpose of this study, health and wellness data for Railroad Employees were collected at:
1.Roseville, California2.Denver, Colorado3.Salt Lake City, Utah

77
Railroad Railroad Health and Wellness SurveyHealth and Wellness Survey
• Permission to conduct this study was given by the Institutional Review Board for the Protection of Human Subjects at the University of Denver.
• Prior to arriving on site at each location, approval for data collection was granted by the Railroad and the appropriate on site supervisors were notified.
88
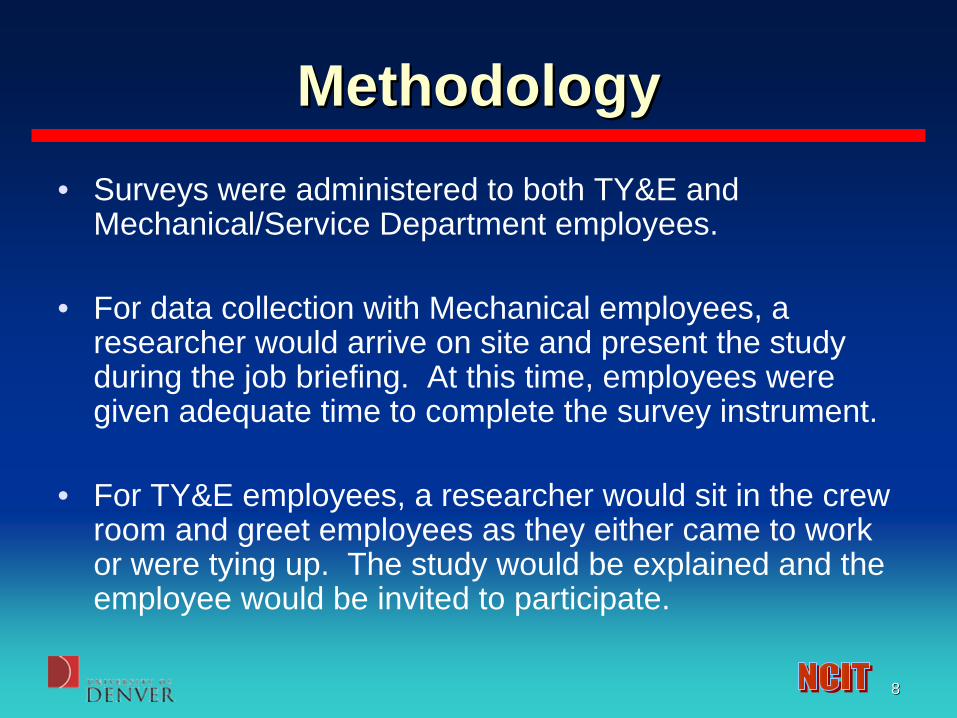
MethodologyMethodology• Surveys were administered to both TY&E and
Mechanical/Service Department employees.
• For data collection with Mechanical employees, a researcher would arrive on site and present the study during the job briefing. At this time, employees were given adequate time to complete the survey instrument.
• For TY&E employees, a researcher would sit in the crew room and greet employees as they either came to work or were tying up. The study would be explained and the employee would be invited to participate.

99
Railroad Railroad Health and Wellness SurveyHealth and Wellness Survey
• Respondents for each location (91% response rate) :1. Roseville, California: 281 Mechanical and
TY&E employees.
2. Denver, Colorado: 160 Mechanical employees.
3. Salt Lake City, Utah: 97 TY&E employees

1010
Depression MeasuresDepression Measures• The Beck Depression Inventory-II (BDI-II)
– 21-item self-report rating scale. – Each item represents a symptom of depression (e.g.,
Sleep Difficulty) and asks respondents to select from several options the choice that best describes them.
– Response choices are labeled from 0 to 3, with higher numbers representing more severe depressive symptoms.
• Scores of 0-13 indicate minimal depression• 14-19 indicate mild depression• 20-28 indicate moderate depression• 29-63 indicate severe depression.

1111
DepressionDepression
Beck is the •GOLD STANDARD•435 respondents• 20.7% reported some form of depression•8.9% reported moderate to severelevels of depression.
Minimal Mild Mod Severe

1212
Comparison of CraftsComparison of Crafts
• Train engineers/ conductors on average scored 3 points higher on the BDI than mechanical workers.
• This difference is small but statistically significant. 0
2
4
6
8
10
12
BDI
MechanicalTYE

1313
Depression MeasuresDepression Measures
• Center for Epidemiological Studies Depression Inventory (CES-D)– 20-item scale– Responses range from 0 (never) to 3 (very
often/always)– Scores:
• 0-15: Minimal Depression• 16-22: Mild Depression• 23-32: Moderate Depression• 33+: Severe Depression
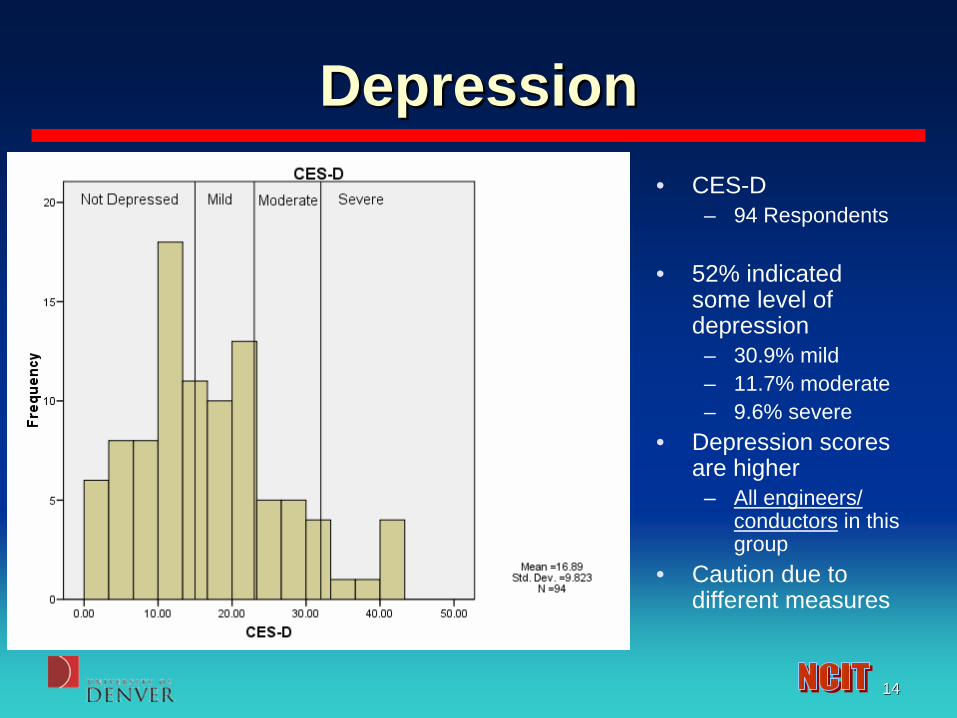
1414
DepressionDepression• CES-D
– 94 Respondents
• 52% indicated some level of depression
– 30.9% mild– 11.7% moderate– 9.6% severe
• Depression scores are higher
– All engineers/ conductors in this group
• Caution due to different measures

1515
SuicideSuicide
• 430 respondents answered a question about suicidal thoughts.
• 27 (6.2%) respondents indicated suicidal thoughts.
• 3 (.7%) respondents indicated that they would kill themselves if they had the chance.

1616
PTSD MeasurePTSD Measure
• The PTSD Checklist Civilian Version (PCL-C) – 17-item rating scale measure assessing symptoms of
PTSD. – Response choices range from 1 (Not at all) to 5
(Extremely), and participants are asked to indicate which response describes how much they have been bothered by each symptoms (e.g., repeated, disturbing dreams of a stressful experience from the past?).
– A cutoff score of 50 suggests a diagnosis of PTSD.

1717
Trauma SymptomsTrauma Symptoms• 80 respondents
indicated exposure to a traumatic event and answered questions about their reactions to traumatic events.
• 17.5% of these individuals meet suggested cutoffs for PTSD

1818
HelpHelp--Seeking BehaviorSeeking Behavior• 429 respondents
answered questions about their help- seeking behavior and barriers to help- seeking
• 124 (28.9%) scored high on “Need for Control” indicating that seeking help for problems would threaten their autonomy.
1919
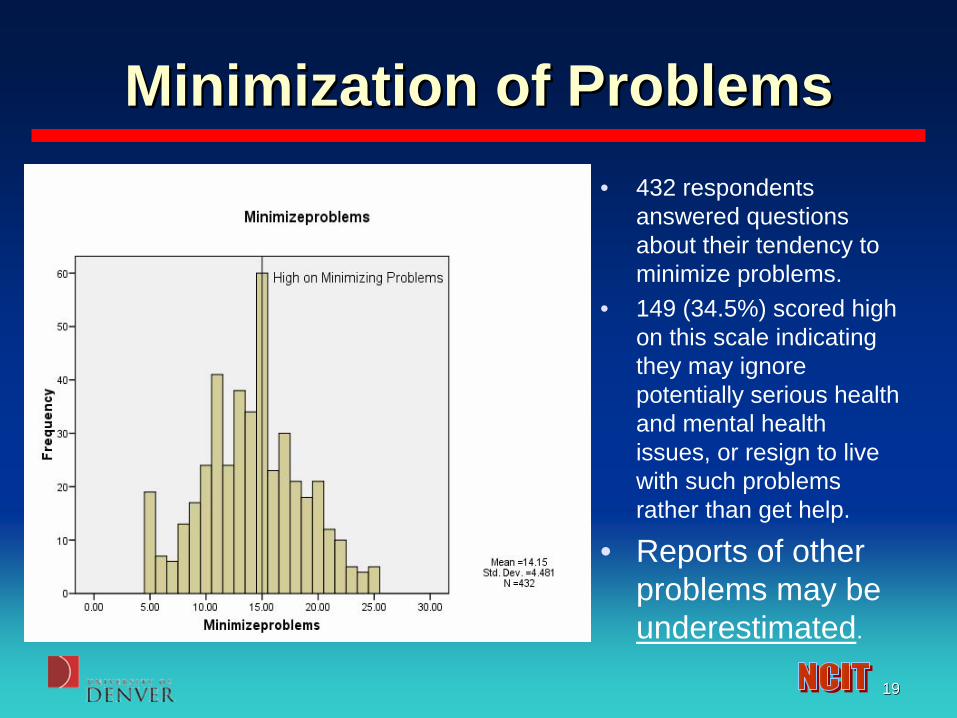
Minimization of ProblemsMinimization of Problems• 432 respondents
answered questions about their tendency to minimize problems.
• 149 (34.5%) scored high on this scale indicating they may ignore potentially serious health and mental health issues, or resign to live with such problems rather than get help.
• Reports of other problems may be underestimated.

2020
SummarySummary• 20.7% of respondents indicated some level of
depression on the BDI-II.– Nearly half of those reported moderate to severe depression.
• 52% of respondents indicated some level of depression on the CES-D.– Over 20% report moderate to severe depression.
• 6.2% indicated suicidal thoughts.• 0.7% indicated that they would kill themselves if they had
the chance.• 17.5% reported clinically significant trauma related
symptoms related to PTSD.

2121
SummarySummary• Job
– Conductors/Engineers report higher overall depression than mechanical workers.
– Confounded with measure and location
• Common barriers to help-seeking were “need for control” and “tendency to minimize problems”.– Efforts to study these issues must account for the fact
that respondents may underreport problems and may not be using established lines of support to get the help they need to do their job safely.
– Implications for measurement and intervention.

2222
SummarySummary
• Measures that assess alternative expressions of depression provide additional information based on male gender roles affecting the experiencing of depression.

2323
Findings Findings
• Variables significantly associated with INCREASED depression in rr studies:– Not spending time with friends– NOT talking about feelings– NOT Talking to supervisors– Dissatisfaction with job

2424
Modeling the Modeling the Cost of Behavioral Health IssuesCost of Behavioral Health Issues
• Recent research has shown that the cost of untreated depression in the workplace can be very high.
– The Costs and Benefits of Enhanced Depression Care to Employers (Wang, Patrick, Avorn, Azocar, Ludman, McCulloch, Simon, & Kessler: Arch Gen Psychiatry. 2006;63:1345-1353) .
• Although outreach and enhanced treatment interventions improve depression outcomes, uptake has been poor in part because of lack of information on return on investment.
• Depressed individuals have been found to have twice the level of absenteeism as non-depressed people.
• The MONETARY value is derived by calculating cost of daily salary & fringe.
• Overall, medical utilization costs for patients with depression are significantly higher than for those without depression, and have been related to greater use of medical services rather than psychiatric services.

2525
Modeling the Modeling the Cost of Behavioral Health IssuesCost of Behavioral Health Issues
• More than three quarters of benefit managers believe that the cost to their companies in lost productivity because of depression is greater than the cost of treating this condition, but only 11 percent facilitate employee screenings.
• Depression in the Workplace (Kessler, 2006).
• The effect is in such areas as job turnover, lowered productivity, increased absenteeism, and higher benefit costs.
• Productivity loss due to lack of vigilance hard to quantify.

2626
Modeling the Modeling the Cost of Behavioral Health IssuesCost of Behavioral Health Issues
• Durso (2005) reviewed seven employers’ medical and drug claims, examining the extent to which workers sought treatment for depression over a two-year period. The population was a national sample of workers from the service, manufacturing, and transportation industry.
• The study looked at various medical vendors and health plans
• The review found that about 7 percent of the population was treated for depression during the two years.
• On a cost-per-episode basis, about half of the benefits paid were for prescription drugs. Hospital admissions accounted for only 13 percent of the total paid.
• The amount paid for medical and drug benefits for depression treatment was $968 per claimant. However, the total medical and drug costs for all conditions for which people with depression were treated was much higher: $8,103 per claimant, compared to the total population average of $4,258 per claimant for all diseases and disorders.

2727
Modeling the Modeling the Cost of Behavioral Health IssuesCost of Behavioral Health Issues
• Clearly, not all of the co-morbidities of the depression claimants are actually associated with the depressive disorder. But a number of recent studies have called attention to the association between depression and long-term painful and treatment-resistant conditions.
• The two highest cost co-morbidities of depression were musculoskeletal and gastrointestinal disorders.

2828
Cost of Depression Cost of Depression
Prevalence of Depression
AvgDaily Salary
Cost of Depression
7.5% $200 $10 million
Workforce Size = 30,000 employee
2929
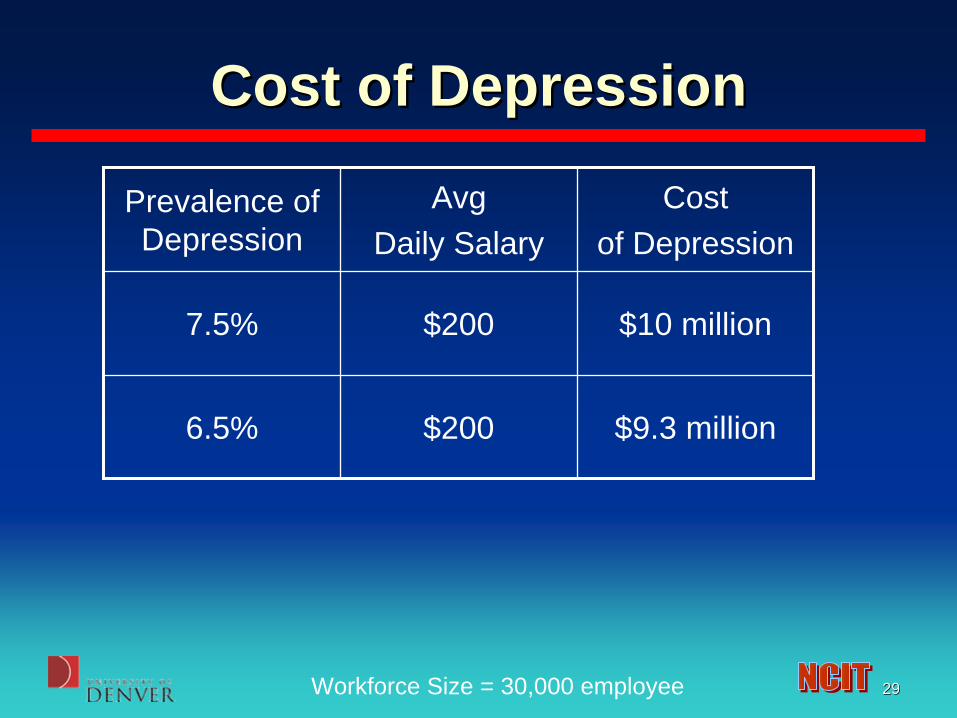
Cost of Depression Cost of Depression
Prevalence of Depression
AvgDaily Salary
Cost of Depression
7.5% $200 $10 million
6.5% $200 $9.3 million
Workforce Size = 30,000 employee

3030
Cost of Depression Cost of Depression
Prevalence of Depression
AvgDaily Salary
Cost of Depression
7.5% $200 $10 million
6.5% $200 $9.3 million
5.5% $200 $7.9 million
Workforce Size = 30,000 employee

3131
Interrelatedness of SymptomsInterrelatedness of Symptoms
Data from Roseville & Denver data. *p<.01
Sleepiness Trauma Symptoms
Depression .318** .370**
Sleepiness .233*
These symptoms are interrelated and intercorrelated suggesting that there may be some particular stressors and vulnerabilities in the RR Industry.

3232
CONCLUSIONSCONCLUSIONS
• Factors that increase these symptoms may be amenable to some extent to:– Social support/Peer intervention– Increasing coping skills– Improving relationships with management– Coping and educational efforts

3333
• Many of these risk reduction factors are delivered best through the informal mechanisms of: – Improved Culture of Engagement and Support
from Management– Peer Support
• Continued support and training for these key programs should lead to quantifiable reductions in behavioral health disorders.