the economic valuation of lugu lake-final
TRANSCRIPT

Thesis for [Master of Science, cand.oecon, cand.polit] - degree.
Analysis on the Economic Valuation of Ecosystem Services:
A case study on LuGu Lake basin
Ding Ding
May 2006
Department of Economics
University of Oslo
Preface
i
Preface From the start of my study at university of Oslo, I recognized my interesting in writing
my thesis to the Master degree in one of the parts of Resource Economics and
Ecology Economics and decided to carry on some quantitative analysis. Thus, it might
be greater with providing common work for part of this project and emphasis on more
comparative analysis with other related evaluations. Indeed, for information and
insight I should grateful to my colleagues in China serviced in Academy of
Macroeconomic Research Institute (NDRC), whose work has been of great value.
Their response to my seeking help is always that fast. And needless to say, I have
drawn heavily on my own of work in this area and would continue with it.
I must express my appreciation to my supervisor Gang Liu, for his inspiration in the
thesis, grateful to him for his constructive suggestions, and sound treatment. His
comments and the discussion with him are often full of illuminations which help me
accomplish this thesis favorably. Thanks also to Professor Olav Bjerkholt, the
director of Program in Environmental and Development Economic, which open
another door to the students from developing countries. I will always remember the
great effort which done to provide the best environment to us, students in the Master
program. I would like to express my acknowledgement to him and thank him for all
his efforts during my study time. These cherish experience would encourage me
forever. Without the help and advice from all these people, I definitely could not go so
far. But all remaining errors are of course my own responsibility.
I indebt to show my gratitude to the Social Development Division of Scientific and
Technology Ministry (MOST), China, fund the project “Studies on Sustainable
development of Lugu Lake Basin” (No.2005DIB3J002), and would like to express my
thanks to the Research Centre of Eco-Environmental Science, China Academy of
Science (CAS) for providing me academic assist and Lijiang Environmental
Protection Bureau (LEPB) for kindly supports during my field work in Lugu Lake.

Content
ii
Content 1 INTRODUCTION…………………………………………………………1
2 THEORETICAL AND EMPIRICAL LITERATURES ON EVES ……………3
2.1 Ecological economics and environmental economics…………......3
2.2 Value of ecosystem services …………………..…………….…….4
2.3 Previous research on analysis of EVES………….………….…......5
2.4 Policy indication of materials analysis on EVES………….……....6
2.5 Brief summary……………………………………………………..6
3 ANALYSIS ON LUGU LAKE ECOSYSTEM SERVICES……..………….….7
3.1 Study site description……………….….………..………..…….…7
3.2 Natural resources……….……………..……….…..……………....9
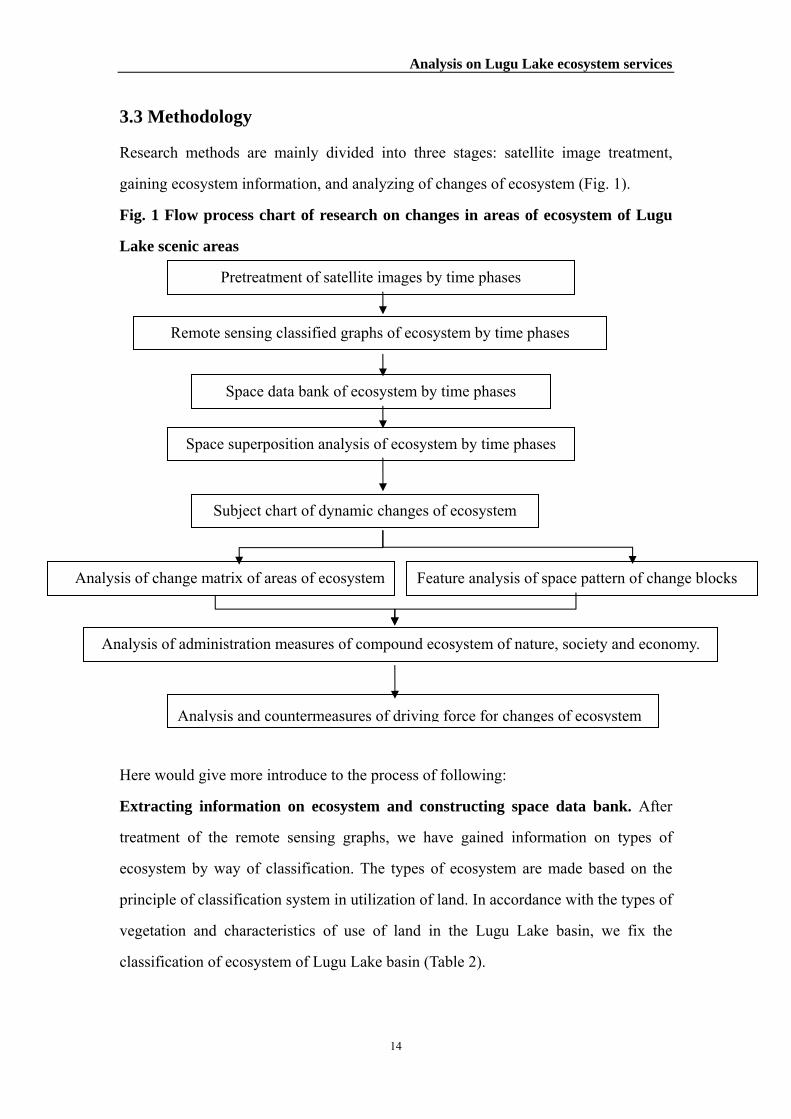
3.3 Methodology…………….…….…………………….………...…14
3.4 Research results and analysis ……………….……...……………15
3.4.1 Analysis of changing trend of areas of different types of ecosystem of
Lugu Lake scenic areas..…………………..……..…………………..…15
3.4.2 Comparison analysis of changes in areas of ecosystem in Lugu Lake
scenic areas and the surrounding areas…………………………….……18
3.4.3 Analysis of area changing matrix of ecosystems in Lugu Lake scenic
areas in 1990-2005…………………….………………………..………19
4 THE ECONOMIC VALUATION OF LUGU LAKE ECOSYSTEM
SERVICES………………………………………………………………..23
4.1 Overview…………………….……………………….….…….…23
4.2. Production supply………………………..……………….......…24
4.3 Regulation function…………………………….………..…….…26
4.3.1 Soil conservation ….………………………...………………….…26
4.3.2 Conservation of water resource…………………………………….30
4.3.3 CO2 absorption……………………………………….….…….….31
Content
iii
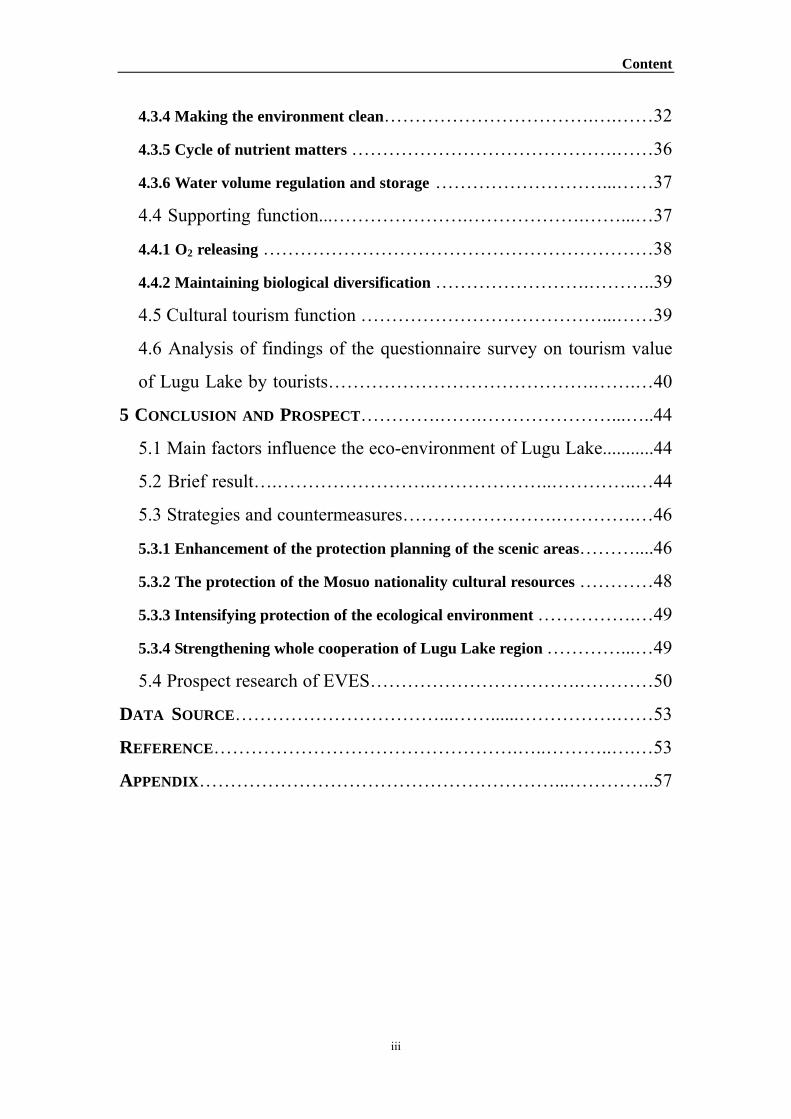
4.3.4 Making the environment clean…………………………….….……32
4.3.5 Cycle of nutrient matters …………………………………….……36
4.3.6 Water volume regulation and storage ………………………...……37
4.4 Supporting function...………………….……………….……...…37
4.4.1 O2 releasing ………………………………………………………38
4.4.2 Maintaining biological diversification …………………….………..39
4.5 Cultural tourism function …………………………………...……39
4.6 Analysis of findings of the questionnaire survey on tourism value
of Lugu Lake by tourists…………………………………….…….…40
5 CONCLUSION AND PROSPECT………….…….…………………...…..44
5.1 Main factors influence the eco-environment of Lugu Lake...........44
5.2 Brief result….…………………….………………..…………..…44
5.3 Strategies and countermeasures…………………….………….…46
5.3.1 Enhancement of the protection planning of the scenic areas………....46
5.3.2 The protection of the Mosuo nationality cultural resources …………48
5.3.3 Intensifying protection of the ecological environment …………….…49
5.3.4 Strengthening whole cooperation of Lugu Lake region …………...…49
5.4 Prospect research of EVES…………………………….…………50
DATA SOURCE……………………………...……......…………….……53
REFERENCE………………………………………….…..………..….…53
APPENDIX…………………………………………………...…………..57

Content
iv
List of Tables
Table 1 The economic development of Lugu Lake basin (2000)……………….….....8
Table 2 Classification of ecosystem of Lugu Lake basin…………………………....15
Table 3 Acreage transformation statistics of the various types of ecosystem types of Lugu Lake scenic areas …………………………………………………….…..16
Table 4 Acreage transformation statistics of various types of ecosystem of surrounding areas of Lugu Lake scenic areas…………………………….….…..18
Table 5 Changing matrix of areas of ecosystems in Lugu Lake scenic area from 1990 to 2005…………………………………………………………….....................19
Table 6 Evaluation indices and methods of ecosystem services in Lugu Lake basin…………………………………………………………………………….23
Table 7 Type of forests and stock volume of forest in Lugu Lake basin….……..….25
Table 8 The value of soil erodibility factor (K) in USLE………………………...…27
Table 9 The value of C of different patterns of vegetation in USLE …………...…..28
Table 10 The calculation results of amount of soil conservation in Lugu Lake….....29
Table 11 Lugu Lake water resource’s self-restraint ability……………………….…31
Table 12 CO2 absorption amount and corresponding value of Lugu Lake basin forest ecosystem……………………………………………………………………….32
Table 13 Underlying SO2 holding and dust detention capacity of Lugu Lake basin forest ecosystem ………………………………………………………….…....33
Table 14 N&P’s cleaning by Erhai Lake and Qionghai Lake in Yunnan-Kweichow Plateau ……………………………………………………………………..…..36
Table 15 Nutriment content of plant body………………………………………..….36
Table 16 O2 release of forest ecosystem in Lugu Lake basin…………………………..…38
Table 17 Evaluation result of Lugu Lake basin ecosystem services value………….45
Content
v
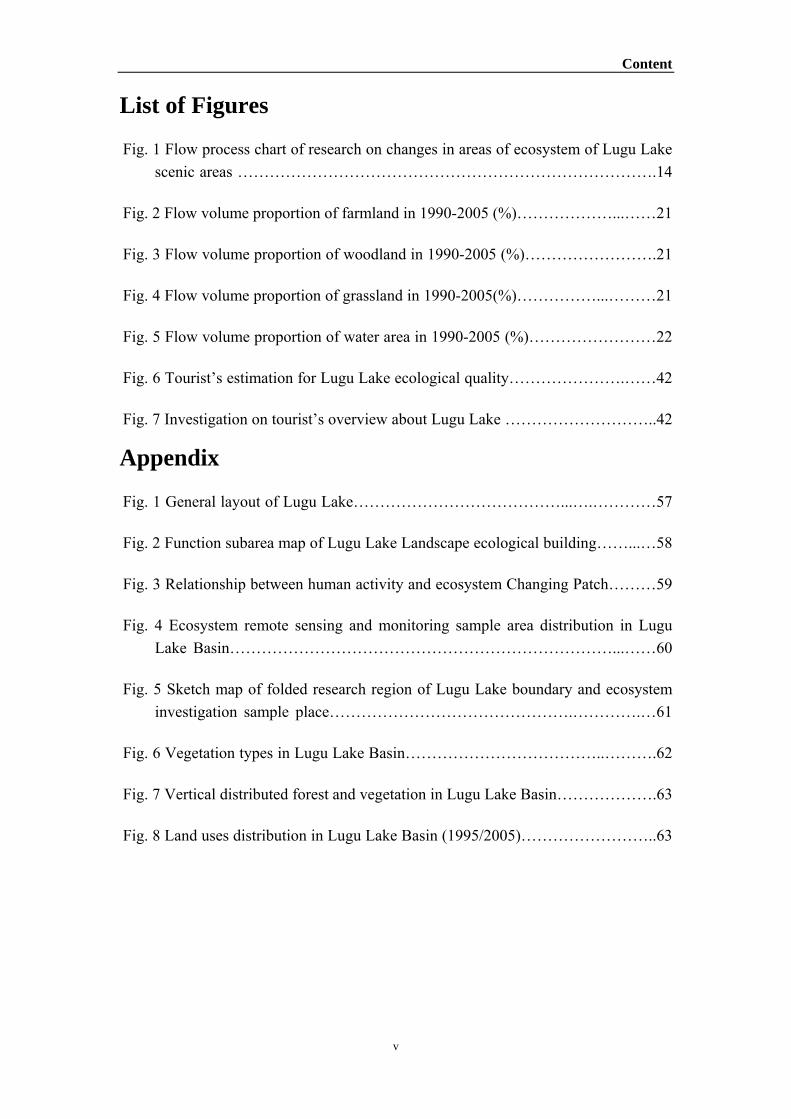
List of Figures
Fig. 1 Flow process chart of research on changes in areas of ecosystem of Lugu Lake scenic areas …………………………………………………………………….14
Fig. 2 Flow volume proportion of farmland in 1990-2005 (%)………………...……21
Fig. 3 Flow volume proportion of woodland in 1990-2005 (%)…………………….21
Fig. 4 Flow volume proportion of grassland in 1990-2005(%)……………...………21
Fig. 5 Flow volume proportion of water area in 1990-2005 (%)……………………22
Fig. 6 Tourist’s estimation for Lugu Lake ecological quality………………….……42
Fig. 7 Investigation on tourist’s overview about Lugu Lake ………………………..42
Appendix
Fig. 1 General layout of Lugu Lake…………………………………...….…………57
Fig. 2 Function subarea map of Lugu Lake Landscape ecological building……...…58
Fig. 3 Relationship between human activity and ecosystem Changing Patch………59
Fig. 4 Ecosystem remote sensing and monitoring sample area distribution in Lugu Lake Basin………………………………………………………………...……60
Fig. 5 Sketch map of folded research region of Lugu Lake boundary and ecosystem investigation sample place……………………………………….………….…61
Fig. 6 Vegetation types in Lugu Lake Basin………………………………..……….62
Fig. 7 Vertical distributed forest and vegetation in Lugu Lake Basin……………….63
Fig. 8 Land uses distribution in Lugu Lake Basin (1995/2005)……………………..63
Abstract
vi
Abstract
This thesis is an empirical investigation and application of economic valuation of
ecosystem in Lugu Lake, southern China.
Ecosystem Services (ES) and their quantitative assessment have become one of
ecological economics research focuses since 1997, especially the Economic
Valuation of Ecosystem Services (EVES). An essential reason of the controversies
is they are reviewed from different study angles. Different disciplinary paradigms lead
to the debate that whether EVES study is necessary and different research scales lead
to the debate related to theories, practical implications of different methodologies. It is
necessary to systematically summarize present research viewpoints, methods and
theoretic backgrounds of EVES. Based on the review of relating theories and case
studies of EVES, this study summarized ecol-economics pre-analysis vision of EVES
and compared contemporary theories, policy implications, appropriate methods and
problems under research which are introduced in all kinds of literatures.
In this dissertation, research methodologies of EVES were classified into two systems:
(1) Absolute economic valuation of ES, which focus on the whole contributions from
ecosystem to society and economy. ES values are measured with material, energy or
monetary units in these kinds of researches. Absolute ES economic values can reflect
the material scarcity of natural capital and synthetic conditions of the whole
ecol-economic systems, which can provide guidelines for the improvement of national
accounting systems and social-economic development assessment. (2) Relative
economic valuation of ES, which focus on partial contributions from ecosystem to
society and economy and the appraisal results of these valuation are measured with
monetary units. The short-term policy implications of relative ES economic valuation
are more abundant than absolute ones because these kinds of research are more
helpful for policy makers to make choices among different trade-offs and market
Abstract
vii
incentives, so policies and institutions can be designed according to them. As the case
analysis, the paper discusses the economic valuation of ecosystem services of Lugu
Lake basin.
The meaning of the ES and the theory that case analysis involved is discussed in Part
1; Part 2 analyze relevant basic theories separately, material analysis of ecosystem
services, and method of EVES, sum up the general theory and policy meaning; Part
3-4 expound the fact that the economic evaluation and ecosystem services of Lugu
Lake, the total economic value of the Lugu lake ecosystem is derived through
aggregating the values from those different components; Placing the study area into a
broader picture of whole Lugu Lake, the empirical research of Lugu Lake was carried
out with fundamental market substitution methods for ecosystem services evaluation.
Theoretically speaking, countable general equilibrium model is desirable to assess
them; but data restriction and relevant chain feedbacks make it practically infeasible.
Although the research seems simple, some theoretical implications can be revealed
from the application of ecosystem services evaluations; Based on the economic
valuation of ecosystem service, the thesis concludes with discussion of policy
implications, Part 5 summarizes the result of the reckoned value of the services of the
ecosystems of Lugu Lake areas, suggests enhancing the strategies and
countermeasures to local sustainable development.
At policy and institutional level, interesting issues for further studies are how to
protect the regional development and how economically develop the local economic
growth, and so on. With respect to environmental economics in China, future studies
include: How environmental valuation methods are applied in China? How economic
valuation of ecosystem methods would be carried out in China? Enlarged economic
evaluation of ecosystem services may be helpful for relative stakeholders who will
take better and more public rational choices.

Introduction
1
1. Introduction The environmental protection movement developed continuously within the scope of
world since the second half of 20th century, at the same time, the concept of
sustainable development was gradually deep-rooted among the people, the
corresponding theories’ investigation also been push forward continuously. Within the
sustainable development theory, the ecology and the economic theory method is the
foundation, and the evolution rule of complex ecology system is the research object,
the new cross-discipline "the ecological economics" which integrates multi-kinds
correlative disciplines of natural and social sciences becomes an important front
research area. Because of the definition and analysis of ecosystem and sustainable
development involve many kinds of theoretical disciplines and the various human
social activities, the present fundamental research is not yet been established "the
model-theory-policy" system. Researchers with different background have the
different view, even more, opposite.
A basic common understanding that has already been formed at present is, close ties
existed between economic system and ecosystem, and the ecological environment has
made indispensable contribution to the economic development of human society.
Benefit that human society obtained from the ecosystem mainly includes useful
material and energy input, offal acceptance and transformation, which were general
designed as Ecosystem services (ES) in recent years, enter social economic
department, combine with artificial capital and manpower capital, then produce the
final consumer goods, for example, the foundation supports function such as
producing various kinds of raw materials and offering the source of water to regulate.
It may also be directly enjoyed by individual member of human society, such as
offering such comfortableness resources as clean air, bright view, etc. The natural
ecosystem can be considered as the Natural Capital (NC).

Introduction
2
As the economic scope of mankind activities is being expanded constantly, ecosystem
services and natural capital become the greatest limiting factor of social economic
development nowadays. Gradually, improving the utilization efficiency of the natural
capital becomes the important subject to be solved of sustainable development. The
improvement of the utilization efficiency of the capital depends on the rising of its
rate of return on investment. As the ecosystem services, the benefit output of natural
capital, possess the characteristics of public good or the accurate public good more,
unable to participate in normal marketing, this means natural capital investment and
income are asymmetric, cause microeconomic subject maintain natural incentive
mechanism of capital insufficient. Meanwhile, the natural capital has restrained public
policy-making bodies from allocating public resources to the complexity of
contributing mechanism of social economic development rationally. The meaning of
study in Economic Evaluation of the Ecosystem services (EVES) lies in, express
with the relative income that the monetary unit invests natural capital in, help the
micro individual and public policymaker, compare different natural capital and
non-natural capital investment, promote the utilization efficiency of the natural capital,
to raise and strengthen social ability of realize sustainable development.
The economic evaluation of the ecosystem services became the highlight that
ecologist and economist paid close attention to after 1997, issue at Nature " global
ecological between service of the system and natural value of capital estimate " quote
over the scientific and technological thesis of 375 within 5 years, my paper will
review the progress briefly on the basis of defining theory normal form of ecological
economics, sum up the latest research results that the economic evaluation material of
ecosystem services correlated with economic relation, summarize theory model,
method system and policy meaning of supply and demand simulation of the
ecosystem services.

Theoretical and empirical literature on EVES
3
2. Theoretical and empirical literature on EVES
It is a study filled with controversy subject that the economic evaluation of the eco
system service is, among them much dispute begins to disagree from the initial
starting point, namely basic difference theories normal paradigm or pre-analytic
vision. The importance is to analyze views and subjective matter (Schumpeter,1954)
Before discussing material base and interests relationship involved in economic
evaluation of the ecosystem services, it is necessary to define the ecological
economics normal form followed in this research, and corresponding natural capital
meaning and value assessment angle at first.
2.1 Ecological economics and environmental economics
Before the concept of ecosystem services is explained in an all-round way (Daily,
1997; OuYang, 2002) the other kind of EVES developed under the cost-benefit
analysis of the environmental impact. (Pearce and Turner, 1990) But from starting
points, the concept of EVES and ecological economics are different, this is new
developing ecological economics and also is the difference between Ecological
Economics (EE) and traditional environment and Environmental and Resource
Economics (ERE).
The difference between EE and ERE lies in, at first, their angle and model of studying
the ecology with dynamic economic system is different: The former regarded the
economic system as the opening subsystem of ecosystem, appropriate in systematic
scale with economy, public and owning resource allocation in common, operating the
optimum standard; The latter is regarded the natural capital and ecosystem services as
the factor of production, it’s primary goal is to operate effectively with the economic
system, consider the fair problem of natural resource allocation partly.
EE and ERE launch at different scope and methods in carrying out the EVES, the
former gives consideration to the ecosystem services, material rareness of the natural
capital and economic rareness that can be transformed, assess all kinds of ecosystem
services of the whole world, not only estimate the relative value of the ecosystem
services, but also analyze the absolute magnitude of the ecosystem services; The latter

Theoretical and empirical literature on EVES
4
investigates especially those can enter the disposing and distribution cycle of
ecosystem services of the economic trade system, and paid more attention to those can
change rareness of material into economic rareness of the ecosystem services.
Because of wider ranges that EE involve, it need more factors and even complicated
relationship analysis among EVES, the research tool adopted is more various, the
accuracy of the result and the logic tightness of research are not so good as ERE.
2.2 Value of ecosystem services
The definition of the object are different, the value of the ecosystem services is also
different. From different scale of economic system of the ecology, the ecosystem
services have multiple values.
Because the ecosystem services comes from the structure and proceeding of the
ecosystem, the ability that the ecosystem provides service to the social economic
system usually has close relation to stability of the ecosystem, healthy contribution
with the ecosystem component, it is suggested to use the concept of ecological value
to compare and analysis the relation between parts of ecosystem (Farber, et al.,2002).
If regarded economic system as a subsystem of the ecosystem, consider the
contribution to economic system from other components of ecosystem, the ecosystem
services of the assessment and support the function to various kinds of products
offered, the focal would be the material amount of these services. This need to divide
various kinds of ecological functions and ecological service of the system rationally,
try to show them through a certain material index in unison, the content discussed in
2.3 of my dissertation.
Because the natural capital has substitutability, some material rareness of natural
capital and ecosystem services can be turned into economic rareness, if from the angle
within the economic system (include the investment and repayment of natural capital
and non-natural capital) to investigate comparative value of the ecosystem (especially
to as goods and the labor, market trading object), the value of ecosystem services will
then equal to the relative economic value of these ecosystem services, usually use the
monetary to weigh. The relative economic value of the ecosystem services not merely
needs to analyze the ecosystem and its contribute to the economic system as the

Theoretical and empirical literature on EVES
5
foundation, but also need to correlate with social and economic situation of
stakeholders.
2.3 Previous research on analysis of EVES
The EVES needs to analyze the material output and function of the ecosystem
structure as the foundation, to illustrate interaction between production mechanism of
ES, so the production and classification of the ecological service of the system are
essential components that EVES studies. At present, the efforts in this area are mainly
studied for the economic assessment of global ecosystem, adopted index measurement
of the currency media of exchange inside economic system, and other materials
indexes too.
There are much methods of the ecosystem services, the one of great impact among
them is divided from the usable way of the ecosystem (Daily, 1997; Moberg and
Folke, 1999), ecosystem and economic support function way that system operate
divide into function and corresponding service system (Costanza, et al., 1997; De
Groot el., 2002; MA, 2003), and according to producing the yardstick in ecosystem
structure (Limburg,et al.,2002), according to the type of the ecosystem
(UNDP ,2000),etc..
Moberg and Folke(1999) studied the ecosystem services of the of coral reef , divide
nature products to regenerated resources, non-renewable resources products, physical
structure services, biotic services, biogeochemical services, information services
and social and cultural services.
According to ecosystem structure function and production mechanism of ES, is the
extensive way to classify the ES. Detailed ES classifies the research (De Groot et al,
2002 )studied and divide the ecosystem services into the regulating function according
to the regulation , habitat , production, about 23 sub classics. The United Nations
“Millennium Ecosystem Assessment” (2000) ,especially categorised four function
group make of provisioning services, regulating services, cultural services, and
supporting services, according to the interaction method, among the ecosystem
structure, function and ES,

Theoretical and empirical literature on EVES
6
2.4 Policy indication of materials analysis on EVES
To avoid the repetition and omission phenomenon in quantitative evaluation of
ecosystem, EVES need to investigate production mechanism, interaction of different
eco system service of the ES, and carry on the proper classification to ES in view of
the above. The existing representative methods mainly are: (1) The worth analysis
from the total supply of ES;(2)The ecological footprint from the total demand of
ES;(3)The expand comparative analysis of net flows among the sub-ecosystems.
Though it is not obvious that the meaning of research on the production mechanism
and definitely economic evaluation of ecosystem services in short-term policy
decision, but research work would contribute to strengthening the understanding of
dynamic economic system of the ecosystem of the whole society, it would also offer a
reference standard of appraising the relative economic worth of the ecosystem
services, significance too in setting up a more scientific national economic and social
development evaluation index system.
2.5 Brief summary
My research adopts the relatively economic evaluation method, that is, at first,
calculate the benefit of single kind of ES on unit's; then regard area of ecosystem
ground of all kinds of as weight coefficient and adds it. This is a kind of preliminary
static behavior, but we can draw result that point out the meaning and can avoid
repeated. My research chose concrete evaluate target and the parameter cautiously, so
as to ensure our assessment presses close to the actual market of China. Because the
Lugu Lake increases yield directly the eco-environmental benefit and ecosystem and
improves the eco-environmental benefit brought to overlap, but the former is easier to
change at any time, the latter has steady and more extensive meaning. As it is not easy
for all the ES can be evaluated in proper way, find a corresponding one can enter
actual compensation way of market, so maybe some appraisal method and this result
close to actual market but others relatively far from its real market value.

Analysis on Lugu Lake ecosystem services
7
3. Analysis on Lugu Lake ecosystem services
3.1 Study site description
Lugu Lake is located at the border of Sichuan and Yunnan Province. It is 72km north
of Ninglang Town and is also under the control of both provinces. The lake is 2685
meters above sea level , 5.2km wide from east to west, and has an area of 48.5 square
km. The deepest end of the lake is about 93.5 meters.
Lugu Lake is long and narrow, like a hoof filled with limpid water. Five small forested
islands are interspersed across the surface, three of which are in Yunnan precinct. The
smallest island is called Lige Island, and there are only eight Mosuo families living on
it. Another island, called Chieftain Island, was named because Ayunshan, the chieftain
of Yongning Village, had built a villa and lived here until his death in the Guangxu
period of the Qing Dynasty. Simultaneously, Joseph Rock, an Austrian writer who was
his friend, wrote part of the Ancient Nakhi Kingdom of South-west China (Harvard
University Press, 1947) on this island. Liwubi Island, which lies three kilometers (one
point nine miles) away from Chieftain Island, is actually a small peninsula extended
into the lake by the Holy Gemu Mountain. The mountain is also called Lion Mountain,
for it looks like a lion drinking water beside the lake. Mosuo people believe that a
beautiful and kind goddess named Gemu lives on the mountain and blesses the
residents at all times. A great sacrificial rite is held to worship the goddess on July
25th of each lunar year at the foot of Gemu Mountain.
Lugu Lake has no industrial inputs but its watershed suffers from severe gully erosion
and a decline of endemic fish populations. Scientific monitoring and research have
played a limited role in Lugu Lake’s management. A small amount of monitoring data
was collected by the county environmental protection office, but was not shared with
village level resource managers. Monitoring data and other scientific support from
county agencies could help local resource managers determine the effects of
increasing erosion on lake water quality and possible causes of the endemic fish catch

Analysis on Lugu Lake ecosystem services
8
decline. Unfortunately, data quality tends to be poor at the county level and in places
like Lugu Lake where people have little experience in monitoring water quality.
Many cultural sites and scenic spots are scattered along the lakeside. As one of the
remaining matriarchal societies -Mosuo people and their customs are living fossils in
a sense. In every family, according to the traditions of the matriarchate, women have
the most important roles and they take on all the responsibilities of the families and
the village. Children take the mothers' family names and live with their mothers. The
relationship between the Mosuo lovers is called "Axia" instead of marriage in the
common society. When the youth have gone through a Maturity Ceremony at the age
of 13, they are permitted to choose their own Axia. Official procedures or documents
are not needed here and the retaining time of this Axia relationship is based on the
lovers' wishes. They are also Mosuo villages, plateau hot springs, the underground
maze-The Lucky Cave, the Chieftain's Palace, the Zhamei Lamaist Temple, Riyuehe -
The Ruins of the Yuan Army Quarters when Kublai Khan was on his south -
expansion, yongning - the key town on the ancient tea and horse trading route. Many
beautiful legends have been circulating among the people. Thus the place is called "A
Quaint Realm of Matriarchy".
There are basically no industries in Lugu Lake basin, and the agricultural economy
takes the absolute superiority. The financial income mainly comes from first industry.
However, tourism has great development in recent years (Table 1).
Table 1 The economic development of Lugu Lake basin (2000)
Province Village/Town Total
Income (Yuan)
Primary Industrial Income
(Yuan)
Proportion (%)
Third Industrial Income
(Yuan)
Proportion(%)
Shankua 228900 215400 94 13500 6 Puluo 248200 229900 93 18300 7
Langfang 136030 128530 94 7500 6 Wangjiawan 102655 98055 96 4600 4
Yunnan
Lvjiaying 112915 106115 94 6800 6

Analysis on Lugu Lake ecosystem services
9
Sanjiacun 169430 155730 92 13700 8 Luoshui 615994 270494 44 345500 56 Zhudi 228723 213223 93 15500 7 Lige 156270 125070 80 31200 20 Small
Luoshui 169230 156230 92 13000 8
Laowuji 113060 106560 94 6500 6 Subtotal 2281407 1805307 79 476100 21
Sichuan Lugu 12860000 9683923 75 3176077 25 Total 15141407 11489230 76 3652177 24
Source: Lijiang Statistical Yearbook 2000 [C].Edit by Statistics Bureau of Yunnan Province .Kunming. 2001.
3.2 Natural resources
Water resources. According to the Report on Lugu Lake Valley Environmental
Program drafted by the Yunnan Provincial Administration of Environmental
Protection in 1998, the annual average water inflow into the lake is 126 million cubic
meters, while the evaporation is 66 million cubic meters, presenting a net amount of
water resources of 60 million cubic meters. Of this, the recoverable resources of water
are 70% of the net amount, and the actual utilization of water resources of the lake
stand at 42 million cubic meters. The figures match the dynamic water capacity of the
lake in many years (the lowest water level of the lake: 2,689.8m, and the highest
storage water level: 2,690.8m, with changing range of 1m). Thanks to the limited
water resources, the lake is considered to be neither suitable for hydropower
development, nor for large amount of water storage and discharge for electric power
generation, which will lead to irrational falloff of water level, and bring about a string
of problems concerning ecology and environment of the lake are. The conclusion is
that the water resource of Lugu Lake is only suitable for irrigation of farmland and
forestland, daily use and tourism.
Forest resources. According to statistics, forestlands in Lugu Lake basin in the part
of Yunnan Province are about 46.3 square kilometers, with forest coverage standing at
47.6%, and live wood reserves of 320,000 cubic meters. Except the part of primeval

Analysis on Lugu Lake ecosystem services
10
forests, most of the forests are grown with un-mature trees, and the mature forests
reserves only account for 9% because of the damages by forest fire and denudation
and disordered lumbering. The forestlands in Lugu Lake basin in the part of Sichuan
Province, mainly in the six administrative villages, are 28.34 square kilometers,
accounting for 18% of the total land in use. The lands in Pingba area of Yongningba
Prefecture are most farmlands, and its surrounding areas are almost grassland or
barren mountains.
The forest resources in the area are limited, and most of them are sparse forests and
bushes. The existing mature forests reserves are small in amount, which can hardly be
used for timber production. In particular, the area has been designated as a key area
for protection of natural forests as it is on the upstream of the Yangtze River. The
forests in the Lugu Lake valley shall be mainly used for water and soil conservation,
not for timber production. At present, the macro scope of Lugu Lake is under slight to
light erosion, with erosion modulus standing at 200-300 tons per square kilometers
annually, and some areas are in poor geological condition and vegetation, posing big
degree of erosion. The fan-shaped accumulations on the lakesides indicate the
seriousness of the water and soil erosion in the area. Furthermore, once the vegetation
of the primeval forests is damaged, the area is likely to be eaten up by the invasion of
derivative biomes, turning highland willows, birches, poplar and dwarf bushes into
grassland. The forests in the area must be put under protection and cultivation, and
shall not be used for timber production. Lumbering shall be strictly banned.
Cultivated land resources. According to statistics, the six major administrative
villages in Lugu Lake basin on the side of Sichuan Province now have cultivated
lands of 9.21 square kilometers, of which lands with slope of 15-25 degrees account
for 20% of the total and lands with slope of more than 25 degrees account for 24%.
Total agricultural output value was 3.202 million Yuan in 2000, including 2.155
million Yuan from farm production. Farm production is the main source of income of
local people. The cultivated lands in Lugu lake basin on the side of Yunnan Province
Analysis on Lugu Lake ecosystem services
11
are 4.42 square kilometers, accounting for 8% of the total land in use. Most of lands in
the Pingba area of Yongningba Prefecture are farmlands, and the area also has some
paddy fields.
The cultivated lands in Lugu Lake valley area are in small proportion, and
furthermore, some of them have been turned into forestlands due the big degrees of
slopes. At the same time, some other cultivated lands are basically in conditions of
planting a lot but yielding less because of the backward irrigation facilities and weak
capability of fighting against natural disasters. From the angle of protecting of
ecology and environment, and increase of income of local people, the lake area shall
pursue adjustment of planting structure, and expansion of planting economic crops,
especially economic tress in a bid to strengthen conservation of water and soil. For
cultivated lands in good conditions, they shall be put into intensive cultivation to
achieve the result of smaller quantity but better quality by taking such measures as
accelerating construction of water conservancy and irrigation facilities, adding more
organic fertilizer, recovering soil fertility, improving varieties of seed, and conducting
intercropping and interplanting. The conclusion is that the utilization of cultivated
land in Lugu Lake valley area shall be in keeping with the local conditions and
combine planting trees with farm production, so as to increase economic efficiency,
and also improve the general environment, thus making an effective use of the
resources of cultivated lands. For Yongningba Prefecture, it can maintain the present
scope of cultivated land, while shifting from the traditional farm production to
development of modern ecological agriculture in a bid to increase economic
efficiency.
Grassland resources. Currently, Lugu Lake valley area has natural grasslands of 2.9
square kilometers (of which about 1.3 square kilometers are on the side of Sichuan,
and about 1.6 square kilometers on the side of Yunnan), accounting for about 1.5% of
the land areas. The amount of livestock in the six major administrative villages on the
side of Sichuan is 5,700-plus cattle and horses, 5,500-plus sheep, and 11,300-plus pigs;

Analysis on Lugu Lake ecosystem services
12
and the amount on the Yunnan side is 1,500-plus cattle, horses and mules, and
4,000-plus pigs. The income of the animal husbandry in the area is 25% of the total
output value of agriculture on the Sichuan part and 16% of the total on the Yunnan
side. Raising of livestock such as cattle and horses in the area is mainly by regular
herding, and that of pigs is in extensive breeding by putting them freely on the sides
of the lake, leaving many animal excretion everywhere, which is not good to the
environment. Some of the animals even gnawed the newly recovered grassland. The
areas on the Sichuan have started breeding of domestic animals in captivity.
As the limited resources of grassland in Lugu Lake valley are mainly in areas of high
elevation and slopes, they are not suitable for excessive herding of domestic animals
for the purpose of not causing degeneration of grassland, and water and soil erosion.
Grassland resources in scenic areas shall be put under an appropriate use and domestic
animals shall be mainly raised in captivity, and they shall also promote grass planting
and animal breeding technology, spread experience of crop-grass rotation, and use
high-quality forage grass and fine breeds of animals so as to gain high economic
returns. The adopting of breeding animals in captivity can also make effective
utilization of excretion to produce methane, and fertilize farmland, thus improving the
sanitary conditions of living for the local people.
Aquatic resources. Lugu Lake has rich resources of aquatic plants, boasting 37 types
of 19 families, and forming more than 10 types of water plants communities. Of them,
the acuminata var crispa, a waterweed, is a special product of the lake, which is edible
for cold dish and soup. The waterweed area of the lake is about seven square
kilometers, and local people use the waterweed as forage. The lake has four primitive
species of fish and six secondary species. Of the primitive species, three types of
schizothoracin fish are specially grown in the lake, known for their high value of
nutrition, big body and tender and delicious meat. Before the introduction of fish
species from the outside in the 1980s, the lake was abundant in schizothoracin fish,
which can be easily caught by bare hands. A haul of the fish could reach more than

Analysis on Lugu Lake ecosystem services
13
3,000 kilograms. The annual output of the fish was 300 tons. But the situation is much
different now. The number of the schizothoracin fish has reduced sharply because
fishes from the outside, which have eaten roes of the schizothoracin, and small-mesh
net catching. The annual output of the fish was only two tons in the 1990s.
The aquatic resources of Lugu Lake are not only rich but also having its own
characteristics, but the benefits of simple utilization for economic purpose is limited.
Due to the lake filling up for increasing farmland, the waterweed area has shrunk, and
the present excessive use of waterweed has shown sign of degeneration of the aquatic
plants. What makes even worse is that the increasing numbers of boats operating on
the waterweed area in the lake have forced migratory birds used to stay in the area in
winter to move to Lianghai Lake. Acuminata var crispa are scattered at the lakebed of
1-5 meters deep. As Lugu is a deep-water lake, the plant has posed a sign of reduction
because of water pollution of part of the lake water and excessive collecting. The
primitive species of fishes in the lake are near extinction because of the introduction
of fishes from the outside, and the excessive introduction of herbivorous fishes might
also damage the water plants communities, harming the primitive ecological
environment. At the same time, disordered and excessive breeding of fishes will also
create pollution of the water system. At the present, Lugu Lake has been listed in the
China’s Plan on Protection of Biological Diversification. The protection and
management of Lugu Lake are centered on ecology of the highland lakes to provide
tight protection of terrestrial and water ecological environment and biological species.
The lake shall make strict control in introduction of biological species from the
outside, fix the time for closing the lake for protection, and make efforts to protect and
recover the numbers of communities of water plants and the schizothoracin
fish. So, the utilization of aquatic resources of Lugu Lake must be carried out under
the preconditions of protecting ecological environment from further damage, and
recovery of original plants.
Analysis on Lugu Lake ecosystem services
14
3.3 Methodology
Research methods are mainly divided into three stages: satellite image treatment,
gaining ecosystem information, and analyzing of changes of ecosystem (Fig. 1).
Fig. 1 Flow process chart of research on changes in areas of ecosystem of Lugu
Lake scenic areas
Here would give more introduce to the process of following:
Extracting information on ecosystem and constructing space data bank. After
treatment of the remote sensing graphs, we have gained information on types of
ecosystem by way of classification. The types of ecosystem are made based on the
principle of classification system in utilization of land. In accordance with the types of
vegetation and characteristics of use of land in the Lugu Lake basin, we fix the
classification of ecosystem of Lugu Lake basin (Table 2).
Space data bank of ecosystem by time phases
Pretreatment of satellite images by time phases
Remote sensing classified graphs of ecosystem by time phases
Space superposition analysis of ecosystem by time phases
Feature analysis of space pattern of change blocks
Analysis of administration measures of compound ecosystem of nature, society and economy.
Subject chart of dynamic changes of ecosystem
Analysis of change matrix of areas of ecosystem
Analysis and countermeasures of driving force for changes of ecosystem
Analysis on Lugu Lake ecosystem services
15
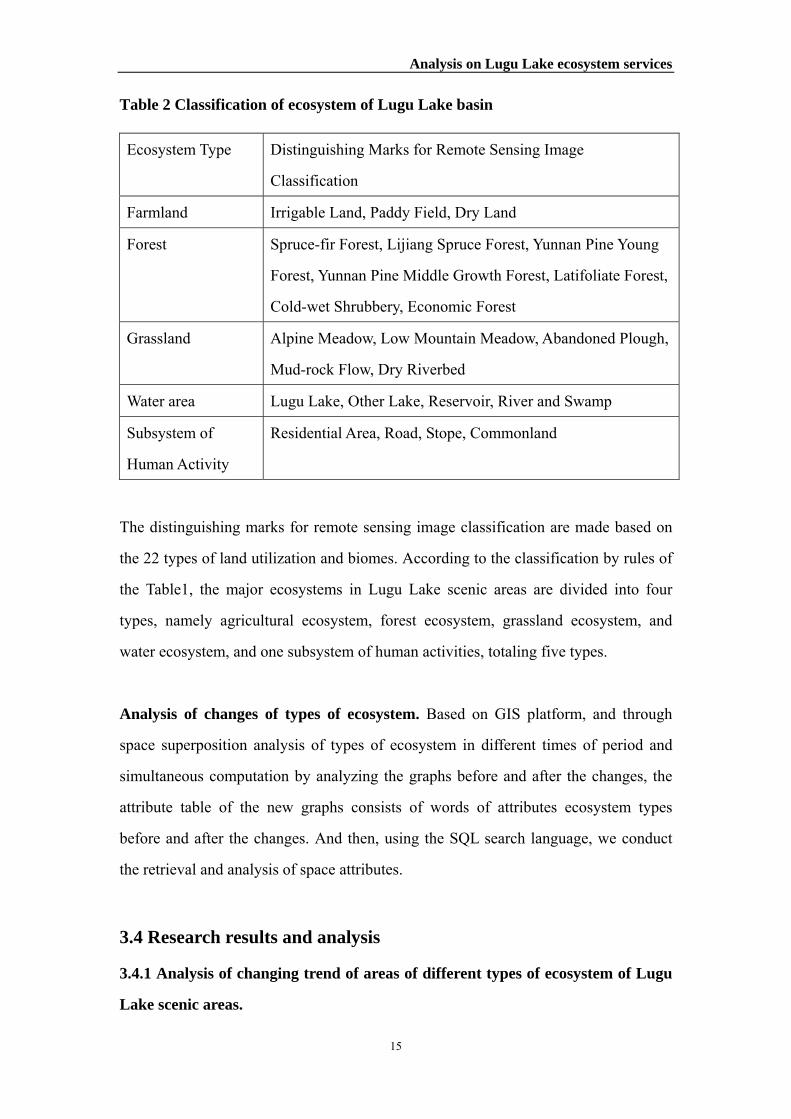
Table 2 Classification of ecosystem of Lugu Lake basin
Ecosystem Type Distinguishing Marks for Remote Sensing Image
Classification
Farmland Irrigable Land, Paddy Field, Dry Land
Forest Spruce-fir Forest, Lijiang Spruce Forest, Yunnan Pine Young
Forest, Yunnan Pine Middle Growth Forest, Latifoliate Forest,
Cold-wet Shrubbery, Economic Forest
Grassland Alpine Meadow, Low Mountain Meadow, Abandoned Plough,
Mud-rock Flow, Dry Riverbed
Water area Lugu Lake, Other Lake, Reservoir, River and Swamp
Subsystem of
Human Activity
Residential Area, Road, Stope, Commonland
The distinguishing marks for remote sensing image classification are made based on
the 22 types of land utilization and biomes. According to the classification by rules of
the Table1, the major ecosystems in Lugu Lake scenic areas are divided into four
types, namely agricultural ecosystem, forest ecosystem, grassland ecosystem, and
water ecosystem, and one subsystem of human activities, totaling five types.
Analysis of changes of types of ecosystem. Based on GIS platform, and through
space superposition analysis of types of ecosystem in different times of period and
simultaneous computation by analyzing the graphs before and after the changes, the
attribute table of the new graphs consists of words of attributes ecosystem types
before and after the changes. And then, using the SQL search language, we conduct
the retrieval and analysis of space attributes.
3.4 Research results and analysis
3.4.1 Analysis of changing trend of areas of different types of ecosystem of Lugu
Lake scenic areas.
Analysis on Lugu Lake ecosystem services
16
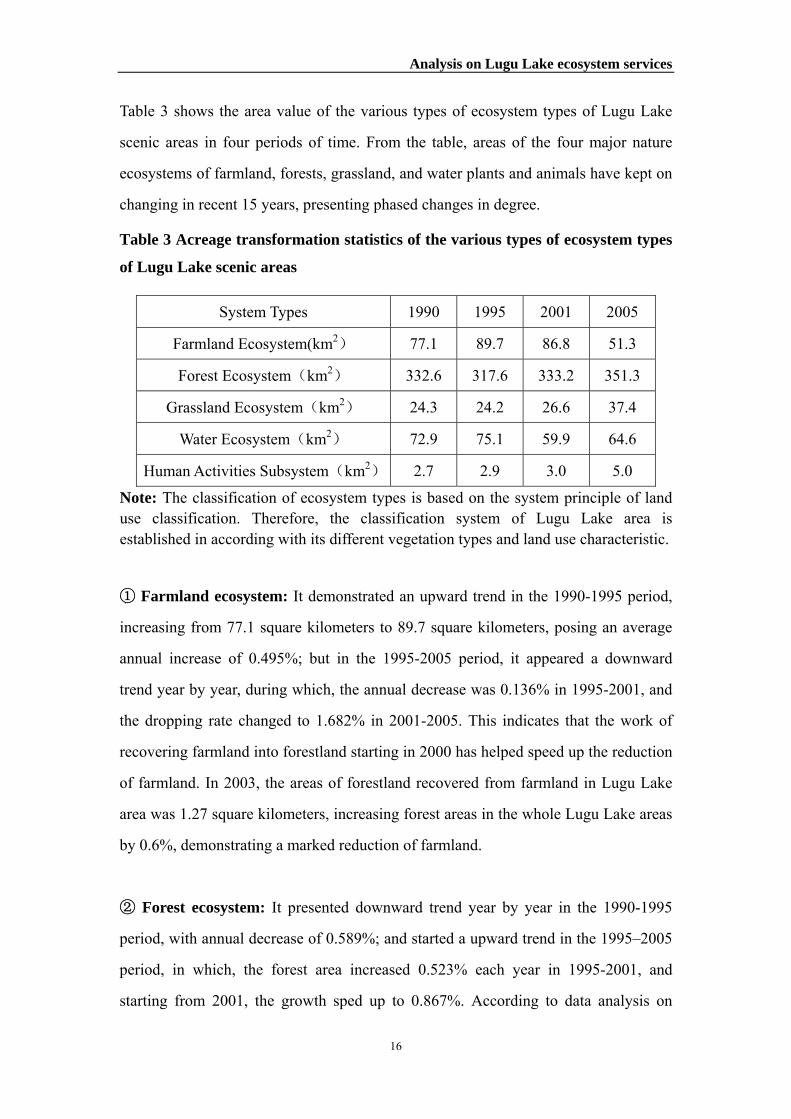
Table 3 shows the area value of the various types of ecosystem types of Lugu Lake
scenic areas in four periods of time. From the table, areas of the four major nature
ecosystems of farmland, forests, grassland, and water plants and animals have kept on
changing in recent 15 years, presenting phased changes in degree.
Table 3 Acreage transformation statistics of the various types of ecosystem types
of Lugu Lake scenic areas
System Types 1990 1995 2001 2005
Farmland Ecosystem(km2) 77.1 89.7 86.8 51.3
Forest Ecosystem(km2) 332.6 317.6 333.2 351.3
Grassland Ecosystem(km2) 24.3 24.2 26.6 37.4
Water Ecosystem(km2) 72.9 75.1 59.9 64.6
Human Activities Subsystem(km2) 2.7 2.9 3.0 5.0
Note: The classification of ecosystem types is based on the system principle of land use classification. Therefore, the classification system of Lugu Lake area is established in according with its different vegetation types and land use characteristic.
① Farmland ecosystem: It demonstrated an upward trend in the 1990-1995 period,
increasing from 77.1 square kilometers to 89.7 square kilometers, posing an average
annual increase of 0.495%; but in the 1995-2005 period, it appeared a downward
trend year by year, during which, the annual decrease was 0.136% in 1995-2001, and
the dropping rate changed to 1.682% in 2001-2005. This indicates that the work of
recovering farmland into forestland starting in 2000 has helped speed up the reduction
of farmland. In 2003, the areas of forestland recovered from farmland in Lugu Lake
area was 1.27 square kilometers, increasing forest areas in the whole Lugu Lake areas
by 0.6%, demonstrating a marked reduction of farmland.
② Forest ecosystem: It presented downward trend year by year in the 1990-1995
period, with annual decrease of 0.589%; and started a upward trend in the 1995–2005
period, in which, the forest area increased 0.523% each year in 1995-2001, and
starting from 2001, the growth sped up to 0.867%. According to data analysis on

Analysis on Lugu Lake ecosystem services
17
protection projects of natural forest resources of Ninglang County, the county stopped
tree cutting of natural forests completely in 1999, completed man-made forests of 7.2
square kilometers, and artificial regeneration of natural forests of 118.5 square
kilometers and close-up hillsides to livestock grazing and fuel gathering to facilitate
afforestation covering an area of 184.57 square kilometers. All the efforts have added
forestlands totaling 382.6 square kilometers, accounting for 10.1% of the original
forest areas of 2,847.7 square kilometers. Protection of natural forests and recovering
farmland into forestland has become the main sources for helping forest ecosystem
grow strong.
③ Grassland ecosystem: It went downward turn year by year in the 1990-1995
period, with annual decrease of 0.002%, but started increasing year by year in the
1995-2005 period, in which, the annual growth in 1995-2001 was 0.089%, and
starting from 2001, the growth sped up to 0.515%. The same is as the forest
ecosystem. The protection of natural forests and recovering farmland into forestland
and grassland were the main force in increasing the areas of grassland ecosystem.
④ Water ecosystem: It demonstrated upward turn year by year in the 1990-1995
period, with annual increase of 0.087%, but started downward trend in the 1995-2001
period, with annual decrease of 0.498%. The decrease was mainly attributed to
watercourse renovation of the Kaiji River in Yongning Township starting from 1995,
which reduced the water area of flood land sharply. But, starting from 2001, the water
areas have maintained an average annual growth of 0.228% because of large amounts
of waterweed piling up at the outlets of the wetland, which have helped raise the
water level and increase the water area.
⑤ Human activities subsystem: One thing needs to be clear the human activities
subsystem refers to the human activities in Lugu lake basin. It has kept on rising year
by year in recent 15 years, and shown sign of speeding up the rises. In particular, the
annual growth in the 2001-2005 period reached 0.094%. With the consistent

Analysis on Lugu Lake ecosystem services
18
improvement of people’s life and development of tourism industry, areas of
newly-built roads and houses have made continuous increases in the area.
3.4.2 Comparison analysis of changes in areas of ecosystem in Lugu Lake scenic
areas and the surrounding areas
The Table 4 shows the areas of various types of ecosystem of Lugu Lake scenic areas
and the surrounding areas in four periods of time. The table indicates that the areas of
the different types of the ecosystem in the surrounding areas of Lugu Lake have made
the similar changes in recent 15 years. Areas of farmland and waters ecosystem have
made continuous decreases, while areas of forest and grassland systems as well as
human activities subsystem have increased.
Comparing the changing trends in the scenic areas, there are big differences between
the two. From 1990 to 2005, the change rates of areas of farmland and waters
ecosystems in the scenic areas stood at –33.5% and –11.4%, while that of the
surrounding areas were –55,2% and -42.7%, respectively, indicating that the
decreasing intensity of areas of farmland and waters in the scenic areas is weaker than
that of the surrounding areas. But the increase of forest areas in the scenic area was
10.1% as against 5.6% in the surrounding areas; and the increase of grassland in the
scenic areas was 53.9% as compared with 23.3% in the surrounding areas. Areas of
human activities subsystem in the scenic areas increased 85.2%, and that of the
surrounding areas went up 552.7%, posing a gap of 6.5 times between the two. From
this point, the influence scope of human activities is comparatively steady in Lugu
Lake areas.
Table 4 Acreage transformation statistics of various types of ecosystem of
surrounding areas of Lugu Lake scenic areas
System types 1990 1995 2001 2005
Farmland Ecosystem(km2) 1072.2 749.1 977.4 480.5
Forest Ecosystem(km2) 6499.7 6879.8 6985.4 7153.6

Analysis on Lugu Lake ecosystem services
19
Grassland Ecosystem(km2) 482.9 383.9 539.4 595.2
Water Ecosystem(km2) 718.5 766.0 170.0 411.6
Human Activities Subsystem
(km2) 18.6 13.0 96.1 121.4
Note: This table lists four different periods’ acreage of various ecosystem types in surrounding areas of Lugu Lake. We can see that the acreage of various ecosystem types changed continually in recent 15 years. The acreage of farmland and water ecosystem continually diminished, and that of forest and grassland ecosystem and human activity subsystem aggrandized. 3.4.3 Analysis of area changing matrix of ecosystems in Lugu Lake scenic areas
in 1990-2005
By building the changing matrix of areas of ecosystems in the Lugu Lake scenic areas
from 1990 to 2005 (Table 5), we have made further analysis of various transformation
trends of major ecosystems in the areas. The analysis finds that the percentage of the
part remained unchanged in the four major ecosystems of farmland, forests, grassland
and waters in Lugu Lake scenic areas in recent 15 years are: 42.9%, 87.8%, 59.3%
and 94.2%, respectively, thus comes to the ranking of steadiness of the major
ecosystems in the areas are: waters, forests, grassland and farmland. At the same time,
the human activities subsystem performed in a very unstable form, with changed areas
accounting for 95.2% of the total.
Table 5 Changing matrix of areas of ecosystems in Lugu Lake scenic area from
1990 to 2005
2005
Ecosystem Types Farmland Forest Grassland Water Area
Human Activity
Subsystem
Farmland(km2) 21.67 3.88 1.71 0.17 0.26
Forest(km2) 18.61 320.12 11.11 2.04 0.48
Grassland(km2) 9.58 37.18 18.92 1.21 0.42
1
9
9
0
Water Area(km2) 0.15 2.91 0.03 55.48 0.04

Analysis on Lugu Lake ecosystem services
20
Human Activity
Subsystem(km2) 0.48 0.65 0.13 0.00 0.06
Note: During this 15-year, there are 5% of water ecosystem area transforming into woodland. These transformations, because of large-scale afforestation, mainly take place in original floodplain and swamp of river and lake. Investigation shows that walnuts were planted in most part of grass-ocean and swamp of Lugu Lake, Sichuan. These man-made transformations have many disadvantages. On one hand, because of high water table (average: 0.6m), unsuitable for growth of walnut, its economical benefit is hardly brought into play. On the other hand, the region was originally swamp ecosystem which has better function of ecosystem services, so man-made transformation into forest ecosystem will certainly decrease the function of the whole ecosystem.
Fig. 2, 3, 4 and 5 respectively show the direction and flow volume of inter-transition
of the farmland, forest, grassland and waters ecosystem. The comparative Fig. 2, 3
and 4 show that the inter-transition between farmland and forestland takes up the main
part of the changes in various types of ecosystems. Some 14% of farmland has been
turned into forestlands, while only 5.3% of the forestlands were recovered into
farmland, presenting a net increase of forestland by 8.7%. Meanwhile, the rate of
farmland turning into grassland was 6.2%, while that of grassland turning into
farmland was 14.2%, with increase of grassland areas by merely 8%. The
transformation rate among other types has not exceeded 2%. The changes in the
ecosystems in the areas are mainly taking place in the farmland, forestlands and
grassland. Under such situation, how to deal with the contradiction between farmland
and forestland, and between farmland and grassland is still a work of top priority in
management of ecosystems in the areas. The principles of giving priority to protection
of Lugu lake basin and maintaining the steadiness of the 95% of water areas and 88%
of forest areas are the foundation to secure the steadiness of the overall ecosystems in
the areas. Such proportion is 11% higher than the 77% of forestlands set by Ninglang
County when it was constructing the shelter belt for the Yangtze River in 1992,
showing that the local governments have attached great importance to the protection
of the scenic areas of Lugu Lake.

Analysis on Lugu Lake ecosystem services
21
Fig. 2 Flow volume proportion of farmland in 1990-2005 (%)
Fig. 3 Flow volume proportion of woodland in 1990-2005 (%)
Fig. 4 Flow volume proportion of grassland in 1990-2005(%)
14.2
55.2
1.8
0.6
0.0 10.0 20.0 30.0 40.0 50.0 60.0
Plough
Woodland
Water Area
Residential Area
5.3
3.2
0.6
0.1
0.0 1.0 2.0 3.0 4.0 5.0 6.0
Plough
Grassland
Water Area
Residential area
14.0
6.2
0.6
0.9
0.0 5.0 10.0 15.0
Woodland
Grassland
Water area
Residential area

Analysis on Lugu Lake ecosystem services
22
Fig.5 Flow volume proportion of water area in 1990-2005 (%)
0.3
5.0
0.0
0.1
0.0 1.0 2.0 3.0 4.0 5.0 6.0
Plough
Woodland
Grassland
Residential Area

The economic valuation of Lugu Lake ecosystem services
23
4. The economic valuation of Lugu Lake ecosystem
services
4.1 Overview
About special eco-system or a certain ecosystem type in a certain area, there are many
successful case of quantitive evaluation on its services. Although there are few
evaluations on river basins, the integrated ecosystems can be divided into several
different types of ecosystems to be analyzed. For the evaluation of Lugu Lake
ecosystem services, we calculate the amount of substances at the first step, then
calculate the value quantity based on price or project cost. The evaluation method
means combination of material and value quantity.
The following Table 6 illuminates the calculation method on service value of Lugu
Lake ecosystem. Combined with investigation data, we can quantitive calculate the
basin ecosystem services.
Table 6 Evaluation indices and methods of ecosystem services in Lugu Lake
basin
Ecosystems’
type
Evaluation Index
Forest
Ecosystem
Wetland
Ecosystem
Thereinto:
Lake
Agro
Ecosystem
Grassland
Ecosystem
Evaluation
Method
Production
Function
Product of Farming,
Forestry, Animal
Husbandry and Fishery √ √ √ √ √
Market Value
Method
Climate Control √ -- -- -- -- Shadow Price
Method
Absorb CO2(C
accumulating) √ √ -- √ √
Shadow Price
Method
Solid Conservation √ -- -- -- √ Opportunity
cost Method
Control
Function
Environment
Decontamination √ √ -- -- √
Cost-Benefit
Analysis
Techniques

The economic valuation of Lugu Lake ecosystem services
24
Nutrimental
Circulation √ -- -- -- √
Shadow Price
Method
Wind-breaking and
Sand-fixing √ -- -- -- √
Shadow Price
Method
Regulated Flow、
Nurturing Water
Source √ √ -- -- √
Substitution Engineering
Method
Flood Control and
Storage -- √ √ -- --
Shadow Price
Method
Water Source
Accumulation -- √ √ -- --
Substitution Engineering
Method
Water Purification -- √ √ -- --
Substitution Engineering
Method
Biodiversity √ √ √ √ √ Opportunity
Cost Method Support
Function Release O2 √ -- -- √ --
Shadow Price
Method
Cultural Diversity √ Contingent
Value Method
Eco-tourism √ Travel
Cost Method
Culture
Function
Eco-aesthetics、
Science Research √
Contingent
Value Method
Note:1、“--”Show there are no corresponding service functions, or couldn’t be evaluated by now.
2、The cultural function is shown together by all ecosystem.
4.2. Production Supply
The productions’ supply function of ecosystems services mainly includes the
productions of agriculture, forestry, livestock and fishery. For the area of Lugu Lake
basin, ecosystem services mainly provide plant productions produced by agro
ecosystem, fishery productions and domestic water supply produced by aquatic
ecosystem, livestock productions produced by grassland ecosystem and timber
productions and relative productions produced by forest ecosystem.
The total value of plant productions, fishery productions, livestock productions and

The economic valuation of Lugu Lake ecosystem services
25
timber and relative productions is calculated through the local first industry income
which presented in Table1, 1148.9×104 Yuan. The determination of timber productions
value was according to acreages of each type of forests and the stock volume of forest
for each type of forests which based on the investigation. The overall value of timber
productions is 5336.4×104 Yuan which is calculated by 5% enhancement per year of
standing volume of forest and multiplying per unit price of standing volume of forest
400 Yuan/ m3. For domestic water consumption, the total volume is 47.7×10⁴m3 per
year, which is calculated by the total volume of local residents’ water consumption
adding to the overall water consumption of travelers. The total volume for local
residents is the multiplying of the number of local residents, 13550 (In 2001, people
in Luoshui Village was 2950, in Lugu county was 10600) and per capita water
consumption 60L/d. For travelers’ water consumption, it is calculated by the number
of travelers which is based on the data of year 2004, 409 thousands/y and 2 days as
staying and visiting period in Lugu basin area, and per capita water usage, 220L (the
average per capita water consumption in city area in China). The total value of
domestic water supply is 477 thousand/y, based on the per unit water price is
1Yuan/m3.
Therefore, the overall value of ecosystems’ productions supply function is 65330
thousands Yuan in Lugu Lake basin area.
Table 7 Type of forests and stock volume of forest in Lugu Lake basin
Types of Forests Shrubs Economic Forest
Latifoliate Forest
Lijiang Spruce forest
Spruce-fir
forest
Yunnan Pine Young Forest
Yunnan Pine Middle
Growth ForestAcreage(hm2) 2921.3 456.9 3533.8 3225.1 243.9 1651.7 714.3
Per unit Stock volume of forest(m3/hm2)
70 70 331 240 400 150 200
Stock volume of forest(m3) 20.4 3.2 117.0 77.4 9.8 24.8 14.3
Source: The total value of plant productions, fishery productions, livestock productions and timber and relative productions is calculated through the local first industry income which presented in Table1

The economic valuation of Lugu Lake ecosystem services
26
4. 3 Regulation function
Regulation functions mainly including:climate regulation、Erosion control and soil
retention, conservation of water resource, wind prevention and sand fixation, soil
melioration, pollution alleviation and so on. These functions of ecosystems services
are significant to the improvement of eco-environment and maintenance of the
ecological balance.
4.3.1 Soil conservation
According to universal soil loss equation (USLE) to count:
A = R·K·LS·C·P
Where,A:Average annual erosion in field sized area(t/hm2.a);
R:Rainfall-runoff (erosivity) factor(Ft.T.In/A.h);
K:Soil erodibility factor;
LS:Topographic factors (L represent slop length, S represent slop
gradient)
C:Crop type factor;
P:Soil conservation practice factor
As for potential soil erosion factor(AP), the cover and management factor and soil
conservation practice factor do not need to be considered in the calculations, so C=1,
P=1,
Therefore:
AP= R·K·LS
As actual soil erosion factor(Ar), the crop type factor and soil conservation practice
factor should be considered in the count,
Therefore:
Ar= R·K·LS·C·P
The Volume of soil conservation is:Ac= AP - Ar
① Determination for R

The economic valuation of Lugu Lake ecosystem services
27
Equation provided by Fujina Zhou Yan Huang et al (Fujian Zhou et al, 1995), which is
based on the experimental data in southern China, to determine the value of R was
used in this paper. The monthly precipitation was considered in this equation. This
equation is adaptive to geographical environment in Southern China.
Where, R: Rainfall-runoff (erosivity) factor(Ft.T.In/A.h)
Pi: Monthly precipitation (mm)
Based on the statistical data of monthly precipitation in Lugu Lake basin between the
year 1971 and 2004 from the Weather Bureau of Ninglang county, the average
monthly precipitation was calculated. Using previous equation, the value of R was
149.69.
② Determination for K
The characteristics and the proportion of organic matter were acquired through the
materials of soil investigation, and then found the value of K from Nomogram which
was set up by Wischmeier et al, US.
Table 8 The value of soil erodibility factor (K) in USLE
Proportion of organic matter(%)
Proportion of organic matter(%) Characteristics
of Soil 0.5 2 4
Characteristics of Soil
0.5 2 4 Sand 0.11 0.07 0.04 Loam 0.85 0.76 0.65
Fine Sand 0.36 0.31 0.22 Silt loam 1.08 0.94 0.74 Extreme fine
sand 0.94 0.81 0.63 Silt 1.34 1.16 0.94
Loamy Sand 0.27 0.22 0.18 Sandy Clay Loam 0.60 0.56 0.47
Loamy Fine Sand 0.54 0.45 0.36 Clay Loam 0.63 0.56 0.47
Loamy Extreme Fine
0.99 0.85 0.67 Silty Clay Loam 0.83 0.72 0.58
12
1
( 1.5527 0.1792 )ii
R P=
= − +∑

The economic valuation of Lugu Lake ecosystem services
28
Sand Sandy Loam 0.60 0.54 0.43 Sand Clay 0.31 0.29 0.27 Fine Sandy
Loam 0.78 0.67 0.54 Silty Clay 0.56 0.52 0.43
Extreme Fine Sandy Loam 1.05 0.92 0.74 Clay 0.65 0.47 0.29
Note: The characteristics and the proportion of organic matter were acquired through the materials of soil investigation, and then found the value of K from Nomogram which was set up by Wischmeier et al, Wischmeier (1969) measured soil erodibility index in simulated rainfall experiment;
Determinati③ on for LS
Based on the equation set up by Fujian Zhou Yanhe Huang et al, the dimensional
distribution characteristics of LS can be obtained.
LS=0.08λ0.35α0.6
Where,λ:Slope Length(m);
α:Percentage Slope
④ Determination for C
Crop type factor is used to determine the relative effectiveness of soil and crop
management systems in terms of preventing soil loss, which is related to the land use
pattern and coverage density closely. Using the different vegetation pattern from
investigation and relative average coverage density to find the value of C of different
patterns of vegetation is found from the Table of Value C in USLE (Wanzhong Wang
et al, 1996).
Table 9 The value of C of different patterns of vegetation in USLE
Ration of coverage(%) 0 20 40 60 80 100
Meadow 0.45 0.24 0.15 0.09 0.043 0.011 Shrubs 0.40 0.22 0.14 0.085 0.040 0.011 Mixed Arbor and Shrub 0.39 0.20 0.11 0.06 0.027 0.007
Flourish Forest 0.10 0.08 0.06 0.02 0.004 0.001

The economic valuation of Lugu Lake ecosystem services
29
Source: Wanzhong Wang, Juying Jiao 1996, Quantitive evaluation research on China’s soil erodibility factor, Journal of Water and Soil Conservation, 16(5): 1-20.
⑤ Determination for P
The P value is 0.15 in paddy field. Other land use patterns do not be implemented in
any methods for soil conservation, so the value should be 1.00.
Table 10 The calculation results of amount of soil conservation in Lugu Lake
Biomes Sub-biomes Acreage * (hm2)
Amount of soil
conservation (t)
Amount of soil per unit area (t/ hm2)
Meadow Land
Meadow land 869.4 22302 25.7
Farmland Dry Land 903.8 13869 15.3 Farmland Paddy Field 52.0 639 12.3
Forest Shurbs 2921.3 96945 33.2
Forest Economic Forest 456.9 6572 14.4
Forest Broad Leaf Forest 3533.8 106886 30.2
Forest Lijiang Spruce Forest
3225.1 65456 20.3
Forest Spruce-fir Forest 243.9 5779 23.7
Forest Yunnan Pine Young Forest 1651.7 35032 21.2
Forest
Yunnan Pine Middle Growth Forest
714.3 16555 23.2
Total 14572.3 370036 25.4 Note:* Based on USLE,the amount of soil erosion can not be calculate when the value of slope is zero, so the total acreages in the table do not include the acreage with zero slope.
Based on the investigation, the depth of surface soil is 0.36m in farmland (dry land) in
Lugu Lake basin and soil density is 1.44t/m3. The amount of soil conservation

The economic valuation of Lugu Lake ecosystem services
30
converting into the acreages of farmland is 71.4hm2. Local per unit of acreage (Mu)
crop yield is 200 kilograms and per unit price is 1.6 Yuan (average price in 2004 in
China), so the value of the soil conservation is 34.3×10⁴Yuan/a in Lugu Lake basin.
4.3.2 Conservation of water resource
This study used the water storage effect of forest ecosystem to measure the
amount of water conservation in forest ecosystem, namely, method of rainwater
containment.
Q = A·J·R/1000
Where:
Q: The amount of increasing water conservation in forest ecosystem, compared
to the quantity of bare land (104t);
A: The acreage of study area (hm2);
J: Average annual precipitation which produce runoff in study area (the
precipitation at one time is >20mm);
R: The effect index of water conservation in forest ecosystem, compared to
bare land.
Based on the materials supplied by weather bureau of Ninglang county, the amount of
average annual precipitation (1971-2004) in Lugu Lake Basin was 939.3mm, and the
amount of precipitation which produced runoff was 318.9mm.
Determination for R: Subtropical evergreen broad-leaved forest 0.39;
Subtropical evergreen coniferous forest 0.36;
Subtropical evergreen-deciduous broad-leaved mixed forest 0.34
Alpine meadow 0.25
Wetland 0.40
The value of water conservation in each type ecosystem in Lugu lake basin was
showed in Table 11. The value of water conservation was calculated by replacement
cost technique, namely, evaluation through reservoir construction cost (0.67Yuan·m-3,

The economic valuation of Lugu Lake ecosystem services
31
at 1990s’ constant price). The evaluation results of value of water conservation in
Lugu lake basin were showed in Table 11.
Table 11 Calculation results of water conservation in Lugu Lake basin
Biomes Sub-biomes Acreage(hm2)
R
Amount of water
conservation(104t/a)
Value (104Yuan/a)
Meadow ecosystem Meadow 1296.1 0.25 103.3 69.2
Forest ecosystem shrub 4001.9 0.34 433.9 290.7 Forest ecosystem
Economic Forest 838.2 0.34 90.9 60.9
Forest ecosystem
Broad-leaved Forest 4369.8 0.39 543.5 364.1
Forest ecosystem
Lijiang Spruce Forest
4129.5 0.36 474.1 317.6
Forest ecosystem
Yanna Fir Forest 255.9 0.36 29.4 19.7
Forest ecosystem
Yong aged Yunnan Pine
Forest 2018 0.36 231.7
155.2 Forest ecosystem
Middle aged Yunna Pine
Forest 896.5 0.36 102.9
68.9 Aquatic system Wetlands 459.5 0.40 58.6 39.3
Total 25288.9 - 2068.3 1385.8 Note: R from Tongqian Zhao The research of terrestrial ecosystem servicess function and its value evaluation Thesis for applying doctor’s degree in graduate school China Academy of Sciences
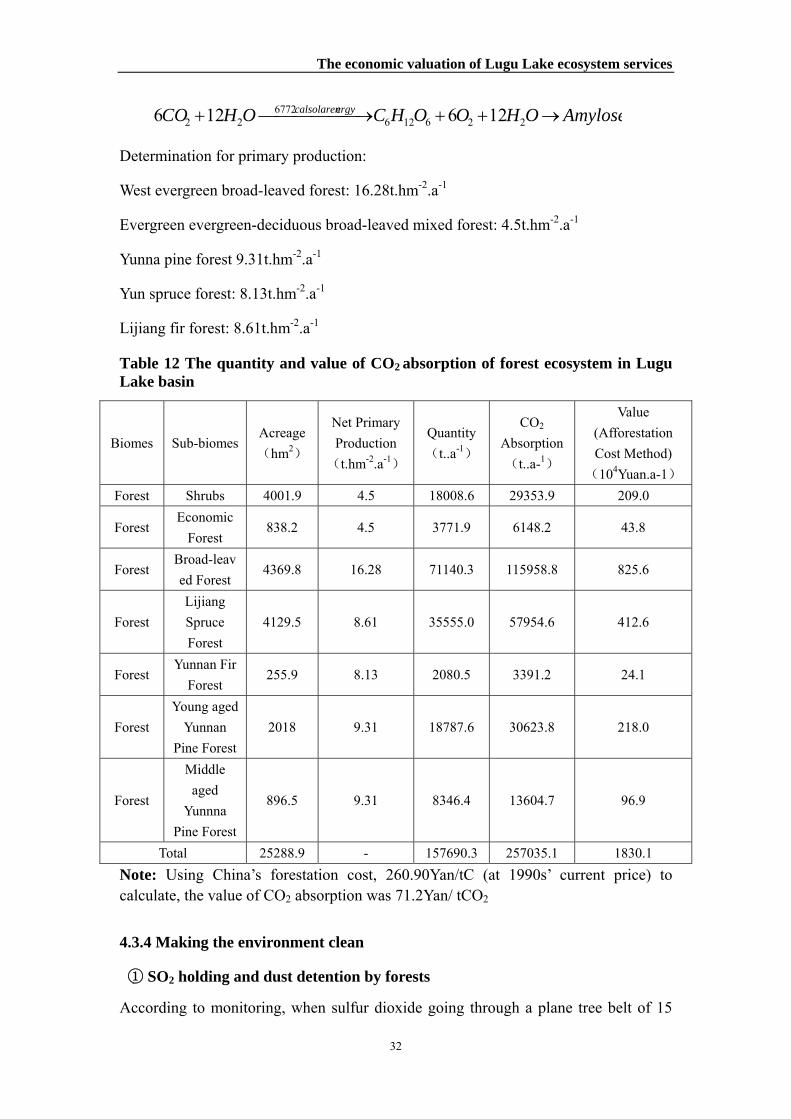
4.3.3 CO2 absorption
Based on data of primary production on different types of forest from other researches,
for forest, the amount of CO2 absorption and O2 release was calculated by following
equation, namely, 1gram dry vegetation dry matter needs 1.63grams CO2 to produce
1.2gramsO2
The economic valuation of Lugu Lake ecosystem services
32
AmyloseOHOOHCOHCO ergycalsolaren →++⎯⎯⎯⎯⎯ →⎯+ 2261266772
22 126126
Determination for primary production:
West evergreen broad-leaved forest: 16.28t.hm-2.a-1
Evergreen evergreen-deciduous broad-leaved mixed forest: 4.5t.hm-2.a-1
Yunna pine forest 9.31t.hm-2.a-1
Yun spruce forest: 8.13t.hm-2.a-1
Lijiang fir forest: 8.61t.hm-2.a-1
Table 12 The quantity and value of CO2 absorption of forest ecosystem in Lugu Lake basin
Biomes Sub-biomesAcreage (hm2)
Net Primary Production
(t.hm-2.a-1)
Quantity (t..a-1)
CO2 Absorption (t..a-1)
Value (Afforestation Cost Method)
(104Yuan.a-1)Forest Shrubs 4001.9 4.5 18008.6 29353.9 209.0
Forest Economic
Forest 838.2 4.5 3771.9 6148.2 43.8
Forest Broad-leaved Forest
4369.8 16.28 71140.3 115958.8 825.6
Forest Lijiang Spruce Forest
4129.5 8.61 35555.0 57954.6 412.6
Forest Yunnan Fir
Forest 255.9 8.13 2080.5 3391.2 24.1
Forest Young aged
Yunnan Pine Forest
2018 9.31 18787.6 30623.8 218.0
Forest
Middle aged
Yunnna Pine Forest
896.5 9.31 8346.4 13604.7 96.9
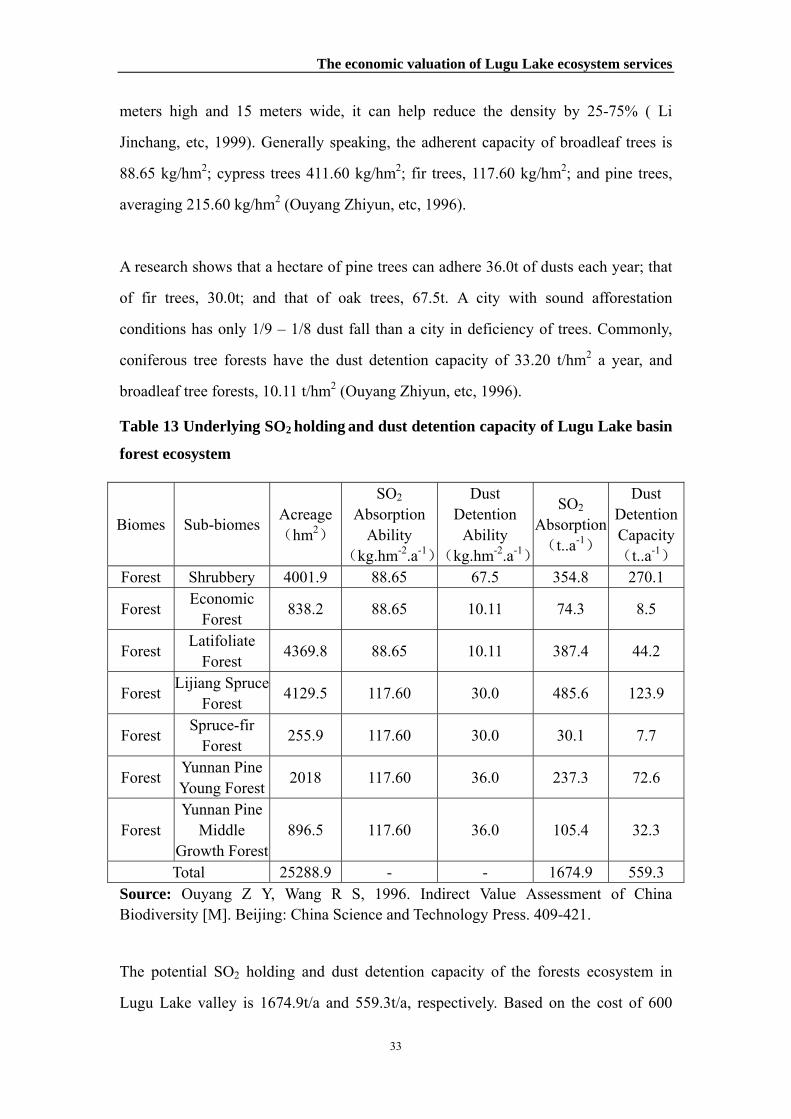
Total 25288.9 - 157690.3 257035.1 1830.1 Note: Using China’s forestation cost, 260.90Yan/tC (at 1990s’ current price) to calculate, the value of CO2 absorption was 71.2Yan/ tCO2 4.3.4 Making the environment clean
① SO2 holding and dust detention by forests
According to monitoring, when sulfur dioxide going through a plane tree belt of 15
The economic valuation of Lugu Lake ecosystem services
33
meters high and 15 meters wide, it can help reduce the density by 25-75% ( Li
Jinchang, etc, 1999). Generally speaking, the adherent capacity of broadleaf trees is
88.65 kg/hm2; cypress trees 411.60 kg/hm2; fir trees, 117.60 kg/hm2; and pine trees,
averaging 215.60 kg/hm2 (Ouyang Zhiyun, etc, 1996).
A research shows that a hectare of pine trees can adhere 36.0t of dusts each year; that
of fir trees, 30.0t; and that of oak trees, 67.5t. A city with sound afforestation
conditions has only 1/9 – 1/8 dust fall than a city in deficiency of trees. Commonly,
coniferous tree forests have the dust detention capacity of 33.20 t/hm2 a year, and
broadleaf tree forests, 10.11 t/hm2 (Ouyang Zhiyun, etc, 1996).
Table 13 Underlying SO2 holding and dust detention capacity of Lugu Lake basin
forest ecosystem
Biomes Sub-biomes Acreage(hm2)
SO2
Absorption Ability
(kg.hm-2.a-1)
Dust Detention
Ability (kg.hm-2.a-1)
SO2
Absorption (t..a-1)
Dust Detention Capacity(t..a-1)
Forest Shrubbery 4001.9 88.65 67.5 354.8 270.1
Forest Economic Forest 838.2 88.65 10.11 74.3 8.5
Forest Latifoliate Forest 4369.8 88.65 10.11 387.4 44.2
Forest Lijiang Spruce Forest 4129.5 117.60 30.0 485.6 123.9
Forest Spruce-fir Forest 255.9 117.60 30.0 30.1 7.7
Forest Yunnan Pine Young Forest 2018 117.60 36.0 237.3 72.6
Forest Yunnan Pine
Middle Growth Forest
896.5 117.60 36.0 105.4 32.3
Total 25288.9 - - 1674.9 559.3 Source: Ouyang Z Y, Wang R S, 1996. Indirect Value Assessment of China Biodiversity [M]. Beijing: China Science and Technology Press. 409-421.
The potential SO2 holding and dust detention capacity of the forests ecosystem in
Lugu Lake valley is 1674.9t/a and 559.3t/a, respectively. Based on the cost of 600

The economic valuation of Lugu Lake ecosystem services
34
Yuan·t-1·a-1 for investment and disposal of sulfur dioxide and the cost of 170
Yuan·t-1·a-1 for operation of dust removing, the value of the potential SO2 holding and
dust detention capacity of Lugu Lake forests ecosystem is estimated at 100.5 x 10⁴
Yuan/a and 9.5 x 10⁴ Yuan/a, respectively.
② Degradation of obsolescence on grassland
In the process of animal herding, large amounts of excretion are left allover the
grasslands, which will be degraded under the joint roles of weathering, drenching,
biological fragmenting and microbial decomposition, and their nutrients return to the
grasslands. Such function avoids large amounts of animal excretion from storing up,
playing an important role in maintaining the function and performance of the
grassland ecosystem.
The evaluation of the degrading capability and nutrient returning function of animal
excretion in the grassland ecosystem is made through estimation of aggregate
nutrients in sample part of grasslands and animal excretion on the grasslands of Lugu
Lake areas. The following is the formula we used in the physical quantitative
evaluation:
2 3
1 1i i j i j
i jG W rλ ω
= =
= ⋅ ⋅∑ ∑
In the formula, G refers to the aggregate returned nutrient matters from the
degradation of the obsolescence, λ refers to the proportion of animal excreta returning
to the grassland, i, j refer to types of livestock (cattle, horse and sheep) and types of
nutrients (N、P2O5) respectively, Wi refers to the different carrying capacity of cattle,
horse and sheep collected from the grassland, rij refers to the quantities of excreta of
different types of livestock, and ωij refers to the average contents of nutrient elements
of excreta of different types of livestock.
By using the shadow price method in magnitude of value, we has made evaluation of
ecological economic value of the degradation of obsolescence matters and nutrient

The economic valuation of Lugu Lake ecosystem services
35
returning function in the grassland ecosystem based on the average price of chemical
fertilizer in China. According to a test (Zeng Zhengdong, etc, 1996), the average daily
excreta of each cow is 25kg, with the proportion of excrement and urine standing at
3:2. The excreta of sheep are 0.53 – 0.71 kg in dry volume ·d -1 (Wang Shiping, etc,
2000). According to a research conducted by Jiang Lihong (1997) in cooperation with
others in Ewenki Autonomous Banner in North China’s Inner Mongolia, based on the
calculation of dry matter voluem, the organic content of cow excrement is 88.3%, the
N content, 1.5%, and P2O50.7%. The organic content of sheep pen excrement is
90.8%, the N content, 2.4%, and P2O50.7%. The organic content of horse stable is
87.6%, the N content, 2.0%, and P2O50.9%. Based on such calculation, each cow and
horse empties N36.6kg, and P2O5012.8kg each year, and each sheep, N6.2kg and
P2O52.8kg.
According to a survey, the total number of cattle and horses in various villages in
Lugu Lake areas was 24,211 heads in 2001, and that of sheep was 6,392. Supposing
that the returning rate of animal excreta to the grassland is 0.4%, the physical volume
of obsolescence degradation and nutrient returning function in the grassland
ecosystem in Lugu lake basin shall be N 370.3 tons, and P2O5131.1 tons. Based on the
average price of chemical fertilizer in China of 2,549 Yuan·t -1 (Drafting group of the
Research Report on Biological Diversification in China, 1997), the value of
obsolescence degradation and nutrient returning function in the grassland ecosystem
is 127.8 x 10⁴ Yuan/a.
③ Purification of lake water
Lake has the capability of self-purification to remove various pollutants in the water.
Currently, we can hardly make any evaluation on the pollutant removing function and
efficiency as there have been no sufficient systematic studies on the subject. Our
research tries to reflect purifying function and value of water systems by conducting
research on the removing efficacy of nitrogen (N) and phosphorus (P) of lakes. With
reference to the per unit N and P removing function of the Erhai Lake and Qionghai
Lake (Table 14), the potential N and P purifying capability of Lugu Lake is estimated

The economic valuation of Lugu Lake ecosystem services
36
at N105.3t/a, p22.55t/a, and the N and P purifying capacity of Lakes can be evaluated
in accordance with the disposal cost of household sewage of N1.5 Yuan·kg-1 and P 2.5
Yuan·kg-1. The evaluation result is that the efficiency of N and P purifying capability
of Lugu Lake is 21.4 x 10⁴ Yuan /a.
Table 14 N&P’s cleaning by Erhai Lake and Qionghai Lake in
Yunnan-Kweichow Plateau
Lake Name
Acreage (km2)
Cleaning N
(t.a-1)
Cleaning P
(t.a-1)
N’s Cleaning Ability
(t.km-2.a-1)
P’s Cleaning Ability
(t.km-2.a-1)
Erhai 250 678.6 90.3 2.7 0.4
Qionghai 31 103.21 15.56 3.3 0.5
Notes: The data is obtained from project“Studies on Sustainable development of Lugu Lake Basin ”.
4.3.5 Cycle of nutrient matters
According different N, P, K contents of forest-type plants (Table 15) and net primary
productivity, the holding volume of such N, P, K nutrients can be reckoned up.
Table 15 Plant body nutriment content
Plant Body Nutriment Content Categorie
s Sub-categories Acreage
(hm2)
Net Elementary Productivity(t.hm-2.a-1)
N % P % K % P2O5%
Forest Shrubbery 4001.9 4.5 0.456 0.032 0.221 0.073 Forest Economic Forest 838.2 4.5 0.456 0.032 0.221 0.073 Forest Latifoliate Forest 4369.8 16.28 0.531 0.042 0.201 0.096
Forest Lijiang Spruce Forest 4129.5 8.61 0.33 0.036 0.231 0.082
Forest Spruce-fir Forest 255.9 8.13 0.33 0.036 0.231 0.082
Forest Yunnan Pine Young Forest 2018 9.31 0.400 0.085 0.227 0.195
Forest Yunnan Pine
Middle Growth Forest
896.5 9.31 0.400 0.085 0.227 0.195
Total - Source: Zhao Tongqian. The Research of Terrestrial Ecosystem services Function

The economic valuation of Lugu Lake ecosystem services
37
and Its Value Evaluation. Thesis for Applying Doctor’s Degree in Graduate School China Academy of Sciences Through computation, the cyclic volume of nutrient matters of the forest ecosystem of
Lugu Lake areas is estimated at N 709.8t/a、P2O5168.0t/a,K339.7t/a. By adopting the
shadow price method, and estimating the average price of chemical fertilizer in China
standing at 2,549 Yuan/t, the value of nutrient matters of the forest ecosystem of Lugu
Lake areas is 310.3 x 10⁴ Yuan/a.
4.3.6 Water volume regulation and storage
① Flood regulating
Lugu Lake’s water area for an average year is 50.1 square kilometers, and annual
changing range of water level is 0.7-0.1m, and the amount of dynamic reserve is
0.351-0.50×10⁸m3, averaging 0.426x 10⁸m3. .
The marshland area of the lake area is 5.9 square kilometers. Reckoning the highest
inundating depth of 1.0 meters in the flood period, the flood storage capacity is 0.059
x 104 m3.
② Storage of water resources
Total water storage of Lugu Lake (including the water storage of the marshland), is
22.52 x 10⁸m3..
By using the substitute engineering method to reckon up the value of the water
regulating and storage function of Lugu Lake, the total value is 15.4 x 10⁸ Yuan·a-1 by
taking the cost of reservoir water storage as 0.67 Yuan·m-3.
4.4 Supporting function
Supporting function is an essential basic function for ensuring other ecosystems to
provide their service functions. As it is different from the supply, and regulating
functions of a product and cultural service, the supporting function exerts indirect
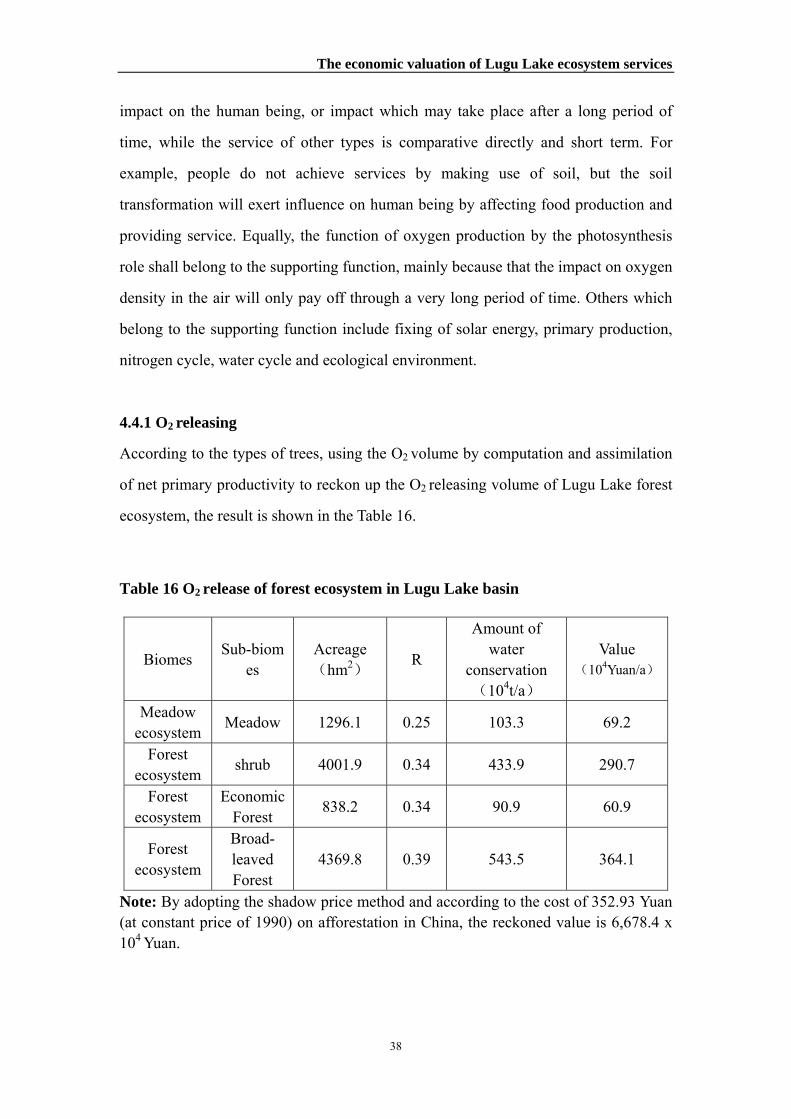
The economic valuation of Lugu Lake ecosystem services
38
impact on the human being, or impact which may take place after a long period of
time, while the service of other types is comparative directly and short term. For
example, people do not achieve services by making use of soil, but the soil
transformation will exert influence on human being by affecting food production and
providing service. Equally, the function of oxygen production by the photosynthesis
role shall belong to the supporting function, mainly because that the impact on oxygen
density in the air will only pay off through a very long period of time. Others which
belong to the supporting function include fixing of solar energy, primary production,
nitrogen cycle, water cycle and ecological environment.
4.4.1 O2 releasing
According to the types of trees, using the O2 volume by computation and assimilation
of net primary productivity to reckon up the O2 releasing volume of Lugu Lake forest
ecosystem, the result is shown in the Table 16.
Table 16 O2 release of forest ecosystem in Lugu Lake basin
Biomes Sub-biomes
Acreage (hm2) R
Amount of water
conservation (104t/a)
Value (104Yuan/a)
Meadow ecosystem Meadow 1296.1 0.25 103.3 69.2
Forest ecosystem shrub 4001.9 0.34 433.9 290.7
Forest ecosystem
Economic Forest 838.2 0.34 90.9 60.9
Forest ecosystem
Broad- leaved Forest
4369.8 0.39 543.5 364.1
Note: By adopting the shadow price method and according to the cost of 352.93 Yuan (at constant price of 1990) on afforestation in China, the reckoned value is 6,678.4 x 104 Yuan.
The economic valuation of Lugu Lake ecosystem services
39
4.4.2 Maintaining biological diversification
It is of great importance to maintain the biological diversification of Lugu Lake areas,
forests and marshlands. The value of the function is calculated by areas in
combination of the result of the research on the value of maintaining the biological
diversification of forests and marshlands in China made by Zhao Tongqian (2004).
According to the research result of Zhao, the total value of the function of maintaining
the biological diversification of ecosystem in nature reserves of the national forest
ecosystem is 495.94 x 10⁸ Yuan·a-1. The service function of marshlands in the country
in providing habitats or “asylum” for birds and animals creates ecological efficiency
amounting to 341.5 x 10⁸ Yuan·a-1 each year. China’s area of nature reserves of forest
ecosystem is 3028.95 x 104hm2, and that of marshlands, 93,972.7 km2.
According to the areas of 2.53 x 10⁴hm2 of the nature reserves of the forest ecosystem
of Lugu Lake and that of 5.9 km2 of marshlands, the aggregate value in the areas is
estimated ate 4,356 x 104 Yuan by maintaining the biological diversification.
4.5 Cultural tourism function
The cultural tourism function refers to non-material benefits gained by people from
ecosystem through moral feeling, knowledge learning, objective impression,
entertainment and recreation and aesthetic experience, which mainly include
diversified national culture, moral and religious value, social relations, knowledge
system (traditional and tangible ones), education value, inspiration, aesthetic value
and value of cultural heritage, which have their distinctive features and formed and
developed on the basis of the forest ecosystem. The cultural tourism value of Lugu
Lake areas can be divided into two of tourism value and cultural value.
The tourism value mainly concentrated on the income from tourist admission tickets.
Lugu lake basin received a total of 409,000 tourists in 2004, with ticket income hitting
7.50 million Yuan. According to the Outline of the General Plan of Scenic Spots in

The economic valuation of Lugu Lake ecosystem services
40
Lugu Lake areas drafted by the China Urban Planning and Designing Institute
entrusted jointly by the Government of the Yi Autonomous County of Ninglang and
the YanYuan County Government, the ideal tourist scale of Lugu Lake areas is
estimated at 600,000 persons a year. According to the number of tourist admission
tickets sold and the number of tourists they received in 2004, the potential admission
ticket income of the areas may reach 11 million Yuan.
It is difficult to evaluate the cultural value by using the market value. Our research
makes indirect evaluation of the cultural value by using the method of payment
intention. According to a questionnaires survey, the intended payment of tourists for
protection of the local Mosuo traditional culture is 22 Yuan/person/time. Based on
such payment intention and the ideal scale of tourists of 600,000 a year, the cultural
value of the ecosystem services of Lugu Lake areas is estimated at 13.20 million
Yuan/year. So, the total value of both the cultural and tourism functions of the
ecosystems of the areas shall be 24.20 million Yuan/year.
4.6 Analysis of findings of the questionnaire survey on tourism value
of Lugu Lake by tourists
Among the 70 effective questionnaires papers from tourists, in response to the
question of what attract tourists most in Lugu Lake scenic areas, 80% ticked natural
scenery, 70% for local folkways, 20% for religious culture, and 3% held that the
history of Mosuo people is the main aspect in attracting tourists.
For selection of the most attractive things for tourists in Lugu Lake areas, 47% of the
tourists chose natural scenery, 20% selected local folkways and religious culture, and
33% ticked several items of natural scenery, local folkways and religious culture. This
indicates that it is very important to protect the ecological environment in the process
of development of tourism in the scenic areas of Lugu Lake.
As development of tourism may exert impact on local traditions and folkways, 84% of

The economic valuation of Lugu Lake ecosystem services
41
the survey tourists held that it is necessary to take measures to protect the traditional
culture of the Mosuo people, only 11% said not necessary, and 5% gave no answers.
Some 86% of the tourists said that the areas should restrict the numbers of tourists in a
bid to provide better protection of the ecological environment of Lugu Lake scenic
areas. Among those selecting restricting the number of tourists, 70% held that the
areas shall set maximum limit for number of tourists each day. In addition, 6%
suggested hikes of prices of admission tickets, and 11% of them mane unclear
answers or kept the column blank.
Development of tourism may bring about influence on the ecological environment of
Lugu Lake. 83% of the survey tourists held that deterioration of the lake ‘s ecological
environment would bring about big and very big impact on the tourism value of the
lake, only 16% said that there would be small or no impact, and 4% gave no answers.
But among tourists who said the deterioration of ecological environment would have
little or no impact on the tourism value of the lake, most of them held that the main
reasons attracting tourists to Lugu Lake are the local tradition and religious culture.
Fig 6 shows the statistics of findings of quality evaluation of ecological environment
in Lugu Lake scenic areas by tourists. Among them, 68.6% said good or very good;
28.6% said so-so; and 2.8% commented poor or very poor, which indicate that tourists
are generally satisfied with the present quality of the ecological environment of Lugu
Lake areas.
Fig 7 shows the findings of the general impression from traveling in Lugu Lake,
which shows that the tourists are also satisfactory with their tour. As Lugu Lake is the
habitats of many rare and precious animals, the areas have set up nature reserves to
protect them. In reply to the question that is it necessary to enhance propaganda and
management measures on protection of the rare and precious animals and plants, 87%
of the surveyed said “necessary, 9% said “not necessary, and 4% gave no answers.

The economic valuation of Lugu Lake ecosystem services
42
Fig. 6 Tourist’s estimation for Lugu Lake ecological quality
Fig. 7 Investigation on tourist’s overview about Lugu Lake
According to the survey statistics, the intention of payment by tourists on protection
of the ecological environment of Lugu Lake is an average 22 Yuan, much higher than
the current three Yuan for the protection covered in the admission ticket to the Lugu
Lake scenic areas.
The survey also shows that intention of payment by tourists for admission tickets for
Tourist’s estimation for Lugu lake ecological quality
24.3%
44.3%
28.6%
1.4%1.4%
Very good
Good
Common
Bad
Very bad
Investigation on tourist’s overview about Lugu lake
28.6%
62.9%
7.1% 1.4%
Very good
Good
Common
Bad
The economic valuation of Lugu Lake ecosystem services
43
Lugu Lake scenic areas is 58 Yuan.
The intention of payment by tourists for protection of Mosuo traditional culture is 22
Yuan, which is the same as the payment intention on protection of ecological
environment. This indicates that tourists attach the same importance to the protection
of the Mosuo traditional culture as that of protection of ecological environment. This
also coincides the survey findings that the scenery and local folkways are the main
parts to attract tourists to Lugu Lake areas.

Conclusion and prospect
44
5. Conclusion and prospect
5.1 Main factors influence the eco-environment of Lugu Lake
The ecological environment in Lugu Lake basin is fragile. The lake supply coefficient
is only 3.54 and the variational water reserve is only 5.6% of the lake content. The
lake’s natural ability to renew itself is weak so that once contaminated, it is difficult to
recover. However, the natural resources in the basin suffer various damages now, such
as many trees have been felled and mountains have been reclaimed in partial areas, a
large number of visitors bring lots of rubbish, and so on. Thus the regional
environment and water body are suffering from various degrees of impact and
pollution.
Lugu Lake basin’s tourism resources and environment are also fragile. As its major
landscape resources are lake water, forest vegetation and the Mosuo nationality’s
culture, Lugu Lake’s regional tourism resources include natural ecosystem and folk
culture system. But the resources and environment above are vulnerable: the lake
water is easy to be polluted; in the forest logging for many years has resulted in soil
erosion. As the Mosuo population is too small and they dwell dispersively, their
traditional culture and social customs are highly impacted, diluted, and even
disappear.
The soil erosion in Lugu Lake basin should arouse much attention. Generally, the
current erosion is micro to mild degree erosion and the erosion modulus is
200-300t/km2·a. In partial regions such as the upriver areas of Big Fish Dam, due to
artificial unreasonable exploitation and reclamation, water and soil erosion is serious,
growing into mudslide disasters. In partial zones of Lugu Lake southwest slope, water
and soil erosion is also severe and in recent years it has been well controlled.
5.2 Brief result
See the Table 17 for the result of the reckoned value of the services of the ecosystems
of Lugu Lake areas.
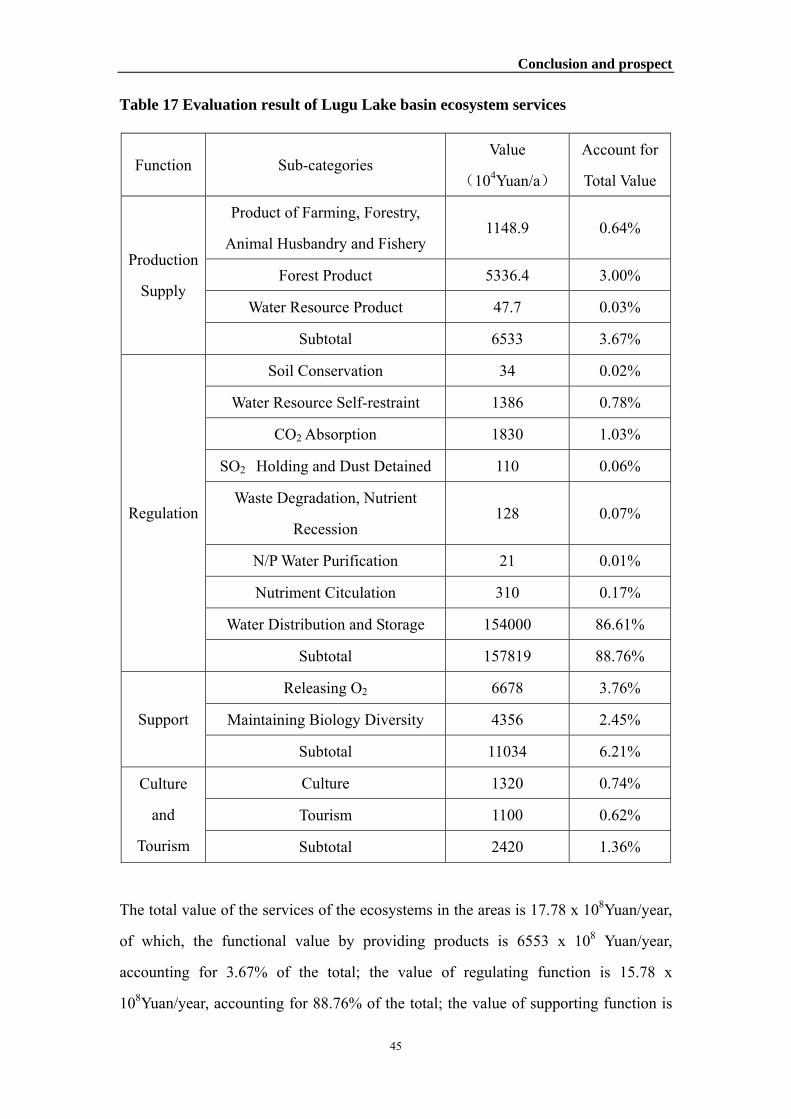
Conclusion and prospect
45
Table 17 Evaluation result of Lugu Lake basin ecosystem services
Function Sub-categories Value
(104Yuan/a)
Account for
Total Value
Product of Farming, Forestry,
Animal Husbandry and Fishery 1148.9 0.64%
Forest Product 5336.4 3.00%
Water Resource Product 47.7 0.03%
Production
Supply
Subtotal 6533 3.67%
Soil Conservation 34 0.02%
Water Resource Self-restraint 1386 0.78%
CO2 Absorption 1830 1.03%
SO2 Holding and Dust Detained 110 0.06%
Waste Degradation, Nutrient
Recession 128 0.07%
N/P Water Purification 21 0.01%
Nutriment Citculation 310 0.17%
Water Distribution and Storage 154000 86.61%
Regulation
Subtotal 157819 88.76%
Releasing O2 6678 3.76%
Maintaining Biology Diversity 4356 2.45% Support
Subtotal 11034 6.21%
Culture 1320 0.74%
Tourism 1100 0.62%
Culture
and
Tourism Subtotal 2420 1.36%
The total value of the services of the ecosystems in the areas is 17.78 x 10⁸Yuan/year,
of which, the functional value by providing products is 6553 x 108 Yuan/year,
accounting for 3.67% of the total; the value of regulating function is 15.78 x
108Yuan/year, accounting for 88.76% of the total; the value of supporting function is

Conclusion and prospect
46
1.10 x 10⁸Yuan/year, 6.21% of the total; and the value of cultural and tourism
functions, 2,420 x 104Yuan/year, accounting for 1.36% of the total.
For Lugu Lake areas, the value of the regulating function mainly demonstrates in the
value of function of water regulating and storage. The functional value of water
regulating and storage of Lugu Lake takes up 86.61% of the total service value of the
ecosystems in the areas, which tallies with the water system of Lugu Lake valley. So,
protection of the water system of Lugu Lake is of great significance to the sustainable
development of the areas.
The total income of the primary and tertiary industries in Lugu Lake areas was 15.14
million Yuan in 2000, only accounting for 4.0% of the service value of the ecosystems
in the areas. The combined tourism income in Lugu Lake scenic areas reached 126.8
million Yuan in 2004, 7.1% of the service value of the local ecosystem.
Due to the insufficient materials and data, the present evaluation methods of the
services of the ecosystems are not mature, and the value of some of the services is
hardly to be calculated. For example, there has been no evaluation made in many
aspects in Lugu Lake areas such as the C accumulation of the grassland ecosystem,
maintaining biological diversification, guarding against biological damage of various
ecosystems, value of gene resources, value of heritages of nature, human being and
cultural scenic spots. The Table 17 only shows the minimum value of service
functions of the ecosystems in Lugu Lake areas with the current limited evaluation
methods, and the value of service by the ecosystems in the areas will exceed the total
value of the evaluation.
5.3 Strategies and countermeasures
5.3.1 Enhancement of the protection planning of the scenic areas
On the basis of the principle "putting prevention first, combining prevention and
treatments, comprehensive protection, sustainable development, sustainable use", and

Conclusion and prospect
47
in accordance with national laws and regulations, we should make a scientific plan for
the unique humanistic resources whose main body is Mosuo culture and the natural
ecosystem which mainly contains the lake water and biological resources in Lugu
Lake region. After integrating the protection of region-wide ecological environment
and the protection of scenic tourist areas, we should pay more attention to planning
for the control of Lugu Lake water pollution and preservation of the Mosuo culture.
Moreover, we should develop grading protection measures to prevent from disorderly
development and destructive construction tourism area.
The protection of Lugu Lake scenic areas should include the protection of local ethnic
villages, the protection of natural resources and overall environmental protection of
scenic landscapes. According to the request of the management of scenic areas, we
should put the protection keystone and measures of the core beauty spot forward
aiming at its scope in the scenic areas. In the process of building and managing the
scenic areas, we must comply with corresponding protection rules.
The core beauty spots in Lugu Lake scenic areas include Mosuo villages conservation
areas, grass-ocean wetland ecological conservation areas, scenic cultivating areas and
the Lugu Lake folk customs scene zone belonging to the primal and secondary
protection view area, the pilgrimage area in Gemu Hill’s highest peak, Zuan Dong
mountain kop dell view area.
To the characteristics of the core view area, the emphasis of the planning is keeping
and continuing the race culture, protecting the natural landscape special features and
growing the sound ecosystem environment. The protections of the race culture include
not only the protection to the existing small village buildings, but also maintaining
and extending its non-material culture, and studying the homologous countermeasures.
The protection of natural landscape features is not limited to the mere protection of
the status quo of the good natural landscape, but also focus on the utilization of its
resources and the reduction of the constructive destruction. The cultivation of the

Conclusion and prospect
48
ecological environment involves not purely reforestation, but also promoting the
structural adjustment of regional agriculture and economic development according to
certain production, and fundamentally changing the environmental damage owing to
agricultural production and the backward way of life.
5.3.2 The protection of the Mosuo nationality cultural resources
The Mosuo nationality culture is the rare resource and soul of Lugu Lake tourism area
so that the effective protection of the Mosuo culture is the guarantee of sustained
development and prosperity in this area. But the protection is not closed protection or
giving up the development, and further more, the protection and development must be
equal in order to promote the protection with the exploitation and to get development
from the protection.
(1) The necessary local laws and regulations should be expeditiously enacted in order
to protect the Mosuo culture effectively. For example, we should restrict the
immigration and the disintegration of the matriarchal family household, regularize and
maintain the "Axia" marriage patterns, and prevent the variation and disintegration of
Mosuo matriarchal clan family and marriage patterns under the impact of external
culture.
(2) The Mosuo cultural conservation village (region) should be established so that the
highly valuable matriarchal system will be protected and preserved originally in the
village communities and the ecological environment. And they can keep up their
normal development and continuance. The natural environment, living environment,
residential areas, courtyard, village patterns, folk customs and traditional lifestyles in
these villages must be strictly maintained and integrally preserved. The subsequent
buildings should not be incompatible with the original features to ensure the integrity
of their environment and the authenticity of their living areas. At the same time, the
living conditions of villagers should be improved through the improvement of the
infrastructure. In addition, in the above villages, "Mosuo folk cultural sightseeing
Conclusion and prospect
49
village" can be selectively opened. Moderate and restrained tourism activities can be
launched in the village, but the principle "separation of tour and living" should be
implemented and the construction of tourism facilities should be strictly limited in the
village.
(3) The research on protection and development of Mosuo nationality culture should
be strengthened. Beside of systematic collection and collation of the Mosuo cultural
relevant information (including tangible culture and intangible culture), accreditation
and academic research are indispensable. The protection and development of Mosuo
culture, such as family structure and marriage patterns, "Daba" primitive religion,
song and dance art, folk festivals, architecture, folk crafts, and so on, should be
organized and implemented as well. The Mosuo people should undertake the
traditional cultural education so as to be able to become Mosuo cultural descendant.
5.3.3 Intensifying protection of the ecological environment
Lugu Lake regional ecological environment is fragile, once damaged it will be
difficult to be resumed. With the increase of visitors’ number, the problem of Lugu
Lake regional ecological environment has been gradually exposed. For instance, Lugu
Lake basin pollution has been increased, the lake suffering a heavy metal pollution,
living garbage especially some hardly degradable materials such as plastic, foam, etc
is increasing in the lakeshore, and the output of unique fish —— the Abdomen
Fissured Fish in Lugu Lake has sharp declined and it’s even on the brink of extinction,
and so on. They are all problems due to tourism development. In the conditions that
the tourism still needs appropriate development, intensifying our protection of the
ecological environment has become more and more important.
5.3.4 Strengthening whole cooperation of Lugu Lake region
Lugu Lake belongs to Yunnan and Sichuan provinces. The region's economical social
development as well as the exploitation of tourism resources is urgently needed
provinces’ close cooperation. For example, the arrangement of tourist facilities should

Conclusion and prospect
50
balance the interests of the two provinces, the project should be in conjunction with
the respective features of different tour landscapes, and in the aspect of resources
protection the responsibility of the two sides should be clearly definitized. Planning
should be shared with the two places as the technical requirements when they build
scenic areas and develop the tourism.
In the process Lugu Lake regional sustainable development, in addition to cooperation
of the two provinces, mutual cooperation and coordination among the villages of
inside region and all races are required, too. In this region, because of the various
degrees of exploitation of tourism resources in different areas, the socio-economy in
different villages and various nationalities develop inconsistently. A number of
villages are rich, while some others are very poor. The lack of socio-economic
harmonious development, to some extent, will bring inconsistency among these
villages, and even inter-ethnic conflicts. Therefore, in the process of the resources’
exploitation, it is necessary to consider the coordinate development of different areas.
5.4 Prospect research of EVES
This research has summarized the ecological economics normal form which should be
followed in research EVES, on the basis of reviewing relevant theory and case, probe
into and instance analysis through the theory of this paper, we can study tentatively on
EVES as following:
First, ecosystem services evaluation broadly enlarged the conception of price and cost
but not all market substitution methods can be taken as real market methods. What we
need for ecosystem services evaluation is not only to prove the importance but also to
emphasize its public or collective shortage and rarity. Generally, ordinary market
value for goods or services is estimated according to its rarity for individuals.
Economic valuation for ecosystem services can be used to explore the difference
between individual and public costs and benefits, then to design policies and
institutions to reduce their difference.

Conclusion and prospect
51
Second, sustainable natural resource exploitation require comprehensive and dynamic
evaluation of ecosystems and their services, and partial and static evaluation is also
useful. In order to evaluate ecosystem services and their relations with human society,
all kinds of evaluation methods have been developed. One series of methods were
developed from the view angle of physical integration of complex ecosystem.
Environment, economy and society cross each other and make a big net in which a
little knot change will make the whole net change. Some methods were designed to
search the unit that can reveal the fundamental characters and make arbitrary parts of
the system can be calculated with the unit. In other words, global research trend needs
holistic views of ecosystem services evaluation but reductive evaluation of ecosystem
services made it possible to insert natural factors into regional and local decision.
Scientific research and management for ecosystem hiberarchies need both applied and
should be across in one research procedure.
Third, in order to promote the capability improvement of regional ecosystem services,
both supply and demand of specific regional ecosystem services should be considered.
In this paper, the supply of ecosystem services were classified into some kinds of
ecosystems and then into some specific kinds, but their shadow price index were
chosen according to economic and social characteristics of South China.
Fourth, holistic and reductive research angle of ecosystem services evaluation can
promote each other. Reductive research focuses on the benefits and costs of individual
then little groups the larger collections, which would make individual decision makers
(individual person, individual corporation, individual organization, individual local
government, etc.) broaden their view angles and consider ecological factors that
maybe important for their future situation. These considerations would make those
individuals directly or indirectly bargain on ecosystem services changes. Partly and
potential market of ecosystem services make it possible for further research of
ecosystem services market substitution which leads to more general assessment.

Conclusion and prospect
52
Fifth, while ecosystem functions and services are divided into more and more specific
kind, evaluation of ecosystem services can include more and more eco-economic
chain effects, so it is possible to establish integrative assess models for complex
ecosystems. However, it will be a long and hard work in which two difficulties must
be resolved: physical research accumulation and macro benefits abutment with micro
benefits. Different methods designed from different disciplinary angles will permeate
each other and establish a comparable index systems, etc.
There are a lot of related topics which could be further studied. One suggested further
study for the project is to determine the impact of increase of tourist. More accurate
projections of future lake water balance and how lake functions react to these changes
is one of the further studies in technical level.
With respect to environmental economics in China, future studies include: How
environmental valuation methods are applied in China? How Economic Evaluation of
ecosystem methods would be carried out in China? Enlarged economic evaluation of
ecosystem services may be helpful for relative stakeholders who will take better and
more public rational choices. Then researches can learn and summary more
comprehensively from the more practices.

Data Source
53
Data Source
Chinese Statistical Yearbook 2000 [C]. Edit by National Bureau of Statistics of China.
Beijing, China Statistical China Statistical Press. 2001.
Lijiang Naxi Nationality Autonomous County Yearbook (2003). Edit by Yearbook
Compilation Committee of Lijiang Naxi Nationality Autonomous County, Yunnan
Nationalities Publishing House.
Lijiang Statistical Yearbook 2000-2003[C]. Edit by Statistics Bureau of Yunnan
Province .Kunming. 2001-2005.
Reports on the Status of Biodiversity of China[R]. Compilation Group of Reports On
the Status of Biodiversity of China. Beijing: Environmental Science Press of China.
Reference
Chaturvedi M. C.. Sustainable Development of India’s Waters—Some Policy Issues.
Water Policy, 2001, 3: 297-320.
Chavas J-P.. Ecosystem Valuation under Uncertainty and Irreversibility [J].
Ecosystems, 2000, 3(1): 11-15.
Costanza R.. d’Arge R., de Groot R., et al. the Value of the World’s Ecosystem
Services and Natural Capital [J]. Nature, 1997, 387: 253–60.
Costanza R.. Social Goals and the Valuation of Ecosystem services [J]. Ecosystems,
2000, 3(1): 4-10.
Daily G. C.. What are Ecosystem Services? [M] In: Nature’s Services: Societal
Dependence on Natural Ecosystems. Washington DC: Island Press, 1997.
Hakkila P.. Utilization of Residual Forest Biomass. Berlin, Ireland: Springer-Verlag,
1989.
Kukelmeisister, Braoctz G. S.. Urban Forestry Revisited [J]. Unasylva, 1993, 173:
3-12.
Ludwig D.. Limitations of Economic Valuation of Ecosystems [J]. Ecosystems, 2000,
3(1): 31-35.

Reference
54
Pritchard Jr. L.. Folke C.. Gunderson L.. Valuation of Ecosystem Services in
Institutional Context [J]. Ecosystems, 2000, 3(1): 36-40.
Savenije H. H. G.. Why Water is not an Ordinary Economic Good, or Why the Girl is
Special. Physics and Chemistry of the Earth, 2002, 27: 741-744.
Schuyt K.. Luke Brander. The Economic Values of the World’s Wetlands.
WWF-International, Gland/Amsterdam, January 2004.
Shi H., Shao M.. Soil and Water Loss from the Loess Plateau in China. Journal of
Arid Environments, 2000, 45: 9-20.
Wischmeier W. H., Smith D. D... Predicting Rainfall Erosion Losses. Agricultural
Handbook 537. USDA, Washington DC. 1978
Young, R.A., S.L. Gray. Economic Value of Water: Concepts and Empirical Estimates.
Department of Economics, Colorado State University, Fort Collins, Colorado,
Final Report to the National Water Commission, Contract NWC 70-028, 1972,
March.
Zilberman, D., Leslie Lipper. The Economics of Water Use. Handbook of
Environmental and Resource Economics, edited by Jeroen C.J.M. van den Bergh.
Cheltenham, UK and Northampton, MA, USA: Edward Elgar Publishing Limited.
1999.
Chinese References
Chang X., Zhao A. and Li S.. Spatial-Temporal Scale and Hierarchy of Vulnerable
Ecotone. Journal of Desert Research, 1999, 19(2): 115-119.
Chen Z. X., Su X. H.. Study on Ecological Benefits of Urban Greening in Beijing (3)
[J]. Chinese Garden, 1998, 4(3): 53-56.
Forestry Annals of Ninglang Yi Autonomous County. Yunnan National Publishing
House, 1990.
Guan W., Wang Z., Chen J., Zhang Q. and Wang X.. Evaluation of Forest Ecosystem
Eervices in Gongga Mountain. Journal of Beijing Forestry University, 2002, 24(4):
80-84.
Guo Ying. On the Exploitation and Protection of the National Cultual Resources in the
Ethnic Areas--Taking Lugu Lake Area as an Example. Tourism Tribune, 2001,

Reference
55
16(3): 68-71.
He Qingming. On Issue of Tourism Exploitation and Ecological Economy in Yunnan
Lugu Lake. Ecological Economy, 2001, (3).
Huan M.. Summarizing the Ecosystem Services Functions and Their Values.
Ecological Economy, 2001, 12: 41-43.
Jiang W.. Analysis and Evaluation on Water-holding Function of Main Forest Types in
Anji Region. Journal of Nanjing Forestry University (Natural Sciences Edition),
2002, 26(4): 71-74.
Kang W. and Tian D.. Economic Evaluation of the Public Benefits of the Forests in
Human: Benefits of Air-cleaning. Journal of Central South Forestry University,
2002, 22(1): 7-10.
Kang Yunhai, Ning Ping. On Theory Foundation in Developing Eco-tourism.
Ecological Economy, 1997, 6: 36-41.
Kang Yunhai. On Eco-tourism of Lugu Lake. Yunnan Science & Technology Press,
1999.
Lan Honglin. Treatment and Protection of Hight Plateau Lake. Yunnan Environmental
Science, 2001, 20(4): 26-28.
Lin Yushi, Zhang Meiliang, Qin Jiaming. Preliminary Study on the Characteristics of
Karst Caves and the Genesis of Lugu Lake, Yunnan. Carsologica Sinica, 2000,
19(3): 232-238,250.
Lin Yushi, Zhang Meiliang, Qin Jiaming. the Record of Paleo-climatic Environment
in Lugu Lake Area of Ninglang County, Yunnan. Carsologica Sinica, 2001, 20(3):
174-182.
Liu Hongzhi, Chen Yongqing. Administration Actuality about China’s Specific Lakes.
Environmental Protection, 1998,(12):9-10
Liu Weihua. Some Theoretical Thoughts about Community-Involved Tourism
Development. Tourism Tribune, 2000, 15(1): 47-52.
Lu Yifei, Guo Ying. On the Establishment of the Lugu Lake Moso Cultural
Preservation Zone. Tourism Tribune, 2001, 16(1): 62-66.
Lv Yonglong. Development and Planning of Eco-tourism. Journal of Natural
Resources, 1998, 1.
Ouyang Z Y, Wang R S, 1996. Indirect Value Assessment of China Biodiversity [M].

Reference
56
In: Modern Ecological Hotspot Problems Research (Wang R S ed.). Beijing:
China Science and Technology Press. 409-421.
OuYang Z., Wang X. and Miao H.. Aprimary Study on Chinese Terrestrial Ecosystem
services and Their Ecological-economic Values. Acta Ecological Sinica, 1999,
19(5): 607-613.
Piao S. and Fang J.. Dynamic Vegetation Cover Change over the Last 18 Years in
China. Quaternary Sciences, 2001, 21(4): 294-302.
Tian Jun, Pang Yunping. Eco-Tourism at Lugu Lake. Yunnan Environmental Science.
2001, 20(2): 8-11.
Wan Ye, Guo Laixi. Crisis Factors and Control Approsches of the Special
Natural-social Ecological System of the Lugu Lake Area. Resources and
Environment in the Yangtze Valley, 1997, 6(3): 211-215
Wang C.. Comparison and Analysis on Ecological Functions between Different Types
of Urban Green Spaces[J]. Journal of Northeast Forestry University, 2002, 30(3):
111-114.
Wanzhong Wang, Juying Jiao. Quantitive Evaluation Research on China’s Soil
Erodibility Factor. Journal of Water and Soil Conservation, 1996, 16(5): 1-20.
Wei Meixian. Cultural Ecology: A Perspective of the Ethno-National Cultural Studies.
Academic Exploration, 2002, 4, 106-109.
Wei Xinliang. A Quantitative Analysis of Ecotourism Impacts on Forest Resources.
Journal of Beijing Forestry University, 2003, 2(1): 65-68.
Zhang Jingfang, etc. Ecological Problems and Consequence of the "Four Lakes" in
Yunnan Plateau. Yunnan Science and Technology Press, 1987.
Zhao Shilin. On Transmission of National Culture in Course of Modernization.
Thinking, 1995, (6).
Zhao Tongqian. The Research of Terrestrial Ecosystem services Function and Its
Value Evaluation. Thesis for Applying Doctor’s Degree in Graduate School China
Academy of Sciences.

Appendix
57
Appendix
Appendix 1 General Layout of Lugu Lake

Appendix
58
Appendix2 Function Subarea Map of Lugu Lake Landscape Ecological Building

Appendix
59
Appendix 3 Relationship between Human Activity and Ecosystem Changing Patch

Appendix
60
Appendix 4 Ecosystem remote sensing and monitoring sample area distribution in Lugu Lake area
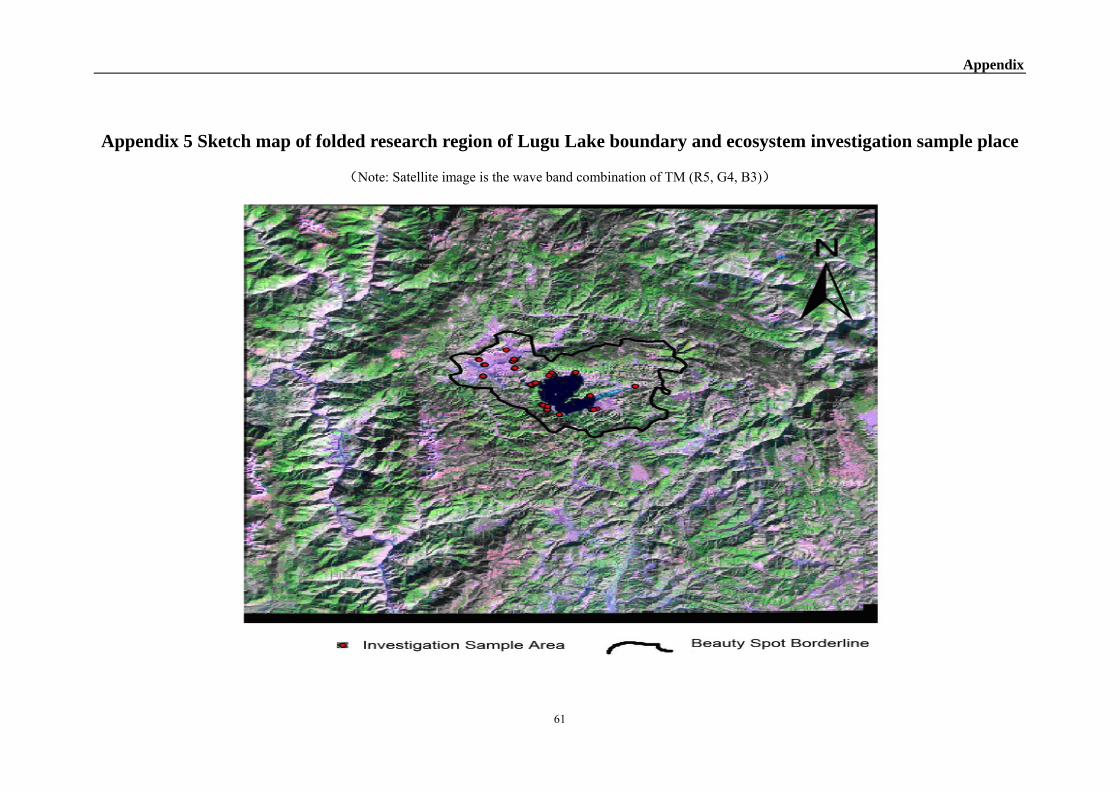
Appendix
61
Appendix 5 Sketch map of folded research region of Lugu Lake boundary and ecosystem investigation sample place
(Note: Satellite image is the wave band combination of TM (R5, G4, B3))

Appendix
62
Appendix 6 Vegetation Types in Lugu Lake basin

Appendix
63
Appendix 7 Vertical distributed Forest and Vegetation in Lugu Lake Basin
Appendix 8 Land uses distribution in Lugu Lake Basin (1995/2005)
Land uses distribution for 2005
Forest80.68%
Agricultural11.01%
Industrial1.18%
Grass/Pasture7.13%
Land uses distribution for 1995
Forest74.94%
Industrial0.14%
Agricultural20.08%
Grass/Pasture4.84%