the economic impact of the small business and - state of california
TRANSCRIPT

THE ECONOMIC IMPACT OF THE SMALL BUSINESS AND DISABLED VETERAN BUSINESS ENTERPRISE
PROGRAMS ON THE STATE OF CALIFORNIA
Submitted by: Sanjay B. Varshney, Ph.D., CFA
Professor of Finance and Dean - College of Business Administration California State University, Sacramento
Dennis H. Tootelian, Ph.D.
Professor of Marketing & Director of the Center for Small Business – College of Business Administration
California State University, Sacramento
June 2009
2
TABLE OF CONTENTS EXECUTIVE SUMMARY ............................................................................................................ 4 INTRODUCTION AND PURPOSE............................................................................................ 7 BACKGROUND .......................................................................................................................... 11 SMALL BUSINESS AND DVBE PROGRAMS IN THE STATE OF CALIFORNIA .......... 14
Comparison between the SB and DVBE Certifications .................................................... 16 Small Business and Microbusiness Certification Benefits ............................................... 16
METHODOLOGY FOR THE STUDY...................................................................................... 18 FINDINGS OF THE STUDY ..................................................................................................... 20
Survey of SBs and DVBEs.................................................................................................... 20 Methodology for the Study ................................................................................................ 21 Summary and Conclusions ............................................................................................... 21
Economic Impact of Small Businesses and DVBEs ......................................................... 23 Multiplier Effect of Small Business and DVBE Activity ..................................................... 28 Economic Impact Effects on Residents and State Programs.......................................... 33
SUMMARY AND CONCLUSIONS OF THE STUDY............................................................ 35 TABLE ONE: TOTAL PROJECTED ECONOMIC IMPACTS............................................. 37
Expected Impact ................................................................................................................. 37 Maximum Impact................................................................................................................. 39 Minimum Impact .................................................................................................................. 41
TABLE TWO: EXPECTED IMPACT FROM CERTIFIED SMALL BUSINESSES .......... 43 Output ................................................................................................................................... 43 Employment ......................................................................................................................... 43 Labor Income....................................................................................................................... 44 Indirect Business Tax ......................................................................................................... 44
TABLE THREE: MAXIMUM EXPECTED IMPACT FROM CERTIFIED SMALL BUSINESSES ............................................................................................................................. 45
Output ................................................................................................................................... 45 Employment ......................................................................................................................... 45 Labor Income....................................................................................................................... 46 Indirect Business Tax ......................................................................................................... 46
TABLE FOUR: MINIMUM EXPECTED IMPACT FROM CERTIFIED SMALL BUSINESSES ............................................................................................................................. 47
Output ................................................................................................................................... 47 Employment ......................................................................................................................... 47 Labor Income....................................................................................................................... 48 Indirect Business Tax ......................................................................................................... 48
TABLE FIVE: EXPECTED IMPACT FROM DISABLED VETERAN BUSINESS ENTERPRISES .......................................................................................................................... 49
Output ................................................................................................................................... 49 Employment ......................................................................................................................... 49 Labor Income....................................................................................................................... 50 Indirect Business Tax ......................................................................................................... 50
3
TABLE SIX: MAXIMUM EXPECTED IMPACT FROM DISABLED VETERAN BUSINESS ENTERPRISES ..................................................................................................... 51
Output ................................................................................................................................... 51 Employment ......................................................................................................................... 51 Labor Income....................................................................................................................... 52 Indirect Business Tax ......................................................................................................... 52
TABLE SEVEN: MINIMUM EXPECTED IMPACT FROM DISABLED VETERAN BUSINESS ENTERPRISES ..................................................................................................... 53
Output ................................................................................................................................... 53 Employment ......................................................................................................................... 53 Labor Income....................................................................................................................... 54 Indirect Business Tax ......................................................................................................... 54
TABLE EIGHT: TOTAL IMPACT PER HOUSEHOLD AND PER RESIDENT OF CALIFORNIA............................................................................................................................... 55 TABLE NINE: EXPECTED ALLOCATION OF INCREMENTAL LABOR INCOME THROUGH THE ECONOMY* .................................................................................................. 56 TABLE TEN: HOW INCREMENTAL TAX DOLLARS COULD IMPACT STATE AGENCY BUDGETS ................................................................................................................. 57 Appendix A: About the DVBE and Small Business Certification Programs..................... 58 Appendix B: About the DVBE Participation Program .......................................................... 60 Appendix C: DVBE Certification Benefits and Eligibility Requirements ........................... 61 Appendix D: DVBE Legislation ............................................................................................... 63 Appendix E: Small Business Certification Benefits and Eligibility Requirements ........... 65 Appendix F: Small Business Legislation ............................................................................... 66 Appendix G: Microbusiness Definition ................................................................................... 68 Appendix H: DVBE and Small Business Regulations ......................................................... 68 Appendix I: DGS Small Business Advisory Council ............................................................ 70

4
THE ECONOMIC IMPACT OF THE SMALL BUSINESS AND DISABLED VETERAN BUSINESS ENTERPRISE PROGRAMS ON THE STATE OF CALIFORNIA
EXECUTIVE SUMMARY Introduction and Purpose Small businesses are the lifeblood of the economy in the United States. Based on data from the U.S. Census Bureau, the Office of Advocacy at the U.S. Small Business Administration documented that small businesses accounted for over 92% of the net new jobs creation between 1989 and 2003. The smallest among the small businesses (those employing fewer than 20 employees) accounted for 85% of the net new job creation over the same period. In essence, the vast majority of the new jobs created in the economy come from the very small businesses. Of the total 21.8 million jobs created between 1989 and 2003, small businesses under 20 employees created 18.6 million jobs, small businesses with between 20 and 500 employees created 1.5 million jobs, and large businesses and companies (with over 500 employees) created only 1.7 million jobs. Similarly, while small businesses created net new jobs in 12 of those 14 years, large businesses eliminated more jobs than they created in 5 of those 14 years. Given the State of California (State) established goals for certified small businesses (SBs) and disabled veteran business enterprise (DVBE) participation, the question that may cross the ordinary tax payer’s mind is why the State goes out of its way to help SBs and DVBEs. Why does the State make allowances for them and provide them with bid preferences? Why does the State make the efforts it does to meet the State established goals? To understand why the State makes such concerted efforts to increase SB and DVBE participation, one need to only understand the importance of small business to California economy. The purpose of this study, therefore, was to assess the economic impact of Department of General Services programs to promote opportunities for SBs and (DVBEs). Specific issues examined included:
What are the economic costs and benefits to the State of California generated by State government contracting with SBs and DVBEs (i.e. new jobs created, additional business and income taxes paid, goods, homes, cars purchased, etc.)? Is there a legitimate economic multiplier that can be arrived at systematically and validated statistically, by region and then overall for the State?

5
Summary and Conclusions The incremental value of the State’s awarding contracts to SBs and DVBEs is positive, resulting in tremendous net new job creation, creation of net new Gross State Product (GSP), net new labor income for California employees, and indirect business taxes. Small business accounts for 99.2% of all employer firms and drives the economic engine of the State. This study documents several attributes of SBs and DVBEs of interest:
• There are significant economic benefits to the State of California generated by State
government contracting with SBs and DVBEs (i.e. new jobs created, additional business and income taxes paid, goods, homes, cars purchased, etc.) that are incremental and over and above what would have been produced by large businesses.
• The direct incremental value of contracting by the State with SBs and DVBEs is at least
$883 million, averages around $1.484 billion, and is as high as $2.242 billion.
• The total net new economic activity generated by the State through contracting with SBs and DVBEs through gross State output is approximately $4.243 billion, is at least $2.523 billion, and is as high as $6.408 billion.
• The total net new jobs created due to the State’s contracting with SBs and DVBEs range
between 15,234 and 38,685 with the average being approximately 25,617.
• In 2006-07, the State awarded contracts totaling $9.387 billion. The net new GSP creation due to contracts awarded by the State to SBs and DVBEs is two thirds (68%) of the total amount awarded under the best case scenario, 45% under the “average” scenario, and 27% under the “minimum” scenario. In other words, the State created 68% more value by awarding contracts to SBs and DVBEs over large businesses under the best case scenario, 27% more value under the worst case scenario, and on average produced new economic activity that is 50% more than if awarding the contracts to large businesses.
• Most of the SB and DVBE respondents (62.5% in survey conducted) have tried to obtain
contracts with the State.
• The main reasons respondents gave for not trying to bid for a State contract(s) are that they either did not know of bid opportunities (28.0%) or they felt that the products/services they offer did not match the State’s needs (28.0%).
• Bid success seems to be a function of the number of applications made. For example,
56.9% of the respondents who have bid two to five times have been successful at least once, and 85.4% of the respondents who bid for at least six contracts have been successful at least once.

6
• Most respondents (76.0%) indicated they are somewhat or very interested in bidding for State contracts. This demonstrates that the Department of General Services (DGS) list is viable in identifying possible SBs and DVBEs for bid opportunities.
• Survey results suggest that additional SB and DVBE education may be appropriate to
improve their knowledge of how the preference program works.
• Most survey respondents (79.0%) said they would like additional information on contracting with the State and the bid opportunities and processes.

7
THE ECONOMIC IMPACT OF THE SMALL BUSINESS AND DISABLED VETERAN BUSINESS ENTERPRISE PROGRAMS ON THE STATE OF CALIFORNIA
SUMMARY REPORT OF FINDINGS
INTRODUCTION AND PURPOSE Small businesses are the lifeblood of the economy in the United States. Based on data from the U.S. Census Bureau, the Office of Advocacy at the U.S. Small Business Administration documented that small businesses accounted for over 92% of the net new jobs creation between 1989 and 2003. The smallest among the small businesses (those employing fewer than 20 employees) accounted for 85% of the net new job creation over the same period. In essence, the vast majority of the new jobs created in the economy come from the very small businesses. Of the total 21.8 million jobs created between 1989 and 2003, small businesses under 20 employees created 18.6 million jobs, small businesses with between 20 and 500 employees created 1.5 million jobs, and large businesses and companies (with over 500 employees) created only 1.7 million jobs. Similarly, while small businesses created net new jobs in 12 of those 14 years, large businesses eliminated more jobs than they created in 5 of those 14 years. This is demonstrated in Figure1 from Small Business Technology Council below relative to net employment growth from 1989 through 2003:

Source: Small Business Technology Council, “Why are small businesses so important to the United States? They create the vast majority of all net new jobs!” Over 90% of the firms in the United States employ fewer than 20 employees, and large firms (500 or more employees) constitute only 0.3% of all firms. Small business drives the economic engine and the Gross State Product (GSP). An adverse impact on small business is bound to adversely impact the production of goods and services, the risk tolerance of the American enterprise, the productivity of labor, the quality of life, and the overall well being of the State of California (State) and its citizens. The ultimate drivers of growth and economic prosperity are innovation, economic risk taking, and investment. The majority of this comes from small business. Efforts to promote small business, facilitate their financing, provide them with fair opportunities to compete for State and federal contracts, and help them overcome regulatory burdens and barriers will help support national economic growth given their importance in driving the economic engine. A study by Clark, Moutray, and Saade showed that even though small businesses in the United States comprise 99.7% of all employers firms, they account for only 23% of direct federal procurement dollars, and 40% of subcontracting dollars using information from 1958 to 2006. The United States federal government promotes direct and subcontracting procurement opportunities for small businesses. And, with the enactment of Public Law 95-507, it also promotes opportunities for small socially and economically disadvantaged small businesses including minorities, women, veterans, service-disabled veterans, and HUB Zone small businesses. Given the State established goals for certified small businesses (SBs) and disabled veteran business enterprise (DVBE) participation, the question that may cross the ordinary tax payer’s mind is why the State goes out of its way to help SBs and DVBEs. Why does the State make allowances for them and provide them with bid preferences? Why does the State make the efforts
8

9
it does to meet the State established goals? To understand why the State makes such concerted efforts to increase SB and DVBE participation, one need to only understand the importance of small business to California economy. The purpose of this study, therefore, was to assess the economic impact of Department of General Services (DGS) programs to promote opportunities for SBs and (DVBEs). Specific issues examined included:
What are the economic costs and benefits to the State of California generated by State government contracting with SBs and DVBEs (i.e. new jobs created, additional business and income taxes paid, goods, homes, cars purchased, etc.)? Is there a legitimate economic multiplier that can be arrived at systematically and validated statistically, by region and then overall for the State?
This study was conducted by Dr. Sanjay Varshney and Dr. Dennis Tootelian. Brief biographies on each are presented below. Dr. Sanjay Varshney is the Dean of the College of Business Administration at California State University, Sacramento. He has also worked at the University of San Francisco, and previously served as the Dean of the Business School at State University of New York in Utica. He earned an undergraduate degree in Accounting and Financial Management from Bombay University, a Master’s degree in Economics from the University of Cincinnati and a doctorate in Finance from Louisiana State University in Baton Rouge. He also holds the Chartered Financial Analyst (CFA) designation. Sanjay’s research interests include market microstructure, new securities issuance and corporate valuation, and his publications have been included in numerous academic and practitioner journals including Journal of Economics and Finance, Journal of Management Research, Studies in Economics and Finance, Journal of Real Estate Finance and Economics, Contemporary Finance Digest, Advances in Financial Economics, and the Journal of Applied Business Research. Sanjay has also served as a financial consultant for leading Wall Street firms such as UBS Financial Services, Salomon Smith Barney, Fleet Boston, Montgomery Securities, Goldman Sachs, J.B. Oxford, Charles Schwab, and Barclays among others. Dr. Dennis H. Tootelian is a Professor of Marketing and Director of the Center for Small Business in the College of Business at California State University, Sacramento. He received his Ph.D. in Marketing from Arizona State University, with minor fields in Accounting and Management. Dennis has been the Director of the Center for Small Business for more than thirty years and has made it into one of the largest of its kind in the United States. Dennis has published approximately one hundred articles dealing with all facets of business, and has co-authored six texts on marketing and small business management. His academic research has appeared as articles in such journals as the Journal of Marketing, Journal of Retailing, Journal of Business Research, Journal of Health Care Marketing, and Journal of Professional Services Marketing. Results of some of his applied research and writing have appeared in The

10
Congressional Record, The Wall Street Journal, Forbes, The Kiplinger Report, USA Today, ABC National News website, and even The National Enquirer. Dennis has worked in a consulting capacity with businesses that are Fortune 500 companies (e.g., McDonald’s Corporation, Merck, Johnson & Johnson, 3M, Target Stores, Nestles U.S.A., McKesson Corporation), professional and trade associations (e.g., California Pharmacists Association, California Dental Association), and federal and State governmental agencies (e.g., Centers for Disease Control, California Environmental Protection Agency, California Department of Parks and Recreation, California Department of Insurance).
11
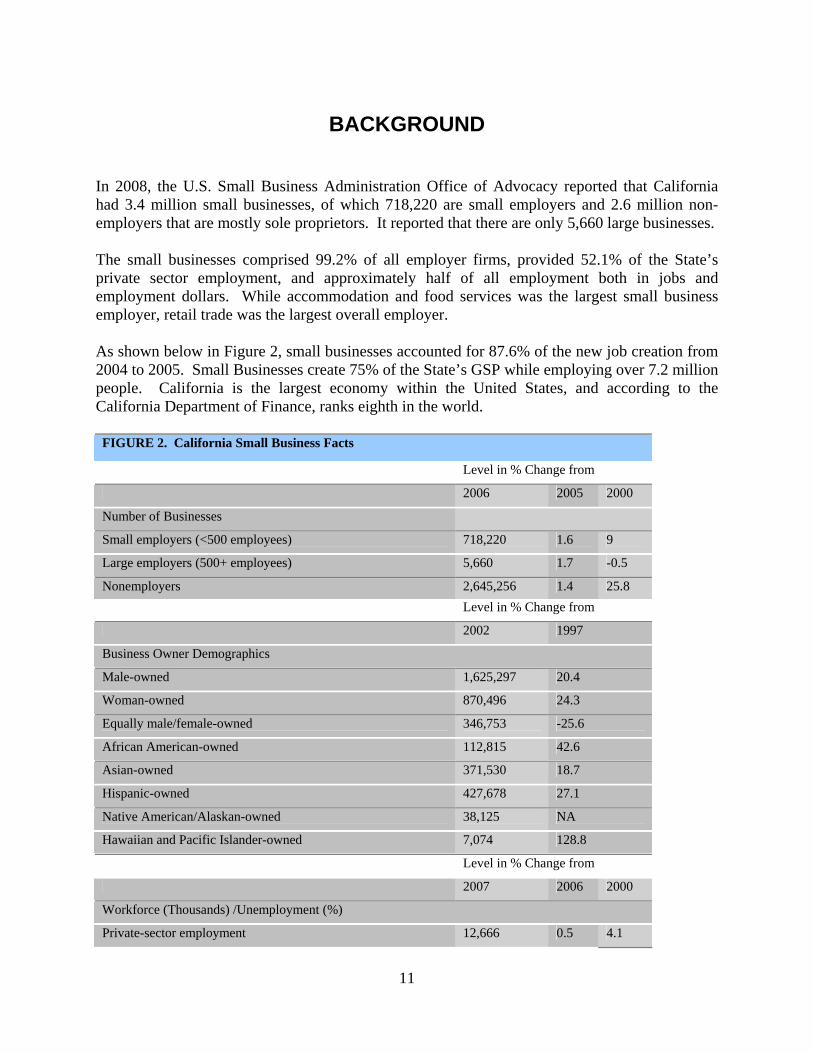
BACKGROUND In 2008, the U.S. Small Business Administration Office of Advocacy reported that California had 3.4 million small businesses, of which 718,220 are small employers and 2.6 million non-employers that are mostly sole proprietors. It reported that there are only 5,660 large businesses. The small businesses comprised 99.2% of all employer firms, provided 52.1% of the State’s private sector employment, and approximately half of all employment both in jobs and employment dollars. While accommodation and food services was the largest small business employer, retail trade was the largest overall employer. As shown below in Figure 2, small businesses accounted for 87.6% of the new job creation from 2004 to 2005. Small Businesses create 75% of the State’s GSP while employing over 7.2 million people. California is the largest economy within the United States, and according to the California Department of Finance, ranks eighth in the world. FIGURE 2. California Small Business Facts
Level in % Change from
2006 2005 2000
Number of Businesses
Small employers (<500 employees) 718,220 1.6 9
Large employers (500+ employees) 5,660 1.7 -0.5
Nonemployers 2,645,256 1.4 25.8 Level in % Change from
2002 1997
Business Owner Demographics
Male-owned 1,625,297 20.4
Woman-owned 870,496 24.3
Equally male/female-owned 346,753 -25.6
African American-owned 112,815 42.6
Asian-owned 371,530 18.7
Hispanic-owned 427,678 27.1
Native American/Alaskan-owned 38,125 NA
Hawaiian and Pacific Islander-owned 7,074 128.8
Level in % Change from
2007 2006 2000
Workforce (Thousands) /Unemployment (%)
Private-sector employment 12,666 0.5 4.1

12
Government employment 2,497 1.8 7.7
Self-employed (incorp. & uninc.) 2,322 -2.3 23.6
Female self-employment 840 1 19.6
Male self-employment 1,482 -4.1 26
Minority self-employment 384 -9.6 25.3
Veteran self-employment 189 -12.4 -18.8
Unemployment rate (%) 5.4 0.5 0.5
Business Turnover
Quarterly establishment openings 175,531 1.6 4.1
Quarterly establishment closings 172,587 1.5 9
Business bankruptcies 3,505 67.1 -52.6
Income and Finance
Proprietors’ income ($billion) 149.4 -3.1 27.4
Bank branches 7,122 3.3 15
No. of bus. loans under $100000 116,932 -5 NA
Total value of business loans under $100,000 ($million)
3,109 -1.5 NA
Sources: U.S. Dept. of Commerce, Bureau of the Census and Bureau of Economic Analysis; U.S. Dept. of Labor, Bureau of Labor Statistics; Administrative Office of the U.S. Courts; Federal Deposit Insurance Corporation, Summary of Deposits; and U.S. Small Business Administration, Office of Advocacy (www.sba.gov/advo/research/lending.html). † Latest available data; certain figures are economy wide.
Small businesses account for almost all of the economic growth the State has witnessed since 1975. Because small businesses comprise 99.2% of all employer firms in the State, the economy grows when they produce more goods and services and hire more workers. California’s economy cannot grow and prosper unless small businesses are growing and prospering. Since small businesses generate much of the State’s economic activity, purchasing and producing goods and services, almost all of this activity is local and regional. Small businesses generate a very large percentage of the revenue received by State and local governments. They collect sales tax revenue, pay taxes on their profits, and, even more importantly, create taxable personal income for their owners and employees. Small businesses also pay property taxes, permits, licenses, fees, assessments, etc. Unlike large businesses whose stockholders and owners are spread out potentially all over the world, the vast majority of small businesses are located in California, and their owners and employees are California residents who pay State income taxes. This is true even if the

13
businesses may be exporting substantial volumes of goods and services to other States and countries and bringing in revenue into California. Small business owners, by living in their local communities, support their churches, social organizations, philanthropy, arts and culture, entertainment, and are an integral part of the local economy. Finally small business owners, being California residents have an influence on the government and politics due to their right to vote and elect their representatives. Small businesses drive economic growth. A study by Bruce, Deskins, Hill, and Rork shows that the category of small business births--establishment of new firms--is the single largest determinant of GSP, employment, and State personal income growth. Similarly, the deaths of small businesses have the opposite effect--with the influence of births and deaths being almost equal. This study also finds that small business activity in neighboring States does not have a negative impact on a State’s own rate of economic growth, but in fact, actually increases growth.

14
SMALL BUSINESS AND DVBE PROGRAMS IN THE STATE OF CALIFORNIA
The State encourages and promotes SB and DVBE programs which were established to acknowledge small businesses and disabled veterans for their service to the nation and the State. The State hopes to promote competition and encourage greater economic opportunity among small businesses and disabled veteran enterprises. Information on the SB and DVBE programs are contained in Appendices A through I. The State attempts to level the playing field for small businesses by promoting and encouraging the SB participation program based on the Small Business Procurement and Contract Act of 1973. Small businesses and micro businesses (MB) that are certified after meeting eligibility criteria set by the State and non-small businesses that contract with a small business for at least 25% of the contract award receive a 5% bid preference while competing for applicable State contracts. The State established a twenty-five percent goal for total contract dollars awarded each year. The awarding departments must report to the governor and legislature each year whether they achieved the goal. Similar to the DVBE program, State agencies that fail to meet the goal must explain the reasons why, and show plans for the future that show how they intend to meet the goal. The State established a DVBE participation goal of at least three percent that applies to the total contract dollars expended each year by the various awarding departments. State agencies make efforts to attain this goal and must report to the governor and legislature each year whether they achieved the goal. If a State agency fails to meet the three percent goal, they are required to explain the reasons why and provide plans for the future that show how they plan to meet the goal. To be eligible for Program benefits, disabled veterans must be registered with DGS as a DVBE after meeting the eligibility criteria. Being registered with DGS as a DVBE not only provides visibility but also several opportunities that may not be available otherwise. Both the SB and DVBE programs allow the SB and DVBE communities to be able to compete more effectively with the large businesses. The goal is to provide more economic opportunities to them in an effort to boost the overall California economy. Each year, as required by Public Contract Code Section 10111, DGS prepares and submits the Consolidated Annual Report (CAR) that consists of details on contract activity reports for SBs, MBs, and DVBEs, that include consulting services and information on ethnicity, race and gender. In 2006-07, SBs and MBs (hereafter SBs) were the beneficiaries of $2.66 billion through State procurement activity for a total of 114,835 contracts. Interestingly, while the SB/MB participation represented 28.31% that met the 25% goal, and represented an increase of 9.05% over the previous year (19.26% that did not meet the 25% goal), the actual number of contracts decreased from 115,064 from the previous year (see Figure 3). The total number of SBs was 13,855 that included 11,225 MBs, and 2,630 non-MBs (see Figure 4). The Department of Corrections and Rehabilitation (CDCR) accounted for 60% of contract dollars to SB/MBs and 45% of overall State total contract dollars. Without CDCR, the State would not meet the 25%

15
SB goal since the SB participation was only 20.8% (CDCR accounted for the balance 7.5% of the total 28.31%). Finally, CSU system awarded contracts totaling $1.2 billion of which $118.25 million went to SBs representing a participation of only 9.84%.
Figure 3. SB/MB Contracting Activity Comparison (excludes CSU participation)
Fiscal Year Total Contract $ Total SB/MB $ Total SB/MB % Total SB/MB Contracts 2005-2006 $8,067,016,038 $1,553,579,315 19.26% 115,064 2006-2007 $9,386,973,057 $2,657,828,690 28.31% 114,835 Variance $ $1,319,957,019 $1,104,249,375 9.05% 229 Variance % 16.36% 71.08% 31.97% 0.00%
Figure 4. CERTIFIED SB/MB Firms by Number of Employees Business Type All Firms 0-25 26-50 51-75 76-100 >100 SB (All Firms) 13,855 12,275 1,200 315 65 0 SB (W/O MB) 2,630 1,050 1,200 315 65 0 SB (W/MB) 11,225 11,225 0 0 0 0
The latest report available on DGS website is for fiscal year 2006-07. Based on this report, all State agency contracts awarded for the procurement of goods and services totaled approximately $9.4 billion. Of this total, DVBE participation was $186 million through the award of 23,341 contracts to DVBE. While these numbers improved from those in 2005-06, they did not reach the three percent contracting goal set for DVBE by Military and Veterans Code Section 999.1 and Executive Order D-43-01. Also, DGS noted that the improved numbers were largely due to more effective and elaborate efforts by DGS to capture and record DVBE participation in contracts and purchase orders. There were 965 registered DVBEs (see Figures 5 and 6), 78% of which were also registered as SBs.
Figure 5. DVBE Contracting Activity Comparison (excludes CSU participation)
Fiscal Year Total Contract $ Total DVBE $ Total DVBE % Total DVBE Contracts 2005-2006 $6,441,685,890 $135,017,788 2.10% 12,649 2006-2007 $6,639,793,370 $186,122,017 2.80% 23,341 Variance $ $198,107,480 $51,104,229 0.70% 10,692 Variance % 3.07% 37.85% 33.33% 45.80%
Figure 6. DVBE by Business Type Business Type Firm Count Construction Manufacturer Non-Manuf. Service DVBE Firms 209 67 6 36 140 DVBE & SB Firms 756 190 30 216 539 DVBE & SB (W/O MB) 57 23 1 19 33 DVBE & SB (W/MB) 699 167 29 197 506
16
Comparison between the SB and DVBE Certifications The primary difference between the SB and DVBE certifications are the eligibility requirements. An SB's eligibility is primarily based on size standards (average gross annual receipts and number of employees) and a DVBE's eligibility focuses on the firm's disabled veteran owner(s). Some of the common items between the two certifications that are considered in the certification process are the business' structure, the principal office location, the type of business, and the owners and their domicile.
Another difference is how the certification, once obtained, is applied in the State contracting arena. DVBE certification entitles the certified business to participate in the State's DVBE Participation Program, which establishes a goal of at least 3% of total overall annual State contracting dollars to be awarded to DVBEs. Comparatively, SB participation goal is set at 25%. SB certification also entitles the certified business to a five percent bid preference on applicable State contracts. The 5% bid preference is only used for computational purposes to determine a contract award. SBs also have prompt payment benefits and DVBEs do not.
Providing all eligibility and compliance requirements are met, it is possible for a business to be certified as both small business and DVBE. Businesses that have this dual certification are able to experience the benefits of both certifications.
The State established a DVBE incentive pursuant to Senate Bill 115 chaptered October 3, 2005 and the Military and Veterans Code section 999.5(a). The new regulations apply to all competitive solicitations for public works, services, goods, and information technology goods and services posted or released after October 09, 2007. The DVBE incentive is required in solicitations that include DVBE program requirements and may be offered in other competitive solicitations.
The DVBE incentive offers State agencies a tool to increase their DVBE participation while still allowing the flexibility to exempt a contract from the participation requirement should the department deem it necessary. Each State agency should incorporate the use of the DVBE incentive into their plan or strategy to ensure achievement of at least three percent DVBE participation on their total contract dollars.
Small Business and Microbusiness Certification Benefits Upon meeting eligibility requirements, certified SBs and MBs are entitled to the following:
• A five percent bid preference on applicable State solicitations.
• Under the Prompt Payment Act, the State must pay a certified SB/MB higher interest penalties for late payment of an undisputed invoice. Prompt payment penalties for construction firms are addressed separately.
• State agencies may use a streamlined process known as the "SB/DVBE Option" by contracting directly with a California-certified small business for goods, services, and information technology valued between $5,001 and $99,999 after obtaining price quotes

17
from at least two California-certified small businesses. For public works projects, the contract value can be up to $147,000.
• The Department of General Services, Procurement Division charges State and local agencies an administrative fee when contracting with a California Multiple Award Schedules (CMAS) vendor. As an incentive, the fee is waived if the CMAS vendor is a certified small business.
• As an incentive, a non-small business prime contractor who uses certified small business subcontractors for at least 25% of its net bid price is eligible for a bid preference of five percent (5%) of the lowest responsible bid when competing against another non-small business.
When applying bidder preferences in which non-small business bidders may be eligible, certified SB and MB bidders have precedence over non-small business bidders. (Small business bids cannot be displaced by non-small business bids when applying any applicable lawful preferences).
• Certified SBs are eligible for the State's Small Business Participation Program. The program sets a goal for the use of small businesses in at least 25% of the State's overall annual contract dollars.
• Certified small businesses increase their visibility and expand their business networking opportunities by being automatically listed in the online search.
Eligibility requirements to be a certified SB include:
• Must be independently owned and operated;
• Cannot be dominant in its field of operation;
• Must have its principal office located in California;
• Must have its owners (or officers in the case of a corporation) domiciled in California; and
• Together with its affiliates, be either:
o A business with 100 or fewer employees, and an average annual gross receipts of $12 million or less over the previous three tax years, or
o A manufacturer with 100 or fewer employees.

18
METHODOLOGY FOR THE STUDY It is important to first understand that not every SB and DVBE that received an award got the contract due to the bid preference. Many SBs and DVBEs receive their contracts by competing with all other bidders normally and without the application of bid preferences. The contracts that were awarded to SBs and DVBEs, if awarded based on bid preference only, would have been awarded to any of the other bidders--that were either another SB or DVBE or perhaps a large business. To measure the true cost or benefit of contracts being awarded to SBs and DVBEs versus being awarded to large businesses, such analysis must be conducted on an incremental basis that measures only the marginal benefit or cost from opportunity foregone. This means that consideration be given to the true net benefit or cost of the contract going to a SB or DVBE instead of a large business. To conduct this study, therefore, it was necessary to review a sample of relevant past contracts that have been awarded to assess the potential cost of the goals expressed in the two questions identified in the Introduction and Scope. A component of the study also included a survey of small business owners to assess whether SB and DVBE preferences make contracting with the State more attractive, how they prefer to receive information about contracting and potential contracts. If a program is to be effective, it needs the support of those to whom it is directed. This survey measured responsiveness of SBs and DVBEs to these efforts by the State to engage them in contracting with the State. It also was necessary to compute the potential costs and benefits of SB/DVBE programs to the State based on a review of past contracts, surveys of small businesses, and other secondary data sources that may be available. This provided the incremental economic impact statistics that were used to assess the overall value of contracting with SBs and DVBEs. From all of this it was possible to conduct an economic impact analysis to assess what the value of SB and DVBE contracts have on the State and on small businesses to address the issues and impacts identified in the two questions identified in the Introduction and Scope. This involved estimating the amount spent by the State that goes to SBs and DVBEs, how much of that spending remains in the State, and the impact that those expenditures may have on California’s economy. The primary model used for this analysis to capture the indirect and induced effects on State GSP is IMPLAN. It provides modeling based on data and tools to assess economic impacts at the State, multi-county, and county levels. Widely recognized and used nationally and regionally, IMPLAN has more than 1,500 active users in the USA and internationally. These include clients in federal and State government, universities, and private sector consultants.

19
Minnesota IMPLAN Group, Inc (MIG, Inc) is the developer of the IMPLAN® economic impact modeling system. IMPLAN® is used to create complete, extremely detailed Social Accounting Matrices and Multiplier Models of local economies. MIG, Inc. provides software tools, region-specific data, and technical support to enable users to make in-depth examinations of State, multi-county, county or sub-county, and metropolitan regional economies. Additionally, the study included an examination of how these expenditures could positively impact small businesses and residents of within the State.

20
FINDINGS OF THE STUDY The findings of this study are presented in four sections. The first contains the results of the survey of SBs and DVBEs. This provides information on the interest in and level of participation in contracting—factors necessary for a successful program. The second section contains the analysis to determine the incremental economic value of SBs and DVBEs. As indicated in the Methodology, consideration of the economic impact must focus on the incremental value of awarding contracts to SBs and DVBEs. The third section presents the overall economic impact on the State. This is based on the computations using IMPLAN, as described in the Methodology, to show the incremental economic impact (output), incremental employment, incremental labor income generated, and incremental indirect business taxes created. Finally, the overall economic impact findings are shown in terms of what they mean to residents of California, how the benefit trickles to various industry sectors based on increased spending as a result of employment, and how the incremental tax dollars could be used to fund other State programs that benefit residents of California.
Survey of SBs and DVBEs As previously indicated, in December 2008, the DGS commissioned California State University, Sacramento to study the economic impact of a State of California (State) program to provide 5% bid preference to SBs and up to 5% incentive to DVBEs in the formal bid process. Part of this study included conducting a survey of owners of SBs and DVBEs to assess their awareness of the bid preference program, activities associated with bidding for State projects, and desires for information about the program. The results of this survey are presented herein.
Specific objectives of this survey were to assess:
• Whether owners of SBs and DVBEs have tried to obtain contracts with the State, and if not, the reasons why.
• Whether owners of SBs and DVBEs who tried to obtain contracts did so as primary contractors or sub-contractors.
• What State, federal, and/or local certifications are held by owners of SBs and DVBEs. • How knowledgeable owners of SBs and DVBEs feel they are about how to become
certified, identifying the contracts available, the process used to submit bids for State work, and the process used by the State to award contracts.
• Whether owners of SBs and DVBEs know about the bid preference program and if that would make them more interested in submitting bids for State work.
• What information owners of SBs and DVBEs would like to have about bidding for State contracts and how they would like to receive that information.

21
Methodology for the Study
The population for this study was defined to be certified SBs and DVBEs in California. The study was limited to those listed on the DGS database as being SBs and DVBEs.
Given the nature of the study, it was determined that a telephone survey would be the most appropriate method of data collection. Telephone interviews can be conducted in a reasonably short period of time across a wide geographic area. This reduces the risk of extraneous events occurring during the data collection process which could adversely affect the quality of the information obtained. Telephone surveys also achieve a high response rate, and thereby minimize potential non-response bias.
Respondents for this survey were selected using a two-tiered sampling plan. Initially, the State was divided into three broad regions: Bay Area, Central Valley, and Southern California. Then, cities within each of these regions were designated for inclusion in the survey. Oakland and San Jose were used in the Bay Area, Sacramento and Fresno used in the Central Valley, and Los Angeles and San Diego used in Southern California. The cities were selected based on geographic location, population, and SB and DVBE representation. These six cities account for approximately 20.4% of the State’s population and 18.7% of the certified SBs and DVBEs in the State. A sample of 200 SBs and DVBEs were selected for surveying.
Summary and Conclusions Based on the findings of this survey, the following summary points and conclusions appear warranted:
• Most of the respondents (62.5%) have tried to obtain contracts with the State. This may be expected since respondents went through the effort to become certified. However, it does suggest that the SBs and DVBEs in the DGS listing are active in reviewing bid opportunities and seeking State contracts. Accordingly, maintaining such a list is appropriate and a viable means for linking SBs and DVBEs with bid opportunities.
• The main reasons respondents gave for not trying to bid for a State contract(s) are that
they either did not know of bid opportunities (28.0%) or they felt that the products/services they offer did not match the State’s needs (28.0%).
• While it appears clear that bid opportunities are being made accessible to SBs and
DVBEs, not narrowing down the notifications to relevant opportunities is problematic. In one respect, SBs and DVBEs may be “overloaded” with notifications that do not match what they do. However, more precise targeting bid opportunities could result in not alerting SBs and DVBEs of viable opportunities. There is a delicate balance between being more selective in the notifications and risking not alerting some companies of viable opportunities. Given the potential problems that could arise from not notifying

22
SBs and DVBEs, it would seem that keeping the notification relatively broad is the more appropriate option.
• Bid success seems to be a function of the number of applications made. The direction of the cause-and-effect relationship is not known--whether the more companies bid, the more likely they will be successful; or whether more successful companies are, the more likely they are to bid more frequently. Nevertheless, success rates clearly are higher among respondents who have bid for more State contracts. For example, 56.9% of the respondents who have bid two to five times have been successful at least once, and 85.4% of the respondents who bid for at least six contracts have been successful at least once. This suggests that there may be a “learning curve” effect and SBs and DVBEs should be encouraged to continue bidding for State contracts rather than be discouraged if they do not receive an award the first time.
• As would be expected, most respondents feel they are knowledgeable about how to
become certified since they already have SB and/or DVBE certifications. However, 36.5% of the respondents believe they are not very or not at all knowledgeable about how to identify contracts, 41.2% feel this way about how to submit bids, and 44.5% of the respondents feel this way about how bids are awarded. Furthermore, 18.0% of the respondents do not know about the 5% bid preference. All of this suggests that additional SB and DVBE education may be appropriate to improve their knowledge of how the preference program works.
• Most respondents (76.0%) indicated they are somewhat or very interested in bidding for
State contracts. This demonstrates that the DGS list is viable in identifying possible SBs and DVBEs for bid opportunities. Of those who did not express an interest in bidding for contracts, 6.3% of the respondents said they would be more interested when knowing of the 5% bid preference. Half of these respondents are uncertain about whether they would be more interested when knowing about the preference.
• Most respondents (79.0%) said they would like additional information on contracting
with the State and the bid opportunities and processes. Somewhat contradictory to the additional comments about the need to more narrowly alert companies to bid opportunities, respondents seem to want a wide range of information, and prefer to receive it via e-mail. Additionally, 72.4% of the respondents indicated that they are at least somewhat likely to visit a central website for information. All of this suggests that there are opportunities to further educate SBs and DVBEs about the program, and to do so electronically by e-mail and/or a central website.
Overall, it appears that the DGS list contains SBs and DVBEs who are interested in contracting with the State, have actively sought contracts, and been somewhat to very successful in their efforts. This makes the listing a very important means for assisting SBs and DVBEs to become more involved in providing services to the State. Further education of these companies to ensure they are knowledgeable about bid opportunities, processes to use to submit bids, and the processes used by the State to award bids could make this list even more valuable.

23
Economic Impact of Small Businesses and DVBEs To consider the incremental economic impact, the first step is to construct the input model. Since 78% of all DVBEs also are small businesses, we will assume that 78% of all contracting dollars awarded to DVBEs were awarded to SBs and not to large businesses. Since small businesses have been shown to account for net new job creation that ranged from 85% to almost 100%, we will assume that small business account for 90% of net new job creation while large businesses account for the balance 10%. Further, small businesses have been shown to account for 75% of the new GSP creation, while large businesses account for the balance 25%. Figure 7 below shows the incremental value of awarding contracts to DVBEs and SBs/MBs instead of awarding to large businesses. Based on the creation of new jobs based on dollars spent on goods and services, every $100 awarded to a DVBE has a direct incremental benefit of $62.40 over a larger business. Similarly every $100 awarded to an SB/MB has a direct incremental benefit of $80.00 over a larger business. Figure 7. Impact of Contracting with SBs Based on Job Creation Contract Dollars Awarded to Small Business $100 Estimated Job Creation by Small Business 90.00% Net contract dollars per $100 used for IMPLAN for contracting with SBs/MBs $90 Impact of Contracting with DVBEs Contract Dollars Awarded to DVBEs $100 Percentage of DVBEs that are Small Business 78.00% Estimated Job Creation by DVBEs that are Small Business 90.00% Contract Dollars used by IMPLAN for Contracting with DVBEs that are SB $70.20 Percentage of DVBEs that are Large Business 22.00% Estimated Job Creation by DVBEs that are Large Business 10.00% Contract Dollars used by IMPLAN for Contracting with DVBEs that are Large Business $2.20 Net contract dollars per $100 used for IMPLAN for contracting with DVBEs $72 Impact of Contracting with Large Businesses Contract Dollars Awarded to Large Business $100 Estimated Job Creation by Large Business 10.00% Net Contract per $100 dollars used for IMPLAN for contracting with Large Business $10.00 Incremental Value of Contracting with SBs and DVBEs Net Incremental Dollars Between Small Business and Large Business $80.00 Net Incremental Dollars Between DVBEs and Large Business $62.40
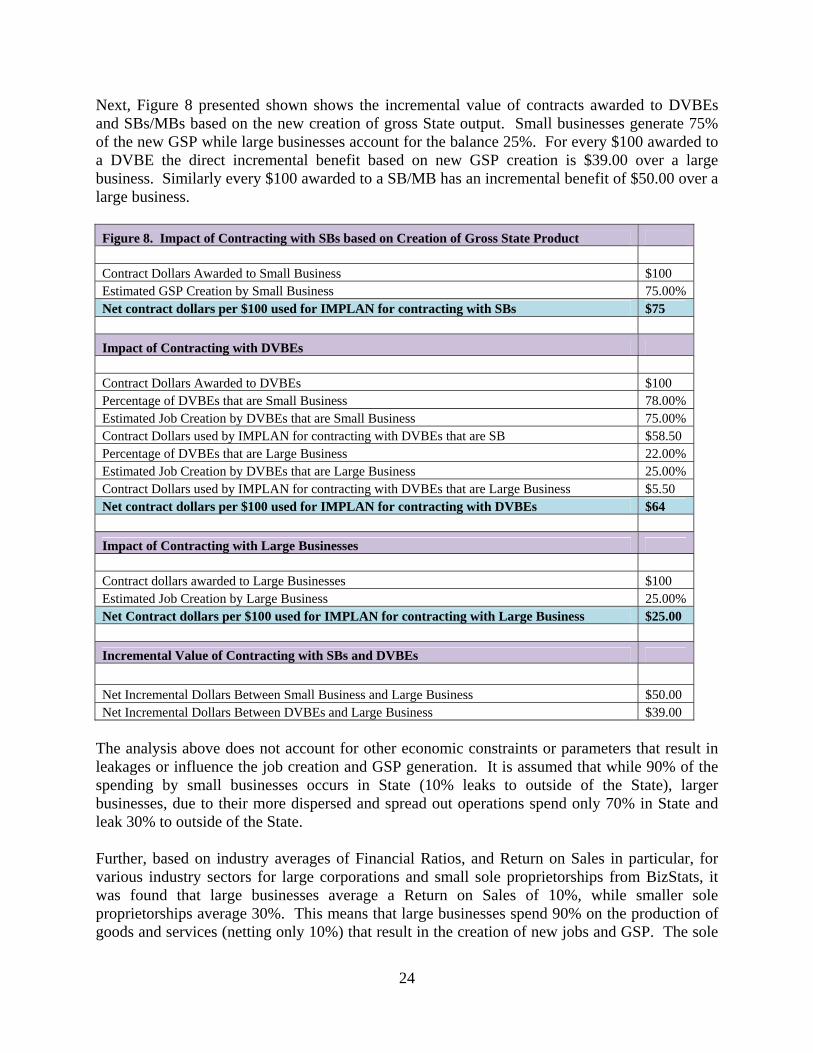
24
Next, Figure 8 presented shown shows the incremental value of contracts awarded to DVBEs and SBs/MBs based on the new creation of gross State output. Small businesses generate 75% of the new GSP while large businesses account for the balance 25%. For every $100 awarded to a DVBE the direct incremental benefit based on new GSP creation is $39.00 over a large business. Similarly every $100 awarded to a SB/MB has an incremental benefit of $50.00 over a large business. Figure 8. Impact of Contracting with SBs based on Creation of Gross State Product Contract Dollars Awarded to Small Business $100 Estimated GSP Creation by Small Business 75.00% Net contract dollars per $100 used for IMPLAN for contracting with SBs $75 Impact of Contracting with DVBEs Contract Dollars Awarded to DVBEs $100 Percentage of DVBEs that are Small Business 78.00% Estimated Job Creation by DVBEs that are Small Business 75.00% Contract Dollars used by IMPLAN for contracting with DVBEs that are SB $58.50 Percentage of DVBEs that are Large Business 22.00% Estimated Job Creation by DVBEs that are Large Business 25.00% Contract Dollars used by IMPLAN for contracting with DVBEs that are Large Business $5.50 Net contract dollars per $100 used for IMPLAN for contracting with DVBEs $64 Impact of Contracting with Large Businesses Contract dollars awarded to Large Businesses $100 Estimated Job Creation by Large Business 25.00% Net Contract dollars per $100 used for IMPLAN for contracting with Large Business $25.00 Incremental Value of Contracting with SBs and DVBEs Net Incremental Dollars Between Small Business and Large Business $50.00 Net Incremental Dollars Between DVBEs and Large Business $39.00
The analysis above does not account for other economic constraints or parameters that result in leakages or influence the job creation and GSP generation. It is assumed that while 90% of the spending by small businesses occurs in State (10% leaks to outside of the State), larger businesses, due to their more dispersed and spread out operations spend only 70% in State and leak 30% to outside of the State. Further, based on industry averages of Financial Ratios, and Return on Sales in particular, for various industry sectors for large corporations and small sole proprietorships from BizStats, it was found that large businesses average a Return on Sales of 10%, while smaller sole proprietorships average 30%. This means that large businesses spend 90% on the production of goods and services (netting only 10%) that result in the creation of new jobs and GSP. The sole

25
proprietorships spend 70% of their sales in job creation and generation of GSP, netting 30%. This is shown in Figure 9 below: Figure 9. 2005 BizStats Industrial Financial Ratios - Return on Sales Industry Corporations Sole Proprietorships Accommodations - Food Services 9.75 11.7 Administrative - Support - Waste Management 7.68 Agriculture - Forestry - Fishing – Hunting 9.43 17.67 Arts - Entertainment – Recreation 13.56 45.11 Construction 7.07 20.06 Educational Services 12.48 Finance – Insurance 17.89 41.88 Health Care - Social Assistance 7.96 45.18 Information 12.41 42.03 Management of Companies (Holding Companies) 18.9 Manufacturing 11.48 19.58 Mining 21.05 32.93 Other Services 7.17 30.99 Professional - Scientific – Technical 9.7 49.48 Real Estate - Rental – Leasing 16.94 49.8 Retail Trade 4.29 11.14 Transportation – Warehousing 6.72 20.52 Utilities 6.38 Wholesale 4.24 15.67 Average Industry Total Return on Sales 10.79 30.25 Average Industry Cost of Production 89.21 69.75
Adjustments were then made to the prior Figures to reflect these leakages. After adjusting for the leakages, the table below shows the incremental value of contracts awarded to SBs and DVBEs based on the new creation of jobs. For every $100 awarded to an SB, the direct incremental benefit based on new job creation is $50.40 over a large business. Similarly, for every $100 awarded to a DVBE, the direct incremental benefit based on new job creation is $39.31 over a large business. This is shown in Figure 10 below. Figure 10. Impact of Contracting with SBs based on Job Creation and Leakages Contract Dollars Awarded to Small Business $100 Estimated Average Percent of Dollars Spent in State by SB 90.00% Estimated Average Percent of Dollars Spent (Not Kept in Retained Earnings) by SB 70.00% Estimated Job Creation by Small Business 90.00% Net Contract Dollars Per $100 Used for IMPLAN for Contracting with SBs/MBs $57

26
Impact of Contracting with DVBEs Contract Dollars Awarded to DVBEs $100 Percentage of DVBEs that are Small Business 78.00% Estimated Average Percent of Dollars Spent in State by Small DVBE 90.00% Estimated Average Percent of Dollars Spent (Not Kept in Retained Earnings) by Small DVBE 70.00% Estimated Job Creation by DVBEs that are Small Business 90.00% Contract Dollars Used by IMPLAN for Contracting with DVBEs that are SB $44.23 Percentage of DVBEs that are Large Business 22.00% Estimated Average Percent of Dollars Spent in State by Large DVBE 70.00% Estimated Average Percent of Dollars Spent (Not Kept in Retained Earnings) by Large DVBE 90.00% Estimated Job Creation by DVBEs that are Large Business 10.00% Contract Dollars used by IMPLAN for contracting with DVBEs that are Large Business $1.39 Net Contract Dollars Per $100 Used for IMPLAN for Contracting with DVBEs $46 Impact of Contracting with Large Businesses Contract Dollars Awarded to Large Business $100 Estimated Average Percent of Dollars Spent in State by Large Business 70.00% Estimated Average Percent of Dollars Spent (Not Kept in Retained Earnings) by Large Business 90.00% Estimated Job Creation by Large Business 10.00% Net Contract Dollars Per $100 Used for IMPLAN for Contracting with Large Business $6.30 Incremental Value of Contracting with SBs and DVBEs Net Incremental Dollars Between Small Business and Large Business $50.40 Net Incremental Dollars Between DVBEs and Large Business $39.31
Next, Figure 11 presented below shows the incremental value of contracts awarded to SBs and DVBEs over large businesses arising due to net new GSP creation, and after adjusting for aforementioned leakages. For every $100 awarded to SBs/MBs the incremental impact due to net new GSP creation is $31.50 over large businesses. Similarly, for every $100 awarded to DVBEs, the incremental impact due to net new GSP creation is $24.57 over large businesses. Figure 11. Impact of Contracting with SBs Based on Creation of Gross State Product and Leakages Contract Dollars Awarded to Small Business $100 Estimated Average Percent of Dollars Spent in State by SB 90.00% Estimated Average Percent of Dollars Spent (Not Kept in Retained Earnings) by SB 70.00% Estimated Gross State Product Created by Small Business 75.00% Net Contract Dollars Per $100 Used for IMPLAN for Contracting with SBs/MBs $47

27
Impact of Contracting with DVBEs Contract Dollars Awarded to DVBEs $100 Percentage of DVBEs that are Small Business 78.00% Estimated Average Percent of Dollars Spent in State by Small DVBE 90.00% Estimated Average Percent of Dollars Spent (Not Kept in Retained Earnings) by Small DVBE 70.00% Estimated Gross State Product Created by DVBEs that are Small Business 75.00% Contract Dollars used by IMPLAN for Contracting with DVBEs that are SB $36.86 Percentage of DVBEs that are Large Business 22.00% Estimated Average Percent of Dollars Spent in State by Large DVBE 70.00% Estimated Average Percent of Dollars Spent (Not Kept in Retained Earnings) by Large DVBE 90.00% Estimated Gross State Product Created by DVBEs that are Large Business 25.00% Contract Dollars used by IMPLAN for Contracting with DVBEs that are Large Business $3.47 Net contract dollars per $100 Used for IMPLAN for contracting with DVBEs $40 Impact of Contracting with Large Businesses Contract Dollars Awarded to Large Business $100 Estimated Average Percent of Dollars Spent in State by Large Business 70.00% Estimated Average Percent of Dollars Spent (Not Kept in Retained Earnings) by Large Business 90.00% Estimated GSP Creation by Large Business 25.00% Net Contract Dollars Used for IMPLAN for Contracting with Large Business $15.75 Incremental Value of Contracting with SBs and DVBEs Net Incremental Contract Dollars Between Small Business and Large Business $31.50 Net Incremental Contract Dollars Between DVBEs and Large Business $24.57
Figures 7 through 11 above help to frame the expected, best case (maximum impact), and worst case (minimum impact) scenarios for measuring the incremental benefit and value of contracts awarded to SBs and DVBEs compared to large businesses. The direct incremental impact of awarding contracts to SBs and DVBEs combined over large businesses, after factoring in net new job creation, net new GSP creation, and various leakages, is at least $882.66 million ($836.96 million for SBs and $45.7 million for DVBEs). This constitutes a worst case scenario. The direct incremental impact could be as high as $2.242 billion ($2.126 billion for SBs and $116.06 million for DVBEs) for a likely best case scenario. If all possible scenarios described in tables above were averaged, the direct incremental impact of awarding contracts to SBs and DVBEs averages $1.484 billion ($1.408 billion for SBs and $76.86 million for DVBEs). The direct incremental impact, however, does not account for the multiplier effect that creates second order and tertiary effects that ripple through the economy. This is shown in Figure 12 below and is discussed in the next section.

28
Figure 12. Incremental Value per $100 of Contracting with SBs and DVBEs over Contracting with Large Businesses DVBEs SBs/MBs Total Based on Job Creation Only $62.40 $80.00 Based on Job Creation and Other Leakages $39.31 $50.40 Based on Creation of Gross State Product Only $39.00 $50.00 Based on Creation of Gross State Product and Other Leakages $24.57 $31.50 Average Incremental Value Per $100 $41.32 $52.98 Lowest Incremental Value Per $100 $24.57 $31.50 Highest Incremental Value Per $100 $62.40 $80.00 Dollars Awarded in 2006-07 (in $ Millions) $186.00 $2,657 Direct Average Incremental Impact over Large Business (in $ Millions) $76.86 $1,407.55 $1,484.40 Direct Lowest Incremental Impact over Large Business (in $ Millions) $45.70 $836.96 $882.66 Direct Highest Incremental Impact over Large Business (in $ Millions) $116.06 $2,125.60 $2,241.66
Multiplier Effect of Small Business and DVBE Activity In addition, this study attempts to measure the second order effects of the State’s awarding contracts to DVBEs and SBs/MBs such as indirect and induced effects which impact the State’s GSP. As an example, small business employees and DVBE employees take home a pay check and then spend a portion on consumer goods. This creates demand for the goods purchased resulting in incremental new employment for the industries that those goods belong to. In turn the new employees working for those industries now take home their paychecks and spend on goods and services creating induced demand for goods and services purchased.
The benefit of using input-output models, including IMPLAN, is that they help evaluate the effects of industries on each other based on the supposition that industries use the outputs of other industries as inputs. Some other models measuring economic activity examine only the total output or employment of an industry, and not the dual causality that may run both ways. The use of an input-output model provides a much more comprehensive view of the inter-related economic impacts. It examines economic relationships between businesses and between business and consumers. This impact analysis then measures changes in any one or several economic variables on an entire economy. Each industry that produces goods and services has an influence on, and in turn is influenced by, the production of goods and services of other industries. These interrelationships are captured through a multiplier effect as the demand and supply trickle over from industry to industry (direct and derived demand) and thus impact total output, compensation, employment, etc. Multipliers may vary from one region to another depending on the strength of these interrelationships. IMPLAN data can be used to compute economic impact at the national, State, regional, and county levels. Of particular interest are industry output, employment, value added (as measured by employee compensation, proprietary income, other property type income, and indirect business taxes), and final demand of institutions (i.e., households, federal government, State and local governments, businesses).

29
The full range of economic impacts includes direct, indirect, and induced effects of contracting activity:
• Direct effects consist of economic activity contained exclusively within the designated sector(s). This includes all expenditures made and all people employed.
• Indirect effects define the creation of additional economic activity that results from
linked businesses, suppliers of goods and services, and provision of operating inputs.
• Induced effects measure the consumption expenditures of direct and indirect sector employees. Examples of induced costs include employees’ expenditures on items such as retail purchases, housing, banking, medical services, and insurance.
The total direct, indirect, and induced effects of the State’s awarding contracts to DVBEs, SBs, and MBs that measure the incremental value of contracting over large businesses and arising due to the multiplier effect are presented in four ways:
• Output accounts for total incremental revenues generated including all sources of income for a given time period for an industry in dollars. This is the best overall measure of business and economic activity lost because it is the measure most firms use to determine current activity levels.
• Employment demonstrates the new number of jobs created and is calculated in a full-time
equivalent employment value on an annual basis.
• Indirect Business Taxes consist of property taxes, excise taxes, fees, licenses, and sales taxes that have been created and will be paid by businesses. While all taxes during the normal operation of businesses are included, taxes on profits or income are not included.
• Labor Income includes all forms of incremental employee compensation that will now be
paid by employers (e.g., total payroll costs including benefits, wages and salaries of workers, health and life insurance, retirement payments, non-cash compensation), and proprietary income (e.g., self employment income, income received by private business owners including doctors, lawyers).
The multiplier effect for sales and employment reflects the increased economic activity that comes from sales being generated, and expenses being incurred, by a business. When a business generates sales, it must use some of that money to purchase other goods and other services and to hire people to meet the demand for its products and services. Purchases made by the business represent sales to other firms who must then also purchase goods and services and hire people to meet their new demand. The additional hiring to meet demand means more people will have income which they will use to purchase goods and services for their households. All of this brings added sales to firms in the community. The net effect is that sales dollars are recycled in the community through this

30
process of sales requiring additional purchases and employment, which results in sales for other firms who must use that money to make their own purchases and hire people.1 The IMPLAN model can be used to quantify the multiplier effect that occurs when new output or employment is added in the geographical area via the designated economic activities. The multiplier effect is generated when new output or employment is added in one sector, but generates additional output or employment in other sectors that supply goods and services (indirect impact) and consumer services to employees (induced impact). The largest component of final demand is household consumption. It includes all payments made by households to all industries for personal consumption of goods and services. Part of total labor income may not be available for spending since it may be used to pay personal taxes, principal and interest on loans, credit card payments, etc. It is also expected that spending patterns will vary from one income level to another. For example at the lower income levels, higher proportional spending takes place on food, clothing, and shelter. At the higher income levels, disposable income is higher for luxury spending. The findings of the IMPLAN analyses in total and separately for SBs and DVBEs are presented in Tables One through Seven at the end of this Summary Report. The impacts are separated into the four categories of output, employment, labor income, and indirect business taxes. They are further separated in each category into the major industrial sectors such as manufacturing, wholesaling, retailing, real estate, professional services, administrative, education, health, arts/entertainment/recreation, accommodations/food services, other, farming, federal, and State/local. IMPLAN analyses were used to compute the total economic impact (direct, indirect, and induced) of contracts awarded to SBs and DVBEs and SBs/MBs. These were conducted using different scenarios. The “Expected” scenario takes a conservative approach to measuring the economic value. The “Maximum” scenario is more optimistic but still considered well within the realm of possibility. The “Minimum” scenario describes what the impact would be at the very least—it is ultra conservative, and considered a “worst case scenario.”
Figure 13 describes the total economic impact of State contracts to SBs and DVBEs in the “Expected” scenario. In 2006‐07, the State awarded $2.657 billion in contracts to SBs and $186 million in contracts to DVBEs, for a total of $2.843 billion to both business groups. The direct incremental value of contracting with SBs and DVBEs is expected to be $1.484 billion after accounting for net new job creation, net new creation of GSP, leakages, and other differences between the economic activities of large businesses versus that for small businesses.
1 For example, assume Company A receives a new order for $1,000 worth of its products, and the raw materials going into those products cost it $700. In order to fill the order, Company A will have to purchase the $700 in raw materials to make those goods from another company (Company B). That $700 becomes new business for Company B, and it will have to purchase some amount from its supplier (Company C) so it can fill the order from Company A. Then, Company C will have to purchase materials from its supplier (Company D) to fill the order from Company B—and this cycle could continue on. Furthermore, Companies A, B, C, etc. may have to employ more people to fill the orders they receive (or have them work longer), and that results in additional wages for new/existing employees. These employees will now have more money to spend for their personal use, and their purchases create new orders for a variety of businesses within the area.

31
This direct incremental value of an average $1.484 billion produces an expected total impact on California’s economy of a net increase of GSP by $4.243 billion. In other words, contracts awarded to SBs and DVBEs produce additional new economic activity totaling $4.243 billion. This translates into the creation of 25,617 net new full time jobs, new labor income of $1.784 billion, and new indirect business taxes of approximately $134 million. Figure 13 also shows the distribution of the new economic activity across various industry sectors. The largest benefits from the new economic activity accrue to the professional services, manufacturing, and real estate industries.
Figure 13. Overall Expected Economic Impact Expected Expected Expected Expected Total Total Total Total Industry Output Employment Labor Income Business Taxes Manufacturing $316,751,637 719 $66,798,754 $6,352,111 Wholesaling $126,714,904 654 $48,875,779 $17,981,416 Retailing $225,055,346 2,654 $94,381,583 $29,200,444 Real Estate $316,879,352 1,912 $94,946,438 $17,148,111 Professional Services $2,234,214,358 10,685 $1,011,046,939 $30,365,591 Administrative $57,051,142 677 $27,857,545 $752,924 Education $24,480,701 387 $13,106,091 $202,964 Health $168,373,598 1,481 $95,516,949 $1,352,654 Arts, entertainment, recreation $99,597,582 614 $33,859,180 $3,360,489 Accommodations, food services $97,701,586 1,527 $35,264,519 $5,965,994 Other $314,587,979 1,373 $61,102,480 $21,266,783 Farming $11,566,695 85 $2,350,352 $229,640 Federal $75,490,427 649 $56,515,848 $0 State and local $174,827,254 2,200 $142,448,007 $0 Foreign trade $0 0 $0 $0 Total $4,243,292,561 25,617 $1,784,070,464 $134,179,121
Figure 14 presents the total economic impact from $2.843 billion awarded to SBs and DVBEs in contracts that describe the “Maximum” scenario. The net new creation of GSP could be as high as $6.408 billion. This translates into the creation of net new full time 38,685 jobs, $2.694 billion in new labor income, and approximately $203 billion in new indirect business taxes. The distribution across industries shows maximum benefit accrual to the professional services, manufacturing and real estate industries. Figure 14. Overall Maximum Economic Impact Maximum Maximum Maximum Maximum Total Total Total Total Industry Output Employment Labor Income Business Taxes Manufacturing $478,337,844 1,090 $100,875,165 $9,592,569 Wholesaling $191,356,656 988 $73,809,046 $27,154,371 Retailing $339,864,042 4,009 $142,528,963 $44,096,625 Real Estate $478,530,726 2,887 $143,381,981 $25,895,969 Professional Services $3,373,966,199 16,136 $1,526,817,800 $45,856,149 Administrative $86,154,946 1,021 $42,068,662 $1,137,019 Education $36,969,173 584 $19,791,972 $306,505

32
Figure 14. Overall Maximum Economic Impact (continued) Maximum Maximum Maximum Maximum Total Total Total Total Industry Output Employment Labor Income Business Taxes Health $254,266,926 2,236 $144,243,529 $2,042,687 Arts, entertainment, recreation $150,405,835 929 $51,131,940 $5,074,793 Accommodations, food services $147,542,623 2,305 $53,254,198 $9,009,459 Other $475,070,449 2,071 $92,273,011 $32,115,725 Farming $17,467,281 129 $3,549,358 $346,789 Federal $114,000,768 978 $85,346,577 $0 State and local $264,012,826 3,322 $215,115,781 $0 Foreign trade $0 0 $0 $0 Total $6,407,946,294 38,685 $2,694,187,983 $202,628,660
Figure 15 describes the total economic impact of State contracts to SBs and DVBEs in the “Minimum” scenario that describes the worst case scenario. At the very least, based on the data presented before, the total economic impact will be $2.523 billion in new gross State output, 15,234 net new full time jobs, $1.060 billion in new labor income, and $80 million in new indirect business taxes. Figure 15. Overall Minimum Economic Impact Minimum Minimum Minimum Minimum Total Total Total Total Industry Output Employment Labor Income Business Taxes Manufacturing $188,346,876 428 $39,719,866 $3,777,080 Wholesaling $75,347,228 389 $29,062,522 $10,692,112 Retailing $133,822,436 1,579 $56,121,183 $17,363,172 Real Estate $188,422,839 1,138 $56,457,066 $10,196,609 Professional Services $1,328,508,798 6,354 $601,188,858 $18,055,985 Administrative $33,923,756 401 $16,564,657 $447,705 Education $14,556,718 230 $7,793,145 $120,687 Health $100,118,329 881 $56,796,299 $804,315 Arts, entertainment, recreation $59,222,728 365 $20,133,353 $1,998,215 Accommodations, food services $58,095,330 909 $20,968,991 $3,547,500 Other $187,060,339 815 $36,332,758 $12,645,658 Farming $6,877,789 51 $1,397,567 $136,554 Federal $44,888,127 385 $33,605,456 $0 State and local $103,955,798 1,309 $84,702,448 $0 Foreign trade $0 0 $0 $0 Total $2,523,147,091 15,234 $1,060,844,169 $79,785,592
In 2006‐07, the State awarded contracts totaling $9.387 billion. The net new GSP creation due to contracts awarded by the State to SBs and DVBEs is two thirds (68%) of the total amount awarded under the best case scenario, 45% under the “Expected” scenario, and 27% under the “minimum” scenario. In other words, the State created 68% more value by awarding contracts to SBs and DVBEs over large businesses under the best case scenario, 27% more value under the worst case scenario, and on average produced new economic activity that is 50% more.

33
Economic Impact Effects on Residents and State Programs The economic impact can affect the residents of California directly as a result of the incremental economic activity and the additional labor income and as a result of the increased business tax dollars that benefit State programs. The details are presented in Tables Eight through Ten. Presented below in Figure 16 and in Table Eight is an illustration of how the total incremental economic activity would benefit housing units and individual residents of the State. As shown, if the increased activity were to be divided equally, each household would benefit by at least $186.48 and as much as $473.59 each year. Similarly, every resident of California would receive at least $66.14 and as much as $111.23 each year in benefit from the State’s SB and DVBE programs. Figure 16. Impact of Total Output on Residents of California Expected Maximum Minimum Total Net Incremental Benefit $4,243,292,561 $6,407,946,294 $2,523,147,091 Number of Housing Units in California* 13,530,719 13,530,719 13,530,719 Benefit per Household $313.60 $473.59 $186.48 Population of California** 38,148,493 38,148,493 38,148,493 Benefit per Resident of State $111.23 $167.97 $66.14
Presented in Figure 17 and in Table Nine are illustrations of how the incremental labor income would be spent in California. This is based on U.S. Bureau of the Census data on how consumers spend their incomes. As is apparent, the monies would be widely disbursed so that all sectors of California’s economy would benefit. Figure 17. How Incremental Labor Income Could be Spent Expected Maximum Minimum Incremental Labor Income $1,784,070,464 $2,694,187,983 $1,060,844,169 Food $222,147,590 $335,472,943 $132,093,424 Alcoholic beverages $20,700,257 $31,260,192 $12,308,789 Housing $622,590,502 $940,195,963 $370,204,830 Apparel and services $65,980,131 $99,638,932 $39,233,112 Transportation $315,190,127 $475,979,772 $187,418,387 Health care $88,542,480 $133,711,135 $52,649,139 Entertainment $92,173,560 $139,194,557 $54,808,252 Personal care products and services $21,134,746 $31,916,328 $12,567,145 Reading $4,469,021 $6,748,827 $2,657,370 Education $29,421,056 $44,429,778 $17,494,351 Miscellaneous $41,276,375 $62,332,916 $24,543,763 Cash contributions $72,931,942 $110,137,107 $43,366,799 Personal insurance and pensions $187,512,677 $283,169,533 $111,498,808

34
Finally, while it is unknown how the incremental business tax dollars would be spent, shown below in Figure 18 (only a sample) and in Table Ten are the percentages of each State agency/department “General Fund” portion of its budget that could be paid for by the economic activities caused by the State’s SB and DVBE programs. It is important to note that the increased business tax dollars were applied to each budget and this does not mean it would cover all of the General Fund portions of the budgets shown below. Figure 18. Sample of How Incremental Business Tax Dollars Could Fund State Agency General Fund Portion of their Budgets Expected Maximum Minimum Tax Dollars* Tax Dollars* Tax Dollars* California Conservations Corps 358.9% 542.0% 213.4% Coastal Commission 1197.0% 1807.6% 711.7% Department of Aging 273.4% 412.9% 162.6% Department of Child Support Services 33.5% 50.6% 19.9% Department of Conservation 1158.4% 1749.4% 688.8% Department of Fish & Game 157.6% 238.0% 93.7% Department of Food & Agriculture 136.9% 206.7% 81.4% Department of Forestry & Fire Protection 13.1% 19.7% 7.8% Department of General Services 1318.2% 1990.7% 783.8% Depart. of Housing & Community Development 1342.1% 2026.7% 798.0% Department of Parks & Recreation 94.5% 142.8% 56.2% Department of Public Health 38.3% 57.9% 22.8% Department of Rehabilitation 237.8% 359.0% 141.4% Department of Veterans Affairs 75.2% 113.6% 44.7% Employment Development Department 481.6% 727.2% 286.3% Environmental Protection 161.3% 243.6% 95.9%
*If percent exceeds 100.0%, it indicates the taxes could pay more than the General Revenue budget request.

35
SUMMARY AND CONCLUSIONS OF THE STUDY The incremental value of the State awarding contracts to SBs and DVBEs is positive, resulting in tremendous net new job creation, creation of net new GSP, net new labor income for California employees, and indirect business taxes. Small business accounts for 99.2% of all employer firms and drives the economic engine of the State. This study documents several attributes of SBs and DVBEs of interest:
• There are significant economic benefits to the State of California generated by State
government contracting with SBs and DVBEs (i.e. new jobs created, additional business and income taxes paid, goods, homes, cars purchased, etc.) that are incremental and over and above what would have been produced by large businesses.
• The direct incremental value of contracting by the State with SBs and DVBEs is at least
$883 million, averages around $1.484 billion, and is as high as $2.242 billion.
• The total net new economic activity generated by the State through contracting with SBs and DVBEs through gross State output is approximately $4.243 billion, is at least $2.523 billion, and is as high as $6.408 billion.
• The total net new jobs created due to State contracting with SBs and DVBEs range
between 15,234 and 38,685 with the average being approximately 25,617.
• In 2006-07, the State awarded contracts totaling $9.387 billion. The net new GSP creation due to contracts awarded by the State to SBs and DVBEs is two thirds (68%) of the total amount awarded under the best case scenario, 45% under the “average” scenario, and 27% under the “minimum” scenario. In other words, the State created 68% more value by awarding contracts to SBs and DVBEs over large businesses under the best case scenario, 27% more value under the worst case scenario, and on average produced new economic activity that is 50% more than if awarding the contracts to large businesses.
• Most of the SB and DVBE respondents (62.5% in survey conducted) have tried to obtain
contracts with the State.
• The main reasons respondents gave for not trying to bid for a State contract(s) are that they either did not know of bid opportunities (28.0%) or they felt that the products/services they offer did not match the State’s needs (28.0%).
• Bid success seems to be a function of the number of applications made. For example,
56.9% of the respondents who have bid two to five times have been successful at least once, and 85.4% of the respondents who bid for at least six contracts have been successful at least once.

36
• Most respondents (76.0%) indicated they are somewhat or very interested in bidding for State contracts. This demonstrates that the DGS list is viable in identifying possible SBs and DVBEs for bid opportunities.
• Survey results suggest that additional SB and DVBE education may be appropriate to
improve their knowledge of how the preference program works.
• Most survey respondents (79.0%) said they would like additional information on contracting with the State and the bid opportunities and processes.

37
TABLE ONE: TOTAL PROJECTED ECONOMIC IMPACTS
Expected Impact Expected Output Industry Indirect Induced Total* Manufacturing $53,006,206 $263,745,431 $316,751,637 Wholesaling $13,297,476 $113,417,428 $126,714,904 Retailing $17,938,678 $207,116,668 $225,055,346 Real Estate $50,155,612 $266,723,740 $316,879,352 Professional Services $358,177,863 $391,626,543 $2,234,214,358 Administrative $25,642,573 $31,408,569 $57,051,142 Education $151,288 $24,329,413 $24,480,701 Health $18,394 $168,355,204 $168,373,598 Arts, entertainment, recreation $62,353,581 $37,244,001 $99,597,582 Accommodations, food services $17,946,417 $79,755,169 $97,701,586 Other $51,542,588 $263,045,391 $314,587,979 Farming $484,934 $11,081,761 $11,566,695 Federal $3,842,639 $71,647,788 $75,490,427 State and local $4,619,785 $170,207,469 $174,827,254 Foreign trade $0 $0 $0 Total* $659,178,034 $2,099,704,575 $4,243,292,561 Expected Employment Industry Indirect Induced Total* Manufacturing 154 565 719 Wholesaling 69 585 654 Retailing 170 2,484 2,654 Real Estate 333 1,579 1,912 Professional Services 1,872 2,268 10,685 Administrative 275 402 677 Education 2 385 387 Health 0 1,481 1,481 Arts, entertainment, recreation 275 339 614 Accommodations, food services 276 1,251 1,527 Other 379 994 1,373 Farming 4 81 85 Federal 35 614 649 State and local 22 2,178 2,200 Foreign trade 0 0 0 Total* 3,866 15,206 25,617

38
Expected Labor Income Industry Indirect Induced Total* Manufacturing $13,376,959 $53,421,795 $66,798,754 Wholesaling $5,142,092 $43,733,687 $48,875,779 Retailing $7,123,521 $87,258,062 $94,381,583 Real Estate $9,731,225 $85,215,213 $94,946,438 Professional Services $153,436,440 $168,316,955 $1,011,046,939 Administrative $12,147,604 $15,709,941 $27,857,545 Education $70,572 $13,035,519 $13,106,091 Health $7,226 $95,509,723 $95,516,949 Arts, entertainment, recreation $20,296,081 $13,563,099 $33,859,180 Accommodations, food services $6,473,801 $28,790,718 $35,264,519 Other $21,246,408 $39,856,072 $61,102,480 Farming $94,364 $2,255,988 $2,350,352 Federal $2,957,195 $53,558,653 $56,515,848 State and local $2,164,735 $140,283,272 $142,448,007 Foreign trade $0 $0 $0 Total* $254,268,223 $840,508,697 $1,784,070,464 Expected Indirect Business Taxes Industry Indirect Induced Total* Manufacturing $2,032,307 $4,319,804 $6,352,111 Wholesaling $1,896,131 $16,085,285 $17,981,416 Retailing $971,985 $28,228,459 $29,200,444 Real Estate $5,501,238 $11,646,873 $17,148,111 Professional Services $6,967,184 $9,301,070 $30,365,591 Administrative $302,463 $450,461 $752,924 Education $970 $201,994 $202,964 Health $120 $1,352,534 $1,352,654 Arts, entertainment, recreation $1,348,375 $2,012,114 $3,360,489 Accommodations, food services $1,133,723 $4,832,271 $5,965,994 Other $1,202,898 $20,063,885 $21,266,783 Farming $10,919 $218,721 $229,640 Federal $0 $0 $0 State and local $0 $0 $0 Foreign trade $0 $0 $0 Total* $21,368,313 $98,713,471 $134,179,121

39
Maximum Impact Maximum Output Industry Indirect Induced Total* Manufacturing $80,046,528 $398,291,316 $478,337,844 Wholesaling $20,080,990 $171,275,666 $191,356,656 Retailing $27,089,834 $312,774,208 $339,864,042 Real Estate $75,741,767 $402,788,959 $478,530,726 Professional Services $540,897,096 $591,409,103 $3,373,966,199 Administrative $38,723,757 $47,431,189 $86,154,946 Education $228,467 $36,740,706 $36,969,173 Health $27,777 $254,239,149 $254,266,926 Arts, entertainment, recreation $94,162,346 $56,243,489 $150,405,835 Accommodations, food services $27,101,520 $120,441,103 $147,542,623 Other $77,836,288 $397,234,161 $475,070,449 Farming $732,319 $16,734,962 $17,467,281 Federal $5,802,906 $108,197,862 $114,000,768 State and local $6,976,497 $257,036,329 $264,012,826 Foreign trade $0 $0 $0 Total* $995,448,092 $3,170,838,202 $6,407,946,294 Maximum Employment Industry Indirect Induced Total* Manufacturing 235 855 1,090 Wholesaling 104 884 988 Retailing 257 3,752 4,009 Real Estate 503 2,384 2,887 Professional Services 2,826 3,425 16,136 Administrative 415 606 1,021 Education 3 581 584 Health 0 2,236 2,236 Arts, entertainment, recreation 416 513 929 Accommodations, food services 417 1,888 2,305 Other 571 1,500 2,071 Farming 6 123 129 Federal 52 926 978 State and local 34 3,288 3,322 Foreign trade 0 0 0 Total* 5,839 22,961 38,685

40
Maximum Labor Income Industry Indirect Induced Total* Manufacturing $20,201,016 $80,674,149 $100,875,165 Wholesaling $7,765,255 $66,043,791 $73,809,046 Retailing $10,757,481 $131,771,482 $142,528,963 Real Estate $14,695,467 $128,686,514 $143,381,981 Professional Services $231,709,807 $254,181,385 $1,526,817,800 Administrative $18,344,525 $23,724,137 $42,068,662 Education $106,574 $19,685,398 $19,791,972 Health $10,914 $144,232,615 $144,243,529 Arts, entertainment, recreation $30,649,827 $20,482,113 $51,131,940 Accommodations, food services $9,776,317 $43,477,881 $53,254,198 Other $32,084,947 $60,188,064 $92,273,011 Farming $142,509 $3,406,849 $3,549,358 Federal $4,465,765 $80,880,812 $85,346,577 State and local $3,269,042 $211,846,739 $215,115,781 Foreign trade $0 $0 $0 Total* $383,979,446 $1,269,281,929 $2,694,187,983 Maximum Indirect Business Taxes Industry Indirect Induced Total* Manufacturing $3,069,067 $6,523,502 $9,592,569 Wholesaling $2,863,414 $24,290,957 $27,154,371 Retailing $1,467,829 $42,628,796 $44,096,625 Real Estate $8,307,615 $17,588,354 $25,895,969 Professional Services $10,521,398 $14,045,863 $45,856,149 Administrative $456,760 $680,259 $1,137,019 Education $1,465 $305,040 $306,505 Health $180 $2,042,507 $2,042,687 Arts, entertainment, recreation $2,036,229 $3,038,564 $5,074,793 Accommodations, food services $1,712,076 $7,297,383 $9,009,459 Other $1,816,543 $30,299,182 $32,115,725 Farming $16,492 $330,297 $346,789 Federal $0 $0 $0 State and local $0 $0 $0 Foreign trade $0 $0 $0 Total* $32,269,068 $149,070,704 $202,628,660

41
Minimum Impact Minimum Output Industry Indirect Induced Total* Manufacturing $31,518,548 $156,828,328 $188,346,876 Wholesaling $7,906,947 $67,440,281 $75,347,228 Retailing $10,666,698 $123,155,738 $133,822,436 Real Estate $29,823,536 $158,599,303 $188,422,839 Professional Services $212,979,774 $232,869,024 $1,328,508,798 Administrative $15,247,589 $18,676,167 $33,923,756 Education $89,960 $14,466,758 $14,556,718 Health $10,938 $100,107,391 $100,118,329 Arts, entertainment, recreation $37,076,694 $22,146,034 $59,222,728 Accommodations, food services $10,671,302 $47,424,028 $58,095,330 Other $30,648,260 $156,412,079 $187,060,339 Farming $288,350 $6,589,439 $6,877,789 Federal $2,284,912 $42,603,215 $44,888,127 State and local $2,747,017 $101,208,781 $103,955,798 Foreign trade $0 $0 $0 Total* $391,960,525 $1,248,526,566 $2,523,147,091 Minimum Employment Industry Indirect Induced Total* Manufacturing 92 336 428 Wholesaling 41 348 389 Retailing 101 1,478 1,579 Real Estate 198 940 1,138 Professional Services 1,113 1,349 6,354 Administrative 163 238 401 Education 1 229 230 Health 0 881 881 Arts, entertainment, recreation 164 201 365 Accommodations, food services 165 744 909 Other 225 590 815 Farming 2 49 51 Federal 20 365 385 State and local 14 1,295 1,309 Foreign trade 0 0 0 Total* 2,299 9,043 15,234

42
Minimum Labor Income Industry Indirect Induced Total* Manufacturing $7,954,200 $31,765,666 $39,719,866 Wholesaling $3,057,592 $26,004,930 $29,062,522 Retailing $4,235,787 $51,885,396 $56,121,183 Real Estate $5,786,381 $50,670,685 $56,457,066 Professional Services $91,236,393 $100,084,645 $601,188,858 Administrative $7,223,209 $9,341,448 $16,564,657 Education $41,964 $7,751,181 $7,793,145 Health $4,296 $56,792,003 $56,796,299 Arts, entertainment, recreation $12,068,460 $8,064,893 $20,133,353 Accommodations, food services $3,849,452 $17,119,539 $20,968,991 Other $12,633,539 $23,699,219 $36,332,758 Farming $56,113 $1,341,454 $1,397,567 Federal $1,758,407 $31,847,049 $33,605,456 State and local $1,287,195 $83,415,253 $84,702,448 Foreign trade $0 $0 $0 Total* $151,192,988 $499,783,361 $1,060,844,169 Minimum Indirect Business Taxes Industry Indirect Induced Total* Manufacturing $1,208,438 $2,568,642 $3,777,080 Wholesaling $1,127,479 $9,564,633 $10,692,112 Retailing $577,959 $16,785,213 $17,363,172 Real Estate $3,271,145 $6,925,464 $10,196,609 Professional Services $4,142,829 $5,530,595 $18,055,985 Administrative $179,851 $267,854 $447,705 Education $577 $120,110 $120,687 Health $71 $804,244 $804,315 Arts, entertainment, recreation $801,771 $1,196,444 $1,998,215 Accommodations, food services $674,135 $2,873,365 $3,547,500 Other $715,270 $11,930,388 $12,645,658 Farming $6,496 $130,058 $136,554 Federal $0 $0 $0 State and local $0 $0 $0 Foreign trade $0 $0 $0 Total* $12,706,021 $58,697,010 $79,785,592
*Includes Direct Benefits not shown in the Table.

43
TABLE TWO: EXPECTED IMPACT FROM CERTIFIED SMALL BUSINESSES
Output Industry Indirect Induced Total* Manufacturing $50,261,637 $250,089,189 $300,350,818 Wholesaling $12,608,957 $107,544,883 $120,153,837 Retailing $17,009,846 $196,392,551 $213,402,396 Real Estate $47,558,646 $252,913,278 $300,471,920 Professional Services $339,632,079 $371,348,847 $2,118,530,866 Administrative $24,314,847 $29,782,291 $54,097,138 Education $143,455 $23,069,680 $23,213,135 Health $17,442 $159,638,082 $159,655,521 Arts, entertainment, recreation $59,125,028 $35,315,577 $94,440,604 Accommodations, food services $17,017,185 $75,625,594 $92,642,775 Other $48,873,810 $249,425,385 $298,299,197 Farming $459,825 $10,507,969 $10,967,794 Federal $3,643,675 $67,937,998 $71,581,672 State and local $4,380,580 $161,394,442 $165,775,022 Foreign trade $0 $0 $0 Total* $625,047,012 $1,990,985,766 $4,023,582,695
Employment Industry Indirect Induced Total* Manufacturing 147 537 687 Wholesaling 65 555 620 Retailing 161 2,356 2,517 Real Estate 316 1,497 1,813 Professional Services 1,775 2,151 10,132 Administrative 261 381 641 Education 2 365 367 Health 0 1,404 1,404 Arts, entertainment, recreation 261 322 583 Accommodations, food services 262 1,186 1,447 Other 359 942 1,301 Farming 4 77 81 Federal 33 582 614 State and local 21 2,065 2,086 Foreign trade 0 0 0 Total* 3,667 14,417 24,293

44
Labor Income Industry Indirect Induced Total* Manufacturing $12,684,321 $50,655,712 $63,340,028 Wholesaling $4,875,844 $41,469,238 $46,345,083 Retailing $6,754,678 $82,740,000 $89,494,679 Real Estate $9,227,360 $80,802,928 $90,030,289 Professional Services $145,491,787 $159,601,815 $958,696,776 Administrative $11,518,624 $14,896,510 $26,415,133 Education $66,918 $12,360,564 $12,427,482 Health $6,852 $90,564,407 $90,571,260 Arts, entertainment, recreation $19,245,187 $12,860,828 $32,106,014 Accommodations, food services $6,138,600 $27,299,988 $33,438,587 Other $20,146,306 $37,792,398 $57,938,706 Farming $89,479 $2,139,177 $2,228,661 Federal $2,804,077 $50,785,484 $53,589,560 State and local $2,052,649 $133,019,664 $135,072,312 Foreign trade $0 $0 $0 Total* $241,102,682 $796,988,713 $1,691,694,570
Indirect Business Tax Industry Indirect Induced Total* Manufacturing $1,927,082 $4,096,142 $6,023,216 Wholesaling $1,797,953 $15,252,419 $17,050,371 Retailing $921,658 $26,766,842 $27,688,498 Real Estate $5,216,394 $11,043,819 $16,260,214 Professional Services $6,606,439 $8,819,477 $28,793,312 Administrative $286,802 $427,137 $713,940 Education $920 $191,535 $192,455 Health $114 $1,282,502 $1,282,615 Arts, entertainment, recreation $1,278,559 $1,907,930 $3,186,490 Accommodations, food services $1,075,021 $4,582,065 $5,657,086 Other $1,140,615 $19,025,014 $20,165,628 Farming $10,355 $207,396 $217,750 Federal $0 $0 $0 State and local $0 $0 $0 Foreign trade $0 $0 $0 Total* $20,261,912 $93,602,278 $127,231,575
*Includes Direct Benefits not shown in the Table.

45
TABLE THREE: MAXIMUM EXPECTED IMPACT FROM CERTIFIED SMALL BUSINESSES
Output Industry Indirect Induced Total* Manufacturing $75,902,192 $377,670,134 $453,572,320 Wholesaling $19,041,314 $162,408,017 $181,449,325 Retailing $25,687,281 $296,580,595 $322,267,875 Real Estate $71,820,303 $381,934,909 $453,755,208 Professional Services $512,892,621 $560,789,408 $3,199,282,059 Administrative $36,718,868 $44,975,481 $81,694,348 Education $216,638 $34,838,487 $35,055,126 Health $26,339 $241,076,137 $241,102,476 Arts, entertainment, recreation $89,287,173 $53,331,532 $142,618,702 Accommodations, food services $25,698,363 $114,205,370 $139,903,734 Other $73,806,381 $376,667,708 $450,474,090 Farming $694,403 $15,868,524 $16,562,926 Federal $5,502,466 $102,596,011 $108,098,477 State and local $6,615,295 $243,728,496 $250,343,791 Foreign trade $0 $0 $0 Total* $943,909,637 $3,006,670,809 $6,076,180,457
Employment Industry Indirect Induced Total* Manufacturing 224 812 1,038 Wholesaling 99 838 937 Retailing 244 3,558 3,801 Real Estate 477 2,261 2,738 Professional Services 2,680 3,248 15,301 Administrative 393 575 968 Education 3 551 554 Health 0 2,120 2,120 Arts, entertainment, recreation 394 486 880 Accommodations, food services 395 1,790 2,186 Other 542 1,422 1,965 Farming 6 116 122 Federal 49 878 928 State and local 32 3,118 3,150 Foreign trade 0 0 0 Total* 5,539 21,773 36,687

46
Labor Income Industry Indirect Induced Total* Manufacturing $19,155,129 $76,497,313 $95,652,431 Wholesaling $7,363,216 $62,624,431 $69,987,650 Retailing $10,200,522 $124,949,130 $135,149,654 Real Estate $13,934,622 $122,023,882 $135,958,503 Professional Services $219,713,233 $241,021,365 $1,447,768,093 Administrative $17,394,754 $22,495,841 $39,890,596 Education $101,056 $18,666,203 $18,767,259 Health $10,348 $136,765,097 $136,775,446 Arts, entertainment, recreation $29,062,959 $19,421,671 $48,484,631 Accommodations, food services $9,270,156 $41,226,851 $50,497,008 Other $30,423,779 $57,071,880 $87,495,660 Farming $135,129 $3,230,462 $3,365,593 Federal $4,234,554 $76,693,278 $80,927,832 State and local $3,099,791 $200,878,559 $203,978,349 Foreign trade $0 $0 $0 Total* $364,099,248 $1,203,565,963 $2,554,698,705
Indirect Business Tax Industry Indirect Induced Total* Manufacturing $2,910,172 $6,185,752 $9,095,917 Wholesaling $2,715,163 $23,033,314 $25,748,478 Retailing $1,391,834 $40,421,726 $41,813,560 Real Estate $7,877,495 $16,677,733 $24,555,227 Professional Services $9,976,660 $13,318,654 $43,481,988 Administrative $433,113 $645,039 $1,078,151 Education $1,389 $289,247 $290,636 Health $171 $1,936,758 $1,936,931 Arts, entertainment, recreation $1,930,803 $2,881,246 $4,812,051 Accommodations, food services $1,623,435 $6,919,567 $8,543,003 Other $1,722,494 $28,730,466 $30,452,963 Farming $15,639 $313,195 $328,835 Federal $0 $0 $0 State and local $0 $0 $0 Foreign trade $0 $0 $0 Total* $30,598,368 $141,352,697 $192,137,740
*Includes Direct Benefits not shown in the Table.

47
TABLE FOUR: MINIMUM EXPECTED IMPACT FROM CERTIFIED SMALL BUSINESSES
Output Industry Indirect Induced Total* Manufacturing $29,886,666 $148,708,498 $178,595,171 Wholesaling $7,497,562 $63,948,539 $71,446,099 Retailing $10,114,426 $116,779,311 $126,893,738 Real Estate $28,279,412 $150,387,774 $178,667,187 Professional Services $201,952,680 $220,812,156 $1,259,724,860 Administrative $14,458,141 $17,709,202 $32,167,343 Education $85,302 $13,717,737 $13,803,039 Health $10,371 $94,924,298 $94,934,672 Arts, entertainment, recreation $35,157,037 $20,999,416 $56,156,452 Accommodations, food services $10,118,792 $44,968,634 $55,087,423 Other $29,061,437 $148,313,795 $177,375,231 Farming $273,422 $6,248,268 $6,521,692 Federal $2,166,609 $40,397,420 $42,564,029 State and local $2,604,789 $95,968,664 $98,573,453 Foreign trade $0 $0 $0 Total* $371,666,646 $1,183,883,712 $2,392,510,389
Employment Industry Indirect Induced Total* Manufacturing 88 319 408 Wholesaling 39 330 369 Retailing 96 1,401 1,497 Real Estate 188 891 1,078 Professional Services 1,055 1,279 6,025 Administrative 155 226 381 Education 1 217 218 Health 0 835 835 Arts, entertainment, recreation 155 191 347 Accommodations, food services 156 705 861 Other 213 560 773 Farming 2 46 48 Federal 19 346 365 State and local 13 1,228 1,240 Foreign trade 0 0 0 Total* 2,180 8,573 14,445

48
Labor Income Industry Indirect Induced Total* Manufacturing $7,542,364 $30,120,987 $37,663,365 Wholesaling $2,899,284 $24,658,517 $27,557,800 Retailing $4,016,479 $49,199,015 $53,215,494 Real Estate $5,486,790 $48,047,193 $53,533,983 Professional Services $86,512,604 $94,902,733 $570,062,142 Administrative $6,849,225 $8,857,791 $15,707,016 Education $39,791 $7,349,861 $7,389,653 Health $4,074 $53,851,578 $53,855,654 Arts, entertainment, recreation $11,443,611 $7,647,330 $19,090,940 Accommodations, food services $3,650,145 $16,233,170 $19,883,316 Other $11,979,436 $22,472,187 $34,451,624 Farming $53,208 $1,272,001 $1,325,211 Federal $1,667,365 $30,198,158 $31,865,524 State and local $1,220,550 $79,096,402 $80,316,953 Foreign trade $0 $0 $0 Total* $143,364,926 $473,906,923 $1,005,918,675
Indirect Business Tax Industry Indirect Induced Total* Manufacturing $1,145,878 $2,435,652 $3,581,538 Wholesaling $1,069,103 $9,069,421 $10,138,523 Retailing $548,037 $15,916,151 $16,464,186 Real Estate $3,101,781 $6,566,896 $9,668,678 Professional Services $3,928,335 $5,244,248 $17,121,135 Administrative $170,539 $253,986 $424,525 Education $547 $113,891 $114,438 Health $68 $762,605 $762,672 Arts, entertainment, recreation $760,259 $1,134,499 $1,894,757 Accommodations, food services $639,231 $2,724,596 $3,363,827 Other $678,237 $11,312,689 $11,990,926 Farming $6,158 $123,324 $129,479 Federal $0 $0 $0 State and local $0 $0 $0 Foreign trade $0 $0 $0 Total* $12,048,173 $55,657,958 $75,654,684
*Includes Direct Benefits not shown in the Table.

49
TABLE FIVE: EXPECTED IMPACT FROM DISABLED VETERAN BUSINESS ENTERPRISES
Output Industry Indirect Induced Total* Manufacturing $2,744,569 $13,656,242 $16,400,816 Wholesaling $688,519 $5,872,545 $6,561,063 Retailing $928,832 $10,724,117 $11,652,950 Real Estate $2,596,966 $13,810,462 $16,407,426 Professional Services $18,545,784 $20,277,696 $115,683,489 Administrative $1,327,726 $1,626,278 $2,954,003 Education $7,833 $1,259,733 $1,267,566 Health $952 $8,717,122 $8,718,074 Arts, entertainment, recreation $3,228,553 $1,928,424 $5,156,979 Accommodations, food services $929,232 $4,129,575 $5,058,807 Other $2,668,778 $13,620,006 $16,288,784 Farming $25,109 $573,792 $598,903 Federal $198,964 $3,709,790 $3,908,754 State and local $239,205 $8,813,027 $9,052,231 Foreign trade $0 $0 $0 Total* $34,131,022 $108,718,809 $219,709,845
Employment Industry Indirect Induced Total* Manufacturing 7 28 36 Wholesaling 4 30 34 Retailing 9 128 138 Real Estate 17 82 99 Professional Services 97 117 553 Administrative 14 21 35 Education 0 20 20 Health 0 77 77 Arts, entertainment, recreation 14 17 32 Accommodations, food services 14 65 79 Other 20 52 71 Farming 0 4 4 Federal 2 32 34 State and local 1 113 114 Foreign trade 0 0 0 Total* 199 785 1,325

50
Labor Income Industry Indirect Induced Total* Manufacturing $692,638 $2,766,083 $3,458,712 Wholesaling $266,248 $2,264,449 $2,530,697 Retailing $368,843 $4,518,062 $4,886,905 Real Estate $503,865 $4,412,285 $4,916,151 Professional Services $7,944,653 $8,715,140 $52,350,140 Administrative $628,980 $813,431 $1,442,413 Education $3,654 $674,955 $678,609 Health $374 $4,945,316 $4,945,692 Arts, entertainment, recreation $1,050,894 $702,271 $1,753,166 Accommodations, food services $335,201 $1,490,730 $1,825,932 Other $1,100,102 $2,063,674 $3,163,772 Farming $4,885 $116,811 $121,697 Federal $153,118 $2,773,169 $2,926,286 State and local $112,086 $7,263,608 $7,375,694 Foreign trade $0 $0 $0 Total* $13,165,541 $43,519,984 $92,375,866
Indirect Business Tax Industry Indirect Induced Total* Manufacturing $105,225 $223,662 $328,894 Wholesaling $98,178 $832,866 $931,044 Retailing $50,327 $1,461,617 $1,511,944 Real Estate $284,844 $603,054 $887,897 Professional Services $360,745 $481,593 $1,572,273 Administrative $15,661 $23,324 $38,985 Education $50 $10,459 $10,509 Health $6 $70,032 $70,039 Arts, entertainment, recreation $69,816 $104,184 $173,999 Accommodations, food services $58,702 $250,206 $308,908 Other $62,283 $1,038,871 $1,101,153 Farming $564 $11,325 $11,891 Federal $0 $0 $0 State and local $0 $0 $0 Foreign trade $0 $0 $0 Total* $1,106,401 $5,111,193 $6,947,536
*Includes Direct Benefits not shown in the Table.

51
TABLE SIX: MAXIMUM EXPECTED IMPACT FROM DISABLED VETERAN BUSINESS ENTERPRISES
Output Industry Indirect Induced Total* Manufacturing $4,144,336 $20,621,182 $24,765,528 Wholesaling $1,039,676 $8,867,649 $9,907,325 Retailing $1,402,553 $16,193,613 $17,596,166 Real Estate $3,921,464 $20,854,050 $24,775,514 Professional Services $28,004,475 $30,619,695 $174,684,168 Administrative $2,004,889 $2,455,708 $4,460,597 Education $11,829 $1,902,219 $1,914,047 Health $1,438 $13,163,012 $13,164,451 Arts, entertainment, recreation $4,875,173 $2,911,957 $7,787,133 Accommodations, food services $1,403,157 $6,235,733 $7,638,892 Other $4,029,907 $20,566,453 $24,596,363 Farming $37,916 $866,438 $904,353 Federal $300,440 $5,601,851 $5,902,291 State and local $361,202 $13,307,833 $13,669,035 Foreign trade $0 $0 $0 Total* $51,538,455 $164,167,393 $331,765,863
Employment Industry Indirect Induced Total* Manufacturing 11 43 56 Wholesaling 5 46 51 Retailing 13 194 207 Real Estate 26 123 149 Professional Services 146 177 835 Administrative 22 31 53 Education 0 30 30 Health 0 116 116 Arts, entertainment, recreation 22 27 48 Accommodations, food services 22 98 119 Other 29 78 107 Farming 0 7 7 Federal 3 48 51 State and local 2 170 172 Foreign trade 0 0 0 Total* 301 1,188 2,002

52
Labor Income Industry Indirect Induced Total* Manufacturing $1,045,887 $4,176,836 $5,222,716 Wholesaling $402,039 $3,419,360 $3,821,399 Retailing $556,959 $6,822,352 $7,379,314 Real Estate $760,845 $6,662,632 $7,423,477 Professional Services $11,996,574 $13,160,020 $79,049,668 Administrative $949,771 $1,228,296 $2,178,068 Education $5,518 $1,019,195 $1,024,712 Health $566 $7,467,518 $7,468,083 Arts, entertainment, recreation $1,586,868 $1,060,442 $2,647,313 Accommodations, food services $506,161 $2,251,030 $2,757,190 Other $1,661,168 $3,116,184 $4,777,355 Farming $7,380 $176,387 $183,767 Federal $231,211 $4,187,534 $4,418,744 State and local $169,251 $10,968,180 $11,137,433 Foreign trade $0 $0 $0 Total* $19,880,198 $65,715,966 $139,489,239
Indirect Business Tax Industry Indirect Induced Total* Manufacturing $158,895 $337,750 $496,639 Wholesaling $148,251 $1,257,643 $1,405,894 Retailing $75,995 $2,207,070 $2,283,062 Real Estate $430,120 $910,621 $1,340,740 Professional Services $544,738 $727,209 $2,374,162 Administrative $23,647 $35,220 $58,869 Education $76 $15,793 $15,869 Health $9 $105,749 $105,759 Arts, entertainment, recreation $105,426 $157,318 $262,744 Accommodations, food services $88,641 $377,816 $466,458 Other $94,049 $1,568,716 $1,662,764 Farming $853 $17,102 $17,955 Federal $0 $0 $0 State and local $0 $0 $0 Foreign trade $0 $0 $0 Total* $1,670,700 $7,718,007 $10,490,915
*Includes Direct Benefits not shown in the Table.

53
TABLE SEVEN: MINIMUM EXPECTED IMPACT FROM DISABLED VETERAN BUSINESS ENTERPRISES
Output Industry Indirect Induced Total* Manufacturing $1,631,882 $8,119,830 $9,751,719 Wholesaling $409,385 $3,491,742 $3,901,127 Retailing $552,272 $6,376,427 $6,928,697 Real Estate $1,544,124 $8,211,529 $9,755,653 Professional Services $11,027,094 $12,056,868 $68,783,961 Administrative $789,448 $966,965 $1,756,415 Education $4,658 $749,021 $753,678 Health $567 $5,183,093 $5,183,657 Arts, entertainment, recreation $1,919,657 $1,146,618 $3,066,276 Accommodations, food services $552,510 $2,455,394 $3,007,903 Other $1,586,823 $8,098,284 $9,685,107 Farming $14,928 $341,171 $356,098 Federal $118,303 $2,205,795 $2,324,096 State and local $142,228 $5,240,117 $5,382,345 Foreign trade $0 $0 $0 Total* $20,293,879 $64,642,854 $130,636,732
Employment Industry Indirect Induced Total* Manufacturing 4 17 20 Wholesaling 2 18 20 Retailing 5 77 82 Real Estate 10 49 59 Professional Services 58 70 329 Administrative 8 12 21 Education 0 12 12 Health 0 46 46 Arts, entertainment, recreation 9 10 19 Accommodations, food services 9 39 47 Other 12 30 42 Farming 0 3 3 Federal 1 19 20 State and local 1 67 68 Foreign trade 0 0 0 Total* 118 467 787

54
Labor Income Industry Indirect Induced Total* Manufacturing $411,836 $1,644,679 $2,056,510 Wholesaling $158,308 $1,346,413 $1,504,722 Retailing $219,308 $2,686,381 $2,905,692 Real Estate $299,591 $2,623,492 $2,923,083 Professional Services $4,723,789 $5,181,912 $31,126,744 Administrative $373,984 $483,657 $857,641 Education $2,173 $401,320 $403,493 Health $222 $2,940,425 $2,940,647 Arts, entertainment, recreation $624,849 $417,563 $1,042,413 Accommodations, food services $199,307 $886,369 $1,085,677 Other $654,103 $1,227,032 $1,881,141 Farming $2,905 $69,453 $72,360 Federal $91,042 $1,648,891 $1,739,933 State and local $66,645 $4,318,851 $4,385,496 Foreign trade $0 $0 $0 Total* $7,828,062 $25,876,438 $54,925,552
Indirect Business Tax Industry Indirect Induced Total* Manufacturing $62,560 $132,990 $195,562 Wholesaling $58,376 $495,212 $553,588 Retailing $29,922 $869,062 $898,983 Real Estate $169,364 $358,568 $527,932 Professional Services $214,494 $286,347 $934,855 Administrative $9,312 $13,868 $23,180 Education $30 $6,219 $6,248 Health $3 $41,639 $41,643 Arts, entertainment, recreation $41,512 $61,945 $103,459 Accommodations, food services $34,904 $148,769 $183,673 Other $37,033 $617,699 $654,735 Farming $338 $6,734 $7,069 Federal $0 $0 $0 State and local $0 $0 $0 Foreign trade $0 $0 $0 Total* $657,848 $3,039,052 $4,130,927
*Includes Direct Benefits not shown in the Table.

55
TABLE EIGHT: TOTAL IMPACT PER HOUSEHOLD AND PER RESIDENT OF CALIFORNIA
Expected Maximum Minimum Total Net Incremental Benefit $4,243,292,561 $6,407,946,294 $2,523,147,091 Number of Housing Units in California* 13,530,719 13,530,719 13,530,719 Benefit per Household $313.60 $473.59 $186.48 Population of California** 38,148,493 38,148,493 38,148,493 Benefit per Resident of State $111.23 $167.97 $66.14
*Source: Department of Finance, City/County Population Estimates, 1/1/2009. **Source: Department of Finance, California County Populations Estimates & Percent Change,
7/1/2008.
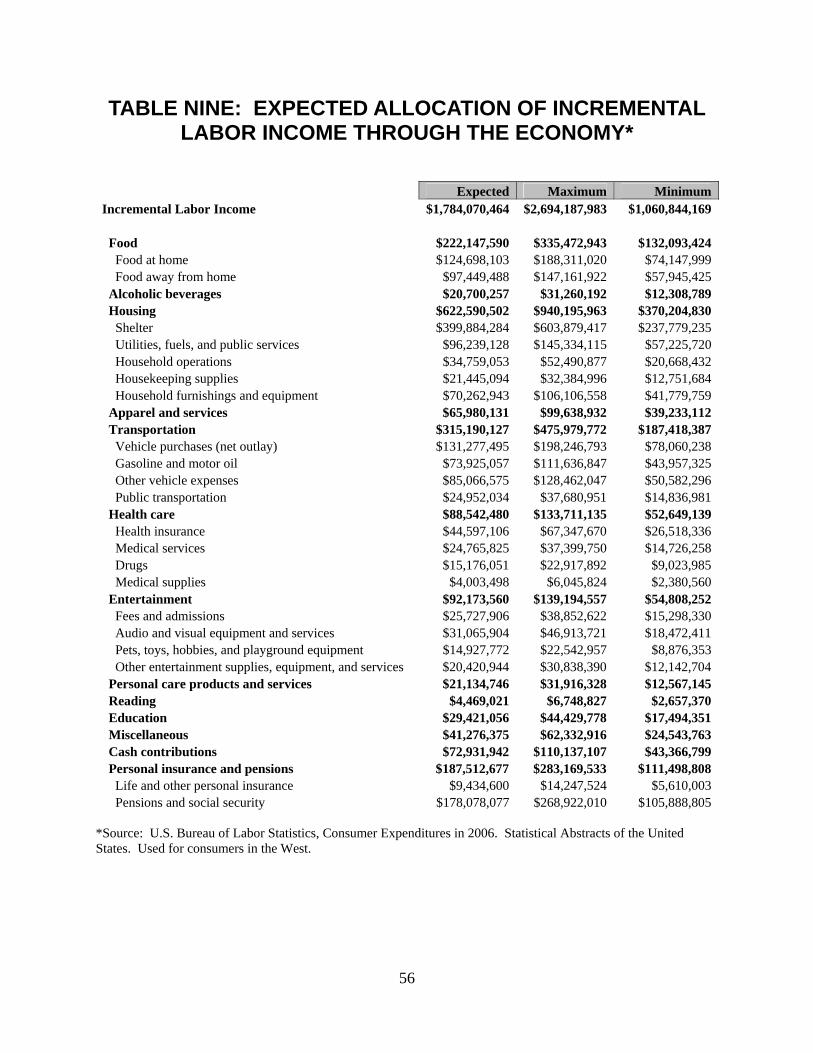
56
TABLE NINE: EXPECTED ALLOCATION OF INCREMENTAL LABOR INCOME THROUGH THE ECONOMY*
Expected Maximum Minimum Incremental Labor Income $1,784,070,464 $2,694,187,983 $1,060,844,169 Food $222,147,590 $335,472,943 $132,093,424 Food at home $124,698,103 $188,311,020 $74,147,999 Food away from home $97,449,488 $147,161,922 $57,945,425 Alcoholic beverages $20,700,257 $31,260,192 $12,308,789 Housing $622,590,502 $940,195,963 $370,204,830 Shelter $399,884,284 $603,879,417 $237,779,235 Utilities, fuels, and public services $96,239,128 $145,334,115 $57,225,720 Household operations $34,759,053 $52,490,877 $20,668,432 Housekeeping supplies $21,445,094 $32,384,996 $12,751,684 Household furnishings and equipment $70,262,943 $106,106,558 $41,779,759 Apparel and services $65,980,131 $99,638,932 $39,233,112 Transportation $315,190,127 $475,979,772 $187,418,387 Vehicle purchases (net outlay) $131,277,495 $198,246,793 $78,060,238 Gasoline and motor oil $73,925,057 $111,636,847 $43,957,325 Other vehicle expenses $85,066,575 $128,462,047 $50,582,296 Public transportation $24,952,034 $37,680,951 $14,836,981 Health care $88,542,480 $133,711,135 $52,649,139 Health insurance $44,597,106 $67,347,670 $26,518,336 Medical services $24,765,825 $37,399,750 $14,726,258 Drugs $15,176,051 $22,917,892 $9,023,985 Medical supplies $4,003,498 $6,045,824 $2,380,560 Entertainment $92,173,560 $139,194,557 $54,808,252 Fees and admissions $25,727,906 $38,852,622 $15,298,330 Audio and visual equipment and services $31,065,904 $46,913,721 $18,472,411 Pets, toys, hobbies, and playground equipment $14,927,772 $22,542,957 $8,876,353 Other entertainment supplies, equipment, and services $20,420,944 $30,838,390 $12,142,704 Personal care products and services $21,134,746 $31,916,328 $12,567,145 Reading $4,469,021 $6,748,827 $2,657,370 Education $29,421,056 $44,429,778 $17,494,351 Miscellaneous $41,276,375 $62,332,916 $24,543,763 Cash contributions $72,931,942 $110,137,107 $43,366,799 Personal insurance and pensions $187,512,677 $283,169,533 $111,498,808 Life and other personal insurance $9,434,600 $14,247,524 $5,610,003 Pensions and social security $178,078,077 $268,922,010 $105,888,805
*Source: U.S. Bureau of Labor Statistics, Consumer Expenditures in 2006. Statistical Abstracts of the United States. Used for consumers in the West.
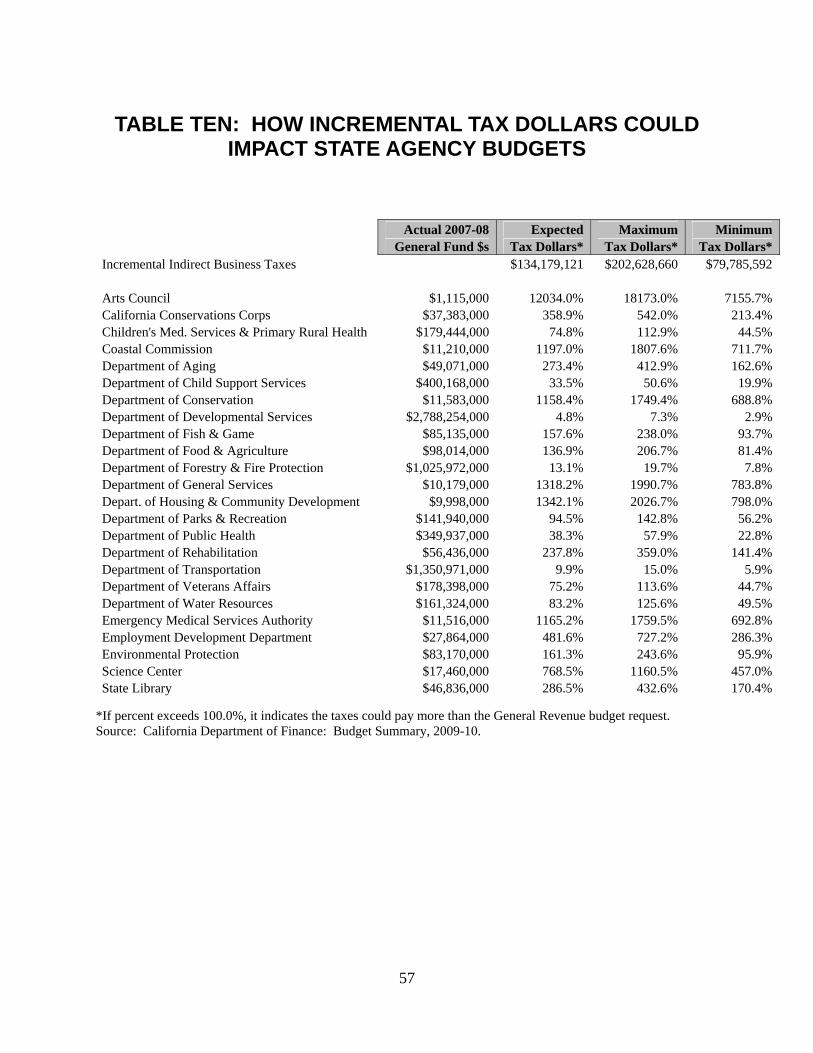
57
TABLE TEN: HOW INCREMENTAL TAX DOLLARS COULD IMPACT STATE AGENCY BUDGETS
Actual 2007-08 Expected Maximum Minimum General Fund $s Tax Dollars* Tax Dollars* Tax Dollars* Incremental Indirect Business Taxes $134,179,121 $202,628,660 $79,785,592 Arts Council $1,115,000 12034.0% 18173.0% 7155.7% California Conservations Corps $37,383,000 358.9% 542.0% 213.4% Children's Med. Services & Primary Rural Health $179,444,000 74.8% 112.9% 44.5% Coastal Commission $11,210,000 1197.0% 1807.6% 711.7% Department of Aging $49,071,000 273.4% 412.9% 162.6% Department of Child Support Services $400,168,000 33.5% 50.6% 19.9% Department of Conservation $11,583,000 1158.4% 1749.4% 688.8% Department of Developmental Services $2,788,254,000 4.8% 7.3% 2.9% Department of Fish & Game $85,135,000 157.6% 238.0% 93.7% Department of Food & Agriculture $98,014,000 136.9% 206.7% 81.4% Department of Forestry & Fire Protection $1,025,972,000 13.1% 19.7% 7.8% Department of General Services $10,179,000 1318.2% 1990.7% 783.8% Depart. of Housing & Community Development $9,998,000 1342.1% 2026.7% 798.0% Department of Parks & Recreation $141,940,000 94.5% 142.8% 56.2% Department of Public Health $349,937,000 38.3% 57.9% 22.8% Department of Rehabilitation $56,436,000 237.8% 359.0% 141.4% Department of Transportation $1,350,971,000 9.9% 15.0% 5.9% Department of Veterans Affairs $178,398,000 75.2% 113.6% 44.7% Department of Water Resources $161,324,000 83.2% 125.6% 49.5% Emergency Medical Services Authority $11,516,000 1165.2% 1759.5% 692.8% Employment Development Department $27,864,000 481.6% 727.2% 286.3% Environmental Protection $83,170,000 161.3% 243.6% 95.9% Science Center $17,460,000 768.5% 1160.5% 457.0% State Library $46,836,000 286.5% 432.6% 170.4%
*If percent exceeds 100.0%, it indicates the taxes could pay more than the General Revenue budget request. Source: California Department of Finance: Budget Summary, 2009-10.

58
Appendix A: About the DVBE and Small Business Certification Programs
The Disabled Veteran Business Enterprise (DVBE) and Small Business (SB) Certification Programs were established to increase business opportunities for the DVBE and SB communities with the State of California; thereby stimulating the State's overall economy. The programs are designed to help DVBEs and SBs participate in a more level playing field with certain advantages when competing against other non-DVBEs and non-SBs for State contracts and purchases. Certified firms can also take advantage of other DVBE and SB benefits.
Every year, each State agency must submit to the legislature an annual report that tracks contract award activity involving DVBEs and SBs. The report must demonstrate that the various participation goals have been met or exceeded. If the minimum goals are not met, the agency must provide a sound justification and the remedial action they will take to attain or exceed the goal(s) the following year.
The Department of General Services (DGS), Procurement Division (PD), Office of Small Business and DVBE Services (OSDS) is the State's certifying agency that administers the DVBE and Small Business Certification Programs. While small business and DVBE certification is the OSDS's primary role, they also assist SBs and DVBEs in a variety of ways including conducting outreach events, providing resource guidance, and supporting the businesses through advocacy.
Comparison Between the DVBE & SB Certifications
The primary difference between the DVBE and SB certifications are the eligibility requirements. An SB's eligibility is primarily based on size standards (average gross annual receipts and number of employees) and a DVBE's eligibility focuses on the firm's disabled veteran owner(s). Some of the common items between the two certifications that are considered in the certification process are the business' structure, the principal office location, the type of business, and the owners and their domicile.
Another difference is how the certification, once obtained, is applied in the State contracting arena. DVBE certification entitles the certified business to participate in the State's DVBE Participation Program, which establishes a goal of at least 3% of total overall annual State contracting dollars to be awarded to DVBEs. Comparatively, SBs participation goal is set at 25%. SB certification also entitles the certified business to a five percent (5%) bid preference on applicable State contracts. The 5% bid preference is only used for computational purposes to determine a contract award. SBs also have prompt payment benefits and DVBEs do not.
Providing all eligibility and compliance requirements are met, it is possible for a business to be certified as both small business and DVBE. Businesses that have this dual certification are able to experience the benefits of both certifications.
Microbusiness Certification
Microbusiness (MB) certification is a subset classification of small business (SB) certification. Therefore, all MBs are also SBs. There is no separate formal MB certification. It is a designation they receive based on the size of their business, which is determined by gross annual receipts averaged over a three-year period and the average number of employees over four quarters.
See Microbusiness Definition.
Depending on business fluctuations throughout the MB's certification period, it is possible that the MB's designation could be turned "on" or "off". If the MB is under both the dollar and employee count thresholds, they retain their MB designation. If they exceed either the dollar or employee count threshold, they are no longer MB but retain their small business status.
About the DVBE & SB Certification Process
To be certified, a firm must meet specific DVBE or SB eligibility requirements. They must apply for formal certification with the Office of Small Business and DVBE Services (OSDS), which consists of an application and specific required support documents. The OSDS will then review the applicant's application package to determine if the applicant meets all eligibility requirements and that all application requirements have been fulfilled. Within about 30 working days, the applicant is then notified of their certification status.
Other Certifications, Certifying Agencies, and Business Assistance
There are many certification and business assistance programs aimed at improving the advantages of smaller business enterprises, including start-up, financial, and networking assistance. Certifying agencies range from the federal government to local government and other businesses and organizations. Some of the more popular certification programs available today include the Federal Small Business Administration's (SBA) "8a Program" and the Office of Business and Economic Opportunity, which is administered by the California Department of Transportation (CALTRANS).
For more information regarding business assistance and opportunities, visit our Related Websites.

59
Small Business Certification Reciprocity
The OSDS also administers the Certification Reciprocity Program which helps further promote small business participation throughout the State by building partnerships with local government agencies in accepting the State's small business certification. Thereby, establishing the convenience of going through one certification process and experiencing the certification benefits of multiple agencies.
Need Help? Contact Us
Email [email protected] or call (916) 375-4940.

60
Appendix B: About the DVBE Participation Program The Disabled Veteran Business Enterprise (DVBE) Participation Program was established to acknowledge disabled veterans for their service and to further DVBE participation in State contracting, promote competition and encourage greater economic opportunity.
The State established a DVBE participation goal of at least three percent. The goal applies to the total contract dollars expended each year by an awarding department. Each State agency establishes their own method for attaining the goal and they have the discretion to include the program goal within individual contracts. Every year, State agencies must also report to the governor and the legislature their total DVBE contracting participation. If the minimum three percent goal is not met, the State agency must provide their reasons for not meeting the goal and an implementation plan for future DVBE participation improvement. They may also be required to stand before a legislative panel to further clarify their results and efforts.
Added DVBE Incentive, Effective 10/09/07
The Department of General Services (DGS) established a DVBE incentive pursuant to Senate Bill 115 chaptered October 3, 2005 and the Military and Veterans Code section 999.5(a). The new regulations apply to all competitive solicitations for public works, services, goods, and information technology goods and services posted or released after October 09, 2007. The DVBE incentive is required in solicitations that include DVBE program requirements and may be offered in other competitive solicitations.
The DVBE incentive offers State agencies a tool to increase their DVBE participation while still allowing the flexibility to exempt a contract from the participation requirement should the department deem it necessary. Each State agency should incorporate the use of the DVBE incentive into their plan or strategy to ensure achievement of at least three percent DVBE participation on their total contract dollars.
• DVBE Incentive (SB 115)
The "Good Faith Effort"
For each applicable contract, prime contractors must achieve the minimum DVBE participation goal or demonstrate they made a "Good Faith Effort" to achieve participation. The law intends DVBE participation, however should a bid be submitted with less than minimum participation, to be program responsive the prime contractor must make and document their efforts to attain participation.
The five legally defined "Good Faith Effort" steps are:
1. Contact was made with the awarding department to identify DVBEs. 2. Contact was made with other State and federal agencies and with local DVBE organizations to identify DVBEs. 3. Advertising was published in trade papers and papers focusing on DVBEs, unless time limits imposed by the awarding
department do not permit that advertising. 4. Invitations to bid were submitted to potential DVBE contractors. 5. Available DVBEs were considered.
Added DVBE Participation Requirements, Effective 1/1/04
• DVBEs must perform a commercially useful function related to the contract's specifications.
• A DVBE that rents equipment to an awarding department is considered an equipment broker, unless one or more disabled veterans own 51% of the equipment with evidence to support the fact. This includes submitting to the Office of Small Business and DVBE Services (OSDS), a copy of the complete personal federal income tax return for each of the disabled veteran owners.
• DVBE brokers awarded a contract under the 3% goal provisions must disclose their broker status prior to contract performance.
• Equipment rented from DVBE equipment brokers cannot be credited towards the 3% participation goal.
• State agencies must not use a DVBE if the agency knows that the DVBE does not maintain certification requirements.
See DVBE Program Changes and AB 669 Impact on Small Businesses & DVBEs & SB 1008 Impact on DVBEs.
Authority
Public Contract Code, Section 10115

61
Military and Veterans Code, Section 999-999.13California Code of Regulations, Sections 1896.60-1896.67 and 1896.90-1896.98
Need Help? Contact Us
Email [email protected] or call (916) 375-4940.
Appendix C: DVBE Certification Benefits and Eligibility Requirements
DVBE Certification Benefits
Upon meeting eligibility requirements, certified DVBEs are entitled to the following:
• State-certified DVBEs are eligible for the State's DVBE Participation Program. The program sets the goal to use DVBEs in at least 3% of the State's overall annual contract dollars.
• State agencies may use a streamlined process known as the "SB/DVBE Option" by contracting directly with a California-certified DVBE for goods, services, and information technology valued between $5,001 and $99,999 after obtaining price quotes from at least two California-certified DVBEs. For public works projects, the contract value can be up to $147,000.
• Certified DVBEs increase their visibility and expand their business networking opportunities by being automatically listed in the State's online list of certified firms.
DVBE Certification Eligibility Requirements
For DVBE certification purposes, a "disabled veteran" is:
• A veteran of the U.S. military, naval, or air service;
• The veteran must have a service-connected disability of at least 10% or more; and
• The veteran must be domiciled in California.
To be certified as a DVBE, your firm must meet the following requirements:
• Your business must be at least 51% owned by one or more disabled veterans;
• Your daily business operations must be managed and controlled by one or more disabled veterans
o The disabled veteran who manages and controls the business is not required to be an owner of the applicant business; and
• Your home office must be located in the U.S. (the home office cannot be a branch or subsidiary of a foreign corporation, foreign firm, or other foreign based business).
New Eligibility Requirements, Effective 1/1/04(See DVBE Legislation 2003-2004 Session)
• The disabled veteran must be domiciled in California.
• All existing and all new DVBE applicants must submit to the Office of Small Business and DVBE Certification (OSDC) complete copies of the DVBE's federal income tax returns for the previous three years. DVBEs who have been in business for less than three years shall submit the federal tax returns for each year they've been in business.
Related Links
About the DVBE & SB Certification Programs
Certification Application
DVBE Legislation
DVBE Participation Program
SB Certification Benefits & Eligibility Requirements
SB/DVBE Services Home

62
• A DVBE applicant that is not a sole proprietorship and rents equipment to the State must provide the federal income tax returns for each of their disabled veteran owners or your firm will be deemed to be an equipment broker.
• DVBE limited liability companies must be wholly owned by one or more disabled veterans.
Certification Application
To apply, access our online Disabled Veteran Business Enterprise Certification Application (STD. 812), or to receive your hard-copy form by mail, e-mail [email protected] or call (916) 375-4940.
Authority
• Military and Veterans Code, Division 4, Chapter 6, Article 6, Section 999-999.13
• California Code of Regulations, Title 2, Section 1896.60-1896.95
Need Help? Contact Us
Email [email protected] or call (916) 375-4940.

63
Appendix D: DVBE Legislation 2003-2004 Session
• AB 669 (Cohn) HTML PDF
o A small business, microbusiness, or DVBE prime or subcontractor must perform a "commercially useful function" (CUF) related to the awarded contract's specifications.
o Increased penalties for fraudulent misrepresentation of a DVBE performing a CUF and/or for misrepresenting the DVBE's participation for obtaining or retaining a contract.
o The disabled veteran must be domiciled in California.
• SB 1008 (Machado) HTML PDF
o Limited liability companies must be wholly owned by one or more disabled veterans.
o A DVBE that rents equipment to an awarding department is considered an equipment broker, unless one or more disabled veterans own 51% of the equipment with evidence to support the fact. This includes submitting to the Office of Small Business and DVBE Certification (OSDC), a copy of the complete personal federal income tax return for each of the disabled veteran owners.
o Awarding department shall not rely on a DVBE's certification status if the agency knows that the DVBE does not maintain certification requirements.
o State funds used for equipment rented from equipment brokers cannot be credited towards the 3% goal.
o A DVBE broker awarded a contract under the 3% goal provisions must disclose their broker status to the awarding agency prior to contract performance.
o Disabled veterans must provide federal tax returns for DVBE certification consideration.
o Penalties for fraud will be imposed.
2001-2002 Session
• AB 737 (Oropeza) HTML PDF
o Allows State agencies to use informal competitive bidding process for contracts between $5000 and $99,999, when contract is awarded to a DVBE, after obtaining a price quote from at least two DVBEs. (Also known as the "SB/DVBE Option".)
• AB 941 (Florez) HTML PDF
o Requires State agencies/departments to appoint a DVBE advocate. The appointed individual shall serve as both SB & DVBE advocate.
• SB 1045 (Polanco) HTML PDF
o Requires State agencies to submit annual DVBE contract & procurement activity report to Governor & Legislature.
1999-2000 Session
• AB 409 (Dickerson) HTML PDF
o Allows a certified DVBE to retain its status for up to three years after the death or permanent disability of the disabled veteran, if the DVBE is inherited or controlled by the disabled veteran's spouse or child, or by both. This would only apply to contracts entered into prior to the disabled veteran's death or permanent disability.
o Dept. of Veterans Affairs to appoint advocate to oversee and report on the DVBE program.
Related Links
Back to Legislation & Executive Orders Homepage
California Code of Regulations, Title 2, Section 1896.60 (CCR)
Proposed DVBE Regulations -2005 (Draft)
California Laws
DGS Legislation
DVBE Certification Benefits & Eligibility Requirements
DVBE Participation Program
Legislative Bill Information
PD Legislation
Related Legislation
Small Business Legislation
SB/DVBE Services Home

64
o Similar provisions to be added to Military and Veterans Code that are in Public Contract Code relating to three percent DVBE participation goal.
• AB 1633 (Committee on Veterans Affairs) HTML PDF
o Requires any school district using funds allocated pursuant to the School Facilities Act of 1998 for school construction or modernization to have an annual 3% DVBE participation goal of the overall dollar amount expended each year by the school district.

65
Appendix E: Small Business Certification Benefits and Eligibility Requirements
Small Business and Microbusiness Certification Benefits Upon meeting eligibility requirements, certified small businesses (SBs) and microbusinesses (MBs) are entitled to the following:
• A 5% bid preference on applicable State solicitations.
• Under the Prompt Payment Act, the State must pay a certified SB/MB higher interest penalties for late payment of an undisputed invoice. Prompt payment penalties for construction firms are addressed separately under Public Contract Code, Section 10261.5). (See Prompt Payment Program.)
• State agencies may use a streamlined process known as the "SB/DVBE Option" by contracting directly with a California-certified small business for goods, services, and information technology valued between $5,001 and $99,999 after obtaining price quotes from at least two California-certified small businesses. For public works projects, the contract value can be up to $147,000.
• The Department of General Services, Procurement Division charges State and local agencies an administrative fee when contracting with a California Multiple Award Schedules (CMAS) vendor. As an incentive, the fee is waived if the CMAS vendor is a certified small business.
• As an incentive, a non-small business prime contractor who uses certified small business subcontractors for at least 25% of its net bid price is eligible for a bid preference of five percent (5%) of the lowest responsible bid when competing against another non-small business.
When applying bidder preferences in which non-small business bidders may be eligible, certified small business and microbusiness bidders have precedence over non-small business bidders. (Small business bids cannot be displaced by non-small business bids when applying any applicable lawful preferences).
• As a certified small business you are eligible for the State's Small Business Participation Program. The program sets a goal for the use of small businesses in at least 25% of the State's overall annual contract dollars.
• Certified small businesses increase their visibility and expand their business networking opportunities by being automatically listed in the online Certified Firm and Application Status Search.
Top of Page
Small Business Certification Eligibility Requirements
• Must be independently owned and operated;
• Cannot be dominant in its field of operation;
• Must have its principal office located in California;
• Must have its owners (or officers in the case of a corporation) domiciled in California; and
• Together with its affiliates, be either:
o A business with 100 or fewer employees, and an average annual gross receipts of $12 million or less over the previous three tax years, or
o A manufacturer with 100 or fewer employees.
Top of Page
Manufacturer Definition
Related Links
About the DVBE & SB Certification Programs
Certification Application
DVBE Certification Benefits & Eligibility Requirements
Manufacturer Definition
Microbusiness Definition
Prompt Payment Rubber Stamp
SB Legislation
SB/DVBE Services Home

66
For small business certification purposes, a manufacturer is a business that is both of the following:
1. Primarily engaged in the chemical or mechanical transformation of raw materials or processed substances into new products. 2. Classified between Codes 2000 to 3999, inclusive, of the Standard Industrial Classification (SIC) Manual published by the
United States Office of Management and Budget, 1987 edition.
Top of Page
Certification Application
To apply, access our online Small Business Certification Application (STD. 813), or to receive your hard-copy form by mail, e-mail [email protected] or call (800) 559-5529 or (916) 375-4940. Authority
California Government Code, Section 14835California Code of Regulations, Title 2, Section 1896-1896.40
Need Help? Contact Us
Email [email protected] or call (916) 375-4940.
Appendix F: Small Business Legislation 2003-2004 Session
• AB 323 (Parra) HTML PDF
o Allows Nonprofit Veteran Service Agency (SB/NVSA) to be certified as a small business and entitles the entity to all small business benefits providing certain eligibility requirements are met.
• AB 2379 (Horton) HTML PDF
o Ineligibility to transact business with State for Small Business program abuse increased from three to 24 months to six to 36 months.
• AB 669 (Cohn) HTML PDF
o A small business, microbusiness, or DVBE prime or subcontractor must perform a "commercially useful function" related to an awarded contract's specifications.
o Penalties for fraudulent misrepresentation of a small business performing a CUF and/or for misrepresenting the small business' participation for obtaining or retaining a contract.
2001-2002 Session
• AB 1084 (Wesson) HTML PDF
o Microbusiness definition.
o Up to 5% bid preference for non-small business prime contractors who use certified small businesses to meet contract's small business participation goal.
o Requires 5% small business bid preference be applied to bids awarded on cost and points.
o Requires State agencies to annually report contract participation by microbusiness as well as by race, ethnicity, and gender on specific contracts.
• AB 2567 (Committee on Business and Professions) HTML PDF
Related Links
Back to Legislation & Executive Orders Homepage
California Laws
California Code of Regulations (CCR), Title 2, Section 1896
DGS Legislation
DVBE Legislation
Legislative Bill Information
PD Legislation
Related Legislation
SB Certification Benefits & Eligibility Requirements
SB/DVBE Services Home

67
o Informal bidding process for construction contracts when awarding to a small business (also known as the "SB/DVBE Option")--contract threshold changed from $200,000 to $100,000 (plus CPI) (per State Contract Act).
1999-2000 Session
• AB 1936 (Papan) HTML PDF
o State has 45-day processing time for prompt payment.
• AB 2890 (Consumer Protection Committee) HTML PDF
o Dollar threshold for informal bidding process with small business (also known as the "SB/DVBE Option") changed to $5001 to $99,999.
1997-1998 Session
• AB 170 (Papan) HTML PDF
o Prohibits State agencies and vendors from waiving or changing existing prompt payment penalty fees due to the State agency's failure to pay on time.
o Supplier does not have to submit a separate claim for late payment penalties.
• AB 835 (Wright) HTML PDF
o Allows State agencies to use informal competitive bidding process for contracts of $2500 up to $49,999, when contract is awarded to a small business, after obtaining a price quote from at least two small businesses. (Also known as the "SB/DVBE Option".)
o Requires State agencies to include small business 5% bid preference in all information technology solicitations.
o Modifies annual small business contract activity report to Legislature to include number of employees.
• AB 2275 (Kuykendall) HTML PDF
o State agencies must pay properly submitted, undisputed invoices within 45 days or automatically calculate and pay penalties.
• AB 2405 (Leach) HTML PDF
o Establishes small business advocate in DGS and each State agency.
• AB 2505 (Olberg) HTML PDF
o Establishes new small business definition and allows for updating as necessary, by regulations, to reflect the changing business environment.

68
Appendix G: Microbusiness Definition
In 2001, AB 1084 established the definition of a microbusiness as a subset category of a small business. It's the State's intent that microbusinesses are afforded the same entitlements and business participation benefits as a small business.
A microbusiness is:
• A small business that, together with affiliates, has an average annual gross receipts of two million seven hundred fifty thousand dollars ($2,750,000) or less over the previous three years, or
• Is a small business manufacturer with 25 or fewer employees.
(For more on benefit and eligibility information, see SB Certification Benefits and Eligibility Requirements.)
Authority
Government Code, Section 14837
Need Help? Contact Us
Email [email protected] or call (916) 375-4940.
Related Links
Microbusiness Certification
SB/DVBE Services Home
Appendix H: DVBE and Small Business Regulations
California Laws
California Code of Regulations (CCR)
California State Legislature
DGS Legislation
DVBE Incentive Regulations
Legislative Bill Information
PD Legislation

69
The DVBE and Small Business certification program is governed by regulations located within the California Code of Regulations, Title 2, Section 1896 et seq.
California Code of Regulations (CCR)
Current Small Business Regulations
The Department of General Services (DGS) proposes modifications to the Small Business regulations. Below are the proposed regulations, the notice which includes the written public comment period, the reasons for the proposed modifications, and the background which includes the escalation analysis.
target=_blank>Proposed Small Business Regulations
Notice of Proposed Rulemaking, Extension of Public Comment Period
Notice of Proposed Rulemaking
Initial Statement of Reasons
Escalation Analysis
DVBE and Small Business Legislation & Executive Orders
California State Legislature DGS Legislation PD Legislation
Legislative Bill Information California Laws
Governor's Executive Orders
Small Business S-02-06•
• DVBE D-43-01
Need Help? Contact Us
Office of Small Business and DVBE Services•
This disclaimer
Disclaimer
• covers all Small Business and DVBE Services' web pages.
SB/DVBE Services Home

70
Appendix I: DGS Small Business Advisory Council The purpose of the DGS Small Business Advisory Council is to provide a forum for representatives of the California Small Business community to provide input on policies and practices that impact Small Business participation in the State procurement and contracting process. The Council assists the DGS to develop solutions to the State's procurement and contracting concerns, to help communicate information regarding DGS projects and programs of interest to the Small Business community and to provide a forum for interactive discussions.
Leadership
The Advisory Council is co-chaired by Jim Butler, Deputy Director, DGS Procurement Division and Randall Martinez, a Small Business member of the Council. The Chairs are assisted by their alternates. Mr. Butler's alternate is Eric Mandell, Manager, DGS Procurement Division, External Operations Branch.
Membership
The DGS seeks to be inclusive in the membership of the Council. We desire a broad representation from the Small Business community through members who represent large segments of California industry, diverse ethnic associations and a broad geographic coverage. The DGS will continue to add Small Business Advisory Council members who meet the eligibility requirements as established in the Charter. We encourage eligible Small Business-persons to apply. Application for Membership
The Revitalized Small Business Advisory Council
In 2004, the DGS decided to revitalize the Small Business Advisory Council. A Charter was adopted that contains guidelines for operation of the Council and criteria for membership. The Council membership was reconstituted in accordance with the new requirement that members represent segments of the small business community through established trade associations or community organizations. For more information see the Charter and the SBC Roster.
First Meeting of the New Council
The first meeting of the new Council was held on March 14, 2005. Committees were established and Committee Chairs identified. The Council conducted a brainstorming session to identify small business issues. Due to continuing budget constraints, the DGS is unable to fund travel expenses for members to participate. Notwithstanding that, the Council decided to meet quarterly. The Council established three subcommittees that will meet prior to regular Council meetings (usually by teleconference). The subcommittees will report on their activities to the full Council at the quarterly meetings. The State's Small Business Advocates are invited guests to the Council meeting and participate on committees along with other staff members of the DGS.
Small Business Advisory Council Meetings
Meetings of the full Council and of the committees are open to the public and are subject to the Bagley-Keene Open Meeting Act (Government Code Sections 11120-11132). Information about future meetings will be posted on this Web site.
Council Committee Meetings
Each committee will have a Web page where it will post information about committee meetings. To view information about the various committees, click on the links below:
• Construction
• Process Committee
• Outreach & Education
Contact Information For information about the DGS Small Business Advisory Council, or to apply for membership, contact Eric Mandell, Small Business Advisory Council Coordinator, by telephone at (916) 375-4608 or by email to [email protected]
Americans With Disabilities Act (ADA) Information
Council and committee meetings comply with the requirements of the Americans with Disabilities Act. ADA Compliance Policy.

71
Need Help? Contact Us: call (916) 375-4940.