the economic impact of the child iii · the economic impact of child care in milwaukee county a...
TRANSCRIPT

The Economic Impact of Child Care in Milwaukee County
A report prepared for the Early Childhood Council of Milwaukee
By The University of Wisconsin-Milwaukee
Center for Economic Development September 22, 2002

2
About This Report
This report was produced at the University of Wisconsin-Milwaukee Center for
Economic Development (UWMCED), a unit of the College of Letters and Science at the
University of Wisconsin-Milwaukee. The College established UWMCED in 1990, with
the assistance of a grant from the U.S. Department of Commerce, Economic
Development Administration’s (EDA) “University Center” program, to provide
university research and technical assistance to community organizations and units of
government working to improve the Greater Milwaukee economy. The analysis and
conclusions presented in this report are solely those of UWMCED and do not necessarily
reflect the views and opinions of UW-Milwaukee or the U.S. Department of Commerce.
This report was commissioned by the Early Childhood Council of Milwaukee. The
authors of this report are Dr. Marc V. Levine, director of UWMCED, and Pamela S.
Fendt, senior policy analyst at the Center. Chieko Maene, a graduate assistant at the
Center, provided research support. The authors wish to thank the following people for
their assistance in pulling together the data for this report and offering constructive
criticism on early drafts: Pam Kaye, Carol Maurer, and Jenny Siepler at 4C-Milwaukee;
Ann Terrell of Milwaukee Public Schools; and Geri Rose, Lori Lutz, and Terri Dix and
other staff members at the Planning Council for Health and Human Services. We also
thank members of the Early Childhood Council of Milwaukee for their guidance.
UWMCED strongly believes that informed public debate is vital to the development of
good public policy. The Center publishers briefing papers, detailed analyses of economic
trends and policies, and “technical assistance” reports on issues of applied economic
development. In these ways, as well as in conferences and public lectures sponsored by
the Center, we hope to contribute to public discussion on economic development policy
in Southeastern Wisconsin.
Further information about the Center and its reports and activities is available at our web site:
www.ced.uwm.edu

3
TABLE OF CONTENTS
Executive Summary 4 I: Introduction 10 II: A Profile of the Child-Care Services Industry in
Milwaukee County 11
III: The Economic Impact of the Child-Care Industry in Milwaukee County 17 IV: Labor Market Conditions in the Child-Care Industry in Milwaukee County 27 V: The Long-Term Impact of Child-Care Services on Local Economic Development 44 Appendix One 48 Appendix Two 51 Appendix Three 52 References 53

4
Executive Summary
Child care is not only a vital community service in Milwaukee County; it is a
major industry, comparable in size to some of the county’s most prominent industries.
This study, completed by the University of Wisconsin-Milwaukee Center for Economic
Development for the Early Childhood Council of Milwaukee, shows that the child-care
industry generates substantial revenues, supports thousands of local jobs, and is an
integral part of the county’s economic base. What’s more, the employment and revenue
generated by the local child-care industry ripple through the rest of the Milwaukee
County economy, creating jobs and boosting income in sectors from retail trade to real
estate. Using the methodology of the respected California “LINCC” project,1 this study
delineates these major contributions of the child-care industry to Milwaukee County’s
economy:
• The regulated child-care services industry in Milwaukee County –including
licensed and trained certified child-care providers-- generated an estimated
$203.7 million in gross receipts, or revenues, in 2001. This means that the trained
regulated child-care industry in Milwaukee County is significantly larger than
industries such as spectator sports, hotels and motels, advertising services, and
engineering services –all industries considered vital to the county’s economic
development. (See Figure 1). As impressive as this figure is, it understates the
size of the child-care services industry in the county, because it excludes the
substantial sector of “unregulated” home providers such as grandparents and other
relatives, babysitters and nannies. In addition, this calculation does not include
care by provisionally certified providers, or school-related programs.

5
FIGURE 1
The Receipts and Total Impact of the Child-Care Service Industry Compared to other Industries in Milwaukee County
0
100
200
300
400
500
600
Child CareServices
Sporting GoodsStores
Spectator Sports AdvertisingAgencies
Hotels andMotels
ManagementConsultingServices
Clothing Stores AccountingServices
EngineeringServices
Annual ReceiptsTotal Impact
• All told, when the ripple effects of the purchasing and employee earnings in the
child-care industry are taken into account, the industry generates around $351
million annually in the Milwaukee County economy. For example, $46.6 million
in revenues in the county’s finance, insurance, and real-estate industry in 2001
were generated by spending originating in the child-care industry.
TABLE 1
Estimated Impact of the Child-Care Services Industry on other Industries in Milwaukee County
Estimated annual receipts/output generated by receipts/output of child-care industry, by sector
Sector Annual Impact (in millions $)
Finance, Insurance, and Real Estate 46.56 Transportation, Communication, and Utilities 17.03 Manufacturing 21.98 Construction 4.63 Wholesale and Retail Trade 15.07 Eating and Drinking Establishments 3.48 Health Services 10.82 Business Services 16.40 Other Services 22.50
1 The “Local Investment in Child Care” (LINCC) project was launched in 1996 by the National Economic Development and Law Center (NEDLC). A full description of their methodology is contained in NEDLC, A Methodology Guide: Creating an Economic Impact Report for the Child Care Industry (April 2001).

6
Child-Care Services (Direct Impact) 203.73
Total Annual Impact (Direct and Indirect/Induced Impact of Child-Care Services)
$351.38
• The regulated child-care industry directly employs over 7,200 people in
Milwaukee County, more than such important local industries as transportation
equipment manufacturing, printing and related activities, and legal services.
Child-care services directly employ twice as many workers as hotels and motels,
five times as many as management consulting, and fourteen times as many as
spectator sports in Milwaukee County. (See Figure 2).
FIGURE 2
The Employment Impact of the Child-Care Services Industry Compared to Other Industries in Milwaukee County
01,000
2,0003,000
4,0005,000
6,0007,000
8,000
Chi
ld C
are
Serv
ices
Tran
spor
tatio
n,Eq
uipm
ent
Food
Man
ufac
turin
g
Prin
ting
and
Rel
ated
Lega
l Ser
vice
s
Acc
ount
ing
Serv
ices
Arc
hite
ctur
al,
Engi
neer
ing,
Com
pute
rSy
stem
Des
ign
Man
agem
ent
Con
sulti
ng
Hot
els a
ndM
otel
s
Clo
thin
g St
ores
Spec
tato
rSp
orts
• When we take into account the “multiplier effect,” the child-care industry creates
and sustains about 9,000 jobs in Milwaukee County. For example, in addition to
the direct employment in the child-care industry, spending originating in the
industry indirectly generates 320 jobs in business services in the county, and 162
jobs in health-care services.

7
• The child-care industry in Milwaukee County frees up approximately 21,000
parents for work. These working parents earn an estimated $538.5 million
annually – a major contribution to the county’s economic base. Once the ripple
effects of these earnings are calculated, the total earnings of workers made
possible by the county’s child-care infrastructure reaches $1.08 billion annually.
This represents six percent of the total earnings of workers in Milwaukee County
(in 2000, the most recent data available).
The Child-Care Labor Market: An Impediment to Quality Care Despite the importance of child-care services to the to the well-being of children –
and to the economic health of Milwaukee County – the industry suffers from well-
documented problems in attracted and retaining workers. In American child-care, as one
analysis put it, employee turnover is high and workers are poorly paid. Indeed, annual
turnover at Wisconsin child-care centers last year was 41 percent .
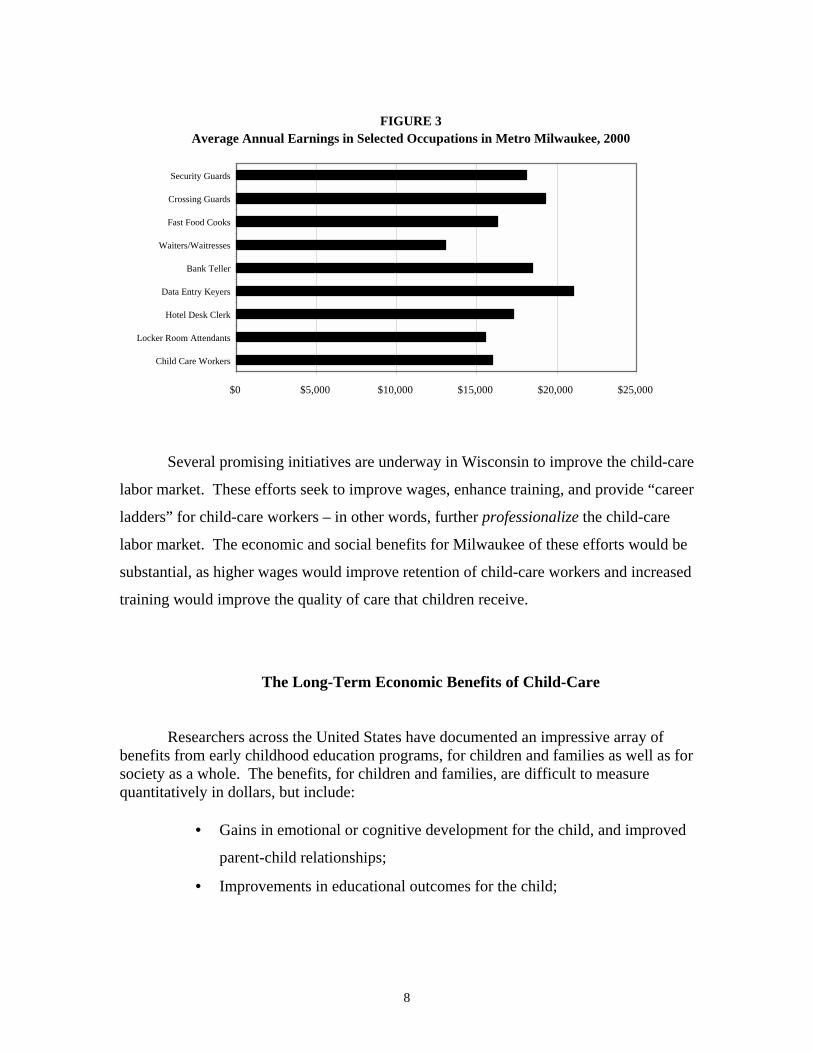
As is the case nationally, child-care workers in Milwaukee County are
compensated as low-wage, low-skill, “secondary labor market” employees, nowhere near
the levels of professional jobs such as schoolteachers. Employees in the child-care
services industry receive average annual pay in the same general range as employees of
apparel stores and beauty shops, and less than workers in hotels or laundry services. As
Figure 3 illustrates, the earnings of a child-care worker in metro Milwaukee are about the
same as locker room attendants and fast food cooks. (See Figure 3).
8
FIGURE 3Average Annual Earnings in Selected Occupations in Metro Milwaukee, 2000
$0 $5,000 $10,000 $15,000 $20,000 $25,000
Child Care Workers
Locker Room Attendants
Hotel Desk Clerk
Data Entry Keyers
Bank Teller
Waiters/Waitresses
Fast Food Cooks
Crossing Guards
Security Guards
Several promising initiatives are underway in Wisconsin to improve the child-care
labor market. These efforts seek to improve wages, enhance training, and provide “career
ladders” for child-care workers – in other words, further professionalize the child-care
labor market. The economic and social benefits for Milwaukee of these efforts would be
substantial, as higher wages would improve retention of child-care workers and increased
training would improve the quality of care that children receive.
The Long-Term Economic Benefits of Child-Care
Researchers across the United States have documented an impressive array of benefits from early childhood education programs, for children and families as well as for society as a whole. The benefits, for children and families, are difficult to measure quantitatively in dollars, but include:
• Gains in emotional or cognitive development for the child, and improved
parent-child relationships;
• Improvements in educational outcomes for the child;

9
• Increased economic self-sufficiency, initially for the parent and later for
the child, through greater labor force participation, higher income, and
lower welfare usage;
• Improvements in health-related indicators, such as child abuse, maternal
reproductive health, and maternal substance abuse (From the 1998 RAND
Institute study, Investing in Our Children).
Public Benefits of Quality Child-Care include:
• Decreases in public expenditures on welfare programs and other public
services (i.e. health care, special education, and other services);
• Reduced criminal justice system costs;
• Increased economic growth and public revenues, due to higher earnings
greater labor force participation, and improved worker productivity.
The RAND Institute, in a review of the benefits and savings of early childhood
intervention programs, calculated that for every dollar invested in such programs,
there is an estimated return of $2.50 to $4.00. Other studies suggest savings up to
$7.00 for every dollar invested.
Conclusions
Investing in quality child-care makes economic sense for Milwaukee County.
Like transportation or electric power, child-care is an integral component of the
“infrastructure of growth” in the county, permitting parents to pursue employment
opportunities across the economic spectrum. As an industry itself, child-care generates
thousands of jobs and millions of dollars in economic activity in the county. Finally, and
most importantly, quality child-care provides a nurturing, educational environment to
help Milwaukee County children reach their full potential as productive members of
society.

10
I
Introduction
Although few would disagree that child care is a vital community service in
Milwaukee County, less understood is the degree to which the child-care industry is a
critical component of economic development in the county. The child-care industry
generates substantial revenues, supports thousands of local jobs, and is an integral part of
the county’s economic base. The employment and revenue generated by the local child-
care industry ripple through the rest of the Milwaukee County economy, creating jobs
and boosting income in sectors such as retail trade, real estate, and business services.
Moreover, like investments in transportation or electric power, child care is an integral
component of the “infrastructure of growth” in Milwaukee County, permitting thousands
of parents to pursue employment opportunities throughout the economy. Quality child
care helps free up the “labor power” that is vital to economic growth in the county.
This report examines the economic impact of child-care services in Milwaukee
County. After a brief overview of recent growth in supply and demand for child-care
services in the county, the report focuses on three main questions regarding the
economics of child care:
• How large is the child-care industry in Milwaukee, and how important is the
industry to the county’s economy?
• What are the key trends in the child-care labor market, and how do these
relate to efforts to improve the quality of child-care services?
• What is the long-term economic development importance of child care for
Milwaukee County, in terms of worker productivity, labor force participation,
and other public benefits?

11
II
A Profile of the Child-Care Services Industry in Milwaukee County
Child care is a rapidly growing industry in Milwaukee County. The number of
child-care providers in the county has grown dramatically over the past decade,
particularly since 1996 and the advent of sweeping work-based welfare reform in
Wisconsin. Between 1996 and 2002, the number of licensed family providers jumped
from 190 to 782 in Milwaukee County (a 312 percent increase), and the number of
licensed group child care centers in the county climbed from 237 to 346 (a 46 percent
increase).
FIGURE 1:
Licensed Child Care in Milwaukee County, 1991-2002
(Number of licensed family care and
group center child-care providers)
0
100
200
300
400
500
600
700
800
900
1991 1996 2000 2001 2002
Lic. Family CareLic. Group Center
Source: Planning Council for Health and Human Services and 4C-Milwaukee
In addition to licensed care, the state and county regulate two other types of
home-based child care: “certified” and “provisionally certified” family child-care
providers. Certified providers have completed 20 hours of training in child-care, have
cleared a criminal background investigation, and had a safety inspection of their home.

12
Provisional certification includes a safety check of the home and a criminal
background check of the provider. Provisional certification is the category that allows
family members to provide child care and receive reimbursement through the state child-
care subsidy program, albeit at a lower rate than fully certified providers. The difference
in reimbursement rates is designed to encourage provisionally certified providers to take
the 20 hours of training to become regular certified child-care providers. Figure 2 shows
the number of certified and provisionally certified child-care providers in Milwaukee
County since 1996. Provisionally certified providers as a proportion of all certified
providers peaked in 1998 (a year in which there was a significant decline in the state
welfare caseload). Between 1998-2002, the number of both types of certified providers
declined by over 25 percent. Provisional certification has been controversial since it was
introduced as a part of welfare reform changes in 1996. On the one hand, advocates for
the category argue that nurturing relatives do not necessarily need formal training to
qualify as caregivers, and provisional certification is sufficient regulation. On the other
hand, critics assert that the existence of provisional certification undercuts efforts to
professionalize child-care services.
FIGURE 2:
Certified Child-Care Providers in Milwaukee County,
1996-2002
(Number of certified child-care providers)
0200400600800
1000120014001600
1996 1998 2000 2001 2002
Regular Certified Provisionally Certified
Source: Planning Council for Health and Human Services and 4C-Milwaukee

13
How many children in Milwaukee County do these providers serve? There is a
large range among individual licensed providers –from a capacity of eight children at
licensed family providers to 300 children at large licensed child-care centers. The
aggregate capacity at licensed child-care providers in Milwaukee County is 30,158.
TABLE 1:
Number of Slots for Children at Licensed Child Care Providers in Milwaukee County, 1991-2002
Type of Provider
1991 1996 2001 2002
Family 714 1517 4859 6256 Group 13942 16523 22042 23902
Source: Planning Council for Health and Human Services and 4C-Milwaukee
In addition, there are 6,105 slots at certified family child-care providers and 1,395
at provisionally certified family child-care providers. Thus, when all categories of
licensed and certified child-care providers are aggregated, the current total child-care
capacity in Milwaukee County is 37,658 slots.
These slots, of course, represent only the organized facilities and “regulated”
providers of child-care services in Milwaukee County. But, it is important to keep in
mind that this figure probably represents around half the total “supply” of child-care slots
in the county. Nationally, according to a recent report by the U.S. Bureau of the Census,
parents and other relatives account for 48.1 percent of the child care arrangements for the
10.1 million children younger than five years old with working mothers (Milwaukee
Journal-Sentinel, 2002). It is reasonable to assume that the composition of child-care
arrangements in Milwaukee County resembles the national percentages

14
Supply and Demand: Current and Future Balance The supply of child-care services in Milwaukee County has grown rapidly since
the early 1990s, because there has been a surge in demand, a surge that shows no sign of
abating. According to recently released data from the 2000 U.S. Census, there are 47,339
children under the age of six with all parents in the labor force. This figure is slightly
down from 1990 (49,108), which reflects mainly an overall drop in the population in
Milwaukee County (the number of children under six in the county declined from 87,121
to 74,650 between 1990 and 2000). In fact, the percentage of children under six in
Milwaukee County with all parents in the labor force rose from 56.3 percent in 1990 to
63.5 percent in 2000 (United States Bureau of the Census, 1990 and 2000). Thus, at a
minimum, there were 47,339 children in Milwaukee County in 2000 who were potential
clientele for child-care services.
What affects demand for child care in Milwaukee County? Demographic change,
labor market trends, and public policy have all played a central role in shaping demand
since 1990.
First, Milwaukee County is a demographically stagnating county – the only
county in metropolitan Milwaukee to experience a population decline in the 1990s. The
county’s population fell by 2.0 percent during the decade. The key factor in this decline,
of course, was the population decline in the City of Milwaukee, which dropped by 5.1
percent during the decade.
Thus, it is not surprising that the number of children under the age of six in
Milwaukee County declined by 14.9 percent during the 1990s. At first glance, this might
be viewed as a factor promoting a plateau or even decline in demand for child-care
services. But, in the aftermath of welfare reform, as well as in the context of long-term
growth in parents (especially mothers) entering the labor force, the trend is ambiguous at
best. Sixty-one percent of women living in Milwaukee County were in the labor force in
2000, up from 58 percent in 1990. As noted above, the percentage of children having all
parents in the labor force rose significantly during the decade as well, by almost seven
percentage points. In short, even in a climate of relative demographic stagnation, trends
in the Milwaukee County labor market suggest a continuing demand for quality child-
care services.

15
Second, Wisconsin’s welfare reform program (“W-2”) has undoubtedly
contributed to the explosion in child care use in Milwaukee County over the past several
years. Officially begun in 1997, W-2 embodies the most forceful work-based approach
to welfare reform in the nation. The stated philosophy of the program is “for those who
can work, only work should pay.” Except in unusual circumstances, families who turn to
help from W-2 will not receive assistance if they do not agree to immediately try to
obtain employment or to participate in workfare activities in order to “earn” their cash
assistance payment. W-2 focuses on putting as many applicants and participants into
unsubsidized employment as possible. Because many low-income parents are qualified
only for entry-level jobs, the wages they can expect to earn are fairly low, which means
they must work full-time (or longer) to make ends meet. This means that they will
require some type of child-care services. In addition, those applicants eligible for “cash
grants” from W-2 are also expected to participate in activities outside the home for up to
40 hours per week. These families also need child-care services.
Conclusion
The supply of and demand for child-care services have grown rapidly in
Milwaukee County in the past decade, and there is compelling evidence, notwithstanding
the county’s recent population slide, that these trends will continue. More and more
parents are entering the labor force, and need child care. Public policy, particularly the
requirements of W-2 and the growth in state child-care subsidies, continues to increase
demand for child-care services (although the expensiveness of quality child care and the
limits of subsidies put something of a brake on demand). Thus, even though the absolute
number of young children in Milwaukee County declined in the last decade, growing
labor force participation by parents –particularly continuing growth in female labor force
participation—means that the demand for child care will, at the very least, remain
constant. More likely, it will continue to grow.
On the other hand, as we will examine in detail in section III of the report,
meeting this demand with quality child-care services continues to be hampered by
problems in the child-care industry labor market. Low-wages and insufficient career
advancement prospects limit the ability to attract the quality workers necessary to expand

16
child-care services. And, without significant public investments, the child-care industry
will not be able to pay the salaries necessary to attract the “professionalized” labor force
needed.
As Nobel physicist Neils Bohr once famously observed, “predictions are very
difficult ---especially about the future.” But this brief overview of trends in supply and
demand in the Milwaukee County child-care industry suggests continuing growth in the
years ahead, with an ongoing need for quality care. As we examine in the rest of this
report, given the economic importance of the child-care industry in Milwaukee County
and the long-run societal benefits of quality child care, the logic for increased public
investment, in subsidies for parents, and in training, and wage enhancements for
providers, is compelling.

17
III
The Economic Impact of the Child-Care
Industry in Milwaukee County
Child care is not only an essential community service in Milwaukee County; it is
a major industry, comparable in size to some of the county’s most prominent industries.
For example, notwithstanding major subsidies and public investments in the local tourism
industry, more than twice as many people are employed in the child-care industry than in
hotels and motels in Milwaukee County. The gross receipts generated on an annual basis
by the licensed child care industry in the county exceed those of hotels and motels by 25
percent. What’s more, the employment and receipts generated by the local child care
industry ripple through the rest of the county economy, creating jobs and income across
the economic spectrum.
How large is the child care industry in Milwaukee County? How important is the
child-care industry to the local economic base? This section of the report provides some
quantitative answers to these questions.2 First, we measure the “direct effects” of the
industry: the “gross receipts” generated on an annual basis by the “regulated” child-care
industry in the county, and the number of people directly employed by the industry.
Then, using an input-output model3, we examine how the expenditures for child care and
employment in child-care facilities affect total economic activity in the county. The
input-output model permits us to quantify indirect and induced effects of an industry.
Indirect effects occur when local producers or service providers satisfy the demands for
goods and services required by the child-care industry (i.e. when a child-care center
makes purchases from a local supplier). Induced effects occur as workers, employed
2 This report documents the quantitative impact of regulated child-care, not informal or license-exempt care. Although we know that unlicensed child-care represents a significant portion of child-care services in Milwaukee County, there is little available data on which to quantitatively document its economic impact. 3 An input-model measures the linkages between all industries in the local economy as well as patterns of consumer spending. Thus, an input-output model would tell us how much local child-care centers purchase from local industries, or how much employees of child-care center spend on local goods and services. The input-output model used in this study is the “RIMS II” model of Milwaukee County, produced by the Bureau of Economic Analysis of the United States Department of Commerce. For more information of the RIMS II model, see U.S. Department of Commerce, Regional Multipliers: A User Handbook for the Regional Input-Output Modeling System (RMS II), Washington, D.C., U.S. Government Printing Office, 1997.

18
either directly by the child-care industry or by firms whose business has been stimulated
by child-care industry expenditures—“recycle” their wages on locally provided goods
and services.
All of these “rounds” of spending produce employment, output, and income
growth in the county’s economy. The measure of the extent to which an initial direct
expenditure (i.e. the gross receipts of the child-care industry) produces additional rounds
of spending, employment, and output is called a multiplier effect. The higher the
multiplier effect, the greater the overall economic impact on the community of a given
industry. Thus, for example, hypothetical “industry A” with a “final demand” multiplier
of 2.0 would, for every job in industry “A”, generate one additional “indirect” job in the
rest of the local economy. A hypothetical “industry B” with a multiplier of 1.25 would,
for every four jobs in the industry, generate one additional “indirect” job. If both
industries produced equal direct impacts (i.e. employed the same number of workers), the
industry with the higher multiplier would have the higher economic impact.4 On the
other hand, even if our hypothetical “industry B” has a lower multiplier than “industry
A,” if industry “B” directly employed 500 workers, and industry “A” directly employed
100 workers, the “final” impact of industry “B” on the local economy would be greater.
Thus, the full measure of the economic impact of an industry requires calculation
of direct and indirect/induced effects. In the analysis below, these calculations are
provided for both the child-care industry in Milwaukee County as well as for a selection
of “comparison industries,” to better appreciate the place of child-care as part of the
county’s economic base.
4 The magnitude of the multiplier effect on a local economy depends on how much “leakage” occurs from the initial expenditure: that is, how much in the way of goods and services a local business needs to purchase from outside the local economy, or how much local workers “re-spend” wages earned on goods and services “imported” from outside the region. Typically, for example, the multiplier effect of local manufacturing will be higher than services, because the local manufacturer will often purchase large amounts of supplies from local suppliers, who, in turn, employ relatively large numbers of people. When the main multiplier effect consists of employee wages, the impact is usually lower since there is substantial “leakage.” While a portion of employee wages are “re-spent” on local purchases, they are also “re-spent” on items such as automobiles, clothing, and food that are produced elsewhere and thus the dollars flow out of the local economy.

19
Accounting for the Child-Care Industry in Milwaukee County
As researchers for the pioneering California Local Investment in Child Care
Project have pointed out, traditional economic accounting tools fail to capture accurately
the gross receipts and direct employment in the licensed child-care industry (NEDLC,
2001, 9). For example, “methodologies utilized by the federal government, through the
Department of Commerce and the Department of Labor, either fail to include large
portions of the licensed child-care industry or scatter them throughout several
unconnected industry categories” (NEDLC, 2001, 9). The Department of Commerce
metrics (for SIC 835, “Child Care Services” or NAICS 6244, “Child Care Day Services” 5) do not include child-care programs operated in connection with public schools or
licensed family child-care homes. The Department of Labor methodology excludes self-
employed persons (licensed and certified family child-care providers) and small
establishments (NEDLC, 2001, 10).
The result is a significant undercounting by official measures of the receipts and
employment generated by the child-care industry. By our analysis, the gross receipts for
child-care services reported for Milwaukee County by the U.S. Bureau of the Census in
the 1997 “Economic Census” captures just a little over one-sixth of the actual annual
receipts of the industry.6 Similarly, as Figure 3 illustrates, our estimate of direct
employment in the Milwaukee County child-care industry is roughly double the estimates
reported by the Department of Commerce and the Department of Labor.
Therefore, to estimate as accurately as possible the gross receipts and direct
employment of the Milwaukee County child-care services industry, we have used the
5 “SIC” stands for “standard industrial classification,” a system of classifying industries used through the 1990s by all government agencies. In 1997, the Department of Commerce began using the “North American Industrial Classification system” (NAICS), which aggregates and defines industries differently than SIC “codes.” But, many agencies still collect data by SIC code. 6 Aside from whatever problems may exist with traditional accounting tools, this gap may also be explained by two factors: 1) The census numbers are from 1997, while our survey measuring gross receipts was conducted in 2002, thus reflecting five years of industry growth; 2) The 1997-2002 period was one in which particularly striking growth occurred in the Milwaukee County child care industry, with increased demand in the wake of welfare reform. Moreover, as we explore below, state subsidies for child care grew by an estimated $100 million in Milwaukee County during this period, contributing mightily to growth in industry receipts.

20
methodology developed by the NEDLC. This methodology generates estimates of
receipts and employment based on data on capacity, enrollment, and average tuition rates
for various age groups in child-care facilities. The data is gathered from local child-care
resource and referral (R &R) agencies -in Milwaukee County, this is “4C-Milwaukee.”
This data, combined with legally required staff to child ratios, yields plausible estimates
of gross receipts and direct employment in the industry. (For a complete explanation of
the methodology, see NEDLC, 2001. The appendices of this report outline how the data
was gathered and the formulas that were used to generate our estimates).
FIGURE 3:
Direct Employment in Child-Care Services
in Milwaukee County: Three Measures
7,251
4,005 3,972
0
1,000
2,000
3,000
4,000
5,000
6,000
7,000
8,000
UWMCED County Business Patterns Covered Employment Statistics
We have calculated the gross receipts and direct employment for the three
primary types of regulated child-care in Milwaukee County: licensed group child-care
providers, licensed group child-care centers, and certified family child-care providers.7
7 The calculation of gross receipts does not include information on provisionally certified child-care providers. This is because the survey data gathered for this study include too few responses from provisionally certified providers to permit reliable enrollment estimates. Our employment estimates do

21
The formula for measuring annual gross receipts is the following: Gross Receipts = (Enrollment) x (Average Cost/per child/per year)
The precise calculation of this formula for Milwaukee County data is shown in
Appendix 1 of this report. Our estimate, based on these calculations, is that total annual
gross receipts for the “trained regulated”8 child-care services industry in Milwaukee
County were $203.73 million in 2001.9
Figure 4 places this figure in local economic context, comparing it to the receipts,
sales, and output of other prominent industries in Milwaukee County. The first bar for
each entry reports the gross receipts/sales/output generated by the industries themselves.
The licensed child-care industry in Milwaukee County is significantly larger than
industries such as spectator sports, hotels and motels, advertising services, and
engineering services. When RIMS II output multipliers are applied to these industries
(the second bar for each entry) the overall impact of the local child-care industry remains
impressive. All told, when the ripple effects of purchasing and employee earnings in the
child-care industry are taken into account, the industry generates around $351 million in
the Milwaukee County economy. This figure represents over twice as much total impact,
for example, as advertising agencies, and over 33 percent greater than the total impact of
hotels and motels in the county. (For a complete listing of the annual receipts, output
multiplier figures, and the total impact estimates, please consult Appendix 3).
include provisionally certified providers, because our methodology permits a reliable estimate of workers per provider. 8 “Trained regulated” refers to licensed family care, licensed group centers, and regulated certified family providers. It excludes “provisionally certified” providers because the survey conducted for this project (see Appendix One) did not generate sufficient data for a reliable estimates of gross receipts in this sector. 9 As noted above, the difference between this figure and “official” data is substantial. According to the 1997 “Economic Census” of the U.S. Bureau of the Census, annual receipts in child-care services in Milwaukee County totaled slightly over $36 million in 1997. However, as we have noted, this figure misses substantial segments of the industry, and thus undercounts the size of the industry in Milwaukee County. We should also point out, as explained in Appendix One, that our estimate is based on a survey of county child care providers conducted in July 2002, with the weekly “snapshot” data then projected for 50 weeks (the estimate annual usage of child-care services). For the purposes of chronological clarity, we then used this estimate for the most recent full year of economic activity (2001).

22
FIGURE 4
The Receipts and Total Impact of the Child-Care Service Industry Compared to other Industries in Milwaukee County
0
100
200
300
400
500
600
Child CareServices
Sporting GoodsStores
Spectator Sports AdvertisingAgencies
Hotels andMotels
ManagementConsultingServices
Clothing Stores AccountingServices
EngineeringServices
Annual ReceiptsTotal Impact
Source: U.S. Bureau of the Census, Economic Census, 1997; for child-care industry, our calculations from 4-C Milwaukee survey.
Table 2 fleshes out the importance of the local child-care industry by breaking
down, by sectors of the Milwaukee County economy, the total impact (gross annual
receipts plus indirect/induced effects) of the child-care industry. The table illustrates how
the child-care industry generates economic activity in other sectors of the Milwaukee
County economy: for example, over $46.5 million annually in receipts in finance,
insurance, and real estate in the county are generated by the child-care industry. $16.4
million in business services and $10.8 million in health services in Milwaukee County are
generated annually by the purchases of child-care centers and spending of child-care
workers. In short, the ripple effects of the child-care industry are substantial, making it
an important part of the county’s economic base.

23
TABLE 2:
Estimated Impact of the Child-Care Services Industry on other Industries in Milwaukee County
(estimated annual receipts/output generated by receipts/output
of child-care industry, by sector) Sector Annual Impact
(in millions $) Finance, Insurance, and Real Estate 46.56 Transportation, Communication, and Utilities 17.03 Manufacturing 21.98 Construction 4.63 Wholesale and Retail Trade 15.07 Eating and Drinking Establishments 3.48 Health Services 10.82 Business Services 16.40 Other Services 11.68 Child-Care Services (Direct Impact) 203.73
Total Annual Impact (Direct & Indirect/Induced Impact of Child-Care Services)
351.38
Measuring the Employment Impact of the Child-Care Services Industry in Milwaukee
As we have already noted, for a variety of reasons official statistics significantly
underestimate the total direct employment in the child-care services industry in
Milwaukee County, roughly by one-half. Thus, once we account for the multiplier effect
of the industry, these official figures would produce a significant understatement of the
total impact of child-care services on the employment base of Milwaukee County.
Once again using the NEDLC methodology (NEDLC, 2001, 12-13), we estimate
total direct employment in child-care services in Milwaukee County at 7,251. (For a
detailed delineation of how the methodology was used to produce our estimate, see
Appendix 2). Individuals working directly with children in teaching or care positions
hold the vast majority of these jobs: 6,751. The remaining 500 jobs are administrative
and support positions, such as cooks, receptionists, and janitors.

24
Figure 5 places these employment figures in comparative context. As the table
illustrates, the number of people directly employed by the child-care services industry is
indeed impressive. The child-care industry directly employs more workers in Milwaukee
County (7,251) than prominent industries such as transportation equipment
manufacturing (7,013), printing and related activities (6,449), and legal services (5,430).
Child-care services directly employ twice as many workers as hotels and motels, five
times as many as management consulting, and fourteen times as many as spectator sports.
The RIMS II employment multiplier for child-care services is relatively low,
compared to other industries. This is chiefly because wages in the industry are low (thus
limiting the employment-generating impact of workers’ consumer spending) and because
a child-care center does not purchase as much from other local industries as, say, a
transportation equipment manufacturer (that purchases high-value items such as metal
and moldings). Nevertheless, even when the indirect and induced employment effects are
taken into account, the total employment impact of child-care services in Milwaukee
County remains substantial. Although the total impact of manufacturing employment is
higher than for child-care services –because the linkages between manufacturers and
local suppliers is robust—the total employment impact of child-care services compares
favorably to many important service industries in Milwaukee County. (For a complete
listing of the direct employment, output multiplier figures, and the total employment
impact estimates, please consult Appendix 3).
All told, as Figure 5 shows, the child-care services industry generates –through
indirect and induced effects—an additional 1,826 jobs in Milwaukee County, in
industries ranging from health care to business services. Table 3 breaks down the extent
to which the indirect and induced effects of child-care services create employment in
major sectors of the Milwaukee County economy. Like Table 2, this table illustrates the
ripple effects of the child-care industry. For example, an estimated 320 jobs in business
services and an estimated 313 jobs in finance, insurance, and real estate in Milwaukee
County are attributable to the economic activity generated by the child-care services
industry.

25
FIGURE 5:
The Employment Impact of the Child-Care Services Industry Compared to Other Industries in Milwaukee County
0
5,000
10,000
15,000
20,000
25,000
30,000C
hild
Car
eSe
rvic
es
Tran
spor
tatio
nEq
uipm
ent
Man
ufac
turin
g
Food
Man
ufac
turin
g
Prin
ting
and
Rel
ated
Activ
ities
Lega
l Ser
vice
s
Acco
untin
gSe
rvic
es
Arch
itect
ural
,En
gine
erin
g,an
d R
elat
edC
ompu
ter
Syst
emD
esig
n
Man
agem
ent
Con
sulti
ng
Hot
els
and
Mot
els
Clo
thin
gSt
ores
Spec
tato
rSp
orts
Direct EmploymentTotal Employment Impact
TABLE 3:
Estimated Impact of the Child-Care Industry
On Employment in Other Industries in Milwaukee County
Sector Employment Generated By Child-Care Services Industry
Finance, Insurance, and Real Estate 313 Transportation, Communication, and Utilities 139 Construction and Manufacturing 182 Wholesale and Retail Trade 235 Eating and Drinking Establishments 151 Health Services 162 Business Services 320 Other Services 324 Child-Care Services (Direct Impact) 7,251 Total Impact (Direct and Indirect/Induced Impact of Child-Care Services)
9,077

26
In short, measured either by direct or total employment impact, the child-care
services industry represents a sizeable part of Milwaukee County’s employment base.
Moreover, as we will examine shortly, in a county with a stagnant employment base,
child-care services is one sector whose employment is increasing rapidly. Thus, when we
take into account the magnitude of the industry’s gross receipts –and the ripple effects in
sectors throughout the Milwaukee County economy—it is clear that child-care services
represent a crucial component of the local economy.

27
IV
Labor Market Conditions in the Child Care Industry in Milwaukee County
As we have seen, the child-care industry is an important source of jobs in
Milwaukee County, directly employing an estimated 7,251 workers (and indirectly
generating 1,826 additional jobs). What can we say about the nature of these jobs? How
well does employment in child-care jobs pay, in comparison to other industries in
Milwaukee County? How well are Milwaukee County child-care workers paid compared
to child-care workers in other central “urban counties” in the Northeast-Midwest regions?
These are important issues, not only in examining the economic impact of the
child care industry, but as a factor affecting the supply and quality of child care services.
As Levy and Michel have recently argued, “despite the apparent abundance of child-care
funding, the supply is not keeping pace: this is due, in part, to low salaries and poor
benefits typically offered to providers.” Consequently, “in the recent climate of near-full
employment, child care centers have found it increasingly difficult to attract and retain
qualified employees, and women who might become independent home-based providers
choose other occupations ” (Levy and Michel, 2002, 253-254). Joan Fitzgerald points out
that programs designed to increase the supply and quality of child-care services by
training people leaving welfare to become child-care workers have generally failed
because the programs could not compete with higher-paying jobs (Fitzgerald, 2002,
A29). “In most labor markets,” writes Fitzgerald, “McDonald’s pays more than child-
care work” (Fitzgerald, 2002, A29). As we shall see, conditions in the Milwaukee
County child-care labor market are in-line with these national observations, a situation
that is compounded by overall weakness in the local labor market, particularly in
Milwaukee's central city.
General Characteristics of the Child-Care Labor Market: National Data Nationally, between 1986 and 2001 the numbers of employees in “child-care
services” grew from 439, 300 to 1,088, 600, or by almost 150 percent. In the next
decade, jobs in child-care are projected to grow by another 42 percent, much more
rapidly than the overall rate of employment growth (Fitzgerald, 2002, A28). Tables 4-6
28
present basic data on the general characteristics nationally of employment in the child-
care industry since the mid-1980s. On the whole, these tables confirm that the industry is
a female-dominated labor market, characterized by large numbers of part-time workers, a
modest percentage of college-educated workers, few union members, and low-wages.
According to the Current Population Survey of the U.S. Bureau of the Census, roughly
three-quarters of child-care workers nationally are employed outside of private
households (i.e. in child-care centers or other institutional settings). Other key elements
of the industry labor market profile:
• Females represented 96 percent of employees in child-care services nationally
in 2001, a figure essentially unchanged since the mid-1980s.
• 19 percent of employees in the industry had a college degree or higher; this
actually represents a decline from 24 percent in 1986. It is possible that the
expanding demand for child-care workers in the 1990s forced employers to
hire workers with lesser educational credentials. In addition, the full
employment labor market of the 1990s also increased other –and more
lucrative-- employment options for college educated women.
• The proportion of child-care workers of color has slowly climbed since the
mid-1980s.
• Few workers in the child-care industry are unionized. In 2001, only 3.4
percent of child-care industry employees worked in settings in which there
was union coverage (a decline from 4.1 percent in 1986). To the extent that
unionization helps improve wages, benefits, and overall working conditions,
employees in U.S. child-care settings fail to capture these benefits. Given the
general state of organized labor in the United States, as well as the small-scale
and fragmented nature of the child-care industry, it is difficult to envision
unionization occurring as in the case recently, for example, in Quebec
(Jenson, 2002, 324-325). We discuss this point in more detail below.

29
TABLE 4:
General Characteristics of the Child-Care Services Industry Labor Market in the United States, 1986-2001
Year % union
coverage
% part-time
% female
% with college
degree
% African-
American
1986 4.1 45 97 24 16 1996 3.5 39 95 20 17 2001 3.4 38 96 19 20
Source: Bureau of National Affairs (1997, 2002)
As Table 5 shows, wages in the child-care services industry remain comparatively
low, although as Table 6 illustrates, real wages in the industry have risen sharply since
1996. Between 1986-1996, in real, inflation-adjusted dollars, the hourly wage of
employees in child-care services declined by 2.2 percent. Between 1996 and 2001,
however, the real wage of child-care services employees rose by 20 percent, actually
running ahead of real wage increases nationally for the economy as a whole. Three
factors undoubtedly contributed to this improving wage situation. First, the tightening of
the national labor market –reaching its apex with unemployment dipping below 4.0
percent in 2000—began to put upward pressure on wages. Second, the post-welfare
reform increases in funding for child-care services increased the demand for child-care
workers, creating labor shortages and driving up wages somewhat. Finally, and perhaps
most importantly, the federal minimum wage was increased from $4.75 to $5.15 in 1997,
an increase of 8.4 percent. This boost benefited low-wage workers across the country
(Mishel, Bernstein, and Schmitt, 2001, 191-192), and, unfortunately, child-care workers
largely fall into this category. Consequently, the minimum wage increase had a
disproportionately positive effect on wages in the child-care services industry in the
period after 1996.

30
Nevertheless, as we shall see, the post-1996 real wage increases have not been
nearly enough to significantly change the relative status of child-care as essentially a low-
wage industry. Moreover, unless the industry is restructured, upward mobility within the
sector is also likely to be limited. As Joan Fitzgerald points out: “The job ladder in child
care has just three rungs: teacher-aide, teacher, and supervisor. Aides earn an average
wage of $6.51 per hour. Teachers earn an average of just $7.54 per hour, and even
supervisors earn only $12.55 per hour…The work is characterized by long hours, social
isolation from adults, few breaks, and scant advancement opportunities. Job
dissatisfaction produces high turnover –annual rates range from 20 percent to 75
percent…” (Fitzgerald, 2002, A29). Fitzgerald’s solutions to these problems in the child-
care services labor market—greater professionalization and “job laddering”—are policies
we endorse below.
TABLE 5:
Wages, Earnings and Hours in Child-Care Services in
the United States, 1986-2001
(wages and earnings in inflation-adjusted, 2001 dollars)
Year Average Weekly Earnings
Average Hourly Wages
Average Weekly Hours Worked
1986 $264 $ 8.65 30.5 1996 $276 $ 8.46 32.6 2001 $340 $10.15 33.5 Source: Bureau of National Affairs (1997, 2002)
TABLE 6:
Trends in Real Hourly Wages in the Child-Care Services Industry in United States, 1986-2001
Period Change in Real Wages
1986-1996 - 2.2 % 1996-2001 +20.0 %
Source: Bureau of National Affairs (1997, 2002)

31
In Wisconsin, recent research suggests that the child-care industry in the state has
an occupational structure and labor market profile consistent with the national picture. In
2001, the Wisconsin Early Childhood Association (WECA) released a study that includes
an analysis of the occupational characteristics of Wisconsin child-care centers and
licensed family providers (Wisconsin Child Care Research Partnership, 2001). This
study revealed:
• Only 42 percent of the teaching staff at child-care centers had associate’s degree
or higher in 2001, compared to 61 percent in 1994. This “downskilling” may, in
part, be the result of the rapid growth in the number of child-care providers in
Wisconsin in the wake of welfare reform, and the difficulty in filling employment
slots;
• Twenty percent of family child-care providers surveyed had an associate’s degree
or higher;
• Half of the family child-care providers responding to the WECA study earned
$17,000 or less in 2000. Average annual earnings were just over $22,000.
Twenty-eight percent of these respondents reported being their family’s sole
source of income;
• Seventy-seven percent of teaching staff (teachers and assistant teachers) at
Wisconsin child-care centers earned under $9.00 per hour in 2001;
• Not only have wages remained stagnant in the Wisconsin child-care industry –
despite the growing demand for child-care services and labor shortages in various
parts of the state—but the proportion of employees receiving fringe benefits at
Wisconsin child-care centers has also remained unchanged since 1994. In 2001,
69 percent of group child care centers offered their employees health insurance,
and 47 percent offered dental insurance; and
• Annual turnover at Wisconsin child-care centers has actually increased since
1994, from 25 to 41 percent. Moreover, 7 percent of responding centers reported
100 percent annual turnover in 2001. Four percent of the centers reported no
turnover.

32
In sum, the WECA study concluded that the labor market conditions in Wisconsin
child-care pose major problems for the quality of care in the state. “By itself, the early
care and education system cannot fully implement massive changes. Quality of care will
continue to be an issue as long as the workforce is underpaid” (Wisconsin Child Care
Research Partnership, 2001, 30).
The Child-Care Services Labor Market in Milwaukee County
The available data for Milwaukee County reveal that conditions in the local child-
care services labor market closely parallel the national situation. Employment in child-
care services in Milwaukee County, even using Department of Labor statistics that
significantly underestimate the number of child-care workers, grew by 26 percent
between 1997 and 2001. During that same period, overall employment in Milwaukee
County increased by slightly less than one percent.
Despite this apparently rapidly growing demand for workers in the county’s child-
care services industry, two particular aspects of Milwaukee’s overall macroeconomic
environment exert strong downward pressure on wages in county’s child-care services
labor market. First, as Table 7 shows, compared to a representative sampling of central
“urban counties” primarily in the Midwest, Milwaukee County has a relatively high
unemployment rate and hence, an unfavorable environment for worker wage increases.
Of the nine counties arrayed in Table 7, Milwaukee County experienced the highest
increase in its unemployment rate between 1997-2001. This was chiefly because of the
surge in unemployment in the City of Milwaukee (which jumped from 5.1 percent in
1995 to 7.9 percent in 2001, despite the cresting of the national economic boom during
this period).

33
TABLE 7:
The Macroeconomic Environment of the Local Child-Care Services Labor Market:
Unemployment Rates in Selected “Urban Counties”
1992-2001
County 1992 1997 2001
Allegheny (Pittsburgh) 6.3 % 4.4 % 3.8 % Cook (Chicago) 8.0 5.0 5.9 Cuyahoga (Cleveland) 7.4 4.9 4.6 Hennipin (Minneapolis) 4.4 2.4 3.2 Marion (Indianapolis) 5.7 4.7 3.8 Milwaukee 5.2 4.3 5.6 St. Louis 4.5 3.1 3.9 Suffolk (Boston) 8.3 4.3 4.1 Wayne (Detroit) 10.5 4.7 5.8
Second, despite its historical reputation as a bastion of family-supporting, largely
unionized middle-class jobs, Milwaukee over the past two decades has become a low-
wage city and a relatively low-wage county (Levine, 1995). As Table 8 shows, average
annual pay for all industries in Milwaukee County is the lowest among the nine “urban
counties” sampled for this report; Milwaukee, in fact, lags five percent below the next
lowest county (see Table 9). Moreover, even during the peak of the national economic
boom (1997-2000), real increases in average annual pay in Milwaukee County ranked
among the lowest of these comparable “urban counties,” rising an average of just 1.5
percent annually between 1997-2000.

34
TABLE 8:
Real Average Annual Pay: Milwaukee County and Selected Urban Counties, 1997-2000
(inflation-adjusted average annual pay, in constant $2000,
in selected urban counties, for all industries)
County 1997 2000 % change, 1997-2000
Allegheny (Pittsburgh) 35,006 36,727 + 4.9 Cook (Chicago) 39,488 42,898 + 8.6 Cuyahoga (Cleveland) 34,930 36,520 + 4.6 Hennipin (Minneapolis) 39,221 43,816 +11.7 Marion (Indianapolis) 34,326 36,473 + 6.3 Milwaukee 33,195 34,744 + 4.7 St. Louis 35,804 38,145 + 6.5 Suffolk (Boston) 47,664 56,699 +19.0 Wayne (Detroit) 39,932 42,440 + 6.3
Source: Bureau of Labor Statistics
TABLE 9:
Real Pay in Milwaukee County In Comparative Perspective, 1997-2000
(average annual pay for all industries,
expressed as percentage of Milwaukee County’s i.e. Milwaukee County = 100).
County 1997 2000
Allegheny (Pittsburgh) 105.5 105.7 Cook (Chicago) 118.9 123.5 Cuyahoga (Cleveland) 105.2 105.1 Hennipin (Minneapolis) 118.2 126.1 Marion (Indianapolis) 103.4 105.0 Milwaukee 100.0 100.0 St. Louis 107.9 110.0 Suffolk (Boston) 143.6 163.2 Wayne (Detroit) 120.3 122.2
Source: Bureau of Labor Statistics

35
In other words, not only is pay relatively low in Milwaukee County, but it is
falling further behind comparable urban counties. For the decade as a whole, real income
and real average annual pay in the Milwaukee County were virtually stagnant. In short,
the overall Milwaukee economy operates in a low-wage macroeconomic context that
effectively places a ceiling on wages in the child-care services industry. Thus, in the long
run, improving wages and the overall quality of the child-care labor market in Milwaukee
County will require improvements in the overall county labor market.
Tables 10 and 11 put average annual pay in Milwaukee County’s child-care
services industry in comparative perspective. The tables confirm that, in all of the urban
counties we examined, child-care remains a low-pay industry, although, confirming what
we saw in Table 6, real pay did increase after 1997 (following changes in the minimum
wage and welfare reform). Compared to other urban counties, average annual pay in
Milwaukee County’s child-care services ranked in the middle-of-the-pack in 2000 (Table
11), a slight improvement from 1997 when industry pay in Milwaukee ranked 6th of the 9
counties studied.
TABLE 10:
Real Average Annual Pay in the Child-Care Services Industry:
The Milwaukee County and Selected Urban Counties, 1997-2000
(inflation-adjusted average annual pay, in constant $2000)
County 1997 2000 % change, 1997-2000
Allegheny (Pittsburgh) $12,879 $13,703 + 7.1 Cook (Chicago) $15,886 $16,353 + 2.9 Cuyahoga (Cleveland) $14,223 $16,121 +13.3 Hennipin (Minneapolis) $14,587 $16,045 +10.0 Marion (Indianapolis) $12,995 $14,566 +12.1 Milwaukee $13,811 $14,927 + 8.1 St. Louis $14,722 $14,832 + 0.7 Suffolk (Boston) $20,614 $21,050 + 2.1 Wayne (Detroit) $13,270 $14,406 + 8.6
Source: Bureau of Labor Statistics

36
TABLE 11:
Real Pay in the Milwaukee Child-Care Services Industry In Comparative Perspective, 1997-2000
(average annual pay in child-care services industry, expressed as percentage of Milwaukee County’s
i.e. Milwaukee County = 100).
County 1997 2000
Allegheny (Pittsburgh) 92.6 91.8 Cook (Chicago) 115.0 109.6 Cuyahoga (Cleveland) 103.0 108.0 Hennipin (Minneapolis) 105.6 107.5 Marion (Indianapolis) 94.1 97.6 Milwaukee 100.0 100.0 St. Louis 106.6 99.4 Suffolk (Boston) 149.3 141.0 Wayne (Detroit) 96.1 96.5
Source: Bureau of Labor Statistics Nevertheless, these modest post-1997 improvements have scarcely changed the
low-pay nature of the Milwaukee County child-care labor market. As Table 12 shows, in
Milwaukee as elsewhere, child-care workers earn a fraction of the average annual pay for
all workers. In most urban counties, average annual pay for employees in the child-care
services industry is less than two-fifths the average annual pay for all workers, and
nowhere does child-care industry pay exceed half the county-wide average annual pay.
The only reason Milwaukee County child-care workers rank relatively higher on this
scale than workers in other counties is that average annual pay for all workers in
Milwaukee is lower than the comparison counties. This is hardly a sign that child-care
workers here earn closer to a “family supporting” income than elsewhere; it is more a
reflection of the overall problem of low-wages in Milwaukee.

37
TABLE 12:
Average Annual Pay in Child-Care Services As a Percentage of all-Industry Average Annual Pay
Selected Urban Counties, 1997-2000
County 1997 2000
Allegheny (Pittsburgh) 36.5 37.3 Cook (Chicago) 40.2 38.1 Cuyahoga (Cleveland) 40.7 44.1 Hennipin (Minneapolis) 37.2 36.6 Marion (Indianapolis) 37.9 39.9 Milwaukee 41.6 43.6 St. Louis 41.1 38.9 Suffolk (Boston) 43.2 37.1 Wayne (Detroit) 33.2 33.9 Source: Bureau of Labor Statistics
Thus, despite improvements in the late 1990s, it is clear that across a sample of
mainly Midwest urban counties pay in the child-care industry remains firmly in the “low-
wage” sector of the labor market. Milwaukee County is no exception: in 2000, the
average annual pay of child-care industry employees ($14,927) here was only 43.6
percent of the county average annual pay ($34,744). Table 13 shows how average annual
pay in the child-care services industry stacks up against selected other industries in
Milwaukee County. Again, the data show the extent to which child-care workers in the
county are in the low-paying segment of the labor market. Employees in the child-care
services industry receive average annual pay in the same general range as employees of
apparel stores and beauty shops, and less than workers in hotels or laundry services.

38
TABLE 13:
Average Annual Pay in Child-Care Services and
Selected Comparison Industries: Milwaukee County, 1997-2000.
(in constant, 2000 dollars)
Industry 1997 2000 % change,
1997-2000
Child-Care Services $13,811 $14,927 + 8.1 Apparel and Accessory Stores $12,898 $13,418 + 4.0 Hotels and Motels $14,997 $16,190 + 8.0 Beauty Shops $13,017 $14,247 + 9.5 Eating and Drinking Places $10,379 $11,042 + 6.4 Laundry, Cleaning, and Garment Services $17,868 $18,934 + 6.0 Printing and Publishing $33,551 $33,981 + 1.3 Elementary and Secondary Schools $36,363 $37,561 + 3.3 Source: Bureau of Labor Statistics
Figure 6 presents the information in a somewhat different way, with similar
conclusions. Our earlier data was collected by industry; Figure 6 arrays wage data by
occupational category for a selected group of jobs. The Bureau of Labor Statistics
collects the data at the metropolitan area level (as opposed to county or city level) but the
level of aggregation is unlikely to dramatically influence the results. Once again, the data
show the compensation of child-care workers to be comparable to low-wage, low-skill,
“secondary labor market” occupations, and nowhere near the levels of professional-level
jobs such as school teachers, for example.

39
FIGURE 6:
Earnings in Selected Occupations in Metro Milwaukee, 2000
$0 $5,000 $10,000 $15,000 $20,000 $25,000
Child Care Workers
Locker Room Attendants
Hotel Desk Clerk
Data Entry Keyers
Bank Teller
Waiters/Waitresses
Fast Food Cooks
Crossing Guards
Security Guards
Source: Bureau of Labor Statistics, Metropolitan Area Occupational Employment and Wage Estimates, 2000.
Strategies to Improve the Child-Care Service Labor Market
The “value-added” and, hence, remuneration attached to various jobs is not
exclusively market driven. As Harvey Molotch (1991) has noted, “the income or dignity
of a job has never been intrinsic to the task performed, but a matter of institutional
definition” (p. 177). Employment in the child-care industry is not intrinsically low-wage
employment; it reflects how the industry has been organized and “defined” in the United
States. But, as researchers such as Barbara Bergmann point out, in other societies, such
as France, child-care employment is structured as skilled, professional work. Salaries for
French child-care workers, in relative terms, more than double those of U.S. child-care
workers, and include such benefits as housing allowances, pensions, vacations, and
tenure. “Given the job stability associated with the civil service,” writes Bergmann, “the

40
pay is apparently sufficient to attract stable, well-educated people to those jobs, in sharp
contrast to the situation in American day care, where employee turnover is high and
employees are often ill-educated, have no special training in childhood education, and are
paid the minimum” (Bergmann, 1996, 31).
Similarly, in Quebec since the late 1990s, prodded by the estimated 25 percent of
child-care workers who are unionized, there has been a concerted effort to establish child
care as a career for “educators,” not merely “caregivers” (Breton, 2002; Davenport and
Smith, 2002). A threatened strike in 1999 by workers at early childhood centers
prompted the provincial government to inject $150 million into the province’s network of
day care centers, which permitted substantial wage increases (the average wage of child-
care workers jumped from $9 to $15 an hour). Another threatened labor action in June
2002 led to a commitment of $32 million from the provincial government to set up a
pension plan for child-care workers (Breton and Gervais, 2002).
Although the French model of professionalization and Quebec model of
unionization seem a long way from the “possible” in the U.S. setting, there have been
efforts in the United States to improve training and wages for child care workers. Under
federal Child Care Development Block Grant (CCDBG) legislation, states were required
to allocate 25 percent of funding for “activities to improve the quality of child care and
provide…early childhood development services”; current law reduces this to four percent
(Levy and Michel, 2002, 254). Levy and Michel note that 11 states (including
Wisconsin) have used this money, sometimes adding state funds, to initiate “programs to
encourage child care workers to obtain more training and then reward them for doing
so…while one state, Rhode Island, subsidizes benefits for child care workers. Such
measures are, however, few and far between; they do little to raise the status of child care
as an occupation or address the attendant issues of working conditions and quality” (Levy
and Michel, 2002, 254).
Several projects around the country have attempted to establish a “comprehensive
career-advancement model” in child-care services (Fitzgerald, 2002, A30). The State of
Washington, for example, has established a limited system (encompassing about seven
percent of the state’s child-care centers) in which centers agree to a state-mandated wage
scale, provide a minimum of 12 days of paid leave, and provide some health benefits.

41
Most importantly, the Washington model sets up a career-development ladder within
centers, involving gradations of pay and credentials, and a clear path of training
necessary to move up the ladder (from teacher’s aides without high-school diplomas
through to teachers with master’s degrees in early childhood education). Fitzgerald notes
that “while this approach has the virtue of regularizing the career path and rewarding
achievement, funding constraints limit it to just one Washington center in 15; and even
with the higher pay, child-care teachers still earn several thousand dollars less than their
counterparts in public kindergartens” (Fitzgerald, 2002, A30).
There are several programs in Wisconsin aimed at improving the child-care labor
market. In Dane County and the City of Madison, CCDBG funds have been used to
launch a $250,000 pilot “local child care wage initiative” in which 24 child-care centers
and 45 in-home providers received bonuses, ranging between $750 and $2000 quarterly,
for full-time teaching staff and directors. “The initiative seeks to improve the quality of
care and the quality of jobs at participating centers and homes by providing compensation
incentives for job attachment, training, education, and experience” (Center on Wisconsin
Strategy, 2002). This pilot covers about one-tenth of the full-time workers at centers and
homes; extending the pilot to cover all full-time child-care workers in Dane County
would cost and estimated $2.5 million annually. A quick calculation suggests that a
similar program in Milwaukee County would cost around $10 million annually.
TEACH (Teacher Education and Compensation Helps) is a scholarship program,
administered by the Wisconsin Early Childhood Association, that supports progress
towards a number of different career steps in the child care field, ranging from the infant
toddler credential through bachelor’s degrees for teachers, family child care providers,
and administrators. There is also scholarship help available for child care providers and
administrators who enter into a formal mentoring program managed by the area child
care resource and referral agency. After completing the agreed-upon education, the
participant receives a pay raise and/or a one-time bonus and makes a commitment to stay
with the child-care entity that sponsored them, or at least in the child care field
(depending on the particular scholarship), for 6 months to one year. In the first 16

42
months of operation, 600 people began educational programs with TEACH
scholarships.10
REWARD (Rewarding Education with Wages and Respect for Dedication) is a
program of the Office of Child Care in the Wisconsin Department of Workforce
Development. Like the Dane County initiative, this program provides stipends to child
care providers and program directors as recognition of educational attainment and
duration of employment. Bonuses ranging from $875 to $1,750 are paid to providers
based on their level of achievement in the state’s Registry Recognition system at level 5
(an associate’s degree in child care and development) and above. $1.2 million dollars in
stipends were awarded to nearly 1,000 providers in 2001, the program’s pilot year.
Beyond the statewide program, the Early Childhood Council of Milwaukee also provides
a supplement of $100 to $400 per child-care worker for achieving levels 1 through 4 in
the Registry system, an additional incentive for entry-level workers in Milwaukee to
pursue training.
Finally, several other notable efforts to improve the child-care labor market are
underway in Milwaukee. 4C-Milwaukee, the child care resource and referral agency for
the four county metropolitan area, recently offered a Professional Support Program,
providing grants to child care programs whose staff members participated in training
from local Centers of Excellence. Thirteen child-care centers in the Milwaukee area were
awarded this designation from the state Department of Workforce Development, and then
4C was designated as an outreach entity for the project.
The Early Childhood Council of Milwaukee offers a project called “Taking on
Turnover.” This project focuses on training and providing ongoing support for child-care
center directors on how to manage staff development and reduce turnover. Another
Council project is a “facilitated accreditation model” that assists providers in pursing
national early care and education childhood standards. Mirroring the overall intention of
most child-care labor market projects, these projects flow from the Council’s overall
mission to foster child-care environments that nurture children and support their families.
10 Milwaukee County DHS funds a substitute pool of child-care workers to fill in for people taking classes funded by TEACH. This program relieves the burden that providers would otherwise face as employees attended training courses.

43
In sum, there are several promising initiatives underway across the country and in
Wisconsin to improve the child-care labor market: to professionalize, raise standards, and
increase wages and benefits. To date, the results have been modest: as we have seen,
employees in child-care services remain firmly in the low-wage segment of the labor
market. But, there was notable wage improvement in Milwaukee County toward the end
of the 1990s, stimulated by an increase in the minimum wage and macroeconomic factors
(increased demand for child-care services and employees in the aftermath of welfare
reform). The next step is to expand these promising wage improvement and career
laddering initiatives to further professionalize the industry and, ultimately, improve the
quality of child-care service available in Milwaukee County.

44
V
The Long-Term Impact of Child-Care Services On Local Economic Development
As we have documented, child-care services is a major industry in Milwaukee County,
generating thousands of jobs and millions of dollars in annual economic activity. But,
child care also provides a variety of other positive effects for the local economy. As the
NEDLC notes: “It allows parents to be productive workers, creates additional jobs within
the local economy, draws down state and federal subsidies that remain in the local
economy, draws down dollars in the form of federal tax credits which are spent locally,
and reduces future public expenditures on social programs and criminal justice”
(NEDLC, 2001, 31). In this section of the report, we briefly spell out some of these long-
term effects of child care on the local economy.
Labor Force Participation and Productivity Effects of Child Care
Like good transportation or reliable electric power, child-care is an integral component
of the long-term “infrastructure of growth” in Milwaukee County. Reliable
transportation enables businesses to get their goods or services to market and allows
workers to commute to and from work efficiently – all critical factors in productivity and
economic growth. Similarly, quality child care is an increasingly central part of local
economic infrastructure. Child-care services permit parents to pursue employment
opportunities across the economic spectrum and enables workers to be more productive
when at work (cutting down on absenteeism due to child care problems, for example).
Thus, child care is indispensable in providing local businesses with the workforce they
require for growth.
In Milwaukee County, we estimate that the regulated child-care industry frees up
approximately 21,000 parents for work.11 These working parents earn an estimated
$538.5 million annually – a major contribution to the county’s economic base.12 Once
11 This estimate is based on the assumption, derived from research by the California Child Care Resource and Referral Network, that three-quarters of the demand for child care is work-related. The July 2002 survey conducted by 4C-Milwaukee (see Appendix One) yields an estimate of 28,243 children in “regulated” child care in Milwaukee County; thus, three-quarters of this figure equals 21,182. 12 This figure was calculated as follows. The average worker in metropolitan Milwaukee, according to the Current Population Survey of the U.S. Bureau of the Census, earned $16.95 an hour in 2001. We assumed a

45
the multiplier effect of these earnings is calculated, the total earnings of workers made
possible by the county’s child-care infrastructure reaches $1.08 billion annually. This
represents six percent of the total earnings of workers in Milwaukee County (in 2000, the
most recent data available).13
Reducing Public Sector Expenditures and Generating Public Benefits
There is a growing body of research documenting an impressive array of benefits from
early childhood education programs, for children and families as well as for society as a
whole. The benefits, for children and families, are difficult to measure quantitatively in
dollars, but include:
• Gains in emotional or cognitive development for the child, and improved
parent-child relationships;
• Improvements in educational outcomes for the child;
• Increased economic self-sufficiency, initially for the parent and later for
the child, through greater labor force participation, higher income, and
lower welfare usage; and
• Improvements in health-related indicators, such as child abuse, maternal
reproductive health, and maternal substance abuse.14
For the community as a whole, however, child care also generates important benefits.
We have already noted the significance of child care in contributing to economic growth
and public revenues, due to higher earnings, greater labor force participation, and
improved worker productivity. In addition, recent studies have documented how child
care helps reduce public expenditures on such items as health care, special education, and
other social services, as well as reduced criminal justice system costs. The RAND
Institute, in a careful review of the benefits and savings of early childhood intervention 30 hour work week, and 50 weeks of work a year. We then multiplied this figure by 21,182 workers, to arrive at an aggregate “wage bill” for parents whose workforce participation was facilitated by child care. 13 In this sense, as Barbara Wolfe and Deborah Lowe Vandell point out, child-care subsidies need to be evaluated differently than conventional approaches to measuring government costs because “unlike many other social services, [they] are directly related to employment. By enabling many more people to go to work, or to work more productively, child-care subsidies generate additional tax income for the government – income that actually offsets expenditures for child care” (Wolfe and Vandell, 2002, A20).

46
programs, calculated that for every dollar invested in such programs, there is an estimated
saving of $2.50 to $4.00.15 Other studies show returns over $7.00 to the public for each
dollar invested, by increasing economic well-being (and tax revenues), and by reducing
expenditures for remedial education and crime (NEDLC, 2001, 34; Wolfe and Vondell,
2002, A20). And these studies likely understate the public return since the only benefits
included are those that can be easily monetized.
Capture of Federal and State Subsidies
Many child care programs, particularly in the era of welfare reform, receive
substantial federal and state subsidies. As NEDLC notes: “These subsidies, which come
from outside the community and are spent within the community, would not be available
without the existence of these child care programs” (NEDLC, 2001, 32). In short, one
benefit to the larger community from child care is an increased flow of transfer payments
and a boost to the overall economy.
In Wisconsin, when welfare reform was implemented, public subsidies to offset the
cost of child care for low-income families were consolidated and expanded, in a program
called “Wisconsin Shares.” The program serves families with incomes up to 200% of the
federal poverty level.16
In Milwaukee County, the Wisconsin Shares subsidy supported 33,471 children in
2001. The average payment $3,839 per child totaled $128.5 million in subsidies in the
county (State of Wisconsin, Department of Workforce Development, Office of Child
14 RAND Institute, Investing in Our Children (1998), p.xv. 15 RAND Institute, Investing in Our Children (1998), p. xviii. The study concluded: “It is worth pointing out, however, that while the benefits exceed costs, the costs accrue immediately, while the benefits are realized only as the years pass and children transition through adolescence to adulthood.” The authors of the RAND report also make another important point in using “cost-savings analysis,” which should be kept in mind as we consider child care policy. “Cost-savings analysis is a useful tool because, when the results are positive, it provides strong support for program worth. That is, it shows that only a portion of the benefits –those easily moneitzable—outweigh the program’s entire cost. However, because only some of the benefits are taken into account, a negative result does not indicate that a program shouldn’t be funded. Policymakers must then decide whether the nonmonetizable benefits –e.g., gains in IQ, in parent-child relations, in high-school diplomas—are worth the net monetary cost to the government.” 16 Most of the “Wisconsin Shares” funding goes directly to offset families’ child-care costs. Approximately 11 percent of the funding is used for programs that encourage the establishment of new child-care providers and that support more training and retention for staff in the child-care industry. Nearly half of the families receiving the child-care subsidy in June 2002 had incomes below the poverty level. For one-third of the families served, the average subsidy payment per child was equal to one quarter of their annual earnings (State of Wisconsin, Department of Workforce Development, Office of Child Care (2002).

47
Care (2002a). This represented 54.4 percent of total state child care subsidy payments
under Wisconsin Shares.
The Wisconsin Shares subsidies provide a significant infusion of funds into the
Milwaukee County child-care industry. In 2001, payments to providers from Wisconsin
Shares accounted for approximately 63 percent of the gross annual receipts of the
regulated child-care industry in Milwaukee County ($128.5 million of $203.7 million).
In short, the capture of state child-care subsidy funds in Milwaukee County provides the
lion’s share of receipts for the local child-care industry—which, as we documented in
section III of this report, in turn generates thousands of jobs and additional economic
activity in Milwaukee County.
Conclusion
The quantifiable public benefits of investments in child care are substantial. As we
have illustrated, child care is a major element in Milwaukee County’s “infrastructure of
growth,” facilitating labor force participation, increased public revenues from more
people working, and decreased long-term public costs as quality child care reduces crime
and other social problems. In Milwaukee County, the child-care infrastructure has
captured significant state funding since the late 1990s, boosting not only the local child
care industry, but jobs and income through the county economy.

48
Appendix 1
Calculating the Annual Gross Receipts of the
Child-Care Services Industry In Milwaukee County
This report utilizes the methodology for calculating the annual gross receipts of the local child care industry developed by the National Economic Development and Law Center for the California “Local Investment in Child Care” (LINCC) Project. The methodology is presented in the LINCC report, A Methodology Guide: Creating an Economic Impact Report for the Child Care Industry.
Traditional economic accounting tools significantly undercount the annual gross
receipts of the child-care industry. As we note in the body of the report, by our estimates the annual gross receipts for child-care services reported for Milwaukee County by the United States Bureau of the Census in the 1997 “Economic Census” captures just slightly more than one-sixth of the actual annual receipts of the industry.
These are the steps we took to calculate annual gross receipts for child-care services in Milwaukee County:
First, we obtained figures on the total capacity of regulated child-care providers in
Milwaukee County from 4Cs of Milwaukee, the county’s “resource and referral” agency. This figure represents the full number of licensed or certified slots in Milwaukee County in July 2002.
Second, we calculated, for each type of child-care provider (licensed family, certified
family, and group centers) how many slots available to children in three different age groupings (0-24 months, 2-5 years old, 6-13 years old). This estimate was derived from a postcard survey conducted by 4Cs of Milwaukee in July 2002.17 This survey asked the active providers in the 4C of Milwaukee database to provide total enrollment and total capacity figures for each age grouping (0-24 months, 2-5 years, 6-13 years) for the week of July 15th. The response rate for this survey was 33%. The breakdowns from the postcard survey on the share of total capacity available to each age grouping were then applied to all providers in Milwaukee County.
Type of Provider 0-24 Months 2-5 Years 6-13 Years Group Center 21.4% 52.0% 26.6% Licensed Family 24.5% 45.6% 29.8% Reg. Certified 26.1% 37.6% 36.3%
17 The survey was necessary to obtain this data, because the process of regulation does not in every provider’s case establish how many children can be cared for from each age grouping. Capacity for different ages of children is dependent on several factors, including the type of provider, the provider’s ability to meet the required staffing ratios, and the facility’s square footage.

49
Third, having calculated the number of available slots, we estimated actual enrollments at regulated child-care providers. According to the postcard survey, there are enrollment rate differences among the different types of providers. Group centers were the highest, with enrollment at 78.9 percent of capacity, while certified family providers and licensed family providers reported enrollments at 64.0 and 60.3 percent of their total capacity, respectively. Many of the home-based providers wrote notes on their survey postcards indicating significant fluctuation in their enrollment numbers. Consequently, we used the countywide average enrollment rate of 75 percent for Milwaukee County in the calculation of the gross receipts as a means to balance this reported trend. Fourth, we compiled data on the average weekly rates for child-care services, by age group. Rates for child-care services vary, of course, by the age of the child as well as type of provider. In addition, rates vary across the county. Therefore, we weighted, by age group, provider type, and zip code grouping, the rate data provided by 4C-Milwaukee.
Average Rates at Regulated Child-Care
Providers in Milwaukee County July 2002
Type of Provider 0-24 Months 2-5 Years 6-13 Years Group Center $181 $149 $135 Licensed Family $167 $151 $153 Reg. Certified $149 $134 $127
Finally, we calculated the gross receipts for the child care industry in Milwaukee County by multiplying the enrollment estimates by the average weekly rate for child-care services, and then multiplying that figure by 50 (based on estimated annual usage of child-care services of 50 weeks per year). The data generated for the calculations are displayed in the table on the following page. Gross Receipts = (Enrollment) x (Average Cost/per child/per week) x 50

50
$203,731,267 TOTAL ANNUAL GROSS RECEIPTS (BASED ON 50 WEEKS PER YEAR USAGE) Gross receipts for Licensed Family child care (B2 x B3) + (C2 x C3) + (D2 x D3) = 192,257.00 + 323,846.20 + 214,215.54 = $730,318.7 x 50 weeks = $36,515,937.00 Gross receipts for Group Centers child care (F2 x F3) + (G2 x G3) + (H2 x H3) = 695,351.72 + 1,387,113.60 + 642,241.23 = $2,724,706.55 x 50 weeks = $136,235,327.50 Gross receipts for Certified child care (J2 x J3) + (K2 x K3) + (L2 x L3) = 177,875.75 + 230,218.17 + 211,506.12 = $619,600.04 x 50 weeks = $30,980,002.00 [NOTE: There are an additional 1395 slots in provisionally certified care that are not included in this calculation of the gross receipts for the child care industry. Also excluded are pre-schools and before and after school care, nanny and au pair care.]
Licensed Family child care Group Centers child care Certified child care
A Total
B 0-24 mos
C 2-5 yrs
D 6-13 yrs
E Total
F 0-24 mos
G 2-5 yrs
H 6-13 yrs
I Total
J 0-24 mos
K 2-5 yrs
L 6-13 yrs
1 Capacity
6256 1533 2853 1864 23902 5115 12429 6358 6105 1593 2295 2216
2 Enrolled
75% 1150 2140 1398 75% 3836 9322 4769 75% 1195 1721 1662
3 Ave. Rate per week
$167.18
$151.33
$153.23
$181.27
$148.80
$134.67
$148.85
$133.77
$127.26

51
Appendix 2:
Calculating Direct Employment in the Child-Care Services Industry In Milwaukee County
This project used the methodology developed by National Economic Development
and Law Center for the California LINCC project to estimate employment in the child-care services industry in Milwaukee County. Using data provided by 4C-Milwaukee, the local child-care resource and referral agency, we estimate that there are 7,251 people employed in the child-care services industry in Milwaukee County in both teaching/caregiving and non-teaching positions.
This estimate was derived as follows: First we estimated the number of people working in home-based child-care. There are
2,283 licensed and certified family child care homes in Milwaukee County; the LINCC methodology estimates that each home averages one employee.
Second, we calculated employment at licensed group child-care centers. The LINCC
methodology developed a series of formulae to estimate teaching/caregiving staffing levels, based on the number of shifts the center operates, the number of children the center is licensed to serve, and the staffing ratios required by state licensing. The Full Time Equivalent staff is calculated by dividing the number of hours that the center is open by 8 (hours).
• Staff for Infants and Toddlers: # of employees = (1 employee for every 4 children) x (FTE for staff) N= 1,900
• Staff for 2-5 year olds
# of employees = (1 employee for every 10 children) x (FTE for staff) N= 2,001
• Staff for 6-13 year olds
# of employees = (1 employee for every 18 children) x (FTE for staff) N= 567
Third, we estimated non-teaching staff. The LINCC methodology assumes one
director, one custodian, one cook, one receptionist, and one off-site administrator for every group center serving 80 or more children. The data from 4C-Milwaukee shows 100 such centers in Milwaukee County, yielding a total estimate of 500 non-teaching staff positions.
• Non-teaching Staff N= 500
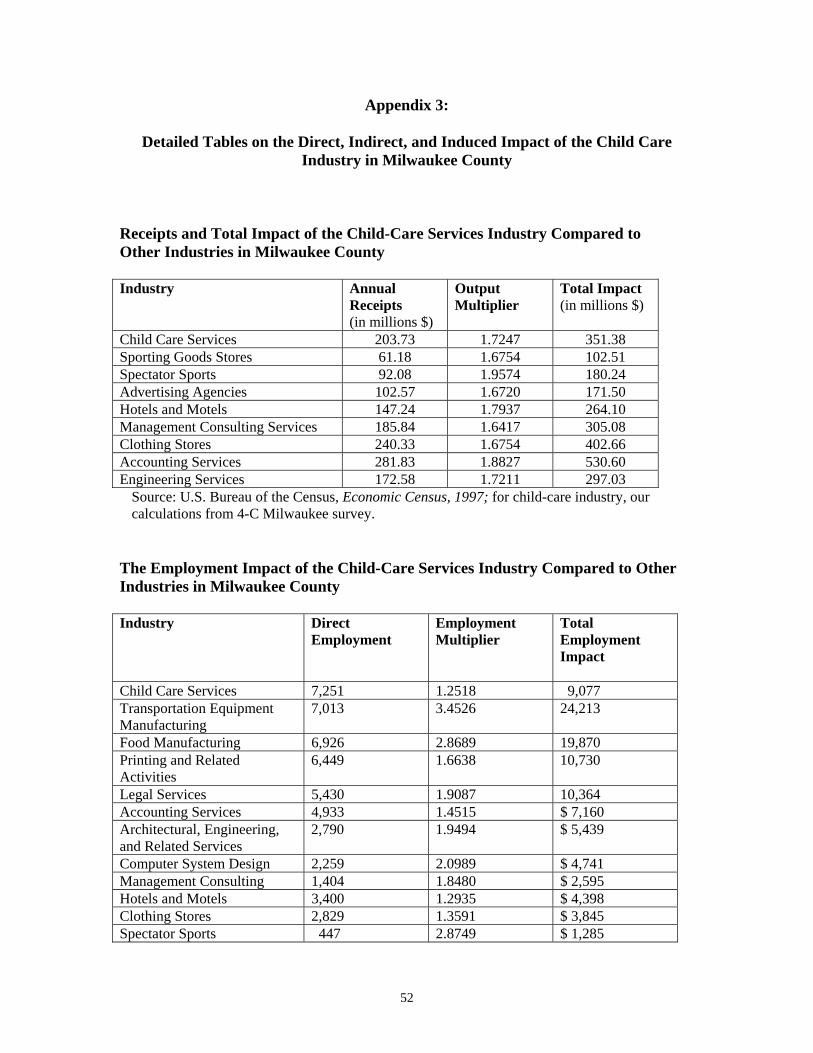
52
Appendix 3:
Detailed Tables on the Direct, Indirect, and Induced Impact of the Child Care Industry in Milwaukee County
Receipts and Total Impact of the Child-Care Services Industry Compared to Other Industries in Milwaukee County Industry Annual
Receipts (in millions $)
Output Multiplier
Total Impact (in millions $)
Child Care Services 203.73 1.7247 351.38 Sporting Goods Stores 61.18 1.6754 102.51 Spectator Sports 92.08 1.9574 180.24 Advertising Agencies 102.57 1.6720 171.50 Hotels and Motels 147.24 1.7937 264.10 Management Consulting Services 185.84 1.6417 305.08 Clothing Stores 240.33 1.6754 402.66 Accounting Services 281.83 1.8827 530.60 Engineering Services 172.58 1.7211 297.03
Source: U.S. Bureau of the Census, Economic Census, 1997; for child-care industry, our calculations from 4-C Milwaukee survey.
The Employment Impact of the Child-Care Services Industry Compared to Other Industries in Milwaukee County Industry Direct
Employment Employment Multiplier
Total Employment Impact
Child Care Services 7,251 1.2518 9,077 Transportation Equipment Manufacturing
7,013 3.4526 24,213
Food Manufacturing 6,926 2.8689 19,870 Printing and Related Activities
6,449 1.6638 10,730
Legal Services 5,430 1.9087 10,364 Accounting Services 4,933 1.4515 $ 7,160 Architectural, Engineering, and Related Services
2,790 1.9494 $ 5,439
Computer System Design 2,259 2.0989 $ 4,741 Management Consulting 1,404 1.8480 $ 2,595 Hotels and Motels 3,400 1.2935 $ 4,398 Clothing Stores 2,829 1.3591 $ 3,845 Spectator Sports 447 2.8749 $ 1,285

53
References
Bergmann, Barbara A. (1996) Saving Our Children from Poverty: What the United States Can
Learn from France (New York: Russell Sage Foundation). Breton, Pascale (2002) “De «gardiennes» à éducatrices,” La Presse, 19 juin. Breton, Pascale et Gervais, Lisa-Marie (2002) “32 millions pour les travailleuses en garderies,”
La Presse, 20 juin. Bureau of National Affairs (2002) Union Membership and Earnings Data Book: Compilations
from the Current Population Survey (Washington: BNA). Center on Wisconsin Strategy (2002) “The Economics of Child Care: An Overview for Dane
County,” (Madison: COWS). Davenport, Jane and Smith, Corinne (2002) “Last minute daycare deal averts strike,” The
Montreal Gazette, 19 June. Department of Workforce Development (2001) “Office of Child Care Update 2001,” (Madison: DWD). Fitzgerald, Joan (2002) “Caring for Children as a Career,” The American Prospect (Summer), pp.
A28-A31. Jenson, Jane (2002) “Against the Current: Child Care and Family Policy in Quebec,” in Sonya
Michel and Rianne Mahon (eds), Child Care Policy at the Crossroads: Gender and Welfare State Restructuring (London: Routledge), pp. 309-332.
Levine, Marc V. (1995) “Globalization and Wage Polarization in U.S. and Canadian Cities: Does Public Policy Make a Difference?” in Peter Karl Kresl and Gary Gappert, Cities and the Global Economy: Challenges and Opportunities (Beverly Hills: Sage Publications), pp. 89-111.
Levy, Denis Urias and Michel, Sonya (2002) “More Can Be Less: Child Care and Welfare Reform in the United States,” in Sonya Michel and Rianne Mahon (eds), Child Care Policy at the Crossroads: Gender and Welfare State Restructuring (London: Routledge), pp. 239-266.
Milwaukee Journal-Sentinel (2002) “More grandparents provide day care, Census Bureau says,” 22 August.
Mishel, Lawrence; Bernstein, Jared; and Schmitt, John (2001) The State of Working America, 2000-2001 (Ithaca: Cornell University Press).
Molotch, Harvey (1991) “Urban deals in comparative perspective,” in John R. Logan and Todd Swanstrom (eds) Beyond the City Limits (Philadelphia: Temple University Press), pp. 3-24.
National Economic Development and Law Center (2001) A Methodology Guide: Creating an Economic Impact Report for the Child Care Industry (Oakland: NEDLC).
RAND Institute (1998) Investing in Our Children: What We Know and Don’t Know About the Costs and Benefits of Early Childhood Intervention (Santa Monica: RAND Institute).
United States Bureau of the Census (1990) Economic and Social Characteristics of the Population: Milwaukee County (Washington: Government Printing Office).
United States Bureau of the Census (2000) Economic and Social Characteristics of the Population: Milwaukee County (Washington: Government Printing Office).
Wisconsin Child Care Research Partnership (2001), Losing Ground or Keeping Up? Report to the Wisconsin Early Childhood Association.
Wolfe, Barbara and Vandell, Deborah Love (2002) “Welfare Reform Depends on Good Child Care,” The American Prospect (Summer), pp. A19-A21.