the economic impact of solar lighting - eth z · the economic impact of solar lighting: ......
TRANSCRIPT

The Economic Impact of Solar Lighting:
Results from a randomised field experiment in rural Kenya
Adina Rom, Isabel Günther, Kat Harrison
February 2017
©P
atri
ck B
entl
ey/S
ola
rAid
2
Executive Summary
Sustainable Development Goal 7 is that by 2030, there will be universal access to affordable,
reliable and modern energy services for all. In many countries of sub-Saharan Africa most of
the population remains unelectrified. Electrification has been linked to a range of development
improvements such as higher income, increased female employment, and better health and
educational outcomes. However, extending the grid to poor and remote rural areas and
providing access to unelectrified households is expensive and poses a number of political,
administrative, and technical challenges. Hence, 68% of all households and 83% of rural
households in sub-Saharan Africa remain without access to electricity.
Prices for solar lights have fallen by around 80% in the past 6 years and are expected to drop
even further. Therefore, solar lights might provide a clean, cost-effective environmentally-
friendly solution to provide poor households with access to lighting. Despite growing interest,
there is still little rigorous evidence regarding the demand for modern energy products and
services by the poor, and the impact of solar lights on households’ well-being in particular. The
goal of this randomised controlled trial (RCT) conducted in rural Kenya with 1,400 households
was to contribute to this research gap by providing insights on the demand for small-scale solar
products, how the products are used, how usage impacts households’ energy expenditure
and household members’ time use. The research included novel sensor technology in addition
to conventional survey data, and looks at the impact of solar lights sold at market price, at
subsidised prices, and given out free.
SolarAid has done primary research in this area and commissioned this study in 2013 to gather
independent, rigorous evidence – Google funded the research, which is now managed at
Acumen.
The results show that most households who purchase or receive a solar light use it daily for
several hours and often tend to treat the solar light as a substitute for a kerosene lamp. This
allows households to reduce monthly kerosene costs and to save between 1% and 2.5% of their
total cash expenditures. However, about a tenth of the lights are broken after 7 months,
indicating that quality improvements to the solar lights are still necessary. Demand for solar
lights is highly price elastic with 29% uptake at market price (9 USD) and 69% when offered at a
discounted price (4 USD). There is almost no difference in usage between solar lights provided
free and solar lights sold to households, which suggests that full subsidies would increase solar
light adoption without altering solar light usage.1 There is some evidence that access to solar
lights increases children’s light use but they do not increase adult’s time use. There is no
significant increase in children’s study time nor shifts to more productive time use for adults.
These results suggest that the effects of solar lights probably are welfare improving for most
households; however, unsurprisingly, they do not seem to be transformational in the sense that
they do not lift people out of poverty. Nevertheless, governments, NGOs and other
organisations may still consider accelerating the adoption of solar lights through tax cuts,
subsidies, creating more favourable business environments, or other means, for some of the
following reasons: First, households with access to solar lights reduce kerosene consumption,
which can be a policy goal in itself. Second, if the policy goal is to provide all citizens with a
minimum level of access to modern forms of energy, solar lights are probably the least
expensive way to do so.
We hope that the results outlined here as well as the work on education, health and
environmental impacts, which we are currently working on, will contribute to the body of
evidence that is necessary for governments, impact investors, and policy makers to make
informed decisions about the allocation of scarce resources in the energy space.
This report offers a summary of the key findings of the research, but a full policy report is
available with more information on existing evidence, statistical significance, additional
analysis, research design, and limitations of the research.
1 Though, there are questions on market sustainability by adopting such a policy.
3
Contents
Executive Summary ................................................................................................................. 2
Introduction .............................................................................................................................. 4
Method ...................................................................................................................................... 6
Results ........................................................................................................................................ 8
Household characteristics and baseline energy spending ........................................... 8
Take-up of solar lights ........................................................................................................ 11
Use of solar lights ................................................................................................................ 12
Impact of solar lights on kerosene use ............................................................................ 13
Time impact of solar lights ................................................................................................. 14
Financial impact of solar lights ......................................................................................... 16
Implications of results ............................................................................................................. 18

4
Introduction
Access to electricity is a critical part of modern life and is considered both an outcome and a
driver of development. A number of studies show that electrification is linked to a range of
development improvements, such as higher income, employment, and better health and
educational outcomes. However, extending the grid to poor and remote rural areas and
providing access to unelectrified households is expensive and poses a number of political,
administrative, and technical challenges. Hence, 68% of all households and 83% of rural
households in sub-Saharan Africa remain without access to electricity. In rural Kenya, around
95% of the population does not have access to electricity. Unelectrified households typically
rely on kerosene lanterns for lighting, which have high operational costs, give off low-quality
light, and could lead to adverse health and environmental effects.
Prices for solar lights have fallen by around 80% in the past 6 years and are expected to drop
even further. Therefore, solar lights may provide a clean and cost-effective solution to provide
poor households with access to lighting. There are a wide variety of off-grid solar products,
ranging from large installations powering entire villages to small portable lights, which have
become increasingly widespread in low- and middle-income countries, like Kenya, as a low-
cost means of providing very basic lighting services. Such small portable products are
particularly popular because they are easy to deploy, do not require a large up-front
investment, and only need limited maintenance. Once fully charged, small solar lights provide
light for 3-45 hours depending on the brand, size, and quality of the light. However, these solar
lights only provide minimal access to energy and cannot satisfy energy needs beyond simple
lighting (and in some cases mobile phone charging). There is little empirical evidence
concerning their cost-effectiveness, impact on household welfare, or potential effect on the
environment. Even less is known about what drives the adoption of this technology or what
impact further price reductions might have on demand.
This report shares the findings from a randomised control trial study that intended to help close
this knowledge gap by studying current demand for solar lights and some of the constraints,
which might limit their adoption, as well as the impact of owning a light on the lives of rural
households.
SolarAid, and its social enterprise SunnyMoney, is one example of an organisation that has seen
promise in solar lights and developed a business model to distribute these lights to rural
households. SolarAid has also been very committed to research, conducting its own on the
ground, and commissioning this study to better understand their impact on poverty reduction.
Its social enterprise, SunnyMoney, is one of the largest distributors of solar lighting products in
East Africa, having sold over 1.87 million solar units to date, and more than 513,000 in Kenya
alone. The study was funded by Google, alongside a pilot study conducted by researchers at
UC Berkeley to look at the impact of lighting on indoor air pollution and health. The study has
been managed by impact investor Acumen since January 2016, when the SolarAid Research
and Impact department moved there.
Existing evidence
The existing evidence on the impact of solar lights on household light use, expenditure,
wellbeing, and productivity is not conclusive. Moreover, only a few studies have been
conducted on these effects; most have small sample sizes and, at times, conflicting results. In
addition, most previous studies distributed free lights, which does not allow for an estimation of
willingness to pay or assessment of whether effects are different for people who purchase a
solar light and people who receive a free one. Finally, previous work has solely relied on self-
reported data to estimate solar and kerosene light usage, a method, which can be both
imprecise and biased. This randomised control trial (RCT) study:
had a large sample size of around 1,400 households, which makes it possible to detect
smaller effect sizes than studies with smaller samples,
offered solar lights at different prices (including SunnyMoney’s market price) to understand
the price elasticity of demand for solar lights,
used sensor data in addition to survey data to obtain more accurate and objective data
on light use,
collected detailed time use data for both school children and one of their guardians,

5
provided solar lights free to a randomly selected sub-sample and solar lights at price to
another sub-sample, in order to study whether people who paid for a solar light use them
differently than people who received one for free.
This report
The first part of this report focuses on the uptake of solar lights looking at the price elasticity of
demand, or in other words the change in demand for solar lights as prices change.
The second part looks at the use of solar lights, focusing on who uses the solar lights in the
household and for what purpose, whether access to a solar light changes households’ light
consumption, and whether time use in terms of productive activities change with access to
lighting.
The third part discusses the economic impact of solar lights, exploring the financial returns to
an investment in a solar light; does average household spending on kerosene, candles, or
batteries change with access to solar lights, and by how much?
The report shares summary findings on both the use and impact of solar lights when they are
distributed free and on use and impact when purchased.

6
Method
After in-depth interviews with a number of solar light users and non-users and a pilot to test
survey tools and acceptability of sensor technology, a randomised control trial (RCT) was
conducted between July 2015 and March 2016 in 20 primary schools in Nambale and Teso
South sub-counties of Busia county, Kenya. Households with at least one student in Standards
(classes) 5-7 were randomly assigned to one of the following groups:
a group with no intervention (control group),
a group who received a free solar light (free solar light group),
a group who had the opportunity to buy a solar light (voucher group or offer to buy group).
Those households which were given the opportunity to buy a solar light (voucher group) were
randomly assigned a price of $4, $7 (subsidised prices), or $9 (the market price at the time of
the study).
Research design
1,410 students were surveyed before the intervention in July/August 2015 (baseline) and seven
months after in February/March 2016 (endline). One of the students’ guardians (mother or
father), was interviewed at both baseline and endline too.
In addition to survey data, sensors were used to measure light use. A sub-sample (187) of the
solar lamps that were distributed free or purchased were equipped with sensors to track when
the solar lights were used and for how long.
More information on the methods used, the sample selection process, and how data was
collected is available in the full report.
The study focused on the impact of small, portable solar lights, providing 30-100 lumens of light
for 4-36 hours on each charge, depending on the model and the brightness setting used, and
costing around $7.50-35. The study used Greenlight Planet Sun King Ecos and Sun King Mobiles,
as sold through SunnyMoney. For comparison, a simple tin kerosene lamp provides around 7.8
lumens and a kerosene lantern provides 45 lumens.
Control group
400 households
(20 households per school)
no intervention
Free light group
400 households
(20 households per school)
50% given solar light free
50% given solar light with
mobile phone charging free
20 schools in Nambale and Teso South
Voucher group
601 households
(~30 households per school)
209 offered solar light at 400KES/$4
195 offered solar light at 700KES/$7
197 offered solar light at 900KES/$9
All public primary schools in Teso South and Nambale of Busia County, Kenya
randomly selected
randomly selected
7
Limitations of research
The design of the study allows us to accurately estimate take-up rates and impacts of solar
lights; it is, however, also subject to a number of limitations;
- the study was conducted in two sub-counties in Western Kenya and results are thus not
necessarily generalisable to other contexts without making further assumptions,
- while the sample size of 1,401 households is larger than most previous studies, it is still not
large enough to detect very small impacts of solar lights,
- spillover effects may occur if household members from the control group start to visit
household members who received or purchased a light in order to enjoy their better
lighting. Spillover effects could lead to an underestimation of the overall effects, and
lastly,
- as with all survey-based studies, we face some risk of social desirability bias which can
lead to biased results if respondents who received access to a solar light feel for some
reason more obliged to answer in a certain than those who did not receive access to
a solar light.

8
Results
Household characteristics and baseline energy spending
Firstly, profile information on the households in the research, on average:
- 42% of the households are likely to live below the national poverty line, and 31% are
likely to be living on less than $1.90 per day per person (PPP adjusted)
- households have 6.7 members with 4.3 children under the age of 18
- women head 30% of households
- 99% of households conduct agricultural activities and around a third own at least one
business, most selling fish or other food items, the chart below shows main income
source
- only 20% of households have at least one member who was employed in the previous
year (formally or informally)
- household spend ~$70 in cash per month ($10 per capita per month, or US $0.30 per
capita per day in current US $ and not PPP adjusted).
- 91% of households owned at least one mobile phone, 41% have more than one mobile
phone.
- 86% of households homes had earth floors and 77% had iron sheet roofs
- the household head attended school for 6.3 years
- 37% used protected springs for drinking water sources, 25% used boreholes, and 19% still
used rivers, streams, or ponds
Household’s main income source
Household energy
Access to modern energy sources are limited with just 9% of households having access to some
form of electricity: 3% of households were connected to the grid, 3% had access to a solar
home system, 2% had access to a car battery (which provided energy for the house), and 0.3%
had access to a generator. Every household which uses grid electricity also uses at least one
other source of lighting — possibly a reaction to the frequent blackouts in the study region,
and/or possibly the desire for portability of lighting outside the home.
98% of the households in the study used open fire for cooking, 1% used charcoal stoves.
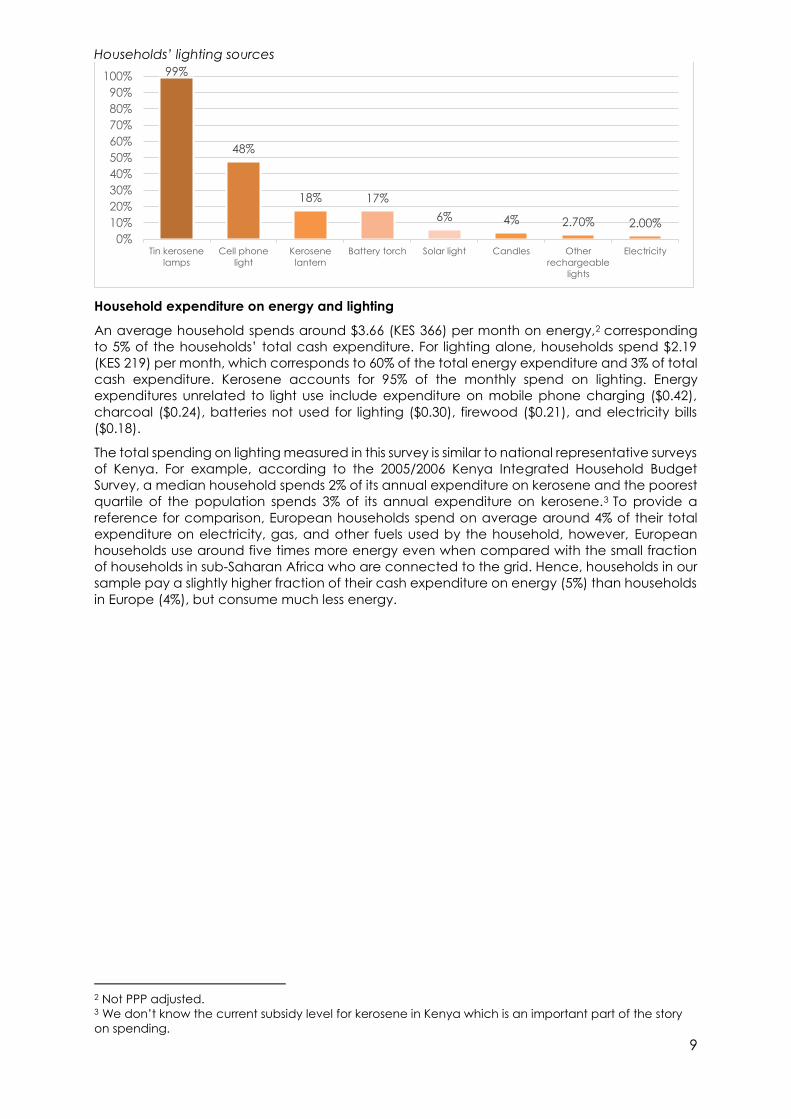
Household lighting sources
The chart below shows lighting sources used within the last month. When asked what lighting
source respondents predominantly relied upon, the most frequent answers were: tin lamps
(88%), larger kerosene lanterns (5%), solar lights (4%) and electricity powered lighting (1%). 76%
of households used more than one type of lighting source in their home. On average, a
household owns 2.2 tin lamps.
68%
15%
11%
4%
2%
Agriculture
Casual labour
Business
Formal wage
Remittances & transfers
9
Households’ lighting sources
Household expenditure on energy and lighting
An average household spends around $3.66 (KES 366) per month on energy,2 corresponding
to 5% of the households’ total cash expenditure. For lighting alone, households spend $2.19
(KES 219) per month, which corresponds to 60% of the total energy expenditure and 3% of total
cash expenditure. Kerosene accounts for 95% of the monthly spend on lighting. Energy
expenditures unrelated to light use include expenditure on mobile phone charging ($0.42),
charcoal ($0.24), batteries not used for lighting ($0.30), firewood ($0.21), and electricity bills
($0.18).
The total spending on lighting measured in this survey is similar to national representative surveys
of Kenya. For example, according to the 2005/2006 Kenya Integrated Household Budget
Survey, a median household spends 2% of its annual expenditure on kerosene and the poorest
quartile of the population spends 3% of its annual expenditure on kerosene.3 To provide a
reference for comparison, European households spend on average around 4% of their total
expenditure on electricity, gas, and other fuels used by the household, however, European
households use around five times more energy even when compared with the small fraction
of households in sub-Saharan Africa who are connected to the grid. Hence, households in our
sample pay a slightly higher fraction of their cash expenditure on energy (5%) than households
in Europe (4%), but consume much less energy.
2 Not PPP adjusted. 3 We don’t know the current subsidy level for kerosene in Kenya which is an important part of the story
on spending.
99%
48%
18% 17%
6% 4% 2.70% 2.00%
0%
10%
20%
30%
40%
50%
60%
70%
80%
90%
100%
Tin kerosene
lamps
Cell phone
light
Kerosene
lantern
Battery torch Solar light Candles Other
rechargeable
lights
Electricity

10
Average monthly cash expenditure by households
Average monthly cash expenditure by poor households
An average household in the poorest quintile4 spends around $2.05 (KES 205) per month on
energy (in comparison to $3.66 (KES 366) for the average household) corresponding to 10% of
its total cash expenditure ($20.59). This amount is almost double the share of cash expenditure
paid by the average household in our sample, which spends 5% of total cash expenditure on
energy. For lighting alone, the poorest 20% of households spend $1.60 (in comparison to US
$2.16 for the average household), which corresponds to 77% of the total energy expenditure
and 8% of total cash expenditure (in comparison with 3% for the average household).
Even if the absolute spending on energy and lighting is lower for poorer households, it is a much
larger fraction of their overall spending, which amounts to only $20.70 per household per month
4 This consists of the 20% of households who have the lowest total expenditures at baseline.
45.5%
18.5%
6.5%
6.1%
5.3%
2.9%
0.2%
2.1% 3.3%
3.2%
2.5% 2.1%1.8%
Food
Education
Health
Funerals/Weddings/Church
Farm inputs
Kerosene
Lighting other than Kerosene
Energy Other
Other
Travel
Cloths/Hair
Communication
House repairs
58%
10%
6%
5%
2%
7%
0%2%
6%
1%
1%2% 0%
Food
Education
Health
Funerals/Weddings/Church
Farm inputs
Kerosene
Lighting other than Kerosene
Energy Other
Other
Travel
Cloths/Hair
Communication
House repairs
11
(compared to $70 per household per month of the average household). This disparity suggests
that poor households view energy (as well as food expenditures) as a necessity: households
with lower income reduce spending on other goods more than their spending on energy (and
food). In other words, demand for energy is less income elastic than it is for other goods.
Take-up of solar lights
Availability of solar lights
Lack of information about, exposure to, and availability of high-quality and low-cost solar
products has been mentioned in previous studies as a potential constraint to the adoption of
solar lights. This study collected information about the availability and cost of solar lights to test
this hypothesis. The majority of adults in the research (89%) mentioned that they had seen a
solar light before; most commonly they reported encountering a solar light for the first time at
a relative’s or neighbour’s house.
The prices of solar lights sold by vendors other than SunnyMoney tended to be above the price
of SunnyMoney’s cheapest light ($9). Of the respondents who already owned a solar light at
baseline (5% of the sample), 90% paid $10 (1,000 KES) or more for it. The average price paid
was around $33. Of those households who did not own a solar light at baseline, 94% said that
the reason they had not purchased one was that they could not afford one. Only 1% said the
reason was that the product was not available for purchase.
These results show that most respondents had seen solar lights before (89%), many knew people
who owned a solar light already (86%), and 53% had seen one for sale. One could conclude
from this information that a lack of exposure might not be the most important constraint to
adoption. We do not, however, have information about the quality of the products that people
encountered. According to Bloomberg, there are a large number of very low-quality products
on the market, and it is not always easy for consumers to assess the quality of a product. Hence,
the exposure to low-quality products could actually lower the chances of adopting any solar
light (of low or high quality). In addition, easy access to solar lights might still be an issue: while
most of the respondents were exposed to solar lights before (i.e. they saw them before), only
39% of respondents said they could be purchased from a nearby store (own village and closest
market centre).
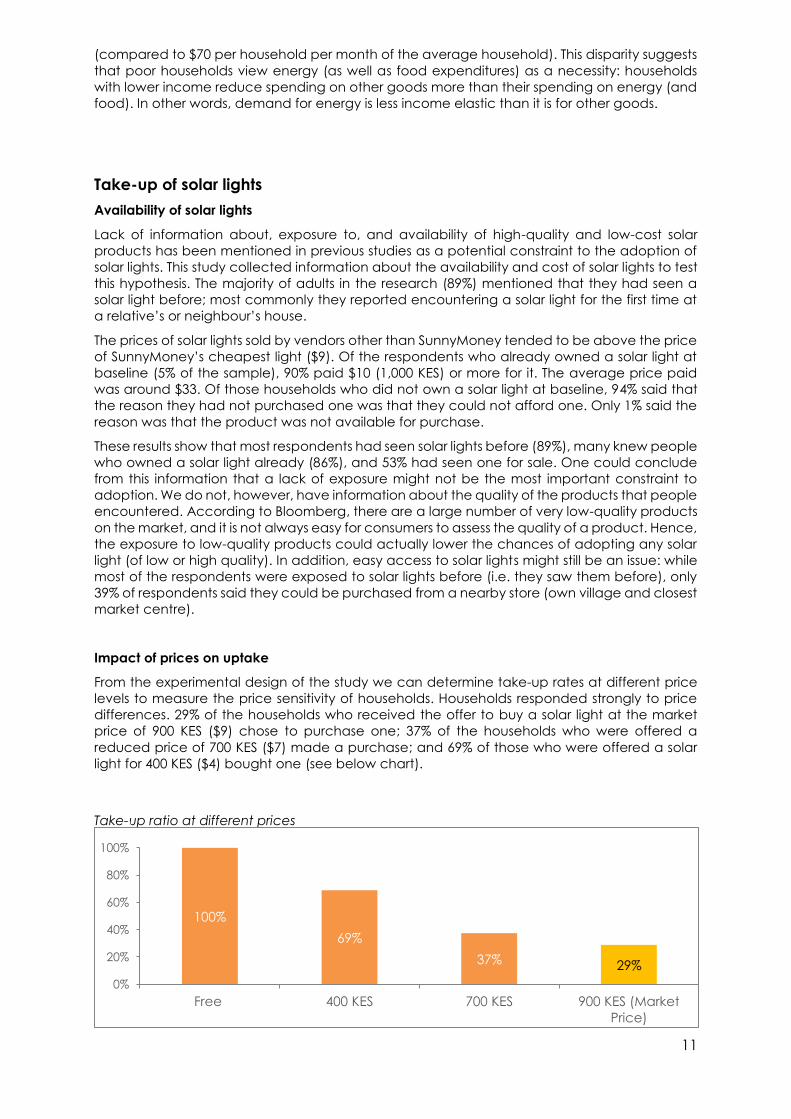
Impact of prices on uptake
From the experimental design of the study we can determine take-up rates at different price
levels to measure the price sensitivity of households. Households responded strongly to price
differences. 29% of the households who received the offer to buy a solar light at the market
price of 900 KES ($9) chose to purchase one; 37% of the households who were offered a
reduced price of 700 KES ($7) made a purchase; and 69% of those who were offered a solar
light for 400 KES ($4) bought one (see below chart).
Take-up ratio at different prices
100%
69%
37% 29%
0%
20%
40%
60%
80%
100%
Free 400 KES 700 KES 900 KES (Market
Price)

12
Use of solar lights
Establishing the extent to which solar lights are used and how they are used is an important first
step to understanding the impact of solar lights on household welfare. This section of the report
shares analysis on whether households who have solar lights use them, who uses them, and for
what purposes. This includes self-reported data from interviews, and data from 187 sensors,
which measure the use of solar lights. Sensor data is used to study how frequently the solar lights
are being used, for how long they are typically being used, and at what time of the day.
Solar lights users and usage
When respondents in the free solar light group were asked which household members had
used the solar light the previous evening, 80% said children, 54% said adults, and 18% of
households reported that no one had used it (this includes the 12% of households which no
longer had a functioning light). In 52% of the households, both adults and children used the
solar lights, in 28% only children used it. Answers from respondents who purchased a solar light
were not statistically different from households who had received a solar light free.
Children reported having used the solar light primarily for homework, only 4% mentioned other
activities, such as talking (2%), cooking (1%), and reading (1%). Adults reported having used
the light for a much more diverse set of main activities; eating (28%), talking (24%), and cooking
(19%).
Frequency and length of use
According to sensor data, 38% of the households use the solar light every single day and an
additional 45% of households use them 9 out of 10 days. Overall, average use according to the
sensor data is 6.2 out of 7 days (self-reported data is very similar at 6.7 days out of 7).
Most people use the lights between 2 and 4 times per day and, on average, 4.3 times per day.5
The solar lights are switched on most often in the evening hours between 18:00 and 19:00,
followed by the morning hours between 05:00 and 06:00. 50% of the time someone turns on a
solar light, they are only used for 10 minutes or less. Anecdotal evidence suggests that people
use the solar lights to quickly look for something in the dark or that people want to test if the
solar light is charged.
Average duration of solar light use by time of day
Households use the solar light for an average of 3.5 hours per day. The average rises to 4.0 hours
per day if only days with any solar light use at all are considered. The chart above shows the
distribution of daily solar light use; in the evenings the lights are used for more than an hour,
5 This figure only includes “on switches” if the lamp was on for more than one minute.
30 27 27 2834
25
1510 11 9 10 11 9 9 10 10 12
22
89 86
56
47
36 36
0
20
40
60
80
100
1 2 3 4 5 6 7 8 9 10 11 12 13 14 15 16 17 18 19 20 21 22 23 24
Min
ute
s o
f so
lar
ligh
t u
se
Hour of the day
13
whereas in the morning they are used for about half an hour, and during the day for about 10
minutes, on average.
The sensor data can also help us understand how usage evolves over time. It could be the
case, for example, that excitement over the novelty of the product induces people to use solar
lights in the early stages of the study; at the same time, it is plausible that usage increases over
time as household members become comfortable using the product. Looking at the number
of hours per day that solar lights are used across different months, there is a very slight decrease
in use over time. During the last month of the study the solar lights were still being used for 3.5
hours per day on average, only 0.2 hours (12 minutes) less than in the first month. Note that this
analysis does not include households that were no longer using their light at the end of the
study (around 10%).
Impact of solar lights on kerosene use
To establish possible environmental, health, and economic impacts of solar lights it is essential
to understand whether solar lights complement or replace existing light sources, which are
typically kerosene-based products. If kerosene lights are replaced we expect that health and
environment improves and that savings occur – quality of lighting improves. If solar lights
complement kerosene lights – quantity of lightning increases - we do not expect all of the
former effects but would expect to find larger impacts on time use (as hours of lighting increase
considerably). This section shares analysis of the impact of receiving or buying a solar light on
the type and number of non-solar lighting sources used, and the impact of access to solar
lighting on the total number of lighting hours per day for adults and children.
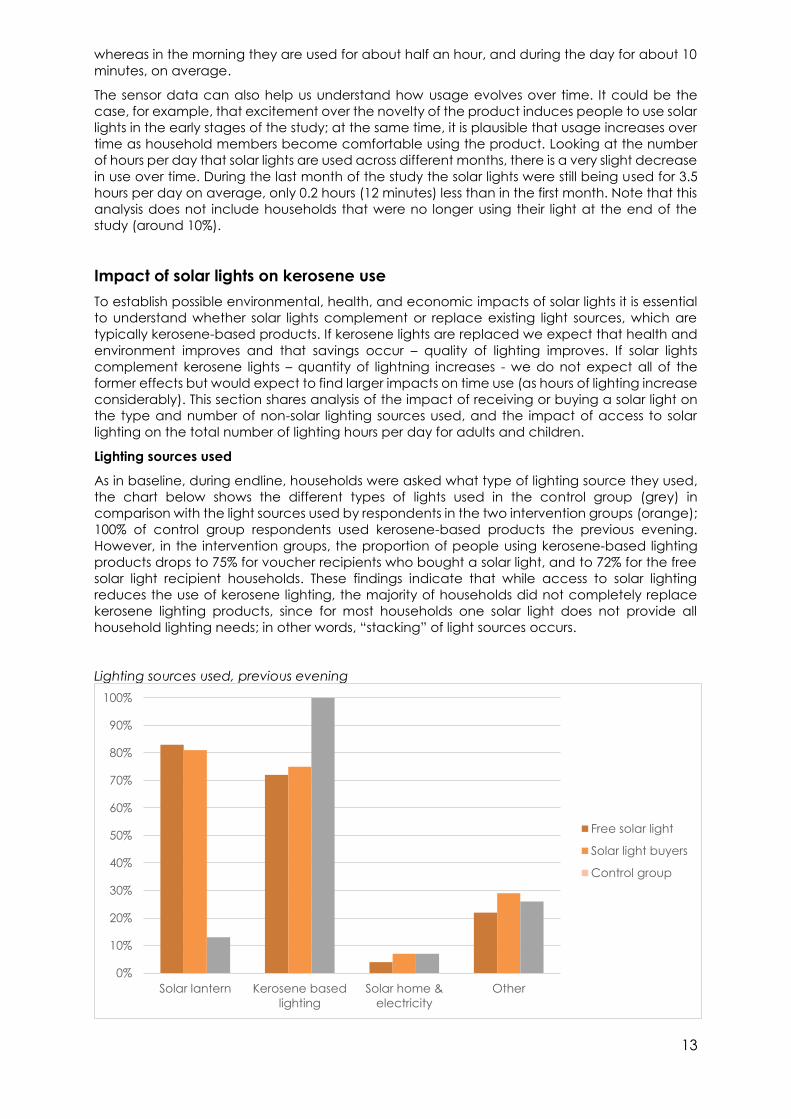
Lighting sources used
As in baseline, during endline, households were asked what type of lighting source they used,
the chart below shows the different types of lights used in the control group (grey) in
comparison with the light sources used by respondents in the two intervention groups (orange);
100% of control group respondents used kerosene-based products the previous evening.
However, in the intervention groups, the proportion of people using kerosene-based lighting
products drops to 75% for voucher recipients who bought a solar light, and to 72% for the free
solar light recipient households. These findings indicate that while access to solar lighting
reduces the use of kerosene lighting, the majority of households did not completely replace
kerosene lighting products, since for most households one solar light does not provide all
household lighting needs; in other words, “stacking” of light sources occurs.
Lighting sources used, previous evening
0%
10%
20%
30%
40%
50%
60%
70%
80%
90%
100%
Solar lantern Kerosene based
lighting
Solar home &
electricity
Other
Free solar light
Solar light buyers
Control group
14
Note: the difference between the buyers group and the control group cannot be interpreted as
causal due to possible selection bias.
Solar light adoption leads to lower usage of kerosene based products. The average number of
tin lamps used by the control group households is 2.2, households who received a free solar
light use 0.9 fewer tin lamps, and those who bought a light use 0.8 fewer tin lamps. Hence, we
see a replacement rate of 1:0.9 and 1:0.8 respectively (one solar light replaces 0.9/0.8 tin
lamps).6 Buyers of solar lights and households who received a free light exhibit approximately
the same replacement ratio.
Students who received a free solar light used any lighting source for 3.6 hours per day, those in
the control group used any type of lighting for 3.3 hours per day. Hence, having access to a
solar light increases lighting hours among students by about 10% per day, or by about 100 hours
per year.
For adults, there is neither a statistically significant difference in lightning hours per day between
those who received a free light and the control group nor between the buyers and the control
group.
In summary, solar lights are a substitute for rather than a complement to kerosene-based
lighting for adults, as their lighting hours do not increase with access to a solar light. For children,
solar lights seem to mostly substitute for kerosene lighting, but they also act as a complement
to some extent, given that students reported a slight increase in light usage (about 20-30
minutes from a baseline of 3 hours and 20 minutes). Light use changes for households which
purchase a solar light and those which receive one free are very similar.
Time impact of solar lights
When higher quantity or higher quality lighting becomes available, households may increase
the number of hours they are awake as their time becomes more productive or enjoyable.
Moreover, households might shift some of the activities they used to do during the day to the
evening, and/or change the number of hours they devote to different types of activities. We
collected detailed time use data for adults and children in the sample and which lighting
source (if any) was used for the activity.
We find considerable differences in time use between male and female adults. Men tend to
be more engaged in income-related activities (agriculture and off-farm work) than women,
but women work much more in total (largely involving household chores). Total working hours
are 9.2 hours for women and 7.5 hours for men. Men enjoy double the amount of recreational
time of women (see chart below).
6 This estimation is not statistically different from a 1:1 replacement.

15
Men’s and women’s time use
There is not any significant impact of solar lights on the time women or men get up in the
morning or go to sleep in the evening. Looking at how women and men in each of the
treatment groups use the 24 hours of the day (see chart below), there are no obvious changes
in working hours (or other activities) for women. However, men with access to solar lightning
tend to increase their recreational time slightly and decrease their working time (including
household chores).
Impact on men’s and women’s time use
In contrast to adults, where women seem to spend their time differently than men, we only find
small differences in the daily activities of boys and girls. Boys and girls are both in class for
around 4-5 hours and do homework and personal studies for around 2.5 hours per day. Girls,
however, get slightly less sleep than boys (0.6 hours) and they spend one hour more on
household chores.
No differences between the control group and the treatment groups in terms of the average
time of day children get up in the morning and go to sleep in the evening were found. For
results for adults, we only observe changes in men’s time allocation, it seems that access to a
solar light has a rather an impact on boys’ time use than on girls’ time use. The most significant
4.1
5.1
1.1
6.8
0.5
1.1
5.8
1.72.2
6.9
0.5
1.4
0
1
2
3
4
5
6
7
8
Nu
mb
er
of
ho
urs
pe
r d
ay
Women
Men
0.00
5.00
10.00
15.00
20.00
Control Offer to Buy Free Solar
Light
Control Offer to Buy Free Solar
Light
Women Men
Other
Religous &
Volunteer
Travel
Sleep/Rest
Recreation
HH Chores
Working Hours

16
effect is a reduction in sleeping hours for both boys and girls — an unintended consequence
of the solar light.
Impact on boy’s and girls’ time use
Children were also asked specifically about homework completion. 80% of the time, children
complete their homework after sunset. Children in households which received a free light are
14% more likely to complete homework after dark than the control group.
Financial impact of solar lights
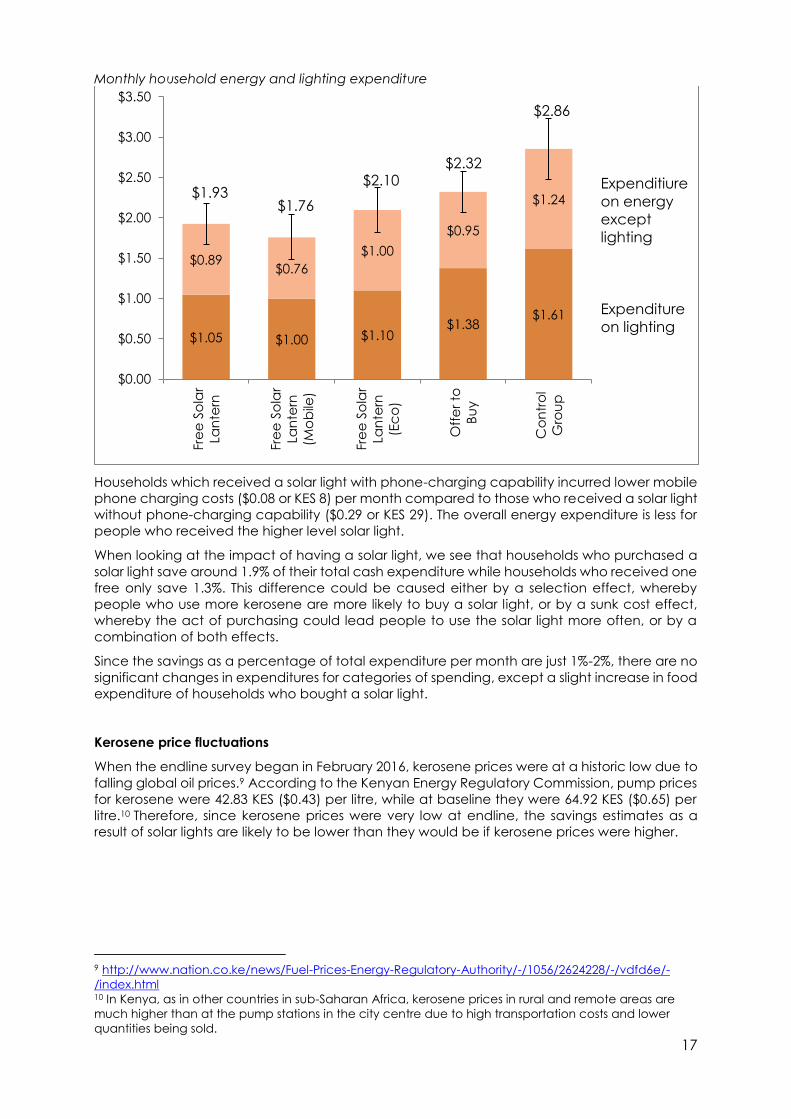
Impact on monthly energy expenditures
During endline data collection, an average household in the control group spent $2.86 (KES
286) per month on energy, corresponding to 3% of total expenditure. Energy spending at
endline was lower than in the beginning of the study due to lower kerosene prices; total
expenditure at endline was higher than at baseline due to school fees, which are due early in
the year. In the control group, lighting alone accounts for $1.61 (KES 161), or 57% of energy
expenditure – and almost all of this (91%) is spent on kerosene.7
Solar lights lead to a reduction of $0.93 spend on energy per month: these savings prove to be
a large share of energy expenditure (around 40%-60% for those with working solar lights), which
is expected given that lighting is a large fraction of energy expenditure. These savings are,
however, a rather small percentage (1-2%) of total cash expenditure. This finding is in line with
the fact that energy accounts for only 3.3%-5.1% of total cash expenditure.8
7 These numbers are slightly different from what is described in Section 3.1, probably due to lower
kerosene prices during endline data collection. 8 During baseline it was at 5.1% and during endline 3.3%, due to lower kerosene prices and higher overall
expenditure (because of schooling fees) at endline.
0.00
5.00
10.00
15.00
20.00
Control Offer to
Buy
Free Solar
Light
Control Offer to
Buy
Free Solar
Light
Girls Boys
Other
Travel
HH Chores
Recreation
Sleep
Study
Hours in School
17
Monthly household energy and lighting expenditure
Households which received a solar light with phone-charging capability incurred lower mobile
phone charging costs ($0.08 or KES 8) per month compared to those who received a solar light
without phone-charging capability ($0.29 or KES 29). The overall energy expenditure is less for
people who received the higher level solar light.
When looking at the impact of having a solar light, we see that households who purchased a
solar light save around 1.9% of their total cash expenditure while households who received one
free only save 1.3%. This difference could be caused either by a selection effect, whereby
people who use more kerosene are more likely to buy a solar light, or by a sunk cost effect,
whereby the act of purchasing could lead people to use the solar light more often, or by a
combination of both effects.
Since the savings as a percentage of total expenditure per month are just 1%-2%, there are no
significant changes in expenditures for categories of spending, except a slight increase in food
expenditure of households who bought a solar light.
Kerosene price fluctuations
When the endline survey began in February 2016, kerosene prices were at a historic low due to
falling global oil prices.9 According to the Kenyan Energy Regulatory Commission, pump prices
for kerosene were 42.83 KES ($0.43) per litre, while at baseline they were 64.92 KES ($0.65) per
litre.10 Therefore, since kerosene prices were very low at endline, the savings estimates as a
result of solar lights are likely to be lower than they would be if kerosene prices were higher.
9 http://www.nation.co.ke/news/Fuel-Prices-Energy-Regulatory-Authority/-/1056/2624228/-/vdfd6e/-
/index.html 10 In Kenya, as in other countries in sub-Saharan Africa, kerosene prices in rural and remote areas are
much higher than at the pump stations in the city centre due to high transportation costs and lower
quantities being sold.
$1.05 $1.00 $1.10$1.38
$1.61
$0.89$0.76
$1.00
$0.95
$1.24
$0.00
$0.50
$1.00
$1.50
$2.00
$2.50
$3.00
$3.50
Fre
e S
ola
r
Lan
tern
Fre
e S
ola
r
Lan
tern
(Mo
bile
)
Fre
e S
ola
r
Lan
tern
(Ec
o)
Off
er
to
Bu
y
Co
ntr
ol
Gro
up
$1.93
$2.32
Expenditiure
on energy
except
lighting
Expenditure
on lighting
$2.86
$1.76
$2.10
18
Implications of results
These results suggest that solar lights are probably a worthwhile investment for most households;
however, unsurprisingly, they are not transformational in the sense that they do not lift people
out of poverty. Nevertheless, governments, NGOs and other organisations may still consider
accelerating the adoption of solar lights through tax cuts, subsidies, creating more favourable
business environments, or other means for the following reasons:
First, as has been shown in this study, solar lights reduce kerosene lighting use of households by
about half. Burning kerosene emits fine particulate matter, which may have adverse health
and environmental effects. Moreover, these are adverse effects that are not immediately
visible to the consumer but manifest themselves in the long run, while the costs have to be
covered immediately (and by the consumer). This could lead to an underinvestment into this
technology than what is socially desirably. In future work we will quantify the extent of kerosene
reduction using sensor data and the associated reduction in fine particular matter, as well as
their related health outcomes. In addition, SolarAid/Acumen, in partnership with UC Berkeley,
are conducting research on the impact of kerosene and solar lighting on indoor air pollution
and health effects; this will provide additional insight on this subject.
Second, if the policy goal is to provide all citizens with a minimum level of access to modern
forms of energy, solar lights are probably the least expensive way to do so. However, solar lights
only provide minimal access to energy that does not go beyond lighting and, in some cases,
mobile phone charging capability.
It is hoped that the results outlined here as well as the work on education, health and
environmental impacts contribute to the body of evidence that is necessary for policy makers
to make informed decisions about the allocation of scarce resources in the energy space.
This report offers a summary of the key findings of the research, but a full policy report is
available with more information on existing evidence, statistical significance, and additional
analysis. Additional analysis, academic papers and policy briefs will follow soon.
19
For more information, please reach out to Kat Harrison, Associate Director of Impact,
Acumen on [email protected] or Adina Rom at [email protected]
The full report can be found here:
http://www.dec.ethz.ch/research/solar-lighting.html
©K
at H
arri
son
/So
larA
id