the economic contributions of outdoor recreation...
TRANSCRIPT

i
The Economic Contributions of Outdoor Recreation in Colorado:
A regional and county-level analysis
Colorado Parks & Wildlife Denver, CO
February 24, 2014
PO Box 6435 Fernandina Beach, FL 32035 Tel (904) 277-9765

ii
Executive Summary This study, conducted by Southwick Associates for Colorado Parks and Wildlife, quantifies the economic contribution of outdoor recreation in Colorado and 7 regions within the state1. Outdoor recreation constitutes a substantial part of the Colorado economy. The total economic output associated with outdoor recreation amounts to $34.5 billion dollars, contributing $19.9 billion dollars to the Gross Domestic Product of the state. This economic activity supports over 313,000 jobs in the state, which represents 13.2% of the entire labor force in Colorado and produces $12.4 billion dollars in salaries and wages. In addition, this output contributes $4.9 billion dollars in local, state and federal tax revenue. Table S1. Total Economic Contribution of Outdoor Recreation in Colorado, by Region ($millions)
Northwest North
Central Metro Northeast Southeast South
Central Southwest State
Output $9,284 $8,295 $3,630 $385 $1,053 $4,142 $2,173 $34,514
Salaries & Wages $3,355 $2,940 $1,460 $116 $324 $1,344 $714 $12,431
GDP Contribution $5,432 $4,734 $2,216 $204 $580 $2,282 $1,242 $19,931
State/Local Taxes $697 $582 $259 $34 $97 $341 $182 $2,404
Federal Taxes $718 $619 $295 $25 $70 $258 $148 $2,546
Jobs 91,822 78,521 34,057 4,528 12,705 47,017 24,568 313,404
Figure S1. SCORP Regions
1 Part of the analysis for this study was based on work performed or supported by the Outdoor Industry
Association (OIA). (http://www.outdoorindustry.org/advocacy/recreation/economy.html) This study uses a broader definition of outdoor recreation, and for this reason the results of these two studies should not be directly compared. Rather, these two studies should be used together to gain a better understanding of the economic contributions of outdoor recreation to the Colorado economy.

iii
Table of Contents
Executive Summary ii
1. Introduction 1
2. Data Sources & Methods 1
3. Outdoor Recreation Participation 2
4. Outdoor Recreation Expenditures 3
5. Economic Contributions of Outdoor Recreation 4
6. Economic Contributions of Fishing, Hunting, and Wildlife Watching 6
7. Hunting Economic Contributions by Destination County 7
8. Comparison to Previous Studies 11
References 12
Appendix A Definitions for Economic Contribution 13
Appendix B Methodology for Economic Contribution 15
Appendix C Spending Methodology 17
Appendix D Overall Activities Data Summary 21
Appendix E Non-Motorized Activities Data Summary 23
Appendix F Motorized Activities Data Summary 24
Appendix G Selected Activities Data Summary 25
Appendix H Retail Trade Sales by County 29
Appendix I Estimates of Spending and Days by Activity Group 31

1
1. Introduction This study, conducted by Southwick Associates for Colorado Parks and Wildlife (CPW), was undertaken to quantify the economic contributions of outdoor recreation in Colorado. This investigation was part of a broader CPW effort to characterize outdoor recreation both statewide and regionally for the Colorado Statewide Comprehensive Outdoor Recreation Plan (SCORP, 2013). Recreation in fishing, hunting, and wildlife watching were of particular interest, and the specific contributions of these three activities were also examined. Additionally, the county-level contributions of hunting were estimated for a more detailed view of the economic contributions of hunting in Colorado. Part of the analysis for this study was based on work performed or supported by the Outdoor Industry Association (OIA). In particular, the statewide economic contributions relied on data from a 2012 OIA study (OIA, 2011; OIA 2012).2 Although components of the analysis presented here relied on OIA data, the results of this study differ somewhat from the state-level results of the OIA study for two reasons. First, this study incorporates a wider range of outdoor recreation activities, which leads to larger economic estimates of outdoor recreation. Second, this study relies principally on the SCORP survey data to characterize participation, and these numbers differ from the OIA-based participation numbers as a consequence of using different data sources. For this reason, the results of these two studies should not be directly compared, but rather should be used together to gain a broader understanding of the economic contributions of outdoor recreation to the Colorado economy.
2. Data Sources & Methods Outdoor recreation in this study includes a set of 38 activities corresponding to questions in a CPW survey sent to 7,000 Colorado residents in 2013 as part of the Colorado Statewide Comprehensive Outdoor Recreation Plan (SCORP, 2013). Spending in Colorado was estimated by applying spending profiles to participation numbers for the 38 activities included in the 2013 SCORP survey. These activities were combined into 18 activity groups in order to match participation numbers to available spending data. Statewide spending was then estimated using appropriate data sources for each activity group (Appendix D). In constructing spending profiles for each activity, this study largely relied on spending data from two OIA surveys administered for the purpose of quantifying the economic contributions of outdoor recreation with the U.S. and each of the 50 states (OIA, 2011; OIA, 2012). Because this study incorporated a wider range of activities than the OIA study, additional data sources were incorporated in characterizing spending profiles for a number of activities. The estimation of spending varied by activity as a result. Detailed descriptions of these procedures are included in Appendix C.
2 The Outdoor Recreation Economy (OIA, 2012).
http://www.outdoorindustry.org/advocacy/recreation/economy.html
2
State-level expenditures were allocated to regions using data that specified the proportion of spending activity within each region. Because outdoor recreationists often make equipment purchases in a different region from their trip destination, equipment and trip-related spending were allocated differently by region. Trip-related spending was allocated using the proportion of activity days by region (SCORP, 2013), while equipment spending was allocated based on the proportion of retail trade sales by region (CDOR, 2012). Details are included in Appendix C. The spending estimates were analyzed using standard economic models to quantify economic contributions. The definitions of key economic terms are presented in Appendix A. The IMPLAN economic modeling software was used to estimate economic contributions. Details of the economic contribution methodology are presented in Appendix B.
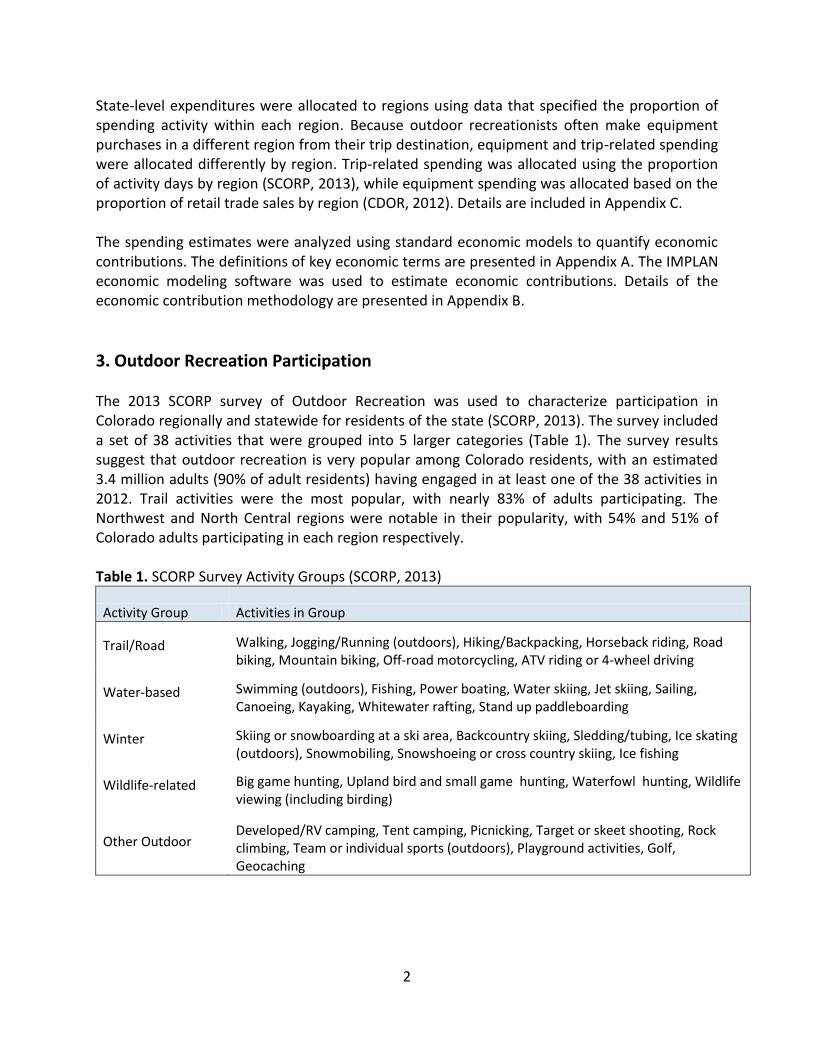
3. Outdoor Recreation Participation The 2013 SCORP survey of Outdoor Recreation was used to characterize participation in Colorado regionally and statewide for residents of the state (SCORP, 2013). The survey included a set of 38 activities that were grouped into 5 larger categories (Table 1). The survey results suggest that outdoor recreation is very popular among Colorado residents, with an estimated 3.4 million adults (90% of adult residents) having engaged in at least one of the 38 activities in 2012. Trail activities were the most popular, with nearly 83% of adults participating. The Northwest and North Central regions were notable in their popularity, with 54% and 51% of Colorado adults participating in each region respectively. Table 1. SCORP Survey Activity Groups (SCORP, 2013)
Activity Group Activities in Group
Trail/Road Walking, Jogging/Running (outdoors), Hiking/Backpacking, Horseback riding, Road biking, Mountain biking, Off-road motorcycling, ATV riding or 4-wheel driving
Water-based Swimming (outdoors), Fishing, Power boating, Water skiing, Jet skiing, Sailing, Canoeing, Kayaking, Whitewater rafting, Stand up paddleboarding
Winter Skiing or snowboarding at a ski area, Backcountry skiing, Sledding/tubing, Ice skating (outdoors), Snowmobiling, Snowshoeing or cross country skiing, Ice fishing
Wildlife-related Big game hunting, Upland bird and small game hunting, Waterfowl hunting, Wildlife viewing (including birding)
Other Outdoor Developed/RV camping, Tent camping, Picnicking, Target or skeet shooting, Rock climbing, Team or individual sports (outdoors), Playground activities, Golf, Geocaching

3
Table 2. SCORP Survey Participants (in thousands) for Activity Groups by Region (SCORP, 2013)
Activity Northwest North
Central Metro Northeast Southeast South
Central Southwest State
Trail/Road 1,513 1,706 1,140 204 285 1,006 570 3,164
Water-based 694 1,037 454 91 173 509 325 2,188
Winter 1,291 694 245 18 25 325 221 1,921
Wildlife-related 433 429 99 175 85 265 197 1,122
Other Outdoor 1,071 1,320 755 182 190 846 432 2,784
Any Outdoor Activity 2,071 1,962 1,352 423 399 1,274 755 3,434
4. Outdoor Recreation Expenditures The popularity of outdoor recreation by both Colorado residents and nonresidents leads to significant consumer spending in the Colorado economy. Outdoor recreationists in Colorado spent over $21 billion dollars on trips and equipment in 2012 (Table 3). The Northwest region included the largest amount of outdoor recreation spending at $6.84 billion, followed by the North Central region at $5.57 billion (Figure 1). Combined, these two regions accounted for over half of all the outdoor recreation spending within Colorado. Also, because retail sales are concentrated in more populous regions, the ratio of equipment to trip-related sales varies widely from one region to the next (Table 3). Partly as a result of these differences, the nature of economic contributions (e.g., industries impacted, types of jobs supported) varies regionally. Table 3. Spending by Region (Trip-Related versus Equipment Spending)
Northwest North
Central Metro Northeast Southeast South
Central Southwest State
Total Spending
Trip-related $6,507 $4,085 $1,250 $301 $747 $2,747 $1,576 $17,212
Equipment $337 $1,490 $1,141 $66 $156 $521 $138 $3,848
Total $6,844 $5,574 $2,391 $367 $902 $3,268 $1,714 $21,060
Percent Spending by Type
Trip-related 95.1% 73.3% 52.3% 81.9% 82.8% 84.1% 92.0% 81.7%
Equipment 4.9% 26.7% 47.7% 18.1% 17.2% 15.9% 8.0% 18.3%
Total 100.0% 100.0% 100.0% 100.0% 100.0% 100.0% 100.0% 100.0%

4
Figure 1. Total Outdoor Recreation Spending by Region (in $millions)
5. Economic Contributions of Outdoor Recreation As a result of the economic multiplier effect, the $21 billion dollars of outdoor recreation expenditures produce additional rounds of economic activity throughout the state’s economy. These include indirect contributions, arising from additional spending within industries, and induced contributions, which result from spending of salaries and wages by employees of these industries. These indirect/induced effects total $13.5 billion, and when combined with direct expenditures, contribute $34.5 billion dollars to the Colorado economy (Table 4). This total output contributes $19.9 billion to U.S. Gross Domestic Product (GDP), which amounts to 7.2% of the total GDP contribution of Colorado (BEA, 2013).3 An important result of outdoor recreation spending is the number of jobs supported in the state. An estimated 313,000 jobs in Colorado are supported by outdoor recreation expenditures, which accounts for 13.2% of all jobs in Colorado, larger than the combined construction and manufacturing labor force in the state (BLS, 2013). These jobs are especially important to the economies of specific locales in the state. In the Northwest region alone nearly 92,000 jobs are supported by the total economic contribution of outdoor recreation, representing one third of the entire adult population in that region (Figure 2).
3 GDP contribution is smaller than total output because GDP only measures the costs of final goods and services
(i.e., any intermediate products are excluded). While total output is a broader measure of economic activity, GDP contribution is included for comparison to the other GDP-based measures.
$6,844
$5,574
$2,391
$367
$902
$3,268
$1,714
Northwest
North Central
Metro
Northeast
Southeast
South Central
Southwest

5
Table 4. Economic Contributions by Region (dollar values in $millions)
Northwest North
Central Metro Northeast Southeast South
Central Southwest State
Direct
Output $6,844 $5,574 $2,391 $367 $902 $3,268 $1,714 $21,060
Salaries & Wages $2,314 $1,832 $844 $93 $232 $948 $520 $7,097
GDP Contribution $3,455 $2,713 $1,209 $153 $405 $1,506 $857 $10,563
State/Local Taxes $504 $396 $172 $28 $79 $265 $144 $1,545
Federal Taxes $478 $375 $169 $19 $50 $177 $106 $1,420
Jobs 64,247 53,330 23,051 3,780 9,881 35,674 18,420 201,442
Indirect/Induced
Output $2,440 $2,721 $1,239 $18 $150 $874 $459 $13,454
Salaries & Wages $1,041 $1,109 $616 $24 $92 $396 $194 $5,334
GDP Contribution $1,977 $2,021 $1,007 $51 $175 $776 $385 $9,368
State/Local Taxes $193 $186 $87 $6 $18 $76 $38 $859
Federal Taxes $239 $244 $126 $6 $20 $82 $42 $1,125
Jobs 27,575 25,191 11,006 748 2,825 11,343 6,148 111,962
Total
Output $9,284 $8,295 $3,630 $385 $1,053 $4,142 $2,173 $34,514
Salaries & Wages $3,355 $2,940 $1,460 $116 $324 $1,344 $714 $12,431
GDP Contribution $5,432 $4,734 $2,216 $204 $580 $2,282 $1,242 $19,931
State/Local Taxes $697 $582 $259 $34 $97 $341 $182 $2,404
Federal Taxes $718 $619 $295 $25 $70 $258 $148 $2,546
Jobs 91,822 78,521 34,057 4,528 12,705 47,017 24,568 313,404
Figure 2. Jobs Supported by Outdoor Recreation in Colorado Regions
91,822
78,521
34,057
4,528
12,705
47,017
24,568
Northwest North Central Metro Northeast Southeast South Central Southwest
0
20,000
40,000
60,000
80,000
100,000
6
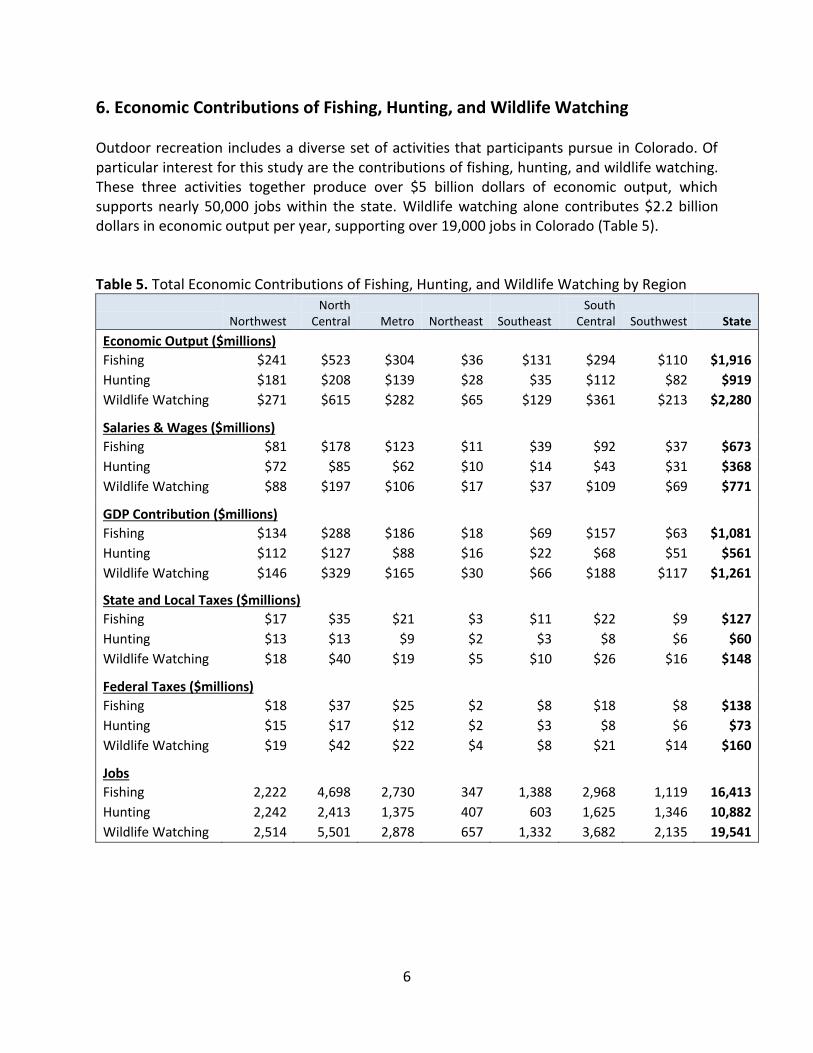
6. Economic Contributions of Fishing, Hunting, and Wildlife Watching Outdoor recreation includes a diverse set of activities that participants pursue in Colorado. Of particular interest for this study are the contributions of fishing, hunting, and wildlife watching. These three activities together produce over $5 billion dollars of economic output, which supports nearly 50,000 jobs within the state. Wildlife watching alone contributes $2.2 billion dollars in economic output per year, supporting over 19,000 jobs in Colorado (Table 5). Table 5. Total Economic Contributions of Fishing, Hunting, and Wildlife Watching by Region
Northwest North
Central Metro Northeast Southeast South
Central Southwest State
Economic Output ($millions)
Fishing $241 $523 $304 $36 $131 $294 $110 $1,916
Hunting $181 $208 $139 $28 $35 $112 $82 $919
Wildlife Watching $271 $615 $282 $65 $129 $361 $213 $2,280
Salaries & Wages ($millions)
Fishing $81 $178 $123 $11 $39 $92 $37 $673
Hunting $72 $85 $62 $10 $14 $43 $31 $368
Wildlife Watching $88 $197 $106 $17 $37 $109 $69 $771
GDP Contribution ($millions)
Fishing $134 $288 $186 $18 $69 $157 $63 $1,081
Hunting $112 $127 $88 $16 $22 $68 $51 $561
Wildlife Watching $146 $329 $165 $30 $66 $188 $117 $1,261
State and Local Taxes ($millions)
Fishing $17 $35 $21 $3 $11 $22 $9 $127
Hunting $13 $13 $9 $2 $3 $8 $6 $60
Wildlife Watching $18 $40 $19 $5 $10 $26 $16 $148
Federal Taxes ($millions)
Fishing $18 $37 $25 $2 $8 $18 $8 $138
Hunting $15 $17 $12 $2 $3 $8 $6 $73
Wildlife Watching $19 $42 $22 $4 $8 $21 $14 $160
Jobs
Fishing 2,222 4,698 2,730 347 1,388 2,968 1,119 16,413
Hunting 2,242 2,413 1,375 407 603 1,625 1,346 10,882
Wildlife Watching 2,514 5,501 2,878 657 1,332 3,682 2,135 19,541

7
Pursuing big game is the most popular form of hunting in Colorado among both residents of the state and those traveling from other locations. Residents make up a majority of days spent hunting big game in the state at 66.8 percent (CPW, 2013a). However, the average nonresident big game hunter spends more money per day than residents. As a result, the economic output contributed by nonresident big game hunters makes up nearly 50 percent of the statewide total (Table 6). Table 6. Total Economic Contributions of Big Game Hunting in Colorado
Output
($millions)
Labor Income
($millions)
GDP Contribution ($millions)
State/Local Taxes
($millions)
Federal Taxes
($millions) Jobs
Resident 322.6 111.1 191.5 22.5 26.9 2,953
Nonresident 286.4 133.9 199.2 17.9 29.4 3,895
Total 609.1 244.9 390.6 40.3 56.3 6,848
7. Hunting Economic Contributions by Destination County Hunting is a popular form of outdoor recreation in Colorado, with participants that are typically active over many years. The type of hunting that Colorado residents and visitors engage in varies greatly by location. Through extensive surveys of hunters, CPW has been able to characterize hunting effort by destination county within the state over a range of species pursued (CPW, 2013a). Using these survey results allowed us to estimate hunter effort by county of activity for three species groups; big game, small game, and waterfowl (Appendix G, Table G2). Pursuing big game is the most popular hunting activity in Colorado, and the Northwest region includes the largest contribution of hunting effort by a fairly large margin (Table 7). Table 7. Hunting Effort by Region (CPW, 2013a)
Northwest North
Central Metro Northeast Southeast South
Central Southwest State
Hunter Days per Year
Big Game 671,700 87,785 36,730 45,658 73,131 234,241 341,573 1,490,818
Small Game 104,898 64,725 4,171 114,212 36,398 43,565 37,422 405,391
Waterfowl 15,478 70,607 888 30,437 14,667 7,441 6,213 145,731
8
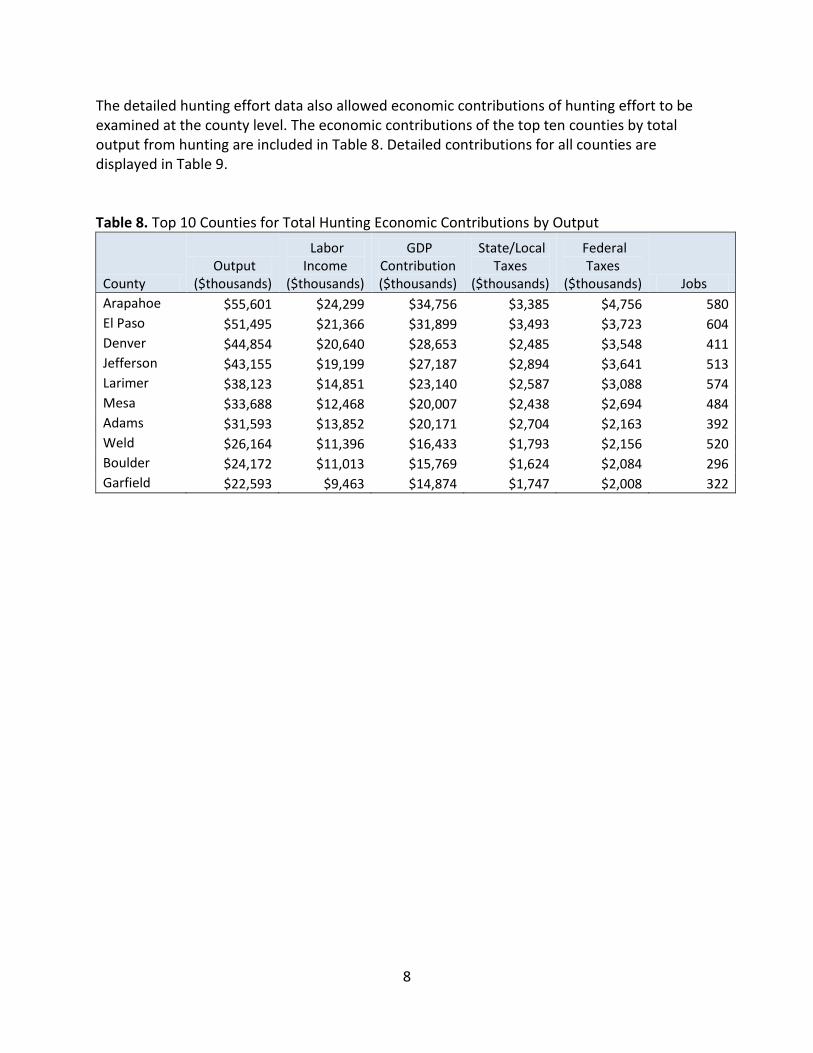
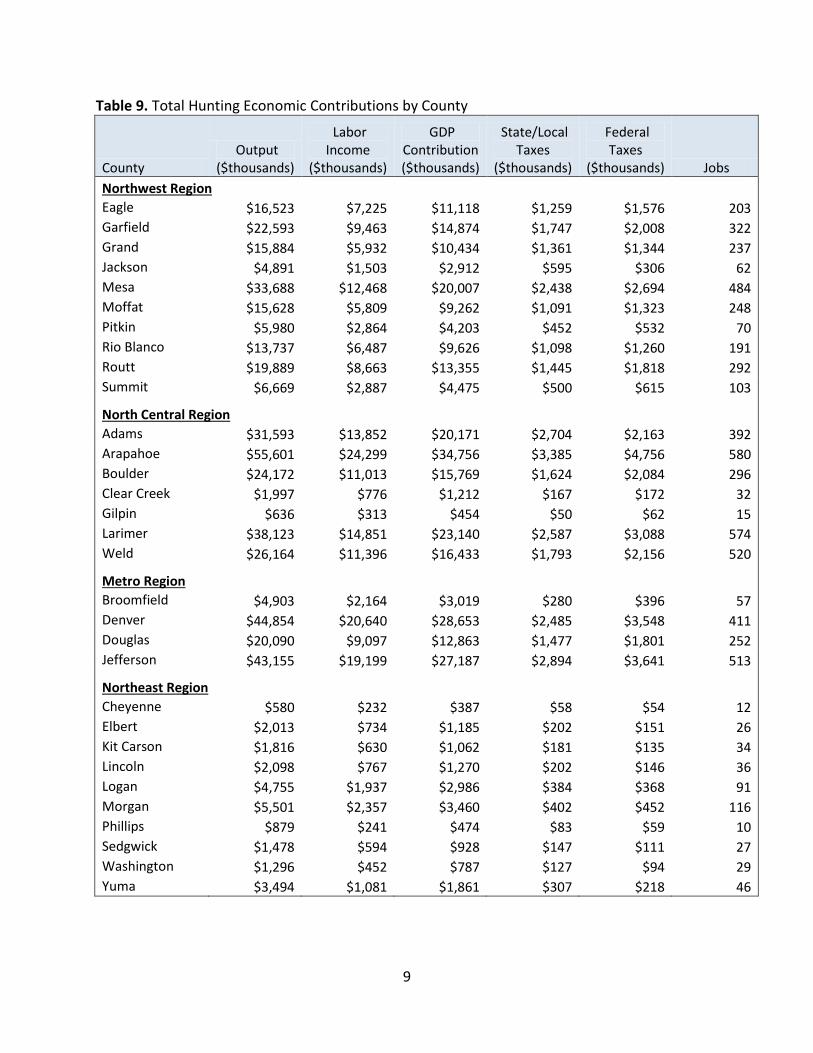
The detailed hunting effort data also allowed economic contributions of hunting effort to be examined at the county level. The economic contributions of the top ten counties by total output from hunting are included in Table 8. Detailed contributions for all counties are displayed in Table 9. Table 8. Top 10 Counties for Total Hunting Economic Contributions by Output
County Output
($thousands)
Labor Income
($thousands)
GDP Contribution ($thousands)
State/Local Taxes
($thousands)
Federal Taxes
($thousands) Jobs
Arapahoe $55,601 $24,299 $34,756 $3,385 $4,756 580
El Paso $51,495 $21,366 $31,899 $3,493 $3,723 604
Denver $44,854 $20,640 $28,653 $2,485 $3,548 411
Jefferson $43,155 $19,199 $27,187 $2,894 $3,641 513
Larimer $38,123 $14,851 $23,140 $2,587 $3,088 574
Mesa $33,688 $12,468 $20,007 $2,438 $2,694 484
Adams $31,593 $13,852 $20,171 $2,704 $2,163 392
Weld $26,164 $11,396 $16,433 $1,793 $2,156 520
Boulder $24,172 $11,013 $15,769 $1,624 $2,084 296
Garfield $22,593 $9,463 $14,874 $1,747 $2,008 322
9
Table 9. Total Hunting Economic Contributions by County
County Output
($thousands)
Labor Income
($thousands)
GDP Contribution ($thousands)
State/Local Taxes
($thousands)
Federal Taxes
($thousands) Jobs
Northwest Region
Eagle $16,523 $7,225 $11,118 $1,259 $1,576 203
Garfield $22,593 $9,463 $14,874 $1,747 $2,008 322
Grand $15,884 $5,932 $10,434 $1,361 $1,344 237
Jackson $4,891 $1,503 $2,912 $595 $306 62
Mesa $33,688 $12,468 $20,007 $2,438 $2,694 484
Moffat $15,628 $5,809 $9,262 $1,091 $1,323 248
Pitkin $5,980 $2,864 $4,203 $452 $532 70
Rio Blanco $13,737 $6,487 $9,626 $1,098 $1,260 191
Routt $19,889 $8,663 $13,355 $1,445 $1,818 292
Summit $6,669 $2,887 $4,475 $500 $615 103
North Central Region
Adams $31,593 $13,852 $20,171 $2,704 $2,163 392
Arapahoe $55,601 $24,299 $34,756 $3,385 $4,756 580
Boulder $24,172 $11,013 $15,769 $1,624 $2,084 296
Clear Creek $1,997 $776 $1,212 $167 $172 32
Gilpin $636 $313 $454 $50 $62 15
Larimer $38,123 $14,851 $23,140 $2,587 $3,088 574
Weld $26,164 $11,396 $16,433 $1,793 $2,156 520
Metro Region
Broomfield $4,903 $2,164 $3,019 $280 $396 57
Denver $44,854 $20,640 $28,653 $2,485 $3,548 411
Douglas $20,090 $9,097 $12,863 $1,477 $1,801 252
Jefferson $43,155 $19,199 $27,187 $2,894 $3,641 513
Northeast Region
Cheyenne $580 $232 $387 $58 $54 12
Elbert $2,013 $734 $1,185 $202 $151 26
Kit Carson $1,816 $630 $1,062 $181 $135 34
Lincoln $2,098 $767 $1,270 $202 $146 36
Logan $4,755 $1,937 $2,986 $384 $368 91
Morgan $5,501 $2,357 $3,460 $402 $452 116
Phillips $879 $241 $474 $83 $59 10
Sedgwick $1,478 $594 $928 $147 $111 27
Washington $1,296 $452 $787 $127 $94 29
Yuma $3,494 $1,081 $1,861 $307 $218 46

10
Table 9 (Continued). Total Hunting Economic Contributions by County
County Output
($thousands)
Salaries & Wages
($thousands)
GDP Contribution ($thousands)
State/Local Taxes
($thousands)
Federal Taxes
($thousands) Jobs
Southeast Region
Baca $1,388 $524 $888 $139 $97 23
Bent $1,220 $307 $644 $159 $55 13
Crowley $416 $204 $298 $38 $28 10
Huerfano $3,264 $1,079 $1,944 $327 $238 73
Kiowa $798 $193 $427 $106 $54 8
Las Animas $5,317 $2,200 $3,486 $460 $431 127
Otero $2,213 $901 $1,427 $199 $184 54
Prowers $1,795 $688 $1,090 $174 $137 33
Pueblo $13,722 $5,980 $8,987 $1,094 $1,165 190
South Central Region
Alamosa $3,392 $1,409 $2,130 $287 $265 57
Chaffee $6,425 $2,236 $3,998 $556 $482 133
Conejos $3,206 $1,246 $2,043 $316 $230 67
Costilla $1,069 $452 $721 $107 $82 25
Custer $2,744 $813 $1,577 $272 $199 59
El Paso $51,495 $21,366 $31,899 $3,493 $3,723 604
Fremont $5,841 $2,157 $3,438 $529 $333 87
Lake $1,520 $546 $936 $153 $106 30
Mineral $1,222 $564 $823 $108 $110 32
Park $6,944 $2,156 $3,995 $742 $465 213
Rio Grande $3,261 $1,260 $2,088 $291 $269 94
Saguache $6,905 $2,700 $4,457 $696 $494 184
Teller $3,902 $1,515 $2,424 $342 $319 84
Southwest Region
Archuleta $6,618 $2,463 $4,233 $530 $520 138
Delta $7,303 $2,630 $4,532 $641 $558 171
Dolores $3,583 $1,396 $2,179 $380 $249 71
Gunnison $17,041 $5,960 $10,170 $1,413 $1,281 277
Hinsdale $2,177 $895 $1,412 $231 $166 47
La Plata $11,072 $4,392 $6,952 $833 $797 162
Montezuma $6,059 $2,230 $3,726 $505 $464 113
Montrose $12,021 $4,621 $7,609 $931 $936 218
Ouray $2,644 $918 $1,665 $242 $202 55
San Juan $972 $257 $568 $115 $66 13
San Miguel $4,637 $1,926 $3,086 $367 $385 63

11
8. Comparison to Previous Studies Previous studies have been undertaken to estimate the economic impacts of fishing, hunting, and wildlife watching in Colorado. CPW supported studies in both 2004 and 2008 to estimate these economic contributions (CPW 2004; CPW 2008). Additionally, USFWS estimates expenditures for fishing, hunting, and wildlife watching by state every five years based on a National Survey (USFWS, 2011). The direct expenditure estimates of these three studies are comparable in scope; retail trip and equipment expenditures made by fishing, hunting, and wildlife watchers in a given year. The spending estimates from each of these studies are summarized in Table 10. Table 10. Estimates of Annual Fishing, Hunting, and Wildlife Watching Expenditures from Comparable Data Sources
Data Source Fishing and Hunting
Expenditures Wildlife Watching
Expenditures
CPW (2004) $845,300,000 $526,000,000
CPW (2008) $1,017,800,000 $703,200,000
USFWS (2011) $1,551,577,000 $1,432,579,000
Current Study $1,604,218,256 $1,322,968,136
Because different studies incorporate different data sources to characterize participation and spending habits of outdoor recreationsists, the resulting expenditure estimates vary as a result. The current study relies largely on the USFWS National Survey to characterize average spending for fishers, hunters, and wildlife watchers. Because the participation numbers used in this study are similar to those estimated by USFWS, the overall statewide expenditures estimates are also similar.

12
References BEA (2013). National Economic Accounts. U.S. Department of Commerce, Bureau of Economic Analysis. Retrieved on 11-17-2013 from www.bea.gov. BLS (2013). State and Metro Area Employment, Hours, and Earnings. U.S. Department of Labor,
Bureau of Labor Statisitcs. Retrieved on 11-17-2013 from www.bls.gov. CDOR (2012). Colorado Department of Revenue Annual Report. Colorado Department of Revenue. CPW (2004). The Economic Impacts of Hunting, Fishing and Wildlife Watching in Colorado.
Colorado Parks & Wildlife, BBC Research and Consulting CPW (2008). The Economic Impacts of Hunting, Fishing and Wildlife Watching in Colorado.
Colorado Parks & Wildlife, BBC Research and Consulting CPW (2013a). Hunter days by County. Colorado Parks & Wildlife. Unpublished data. CPW (2013b). Resident fishing licenses sold in 2012. Colorado Parks & Wildlife. Unpublished data. Davies, S., Watson, P., Cramer, A., & Thilmany, D. (2004). The Economic Contribution of Colorado’s Golf
Industry. Department of Agricultural and Resource Economics. Fort Collins, CO. Martinson, K., Schneider, I., Earing, J., Date, A., & Venegas, E. (2009). Economic Contribution and Demographics of Recreational Horse Trail Users in Minnesota. University of Minnesota. NGF (2004-2011). Rounds played in the United States. National Golf Foundation. NSSF (2012). Survey of Target Shooting in the United States. National Shooting Sports Foundation.
Unpublished raw data. OIA (2011). Survey of Outdoor Recreation in the U.S. Outdoor Industry Association.
Unpublished data. OIA (2012). Survey of Outdoor Recreation in U.S. states. Outdoor Industry Association.
Unpublished data. SCORP (2013). Survey of Outdoor Recreation in Colorado. Colorado Parks & Wildlife, Statewide
Comprehensive Outdoor Recreation Plan. Unpublished data. Venegas, E. (2009). Economic Contribution of Recreational Trail Use in Different Regions of Minnesota. University of Minnesota Tourism Center. USDOL (2013). Consumer Price Index for All Urban Consumers, Annual Average. U.S. Department of Labor. Retrieved on 9-17-2013 from http://www.bls.gov/cpi/. USFWS (2011). 2011 National Survey of Fishing, Hunting, and Wildlife-Associated Recreation.
U.S. Fish & Wildlife Service, U.S. Census Bureau.

13
Appendix A Definitions for Economic Contribution Economic benefits can be estimated by two types of economic measures: economic contributions and economic values. An economic contribution addresses the business and financial activity resulting from the use of a resource. Economic value, on the other hand, is a non-business measure that estimates the value people receive from an activity after subtracting for their costs and expenditures. This concept is also known as consumer surplus. There are three types of economic contribution: direct, indirect and induced. A direct contribution is defined as the economic contribution of the initial purchase made by the consumer (the original retail sale). Indirect contributions are the secondary effects generated from a direct contribution, such as the retailer buying additional inventory, and the wholesaler and manufacturers buying additional materials. Indirect contributions affect not only the industry being studied, but also the industries that supply the first industry. An induced contribution results from the salaries and wages paid by the directly and indirectly effected industries. The employees of these industries spend their income on various goods and services. These expenditures are induced contributions, which, in turn, create a continual cycle of indirect and induced effects. The direct, indirect and induced contribution effects sum together to provide the overall economic contribution of the activity under study. As the original retail purchase (direct contribution) goes through round after round of indirect and induced effects, the economic contribution of the original purchase is multiplied, benefiting many industries and individuals. Likewise, the reverse is true. If a particular item or industry is removed from the economy, the economic loss is greater than the original lost retail sale. Once the original retail purchase is made, each successive round of spending is smaller than the previous round. When the economic benefits are no longer measurable, the economic examination ends. This study presents several important measures: Retail Sales – these include expenditures made by outdoor recreationists for equipment, travel
expenses and services related to their outdoor activities over the course of the year. These combined initial retail sales represent the “direct output”.
Total Economic Effect – also known as “total output” or “total multiplier effect,” this measure reports the sum of the direct, indirect and induced contributions resulting from the original retail sale. This figure explains the total activity in the economy generated by a retail sale. Another way to look at this figure is, if the activity in question were to disappear and participants did not spend their money elsewhere, the economy would contract by this amount.
Salaries & Wages – this figure reports the total salaries and wages paid in all sectors of the economy as a result of the activity under study. These are not just the paychecks of those employees directly serving recreationists or manufacturing their goods, it also includes portions of the paychecks of, for example, the truck driver who delivers food to the restaurants serving recreationists and the accountants who manage the books for companies down the supply chain, etc. This figure is based on the direct, indirect and
14
induced effects, and is essentially a portion of the total economic effect figure reported in this study.
Jobs – much like Salaries and Wages, this figure reports the total jobs in all sectors of the economy as a result of the activity under study. These are not just the employees directly serving recreationists or manufacturing their goods, they also include, for example, the truck driver who delivers food to the restaurants serving recreationists and the accountants who manage the books for companies down the supply chain, etc. This figure is based on direct, indirect and induced effects.
GDP Contribution – this represents the total “value added” contribution of economic output made by the industries involved in the production of outdoor recreation goods and services. For a given industry, value added equals the difference between gross output (sales and other income) and intermediate inputs (goods and services imported or purchased from other industries). It represents the contribution to GDP in a given industry for production related to outdoor recreation.

15
Appendix B Methodology for Economic Contribution The extent of the economic contributions associated with spending for outdoor recreation can be estimated in two ways:
Direct effects: These include the jobs, income and tax revenues that are tied directly to the spending by outdoor recreationists without including multiplier effects.
Total effects: These include the jobs, income and tax revenues that are tied directly to the spending by outdoor recreationists plus the jobs, income and tax revenues that result from the multiplier effects of outdoor recreation spending. The multiplier effect occurs when a direct purchase from a business leads to increased demand for goods and services from other businesses along their supply chain. Also included is economic activity associated with household spending of incomes earned in the affected businesses.
The economic contributions from outdoor recreation, both direct effects and total effects, were estimated with an IMPLAN input-output model for the state and regional economies of Colorado, and the county economies for hunting economic contributions. The IMPLAN model was developed by MIG, Inc. originally for use by the U.S. Forest Service. Inherent in each IMPLAN model is the relationship between the economic output of each industry (i.e. sales) and the jobs, income and taxes associated with a given level of output. Through those models, it is possible to determine the jobs, income and taxes supported directly by wildlife-based recreationists with and without the multiplier effects. Input-output models describe how sales in one industry affect other industries. For example, once a consumer makes a purchase, the retailer buys more merchandise from wholesalers, who buy more from manufacturers, who, in turn, purchase new inputs and supplies. In addition, the salaries and wages paid by these businesses stimulate more benefits. Simply, the first purchase creates numerous rounds of purchasing. Input-output analysis tracks the flow of dollars from the consumer through all of the businesses that are affected, either directly or indirectly. To apply the IMPLAN model, each specific expenditure for outdoor recreation activities was matched to the appropriate industry sector affected by the initial purchase. The spending was estimated with models of the Colorado economy, therefore all of the resulting contributions represent salaries and wages, total economic effects, jobs and tax revenues that occur within the state of Colorado. Likewise, models based on specific regions or counties represent the economic effects within the selected region or county. The results do not include any economic activity or indirect contributions that leak out of the state, region, or county of interest. As a result of this leakage, economic contributions at the state level are larger than the sum of corresponding regional or county contributions. This occurs because a portion spending in a particular region (or county) leaks to other regions (or counties) within the state, and this within-state leakage is captured in the Colorado model.

16
Estimating Tax Revenues The IMPLAN model estimates detailed tax revenues at the state and local level and at the federal level. The summary estimates provided in this report represent the total taxes estimated by the IMPLAN model including all income, sales, property and other taxes and fees that accrue to the various local, state and federal taxing authorities.

17
Appendix C Spending Methodology
I. Overview Spending in Colorado was estimated by applying spending profiles to participation numbers for 18 activity groups (Table D2). The procedure involved first estimating participation and spending at the state level and then allocating spending to each region. A. Estimating Participation For the majority of the 18 activity groups, a single data source was not sufficient to characterize both resident and nonresident participation in Colorado (Table D2).4 Procedures used to estimate final participation numbers varied between activity groups as a result of differences in the data available for each group. The specific procedures used are detailed within sections II through IV. B. Estimating Spending at the State Level Spending profiles for each activity group included a set of expenditures by item for a typical participant. Each spending profile included two components; equipment spending, and trip-related spending.5 Spending profiles were applied differently by activity due to differences in source data (Sections II through IV). C. Allocating Spending to each Region Spending totals were allocated to regions differently for equipment and trip spending. We assumed that most consumers would not make many equipment purchases during a trip. Instead, they would likely purchase equipment prior to going on a trip. As a result many equipment purchases would be expected to occur in different regions than trip-related purchases. In order to more accurately reflect locations of equipment purchases, we used retail trade sales data by county (CDOR, 2012; Appendix H) to allocate these expenditures regionally. SCORP survey data was used to allocate trip-related expenditures.6 The percentages used to allocate regional expenditures are shown in Tables E2, F2, and G3. Regional Allocation Calculations:
4 For horseback riding and target shooting, only resident expenditures were estimated in this analysis due to lack
of reliable data for characterizing nonresident participation. The resulting underestimation is negligible assuming that nonresident spending for these activities is a small fraction of total spending. 5 For golfing, only trip-related expenditures were included because the spending data consisted of purchases made
at golf courses only (Davies et al., 2004). As a result, the golf-related spending estimates included in this analysis are likely more conservative than estimates for the other activities. 6 For hunting, participation data from Colorado Parks and Wildlife were used to allocate trip-related spending
regionally (CPW, 2013a).
18
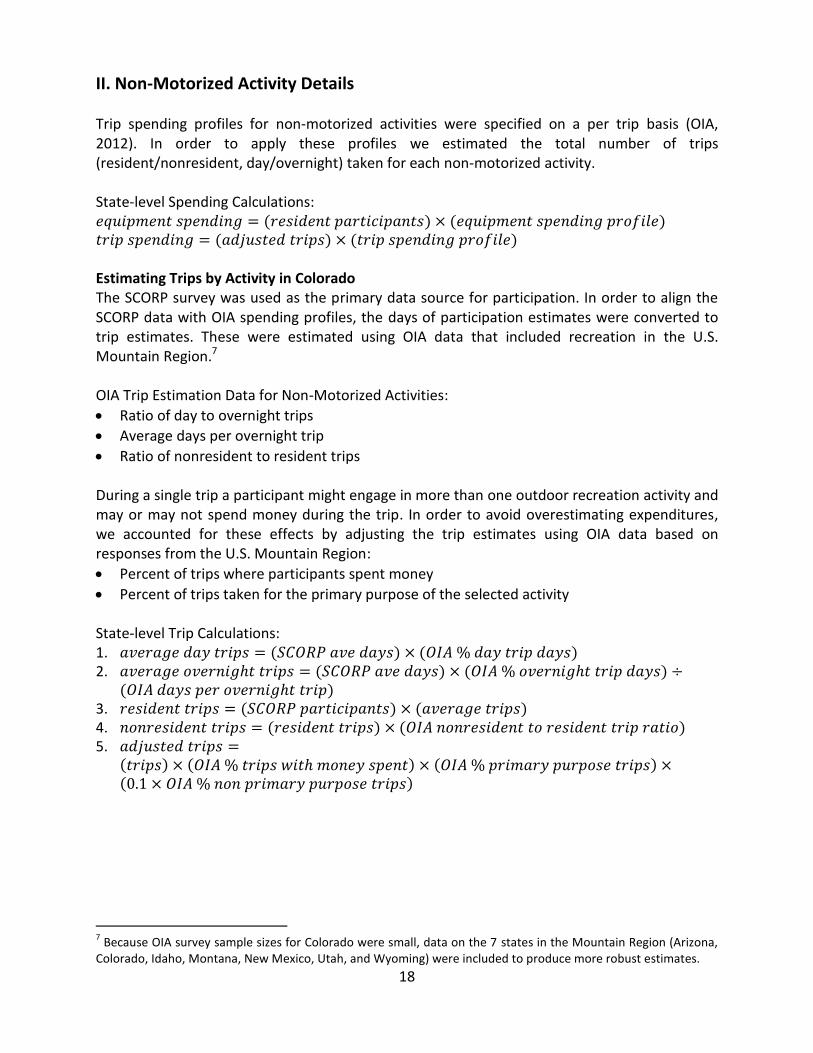
II. Non-Motorized Activity Details Trip spending profiles for non-motorized activities were specified on a per trip basis (OIA, 2012). In order to apply these profiles we estimated the total number of trips (resident/nonresident, day/overnight) taken for each non-motorized activity. State-level Spending Calculations: Estimating Trips by Activity in Colorado The SCORP survey was used as the primary data source for participation. In order to align the SCORP data with OIA spending profiles, the days of participation estimates were converted to trip estimates. These were estimated using OIA data that included recreation in the U.S. Mountain Region.7 OIA Trip Estimation Data for Non-Motorized Activities:
Ratio of day to overnight trips
Average days per overnight trip
Ratio of nonresident to resident trips During a single trip a participant might engage in more than one outdoor recreation activity and may or may not spend money during the trip. In order to avoid overestimating expenditures, we accounted for these effects by adjusting the trip estimates using OIA data based on responses from the U.S. Mountain Region:
Percent of trips where participants spent money
Percent of trips taken for the primary purpose of the selected activity State-level Trip Calculations: 1. 2.
3. 4. 5.
7 Because OIA survey sample sizes for Colorado were small, data on the 7 states in the Mountain Region (Arizona,
Colorado, Idaho, Montana, New Mexico, Utah, and Wyoming) were included to produce more robust estimates.

19
III. Motorized Activity Details Spending for motorized activities was estimated using the non-motorized activity procedure, with 2 additional steps. Because a particular motorized vehicle is often used for outdoor recreation as well as other purposes, additional adjustments were made to exclude the economic contributions of non-outdoor recreation related activities and also to reallocate part of motorized vehicle expenditures to relevant outdoor recreation categories (e.g., powerboat expenditures used for fishing).8 These adjustments were made using OIA survey data for activity responses in the U.S. Mountain Region. A. Adjusting Trip Estimates to Exclude Non-Outdoor Recreation In the OIA survey respondents were asked to identify the percentage of trips by motorized activity for 4 primary purposes (outdoor recreation, cruising, special events, or other uses). The final trip estimation was adjusted by excluding the percentage for “special events” and “other uses.” Final Trip Calculation: B. Reallocating Contributions to Non-motorized Activities In order to attribute motorized expenditures made for the purposes of other outdoor activities (e.g., fishing, hunting, etc.) a portion of the motorized economic contributions were reallocated to 8 non-motorized activities. The “outdoor recreation” portion of each motorized activity was allocated to non-motorized activities based on an OIA survey question indicating the proportion of outdoor recreation trips for each activity. Reallocation Calculation:
IV. Selected Activity Details Spending for each activity in the “selected” group was estimated in a unique way due to the particular nature of the data that were used. Each of the following 6 sub-sections includes the estimation details for the corresponding activity.
8 For equipment expenditures, a primary purpose adjustment was included when constructing spending profiles.
For this reason, no additional adjustments were made to equipment spending in order to exclude contributions of non-outdoor recreation related activities.

20
A. Fishing In 2012 there were 739,885 resident anglers who purchases fishing licenses in Colorado (CPW, 2013b). The ratio of resident to nonresident anglers in Colorado, taken from the 2011 USFWS National survey, was used to produce the estimate of 218,286 nonresident anglers. The per participant spending profile (excluding motorized items) from the National Survey was applied to estimate total fishing spending at the state level. B. Hunting Hunting spending profiles were constructed using the USFWS 2011 National Survey. Hunter days by county (Table G2) were combined to estimate total hunter days in Colorado for residents and nonresidents combined (CPW, 2013a). For each hunting type (big game, small game, and waterfowl) hunter day estimates were applied to the respective spending profiles to estimate total spending for hunting in Colorado.9 Trip spending by county was allocated using CPW participation estimates, and equipment spending by county was allocated using county trade sales data (CDOR, 2012; Appendix H). C. Wildlife Watching An estimated 713,581 Colorado residents participated in wildlife watching within the state in 2013 (SCORP, 2013). The ratio of resident to nonresident wildlife viewers in Colorado, taken from the 2011 USFWS National survey, was used to produce the estimate of 451,129 nonresident wildlife viewers. Spending for wildlife watching was estimated by using the non-motorized per participant spending profile taken from the 2011 USFWS National Survey. D. Golfing Spending for golfing was characterized by updating an estimate of total spending at golf courses in Colorado in 2002 (Davies et al., 2004). The 2002 estimate was adjusted to 2011 dollars using consumer price indices (USDOL, 2013). An adjustment for change in participation was applied based on rounds played data produced annually from 2004 to 2011 (National Golf Foundation). E. Horseback Riding The horseback riding spending profile was based on a 2009 study that included trip spending estimates by day (Venegas et al., 2009) and annual equipment spending estimates by person (Martinson et al., 2009) for horseback riders in Minnesota. These profiles were adjusted to 2011 dollars using consumer price indices (USDOL, 2013). Participation was characterized using the 2013 SCORP survey (Table G1). F. Target Shooting A recent survey by the National Shooting Sports Foundation was used to estimate spending profiles for target shooters in Colorado (NSSF, 2012). Spending and participation data for Colorado residents were used to construct the target shooter spending profile. This profile was applied to the 2013 SCORP participation numbers to estimate total spending.
9 The “migratory bird” spending profile from the 2011 USFWS National Survey was used to estimate waterfowl
expenditures.

21
Appendix D Overall Activities Data Summary
Table D1. SCORP Outdoor Recreation Activities and Combined Activity Groups
SCORP Survey Activity Activity Group for Economic Estimates
Trail
Walking Trail (apparel only)
Jogging/Running (outdoors) Trail (apparel only)
Hiking/Backpacking Trail
Horseback riding Horseback Riding
Road biking Biking
Mountain biking Biking
Off-road motorcycling Off-road (motorcycle)
ATV riding or 4-wheel driving Off-road (other)
Water-based
Swimming (outdoors) Trail (apparel only)
Fishing Fishing
Power boating Boating
Water skiing Boating
Jet skiing Boating
Sailing Water Sports
Canoeing Water Sports
Kayaking Water Sports
Whitewater rafting Water Sports
Stand up paddleboarding Water Sports
Winter
Skiing or snowboarding at a ski area Snow Sports
Backcountry skiing Snow Sports
Sledding/tubing Snow Sports (apparel only)
Ice skating (outdoors) Snow Sports (apparel only)
Snowmobiling Snowmobiling
Snowshoeing or cross country skiing Snow Sports
Ice fishing Fishing
Wildlife-based
Big game hunting Hunting
Upland bird and small game hunting Hunting
Waterfowl hunting Hunting
Wildlife Watching (including birding) Wildlife Watching
Other Outdoor
Developed/RV camping RV Camping
Tent camping Tent Camping
Picnicking Trail (apparel only)
Target or skeet shooting Target Shooting
Rock climbing Trail
Team or individual sports (outdoors) Trail (apparel only)
Playground activities Trail (apparel only)
Golf Golfing
Geocaching Trail (apparel only)
Note: For “apparel only” categories, only apparel expenditures were included in the economic estimates.

22
Table D2. Data Sources Used to Estimate Participation and Spending Profiles
Activity Group Spending Profile Data Sources Participation Data Sources
Motorized Activities
Boating OIA (2011) SCORP (2013), OIA (2012)
Off-road (motorcycle) OIA (2011) SCORP (2013), OIA (2012)
Off-road (other) OIA (2011) SCORP (2013), OIA (2012)
RV Camping OIA (2011) SCORP (2013), OIA (2012)
Snowmobiling OIA (2011) SCORP (2013), OIA (2012)
Non-Motorized Activities
Biking OIA (2011) SCORP (2013), OIA (2012)
Snow Sports OIA (2011) SCORP (2013), OIA (2012)
Snow Sports (apparel only) OIA (2011) SCORP (2013), OIA (2012)
Tent Camping OIA (2011) SCORP (2013), OIA (2012)
Trail OIA (2011) SCORP (2013), OIA (2012)
Trail (apparel only) OIA (2011) SCORP (2013), OIA (2012)
Water Sports OIA (2011) SCORP (2013), OIA (2012)
Selected Activities
Fishing USFWS (2011) CPW (2013b), SCORP (2013), USFWS (2011)
Hunting USFWS (2011) CPW (2013a)
Wildlife Watching USFWS (2011) SCORP (2013), USFWS (2011)
Golfing Davies (2004) SCORP (2013), Davies (2004), NGF (2004-2011)
Horseback Riding Venegas (2009), Martinson (2009) SCORP (2013)
Target Shooting NSSF (2012) SCORP (2013)

23
Appendix E Non-Motorized Activities Data Summary Table E1. SCORP Survey Annual Non-Motorized Participation
Northwest North
Central Metro Northeast Southeast South
Central Southwest State
Numbers of Participants (thousands)
Biking 400 658 482 53 98 245 127 1,386
Tent Camping 593 582 123 16 59 411 231 1,357
Snow Sports 1,133 493 75 5 8 232 165 1,533
Trail Sports 1,073 1,077 360 48 85 645 355 2,066
Water Sports 214 208 74 1 53 155 146 625
Trail (apparel only) 1,095 1,424 1,129 271 251 721 388 3,043
Snow (apparel only) 256 278 174 12 13 70 46 709
Average Days per Participant
Biking 17.1 27.2 27.2 18.1 21.8 20.1 18.4 34.8
Tent Camping 7.3 7.1 5.5 6.4 6.0 7.4 6.8 10.4
Snow Sports 13.2 9.1 6.0 1.6 6.1 9.3 11.4 15.6
Trail Sports 12.1 16.4 15.9 7.6 11.4 15.3 10.8 24.9
Water Sports 9.7 8.9 7.7 5.1 12.0 14.4 7.1 13.5
Number of Respondents
Biking 117 87 72 17 27 60 75 316
Tent Camping 128 64 20 11 22 93 102 329
Snow Sports 234 69 10 4 8 61 109 399
Trail Sports 249 150 60 18 33 160 180 531
Water Sports 67 29 13 3 14 34 56 177
Trail (apparel only) 310 219 193 105 104 213 242 875
Snow (apparel only) 58 27 21 6 5 16 44 159
Table E2. Regional Spending Allocation for Non-Motorized Activities
Northwest North
Central Metro Northeast Southeast South
Central Southwest State
Equipment Spending
All Activities 8.8% 38.7% 29.7% 1.7% 4.0% 13.5% 3.6% 100.0%
Trip Spending
Biking 14.2% 37.1% 27.2% 2.0% 4.4% 10.2% 4.8% 100.0%
Tent Camping 30.4% 29.0% 4.8% 0.7% 2.5% 21.4% 11.1% 100.0%
Snow Sports 62.2% 18.8% 1.9% 0.0% 0.2% 9.0% 7.9% 100.0%
Trail Sports 25.3% 34.3% 11.2% 0.7% 1.9% 19.2% 7.5% 100.0%
Water Sports 24.7% 22.0% 6.8% 0.1% 7.6% 26.6% 12.2% 100.0%

24
Appendix F Motorized Activities Data Summary Table F1. SCORP Survey Annual Motorized Participation
Northwest North
Central Metro Northeast Southeast South
Central Southwest State
Numbers of Participants
Boating 172,199 235,905 92,424 31,770 58,216 62,827 31,206 556,489
Off-road (motorcycle) 108,927 23,828 12,286 17,713 14,755 41,996 18,615 213,490
Off-road (other) 277,655 158,497 24,082 52,996 87,963 225,052 167,565 646,152
RV Camping 271,326 184,777 66,372 54,738 56,780 140,125 113,905 562,840
Snowmobiling 125,882 4,928 4,721 482 1,753 39,871 48,150 191,592
Average Days per Participant
Boating 8.3 11.8 18.8 20.1 39.1 30.8 14.2 20.2
Off-road (motorcycle) 7.5 4.2 14.7 6.0 8.7 20.9 11.1 11.3
Off-road (other) 12.1 14.2 15.9 14.5 16.8 13.4 11.5 20.4
RV Camping 6.3 7.9 4.9 4.6 5.9 10.7 7.8 11.5
Snowmobiling 6.1 27.4 10.0 20.0 5.3 12.3 10.4 10.2
Number of Respondents
Boating 43 27 17 15 16 13 31 141
Off-road (motorcycle) 22 6 3 4 6 17 19 61
Off-road (other) 92 32 6 13 22 66 101 240
RV Camping 84 37 17 10 25 59 73 212
Snowmobiling 33 2 2 1 2 5 26 66
Table F2. Regional Spending Allocation for Motorized Activities
Northwest North
Central Metro Northeast Southeast South
Central Southwest State
Equipment Spending
All Activities 8.8% 38.7% 29.7% 1.7% 4.0% 13.5% 3.6% 100.0%
Trip Spending
Boating 12.7% 24.8% 15.5% 5.7% 20.2% 17.2% 3.9% 100.0%
Off-road (motorcycle) 33.9% 4.2% 7.4% 4.4% 5.3% 36.3% 8.5% 100.0%
Off-road (other) 25.6% 17.0% 2.9% 5.8% 11.2% 22.8% 14.6% 100.0%
RV Camping 26.4% 22.6% 5.1% 3.9% 5.2% 23.1% 13.7% 100.0%
Snowmobiling 39.0% 6.9% 2.4% 0.5% 0.5% 25.1% 25.6% 100.0%

25
Appendix G Selected Activities Data Summary Table G1. Participation for Selected Activities (SCORP, 2013)
Northwest North
Central Metro Northeast Southeast South
Central Southwest State
Numbers of Participants
Fishing 406,418 634,220 182,522 67,415 142,606 428,749 240,813 1,399,845
Golfing 171,190 259,190 251,529 23,900 36,718 161,947 42,547 713,581
Horseback Riding 105,052 129,865 53,406 25,340 8,745 66,666 20,585 282,247
Hunting 252,899 166,360 13,660 148,581 73,799 135,314 103,885 593,619
Shooting 89,653 259,045 35,765 31,943 40,822 119,859 52,738 520,724
Wildlife Watching 218,917 304,051 89,706 43,355 56,542 192,707 143,801 733,220
Average Days per Participant
Fishing 12.6 12.6 18.2 6.9 16.8 15.9 11.7 20.7
Golfing 8.2 13.6 9.5 16.6 9.2 15.7 13.4 15.7
Horseback Riding 7.7 6.6 8.1 8.2 10.2 3.9 11.0 10.2
Hunting 10.1 10.4 28.1 6.9 20.6 13.3 14.1 17.6
Shooting 11.3 9.3 3.6 8.6 17.1 12.9 5.5 12.2
Wildlife Watching 9.8 12.7 10.2 16.3 20.2 17.3 16.2 19.7
Number of Respondents
Fishing 151 111 37 37 57 129 138 482
Golfing 63 39 51 21 20 47 39 222
Horseback Riding 25 14 4 13 7 12 26 85
Hunting 86 32 6 59 27 48 80 255
Shooting 34 31 11 28 18 35 32 167
Wildlife Watching 87 56 19 35 21 62 96 272
Note: Not all of the above numbers were included in specifying participation for this analysis (see Appendix D, Section IV for details).

26
Table G2. Hunting Participation by County in Hunter Days (CPW, 2013a)
County Big Game Small Game Waterfowl
Northwest Region
Eagle 64,716 7,164 1,486
Garfield 91,843 9,828 1,978
Grand 87,672 4,445 1,952
Jackson 50,316 3,054 905
Mesa 73,920 40,582 6,062
Moffat 75,224 23,974 1,659
Pitkin 27,286 1,342 47
Rio Blanco 87,070 2,685 740
Routt 92,686 7,659 508
Summit 20,967 4,165 142
North Central Region
Adams 3,645 3,300 6,570
Arapahoe 4,768 4,141 675
Boulder 9,597 8,711 5,448
Clear Creek 7,552 4,420 0
Gilpin 4,763 1,132 0
Larimer 49,027 13,145 13,886
Weld 8,433 29,876 44,028
Metro Region
Broomfield 485 0 0
Denver 1,890 43 132
Douglas 9,484 1,190 644
Jefferson 24,871 2,938 113
Northeast Region
Cheyenne 4,577 649 0
Elbert 7,876 2,141 126
Kit Carson 5,080 9,509 180
Lincoln 8,134 3,856 105
Logan 4,313 20,011 8,138
Morgan 5,160 17,345 17,266
Phillips 581 8,739 97
Sedgwick 2,260 14,902 2,816
Washington 3,916 10,249 347
Yuma 3,761 26,811 1,360
27
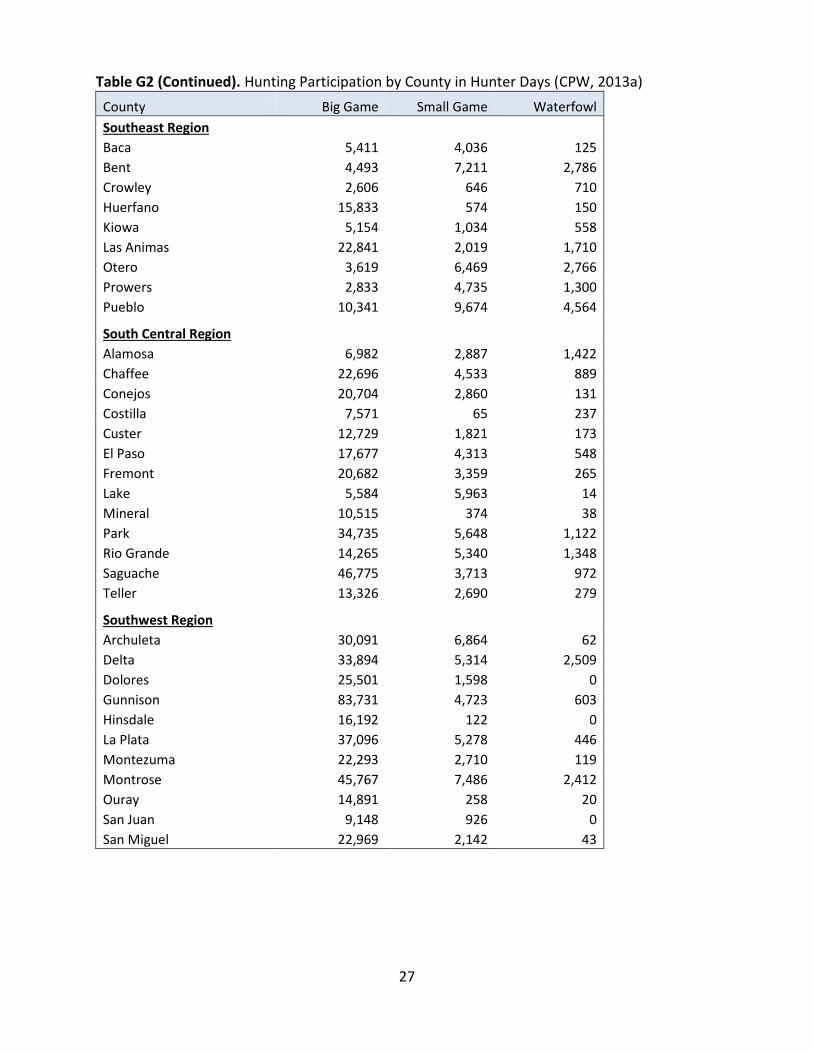
Table G2 (Continued). Hunting Participation by County in Hunter Days (CPW, 2013a)
County Big Game Small Game Waterfowl
Southeast Region
Baca 5,411 4,036 125
Bent 4,493 7,211 2,786
Crowley 2,606 646 710
Huerfano 15,833 574 150
Kiowa 5,154 1,034 558
Las Animas 22,841 2,019 1,710
Otero 3,619 6,469 2,766
Prowers 2,833 4,735 1,300
Pueblo 10,341 9,674 4,564
South Central Region
Alamosa 6,982 2,887 1,422
Chaffee 22,696 4,533 889
Conejos 20,704 2,860 131
Costilla 7,571 65 237
Custer 12,729 1,821 173
El Paso 17,677 4,313 548
Fremont 20,682 3,359 265
Lake 5,584 5,963 14
Mineral 10,515 374 38
Park 34,735 5,648 1,122
Rio Grande 14,265 5,340 1,348
Saguache 46,775 3,713 972
Teller 13,326 2,690 279
Southwest Region
Archuleta 30,091 6,864 62
Delta 33,894 5,314 2,509
Dolores 25,501 1,598 0
Gunnison 83,731 4,723 603
Hinsdale 16,192 122 0
La Plata 37,096 5,278 446
Montezuma 22,293 2,710 119
Montrose 45,767 7,486 2,412
Ouray 14,891 258 20
San Juan 9,148 926 0
San Miguel 22,969 2,142 43

28
Table G3. Regional Spending Allocation for Miscellaneous Activities
Northwest North
Central Metro Northeast Southeast South
Central Southwest State
Equipment Spending
All Activities 8.8% 38.7% 29.7% 1.7% 4.0% 13.5% 3.6% 100.0%
Trip Spending
Fishing 17.7% 27.6% 11.5% 1.6% 8.3% 23.5% 9.8% 100.0%
Golfing 12.6% 31.6% 21.4% 3.6% 3.0% 22.7% 5.1% 100.0%
Horseback Riding 28.0% 29.6% 15.1% 7.3% 3.1% 9.0% 7.8% 100.0%
Shooting 16.0% 37.9% 2.0% 4.3% 10.9% 24.3% 4.6% 100.0%
Wildlife Watching 14.8% 26.8% 6.3% 4.9% 7.9% 23.1% 16.2% 100.0%
Trip Spending for Hunting
Big Game 45.1% 5.9% 2.5% 3.1% 4.9% 15.7% 22.9% 100.0%
Small Game 25.9% 16.0% 1.0% 28.2% 9.0% 10.7% 9.2% 100.0%
Waterfowl 10.6% 48.4% 0.6% 20.9% 10.1% 5.1% 4.3% 100.0%
Table G4. Trail Activities Participation by Percent of Population
Trail Activities Northwest North
Central Metro Northeast Southeast South
Central
Southwest State
Non-Motorized
Walking 69.3% 69.0% 63.0% 48.0% 54.5% 68.9% 74.5% 66.3%
Jogging/Running 26.7% 32.8% 36.5% 13.1% 17.1% 26.8% 17.7% 30.8%
Hiking/Backpacking 64.4% 57.0% 48.5% 17.5% 23.6% 54.0% 52.3% 51.9%
Horseback riding 9.9% 7.4% 8.4% 5.6% 4.5% 4.1% 12.8% 7.4%
Mountain biking 30.0% 26.2% 18.5% 4.7% 12.6% 19.9% 27.3% 22.1%
Snowshoe/X-Country Ski 30.6% 23.9% 12.9% 1.3% 4.4% 10.3% 26.6% 17.7%
Any Non-motorized Trail 89.1% 81.9% 80.4% 54.0% 60.5% 84.2% 84.2% 80.8%
Motorized
Off-road motorcycling 11.5% 3.8% 6.2% 5.7% 5.9% 5.5% 7.3% 5.6%
ATV/4-wheel driving 30.5% 11.6% 14.9% 11.2% 21.2% 24.1% 28.6% 16.9%
Any Motorized Trail 33.4% 13.0% 15.4% 12.4% 22.9% 27.6% 32.2% 18.6%
Combined
Any Trail 93.7% 82.7% 81.0% 57.5% 66.7% 86.3% 90.4% 82.6%
29
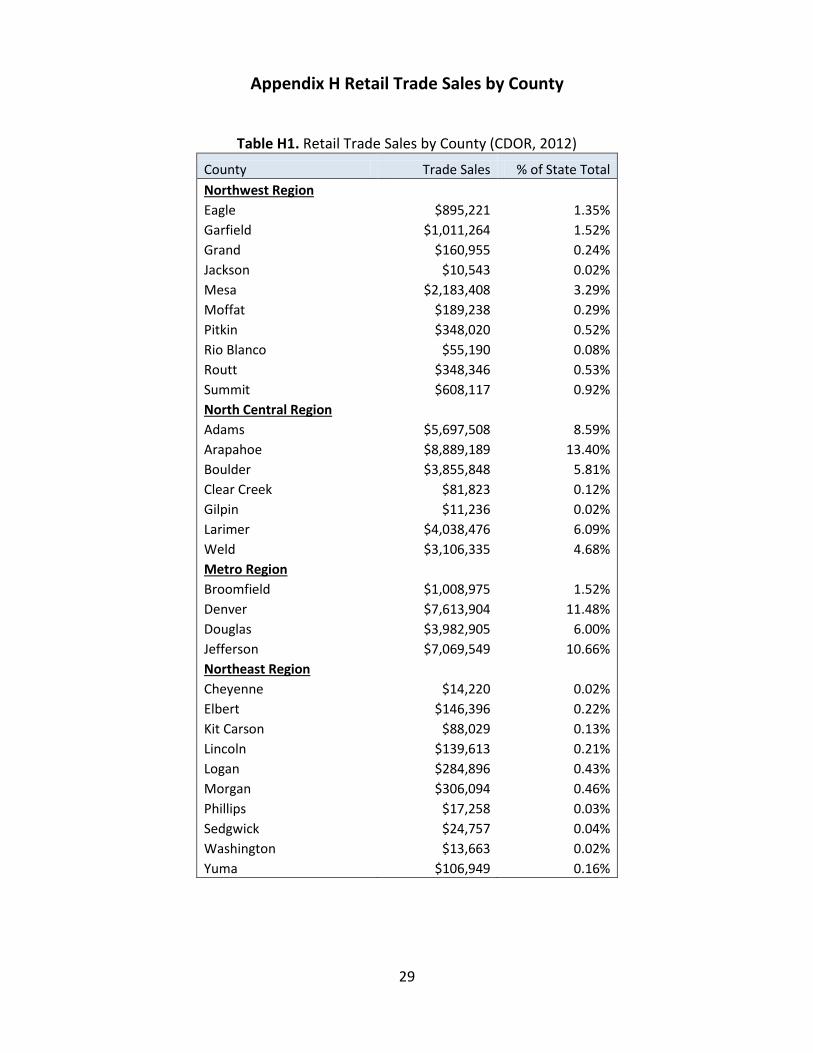
Appendix H Retail Trade Sales by County
Table H1. Retail Trade Sales by County (CDOR, 2012)
County Trade Sales % of State Total
Northwest Region
Eagle $895,221 1.35%
Garfield $1,011,264 1.52%
Grand $160,955 0.24%
Jackson $10,543 0.02%
Mesa $2,183,408 3.29%
Moffat $189,238 0.29%
Pitkin $348,020 0.52%
Rio Blanco $55,190 0.08%
Routt $348,346 0.53%
Summit $608,117 0.92%
North Central Region
Adams $5,697,508 8.59%
Arapahoe $8,889,189 13.40%
Boulder $3,855,848 5.81%
Clear Creek $81,823 0.12%
Gilpin $11,236 0.02%
Larimer $4,038,476 6.09%
Weld $3,106,335 4.68%
Metro Region
Broomfield $1,008,975 1.52%
Denver $7,613,904 11.48%
Douglas $3,982,905 6.00%
Jefferson $7,069,549 10.66%
Northeast Region
Cheyenne $14,220 0.02%
Elbert $146,396 0.22%
Kit Carson $88,029 0.13%
Lincoln $139,613 0.21%
Logan $284,896 0.43%
Morgan $306,094 0.46%
Phillips $17,258 0.03%
Sedgwick $24,757 0.04%
Washington $13,663 0.02%
Yuma $106,949 0.16%
30
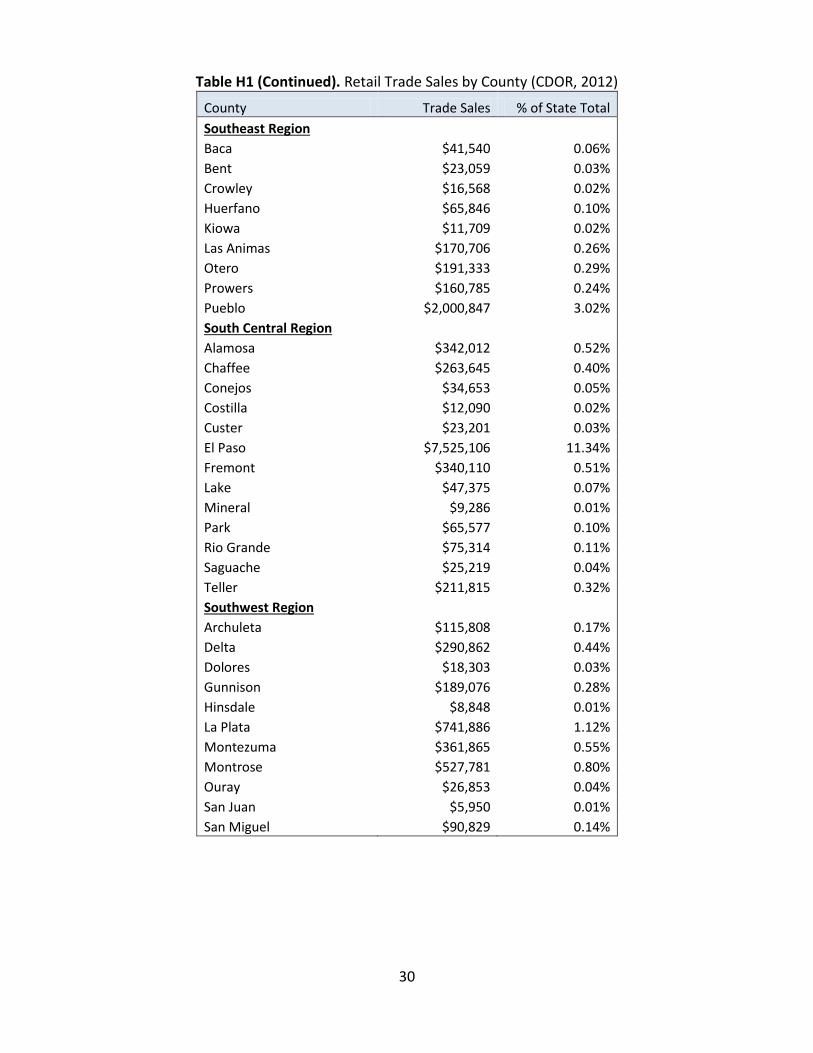
Table H1 (Continued). Retail Trade Sales by County (CDOR, 2012)
County Trade Sales % of State Total
Southeast Region
Baca $41,540 0.06%
Bent $23,059 0.03%
Crowley $16,568 0.02%
Huerfano $65,846 0.10%
Kiowa $11,709 0.02%
Las Animas $170,706 0.26%
Otero $191,333 0.29%
Prowers $160,785 0.24%
Pueblo $2,000,847 3.02%
South Central Region
Alamosa $342,012 0.52%
Chaffee $263,645 0.40%
Conejos $34,653 0.05%
Costilla $12,090 0.02%
Custer $23,201 0.03%
El Paso $7,525,106 11.34%
Fremont $340,110 0.51%
Lake $47,375 0.07%
Mineral $9,286 0.01%
Park $65,577 0.10%
Rio Grande $75,314 0.11%
Saguache $25,219 0.04%
Teller $211,815 0.32%
Southwest Region
Archuleta $115,808 0.17%
Delta $290,862 0.44%
Dolores $18,303 0.03%
Gunnison $189,076 0.28%
Hinsdale $8,848 0.01%
La Plata $741,886 1.12%
Montezuma $361,865 0.55%
Montrose $527,781 0.80%
Ouray $26,853 0.04%
San Juan $5,950 0.01%
San Miguel $90,829 0.14%
31
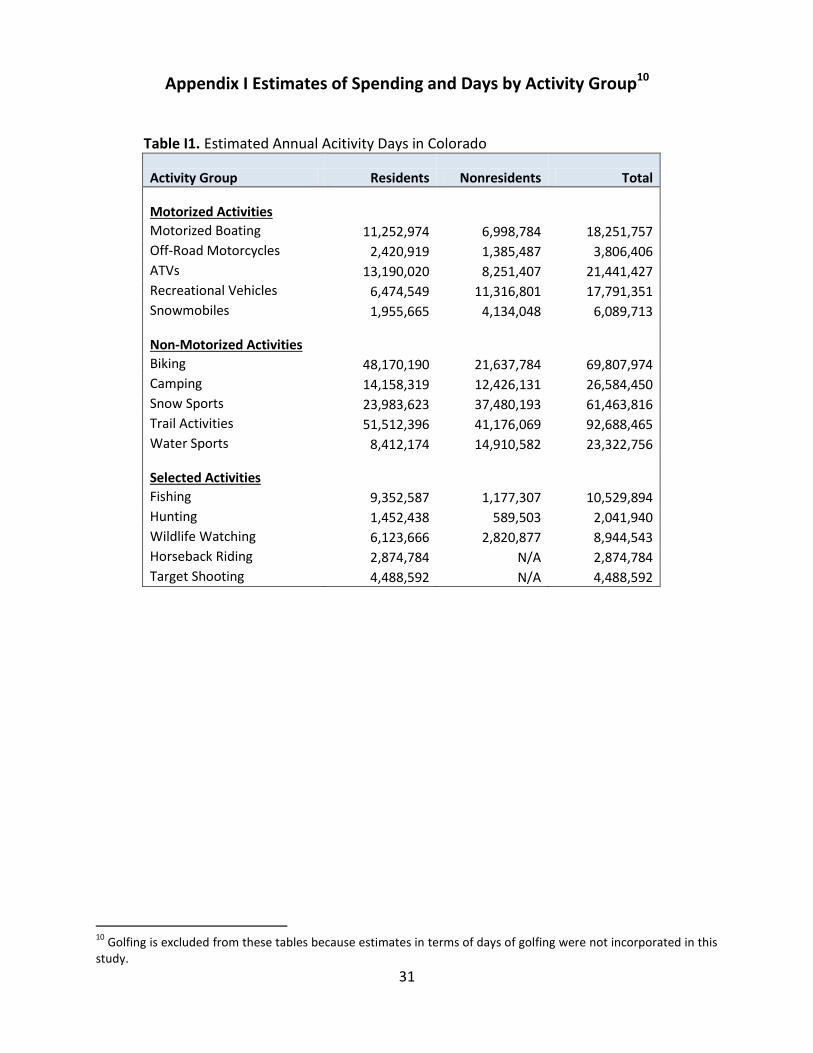
Appendix I Estimates of Spending and Days by Activity Group10
Table I1. Estimated Annual Acitivity Days in Colorado
Activity Group Residents Nonresidents Total
Motorized Activities
Motorized Boating 11,252,974 6,998,784 18,251,757
Off-Road Motorcycles 2,420,919 1,385,487 3,806,406
ATVs 13,190,020 8,251,407 21,441,427
Recreational Vehicles 6,474,549 11,316,801 17,791,351
Snowmobiles 1,955,665 4,134,048 6,089,713
Non-Motorized Activities
Biking 48,170,190 21,637,784 69,807,974
Camping 14,158,319 12,426,131 26,584,450
Snow Sports 23,983,623 37,480,193 61,463,816
Trail Activities 51,512,396 41,176,069 92,688,465
Water Sports 8,412,174 14,910,582 23,322,756
Selected Activities
Fishing 9,352,587 1,177,307 10,529,894
Hunting 1,452,438 589,503 2,041,940
Wildlife Watching 6,123,666 2,820,877 8,944,543
Horseback Riding 2,874,784 N/A 2,874,784
Target Shooting 4,488,592 N/A 4,488,592
10
Golfing is excluded from these tables because estimates in terms of days of golfing were not incorporated in this study.

32
Table I2. Estimated Spending per Day of Activity in Colorado
Activity Group Average Spending
per Day
Motorized Activities
Motorized Boating $36.05
Off-Road Motorcycles $37.99
ATVs $49.66
Recreational Vehicles $18.73
Snowmobiles $23.17
Non-Motorized Activities
Biking $19.59
Camping $73.75
Snow Sports $118.32
Trail Activities $24.43
Water Sports $56.04
Selected Activities
Fishing $103.16
Hunting $253.67
Wildlife Watching $147.91
Horseback Riding $253.81
Target Shooting $55.45