the economic consequences of social network structure/menu/standard/file/... · the economic...
TRANSCRIPT

The Economic Consequences of Social Network
Structure
Matthew O. Jackson,∗ Brian Rogers† and Yves Zenou‡§
January 2015
Abstract
We survey the literatures on the economic consequences of the structure of social
networks. We develop a taxonomy of ‘macro’ and ‘micro’ characteristics of social inter-
action networks and discuss both the theoretical and empirical findings concerning the
role of those characteristics in determining learning, diffusion, decisions, and resulting
behaviors. We also discuss the challenges of accounting for the endogeneity of networks
in assessing the relationship between the patterns of interactions and behaviors.
Keywords: Social networks, social economics, homophily, diffusion, social learning,
contagion, centrality measures, endogeneity, network formation.
JEL Classification Codes: D85, C72, L14, Z13
∗Department of Economics, Stanford University, the Santa Fe Institute, and CIFAR.
http://www.stanford.edu/∼jacksonm, e-mail: [email protected]†Department of Economics, Washington University in St. Louis.
http://pages.wustl.edu/brogers, email: [email protected]‡Department of Economics, Stockholm University and IFN.
http://www.ne.su.se/english/research/our-researchers/yves-zenou, email: [email protected]§We thank Ben Golub for helpful comments. Matthew Jackson gratefully acknowledges financial support
from the NSF under grants SES-0961481 and SES-1155302 and from grant FA9550-12-1-0411 from the
AFOSR and DARPA, and ARO MURI award No. W911NF-12-1-0509. Yves Zenou acknowledges financial
support from the Swedish Research Council (Vetenskapradet) through research grant 421–2010–1310.
1

1 Introduction
Humans are inherently social beings. We rely on each other for sustenance, safety, gover-
nance, information, and companionship. Production, exchange and consumption of goods
and services largely take place in social settings where the patterns and nature of interactions
influence, and are influenced by, economic activity. This embeddedness of many economic
transactions means that abstracting from social structure comes with the risk of severely mis-
understanding behavior.1 In particular, designing many economic policies requires a deep
understanding of social structure:
• Criminality is often a social behavior and accounting for peer influences and networks
of interactions can lead to more effective policies to reduce crime.
• Improving the employment and wages of a disadvantaged group requires understanding
that many jobs are obtained via social contacts and the underlying social networks
exhibit patterns that can result in persistent inequality and poverty traps.
• Improving the human capital investments of a given group must account for the fact
that one’s decisions regarding education and labor market participation are often heav-
ily influenced by decisions of family and friends, through both learning and comple-
mentarities.
• Integrating schools not just in terms of ethnic mixes, but in terms of friendship forma-
tion and cross-group interactions, requires understanding when and why students are
compelled to seek friendships with others similar to themselves.
• Enhancing new technology adoption requires a proper understanding of how peoples’
opinions and beliefs are shaped by word-of-mouth communication.
• Sustaining informal risk-sharing and favor exchange depends on social norms and sanc-
tions, and social structure provides new insights into how communities overcome basic
incentive problems.
This is, of course, only a partial list of the many economic behaviors that are shaped at
a fundamental level by network patterns of interaction. For instance, beyond such “social”
networks, other interactions, such as international trade and political alliances, have inherent
network structures that shape the impact of policies and help us understand conflict and other
inefficiencies. Given the importance of social context and the emerging tools researchers are
currently developing to account for it, there has been a rapid growth of analyses of economic
behavior and social context appearing in an array of applied and theoretical literatures both
1See Granovetter (1985) for a seminal discussion.
2

within and outside of economics. We do not attempt to provide a comprehensive survey of the
economic literature on social networks.2 Instead, we provide a framework for understanding
how networks of interactions shape behavior.
Most importantly, there are robust regularities in how network structure relates to be-
havior, involving the density and distribution of connections, segregation patterns, and the
position of key nodes. Our narrative is based on pulling together major insights, within a
common framework, that are emerging from the combination of empirical and theoretical
analyses regarding how network structure relates to behavior.
In our presentation, we also emphasize that the relationship between social structure
and economic behavior is not unidirectional, as networks are endogenous and determined
partly by economic behaviors. In particular, the symbiotic relationship of social context and
behavior complicates empirical analysis, due to the fact that the relationships among most
of the variables of interest are endogenous. It is thus essential for many economic questions
to understand how networks form, evolve, and interact with behaviors. From an empirical
perspective, these questions arise at a unique time in which large network data sets are
rapidly becoming available, along with the computing power to analyze them.
In Section 2, we first elaborate on a few specific examples in order to ground the discussion
and illustrate what we have in mind. In Section 3, we turn to outlining the contents of the
remainder of the article by proposing a classification of network characteristics and how
they relate to behavior. Sections 4 through 7 present detailed descriptions of how specific
network characteristics relate to economic behavior. In Section 8, we discuss some challenges
that arise with empirical analyses in networked settings, devoting particular attention to
endogeneity problems, which are ubiquitous in the study of social interactions. We close
with a summary and some concluding remarks in Section 9.
2 Illustrative Examples
In order to ground our discussion, we start by expanding on the examples mentioned in the
Introduction in which network structures are of primary importance in determining behavior.
Each of the following four examples illustrate a theme that we elaborate upon below.
First, many criminal behaviors do not occur in isolation, but take place in a social con-
text.3 Indeed, criminals often have friends or acquaintances who have themselves committed
2Some aspects of networks have been covered in previous surveys. See, in particular, Jackson (2003,
2004, 2005, 2011), Ioannides and Datcher-Loury (2004), Granovetter (2005), Jackson and Yariv (2011),
Jackson and Zenou (2015), as well as the books by Demange and Wooders (2003), Vega-Redondo (2007),
Goyal (2007), Jackson (2008a), Benhabib, Bisin and Jackson (2011), Jackson and Zenou (2013), and
Bramoulle, Galeotti and Rogers (2015).3It is well-established that crime is, to some extent, a group phenomenon, and the source of crime and
3

several offenses. These social ties among criminals can serve as a means whereby individuals
actively or passively influence one another to commit crimes. In fact, not only friends but
also the structure of social networks predicts an individual’s own criminal behavior. Influence
occurs through a number of channels, as criminal behaviors involve many complementarities,
including role models, learning, and increased opportunities, which can lead individuals to
undertake criminal acts. Moreover, some crimes inherently involve team production (e.g.,
production and smuggling of illegal drugs and goods) and require criminals to work with
accomplices. These complementarities can then feed back and affect the social network in
which an individual resides, as they may constitute relevant components of the decision to
invest in relationships. This, in turn, can reinforce behaviors and erode investments in more
productive human capital and opportunities.
Second, we observe persistent inequality on a number of dimensions between ethnicities,
genders, and other social classes. Important components of these differences relate to segre-
gation patterns in interaction, as segregation in network structures affects how information
flows, what access individuals have to various opportunities, and how decisions are made. In
sufficiently segregated networks, different behaviors, norms, and expectations can persist in
different communities which, in turn, can have consequences for human capital investments,
career choice, and various other behaviors. For example, once different outcomes arise in dif-
ferent communities, incentives are affected by, e.g., dictating different opportunity costs for
investments for individuals in different social settings. Hence, it is essential for economists
to understand why networks often exhibit strong segregation patterns, why those structures
seem to be so persistent, and how those patterns affect behavior and outcomes. Recent
studies have made significant progress on each of these facets.
Third, one of the most extensively studied network phenomena is diffusion, as it is ob-
viously a network phenomenon and has a huge number of applications. A most obvious
application is from epidemiology: how does a contagious disease spread through a popula-
tion? Finer details of network structure have only recently been systematically incorporated
in answering this question. Clearing, features such as segregation, network density, the dis-
tribution of links, and the joint characteristics of linked individuals, and potential reactions
of the network to the contagion, are all important to understand. A second example of an
application of diffusion is technology adoption: when should we expect a new technology
be widely adopted? What do the dynamics of market penetration look like, and what fac-
tors determine success or failure of adoption? More generally, it is important to understand
which aspects of network structure enhance or impede diffusion. How do the answers to
these questions depend on the nature of the diffusion process?
delinquency is located in the intimate social networks of individuals (see e.g. Sutherland (1947), Sanercki
(2001), Warr (2002), Calvo-Armengol and Zenou (2004), Patacchini and Zenou (2012)).
4

Fourth, cooperative behavior prevails in some environments, and not others. In particu-
lar, informal risk sharing and favor exchange, the provision of various (local) public goods,
and economic exchange, are all inherently networked and matter greatly in the developmnt
of a society. Such pro-social behavior is routinely observed, even in contexts with little in the
way of formal institutions to provide sanctions. This is true in both the developing world and
the developed world, as many interactions are more easily governed by social sanctions than
relying on costly contracting. The means of providing appropriate incentives often relies
in large part on social structure. For example, information about misbehavior can spread
quickly through an individual’s network, leading to negative reactions in future interactions
for those whose actions conflict with social norms. Social structure plays a prominent role
in determining the forms of cooperative behavior that can be maintained.
3 Classifying Network Characteristics
With a few motivating examples in hand, we now offer a framework through which to under-
stand how structural properties of a network impact behaviors of the agents involved in the
network.4 The framework is based on the fundamental characteristics of networks. We focus
on four major characteristics (that we define below for those new to the subject): degree
distributions, homophily patterns, clustering, and the centrality of nodes. Naturally, there
are many other facets of such inherently complex structures that can also be important;
however we focus on these four because they are particularly prominent, fundamental, and
provide some essential insights.
In discussing impacts of network structure on behavior it is useful to divide such network
characteristics into two categories: (i) those that are somehow ‘macro’, ‘global’, or ‘aggre-
gate’, and (ii) those that are more ‘micro’, ‘local’, or ‘individual’. The macro/global/aggregate
characteristics include those such as the density of links or segregation patterns, while the mi-
cro/local/individual characteristics include those such as whether some given person’s friends
are friends with each other, or how central or influential an individual is in a network.
3.1 Macro/Global/Aggregate Network Patterns and Behavior
We begin by discussing macro patterns in networks. There are a variety of characteris-
tics through which researchers describe and classify networks when looking at the role of
macro/global/aggregate patterns in shaping behavior. We discuss two of the most promi-
nent ones, as they are particularly pertinent in analyzing the impact of network structure
on behavior.
4See Jackson (2014).
5

3.1.1 Degree Distributions
The most basic macro characteristic is the degree distribution, which is the distribution of
the number of relationships that various nodes have. This can be captured via the density
of links or ‘average degree’ in a network, or in greater richness via the full distribution of
degrees across nodes: the ‘degree distribution’ of the network. In addition to the average
degree, higher moments of the distribution can vary across settings and these are known to
have significant consequences for behavior.
To fix ideas, let us consider a network of relationships that is represented by a simple
graph: two nodes are either connected to each other or not, and there is no weight or direction
associated with the relationships. The degree of a node is then the number of other nodes
to which it is connected. The degree distribution is then a frequency distribution of the
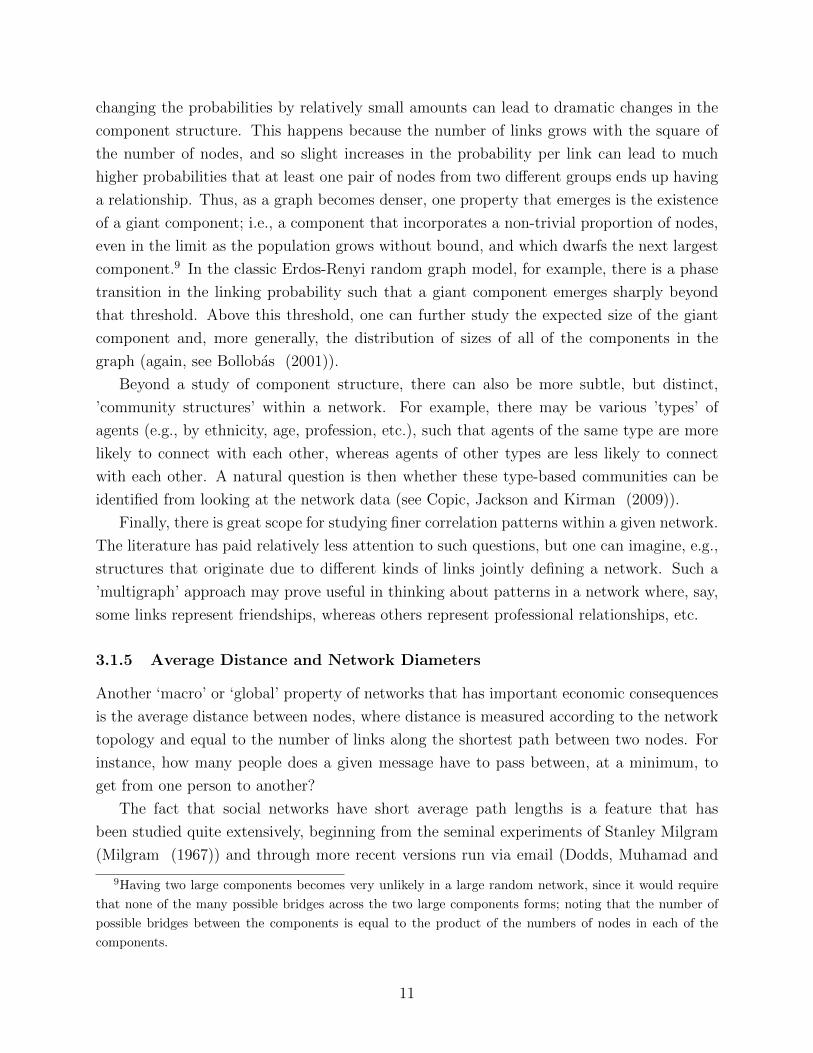
degrees in the society, as different nodes may have different numbers of relationships. Figure
1 depicts two degree distributions from data sets analyzed in Jackson and Rogers (2007a).
�������������
���
���
���
��
��
��
��
�
� � � � � � � � ��
����������
��������
�����������
��� �����
����������� �������
��
��
��
��
��
��
� � �� �
����������
��������
�������������
�����������
Figure 1: Fit of two degree distributions, reprinted from Jackson and Rogers (2007a). Pink:
Fit of complementary cdf from their model; Blue: complementary cdf from the data; (left)
Notre Dame www data set from Albert, Jeong, and Barabasi (1999), (right) Economics
co-author data set from Goyal, Van Der Leij and Moraga-Gonzalez (2006). The two degree
distributions are quite different in their curvatures. Reprinted with permission of the AER.
In each panel, the log of the proportion of nodes with connectivity of at least the given
degree (i.e., the log of the complemetary cdf) is plotted as a function of the log of the
6

degree. The blue curve is the empirical distribution and the pink curve is the fit obtained
from their network formation model. The depicted data sets in Figure 1 are a portion of
the www in which nodes are web pages and links are hyperlinks between pages (left panel)
and a network among economics researchers in which links represent a published coauthored
paper (right panel). For our present purposes, the most important observation is that the
distributions of degree are radically different in the two networks. The near-linear pattern
in the www network corresponds to a case in which there are relatively more high degree
nodes and low degree nodes, and relatively fewer nodes with intermediate degrees than in
the coauthor network. The www network is, in this sense, closer to having a “hub-and-
spoke” sort of structure, with numerous very highly connected nodes (hubs) and many
other far less connected nodes (e.g., see Albert, Jeong, and Barabasi (1999); Huberman
and Adamic (1999)). Instead the coauthor network exhibits greater regularity and less
variance. Such differences could occur for a number of reasons. For example, while time
clearly places a constraint on the number of coauthors a researcher is able to collaborate
with, there is no obvious counterpart to that constraint in terms of the number of hyperlinks
a webpage maintains, thus allowing for the possibility of greater absolute numbers and,
therefore, heterogeneity of links.
From a theoretical perspective, two of the most prominent degree distributions are a
Poisson distribution and a power distribution (or scale-free distribution, related to a Pareto
distribution). These can be thought of as extreme distributions in a space of plausible degree
distributions, the first in which the only variation in degrees comes from uniformly random
noise, and the latter in which variation in degrees comes from a cumulative process in which
nodes gain connections in proportion to the number of connections that they already have.
In simple models of network formation, the Poisson distribution arises when links are formed
uniformly at random (and are not too dense), so that the degree differences across nodes
are simply reflective of the randomness inherent in binomial random variables (which are,
in turn, well approximated by a Poisson distribution). A distribution that exhibits a power
law instead has a greater variation in the degrees, and is usually derived from a form of
a “rich-get-richer” process: often dynamic in which the nodes with the higher degrees are
the nodes that gain new links at higher rates.5 The term ‘power’ reflects the fact that the
likelihood of a given number of connections is proportional to the degree raised to a power
- a distribution that has an unbounded variance as the number of nodes grows. Power
distributions are said to have ‘fat tails’, as the relative likelihood of very high degree and
very low degree are higher than a distribution with links formed uniformly at random, and
correspondingly, intermediate degree nodes then are less likely than in a distribution with
5See Price (1976); Mitzenmacher (2004); Barabasi and Albert (1999); Jackson and Rogers (2007a);
Jackson (2008a) for more on processes leading to each of these, as well as other, degree distributions.
7

links formed uniformly at random. The term ‘scale-free’ refers to the fact that the relative
frequency of nodes with degree d compared to nodes of degree d′, is the same as the relative
frequency of nodes with degree kd compared to nodes of degree kd′, when rescaling by an
arbitrary factor k.6
When one analyzes degree distributions from many social networks, it is often claimed
that a “power-law” is found. However, it is more accurate to say that many social networks
exhibit ‘fat tails’, as when closely analyzing the distributions, they are often significantly
different from both a power distribution and a Poisson distribution, but instead lie somewhere
between (e.g., see Jackson and Rogers (2007a)).
Differences in the distribution of degrees have important implications for diffusion pro-
cesses, as we discuss shortly.
3.1.2 Assortativity and Correlations in Degrees
In this subsection and the next, we briefly discuss ways in which the properties of one’s
neighbors vary with one’s own characteristics. We begin here by posing the question: are
highly connected nodes more likely to be connected to other high degree nodes, and low
degree nodes with other low degree nodes? The answer is frequently yes (e.g., see Newman
(2003); Jackson and Rogers (2007a)). One explanation for this is that nodes are born at
different times. For instance, people become researchers at different points in time. Older
researchers have had more opportunities to collaborate with other researchers (tending to
give them higher degree) and also relatively more opportunities to collaborate with other
older researchers (producing a correlation in the degree of connected nodes). This is true of
a variety of settings in which nodes and connections accumulate in tandem over time (e.g.,
see Jackson and Rogers (2007a); Jackson (2008a)). Assortativity patterns turn out to have
implications for time patterns in homophily (Bramoulle et al. (2012)) as well as contagion
processes (Newman (2002); Jackson and Lopez-Pintado (2013)). 7
3.1.3 Homophily and Segregation Patterns among Nodes
The degree distribution is a purely structural phenomenon that concerns the unlabeled graph
structure. In social and economic contexts, actors generally come with relevant attributes,
such as ethnicity, gender, age, education, experience, interests, income, etc., and those at-
tributes are often related to the interaction pattern.8 For example, are individuals more
6Given that the frequency f(d) = cd−γ , then f(d)/f(d′) = (d/d′)−γ = f(kd)/f(kd′).7It is worth noting that there are other networks, not social in nature, such as e.g. power grids, that tend
to be dissortative, such that hubs tend to be connected to relatively isolated nodes.8Note that if one considers degree to be such an attribute, e.g. as a proxy of ‘popularity’, then assortativity
can be viewed as a particular form of homophily.
8

likely to be linked to others who have similar characteristics? This is a phenomenon known
as homophily, and it refers to the fairly pervasive observation in working with social networks
that having similar characteristics (age, race, religion, profession, education, etc.) is often
a strong and significant predictor of two individuals being connected (McPherson, Smith-
Lovin, and Cook (2001)). This means that social networks can, and often do, exhibit strong
segregation patterns. Segregation can occur because of the decisions of the people involved
and/or by forces that affect the ways in which they meet and have opportunities to inter-
act (Currarini, Jackson and Pin (2009, 2010), Tarbush and Teytelboym (2014)). Clearly,
capturing homophily requires one to model or at least explicitly account for characteristics
of nodes that exhibit a dimension of heterogeneity across the population. Homophily, and
other segregation patterns, mean that two networks that have the same degree distribution
might have strikingly different properties in terms of how different groups of nodes intercon-
nect with each other. This can have profound implications for how behaviors are chosen and
evolve over time.
Consider, for example, Figure 2, which depicts a friendship network among high school
students in the United States (from the National Longitudinal Survey of Adolescent Health
– ‘AddHealth’). It turns out that the (self-reported) friendships are strongly related to
ethnicity, with students of the same ethnicity being significantly more likely to be connected
to each other than students of different ethnicities. If one is interested in how information
spreads through social learning, such homophily patterns are important to understand. As
homophily increases, the propensity for a diffusion to gain hold within a particular group
rises, sometimes at the expense of the speed and extent of diffusion throughout the entire
population, as we discuss in more detail below. Further, given sufficiently strong homophily,
one can imagine different norms or cultures emerging, e.g. regarding cooperative behavior,
and so different groups may have quite different outcomes. It could also be that, in a diffusion
context, different prevalences will be sustained in different areas of the network, which in
turn can lead to welfare and behavioral differences across groups.
3.1.4 Component and Community Structures
We now turn to discussing how the structure of a network dictates the shape and character-
istics of the community that surrounds a given agent. A basic concept is that of a network
component, i.e., a set of agents such that all pairs have at least one path connecting them,
and such that the addition of any other node breaks this connectedness property. An easy
way to think about finding the component structure of a network is via the following algo-
rithm. Start from any agent, and examine each of her links to find all of her neighbors. Then,
from each neighbor, repeat the process, and continue from the next set of nodes that are
reached, and so on. Assuming there are a finite number of nodes, this process is guaranteed
9

Figure 2: A Network of the Friendships in a High School from the Ad Health Data Set:
green=Asian, blue=Black, red=Hispanic, yellow=White, pink=other/unknown. (Reprinted
from Jackson (2007).)
to reach a state after which no new nodes can be found; at which point the current set of
nodes that have been reached form a component. Repeating this process starting from a
node that was not included in the first component will then identify a second component,
and so on, until the full component structure of the network has been identified.
The number of components that a network separates into, and the size distribution of
those components, has implications for various processes, especially diffusion processes. In
particular, there is a strong sense in which a network with many small components can be
thought of as being more segregated than a network with fewer and larger components. In
the limit, one obtains a network in which all nodes belong to the same component, which
is often simply referred to as being ‘path-connected’ or, more simply, ‘connected’. In a
path-connected network, it is possible, depending on the particular process in question, for
information or behaviors to spread from any node to any other node, given enough time.
On the other hand, for networks with many small components, information or behavior
that originates among nodes in one component has no natural way to spread to nodes in
other components, presuming that the network has been constructed to describe the feasible
avenues of diffusion.
From a theoretical perspective, the number and sizes of components has been extensively
studied in the context of relatively simple random graph models (e.g., see Bollobas (2001)).
A straightforward insight is that, having higher probabilities of links existing between any
two nodes is likely to result in a network with fewer and larger components than one formed
with lower probabilities of links between any two nodes, which is simply an expression of the
fact that extra linkages will occasionally connect two nodes who otherwise would have been
in separate components and, following the addition of that ’bridge’, the two components
merge. What is perhaps more surprising, and applies to many random graph models, is that
10
changing the probabilities by relatively small amounts can lead to dramatic changes in the
component structure. This happens because the number of links grows with the square of
the number of nodes, and so slight increases in the probability per link can lead to much
higher probabilities that at least one pair of nodes from two different groups ends up having
a relationship. Thus, as a graph becomes denser, one property that emerges is the existence
of a giant component; i.e., a component that incorporates a non-trivial proportion of nodes,
even in the limit as the population grows without bound, and which dwarfs the next largest
component.9 In the classic Erdos-Renyi random graph model, for example, there is a phase
transition in the linking probability such that a giant component emerges sharply beyond
that threshold. Above this threshold, one can further study the expected size of the giant
component and, more generally, the distribution of sizes of all of the components in the
graph (again, see Bollobas (2001)).
Beyond a study of component structure, there can also be more subtle, but distinct,
’community structures’ within a network. For example, there may be various ’types’ of
agents (e.g., by ethnicity, age, profession, etc.), such that agents of the same type are more
likely to connect with each other, whereas agents of other types are less likely to connect
with each other. A natural question is then whether these type-based communities can be
identified from looking at the network data (see Copic, Jackson and Kirman (2009)).
Finally, there is great scope for studying finer correlation patterns within a given network.
The literature has paid relatively less attention to such questions, but one can imagine, e.g.,
structures that originate due to different kinds of links jointly defining a network. Such a
’multigraph’ approach may prove useful in thinking about patterns in a network where, say,
some links represent friendships, whereas others represent professional relationships, etc.
3.1.5 Average Distance and Network Diameters
Another ‘macro’ or ‘global’ property of networks that has important economic consequences
is the average distance between nodes, where distance is measured according to the network
topology and equal to the number of links along the shortest path between two nodes. For
instance, how many people does a given message have to pass between, at a minimum, to
get from one person to another?
The fact that social networks have short average path lengths is a feature that has
been studied quite extensively, beginning from the seminal experiments of Stanley Milgram
(Milgram (1967)) and through more recent versions run via email (Dodds, Muhamad and
9Having two large components becomes very unlikely in a large random network, since it would require
that none of the many possible bridges across the two large components forms; noting that the number of
possible bridges between the components is equal to the product of the numbers of nodes in each of the
components.
11

Watts (2003)), and on social media sites (e.g., Backstrom et al (2012)). The main finding
of these studies is that, when asked to forward a message to a personal acquaintance, with
the goal of eventually reaching a given target, a message typically has to pass through a
surprisingly small number of individuals, even in very large and sparse networks. This is not
only surprising because of the existence of a small path length between geographically and
demographically diverse pairs of people, but also because people are able to navigate the
network and find these paths without complete information about the network structure (i.e.,
they are able to forward the messages in a way that reaches the target relatively efficiently
without knowing much about the larger network; see Kleinberg (2000a,b)).
This empirical finding is a feature that is rather well-understood from a theoretical per-
spective too. The main observation to bear in mind is that, when links are sparse, a random
network tends to have very few cycles, so that a tree-structure underlies the network. This
means that, starting from any node and successively tracing all the paths emanating from
that node, one reaches exponentially many others as a function of the number of links one
moves outward – and thus the typical path length tends to vary as the log of the number of
nodes in the network.10 Theorems showing that this is true have been proven for increas-
ingly rich network models, starting from simple ones (Erdos and Renyi (1959)), to ones with
richer degree distributions (Chung and Lu (2002)), to ones rewired from networks with high
clustering (Watts and Strogatz (1998)), to ones with rich sets of node characteristics and
homophily (Jackson (2008b).
Although average path length is clearly a useful summary statistic, there are other mea-
sures of distance that are often considered, just as average degree is informative of, but does
not completely describe, the degree distribution. A measure that is tractable to estimate is
the maximum distance between pairs of nodes in a network, which is termed the network’s
‘diameter’. While precise expressions for diameter are generally difficult to obtain in many
network models, it is possible to identify and prove bounds on the diameter in some growing
random graph models (Bollobas and Riordan (2004) as well as some strategic network for-
mation models (Jackson and Rogers (2005)). Indeed, diameters tend to be small in random
graphs for the reasons cited above, whereas it is for very different reasons that diameters are
low for networks in which individuals choose links strategically. When people choose links
and obtain value from having short paths to other individuals, diameters become limited
because if the diameter were sufficiently large, then two individuals who are quite distant
in the network would see sufficiently large benefits to connecting to each other and greatly
10Another way to see this is that the number of potential paths of length two between a pair of nodes
is n − 2 (any other node could serve as an intermediary). Then the number of potential paths increases
exponentially with the length of the which makes it rare to only have very long paths between nodes unless
links are extremely rare so that none of the shorter paths exist.
12

shortening many paths in the network. Diameters are directly useful for providing bounds
for some diffusion processes that travel via shortest paths.
3.2 Micro/Local/Individual Network Analyses and Behavior
On the micro side, we identify three main perspectives that have received extensive attention.
Each of these are fundamental and continue to generate important new insights.
3.2.1 Clustering and Support
The first perspective relates to clustering patterns of links. Essentially, clustering is a mea-
sure of the local correlation or dependence among the locations of links. There are various
related statistics in the literature that have been used to capture clustering and two of these
are as follows. One is the frequency with which neighbors of any given node tend to be
neighbors of each other, which is referred to as a ‘clustering coefficient’ or ‘transitivity’.11
In Figure 3 (left), the clustering coefficient of a node i measures, across all pairs of nodes j
and k that are each connected to i, the proportion that are connected to each other. The
second, distinct but related, measure is whether or not two linked nodes have some third
node to which they are both connected. In Figure 3 (right), this measure asks, for a pair of
neighbors i and j, whether there exists at least one node k that is connected to both i and
j. This latter notion is also termed ‘support’ by Jackson, Rodriguez-Barraquer and Tan
(2012), who study its role in providing incentives for individuals i and j to act cooperatively
in a relationship.
j k
i
j k
i
Figure 3: Two relationship triads to illustrate clustering concepts.
Although both of these measures relate to the presence of ‘triangles’ or ‘triads’ in a
network, they are different concepts. For example, as illustrated in Figure 4, one can have
a network for which every link is supported, and yet have the clustering of some nodes be
limited. Indeed, in this network all links are supported and so the support measure is 1.
11See Jackson (2008a) for more detailed definitions.
13

However, only 1/3 of the pairs of friends of the most central agent are friends with each
other (e.g., considering the middle-most node 1 and his neighbors 2, 3, 4 and 5, we see that
2 is a friend of 3, but not of 4 or 5). Thus, the clustering in this network is much lower than
the support measure.12
1
2 3
5 4
11
10
9
8
7
6
13
12
Figure 4: Every two linked nodes are supported (they have at least one neighbor in common),
while the middle five nodes each have many neighbors who are not connected to each other.
Across various definitions, social networks tend to exhibit higher correlations in local
linkings than would be predicted by a model in which links are formed independently across
pairs of nodes at random. For example, Newman (2003) discusses several large coauthor
networks and finds total clustering coefficients of 0.496 for computer science - so that on
average almost 50 percent of the coauthors of a computer science researcher in the data are
coauthors of each other - and 0.43 for physics. Note that, given the sparsity of these networks
(i.e., low link densities overall), the clustering coefficients would be dramatically smaller if
there were no correlations in presence of links across triads of nodes.
We note that clustering and support, although inherently local phenomena, are often
measured in the aggregate. Nonetheless, as their implications for behavior operate on a local
level, we find it more natural to think of them in the ’micro’ category. In particular, these
sorts of local patterns of interaction are important in providing incentives for individuals
to behave in certain ways, as such patterns determine who is aware of a given individual’s
behavior. For instance, if a person cheats another person and they have a friend in common,
then that friend in common can react with some punishment, as we discuss in more detail
below.
In principle, the intuitive notion of clustering is aimed at capturing the extent to which
links tend to gravitate to bring sets of nodes into close contact with others, where ’close’
manifests both as short path lengths as well as the presence of redundant paths. For the
12The importance of clustering traces back to the pioneering social network research of Simmel (1908).
Coleman (1988) provides specific discussion of the role of clustering (or more general forms of ‘closure’) in
enforcing social norms.
14

most part, the statistical measures that have been developed to capture clustering tend to
focus on triads – groups of three nodes at a time. While certainly useful, it seems reasonable
to conjecture that clustering in a graph may have features that cannot be captured by such
measures. Thus, one possible direction for research is to develop other ways to meaningfully,
yet parsimoniously, capture the extent and consequences of clustering.
3.2.2 Centrality Measures
A second sort of micro analysis relates to the centrality of a node in a network. This may
relate to a node’s potential power, influence, or prestige. While related, it must be noted that
these are distinct concepts, and can differ across applications, and thus there are numerous
different measures of ‘centrality’, each having its own importance and logic. In particular,
there is a taxonomy of four major classes of centrality measures (see Jackson (2008a)). A
basic one is (i) simply counting how many connections a given node has, or its degree. This
may be thought of as a sort of measure of the popularity of a node, and can also capture
other aspects, depending on the setting. But there are also many richer definitions that
keep track of: (ii) how close a given node is to others, on average, or (iii) whether a given
node is a critical connector lying on paths between other nodes, or (iv) the extent to which
a given node is well connected to other important nodes. In this last case, ’importance’
immediately becomes a recursive notion, as the importance of one’s neighbors is a function
of the importance of their neighbors, and so on. These sorts of centrality or importance
measures have important implications for the seeding of diffusion processes, or a node’s
impact as an intermediary in various transactions, as we discuss below.
As with clustering, the various measures that the literature has proposed for capturing
centrality have been very useful, but are not yet comprehensive – certainly continued research
will develop further aspects of centrality. The intuitive goal is to capture how important
a given node is by virtue of its position in the network. Of course, ’importance’ is highly
dependent on context. If one is studying epidemiological diffusion, then the measure needs to
capture the extent to which a node contributes to the spread of a disease. On the other hand,
if one is studying a game with local complementarities, importance may instead be aimed at
the extent to which one individual’s actions influence the actions of many other agents. In
principle, the range of centrality notions is potentially as broad as the range of applications
one considers. This leaves much room for methodological studies that characterize various
centrality measures in terms of the properties they satisfy, and to propose new measures as
well (see, Dequiedt and Zenou (2014); Bloch, Jackson, and Tebaldi (2015) for some recent
examples). We discuss how distinctions between centrality measures are becoming evident
from empirical studies in Section 7.
15

3.2.3 Tie Strength and Multigraphs
In many studies, both empirical and theoretical, connections between individuals are coded
as binary quantities: either present or absent. In many contexts, such a formulation is
adequate to capture the phenomena that one wants to understand, and given advantages of
tractability this is expedient. On the other hand, binary links are clearly an abstraction. In
some contexts, forcing the relationship between two individuals to be either ’on’ or ’off’ may
obscure important aspects of the process under consideration. For example, if one is studying
opinion formation, it may be that a given individual pays attention to a number of sources,
but puts significantly more weight on the opinions of some contacts relative to others. In
this case, it would be important to capture the heterogeneity in these links. Generally, the
way this is done is to allow links to have weights, or strengths. Then, one can, for example,
capture the network by writing down a matrix where each element captures the intensity of
the link from one node to another (and so it is also quite natural to accommodate directed
links, in which the relationship from one node to another is not necessarily reciprocal).
One simple way to incorporate a basic form of link heterogeneity is to allow for a simple
distinction between ’strong’ and ’weak’ links. In fact, such an approach has been quite
influential, especially from an empirical perspective. In the pioneering work of Granovetter
(1973) and Granovetter (1974), it is argued that weak ties can be of particular importance
in passing information, as many job referrals (and hence, ultimately, jobs themselves) are
passed through weak ties with significant frequency – individuals who are acquainted but
do not have a close personal relationship can, and often do, provide valuable information to
each other.13
Another way in which one can enrich the coding of a network is via a multigraph; i.e.,
by keeping track of multiple sorts of relationships. A person may have one person from
whom she would ask to borrow money, and a different friend to whom she would turn for
advice; or these two relationships might be layered on top of each other. Many network
data sets include multiple sorts of relationships (e.g., Banerjee, Chandrasekhar, Duflo, and
Jackson (2013)), which can encode richer information than just whether two people are
close or not. Furthermore, this can be a very different distinction than thinking in terms of
a strong/weak dimension, as it could be that a pair who share only one type of relationship
interact regularly and frequently and have a ‘strong’ relationship, and another pair who share
multiple relationships interact very infrequently and may be thought of as having a ‘weak’
connection.
Related to the strength of connections is a consideration of the timing of interaction in
relationships. The frequency with which people interact can vary both across relationships,
13Weak ties have also been shown to be important in criminal behaviors (Patacchini and Zenou (2008))
and migration decisions (Giulietti, Wahba and Zenou (2014))
16
exhibiting significant heterogeneity across the population,14 as well as with time, so that they
may be nonstationary. There is some evidence that interactions exhibit nonstationarities
(e.g., Barabasi (2011)), and understanding the dynamics of interactions is an increasingly
active area of research.
3.3 The Blur Between Micro and Macro Measures
Before proceeding, we point out that, as one might expect, our macro and micro distinction
is not always completely clear cut. For instance, some centrality measures that are used in
a micro analysis involve aspects of the entire network. Thus, although we might be focusing
on how some individual’s position matters - a sort of micro analysis - the relevant measure
of that person’s position could be based on information about the network that extends
beyond that individual’s local neighborhood. Thus, although the focus may be micro, it
still could involve some global aspects of the network. Hence, the distinction is not always
a bright line. Nevertheless, it is still useful to distinguish whether one is examining the
roles of specific nodes or neighborhoods (a micro/local/individual feature), as compared to
overall structure of the network (a macro/global/aggregate feature), even if characterizing
that person’s position in the network requires some broad network information.
4 A Basic Macro Analysis of Network Structure and
Behavior: Density and Degree Distributions
Network density, referring to the total number (and weights, if relevant) of links in a graph,
is a basic and fundamental property. Its properties have implications across a wide range of
settings, including contagious diseases, industrial organization, research and development,
security and vulnerability, and various diffusion processes. In order to provide some focus to
our exposition, we discuss the important implications of network connectivity for diffusion,
one of the most prominent and pervasive applications of network analysis, as it illustrates
many of the important insights. These insights have wide implications to more specific
topics related to diffusion including learning, epidemics, opinion formation, and financial
contagions.15 This wide applicability is in large part responsible for the significant interest
in exploring diffusion processes.
In a canonical diffusion process, a disease, piece of information, behavior, opinion, or
product is introduced to a small fraction of the population. Let us focus on the case of a
disease, which then spreads through the population across links in the network, according
14In fact, basic frequency was part of Granovetter’s operational definition of strength.15For a survey see Jackson and Yariv (2011).
17

to a given process. There may also be a decay process such that the disease dies off from
infected individuals at some rate. One wants to understand if the disease eventually dies
out, or instead if it becomes endemic in a population and, if so, what proportion of agents
remain infected.
Not surprisingly, the density of connections in a network is well-known to be a critical
determinant of the contagion of communicable diseases and of the diffusion of a new product.
A fairly obvious effect is that denser networks, all else held equal, enhance contagion and
diffusion processes (Anderson and May (1992), Rogers (1995), Colizza and Vespignani
(2007)). Greater numbers or frequency of interactions lead to increased opportunities for
spreading diseases, information, and experiences. This conclusion has recently been estab-
lished for a variety of diffusion processes (Jackson and Rogers (2007b), Lopez-Pintado
(2008)) and confirmed via careful statistical analyses of some processes in field studies of
learning and diffusion (e.g., Alatas et al. (2013)).
One important aspect of contagion outcomes is in terms of comparative statics in the
network structure. If we compare a diffusion process on two different networks, how does
the diffusion depend on how the two networks compare in terms of connectivity, all else held
equal? It turns out that diffusion processes often exhibit sharp phase transitions: there is
a critical threshold in connectivity such that on networks with connectivity slightly below
that level a diffusion may die out and not take hold in a society, whereas slightly above that
threshold the diffusion can be extensive. It is thus possible that two societies with slightly
different densities could experience very different responses to the same diffusion process
(e.g., Watts (2002); Lopez-Pintado (2008)).
One can see some of the basic insights behind this sort of phase transition in the original
random graph formation models of Solomonoff and Rapoport (1951) and Erdos and Renyi
(1959, 1960) (see Bollobas (2001) for details). In that framework, links are formed indepen-
dently across pairs of nodes according to a given probability. One of the important objects
of analysis in that framework is the existence and size of a giant component – a component
of individuals who are path connected and comprise a majority of individuals in the network
– as the group size gets arbitrarily large. As already mentioned, the emergence of a giant
component occurs sharply across a threshold in the probability that links are formed, treated
as a function of the size of the population. This probability is the relevant notion of density
for this model. The interest in the giant component, for our purpose, is that when link
probabilities are low enough that a giant component fails to exist, then the possibility for
diffusion to a large portion of the society is naturally limited by the component structure of
the network and, in particular, the fact that any two agents are very unlikely to have a path
connecting them in the graph. On the other hand, when there is a giant component, then
18

widespread diffusion can occur.16
While studying how changes in the density of a network impact a diffusion process delivers
intuitive results, it is important to clarify what is meant by density. In a world in which
every agent is treated identically, the notion of density is straightforward: the number of
connections per agent (per time) is a simple measure. However, in a world with heterogeneity
in terms of numbers of connections, the notion of density must be treated more carefully.
Knowing only that one society has a greater average connectivity than another does not
necessarily allow one to conclude that it is more conducive to diffusion. One can make
distinctions in cases where there is an unambiguous comparison, for instance, in which all
nodes have increased connectivity. More generally, one has to be able to make comparisons of
the distributions of connectivity. Without clear cut comparisons it could be that some nodes
have greater connectivity and conductivity, while others less so. The comparative static
that often allows one to pin down the effects on diffusion is a strong one: that of first order
stochastic dominance of the degree distribution, in which, for every possible absolute level of
connectivity, the proportion of agents who are at least that well connected rises. The sort of
results mentioned above in terms of increased density leading to increased diffusion typically
apply to networks that are ordered in the sense of first order stochastic dominance.17 It
is important to note that, since stochastic dominance is a very structured relationship, it
is not nearly a complete ranking: it fails to rank many pairs of distributions, thus leaving
open the question of how a diffusion process may respond to general changes in the degree
distribution.
Even though this notion of density operates on the distribution of connectivity in a
society, it is still concerned essentially with the aggregate level of connections. Some less
expected insights of how network structure impacts diffusion and contagion processes are
not associated with the aggregate connectivity of a network, but rather of changes in the
distribution of connectivity. In order to emphasize this distinction, much of the literature
16One can tune the link probability to incorporate a probability that two connected individuals would
communicate with each other. For instance, an agent might have thousands of acquaintances, but might
only interact with dozens of them during a limited time period in which he or she is contagious. From
that perspective, tuning link densities to represent the number of per-period interactions would be the right
approach for an empirical estimation. Modern epidemiological models are quite intricate, tracking travel
patterns and geography, heterogeneity in individuals, and institutions like interactions via cafeterias, mass
transportation, health care, and others - mostly via simulation due to limited tractability. But some of the
basic insights from random graph models still underlie those models.17Studying 631 villages in Indonesia, Alatas et al. (2013) have verified that if a network’s degree distri-
bution first-order stochastic dominates another’s distribution, then there is better information aggregation
on poverty status within the network, i.e. there will have an overall lower error rates in ranking the income
distribution of the people in the network - consistent with earlier theoretical predictions (e.g., Jackson and
Rogers (2007b)).
19

has focused on changes that are independent of average connectivity in society. Consider
the notion of a mean-preserving spread, which increases the variation in connectivities while
holding fixed average connectivity. This has the effect of increasing the prevalence both
of highly connected agents and also of poorly connected agents, leaving fewer agents with
near-average connectivity.
When the interaction pattern changes according to a mean preserving spread, society is
characterized by a greater prevalence of both higher-than-average and lower-than-average
connected nodes. So, more nodes in the graph of connections will be highly connected hubs,
but also more nodes will be poorly connected. How will a society’s susceptibility to diffusion
change as a result of these opposing forces?
One main finding is that a mean-preserving spread can increase the susceptibility of
a population to contagion and diffusion. This kind of result leverages the fact that highly-
connected nodes serve as hubs of transmission, for two separate reasons. First, they are quite
likely to come in contact with the diffusion by virtue of their high level of exposure. Second,
they are then likely to spread the transmission to many other agents. These effects are often
stronger than the countervailing effect that poorly connected nodes become harder to infect
and less likely to transmit the diffusion. From these intuitions, one can see that the presence
of even a few highly connected hubs can serve to keep a contagion active quite robustly.
This conclusion has been reached in the context of simple contagions (Pastor-Satorras and
Vespignani (2001)), more complicated diffusions that involve strategic complementarities
such as in new product adoption (Jackson and Yariv (2005); Jackson and Rogers (2007b);
Jackson and Yariv (2007); Lopez-Pintado (2008); Galeotti et al. (2010)), and has even been
found to enhance a population’s ability to coordinate its actions in voting settings (Kearns,
Judd, Tan, and Wortman (2009)).18
Note that, even when a society becomes more susceptible to a contagion process as a
result of a mean preserving spread of the degree distribution, it is not obvious that one
should generally expect a higher prevalence. That is, there may well not be a clear sense in
which a mean preserving spread unambiguously translates into “higher” diffusion outcomes.
The reason goes back to the higher proportion of poorly connected nodes along with the
additional hubs. It can well be that a mean-preserving spread makes it easier for a society
to sustain a diffusion, due to the increased role of hubs, but at the same time, it lowers the
expected prevalence of the diffusion, since there are more hard-to-reach nodes (see Jackson
and Rogers (2007b)). In this case, the society is more susceptible to contagions remaining
18A general approach to using stochastic dominance of degree distributions to rank contagion and diffusion
processes was developed in several contexts by Jackson and Yariv (2005); Jackson and Rogers (2007b);
Jackson and Yariv (2007) (see more discussion in Jackson and Yariv (2011) and further development in
Lamberson (2011)).
20

endemic, as the hubs are continually being infected and spreading it to others, but a high
proportion of the population is nonetheless only rarely infected, as the exposure of poorly
connected nodes is very limited. So there can be a sense in which the contagion actively
infects a small proportion of agents, creating a strong disparity in outcomes for agents as a
function of their positions in the network.
There is great scope in how one defines the specific ingredients of a diffusion process,
depending on the features or applications one wants to consider. For example, one can
allow diffusion to occur independently along links, as a function of the total number or the
proportion of an agent’s neighbors that are infected, and so forth. This applies in settings
such as simple disease settings where the probability of infection increases linearly in the
probability of contact with an infected individual.19
More generally, there are many settings in which there are richer aspects to how diffusion
occurs on a local level. For instance, in the the case of technology diffusion, a given individ-
ual’s behavior might depend on which technology the majority of an individual’s neighbors
use. Network structure and link densities still matter in fundamental ways, but the specifics
at a micro-level then hinge on the details of how diffusion from one node to another de-
pends on the local interaction. There is a growing literature on such strategic interactions in
networks (e.g., Jackson and Yariv (2007); Lopez-Pintado (2008); Galeotti et al. (2010)),
which is surveyed by Jackson and Zenou (2015).
Consider, for example, incorporating the possibility of costly immunization into an anal-
ysis of disease diffusion. If agents can choose to immunize before the diffusion process takes
hold, the results on density and degree distributions can change dramatically. The idea is
that, if the density of connections increases, then the incentive to immunize increases as well.
The higher density puts upward pressure on diffusion, but the higher immunization rate puts
downward pressure on immunization. The combined effects in equilibrium can result in a
lower prevalence in the denser society.20 More generally, it is clear that the incorporation of
agents’ incentives into diffusion models is important and will produce insights that go beyond
the existing conclusions that rely more on exogenous decision rules. Indeed, consider the
choice of an individual who has to decide whether or not she wants to receive a vaccination.
The optimal choice depends on the choices of the people she is linked to. There is typically
imperfect information in that individuals have a good sense of the aggregate number of oth-
ers who make a similar vaccination choice, but do not know the identity of these people and
the ones with whom they are connected. In a series of laboratory experiments, Charness,
Feri, Melendez-Jimenez and Sutter (2014) show that players tend to vaccinate if their degree
19There is also the consideration of recovery, and of the possibility of latent states such as contagion
without active infection, which have been modeled in the epidemiology literature.20Papers that contribute to this line of modeling and derive such a result include Geoffard and Philipson
(1997), Kremer (1996), Toxvaerd (2012), and Galeotti and Rogers (2013).
21

is above a certain threshold and less otherwise, and, moreover, that the frequency of active
players increases with connectivity.
Much of the literature, and hence our discussion, has discussed the eventual, or steady-
state outcomes of diffusion processes. Beyond such a consideration, one may also be in-
terested in the dynamics of the diffusion process itself, that lead through some time path
to a steady-state outcome. Which networks will be susceptible to faster contagions? One
property here that is important is the path lengths connecting agents (recall the discussion
from Section 3.1.5). One would expect that nodes that are closer will pass information (or
behaviors) more quickly from one to another, and thus the steady-state may be reached more
quickly.
Redundancy in the network will also play an important role. That is, nodes that have
many distinct paths between them, as opposed to a unique path, are more robustly connected.
This becomes particularly relevant in situations where links are ‘active’ probabilistically. In
such a case one may wish to consider the probability that information diffuses from one node
to another. Redundant connections will increase this probability and hence make diffusion
more likely to occur.
In summary, some basic aspects of overall network structure, such as the distribution of
degrees, can have important consequences for a variety of processes, such as diffusion and
learning, in well-defined ways.
5 Characteristics of Nodes and Macro Patterns of In-
teraction: Homophily and Segregation
Next, let us turn to our second major ‘macro’ characteristic of a network: homophily and
segregation patterns. Examining the impact of homophily and its roots has been one of the
more active and interesting areas of recent study about how network structure relates to
behavior. There are a number of insights that can be found looking across this literature.
Most basically, homophily enables different patterns of behavior to persist across differ-
ent groups. When subjects repeatedly play games that involve coordination among multiple
equilibria, they often eventually coordinate successfully (e.g., Cooper, DeJong, Forsyth and
Ross (1990), Van Huyck, Battalio, and Beil (2011), Banks, Plott and Porter (1988)).
Conventions, which operate through social norms, can guide expected behaviors and help
people coordinate in settings in which there are multiple possible stable (equilibrium) out-
comes. Nonetheless, what is focal in the presence of multiple equilibria is not always obvious,
and one can then expect that different conventions or expectations might arise in different
cultures. In particular, with high levels of homophily, groups can become insular and then
22

sustain different conventions (e.g., Morris (2000)). It can also affect whether information
flows easily from one group to another or is impeded (e.g., Golub and Jackson (2012)).
This can have important implications for access to employment opportunities (Granovetter
(1974), Calvo-Armengol and Jackson (2004, 2007), Ioannides and Datcher-Loury (2004),
Jackson (2007), Bayer, Ross, and Topa (2008), Beaman (2012), Gautier and Holzner
(2013), Rubineau and Fernandez (2015), Zenou (2013, 2015a)), social mobility (Calvo-
Armengol and Jackson (2009), Munshi and Rosenzweig (2009)), marriage markets (Skopek,
Schulz, and Blossfeld (2011)), health behavior (Centola (2011)), and educational achieve-
ment (Calvo-Armengol, Patacchini and Zenou (2009)). Shared history and expectations
allow people from a similar background (homophily), when connected, to predict each oth-
ers’ behaviors and what they might anticipate as focal, and that facilitates coordination;
whereas interacting with people from different cultures can lead to costly miscoordinations
in behavior (Jackson and Xing (2014)). In laboratory settings, people do indeed play differ-
ently in simple games such as ultimatum, dictator, and public good provision depending on
their cultural background - with subjects deviating from self-interested play and with some
levels of cooperation dependent upon their backgrounds (Henrich, Heine, and Norenzayan
(2010)).
Another important insight is that homophily has countervailing effects on diffusion pro-
cesses. On the one hand, increased density within groups accelerates diffusion and learning
within a group, but then the decreased interactions across groups can slow broader spreads.
This sort of pattern is found in recent laboratory experiments on coordination of behavior
(e.g., voting, Kearns, Judd, Tan, and Wortman (2009), trust, Goeree et al. (2010), Cur-
rarini and Mengel (2012)), in a field experiment on the convergence of political opinions of
French students (Algan et al. (2015)) and also is seen in theoretical results on learning pro-
cesses (Golub and Jackson (2012), Dandekar, Goel, and Lee (2013)) and diffusion processes
(Jackson and Lopez-Pintado (2013)). What is perhaps most interesting is that homophily
can actually enhance widespread diffusion. For instance, by having more homophily one
might actually increase the likelihood of a society-wide diffusion: increased density within
groups allows a process to get a toe-hold and incubate within a group, and then eventually
spread to a larger population (Jackson and Lopez-Pintado (2013)), whereas in a less ho-
mophilous society, there may not exist dense enough clusters of relationships to foster the
diffusion reaching critical mass in the first place.
There are also interesting interactions between homophily and geographic segregation.
There is some evidence that even slight ethnic preferences in friendships and social inter-
actions can lead to separation in a geographical space (Schelling (1971), Cutler, Glaeser
and Vigdor (1999), Patacchini and Zenou (2015)). The essential insight, first exposed by
Schelling (1971), is that once the minority (e.g., racial) share in a neighborhood exceeds a
23

critical tipping point some majority group members may have a (slight) preference to leave
(see also Card, Mas, and Rothstein (2008)). This can then start a cascade in which other
majority members move out as the racial composition shifts even further. This implies that,
with only a modest preference of the racial majority to live next to others who are similar
could result in nearly complete residential segregation, because of the instability of interme-
diate points where one agents residential location depends on the actions of other agents in
the neighborhood. As a result, because of this kind of homophily-driven behavior, even a rel-
atively small fraction of minority agents could cause the neighborhood to tip from essentially
a majority neighborhood to completely minority one. This phenomenon can help explain
the distinctive American pattern in which blacks live in cities and whites in suburbs.21 In
the labor market, homophily isolates minority workers from workers of the majority group,
which reduces their chance of finding a job (Battu, Seaman and Zenou (2011)).
Financial contagion is also an important topic where ‘homophily’ (in the form of specific
correlations in the interaction structure of organizations) offers some insights. Indeed, since
the recent financial crisis, the discourse about bank safety has widened from viewing the
riskiness of financial institutions as individual firms to measuring and understanding systemic
risk. Interconnections among financial institutions create potential channels for contagion
and amplification of shocks. Furthermore, the way the institutions are financially connected
is crucial for understanding the risk exposure of the system as a whole where shocks to some
of its parts can develop into a wider breakdown of banks and financial institutions through
cascades of insolvencies and domino effects (see Gai, Haldane, and Kapadia (2011)).
Consider, for example, four banks located in four different regions that are linked through
their balance sheets and that face negatively correlated liquidity shocks (Allen and Gale
(2000)). In such a situation, it can be optimal for banks to hold part of their deposit base in
other regions to provide liquidity in times of elevated liquidity demand in their own region.
In the case of a banking crisis in one region, the claims of other banks on this region lose value
and can cause a banking crisis in the adjacent regions. The crisis can gain momentum and
spread in a contagion effect to all regions. As a result, contagion can spread more easily if the
network topology has the form of a circular exposure of one region against its neighboring
regions. On the contrary, if the regions are fully connected, the network is more resilient in
absorbing losses. More generally, financial contagion can exhibit a form of phase transition as
interbank connections increase: as long as the magnitude and the number of negative shocks
affecting financial institutions are sufficiently small, more complete interbank claims enhance
the stability of the system (Allen and Gale (2000), Freixas, Parigi, and Rochet (2000)).
21American metropolitan areas are segregated by race, both by neighborhood and across jurisdiction lines.
In 1980, after a century of suburbanization, 72% of metropolitan blacks lived in central cities, compared to
33% of metropolitan whites (Boustant (2010)).
24

However, beyond a certain point, such interconnections start to serve as a mechanism for
propagation of shocks and lead to a more fragile financial system (Acemoglu, Ozdaglar,
and Tahbaz-Salehi (2015), Elliott, Golub and Jackson (2014).22 In sum, there are strong
connections between the financial network architecture and the likelihood of systemic failures
due to contagion of counter-party risk (Cohen-Cole, Patacchini and Zenou (2015)).23
Because people often make deliberate choices when forming links, the empirical tests of
the issues mentioned above and their policy implications are difficult because of the possible
endogeneity of the network. The specific concern is often that individuals have unobserved
characteristics that are associated with their outcomes, and that these characteristics are
also associated with the decision to establish links. The precise mechanism that is often
articulated assumes that individuals exhibit homophily in these unobserved characteristics,
making it more likely that individuals with similar characteristic values form links. If these
characteristics are also correlated with the outcomes, researchers will find that individuals
who are connected have correlated outcomes even without true peer effects. For example,
a correlation between the individual and the peer-school performance may be due to an
exposure to common factors (e.g. having good teachers) rather than to social interactions.
We will address this endogeneity issue below (see Section 8) and will argue that having a
structural approach explicitly modeling homophily behaviors can be very helpful in dealing
with this issue.
22Consider a set of organizations (for instance, countries, industries, or sectors) linked through a network of
financial interdependencies where segregation (homophily) among different segments of the economy prevails.
This means that the relative intensity of nodes’ connections with others can vary between their own group
and other groups. This captures the difference between integration across industries and integration within
industries. It can be shown (Elliott, Golub and Jackson (2014)) that increasing homophily can eventually
sever connections between groups of organizations and lead to lower financial contagion. This is because
lower-degree networks fragment at lower levels of homophily than high degree networks. So at high levels of
homophily, lower-degree networks can actually be more robust.23Modeling network topology and default cascades helps identify critical institutions in a banking system.
For instance, one can provide a measure of resilience that allows for a given network to predict the spread
of distress (Amini, Cont, and Minca (2012, 2015)). One can also determine a threat index, which measures
the decrease in payment within the banking system following a reduction in net worth at one institution
(Demange (2011)). The latter is related to the intercentrality measure of the key player (Ballester, Calvo-
Armengol, Zenou (2006), Zenou (2015b)) described in Section 7 below. In both cases, it would optimal to
target the institutions with the highest threat index and/or the highest intercentrality measure. Targeting
these key banks may not necessary mean restricting their number of connections because it could result in
a financial architecture that is less efficient, more fragile, and harder to monitor (Gofman (2013)).
25

6 Micro Analyses: Clustering and Local Interaction
Patterns
Having discussed the effects of large-scale network structure on aggregate behaviors and
outcomes, we now turn to focus more on individual outcomes. For example, in the previous
sections, we were more concerned with the total prevalence of a diffusion process, whereas the
local counterpart to that question is an assessment of the likelihood that a given individual
will be infected, as a function of her local neighborhood in the network.
There are at least two different ways in which local patterns of social networks, in par-
ticular having ‘tightly-knit’ groups, relate to behavior. One is that information travels
quickly and reliably among tightly clustered groups of people. For instance if any individual
misbehaves and his or her friends are all friends with each other, then if that news flows
stochastically through the links in the network, this can lead many of his or her friends to
quickly hear that news. In contrast, if the individual’s friends do not know each other, then
it can be that many of his or her friends never hear the news. One may be interested in
the flow of information per se, but it could also be that the flow of information is impor-
tant for strategic reasons. A second, somewhat related, effect is that groups of individuals
who are tightly knit and all friends with each other can collectively ostracize an individual
and enforce social norms and behaviors. The local patterns of friendships are thus not only
important in how information about behavior spreads, but also in how people are able to
coordinate in responding to a behavior.
These aspects of social networks are related to basic theories of social capital (e.g., Cole-
man (1988), Putnam (2000)) that posit that closure and strongly reinforced relationships
help foster cooperation. Those theories, however, have only recently been formally modeled
and analyzed directly, rather than in some reduced form. A series of recent studies have pro-
vided detailed theories of exactly how structures of relationships might influence behavior,
and which specific sorts of patterns in social networks we should be looking for in deter-
mining whether a society is well-adapted to fostering cooperative behaviors. In particular,
there are several studies (Bloch, Genicot, and Ray (2008), Lippert and Spagnolo (2011),
Jackson, Rodriguez-Barraquer and Tan (2012), Ali and Miller (2012, 2013)) that have
explored how having friends in common and other local clique structures can help enforce
cooperative behavior.24 The literature has investigated both how this works through com-
munication, patterns of ostracism (Jackson, Rodriguez-Barraquer and Tan (2012); Ali and
Miller (2013)), as well as social collateral (Karlan, Mobius, Rosenblat, and Szeidl (2009)).
Let us begin by discussing in a bit more detail the idea that social networks that are highly
24This is a network embodiment of some related ideas of Ostrom (1990) of community monitoring and
enforcement.
26

clustered can enhance communication among the friends of a given individual. If networks are
highly clustered, then if an individual misbehaves information can quickly come back to that
individual’s friends. Networks where a given individual’s friends are friends with each other
allow for such fast communication and coordination, helping to react to a given individual’s
misbehavior in a timely manner. For instance, to ensure that individuals contribute to
some public good, or provide costly favors to others, and are generally cooperative, those
individuals are rewarded with high future payoffs from good behaviors and punished with low
future payoffs for bad behaviors. These rewards and punishments are then provided through
the actions of that individual’s friends and neighbors. If those friends and neighbors are made
quickly aware of the individual’s behavior, then they can react quickly. This is important
for providing the right incentives, as the threat of a punishment in the near future will have
the greatest scope for disciplining behavior. If instead, individuals can ‘misbehave’ with
few people observing the behavior in a timely manner, then it becomes difficult to provide
incentives for individuals to behave according to some desired social norm. Networks that
look more like trees can enable an individual to misbehave in some relationships, and never
have that information come back to affect other relationships (Raub and Weesie (1990),
Lippert and Spagnolo (2011), Ali and Miller (2012, 2013)).25
The second insight is that a pair of individuals who exchange favors or who enter into
some other sort of non-binding relationship can have stronger incentives to behave efficiently
if they have friends in common, i.e. the notion of support discussed in Section 3.2.1 above.
Those common friends can react to a misbehavior (in an incentive compatible manner) by
ostracizing the individual, and thereby providing incentives for that individual to behave
cooperatively/efficiently. Without considering any issues of information passing, there is
also a question as to how a society must be structured so that if an individual fails to
provide favors when asked, the subsequent “punishment” leads to minimal disruptions in
the cooperative behavior in the society at large. If two individuals have friends in common,
then when one of them fails to provide a favor to another, i.e., going against an efficient
social convention, then those friends in common can refuse to provide future favors to the
individual who failed to provide the favor. This requires only “local” disruptions in the
efficient cooperation in a society, and need not affect other parts of the society, whereas
without such local structures contagion of the breakdown of cooperation might spread more
broadly. Indeed as found by Jackson, Rodriguez-Barraquer and Tan (2012) for 75 villages in
southern rural India, one sees a very high level of favor exchange relationships in which there
25Beyond the basic idea that information flows help in enforcing behavior there are interesting questions
of incentives to pass information about misbehavior Ali and Miller (2012, 2013). For example, reporting
misbehavior can lead to costly breakdowns in cooperative behavior, and so incentives also need to be balanced
so that individuals observing some misbehavior have proper incentives to tell others rather than to cover it
up.
27

are friends in common that support that relationship, and this support can be more prevalent
when the relationships in question involve explicit favor exchange rather than being more
purely social. They also find that the level of support is significantly higher than what would
arise if links were formed at random and significantly higher than levels of clustering. There
are also studies that suggest micro-network characteristics are related to money transfers
and loan repayments (Karlan, Mobius, Rosenblat, and Szeidl (2009, 2010); Blumenstock,
Eagle and Fafchamps (2011); Alatas et al. (2013)) as well as risk-sharing (Bloch, Genicot,
and Ray (2008), Ambrus, Mobius, and Szeidl (2014), Alatas et al. (2013)).
A different insight concerning how local patterns of networks influence behavior has less
to do with incentives, but rather concerns behavior reinforcement. In particular, high cluster-
ing can have effects on diffusion in which behaviors exhibit complementarities. In situations
where behaviors have high levels of complementarity (for instance, when an individual re-
quires that many of his or her friends adopt a behavior before being willing to do so as well),
high clustering can enable the behavior to be adopted at a local level. If the network is
properly intertwined in terms of its local neighborhoods, then this can enhance ultimate dif-
fusion. For example, by studying the spread of health behavior through a network-embedded
population by creating an Internet-based health community, containing 1528 participants re-
cruited from health-interest World Wide Web sites, Centola (2010) shows that a network
with more clustering is advantageous, even if the network as a whole has a larger diameter.
Individual adoption was much more likely when participants received social reinforcement
from multiple neighbors in the social network. The behavior spread farther and faster across
clustered-lattice networks than across corresponding random networks.
The full understanding of the importance of local structure of networks is still in its
infancy, as detailed studies of how these structures facilitate and reinforce information flows,
and also provide incentives for behavior, have only recently emerged. It is also worth noting
that useful measures of local structure should extend well beyond clustering and support,
as other aspects of the neighborhoods of a node or link are important in reinforcements
of behaviors, for instance. A good measure should ultimately be behaviorally important,
analytically tractable, and lend itself to computation in applied work.
7 Micro Analyses: Centrality and Behavior
Another important area in which ‘micro’ analyses of networks have been very useful is in
understanding the role of individuals in learning, contagion, and diffusion processes; as well
as understanding how differences between individuals might arise. Studying these topics
involves defining an individual’s importance, influence, or centrality in a network.
As already discussed, there are many ways of measuring individual centrality in a network
28

(see Wasserman and Faust (1994) and Jackson (2008a) for overviews). Conceptually,
centrality is fairly straightforward: we want to identify which nodes are in the “center” of
the network. In practice, identifying exactly what we mean by “center” can be complicated,
and often it is attempting to get at issues of power or influence.
As mentioned above, there are roughly four different ways of measuring node centrality:
connectivity, closeness, intermediation, and having well-connected neighbors. The simplest
index of connectivity is the number of direct links stemming from each node in the network,
also known as the degree of a node. Closeness and decay centrality are measures of how close
an agent is to all other agents in the network. The most central agents can quickly interact
with all others because they are close to all others. These measures of centrality capture how
easily an individual reaches others, i.e., how informed a given individual is in the context
of information flows. Intermediation is also clearly important is measuring centrality. This
is what betweenness centrality captures. It is indeed equal to the number of shortest paths
between all pairs of agents that pass through the given agent. In other words, an agent
is central, if she lies on many shortest paths among other pairs of agents. Betweenness
centrality captures the importance as an intermediary in this sense. Such central agents
have control over the flow of information in the network and it is related to the notion of
structural holes developed by Burt (1992), who postulates that social capital is created by a
network in which people can broker connections between otherwise disconnected segments.
The last class of centrality measures puts forward the importance of being connected to well-
connected agents. This is what characterizes eigenvector centrality, which assigns relative
scores to all agents in the network based on the concept that connections to high-scoring
agents contribute more to the score of the agent in question than equal connections to low-
scoring agents. It thus captures indirect reach so that being well-connected to well-connected
others make you more central. Google’s early versions of PageRank (Page, Brin, Motwani,
and Winograd. (1998)) were a variant of the eigenvector centrality measure. Similarly, Katz-
Bonacich centrality (due to Katz (1953) and Bonacich (1987)) takes all possible paths in a
network (not only the shortest ones) but puts a lower weight to links that are further away
from the agent. As a result, Katz-Bonacich centrality captures the influence on friends and
on their friends.
As these different measures capture fundamentally different aspects of the position of a
node in a network, they have different uses when trying to understand how a node’s posi-
tion relates to different behaviors. The idea that more central people may exhibit different
behaviors from less central people appeared early in the literature, both in terms of theory
(e.g., Simmel (1908), Katz and Lazarsfeld (1955), Burt (1992)) as well as in empirical ob-
servations (Coleman et al. (1966)).26 More recent data have enabled much cleaner studies of
26For example, Mehra, Kilduff and Brass (2001) find that workers with higher betweenness centrality
29
such effects, and allowed researchers to understand the workings of centrality in much finer
detail. For example, Christakis and Fowler (2010) combine Facebook data with observations
of a flu contagion, showing that individuals with more friends were significantly more likely
to be infected at an earlier time than less connected individuals.27
More generally, better-connected individuals are subjected to greater complementarities
in behaviors, and also exude greater influence. The combination of these effects, for example,
is seen in a tractable model of how behavior depends on network positions by Ballester,
Calvo-Armengol, Zenou (2006), which has been the foundation for empirical investigations
that have found evidence that individual position in a network can have significant effects on
an individual’s education attainment as well as on that individual’s friends (Calvo-Armengol,
Patacchini and Zenou (2009)). More general models of interactions with complementarities
make broad predictions about how individual behavior depends on position in a network as
well as how that translates into overall behavior in the network (Galeotti et al. (2010)),
and some of those predictions have recently been confirmed in laboratory settings (Charness,
Feri, Melendez-Jimenez and Sutter (2014)). Indeed, in an environment in which the agents
are uncertain about the precise network structure, the latter show in a series of experiments
that, in the presence of strategic complements, players are active if their degree is above a
certain threshold and inactive otherwise. They also show that the frequency of active players
increases with connectivity.
Which measure of “centrality” or “influence” is appropriate to predict behavior depends
on context. An interesting example was the rise to prominence of the Medici family in
15th century Florence, as discussed by Padgett and Ansell (1993).28 The family was not
the wealthiest nor the most politically prominent. Nonetheless, they eclipsed other families
partly by leveraging their position in the network as a central connector: with much higher
betweenness centrality than others. This provided them with important roles as an interme-
diary or broker, both politically and economically, sitting in a unique position to mobilize
other families. Interestingly, the Medici do not stand out as dramatically by other centrality
measures. This does not mean that betweenness is a measure that performs well generally,
but that it can be very useful in settings where being a connector or an intermediary is
particularly important.
In models with behavioral complementarities, measures of a person’s centrality need to
incorporate aspects of the network beyond how many friends the individual has (i.e. degree
perform better in the workplace.27There are some exceptions to this insight. For example, if individuals strategically transmit information
(Hagenbach and Koessler (2010)), then they may deliberately hide information that they may not wish to
spread from better connected individuals, something that has been found in theoretical (Lee and Persson
(2010)) and empirical investigations (Banerjee et al. (2014)).28See Jackson (2008a) for more details on the centrality measures in this example.
30

centrality). For example, in cases in which there are strong complementarities in behaviors
such as in crime or education, Katz-Bonacich centrality has proven useful in describing
the activity of each agent (Ballester, Calvo-Armengol, Zenou (2006)). If, for instance, we
consider a game with complementarities where the utility depends on the profile of actions
in an appropriate (linear) way, then the best response mappings essentially become identical
to the centrality relationships, and equilibrium is characterized by the fixed point, which
is equivalent to the solution of equations from which centrality is derived. This should not
come as a surprise since, as stated above, the Katz-Bonacich centrality belongs to the a
class of centrality measures for which the centrality of an agent is recursively related to
the centralities of the agents she is connected to. This is clearly related to the fixed point
argument of the Nash equilibrium in actions since the best-reply function of each agent is
such that the action of an agent (i.e. his/her centrality measure) only depends on his/her set
of neighbors and their centralities. This is the central idea of the Katz-Bonacich centrality,
which mainly captures the importance of feedback and social multiplier effects.
Revisiting the crime example, the most central agents (in terms of Katz-Bonacich cen-
trality) in a given network are also the most active criminals. Quite naturally, this leads to
interesting policy implications in terms of crime reduction. One could target “key players”
in a network in order to reduce total crime. Specifically, if we could choose to push one
person’s criminal activity to 0 and remove all her existing links from the network, which
player’s removal would lead to the highest overall criminal activity reduction when account-
ing for equilibrium effects? Here again centrality measures can help in determining such a key
player. The intercentrality measure (Ballester, Calvo-Armengol, Zenou (2006); Ballester,
Calvo-Armengol, and Zenou (2010); Ballester and Zenou (2014); Zenou (2015b)), which
not only looks at how central an agent is, but also at how this agent contributes to the cen-
trality of others, helps define key players in networks. It turns out that, at least in theory,
the intercentrality measure is useful not only in reducing crime (Liu, Patacchini, Zenou, and
Lee (2012), Lindquist and Zenou (2013)), but also in determining which firm(s) should be
subsidized in R&D networks in order to maximize total activity (Konig, Liu, and Zenou
(2014)) or which bank(s) should be bailed out in order to avoid a financial crisis (Julliard,
Denbee, Li, and Yuan (2013)).
The usefulness of Katz-Bonacich related measures has also been confirmed empirically
in a context of peer effects. Looking at education performance of fourth graders in rural
Bangladesh, Hahn et al. (2015) randomly allocate these students to groups of four. They
show that, if a student (randomly) ends up in a group with high centrality, he or she tends
to perform better both individually and collectively. Hahn et al. (2015) also show that
the Katz-Bonacich centrality is a key determinant of this performance, and that other cen-
tralities, such as the betweenness and the eigenvector centrality, matter less. These results
31

and the ones mentioned above indicate that there is a class of centrality measures (Katz-
Bonacich, eigenvector and diffusion centrality) that can predict relatively well the impact of
peers on criminal and educational behaviors and can explain the importance of certain indi-
viduals in a diffusion process. Of course, the intercentrality measure (key player) is context
dependent, relies on estimating the peer-effect model, and may not be appropriate in other
contexts.
In contrast, when studying the diffusion of information, Katz-Bonacich centrality is not
always a strong predictor of which people are the most influential seeds for the process,
and other centrality measures outperform it. Indeed, in investigating microfinance diffusion
in 43 different villages, Banerjee, Chandrasekhar, Duflo, and Jackson (2013)29 find that
the degrees of the first contacted individuals (i.e. the set of original injection points in a
village) are not significantly correlated with the extent of the eventual diffusion, nor are
their Katz-Bonicich centralities. Instead, the eigenvector centrality of the initial injection
points, and a related, more general, centrality measure based directly on modeling diffusion
( ‘diffusion centrality’), are the only significant predictors of eventual diffusion in their data.
More generally, eigenvector-related centralities are have both theoretical and of behavior in
various settings including whether a society efficiently aggregates information (Golub and
Jackson (2010)), how much criminal activity a society engages in (Calvo-Armengol and
Zenou (2004), Ballester, Calvo-Armengol, and Zenou (2010)), and how a society can best
mitigate externalities (Elliott and Golub (2012)).
New studies of centrality are providing us with more knowledge about the similarities and
differences between different measures of centrality, and provide us with better ideas of which
ones might be appropriate for different applications. For example, Banerjee, Chandrasekhar,
Duflo, and Jackson (2014) show that degree, eigenvector, and Katz-Bonacich centralities
are all special cases (different extreme points) of the notion of ‘diffusion centrality’ that they
defined in Banerjee, Chandrasekhar, Duflo, and Jackson (2013). In particular, each of these
notions is defined via walks emanating from nodes, with degree just looking at walks of
length one and the others accounting for walks of all lengths emanating from a given node,
and diffusion centrality allowing for all variations in walk-length - thus nesting all three of the
other centrality notions. Furthermore, using the insight that eigenvector and Katz-Bonacich
centralities belong to the same class of centrality measures for which the centrality of an
agent is recursively related to the centralities of the agents she is connected to, Dequiedt and
Zenou (2014) propose an axiomatic characterization of these classes of centrality measures
using similar axioms for variations on the centrality measures, and Bloch, Jackson, and
Tebaldi (2015) provide characterizations for families of centrality measures including those
29See also Cai, de Janvry, and Sadoulet (2015) who study the influence of social networks on the decision
to adopt a new weather insurance product in rural China.
32

mentioned above and others - showing exactly what they have in common and how they
differ.
While centrality notations are useful to researchers, one might question whether people
embedded in a network, but unaware of its details could nonetheless identify highly central
people. If so, how might people come to know who is influential in their community? Using
data from the same villages in India, Banerjee, Chandrasekhar, Duflo, and Jackson (2014)
show that people living in these villages are fairly accurate at identifying those who are most
central in their villages. They also show that this ability can come from simply listening to
gossip through their networks: people hear information about others according to a simple
gossip process in proportion to those nodes’ abilities to diffuse information (according to
diffusion centrality) - and thus simply by naming people they hear about most frequently,
they can identify those best able to diffuse information.
While the notion that centrality matters in various diffusion and influence settings is long-
standing, the science of distinguishing how to best measure centrality and which measures
have consequences in which economic settings, is still maturing.
8 Endogeneity of Networks and Other Empirical Chal-
lenges
Having discussed some of the major insights from our taxonomy outlined in Section 3, both
empirical and theoretical, we now discuss some of the major challenges faced when doing
empirical analyses of behaviors and effects that occur in the context of social networks. A
prominent topic that falls into this category is that of peer effects, which arise in many
settings and impact a wide range of policy decisions. The estimation of peer effects and
other network processes are complicated by several factors, which we now discuss.
The challenges in accurately estimating interactive effects in networked settings include:30
1. Identification: a model of behavior on networks must be specified so that individuals’
influences on one another can be identified and distinguished from other sources of
influence.
2. Endogenous networks and homophily: people have proclivities to link to others similar
to themselves, both on observed characteristics and unobserved characteristics that
could influence their behavior. By failing to account for similarities in (unobserved)
characteristics, similar behaviors might be mistakenly attributed to interactive effects
30This taxonomy is drawn from a discussion by Jackson (2013) of a paper by Goldsmith-Pinkham and
Imbens (2013). See also Jackson (2014).
33

when they are actually due to underlying characteristics or exposure to common stim-
uli.
3. Computation: the set of possible networks is exponential in population size, which
raises substantial computational hurdles in modeling endogenous network formation as
the relative probability of seeing the observed network often needs to be compared to
other possibilities when estimating how the observed network of relationships depends
on observed and unobserved characteristics.
4. Measurement error: relationships are observed with noise and often only at specific
points in time, and so the observed network may be an imperfect proxy for the true
set of relevant interactions.
5. Misspecification: there are many different functional forms that could describe how
neighbors’ behaviors interact with each other, and seemingly small changes in the
model can lead to large changes in predicted behaviors, including omitting variables.
Several of these issues are well-studied in broader contexts, especially as some are not
unique to networked settings. Nonetheless, others are just beginning to be understood and
systematically addressed.
Let us discuss the first two of these challenges in the context of measuring peer effects
in education. For example, consider the estimation of how a student’s test scores or grades
depends on her own characteristics and the grades of her peers, as well as other potential
influences such as the characteristics of her peers.
A first challenge is the fact that the mutual interaction between behaviors can make it
difficult to disentangle the effects of individual and group characteristics from the influences
of each others’ behaviors. For example, an individual’s grades may depend on his or her peers’
grades, as well as on other background characteristics. But then the peers’ grades depend,
for their part, on the individual’s grades, which are also influenced by the characteristics.
The system of equations that is defined in order to sort out the precise interactions may
well be indeterminant. In the context of linear interaction models, this issue was termed the
reflection problem in an important paper by Manski (1993). There are various specifications
for the patterns of effects for which the potential indeterminacy can be overcome, including
ones in which the peer effects operate in nonlinear ways (see Brock and Durlauf (2000);
Blume, Brock, Durlauf, and Ioannides (2011) for detailed discussions). In particular, having
network information about the structure of the peer effects can enable identification, as then
the full feedback patterns pointed out by Manski (1993) can be disentangled by taking
advantage of the fact that different individuals have different sets of peers, and therefore
different exposures and net effects, as shown by Bramoulle, Djebbari, and Fortin (2009).
34

A major concern with the interpretation of estimates of the parameters of this type of
estimation is that correlations in residual outcomes (e.g., grades or test scores after control-
ling for the individual characteristics such as parental income and education, etc.) between
peers need not be the (causal) effect of peer behaviors. Instead, these correlations may be
at least in part due to some correlated but unobserved characteristics. More specifically,
individuals who are peers may be similar in terms of unobserved characteristics that also
affect the outcomes, generating correlation in outcomes between peers as a result. Consider,
for example, a youth’s decision to initiate drug use. Is it because his/her friend initiated
drug use (endogenous peer effects)? Or is it due to the fact that some peer background
characteristics, such as common exposure to a substance-abusing parent that caused both
children to adopt the same behavior? Or is it because they live in a neighborhood with
special characteristics? The distinction between these explanations is crucial for policy pur-
poses. When true peer influence (or other sorts of diffusion) effects operate, intervening
to alter one child’s behavior may affect several others’ behaviors (social multiplier effects).
Absent such peer effects, but when children initiate substance use because adults in their en-
vironment provide opportunities to do so, these multiplier effects would not exist. Correctly
distinguishing social interaction from other effects is thus important in accurately gauging
the benefits of interventions, and therefore to making a proper assessment of the welfare
consequences of such policies (e.g., see Brock and Durlauf (2000)).
One way that this problem has been addressed in the literature (Bramoulle, Djebbari, and
Fortin (2009); Calvo-Armengol, Patacchini and Zenou (2009)) is to exploit the architecture
of network contacts to construct valid instrumental variables for the social interaction effect.
Since peer groups are individual-specific in social networks (usually, different people have
different groups of friends from each other in rich enough ways that allows for identification),
the characteristics of indirect friends are natural candidates. The idea is that a change in
the action of a friend of a friend only interacts with a friend’s behavior and not directly with
the individual’s behavior.
This brings us to the second major challenge outlined above: the endogeneity of the
network. Unfortunately, the sort of instrumental variable strategy described above is valid
only if the network can be treated as exogenous, which is not usually the case unless one
has access to an appropriately controlled field experiment. For example, suppose that the
decision to form a friendship is a choice of the individuals involved. The decision is likely to
depend on the characteristics of the two agents, not only in terms of observed characteristics
but also in terms of unobserved characteristics that could influence their behaviors. It
could then be that behaviors of friends of friends are correlated in ways that invalidate
instrumenting on friends of friends as a method to identify peer effects.
Properly accounting for these possible unobserved factors that correlate with network
35

formation then requires one to be lucky enough to have data where the network was formed
exogenously (e.g., see Carrell, Fullerton, and West (2009); Carrell, Sacerdote and West
(2013); Algan et al. (2015); Lindquist, Sauermann and Zenou (2015)), or to be able to
plausibly rule out unobserved factors, or to develop instruments that are plausibly exogenous
to the interaction structure, or else explicitly model network formation and try to account for
factors that could have substantial influences on behaviors and also on network formation31
In many situations, controls and effective instruments for network formation may be
underpowered, and a careful modeling of network formation can help account for the en-
dogeneity of the network.32 As above, a basic issue that needs to be accounted for in so
doing is that, under homophily, linked individuals are likely to be similar both on observed
and unobserved characteristics. For example, youths who are relatively under-supervised (in
terms of parental attention) may form friendships with others who are under-supervised, and
so forth. Without fully accurate measurements of all the characteristics that might affect
friendship formation, one has to infer the process of formation to account for the missing
data. Otherwise, if the variables that drive this process of network formation are not fully
observable, potential correlations between these unobserved factors and the target regressors
are potentially major sources of bias, as they correlate with patterns of interaction and then
are mis-attributed to peer interaction. The scale of this bias can be large, as pointed out by
Aral, Muchnik, and Sundararajan (2009).
One approach to dealing with unobserved correlations comes from Goldsmith-Pinkham
and Imbens (2013).33 The idea is as follows. Under homophily, pairs of friends tend to
be more similar than pairs of non-friends in terms of their observed and unobserved traits.
Thus, if one sees two people who are friends but are not similar along observed traits, then
they are likely to be similar in unobserved traits. Similarly, if two individuals are similar
on observed traits but are not friends, then they are more likely to be dissimilar in the
full profile of unobserved traits. If one writes down an explicit model for how friendships
might depend on observed and unobserved traits, then this perspective allows one to infer
the likelihood that different pairs of individuals are similar or different on unobserved traits.
Once one infers similarities on unobserved traits, then it is possible to correct for the effects
of those traits on behaviors and remove some of the bias that comes from simply ignoring
31See, e.g., Acemoglu, Garcia-Jimeno, and Robinson (2015) who study the direct and spillover effects
of local state capacity using the network of Colombian municipalities. They exploit both the structure of
the network of municipalities over which spillovers take place, and then the historical roots of local state
capacity as a source of exogenous variation.32Even when careful controls, natural experiments, or other instruments are readily available, having some
theory behind the formation process can be essential in properly structuring an analysis and identifying
(alternative) hypotheses.33One can also jointly estimate a model of behavior and network formation as in Badev (2013).
36

the presence of such traits. Goldsmith-Pinkham and Imbens (2013) illustrate this in the
context of a simple network formation model, but one could enrich the model to address
some of the further concerns we discuss below.
This brings us to the third challenge in working with network data and properly account-
ing for the endogeneity of the networks: computing models of network formation.34 Gener-
ally, the formation of links in a network is not independent across pairs of individuals, and
there will often be strong correlations across pairs in the presence of relationships. There are
many possible reasons underlying such correlations. People meet each other through friends
of friends (e.g., Jackson and Rogers (2007a)). People may benefit from the indirect connec-
tions that others bring (e.g., Jackson and Wolinsky (1996)). People may wish to have their
friends be friends with each other (e.g., under structural balance theory as in Cartwrighth
and Harary (1956)). Having tight cliques of friends may help enforce behaviors that are
not otherwise sustained in a network without cliques or local clustering (Coleman (1988);
Jackson, Rodriguez-Barraquer and Tan (2012); Ali and Miller (2012)). People might also
be forming links based on homophily or location (Graham (2014); Leung (2014)), which
then leads to correlation if not all characteristics are observed. This means that one cannot
model network formation on a link-by-link basis, but rather must explicitly account for in-
terdependencies in how sets of links are formed. Once one does this, to fully confront the
resulting structure, one is then faced with specifying a model at the network level as opposed
to, say, the link level. There is a powerful and natural formulation of such models known as
“exponential random graph models” that incorporate such interdependencies (ERGMs or p∗
models - see Robins et al (2007); Jackson (2008a) for background). The ERGM model class
can nest any random graph model, can incorporate arbitrary interdependencies in connec-
tions and admit a variety of strategic (choice-based) network formation models, and so it is
quite powerful. However, because the number of possible networks on a given set of nodes is
an exponential function of the number of nodes, it is practically impossible to estimate the
likelihood of a given network at even a moderately large scale and thus there is an important
computational hurdle (see the discussion in Chandrasekhar and Jackson (2013)).35 Thus,
one somehow needs models of networks that incorporate the link dependencies observed in
the data, but yet allow for practical estimation.
One approach around this obstacle is, instead of modeling network effects at either the
34For recent surveys of the econometrics of network formation, see Chandrasekhar (2015); Graham (2015).35Any model that specifies probabilities at a network level then has to be estimated by comparing the
likelihood (or conditional probability if Bayesian) of the observed network to other potential networks.
As the number of networks explodes exponentially with the number of nodes, one would then have to
estimate probabilities of alternative networks via sampling rather than exhaustive calculation. Unfortunately,
standard sampling methods based on MCMC techniques do not work except in extreme cases, as shown by
Bhamidi, Bresler, and Sly (2008).
37

link level (and thus failing to incorporate interdependencies) or the full network level (and
thus failing computability), to model things at a subnetwork level, which is then computable
and also allows for rich sets of link interdependencies, as shown by Chandrasekhar and
Jackson (2013). Another approach is to model the network as an evolving process as in
Price (1976); Barabasi and Albert (1999); Jackson and Rogers (2007a); Snijders (2001);
Christakis et al. (2010); Mele (2013); Konig, Tessone, and Zenou (2014), as such models
allow for dependencies in that new links form at various points in time based on the currently
existing network at the time of formation. For instance, network formation can be modeled
as a sequential process where in each period a single randomly selected agent (or pair of
agents) has the opportunity to form a link. A key assumption in these models that enables
tractability is that agents either follow some rule of thumb (e.g., preferential attachment)
or act to maximize their payoffs but do not take into account possible future changes to the
network. This avoids complications with the presence of multiple equilibria, and can also
greatly simplify the computational burden of analyzing these models. All of these models
have yet to be integrated back with explicit models of individual behavior and potentially
of latent characteristics (as in Goldsmith-Pinkham and Imbens (2013)), which is a natural
next step. A challenge here is in making the dynamic models rich enough to fit varieties of
data well, and yet still retaining computability.
Finally, there is much that can still be accomplished with partial identification. Indeed,
it can be enough to put constraints on the relationships between variables to rule out cer-
tain patterns in the data, and this can be done without a fully identified model of network
formation. Partial identification approaches have been very successful in some areas, such as
finance and industrial organization (e.g., Hansen and Jagganathan (1991); Berry, Levinsohn,
and Pakes (1995)), but have not really been applied in network settings. More generally,
the scientific method examines predictions of the models and rejects them when their pre-
dictions fail, which does not always require full identification. More specifically, it may be
easier to identify that a model fails to hold, than that it does hold - it is not a symmetric
relationship. Of course, not rejecting a model or theory does not then imply causation, but
it is still possible to make substantial progress by rejecting models and then replacing them.
This observation may be particularly relevant to the modeling of network formation, which,
because of various challenges mentioned above faces full-identification hurdles. There is a
big middle ground that is not as ambitious as proving causation, utilizing instead partial or
limited identification that should not be overlooked, as it is still very useful in pushing the
science forward, especially for network formation.
38

9 A Summary of Lessons and Themes Emerging from
the Literature Relating Network Structure to Eco-
nomic Behavior
In this paper, we have highlighted the importance that social networks have on economic
behavior. Let us summarize some of the key insights.
• Regarding Macro Analyses of Networks and Behavior:
– The distribution of connectivity in a society is critical in fostering diffusion pro-
cesses:
∗ whether a society experiences various contagion or diffusion tends to exhibit
sharp ‘phase transitions’ in how connected the society is - less densely con-
nected societies exhibit no diffusion and societies that have densities (slightly)
above a critical threshold exhibit substantial diffusion;
∗ not only does the average number of relationships per capita in a society mat-
ter, but also higher variance in connectivity matters since highly connected
individuals can serve as hubs that facilitate diffusion and contagion;
∗ the impact of the network’s degree distribution depends on how the infection
or behavior spreads from node to node.
– Homophily and segregation patterns can help or hinder diffusion:
∗ high levels of homophily can lead groups to be insular and to maintain differ-
ent customs and behaviors from other groups, and can enable poverty traps
and under-investment due to complementarities in behaviors, as well as slow
the spread of information across groups, but
∗ high homophily can also help incubate behaviors or infections within one
group that might not take hold otherwise, and then those behaviors or infec-
tions can spread to a whole society.
• Micro Analyses of Networks and Interaction:
– The centrality of individuals can affect their behaviors and have implications for
their influence on diffusion, learning, and behaviors in a society:
∗ better connected individuals can hear new information sooner and have high
levels of influence on the eventual spread of information and/or the adoption
of new products in a society;
39

∗ the notions of centrality that best predict the influence of a particular in-
dividual for diffusion and behaviors with complementarities are often based
on iterative measures of how well-connected the individual’s friends are (e.g.,
eigenvector, Katz-Bonacich and diffusion centralities);
∗ the (many) different notions of centrality all capture different aspects that
turn out to be important in different settings (betweenness for intermediation,
Katz-Bonacich for games of complements, eigenvector and diffusion centrality
for learning and diffusion, key player for reducing crime, distance and gossip
centrality for informedness, degree for short-lived processes).
– The extent to which an individual’s friends are friends with each other, as well as
the extent to which pairs of friends have friends in common, can have important
implications for cooperative behavior:
∗ high clustering can help enable information spread about (mis)behaviors of
an individual to his or her friends and help provide fast societal reactions and
effective incentives;
∗ having friends in common can help in providing incentives to individuals to
exchange favors; and
∗ having high local clustering can help reinforce behaviors that exhibit comple-
mentarities and help them survive and spread compared to what might occur
in more dispersed network structures.
• Endogeneity of Networks:
– The endogeneity of friendships and social relationships is important to model and
observe:
∗ the substantial homophily that social networks exhibit can lead connected
individuals to exhibit similar behaviors and beliefs even after correcting for
observed characteristics, which can substantially contaminate estimation of
peer effects;
∗ statistical models of network formation need to incorporate elements beyond
the link level in order to capture network effects;
∗ individuals may not have incentives to form relationships in ways that are
most beneficial for a society; and
∗ the formation of friendships can be governed not only by the preferences of
individuals, but also by biases in the opportunities that individuals have to
meet each other as distorted both by individual characteristics and by existing
network structure.
40

We have provided two sets of organizing principles. First, we have suggested a taxonomy
of network properties, aimed at distinguishing between local and aggregate features of the
network. Large networks are complicated objects and, given the inherent limitations involved
in attempting to simplify and summarize them, it is useful to have in mind a classification
of properties that capture essential properties of networks. Second, we have illustrated the
importance that those network properties have for economic outcomes and behavior. The
chosen contexts also demonstrate that the classification of network properties aligns with
natural research questions.
Finally, we should like to emphasize that the overlap of theoretical and empirical work
in network economics has been not only healthy for developing deeper understandings of
how network structures matter in economics, but is also maturing to a point at which policy
implications are emerging. Just as one example, in the context of criminal networks, it has
been estimated that, not only can a key player policy reduce total crime in a network by
38 percent but it is also capable of outperforming other reasonable – but, from a network
perspective, naive – police policies such as targeting the most active criminals (Lindquist and
Zenou (2013)). Moving forward, it is our hope and expectation that network economics will
greatly aid in the understanding of policies in many arenas including poverty, development,
education, public health, segregation, business cycles, finance, politics, and international
relations.
References
Acemoglu, D., Garcia-Jimeno, C. and J.A. Robinson (2015), “State capacity and economic
development: A network approach,” Unpublished manuscript, MIT.
Acemoglu, D., Ozdaglar, A. and A. Tahbaz-Salehi (2015), “Systemic risk and stability in
financial networks,” American Economic Review 105.
Acemoglu, D., Ozdaglar, A. and A. Tahbaz-Salehi (2012), “Network origins of aggregate
fluctuations,” Econometrica 80(5), 1977–2016.
Adamic, L.A. (1999), The Small World Web, Proceedings of the ECDL, vol 1696 of Lecture
Notes in Computer Science, pp. 443–454.
Alatas, V., Banerjee, A., Chandrasekhar, A.G., Hanna, R. and B. Olken (2013), “Social
networks and the aggregation of information: Theory and evidence from Indonesia,” NBER
Working Paper No. 18351.
41

Albert, R., Jeong, H. and Barabasi, A.-L. (1999), “Internet: Diameter of the world-wide
web,” Nature, 401, 130.
Algan, Y., Do, Q.-A., Le Chapelain, A. and Y. Zenou (2015), “How social networks shape our
values? A natural experiment among future French politicians,” Unpublished manuscript,
Science Po, Paris.
Ali, N. and D. Miller (2012), “Enforcing cooperation in networked societies, ” Unpublished
manuscript, University of California, San Diego.
Ali, N. and D. Miller (2103), “Ostracism ” Unpublished manuscript, University of California,
San Diego.
Allen, F. and D. Gale (2000), “Financial contagion,” Journal of Political Economy 108, 1–33.
Ambrus, A., Mobius, M. and A. Szeidl (2014), “Consumption risk-sharing in social net-
works,” American Economic Review 104, 149–82.
Amini, H., Cont, R. and A. Minca (2012), “Stress testing the resilience of financial networks,”
International Journal of Theoretical and Applied Finance 15(1), 1250006.
Amini, H., Cont, R. and A. Minca (2015), “Resilience to contagion in financial networks,”
Mathematical Finance, forthcoming.
Anderson, R.M. and R.M. May (1992), Infectious Diseases in Humans, Oxford: Oxford
University Press.
Aral, S., Muchnik, L. and A. Sundararajan (2009), “Distinguishing influence-based conta-
gion from homophily-driven diffusion in dynamic networks ” Proceedings of the National
Academy of Sciences of the USA 106 (51), 21544–21549.
Backstrom, L. and Boldi, P. and Rosa, M. and Ugander, J. and Vigna, S. (2012), “Four
Degrees of Separation,” arXiv:1111.4570.
Badev, A. (2013), “Discrete Games in Endogenous Networks: Theory and Policy,” Unpub-
lished manuscript, University of Pennsylvania.
Ballester C, Calvo-Armengol A. and Y. Zenou (2006), “Who’s who in networks: wanted the
key player,” Econometrica 74(5), 1403–1417.
Ballester, C., Calvo-Armengol, A. and Y. Zenou (2010), “Delinquent networks,” Journal of
the European Economic Association 8, 34–61.
42

Ballester, C. and Y. Zenou (2014), “Key player policies when contextual effects matter,”
Journal of Mathematical Sociology 38, 233–248.
Banerjee, A., Chandrasekhar, A.G., Duflo, E. and M.O. Jackson (2013), “Diffusion of mi-
crofinance,” Science 341 (6144).
Banerjee, A., Breza, E., Chandrasekhar, A., Duflo, E. and M.O. Jackson (2014), “Come
play with me: Information diffusion about rival goods,” Unpublished manuscript, MIT,
Columbia, and Stanford.
Banerjee, A., Chandrasekhar, A.G., Duflo, E. and M.O. Jackson (2014), “Gossip: Identify
central individuals in a social network,” Unpublished manuscript, MIT and Stanford.
Banks, J.S., Plott, C.R. and D.P. Porter (1988), “An experimental analysis of unanimity in
public goods provision mechanisms,” Review of Economic Studies 55(2), 301–322.
Barabasi, A.-L. and Albert, R. (1999) “Emergence of Scaling in Random Networks,”
Barabasi, A.-L. (2011) Bursts: The Hidden Patterns Behind Everything We Do, from Your
E-mail to Bloody Crusades, New York: Penguin Group.
Battu, H., Seaman, P.T. and Y. Zenou (2011), “Job contact networks and the ethnic mi-
norities,”Labour Economics 18, 48–56.
Bayer, P., Ross, S.L. and G. Topa (2008), “Place of work and place of residence: Informal
hiring networks and labor market outcomes,” Journal of Political Economy 116, 1150-1196.
Beaman, L.A. (2012), “Social networks and the dynamics of labour market outcomes: Evi-
dence from refugees resettled in the U.S.,” Review of Economic Studies 79(1), 128–161.
Benhabib, J., Bisin, A. and M.O. Jackson (2011), Handbook of Social Economics Vol. 1 and
2, Amsterdam: Elsevier Science.
Berry, S., J. Levinsohn and A. Pakes (1995), “Automobile prices in market equilibrium,”
Econometrica 63(4), 841–890.
Bhamidi, S. and Bresler, G. and A. Sly (2008), “Mixing time of exponential random graphs,”
Arxiv preprint arXiv:0812.2265.
Bloch, F., Genicot, G. and D. Ray (2008), “Informal insurance in social networks,” Journal
of Economic Theory 143(1), 36–58.
Bloch, F., Jackson, M.O. and Tebaldi, P. (2015), “Centrality”, Stanford University.
43

Blume, L.E., Brock, W.A., Durlauf, S.N. and Y.M. Ioannides (2011), “Identification of
social interactions,” In: J. Benhabib, A. Bisin, and M.O. Jackson (Eds.), Handbook of
Social Economics, Vol. 1B, Amsterdam: Elsevier Publisher, pp. 853-964.
Blumenstock, J., Eagle, N. and M. Fafchamps (2012),“Charity and reciprocity in mobile
phone-based giving: Evidence from Rwanda,” Unpublished manuscript, University of Cal-
ifornia, Berkeley.
Bollobas, B. (2001), Random Graphs, 2nd edition, New York: Academic Press.
Bollobas, R. and Riordan, O. (2004), “The Diameter of a Scale-Free Random Graph,” Jour-
nal Combinatorica 24(1), 5–34.
Bonacich P. (1987), “Power and centrality: A family of measures,” American Journal of
Sociology 92, 1170–1182.
Bonacich P. (1991), “Simultanous group and individual centralities,” Social Networks 13,
155–168.
Boucher, V., Bramoulle, Y., Djebbari, H., and B. Fortin (2014), “Do peers affect student
achievement? Evidence from Canada using group size variation,” Journal of Applied
Econometrics 29(1), 91–109.
Boustant, L.P. (2010), “Was postwar suburbanization white flight? Evidence from the black
migration,” Quarterly Journal of Economics 125(1), 417–443.
Bramoulle, Y., Djebbari, H. and B. Fortin (2009), “Identification of peer effects through
social networks,” Journal of Econometrics 150, 41–55.
Bramoulle, Yann, Sergio Currarini, Matthew O. Jackson, Paolo Pin, and Brian Rogers
(2012), “Homophily and Long-Run Integration in Social Networks,” Journal of Economic
Theory 147(5), 1754–1786.
Bramoulle, Yann, Andrea Galeotti and Brian Rogers (2015), The Oxford Handbook on the
Economics of Networks, Oxford: Oxford University Press, forthcoming.
Brock, W.A. and S.N. Durlauf (2000), “Discrete Choice with Social Interactions,” The Re-
view of Economic Studies, 68:2, 235–260.
Burt, R.S. (1992), Structural Holes, New York: Academic Press.
Cai, J., de Janvry, A. and E. Sadoulet (2015), “Social networks and the decision to insure,”
American Economic Journal: Applied Economics, forthcoming.
44

Calvo-Armengol, A. and M.O. Jackson (2004), “The effects of social networks on employment
and inequality, ” American Economic Review 94, 426–454.
Calvo-Armengol, A. and M.O. Jackson (2007), “Networks in labor markets: Wage and
employment dynamics and inequality, ” Journal of Economic Theory 132(1), 27–46.
Calvo-Armengol, A. and M.O. Jackson (2009), “Like father, like son: Labor market networks
and social mobility, ” American Economic Journal: Microeconomics 1(1), 124-150.
Calvo-Armengol, A., E. Patacchini, and Y. Zenou (2009), “Peer effects and social networks
in education,” Review of Economic Studies 76, 1239–1267.
Calvo-Armengol, A. and Y. Zenou (2004), “Social networks and crime decisions: The role of
social structure in facilitating delinquent behavior,” International Economic Review 45,
935–954.
Card, D., Mas, A. and J. Rothstein (2008), “Tipping and the dynamics of segregation,”
Quarterly Journal of Economics 45, 123(1), 177–218.
Carrell, S.E., Fullerton, R.L. and J.E. West (2009), “Does your cohort matter? Estimating
peer effects in college achievement,” Journal of Labor Economics 27(3), 439–464.
Carrell, S.E., Sacerdote, B.I. and J.E. West (2013), “From natural variation to optimal
policy? The importance of endogenous peer group formation,” Econometrica 81(3), 855-
882.
Cartwright, D. and F. Harary (1956), “Structural balance: a generalization of Heider’s
theory,” Psychological Review 63(5), 277–293.
Centola, D. (2010), “The spread of behavior in an online social network experiment,” Science
329, 1194-1197.
Centola, D. (2011), “An experimental study of homophily in the adoption of health behav-
ior,” Science 334, 1269-1272.
Chandrasekhar, A.G. (2015) “Empirics of Network Formation,” In: Y. Bramoulle, B.W.
Rogers and A. Galeotti (Eds.), Oxford Handbook on the Economics of Networks, Oxford:
Oxford University Press, forthcoming.
Chandrasekhar, A.G. and M.O. Jackson (2013), “Tractable and consistent random graph
models,” Unpublished manuscript, Stanford University.
45

Charness, G., F. Feri, M.A. Melendez-Jimenez and M. Sutter (2013), “Experimental games
on networks: Underpinnings of behavior and equilibrium selection,” Econometrica 82,
1615–1670
Christakis, N. and J.H. Fowler (2010), “Social network sensors for early detection of conta-
gious outbreaks,” PLOS One: e12948 5(9).
Christakis, N., Fowler, J., Imbens, G. and K. Kalyanaraman (2010), “An empirical model
for strategic network formation,” NBER Working Paper No. 16039.
Chung, F. and Lu, L. (2002), “The average distances in random graphs with given expected
degrees,” PNAS 99(25), 15879-15882.
Cohen-Cole, E., Patacchini, E. and Y. Zenou (2015), “Static and dynamic networks in in-
terbank markets,” Network Science, forthcoming.
Coleman, J.S. (1988), “Social capital in the creation of human capital, ” American Journal
of Sociology 94, S95–S120.
Coleman, J.S., Campbell, E.Q., Hobson, C.J., McPartland, F., Mood, A.M., Weinfeld, F.D.,
et al. (1966), Equality of educational opportunity, Washington, DC: U.S. Government
Printing Office.
Colizza, V. and A. Vespignani (2007), “Invasion threshold in heterogeneous metapopulation
networks,” Physical Review Letters 99, 148-701.
Cooper, R.W., DeJong, D.V., Forsythe, R. and T.W. Ross (1990), “Selection criteria in
coordination games: Some experimental results, ” American Economic Review 80(1),
218–233.
Copic, J., Jackson, M.O. and A. Kirman (2009), “Identifying community structures from net-
work data via maximum likelihood methods,” The B.E. Journal of Theoretical Economics
9(1), Article 30.
Currarini, S., Jackson, M.O., and P. Pin (2009), “An economic model of friendship: Ho-
mophily, minorities, and segregation,” Econometrica 77, 1003–1045.
Currarini, S., Jackson, M.O., and P. Pin (2010), “Identifying the roles of race-based choice
and chance in high school friendship network formation,” Proceedings of the National
Academy of Sciences of the USA 107, 4857–4861.
46

Currarini, S. and F. Mengel, F. (2012), “Identity, homophily and in-group bias, based choice
and chance in high school friendship network formation, Unpublished manuscript, Univer-
sity of Venice.
Cutler, D., Glaeser, E.L. and J.L. Vigdor (1999), “The rise and decline of the American
ghetto,” Journal of Political Economy 107, 455–506.
Dandekar, P., Goel, A. and D.T. Lee (2013),“Biased assimilation, homophily, and the dy-
namics of polarization,” Proceedings of the National Academy of Sciences of the USA
110(15), 5791-5796.
Dequiedt, V. and Y. Zenou (2014), “Local and consistent centrality measures in networks,”
CEPR Discussion Paper No. 10031.
Demange, G. (2011), “Contagion in financial networks: A threat index,” Unpublished
manuscript, Paris School of Economics.
Demange, G. and Wooders, M. (2003), Group Formation in Economics. Networks, Clubs
and Coalitions, Cambridge, UK: Cambridge University Press.
Dodds, P., and Muhamad, R., and Watts, D. (2003), “An Experimental Study of Search in
Global Social Networks,” Science 301, 827-829.
Elliott, M.L. and B. Golub (2013), “A network approach to public goods,” Unpublished
manuscript, Caltech.
Elliott, M.L., Golub, B. and M.O. Jackson (2014), “Financial networks and contagion,”
American Economic Review 104(10), 3115–3153.
Erdos, P. and A. Renyi (1959), “On random graphs, ”Publicationes Mathematicae 6, 290–
297.
Erdos, P. and A. Renyi (1960), “On the evolution of random graphs,” Publication of the
Mathematical Institute of the Hungarian Academy of Sciences 5, 17–61.
Freixas, X., Parigi, B. and J. Rochet, (2000), “Systemic risk, interbank relations and liquidity
provision by the central bank,”Journal of Money, Credit and Banking 32, 611–638.
Gai, P., Haldane, A. and S. Kapadia (2011), “Complexity, concentration and conta-
gion,”Journal od Monetary Economics 58(5), 453-470.
Galeotti A. and B. Rogers (2013), “Strategic immunization and group structure,”American
Economic Journal: Microeconomics 5(2), 1–32.
47
Galeotti A., Goyal S., Jackson M.O., Vega-Redondo F. and L. Yariv (2010), “Network
games,”Review of Economic Studies 77, 218–244.
Gautier, P.A. and C.L. Holzner (2013), “Simultaneous Search and Network Efficiency,” Un-
published manuscript, Tinbergen Institute.
Geoffard, P-Y. and T. Philipson (1997), “Disease eradication: Private versus public vacci-
nation,”American Economic Review 87(1), 222–230.
Giulietti, C., Wahba, J. and Y. Zenou (2014), “Strong versus weak ties in migration,”CEPR
Discussion Paper No. 10248.
Goeree, J.K., McConnell, M.A., Mitchell, T., Tromp, T. and L. Yariv (2010), “The 1/d law
of giving,”American Economic Journal: Microeconomics 2(1), 183–203.
Gofman, M. (2013), “Efficiency and stability of a financial architecture with too-
interconnected-to-fail institutions,” Unpublished manuscript, University of Wisconsin-
Madison.
Goldsmith-Pinkham, P. and G. Imbens (2013), “Social networks and the identification of
peer effects, ” Journal of Business and Economic Statistics 31(3), 253–264.
Golub, B. and M.O. Jackson (2010), “Naive learning in social networks and the wisdom of
crowds,”American Economic Journal: Microeconomics 2(1), 112–149.
Golub, B. and M.O. Jackson (2012), “How homophily affects the speed of learning and
best-response dynamics,”Quarterly Journal of Economics 127(3), 1287–1338.
Goyal, S. (2007), Connections: An Introduction to the Economics of Networks, Princeton:
Princeton University Press.
Goyal, S., Van Der Leij, M.J. and J.L. Moraga-Gonzalez (2006) “Economics: An emerging
small world,” Journal of Political Economy 114, 403–412.
Graham, B.S. (2014) “An empirical model of network formation: detecting homophily when
agents are heterogenous,” Unpublished manuscript, U.C. Berkeley.
Graham, B.S. (2015) “Methods of identification in social networks,” Annual Review of Eco-
nomics, forthcoming.
Granovetter, M.S. (1973), “The strength of weak ties,”American Journal of Sociology 78,
1360–1380.
Granovetter, M. (1974), Getting a Job, Chicago: University of Chicago Press.
48

Granovetter, M. (1985), “Economic action and social structure: The problem of embedded-
ness,”American Journal of Sociology 91(3), 481-510.
Granovetter, M. (2005), “The Impact of Social Structure on Economic Outcomes,”Journal
of Economic Perspectives 19(1), 481-510.
Grossman, J.W. (2000), “The evolution of the mathematical research collaboration
graph,”Proceedings of 33rd Southeastern Conference on Combinatorics 158, 201–212.
Hagenbach, J. and F. Koessler (2010),“Strategic communication networks, ”Review of Eco-
nomic Studies 77(3), 1072–1099.
Hahn, Y., Islam, A., Patacchini, E. and Y. Zenou (2015),“Networks and education: Evidence
from a field experiment in Bangladesh, ”Unpublished manuscript, Monash University and
Stockholm University.
Hansen, L.P. and R. Jagannathan (1991) “Implications of Security Market Data for Models
of Dynamic Economies,” Journal of Political Economy 99(2), 225–262.
Henrich, J., Heine, S.J. and A. Norenzayan (2010), “Most people are not weird,”Nature
466(7302), 29–29.
Huberman, B.A. and Adamic, L.A. (1999), “Growth dynamics of the World-Wide Web,”
Nature 401, 131.
Ioannides, Y.M. and L. Datcher-Loury (2004), “Job information networks, neighborhood
effects and inequality,”Journal of Economic Literature 424, 1056–1093.
Jackson M.O. (2003), “The stability and efficiency of economic and social networks,” In: S
Koray and M. Sertel (Eds.), Advances in Economic Design, Heidelberg: Springer-Verlag,
pp. 319—362.
Jackson M.O. (2004), “A survey of models of network formation: stability and efficiency,” In:
G. Demange and M. Wooders (Eds.), Group Formation in Economics. Networks, Clubs
and Coalitions, Cambridge, UK: Cambridge University Press, pp. 11–57.
Jackson M.O. (2005), “The economics of social networks,” In: R. Blundell, W. Newey and
T. Persson (Eds.), Proceedings of the 9th World Congress of the Econometric Society,
Cambridge, UK: Cambridge University Press, pp. 1–56.
Jackson, M.O. (2007), “Social structure, segregation, and economic behavior,” Nancy
Schwartz Memorial Lecture, http://papers.ssrn.com/abstract=1530885.
49
Jackson M.O. (2008a) Social and Economic Networks, Princeton, NJ: Princeton University
Press.
Jackson M.O. (2008b) “Average Distance, Diameter, and Clustering in Social Networks with
Homophily,” in the Proceedings of the Workshop in Internet and Network Economics
(WINE 2008), Lecture Notes in Computer Science, Springer-Verlag, Berlin Heidelberg,
2008.
Jackson, M.O. (2011) “An overview of social networks and economic applications,” In: J.
Benhabib, A. Bisin and M.O. Jackson (Eds.), Handbook of Social Economics Volume 1A,
Amsterdam: Elsevier Science, pp. 511–585.
Jackson, M.O. (2013), “Unraveling peers and peer effects: Comments on Goldsmith-Pinkham
and Imbens’ “Social Networks and the Identification of Peer Effects”, ” Journal of Business
and Economic Statistics 31(3), 270–273.
Jackson, M.O. (2014), “Networks in the understanding of economic behaviors,” Journal of
Economic Perspectives, 28(4), 3–22.
Jackson, M.O. and D. Lopez-Pintado (2013), “Diffusion and contagion in networks with
heterogeneous agents and homophily,” Network Science 1(1), 49–67.
Jackson, M.O., Rodriguez-Barraquer, T. and X. Tan (2012),“Social capital and social quilts:
Network patterns of favor exchange,” American Economic Review 102, 1857–1897.
Jackson, M.O. and B.W. Rogers (2005), “The Economics of Small Worlds, The Journal of
the European Economic Association (Papers and Proceedings) 3(2-3), 617–627.
Jackson, M.O. and B.W. Rogers (2007a), “Meeting strangers and friends of friends: How
random are social networks?,” American Economic Review 97(3), 890–915.
Jackson, M.O. and B.W. Rogers (2007b), “Relating network structure to diffusion properties
through stochastic dominance,” The BE Journal of Theoretical Economics 7(1), 1–13.
Jackson, M.O. and A. Watts (2001), “The existence of pairwise stable networks,” Seoul
Journal of Economics 14, 299-321.
Jackson, M.O. and A. Wolinsky (1996), “A strategic model of social and economic networks,”
Journal of Economic Theory 71, 44–74.
Jackson, M.O. and Y. Xing (2014), “Homophily, convention, and culture in coordinating
behaviors ” Proceedings of the National Academy of Sciences of the United States, July.
50

Jackson, M.O. and L. Yariv (2005), “Diffusion on Social Networks,” Economie Publique
16(1), 69–82.
Jackson, M.O. and L. Yariv (2007), “Diffusion of Behavior and Equilibrium Properties in
Network Games,” American Economic Review (Papers and Proceedings) 97 (2), 92–98.
Jackson, M.O. and L. Yariv (2011), “Diffusion, Strategic Interaction, and Social Structure,”
In: J. Benhabib, A. Bisin and M.O. Jackson (Eds.), Handbook of Social Economics Volume
1A, Amsterdam: Elsevier Science, pp. 645–678.
Jackson, M.O. and Y. Zenou (2013), Economic Analyses of Social Networks, The Interna-
tional Library of Critical Writings in Economics, London: Edward Elgar Publishing.
Jackson, M.O. and Y. Zenou (2015), “Games on networks,” In: P. Young and S. Zamir
(Eds.), Handbook of Game Theory Vol. 4, Amsterdam: Elsevier Publisher, pp. 91–157.
Julliard, C., Denbee, E., Li, Y. and K. Yuan (2013), “Network risk and key players: A
structural analysis of interbank liquidity,” Unpublished manuscript, London School of
Economics and Political Science
Karlan, D., Mobius, M., Rosenblat, T. and A. Szeidl (2009),“Trust and social collateral,”
Quarterly Journal of Economics 24, 1307–1361.
Karlan, D., Mobius, M., Rosenblat, T. and A. Szeidl (2010),“Measuring trust in Peruvian
shantytowns, ” Unpublished manuscript, Yale University.
Katz, L. (1953), “A new status index derived from sociometric analysis,” Psychometrika 18,
39–43.
Katz, E. and P.F. Lazarsfeld (1955), Personal Influence: The Part Played by People in the
Flow of Mass Xommunication, Glencoe, IL: Free Press.
Kearns, M.J., Judd, S., Tan, J. and J. Wortman (2009), “Behavioral experiments on biased
voting in networks,” Proceedings of the National Academy of Sciences 106(5), 1347–1352.
Kleinberg, J. (2000a) “The small-world phenomenon: An algorithmic perspective,’ Proceed-
ings of the thirty-second annual ACM Symposium on Theory of Computing
Kleinberg, J. (2000b) “Navigation in a small world,” Nature 406, 845.
Konig, M.D., Liu, X. and Y. Zenou (2014) “R&D networks: Theory, Empirics and Policy
Implications,” CEPR Discussion Paper No. 9872.
51

Konig, M.D., Tessone, C. and Y. Zenou (2014), “Nestedness in networks: A theoretical
model and some applications,” Theoretical Economics 9, 695-752.
Kremer, M. (1996), “Integrating behavioral choice into epidemiological models of AIDS,”
Quarterly Journal of Economics 111(2), 549–573.
Lamberson, P.J. (2010) “A Typology of Mechanisms that Generate Clustering in Networks,”
American Journal of Epidemiology 171, Suppl 11.
Lamberson, P.J. (2010) “Social Learning in Social Networks,” B. E. Journal of Theoretical
Economics 10(1), Article 36.
Lamberson, P.J. (2011) “Linking Network Structure and Diffusion through Stochastic Dom-
inance,” Connections, 31(1).
Lee, S. and P. Persson (2010), “Circles of trust,” Unpublished manuscript, Columbia Uni-
versity.
Leung, M. (2014) “A Random-field approach to inference in large models of network forma-
tion,” Stanford University.
Lindquist, M.J. and Y. Zenou (2013), “Key players in co-offending networks, ” CEPR Dis-
cussion Paper No. 9889.
Lindquist, M.J., Sauermann, J. and Y. Zenou (2015), “Network effects on training,” Unpub-
lished manuscript, Stockholm Uiversity.
Lippert, S. and G. Spagnolo (2011), “Networks of relations and word-of-mouth communica-
tion, ” Games and Economic Behavior 72(1), 202-17.
Liu, X., Patacchini, E., Zenou, Y. and L.-F. Lee (2012), “Criminal networks: Who is the
key player?” CEPR Discussion Paper No. 8772.
Lopez-Pintado, D. (2008), “Contagion in complex social networks, ” Games and Economic
Behavior 62(2), 573-590.
Manski, C.F. (1993), “Identification of endogenous effects: The reflection problem,” Review
of Economic Studies 60, 531–542.
Mehra, A., Kilduff, M. and D.J. Brass (2001), “The social networks of high and low
self-monitors: Implications for workplace performance,”Administrative Science Quarterly
46(1), 121-146.
52

Mele, A. (2013), “A structural model of segregation in social networks,”Unpublished
manuscript, Johns Hopkins Carey Business School.
McPherson, M., Smith-Lovin, L. and J.M. Cook (2001), “Birds of a feather: Homophily in
social networks,”Annual Review of Sociology 27, 415–444.
Milgram, S. (1967),“The Small-world Problem,”Psychology Today 2, 60–67.
Mitzenmacher, Michael (2004) ”Brief History of Generative Models for Power Law and Log-
normal Distributions,”Internet Mathematics 1(2), 226–251.
Morris, S. (2000), “Contagion,”Review of Economic Studies 67(1), 57-78.
Munshi, K. and M. Rosenzweig (2009), “Why is mobility in India so low? Social insurance,
inequality, and growth,”NBER Working Paper No. 14850.
Newman, M. (2002), “Assortative Mixing in Networks, ”Physical Review Letters 89, 20871.
Newman, M. (2003), “The structure and function of complex networks, ”SIAM Review 45,
167–256.
Ostrom, E. (1990), Governing the Commons: The Evolution of Institutions for Collective
Action, Cambridge: Cambridge University Press.
Padgett, J.F. and C.K. Ansell (1993), “Robust action and the rise of the Medici 1400-1434,”
American Journal of Sociology 98(6), 1259–1319.
Page, L., Brin, S., Motwani, R. and T. Winograd (1998), “The PageRank citation ranking:
Bringing order to the web,” Technical Report, Stanford University.
Pastor-Satorras, R. and A. Vespignani (2001), “Epidemic dynamics and endemic states in
complex networks,”Physical Review E 63, 66-117.
Patacchini, E. and Y. Zenou (2008), “The strength of weak ties in crime,” European Eco-
nomic Review 52, 209–236.
Patacchini, E. and Y. Zenou (2012), “Juvenile delinquency and conformism,”Journal of Law,
Economic, and Organization 28, 1–31.
Patacchini, E. and Y. Zenou (2015), “Racial identity and education in social net-
works,”Unpublished manuscript, Stockholm University.
Price, D. (1976) “A general theory of bibliometric and other cumulative advantage pro-
cesses,”Journal of the American Society for Information Science 27, 292–306.
53

Putnam, R.D. (2000), Bowling Alone: The Collapse and Revival of American Community,
New York: Simon and Schuster.
Raub, W. and J. Weesie (1990), “Reputation and efficiency in social interactions: An example
of network effects,”American Journal of Sociology 96(3), 626-654.
Robins, G., Snijders T., Wang P. Handcock M., Pattison P. (2007) “Recent developments in
exponential random graph (p∗) models for social networks,” Social Networks, 29, 192–215.
Rogers, E.M. (1995), Diffusion of Innovations, New York: Free Press.
Rubineau, B. and R.M. Fernandez (2015), “Missing links: Referrer behavior and job segre-
gation,” Management Science, forthcoming.
Sarnecki, J. (2001), Delinquent Networks: Youth Co-Offending in Stockholm, Cambridge:
Cambridge University Press.
Schelling, T.C. (1971), “Dynamic models of segregation,”Journal of Mathematical Sociology
1, 143–186.
Simmel, G. (1908), Investigations on the Forms of Sociation, Leipzig: Duncker and Humblot.
Skopek, J., Schulz, F. and H.-P. Blossfeld (2011), “Who contacts whom? Educational ho-
mophily in online mate selection,”European Sociological Review 27(2), 180–195 .
Snijders, T. (2001) “The statistical evaluation of social network dynamics,”Sociological
Methodology 31(1), 361-395.
Solomonoff, R. and A. Rapoport (1951), “Connectivity of random nets,”Bulletin of Mathe-
matical Biophysics 13, 107–17.
Sutherland, E.H. (1947), Principles of Criminology, Fourth edition, Chicago: J.B. Lippin-
cott.
Tarbush, B. and A. Teytelboym (2014), “Friending,” Unpublished manuscript, MIT.
Toxvaerd, F. (2012), “Recurrent infection and externalities in prevention,” Unpublished
manuscript, Cambridge University.
Van Huyck, J.B., Battalio, R.C. and R.O. Beil (1990), “Tacit coordination games, strategic
uncertainty, and coordination failure, ,” American Economic Review 80(1), 234–248.
Vega-Redondo, F. (2007), Complex Social Networks, Econometric Society Monograph Series,
Cambridge: Cambridge University Press.
54

Warr, M. (2002), Companions in Crime: The Social Aspects of Criminal Conduct, Cam-
bridge: Cambridge University Press.
Wasserman, S. and K. Faust (1994), Social Network Analysis. Methods and Applications,
Cambridge: Cambridge University Press.
Watts, D.J. (2002), “A simple model of global cascades on random networks,”Proceedings of
the National Academy of Sciences of the USA 99(9), 5766–5771.
Watts, D.J. and S. Strogatz (1998) “Collective dynamics of ’small-world’ networks,” Nature,
393, 440-442.
Zenou, Y. (2013), “Spatial versus social mismatch,”Journal of Urban Economics 74, 113–132.
Zenou, Y. (2015a), “A dynamic model of weak and strong ties in the labor market,”Journal
of Labor Economics, forthcoming.
Zenou, Y. (2015b), “Key players,”In: Y. Bramoulle, B.W. Rogers and A. Galeotti (Eds.),
Oxford Handbook on the Economics of Networks, Oxford: Oxford University Press, forth-
coming.
55