the economic and health impact of a tax on sugar sweetened ...cege/diskussionspapiere/dp356.pdf ·...
TRANSCRIPT
ISSN: 1439-2305
Number 356 – November 2018
THE ECONOMIC AND HEALTH IMPACT
OF A TAX ON SUGAR SWEETENED BEVERAGES (SSBS) IN SOUTH AFRICA
Charity Gomo Laura Birg
The Economic and Health Impact of a Tax on Sugar Sweetened Beverages (SSBs) in South Africa
Charity Gomo1 and Laura Birg2
1. [email protected]. 2. Department of Economics, University of Göttingen, Germany, [email protected].
November 2018
Abstract Background/Objectives: The increased consumption of sugar sweetened beverages (SSBs) has been associated with risks of obesity, and corresponding risks of type 2-diabetes, cancer, and cardiovascular disease. In order to reduce the intake of these beverages, the South African government has recently introduced a tax on SSBs.
Methods: This paper evaluates the economic and health impact of the recently introduced tax on sugar sweetened beverages in South Africa, by constructing a microsimulation model using the South African Income and Household Survey (IES 2010/11) as the main data set.
Results and conclusion: The overall results indicate that a 10 % SSB tax will lead to a substantial reduction in consumption of carbonated soft drinks by about 27% and minor reductions in other SSB categories. Results also indicate that the 10% SSB tax can generate about ZAR 14.5 billion (USD 1.08 bn) in government tax revenue annually. In addition, simulation results show that the SSB tax would result in an average reduction in energy intake by 16.97 kj/person/day.
2
Introduction and background In the recent past, obesity rates in South Africa have increased considerably – currently, 14.7% of
men and 44.5% of women are obese [1]. Among others, increasing consumption of sugar sweetened
beverages (SSBs) has been linked to weight gain due to high levels of energy and low nutritional
content [2]. The increase in body mass has been associated with risks of obesity, and corresponding
risks of type 2-diabetes, cancer, and cardiovascular disease [2]. The increase in obesity levels is
expected to contribute to rising health care costs [3].
The nutritional transition in South Africa has contributed to the challenge of increasing obesity levels:
Given the expansion of supermarkets into informal urban settlements and rural areas over the years,
SSBs have become increasingly available to lower-income groups [2]. An annual growth rate of 2.4%
for the beverage industry has been projected for the period until 2017 [2]. Tugendhaft et al. (2016) [2]
find that this growth rate could result in an increase in obese adults in South Africa by 1.2 million by
2017.
A tax-induced price increase of SSBs could reduce SSB consumption [4]. The South African
government has recently introduced a tax on SSBs as a way of reducing the intake of these beverages,
generating government revenue and potentially lowering medical costs. Initially, a tax of ZAR 0.0229
per gram (0.17 USD cents), equivalent to a 20% tax rate, for all non-alcoholic drinks containing added
sugar was proposed [5]. Due to industry lobbying, the proposal was changed to ZAR 0.021 per gram
of the sugar content exceeding 4 grams per 100ml, meaning that the first 4 grams of the 100ml are
levy free [6]. This translates to about a 10% tax rate with an exemption for the first 4 g of sugar [7].
SARS has started collecting the SSB tax in April 2018.
Manyema et al. (2014) [8] have shown that a 20% tax on SSBs in South Africa may decrease the
number of obese adults by 3.8% or 220,000 persons. Manyema et al. (2015) find that a 20% SSB tax
and the corresponding decrease in obesity levels could reduce the prevalence of type 2-diabetes by 4%
[9]. Over a period of 20 years, this would reduce healthcare costs by ZAR 10 billion (or equivalently

3
USD 740 million) [9]. Also, Veerman et al. (2016) [10] report a reduction in healthcare expenditure
from the introduction of a tax on SSBs for Australia.
Manyema et al. (2014) [8] could have possibly overestimated the effect of the tax on the reduction of
consumption of SSBs, as they have used a higher tax rate than the one currently being applied and a
higher elasticity than that estimated by Stacey et al. (2017) [7].
The study evaluates the potential economic and health impact of the recently introduced tax on sugar
sweetened beverages in South Africa. The study adds to the existing literature in several ways. Firstly,
it considers the effect of growing consumption levels of SSBs absent of a tax and the new tax policy
scenario of a 10% tax rate, with an exemption for the first 4 g of sugar instead of a 20% tax rate which
was proposed earlier. Secondly, this paper uses the estimated elasticities for South Africa from Stacey
et al. (2017) [7] rather than elasticities for other countries. This implies also taking substitution
patterns with respect to other non-taxed beverages into account better. Thirdly, the study also
considers the differential impact of the SSB tax on consumption levels and health effects of different
socio-economic groups. Tugendhaft et al. (2016) [2] show that consumption patterns of SSBs differ
across socio-economic groups and differ according to the place of residence. Stacey et al. (2017) [7]
find evidence for positive expenditure elasticity for SSBs, suggesting that a tax on SSBs may reduce
expenditure for SSBs more for high-income groups. Moreover, we can expect health effects and
changes in health care cost to be distributed differently across income groups. The study complements
that of Stacey et al. (2017) [7] by incorporating caloric compensation from switching to non-taxed
beverages and foods.
The aim of this study is to model and quantify the potential economic and health impact of the
recently introduced 10% SSB tax in South Africa.
4
Material and Methods
Model overview We construct a simulation model to analyse the economic and health effects of a tax on SSBs in South
Africa. The calculations are done using Stata version 13 and Microsoft Excel. The modelling
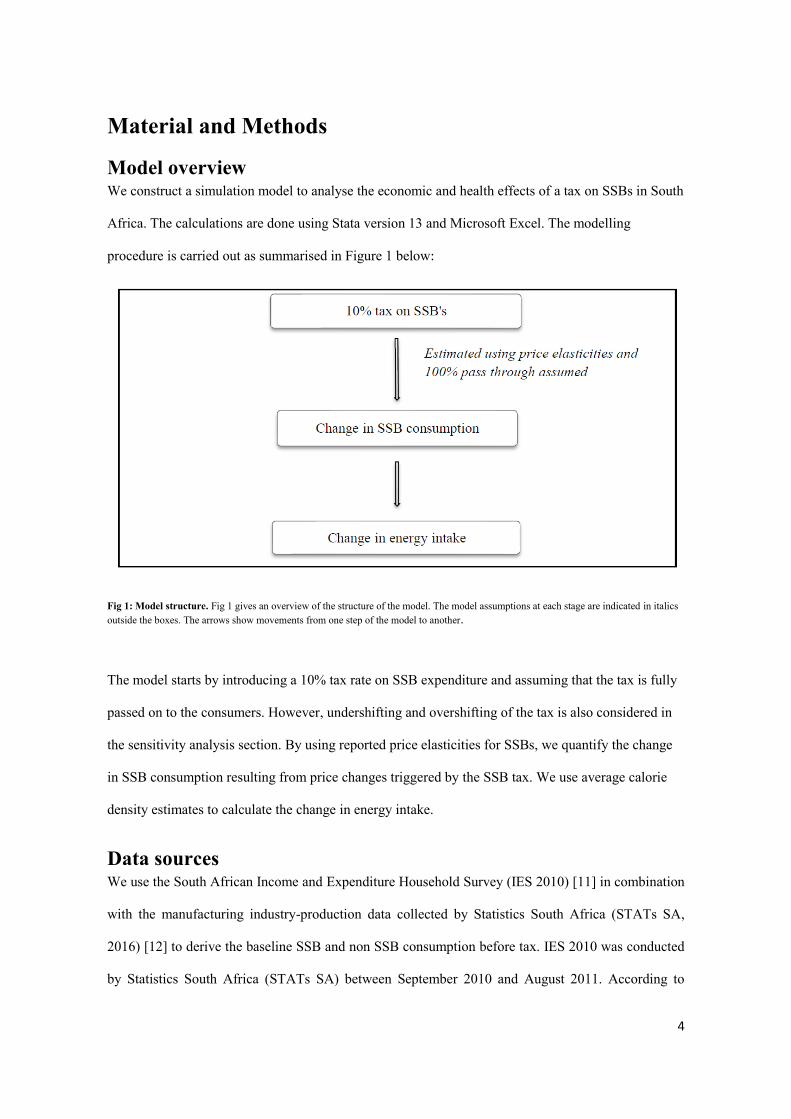
procedure is carried out as summarised in Figure 1 below:
Fig 1: Model structure. Fig 1 gives an overview of the structure of the model. The model assumptions at each stage are indicated in italics outside the boxes. The arrows show movements from one step of the model to another.
The model starts by introducing a 10% tax rate on SSB expenditure and assuming that the tax is fully
passed on to the consumers. However, undershifting and overshifting of the tax is also considered in
the sensitivity analysis section. By using reported price elasticities for SSBs, we quantify the change
in SSB consumption resulting from price changes triggered by the SSB tax. We use average calorie
density estimates to calculate the change in energy intake.
Data sources We use the South African Income and Expenditure Household Survey (IES 2010) [11] in combination
with the manufacturing industry-production data collected by Statistics South Africa (STATs SA,
2016) [12] to derive the baseline SSB and non SSB consumption before tax. IES 2010 was conducted
by Statistics South Africa (STATs SA) between September 2010 and August 2011. According to
5
STATs SA, the main objective of the survey is to collect information on household consumption
patterns in order to update the consumer price index (CPI) basket of goods and services. In IES 2010,
data was obtained from 25,328 households across the country using the diary and recall methods. A
two-stage stratified sampling design with probability proportional to size sampling of primary
sampling units (PSUs) from strata was used in the first stage and systematic sampling of dwelling
units from the sampled PSUs used in the second stage to collect IES 2010 data.
We use the IES 2010 as the main data set to estimate the baseline consumption of different SSB and
non SSB beverages for two main reasons: Firstly, the data gives the same classification of SSBs as
presented in Stacey et al. (2017) [7], the main source of our price elasticity estimates. Secondly, the
baseline SSB consumption figures are in line with published SSB statistics. Manyema et al. (2014) [8]
have used a different data set (SA National Health and Nutrition Examination Survey-SANHANES)
and find that the baseline consumption figures seem to underestimate the officially reported SSB
consumption.
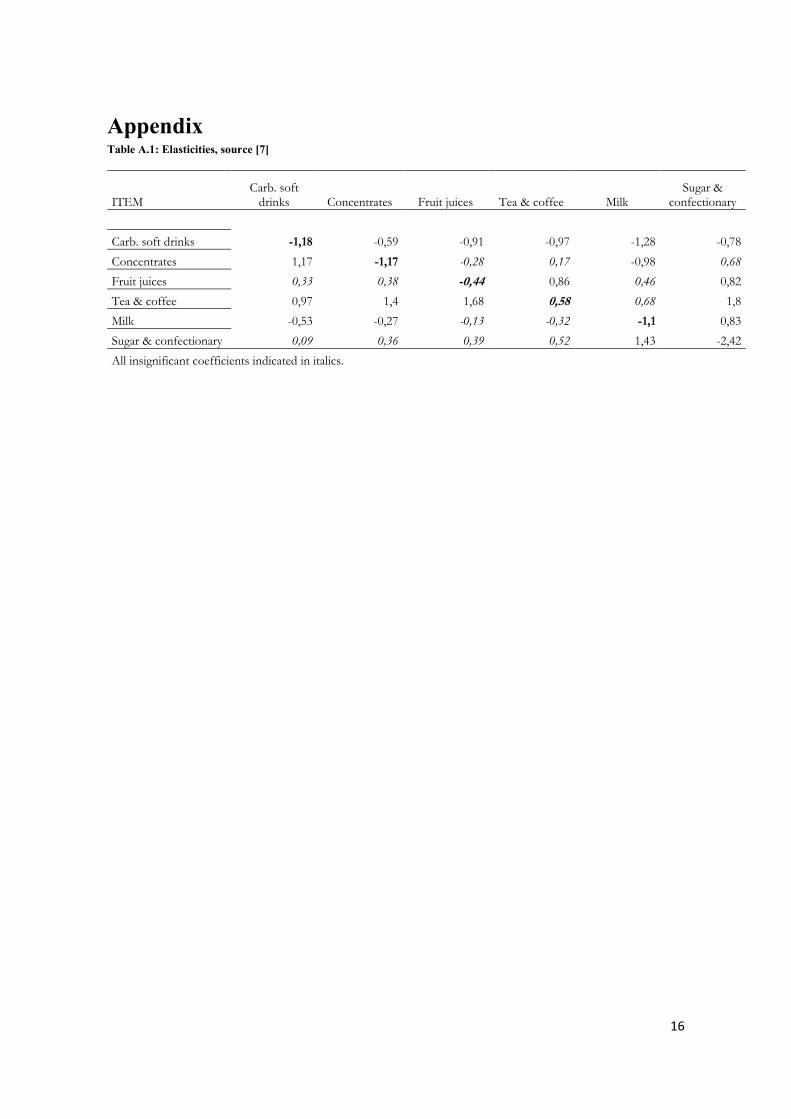
Model assumptions Price elasticities
We use price elasticities estimated by Stacey et al. (2017) [7] to estimate changes in the consumption
of SSB. A summary of the price elasticity figures is also presented in Table A.1 in the appendix
section.
SSB consumption
SSBs are defined as non-alcoholic beverages containing added sugar. For our analysis, it includes
carbonated soft drinks, concentrates and fruit juices. Baseline consumption before proposed SSB tax
was estimated using IES 2010 data. We estimate changes in SSB consumption by assuming a 100%
pass through of a 10% SSB tax combined with price elasticities estimated by Stacey et al. (2017) [7].

6
Government revenue
IES 2010 survey presents SSB expenditure for the year 2010/11. SSB consumption values were
updated from 2010/11 up to 2014 using manufacturing industry data published by STATs SA [12].
Due to data limitations, we assume an average constant growth rate from 2015 to 2017. We then apply
a 10% tax on updated SSB expenditure to forecast government tax revenue. To estimate total SSB tax
revenues for the whole country, we apply sample weights.
Energy intake
We use change in volume of SSBs consumed to estimate the effect of the SSB tax on energy intake.
Initially the reported SSB values are converted to volumes using disaggregated average product price
data collected by STATs SA’s CPI unit. These volumes of SSB are then converted into Kilo joule (kj)
equivalents using calorie levels of each SSB and non SSB as reported in Manyema et al. (2014) [8].
An energy density of 1800 kj/litre for carbonated soft drinks and 2540 kj/litre for whole milk are used.
Fruit juice is dropped out of the analysis since their estimated price elasticity is not statistically
significant. For tea and coffee (consumed at home), the reported values are first converted into
quantities (kg). We assume that 1 kg of tea makes on average 400 cups (200 ml cups) of tea and 1 kg
of coffee makes 84 cups (200 ml) of coffee. We further assume that people use at least 1 cube of sugar
per cup of either tea/coffee and that each cube of sugar has 12 calories. The changes in kj for each
beverage are then summed and weighted (using sample weights) to get South Africa’s total net change
in kj.
Results and Discussions
Descriptive statistics
Given the data limitations, descriptive statistics are given according to different income groups though
the main analysis will be done for all household groups (we do not have differential price elasticity
figures). We define households as ‘low-income’ if their income falls in the bottom 40% of the
household distribution of the estimation sample. The SSB expenditure is classified into carbonated
7
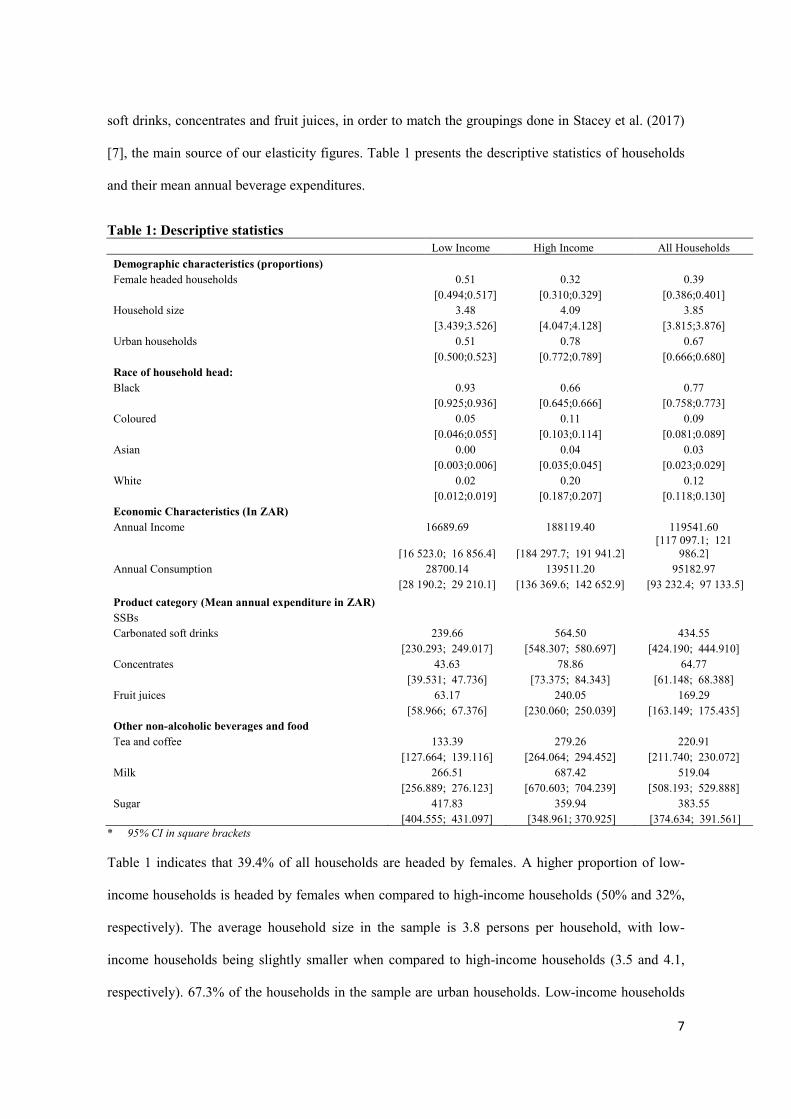
soft drinks, concentrates and fruit juices, in order to match the groupings done in Stacey et al. (2017)
[7], the main source of our elasticity figures. Table 1 presents the descriptive statistics of households
and their mean annual beverage expenditures.
Table 1: Descriptive statistics Low Income High Income All Households Demographic characteristics (proportions) Female headed households 0.51 0.32 0.39 [0.494;0.517] [0.310;0.329] [0.386;0.401] Household size 3.48 4.09 3.85 [3.439;3.526] [4.047;4.128] [3.815;3.876] Urban households 0.51 0.78 0.67 [0.500;0.523] [0.772;0.789] [0.666;0.680] Race of household head: Black 0.93 0.66 0.77 [0.925;0.936] [0.645;0.666] [0.758;0.773] Coloured 0.05 0.11 0.09 [0.046;0.055] [0.103;0.114] [0.081;0.089] Asian 0.00 0.04 0.03 [0.003;0.006] [0.035;0.045] [0.023;0.029] White 0.02 0.20 0.12 [0.012;0.019] [0.187;0.207] [0.118;0.130] Economic Characteristics (In ZAR) Annual Income 16689.69 188119.40 119541.60
[16 523.0; 16 856.4] [184 297.7; 191 941.2] [117 097.1; 121
986.2] Annual Consumption 28700.14 139511.20 95182.97 [28 190.2; 29 210.1] [136 369.6; 142 652.9] [93 232.4; 97 133.5] Product category (Mean annual expenditure in ZAR) SSBs Carbonated soft drinks 239.66 564.50 434.55 [230.293; 249.017] [548.307; 580.697] [424.190; 444.910] Concentrates 43.63 78.86 64.77 [39.531; 47.736] [73.375; 84.343] [61.148; 68.388] Fruit juices 63.17 240.05 169.29 [58.966; 67.376] [230.060; 250.039] [163.149; 175.435] Other non-alcoholic beverages and food Tea and coffee 133.39 279.26 220.91 [127.664; 139.116] [264.064; 294.452] [211.740; 230.072] Milk 266.51 687.42 519.04 [256.889; 276.123] [670.603; 704.239] [508.193; 529.888] Sugar 417.83 359.94 383.55 [404.555; 431.097] [348.961; 370.925] [374.634; 391.561]
* 95% CI in square brackets
Table 1 indicates that 39.4% of all households are headed by females. A higher proportion of low-
income households is headed by females when compared to high-income households (50% and 32%,
respectively). The average household size in the sample is 3.8 persons per household, with low-
income households being slightly smaller when compared to high-income households (3.5 and 4.1,
respectively). 67.3% of the households in the sample are urban households. Low-income households
8
are less likely to live in urban areas in comparison to high-income households (51 % and 78%,
respectively).
Households differ in terms of the race of the household head. On average, 77% of all households are
led by a black household head (low-income households: 93%, high-income households: 66%). 8.5%
of all households are led by a coloured household head (low-income: 5%, high-income: 11%). Only
about 3% of all households are led by an Asian household head (low-income: 0 %, high-income: 4%).
12% of all households are led by white persons (low-income households: 2%, high-income
households: 20%).
The average annual income of all households is ZAR 119,541, equivalently USD 8,869 (low-income:
ZAR 16,690, USD 1,238; high-income: ZAR 13,956, USD 1,035). Consumption levels differ less
between income groups than annual income: Low-income households’ consumption exceeds their
income, whereas high-income households do not spend all their income for consumption (all
households: ZAR 95,183, USD 7,061; low-income: ZAR 28,700, USD 2,129; high-income: ZAR
139,511, USD 10,350).
Annual expenditure for SSBs differs between income groups. On average, households spend ZAR 435
(USD 32) on carbonated soft drinks, low-income households spend ZAR 240 (USD 18) and high-
income households spend ZAR 565 (USD 42). For concentrates, households pay ZAR 65 (USD 5) on
average annually (low-income: ZAR 44 (USD 3), high-income ZAR 79 (USD 6)). For fruit juices,
households spend ZAR 169 (USD 13) on average (low-income: ZAR 63 (USD 5), high-income: ZAR
240 (USD 18)).
For other non-alcoholic beverages, expenditure differs among income groups. On average, households
spend ZAR 220 (USD 16) for tea and coffee; low-income households pay ZAR 133 (USD 10) and
high-income households spend nearly ZAR 280 (USD 21). Consumption of milk differs even more
between income groups. On average, households spend ZAR 519 (USD 39) on milk. Low-income
households spend ZAR 266 (USD 20) and high-income households spend ZAR 687 (USD 51) on
milk. Consumption of sugar also differs between income groups, but the other way around. On
9
average, households spend ZAR 383 (USD 28) on sugar. But low-income households pay ZAR 417
(USD 31) compared to an expenditure of nearly ZAR 360 (USD 27) for high-income households.
Main findings
Impact on prices
Previous studies have indicated that companies do not always increase prices by the same amount as
the SSB tax; they may increase prices by an amount lesser or greater than the tax amount [13]. For
this analysis, we assumed a pass-through rate of the tax of 100% and consider pass-through rates of
80% and 120% in a sensitivity analysis.
Impact on consumption
We relied on the elasticity figures (own price elasticity and cross-price elasticity) estimated by Stacey
et al. (2017) [7] to model the impact of a 10% SSB tax, and equivalently, a 10% price increase of
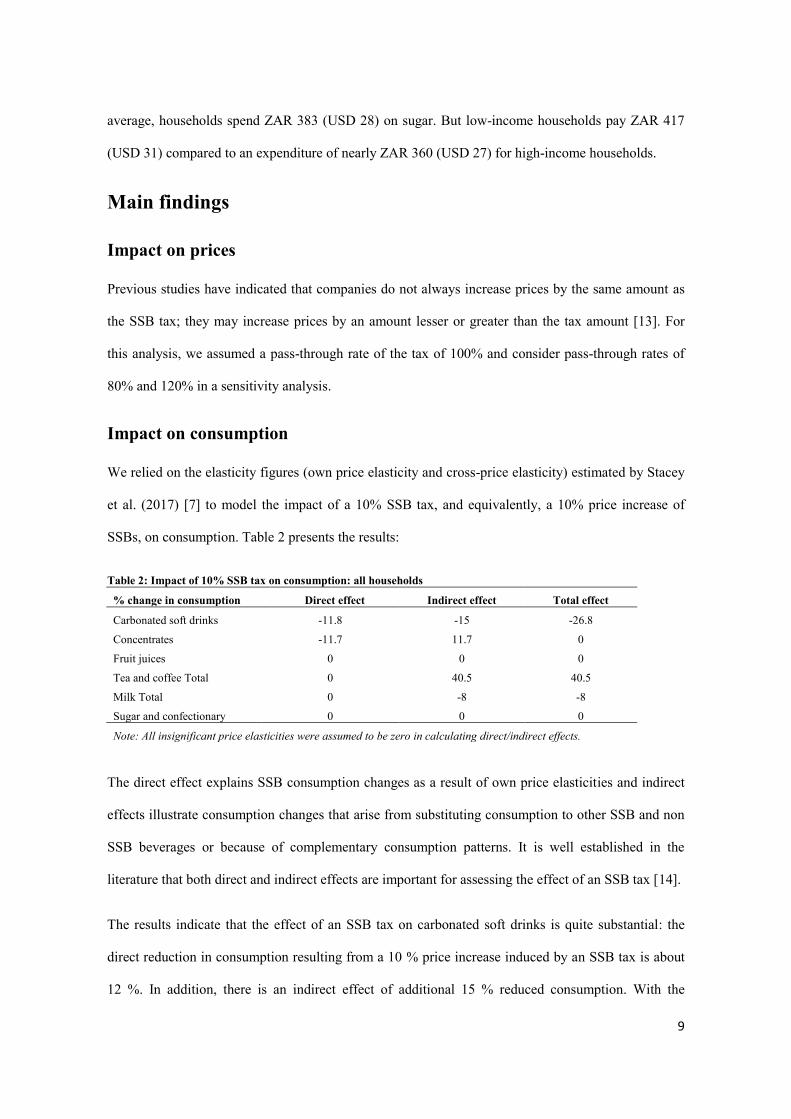
SSBs, on consumption. Table 2 presents the results:
Table 2: Impact of 10% SSB tax on consumption: all households
% change in consumption Direct effect Indirect effect Total effect
Carbonated soft drinks -11.8 -15 -26.8
Concentrates -11.7 11.7 0
Fruit juices 0 0 0
Tea and coffee Total 0 40.5 40.5
Milk Total 0 -8 -8
Sugar and confectionary 0 0 0
Note: All insignificant price elasticities were assumed to be zero in calculating direct/indirect effects.
The direct effect explains SSB consumption changes as a result of own price elasticities and indirect
effects illustrate consumption changes that arise from substituting consumption to other SSB and non
SSB beverages or because of complementary consumption patterns. It is well established in the
literature that both direct and indirect effects are important for assessing the effect of an SSB tax [14].
The results indicate that the effect of an SSB tax on carbonated soft drinks is quite substantial: the
direct reduction in consumption resulting from a 10 % price increase induced by an SSB tax is about
12 %. In addition, there is an indirect effect of additional 15 % reduced consumption. With the
10
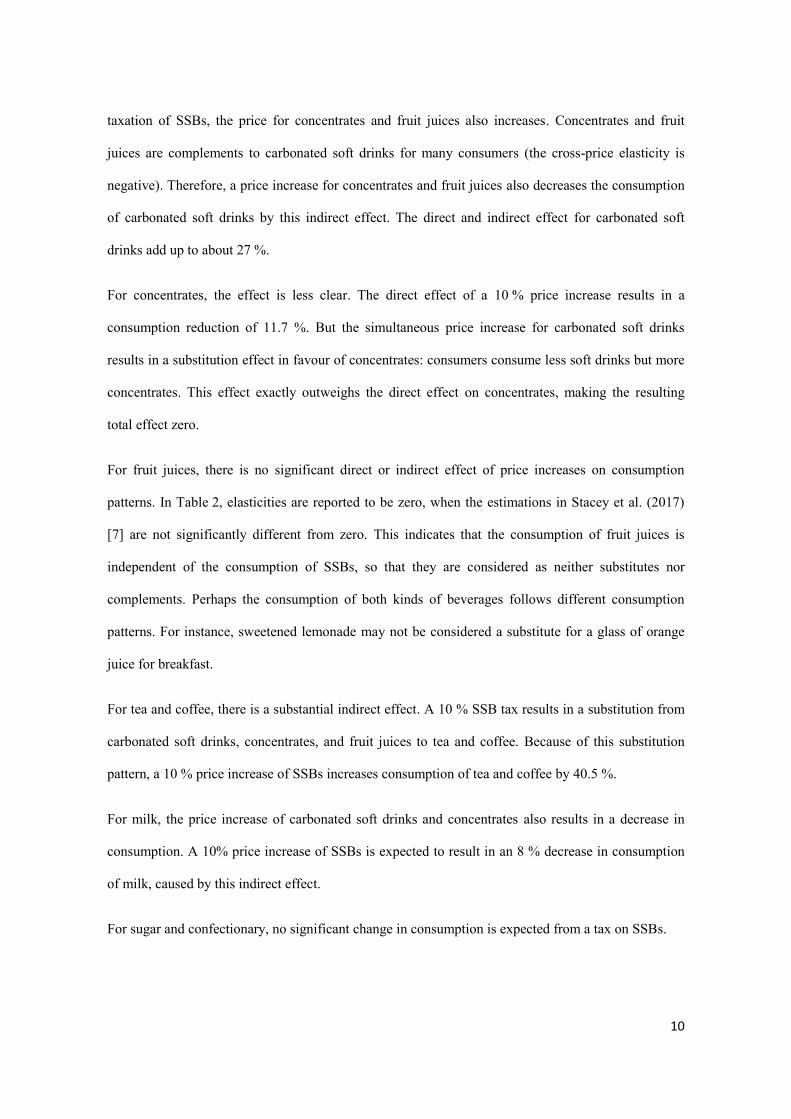
taxation of SSBs, the price for concentrates and fruit juices also increases. Concentrates and fruit
juices are complements to carbonated soft drinks for many consumers (the cross-price elasticity is
negative). Therefore, a price increase for concentrates and fruit juices also decreases the consumption
of carbonated soft drinks by this indirect effect. The direct and indirect effect for carbonated soft
drinks add up to about 27 %.
For concentrates, the effect is less clear. The direct effect of a 10 % price increase results in a
consumption reduction of 11.7 %. But the simultaneous price increase for carbonated soft drinks
results in a substitution effect in favour of concentrates: consumers consume less soft drinks but more
concentrates. This effect exactly outweighs the direct effect on concentrates, making the resulting
total effect zero.
For fruit juices, there is no significant direct or indirect effect of price increases on consumption
patterns. In Table 2, elasticities are reported to be zero, when the estimations in Stacey et al. (2017)
[7] are not significantly different from zero. This indicates that the consumption of fruit juices is
independent of the consumption of SSBs, so that they are considered as neither substitutes nor
complements. Perhaps the consumption of both kinds of beverages follows different consumption
patterns. For instance, sweetened lemonade may not be considered a substitute for a glass of orange
juice for breakfast.
For tea and coffee, there is a substantial indirect effect. A 10 % SSB tax results in a substitution from
carbonated soft drinks, concentrates, and fruit juices to tea and coffee. Because of this substitution
pattern, a 10 % price increase of SSBs increases consumption of tea and coffee by 40.5 %.
For milk, the price increase of carbonated soft drinks and concentrates also results in a decrease in
consumption. A 10% price increase of SSBs is expected to result in an 8 % decrease in consumption
of milk, caused by this indirect effect.
For sugar and confectionary, no significant change in consumption is expected from a tax on SSBs.
11
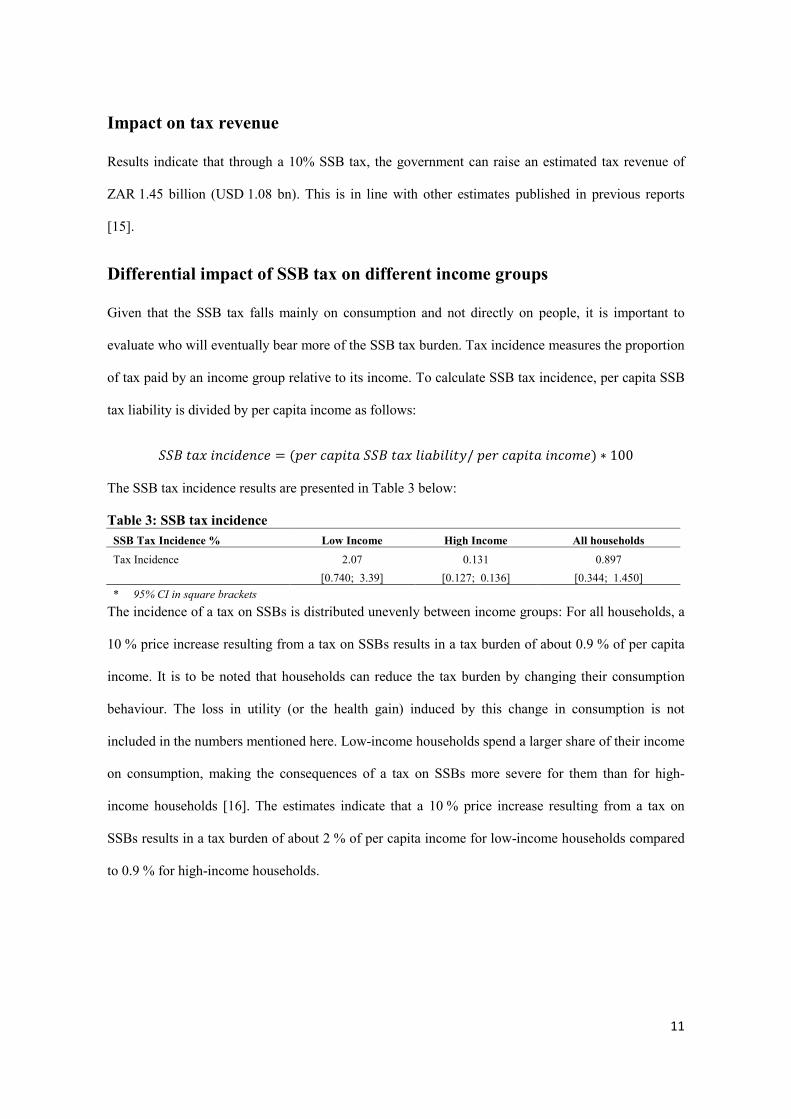
Impact on tax revenue
Results indicate that through a 10% SSB tax, the government can raise an estimated tax revenue of
ZAR 1.45 billion (USD 1.08 bn). This is in line with other estimates published in previous reports
[15].
Differential impact of SSB tax on different income groups
Given that the SSB tax falls mainly on consumption and not directly on people, it is important to
evaluate who will eventually bear more of the SSB tax burden. Tax incidence measures the proportion
of tax paid by an income group relative to its income. To calculate SSB tax incidence, per capita SSB
tax liability is divided by per capita income as follows:
𝑆𝑆𝐵 𝑡𝑎𝑥 𝑖𝑛𝑐𝑖𝑑𝑒𝑛𝑐𝑒 = (𝑝𝑒𝑟 𝑐𝑎𝑝𝑖𝑡𝑎 𝑆𝑆𝐵 𝑡𝑎𝑥 𝑙𝑖𝑎𝑏𝑖𝑙𝑖𝑡𝑦/ 𝑝𝑒𝑟 𝑐𝑎𝑝𝑖𝑡𝑎 𝑖𝑛𝑐𝑜𝑚𝑒) ∗ 100
The SSB tax incidence results are presented in Table 3 below:
Table 3: SSB tax incidence SSB Tax Incidence % Low Income High Income All households Tax Incidence 2.07 0.131 0.897 [0.740; 3.39] [0.127; 0.136] [0.344; 1.450] * 95% CI in square brackets
The incidence of a tax on SSBs is distributed unevenly between income groups: For all households, a
10 % price increase resulting from a tax on SSBs results in a tax burden of about 0.9 % of per capita
income. It is to be noted that households can reduce the tax burden by changing their consumption
behaviour. The loss in utility (or the health gain) induced by this change in consumption is not
included in the numbers mentioned here. Low-income households spend a larger share of their income
on consumption, making the consequences of a tax on SSBs more severe for them than for high-
income households [16]. The estimates indicate that a 10 % price increase resulting from a tax on
SSBs results in a tax burden of about 2 % of per capita income for low-income households compared
to 0.9 % for high-income households.
12
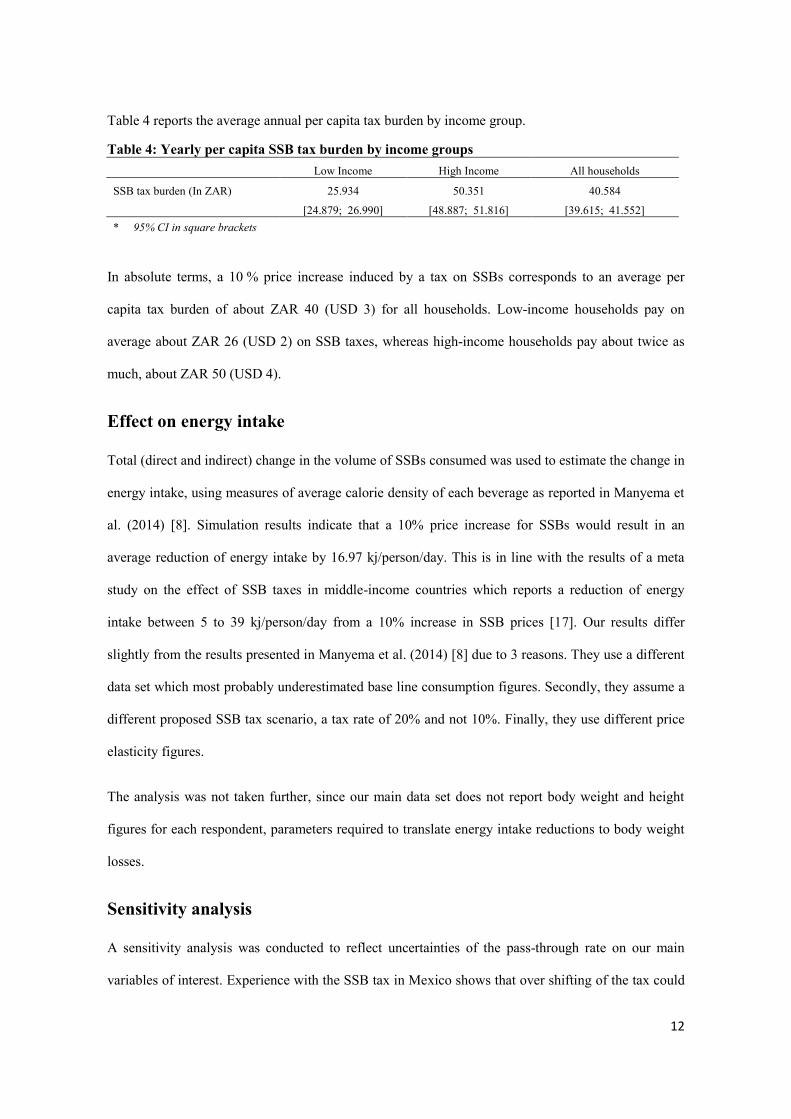
Table 4 reports the average annual per capita tax burden by income group.
Table 4: Yearly per capita SSB tax burden by income groups Low Income High Income All households
SSB tax burden (In ZAR) 25.934 50.351 40.584
[24.879; 26.990] [48.887; 51.816] [39.615; 41.552] * 95% CI in square brackets
In absolute terms, a 10 % price increase induced by a tax on SSBs corresponds to an average per
capita tax burden of about ZAR 40 (USD 3) for all households. Low-income households pay on
average about ZAR 26 (USD 2) on SSB taxes, whereas high-income households pay about twice as
much, about ZAR 50 (USD 4).
Effect on energy intake
Total (direct and indirect) change in the volume of SSBs consumed was used to estimate the change in
energy intake, using measures of average calorie density of each beverage as reported in Manyema et
al. (2014) [8]. Simulation results indicate that a 10% price increase for SSBs would result in an
average reduction of energy intake by 16.97 kj/person/day. This is in line with the results of a meta
study on the effect of SSB taxes in middle-income countries which reports a reduction of energy
intake between 5 to 39 kj/person/day from a 10% increase in SSB prices [17]. Our results differ
slightly from the results presented in Manyema et al. (2014) [8] due to 3 reasons. They use a different
data set which most probably underestimated base line consumption figures. Secondly, they assume a
different proposed SSB tax scenario, a tax rate of 20% and not 10%. Finally, they use different price
elasticity figures.
The analysis was not taken further, since our main data set does not report body weight and height
figures for each respondent, parameters required to translate energy intake reductions to body weight
losses.
Sensitivity analysis
A sensitivity analysis was conducted to reflect uncertainties of the pass-through rate on our main
variables of interest. Experience with the SSB tax in Mexico shows that over shifting of the tax could

13
be possible [18]. We experimented with three pass-through rates, 80%, 100% and 120%. Table 5
presents the results of the sensitivity analysis.
Table 5: Sensitivity analysis Pass through rates
8% 10% 12%
Effect on Beverage consumption (Total effect %)
Carbonated soft drinks -21.44 -26.8 -32.16
Concentrates 0 0 0
Fruit juices 0 0 0
Tea and coffee Total 32.4 40.5 48.6
Milk Total -6.4 -8 -9.6
Sugar and confectionary 0 0 0
Effect on tax revenue (in billion ZAR) 1.16 1.45 1.74
[1.13; 1.19] [1.41; 1.49] [1.69; 1.79]
Effect on energy intake (kj/person/day) 13.539 16.970 20.402
[12.96; 14.12] [16.24; 17.69] [19.53; 21.28] * 95% CI in brackets
The results indicate that if tax was only partially passed through to consumers (pass-through rate of
80%), the corresponding changes in consumption and energy intake will substantially decrease. On
the other hand, if the price increase exceeds the tax (pass-through rate of more than 100%), the effect
of the SSB tax on consumption of other beverages will be stronger. This holds for all product
categories with an estimated elasticity that is significantly different from zero. Qualitatively, the
effects are expected to be similar, independent of the pass-through rate. The direction of the effect is
especially independent of the magnitude of the pass-through. For instance, a tax on SSBs is expected
to decrease consumption of carbonated soft drinks and milk and is expected to increase consumption
of tea and coffee.
The pass-through rate is crucial for the effect of the SSB tax on tax revenue. An overshooting pass-
through rate by more than 100% results in additional government revenue and an amplified incentive
effect. But for incomplete pass-through, a part of the tax results neither in additional government
revenue (but decreases profits by producers) nor in different consumption behaviour.
14
Summary and conclusions Overall, a 10 % SSB tax is predicted to result in a substantial reduction in consumption of carbonated
soft drinks by about 27% and minor reductions in other SSB categories. Results also indicate that this
10% SSB tax can generate about ZAR 14.5 (USD 1.08 bn) billion in government tax revenue
annually. In addition, simulation results indicate that the same SSB tax would result in an average
reduction of energy intake by 16.97kj/person/day. These results imply that an SSB tax could be an
effective instrument to meet the obesity challenge in South Africa. In addition, SSB tax revenue could
be used for complementary measures, such as improving consumer information and consumer
awareness.
Our findings are based on a simulation. Since South Africa has started collecting the SSB tax in April
2018, an empirical analysis of the SSB tax in South Africa will be possible once data is available.
Strengths and limitations of the study Despite the contributions made by this paper to the vast body of literature in this area, it has the
following limitations: Firstly, given the data limitations, we did not use different price elasticities of
demand for low and high-income groups. However, the study gives a detailed comparison of these
income groups under the descriptive statistics section. Secondly, the price elasticities used in this
paper were estimated using urban households; we therefore assumed that rural consumers respond
similarly to price changes. Thirdly, due to data limitations, we do not consider price elasticities by age
group. Dubois; Griffith & O'Connell (2017) [19] have shown that SSB elasticities can also vary by
age – young consumers tend to reduce their SSB consumption more than older consumers. Moreover,
the distinction between short run and long run elasticities is beyond the scope of this paper.
Acknowledgments We would like to thank Jan S. Voßwinkel and seminar participants at the University of Göttingen for helpful comments.
15
References 1. GBD Obesity Collaborators. Health effects of overweight and obesity in 195 countries over 25 years. New
England Journal of Medicine. 2017; 377:13-27. 2. Tugendhaft A, Manyema M, Veerman LJ, Chola L Labadarios D, Hofman KJ. Cost of inaction on sugar-
sweetened beverage consumption: implications for obesity in South Africa. Public Health Nutrition. 2016; 19(13): 2296-2304.
3. Sturm R, Maroba J, Patel D. The Effects of Obesity, Smoking, and Excessive Alcohol Intake on Health Care Expenditure in a Comprehensive Medical Scheme. South African Medical Journal. (2013); 103(11): 840–844.
4. Cabrera Escobar, MA, Veerman JL, Tollman SM, Bertram MY, Hofman KJ. Evidence that a tax on sugar sweetened beverages reduces the obesity rate: a meta-analysis. BMC Public Health. 2013; 13(1): 1072-1081.
5. National Treasury of South Africa. Taxation of sugar sweetened beverages. Policy Paper. 2016. [Online]Available: www.treasury.gov.za/public%20comments/Sugar%20sweetened%20beverages/POLICY%20PAPER%20AND%20PROPOSALS%20ON%20THE%20TAXATION%20OF%20SUGAR%20SWEETENED%20BEVERAGES-8%20JULY%202016.pdf.
6. South African Revenue Services (SARS). [Online]Available: www.sars.gov.za. 7. Stacey N, Tugendhaft A, Hofman KJ. Sugary Beverage Taxation in South Africa: Household. Expenditure,
Demand System Elasticities, and Policy Implications. Preventive Medicine. 2017; 105: S26–S31. 8. Manyema M, Veerman LJ, Chola L, Tugendhaft A, Sartorius B, Labadarios D. The Potential Impact of a 20% Tax
on Sugar-Sweetened Beverages on Obesity in South African Adults: A Mathematical Model. PLOS ONE. 2014; 9(8): e105287. doi: 10.1371/journal.pone.0105287.
9. Manyema M, Veerman LJ, Chola, L, Tugendhaft A, Labadarios, D, Hofman, K. Decreasing the Burden of Type 2 Diabetes in South Africa: The Impact of Taxing Sugar-Sweetened Beverages. PLOS ONE. 2015; 10(11): e0143050. doi:10.1371/journal.pone.0143050
10. Veerman JL, Sacks G, Antonopoulos N, Martin J.The Impact of a Tax on Sugar- Sweetened Beverages on Health and Health Care Costs: A Modelling Study. PLOS ONE. 2016; 11(4):e0151460. doi:10.1371/journal.pone.0151460.
11. Statistics South Africa. Income and Expenditure Survey (IES 2010/11). 12. Statistics South Africa. Manufacturing Industry: Production, 2014. Report no. 30-02-04 (2014). 13. Oxford Economics. The economic impact of soft drinks levy. Final report, August 2016. 14. Dharmasena S, Capps O. Intended and unintended consequences of a proposed national tax on sugar-sweetened
beverages to combat the US obesity program. Health Economics. 2012; 21:669-694. 15. PricewaterhouseCoopers. Proposed sugar levy unlikely to make sizeable dent in fiscal deficit. 2018. [Online]
Available: https://www.pwc.co.za/en/press-room/proposed-sugar-levy-unlikely-to-make-sizeable-dent-in-fiscal-def.html [Accessed 08 April 2018].
16. Sharma A, Hauck K, Hollingsworth B, Siciliani L. The Effects of Taxing Sugar-Sweetened Beverages Across Different Income Groups. Health Economics. 2014; 23: 1159–1184.
17. Nakhimovsky SS, Feigl AB, Avila C, O'Sullivan, G, Macgregor-Skinner, E, Spranca, M. Taxes on Sugar-Sweetened Beverages to Reduce Overweight and Obesity in Middle-Income Countries: A Systematic Review PLoS ONE. 2016; 11(9): e0163358. doi:10.1371/journal.pone.0163358
18. Grogger, J. Soda Taxes and the Prices of Sodas and other Drinks: Evidence from Mexico. American Journal of Agricultural Economics. 2017; 99: 481-498.
19. Dubois P, Griffith R, O'Connell M. How well targeted are soda taxes? 2017. TSE Working paper 17‐868. [Online]Available: https://www.tse-fr.eu/sites/default/files/TSE/documents/doc/wp/2017/wp_tse_868.pdf.
16
Appendix Table A.1: Elasticities, source [7]
ITEM Carb. soft
drinks Concentrates Fruit juices Tea & coffee Milk Sugar &
confectionary
Carb. soft drinks -1,18 -0,59 -0,91 -0,97 -1,28 -0,78
Concentrates 1,17 -1,17 -0,28 0,17 -0,98 0,68 Fruit juices 0,33 0,38 -0,44 0,86 0,46 0,82 Tea & coffee 0,97 1,4 1,68 0,58 0,68 1,8 Milk -0,53 -0,27 -0,13 -0,32 -1,1 0,83 Sugar & confectionary 0,09 0,36 0,39 0,52 1,43 -2,42 All insignificant coefficients indicated in italics.