the east-west center is an education and research
TRANSCRIPT


The East-West Center is an education and research organization established by the U.S. Congress in 1960 to strengthen relations and understanding among the peoples and nations of Asia, the Pacific, and the United States. The Center contributes to a peace-ful, prosperous, and just Asia Pacific community by serving as a vigorous hub for cooperative research, education, and dialogue on critical issues of common concern to the Asia Pacific region and the United States. Funding for the Center comes from the U.S. government, with additional support provided by private agencies, individuals, foundations, corpora-tions, and the governments of the region.
East-West Center Working Papers are circulated for comment and to inform interested colleagues about work in progress at the Center.
For more information about the Center or to order publications, contact:
Publication Sales OfficeEast-West Center1601 East-West RoadHonolulu, Hawai‘i 96848-1601
Telephone: 808.944.7145Facsimile: 808.944.7376Email: [email protected]: www.EastWestCenter.org

E A S T - W E S T C E N T E R W O R K I N G P A P E R SE A S T - W E S T C E N T E R W O R K I N G P A P E R SE A S T - W E S T C E N T E R W O R K I N G P A P E R SE A S T - W E S T C E N T E R W O R K I N G P A P E R SE A S T - W E S T C E N T E R W O R K I N G P A P E R S
Economics Ser iesEconomics Ser iesEconomics Ser iesEconomics Ser iesEconomics Ser ies
No. 101, March 2009
Gnanaraj Chellaraj is a Visiting Scholar at the East-WestCenter and an Independent Consultant for the World Bank.During 2003-2005, Dr. Chellaraj was a Principal Economistwith the Economist Service, Government of Singapore.
Aaditya Mattoo is a Lead Economist in the DevelopmentEconomics Research Group, The World Bank.
East-West Center Working Papers: Economics Series is anunreviewed and unedited prepublication series reporting onresearch in progress. The views expressed are those of theauthor and not necessarily those of the Center. Please directorders and requests to the East-West Center's PublicationSales Office. The price for Working Papers is $3.00 each plusshipping and handling.
Can the Knowledge-CapitalModel Explain Sectoral ForeignInvestment? Evidence fromSingapore
Gnanaraj Chellaraj and Aaditya Mattoo
1
CAN THE KNOWLEDGE-CAPITAL MODEL EXPLAIN SECTORAL FOREIGN INVESTMENT? EVIDENCE FROM SINGAPORE
Gnanaraj Chellaraj Aaditya Mattoo
February 25, 2009 Gnanaraj Chellaraj is a Visiting Scholar at the East West Center and an Independent Consultant to the World Bank. During 2003-2005, Dr. Chellaraj was a Principal Economist with the Economist Service, Government of Singapore. Aaditya Mattoo is a Lead Economist, Development Economics Research Group, The World Bank
2
Acknowledgments Research for this paper was partially undertaken while Gnanaraj Chellaraj was a Visiting Scholar at the University of Adelaide, Australia. The authors are grateful to the School of Economics, University of Adelaide, Department of Economics, University of Colorado, Boulder, the East West Center and the World Bank country Office, Singapore for their technical support. In particular the authors wish to thank Carol Wong, Kimberly Fujiuchi, Laura Moriyama, Anna Tanaka and Sharon Shimabukuro at the East West Center for their technical assistance. The authors are also grateful to Keith Maskus, Marcus Noland, Nancy Lewis, Sumner LaCroix, Rana Hasan, Jian Zhang and the anonymous reviewers for helpful comments and suggestions. Partial funding for this paper from British DIFID is gratefully acknowledged.
3
Abstract Using the knowledge-capital model, we compare factors affecting the inbound
and outbound manufacturing and services investment between Singapore and a sample of industrialized and developing countries. The nature of Singapore’s two-way investment with the industrialized nations is essentially skill seeking, while with the developing countries it is low wage seeking with the exception of inbound services investment, which is skill seeking. During 1994-2003 time period, Singapore’s skill abundance relative to all parent countries, increased annual average inbound investment in manufacturing and services by US$ 8.15 billion and US$ 15.19 billion respectively.
4
1. Introduction
In this paper we apply the KK model to compare the influence of skills on
manufacturing and service sector foreign investment in Singapore. Although in the past,
the KK model has been applied to study factors affecting aggregate investment stocks
(Carr, Maskus and Markusen, 2001 (hereafter CMM); Chellaraj, Maskus and Mattoo,
2009 (hereafter CHMM)) it has not been tested for bilateral investment stocks in the
service sector for any country.
Singapore’s strategy has been to make the country an attractive investment
location for foreign MNEs by emphasizing infrastructure and skills development, along
with fiscal incentives (Chang, 2005; Shin, 2005; Hu, 2004). In the mid 1980s, the GOS
adopted a policy of promoting and developing Singapore as a regional hub (Dobson and
Chia, 1997). There were two strategic elements: developing highly specialized niches
and upgrading the low productivity domestic sector. The Singapore government adopted
the cluster strategy of promoting key industries in electronics, pharmaceutical,
telecommunications, etc (Hattari et al., 2008). In the most recent decade Singapore has
shifted from low end manufacturing toward research, innovation, and service sectors such
as transport, banking and financial investments (Sung 2006). Between 1984 and 2003
Singapore rapidly closed its skills gap with most industrialized countries through training
and expanding education (Anwar, 2008). Kee and Hoon (2005) argue that the rapid
economic development of Singapore may be partly attributed to these policies.
In 2003, inbound direct and portfolio investment stocks in manufacturing
exceeded the corresponding outbound investment stocks by a margin of over 1.6 to 1, as
noted in figure 1 while the corresponding figure for services was 2:1 (figure 2). Further,

5
two-way investment between industrialized countries and Singapore exceeded that
between developing countries and Singapore by more than 6 to 1 in manufacturing and
more than 4:1 in services (figures 1 and 2). It is plausible that increasing relative
Singapore skill endowments underlay the increase in outbound investment stocks,
especially in developing countries for both manufacturing and services.
The paper proceeds as follows. In the next section we briefly review the KK
model to motivate the analysis. In Section 3 we specify the KK model for estimation and
in Section 4 we provide the econometric results. In the final section we discuss the
potential economic and policy significance of the findings and offer concluding remarks.
2. The Knowledge-Capital Model
2. The Knowledge-Capital Model and Prior Empirical Literature
Since Markusen (1984) and Helpman (1984), the general-equilibrium theory of
the multinational enterprise has focused on two distinct motivations for investment: to
access markets in order to circumvent trade frictions (horizontal FDI) and to employ low-
wage labor for assembly parts of the production process (vertical FDI, or fragmentation).
In the former case, multiple plants making similar goods are located in different markets
and produce either for local markets or regional exports. In the latter, headquarters are
split from assembly, and goods are traded in different stages of fabrication.
2a. Theoretical Overview
These motivations may be understood consistently within the general-equilibrium
knowledge-capital model of FDI, explicated in Markusen (2002). The KK approach
includes three principal assumptions. First, services of knowledge-based activities, such as
R&D, can be geographically separated from production and supplied to production
6
facilities at low cost. Second, these knowledge-intensive activities are skilled-labor
intensive relative to production. These assumptions create a motive for the vertical
fragmentation of production, locating R&D activities where skilled labor is abundant and
production where unskilled labor is plentiful. There will also be a motive for locating
production in large markets if there are plant-level scale economies.
Third, knowledge-based services have a (partial) joint-input characteristic, in that
they can be utilized simultaneously by multiple production facilities. The third assumption
creates firm-level scale economies and motivates horizontal investments that replicate the
same products or services in different locations.
The model assumes two homogeneous goods (X and Y), two countries (h and f),
and two homogeneous factors, unskilled labor (L) and skilled labor (S), which are
internationally immobile. Good Y is labor-intensive and produced under constant returns
to scale in a competitive industry. Good X is skilled-labor-intensive overall, has increasing
returns to scale at the plant level, and is subject to Cournot competition with free entry and
exit. Within a firm, headquarters services and plant facilities may be geographically
separated and a firm may have plants in one or both countries. Because R&D services can
be shared across plants, sector X exhibits firm-level economies of scale as well. Transport
costs in trade use unskilled labor and there are fixed costs of investing in a new plant.
With this structure, there are several firm types that can arise in equilibrium. First,
there may be national firms that maintain a single plant and headquarters in one country
and may or may not export to the other. Second, there may be horizontal MNEs that
maintain plants in both countries with headquarters located in one country. Finally, there
7
may be vertical MNEs that maintain a single plant in one country and headquarters in the
other.
Different country characteristics favor various firm types producing or
maintaining headquarters in either country. For example, national firms will be more
likely in country h if it is relatively large, which encourages local production while firms
would avoid investment costs in the smaller nation. National firms also dominate if the
two nations are similar in size and relative endowments, tending to discourage vertical
FDI, and transport costs are low or foreign investment barriers are high, reducing
horizontal investment.
Horizontal MNEs become important if the nations are similar in size and relative
endowments, transport costs are high and investment costs are low. In this environment
firms find it advantageous to locate production capacity in both locations, taking
advantage of firm-level scale economies, while selling primarily in local markets to avoid
transport costs. However, if the countries vary in endowments but have similar size
firms, MNEs would concentrate headquarters in the skilled-labor-abundant country and
production in the skilled-labor-scarce country. Thus vertical firms headquartered in the
skilled-labor-abundant countries are favored unless trade costs are high. Vertical MNEs
become especially significant if one country is small and skilled-labor abundant, in which
case headquarters locate there and produce in the other location. This incentive is
increased if trade costs from the host country back to the parent country are low.
2b. Application to Singapore
We apply this model informally to Singapore in order to motivate our regression
analysis. Throughout the period of analysis, Singapore, despite experiencing rapid
8
economic growth, remained small in terms of its own market size (domestic
consumption) in comparison with the other countries in our sample. However, the
economy dramatically increased its relative skill endowments. For example, figure 3
depicts trends over time of differences in Singapore skill endowments and average skill
endowments of selected industrialized and developing countries for the period 1994-
2003.1 This reflects increases in Singapore’s endowment of occupational skills relative to
the average skills of partner nations. There is a general upward trend suggesting
widening of skill differences between Singapore and its investment partners.
The trends in inward services FEI stocks for all industrialized economies in our
sample are presented in figure 4 and show a general upward trend. However,
manufacturing FEI from these countries increased until 1999 and then exhibited a
downward trend. Similarly, while outbound FEI in services to all industrialized countries
in our sample showed an upward trend since 1998, manufacturing FEI rose until 2000
and thereafter declined sharply (figure 5).
Regarding developing countries inbound manufacturing FEI declined between
1994 and 2003 while inbound services FEI rose sharply (figure 6). However, both
manufacturing and services FEI from Singapore to the developing countries in our
sample rose during the 1994-2003 period and in the case of services it increased sharply
(figure 7). As Singapore became skill abundant relative to the developing countries in
our sample, inbound manufacturing investment declined while services investment
increased. Meanwhile, relative Singapore skill abundance has resulted in sharp increases
in both manufacturing and services FEI to developing countries.
1 We define this measure of skill differences in the next section.

9
2c. Prior Estimation
In CMM (2001) the initial empirical estimation of the KK model was performed,
using a 1986-1994 panel dataset of bilateral country-level affiliate sales in manufacturing,
involving both U.S. affiliates abroad and foreign affiliates in the United States. In their
econometric work, the authors found that a convergence in income (GDP) between the
United States and any investment partner (holding the sum of their incomes constant)
increased affiliate sales in both directions. There was substantially greater evidence of
horizontal FDI, with affiliate sales rising in host countries with skill endowments closer
to those of the United States, than of vertical FDI. This result may have been due to the
selection of countries, which did not include many lower-income developing nations.
This empirical evidence has been substantiated by other studies. Gao (2003)
included an additional variable to account for ethnic networks and found that there is a
significantly positive role in inward FDI of ethnic Chinese networks. Waldkirch (2008)
studied German MNEs and found that FDI happens largely between similarly endowed
countries, with little evidence of any vertical motivation. Braconier, Norback and Urban
(2005) included other industrialized countries, such as Sweden, and found evidence to
support the KK model.
An important criticism of the CMM approach was that pooling bilateral data
could disguise the actual relationships between endowment differences and MNE
activity. The reason is that the United States was the host in half the observations and the
parent in the rest, implying that the sign of their skill-endowments variable (the
difference between parent and host in the ratio of skilled to total labor) depended on the
direction of the investment. Thus, where the United States was a skill-abundant host
10
(parent), an increase in skill differences implied a convergence (divergence) in
endowments. This difference makes interpretation of coefficients difficult and calls for
splitting the sample into inbound and outbound investment (Blonigen, Davies and Head,
2003; Blonigen, 2005).
A second criticism of such studies is the potentially inappropriate pooling of data
from developing and industrialized countries. Blonigen and Wang (2004) found that the
underlying factors affecting the location of FDI activity varied systematically across
these country groups in a way that was not captured by prior empirical models. Thus,
U.S. outward FDI to large industrialized countries is strongly attracted to countries with
higher skill abundance, suggesting a horizontal motivation. However, the effect was
reversed for FDI in developing countries, although the relationship was not statistically
significant.2
The above criticisms were addressed by CHMM (2009) using aggregate bilateral
foreign investment stocks data for Singapore which found strong evidence that the nature
of Singapore’s two-way investment with the industrialized nations has shifted into skill-
seeking activities over the period, while Singapore’s investments in developing countries
have increased sharply and become concentrated in labor-seeking activities. The results
also indicate that the size of the ASEAN market also influenced inbound foreign
investment in Singapore from industrialized countries.
This research is the first attempt to estimate the KK model for the service sector
for any country and also the first attempt to separately compare the impact of skills on
manufacturing and service sector investments. Furthermore, as MNEs base regional
2 See also Yeaple (2003).
11
headquarters in Singapore and invest in neighboring countries, the use of ASEAN GDP
to account for host market size is appropriate for inbound foreign investment in both
manufacturing and services. As this research incorporates both these investment
objectives, a panel study of two-way FDI into and out of Singapore taking into
consideration the impact of the regional market size should be of considerable interest.
In addition, we also incorporate the role of the GOS in maintaining political stability,
strict anti-corruption laws as well as the development of infrastructure such as roads,
rails, energy, telecommunications and ports.
3. Methodology and Data
3a. Basic Specification
Following CHMM, our specification for the determinants of both manufacturing
and service sector investment is as follows:
FEIijt = β0 + β1 (GDPit +GDPjt) + β2 (GDPit –GDPjt)2 + β3 (SKit – SKjt)
+β4 (GDPit –GDPjt) * (SKit – SKjt) + β5 ICjt + β6 INSTjt + β7 INFRAjt + β8 TCjt + β9 TCjt *
(SKit – SKjt)2+ β10 TCit + β11 DISTij+ eijt (1)
The dependent variable is the stock of foreign equity investment (FEI) invested by
country i (the parent) in country j (the host).3 For inward investment, Singapore is always
the host country and for outward investment Singapore is always the parent country.
CMM (2001) employed majority-owned affiliate sales in manufacturing as their measure
of investment activity. Available data do not incorporate this measure and we choose to
analyze investment stocks instead. Note that focusing on stocks instead of activity flows
may actually be an advantage, for the former measures reflect long-term decisions to
3 Definitions of variables and data sources are provided in the following subsection.

12
invest and are less volatile, and less dependent on omitted variables, than are annual
activity measures (Braconier, Norback and Urban, 2005).
(GDPit +GDPjt) is the sum of parent-country and host-country real gross domestic
product (GDP Sum). It captures joint market size and the coefficient is expected to be
positive. The next variable, the squared difference in GDP between parent and host
nations captures changes in relative size, holding relative factor endowments fixed, and
the theory implies that incentives for market-seeking investment should increase as
countries become more similar in size. Thus, in principle there should be an inverted U-
shaped relationship between FEI stock and country size differences, suggesting that the
coefficient should have a negative sign. One difficulty with this interpretation is that
Singapore is small relative to the other countries in the data. When one partner is small,
the underlying theoretical discrimination between horizontal and vertical motivations is
less sharp and it is possible to observe a positive coefficient on size differences.
The next variable is the difference in relative skill endowments between the
parent and host countries. If the recipient nation is skill-abundant, implying that the skill
differences variable is negative, a rise in its endowment would attract skill-seeking FDI
and vice versa. On the other hand, if the recipient nation is labor abundant, implying that
the skill differences variable is positive, a fall in its endowment would attract low wage
seeking FDI.
The interaction terms introduced in this model are based on numerical simulation
by CMM (2001). The basic result of this simulation is that the effect of differences in
country size on FDI depends on whether the countries are similar in relative endowments
and, if they are different in size, on whether the small country is the skill abundant

13
country. While coefficient β3 captures the direct marginal impact of skill differences on
investment stocks, the total marginal effect depends on other economic determinants, as
suggested by the non-linearities captured in interaction terms. For example, if β4 is
negative and the parent country is larger than the host, a reduction in the difference in
country size (that is, an increase in the size of the host) should reduce the sensitivity of
investment stocks to skill differences. Thus, the interaction between country-size
differences and skilled labor differences is expected to have a negative impact since FEI
stocks should be smaller where market size differences are large, for a given difference in
skills. The interaction term between host-country trade costs and squared skill
differences is designed to capture the fact that such costs should encourage horizontal,
but not vertical, investment, in which case they should matter less when skill differences
are large. But, as CMM (2001) point out, this is not a theoretically sharp hypothesis.
Higher host-country investment costs (ICjt) should reduce investment. Similarly,
higher host country institutional barriers (INSTjt) and host country infrastructure
impediments (INFRAjt) should have a negative impact on FEI. To the extent that
investment is driven by market-seeking incentives, higher host-country trade costs (TCjt)
should increase it due to tariff-jumping. However, where investment is undertaken to
fragment production networks, higher trade costs can deter FEI. Parent-country trade
costs (TCit) should have a negative impact on FEI stocks since they make exporting
output back home more costly. Finally, DISTij is the distance in kilometers between
Singapore and the capital cities of partner countries. Generally, one would anticipate a
negative coefficient on this variable.

14
This basic framework is applied to data samples involving both inbound and
outbound manufacturing and services FEI stocks in Singapore. This estimation should
capture the basic influences of the KK model. However, we also split the sample into
inbound and outbound separately for industrialized and developing country partners and
investigate foreign investment behavior for these groups separately for both services and
manufacturing. Outbound and inbound investments to and from industrialized countries
in both manufacturing and services are expected to be skill seeking. Outbound investment
to developing countries for both manufacturing and services is expected to be low wage
seeking. Although we have no particular expectation for inbound investment from
developing countries into Singapore trends indicate that as Singapore became relatively
more skill abundant, manufacturing investment declined and services investment
increased.
3b. Data Sources and Description
The dependent variable in the KK model should be a measure of bilateral stocks
of foreign direct investment. Unfortunately, Singapore only sporadically compiled
outbound and inbound FDI data before 1998 for many countries. Information from 1994-
2003 is available on bilateral stocks of foreign equity investment, defined as the sum of
direct equity investment and portfolio equity investment. Direct equity investment
incorporates all investments made in ownership entailing a measure of management
control, with a minimum ownership threshold of ten percent, while portfolio investment
involves financial stakes unrelated to management control. Thus, the measure we
analyze, FEI stocks, is somewhat broader than FDI. However, in Singapore portfolio
investment is relatively small. Stocks of such investment amounted to no more than 9.5

15
percent of total FEI stocks from 1994 to 2003 and averaged less than 4.0 percent.
Moreover, the correlation between FEI stocks and FDI stocks from 1994 through 2003 is
0.929. The sources of the FEI data are the Statistical Yearbook of Singapore, Foreign
Equity Investment in Singapore and Singapore’s Investment Abroad, published by the
GOS’s Department of Statistics. They are converted into millions of 1990 US dollars
using contemporaneous exchange rates and the US GDP deflator.
Data on the right-hand side variables come from sources detailed in CMM (2001),
updated through 2003. Real GDP is measured in billions of US dollars for each country.
Annual real GDP figures in local currencies were converted into dollars using the market
exchange rate. Both GDP and exchange rates are from the International Financial
Statistics of the IMF. Skilled labor abundance is defined as the sum of occupational
categories 0/1 (professional, technical, and kindred workers) and 2(administrative workers)
in employment in each country divided by total employment. These figures are compiled
from annual surveys in the Yearbook of Labor Statistics published by the International
Labor Organization. In cases where some annual figures were missing, the skilled labor
ratios were taken to equal the period averages for each country. Our skill difference
variable is the relative skill endowment of the parent country less that of the host country.
The cost of investing in the affiliate country is a simple average of several indices
of perceived impediments to investment, reported in the World Competitiveness Report
(1984-1994) and Global Competitiveness Report (1995-2003) of the World Economic
Forum. The investment barriers include restrictions on the ability to acquire control in a
domestic corporation, limitations on the ability to employ foreign skilled labor, restraints
on negotiating joint ventures, strict controls on hiring and firing practices, market

16
dominance by a small number of enterprises, an absence of fair administration of justice,
difficulties in acquiring local bank credit, restrictions on access to local and foreign capital
markets and inadequate protection of intellectual property. The resulting indices are
computed on a scale of zero to 100, with a higher number indicating higher investment
costs. The institutional barriers are defined as the frequency of bribery and corruption in
the host country and are computed on a scale from zero to 100 with zero being the least
corrupt and 100 being the most corrupt. Meanwhile, the infrastructure barriers refers to the
quality of infrastructure in the host country and includes the quality of railroad, ports, air
transport, waterways, roads, electric supply as well as telecoms and telephones. They are
also computed on a scale of zero to 100 with zero being the most efficient and 100 being
the least efficient. Finally, the trade cost index is taken from the same source and is defined
as a measure of national protectionism, or efforts to prevent importation of competitive
products. It also runs from zero to 100, with 100 being the highest trade costs. All of these
indices are based on extensive surveys of MNE managers. Finally distance is the number
of kilometers of each country’s capital city from Singapore.
Sixteen countries are included in the manufacturing and services sample for the
period 1994-2003. 4 Overall total outbound FEI stocks to developing countries were far
higher than the reverse activity. In contrast, total inbound FEI stocks from industrialized
countries were much higher than Singapore’s outward FEI to those nations. It is important
to note that there are a number of years early in the period where either inward or outward
4 The countries included in the sample (1994-2003) are Australia, Canada, France, Germany, the Netherlands, Japan, Switzerland, Taiwan, UK, USA, Hong Kong, China, Indonesia, Malaysia, the Philippines, and Thailand.
17
investment stocks were reported to be zero, almost always with developing countries.
Thus, our estimation procedure is Tobit.
3c. Endogeneity and Instrumental Variables
It is evident that causation may run both ways between skill differences, which is
our primary determinant of interest, and foreign investment. For example, an increase in
inbound FEI may raise the level of skills in Singapore due to professional training within
MNEs. Moreover, flows of investment may be accompanied by skilled engineers and
managers within the firm. Thus, the skill-differences variable is likely to be endogenous
to investment in some degree. To address this issue we develop instruments that
plausibly are correlated with skill differences but not correlated with the regression error
term.
We incorporate two classes of instruments. First is the vector of legal marriage
ages for males and females in the partner country, which we take from the UN
Demographic Yearbook and the relevant statistical yearbooks of individual countries.
The idea is that as the prevalence of skills rises, countries are likely to adopt higher
minimum marriage ages in response to demographic pressures. For example, France
increased its marriage age for women from 15 to 18 in 2000 and India increased it from
17 to 19 in 1996. Thus, for French investment in Singapore these instruments are the
marriage ages of males and females in France, whereas for Singapore’s investment in
India it is the corresponding Indian ages. We note that there is considerable variation
across countries in legal marriage ages but not much time variation within any country in
our period.
18
A second class of instruments relates to labor-market conditions abroad. For
regressions involving bilateral FEI stocks between Singapore and the industrialized
economies we employ the contemporaneous unemployment rates in China and the
Philippines. The idea is that changes in aggregate labor demand in those countries
should be correlated with labor-market conditions, including occupational mix, in
Singapore and the developed economies, but should be exogenous to decisions to change
their bilateral FEI stocks. Similarly, for bilateral skill-ratio differences between
Singapore and the developing economies our instrument is the average unemployment
rate of OECD countries, which is available from an on-line OECD database. The citizens
of these countries also have options to go to other countries such as the US, Australia or
UK if unemployment rates remain high. But, countries such as the UK, US or Australia
have quotas on foreign skilled labor while Singapore does not. Hence, it is appropriate to
use unemployment rates in OECD countries, China and the Philippines as instrumental
variables. The Chinese unemployment rate is available from the China Statistical
Yearbook and the Philippines unemployment rate is available from the Philippines
Yearbook of Statistics.
3d. Regional FDI Activities
One notable feature that helps explain the structure of foreign investment is that
MNEs often establish an affiliate in Singapore and then use it as a base to invest in
neighboring developing countries (Low, Ramstetter and Yeung, 1998). Outward
investment by foreign-controlled firms was around 60 percent of total outward
investment during 1995, declining to 40 percent by 19985. It declined further to 35% by
5 Department of Statistics, Government of Singapore.

19
2003 due to waves of mergers and consolidations in which Singapore based corporations
purchased majority stakes in foreign firms operating in Singapore (Department of
Statistics, 2003). To check the robustness of the results using Singapore GDP, we re-
estimate the inbound equations for industrialized countries using ASEAN GDP to
account for regional investment activities for both manufacturing and total investment.
Specifically, the variables GDPSUM and the square of GDP differences would change to
account for ASEAN GDP. For skill differences interacted with GDP differences, we
would use ASEAN GDP interacted with skill differences between Singapore and its
investment partners. Meanwhile all other variables remain the same as the basic
specification. Here, the focus is only on inbound investment from industrialized
countries.
Annual GDP figures for ASEAN6 in local currencies were converted into US
dollars using the market exchange rate. Both ASEAN GDP and exchange rates are from
the International Financial Statistics of the IMF.
4. Results
First the basic framework is applied to the inbound and outbound FEI data for all
sectors for manufacturing and services. Our instrumental-variables procedure is to run
the first-stage regressions of relative skill differences on the instrumental variables
discussed above for each sample and use the predicted values to estimate second-stage
tobit regressions. With few exceptions, the Sargan test7 indicated that the variables are
6 Sum of the GDPs of Singapore, Malaysia, Indonesia, Thailand, the Philippines, Vietnam, Cambodia and Laos. Time series data for Myanmar and Brunei Darussalam were not available for all years and hence were excluded from the ASEAN GDP.
7 A Sargan test for over-identifying restrictions is used to test for the validity of instruments. The instruments adopted are valid if the p value is greater than 0.1.
20
uncorrelated with the residuals and serve as appropriate instruments. The first-stage
equations are available upon request.
4a. Basic Specification
The second-stage Tobit regression results for inward manufacturing FEI stocks in
Singapore for the period 1994-2003 presented in Table 1 indicate that the effect of joint
market size, measured by the sum of GDP, is positive and significant, and the coefficient
on squared difference in real GDP is negative (though insignificant), the expected
outcome under the KK model. However, the squared difference in real GDP for inward
services investment in the third column is positive and significant, not as expected under
the KK model. These findings suggest that while incoming manufacturing investments
follow the inverted-U shape in size differences, services investments seem to rise with
differences in GDP. It may be that larger parent countries, such as the United States and
Japan, are more likely to invest disproportionately in the various service sectors as their
GDP rises. Outbound manufacturing and services investment from Singapore rise with
market size and falls with GDP size differences, as anticipated, although in the case of
the latter, the squared GDP skilled differences are insignificant.
Host investment costs for inbound and outbound manufacturing are negative and
significant at the five percent level and for outbound services at the one percent level,
while host trade costs are positive and significant at the one percent level only for
inbound services. Parent trade costs are also negative and significant at the one percent
level for inbound services only. Meanwhile, institutional barriers are an impediment in
all four equations while the infrastructure barriers are an impediment to only outbound
investment for both manufacturing and services. This is not surprising as infrastructure,

21
especially public transport infrastructure in Singapore is highly developed even compared
to many industrialized countries such as the United States and the index has not varied
much from year to year. Finally, distance does not appear to have any impact on inbound
stocks for either manufacturing or services but it significantly reduces outbound
aggregate investment in both sectors.
Our main interest lies in the impact of relative skill endowments. The direct
coefficients on relative skill differences are negative and significant at the one-percent
level for only the services inbound sample but not for manufacturing. However, results
for outbound regressions indicate that an increase in Singapore’s skills compared to the
countries in which it invests tends to significantly increase FEI stocks in both sectors.
Thus, an increase in this variable would suggest a rising relative skill endowment in
Singapore, which induces a rise in both manufacturing and services outbound FEI stocks.
This finding supports the view that Singapore’s investment abroad is concentrated in
labor-intensive assembly manufacturing and low skill services industries.
As noted earlier, the total impact of skill differences depends also on the
interaction coefficients. Thus, the change in FEI as a result of change in skill differences
is derived as follows:
∂FEI/∂(SKit – SKjt)= β3+ β4 (GDPit –GDPjt)+ 2*β9 (TCit * (SKit – SKjt)) (2)
The interaction between GDP differences and skill differences is negative and significant
for inbound FEI for both manufacturing and services. It is negative and insignificant for
outbound manufacturing FEI and positive and insignificant for outbound services FEI.
A negative and significant coefficient in the case of inbound manufacturing and services
FEI suggests that as Singapore increases in size relative to the host countries, it reduces
22
sensitivity of inbound investment stocks to skill differences for both manufacturing and
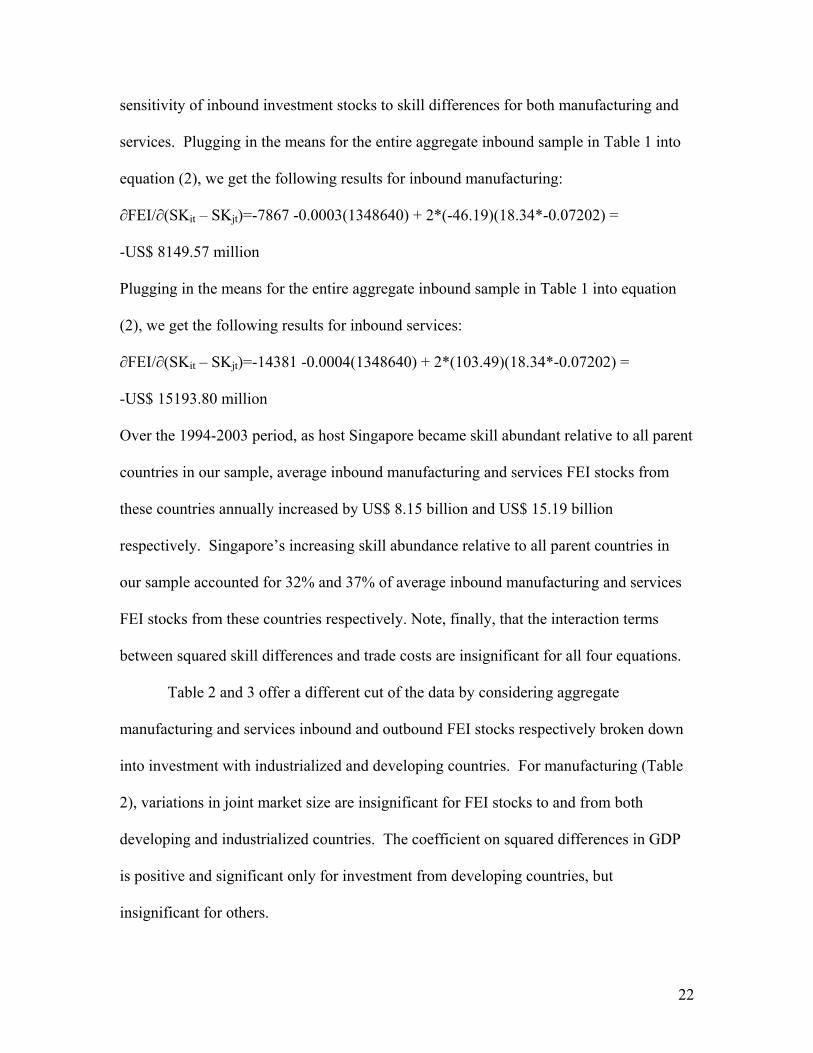
services. Plugging in the means for the entire aggregate inbound sample in Table 1 into
equation (2), we get the following results for inbound manufacturing:
∂FEI/∂(SKit – SKjt)=-7867 -0.0003(1348640) + 2*(-46.19)(18.34*-0.07202) =
-US$ 8149.57 million
Plugging in the means for the entire aggregate inbound sample in Table 1 into equation
(2), we get the following results for inbound services:
∂FEI/∂(SKit – SKjt)=-14381 -0.0004(1348640) + 2*(103.49)(18.34*-0.07202) =
-US$ 15193.80 million
Over the 1994-2003 period, as host Singapore became skill abundant relative to all parent
countries in our sample, average inbound manufacturing and services FEI stocks from
these countries annually increased by US$ 8.15 billion and US$ 15.19 billion
respectively. Singapore’s increasing skill abundance relative to all parent countries in
our sample accounted for 32% and 37% of average inbound manufacturing and services
FEI stocks from these countries respectively. Note, finally, that the interaction terms
between squared skill differences and trade costs are insignificant for all four equations.
Table 2 and 3 offer a different cut of the data by considering aggregate
manufacturing and services inbound and outbound FEI stocks respectively broken down
into investment with industrialized and developing countries. For manufacturing (Table
2), variations in joint market size are insignificant for FEI stocks to and from both
developing and industrialized countries. The coefficient on squared differences in GDP
is positive and significant only for investment from developing countries, but
insignificant for others.
23
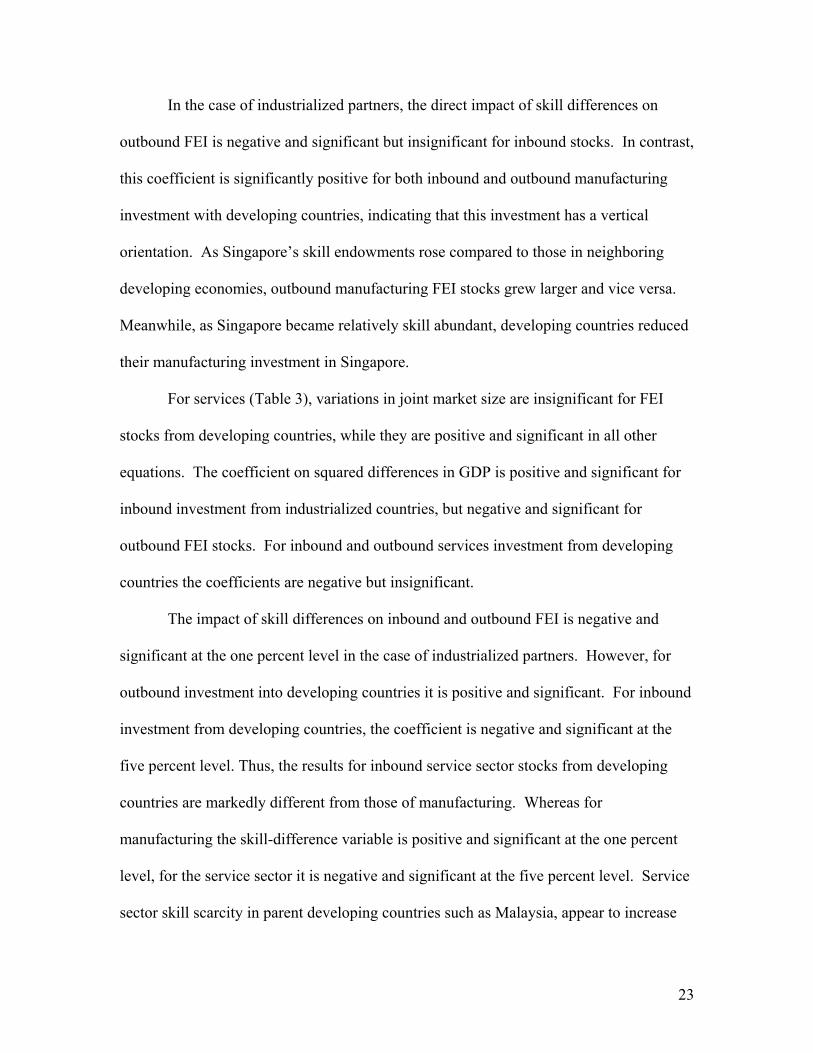
In the case of industrialized partners, the direct impact of skill differences on
outbound FEI is negative and significant but insignificant for inbound stocks. In contrast,
this coefficient is significantly positive for both inbound and outbound manufacturing
investment with developing countries, indicating that this investment has a vertical
orientation. As Singapore’s skill endowments rose compared to those in neighboring
developing economies, outbound manufacturing FEI stocks grew larger and vice versa.
Meanwhile, as Singapore became relatively skill abundant, developing countries reduced
their manufacturing investment in Singapore.
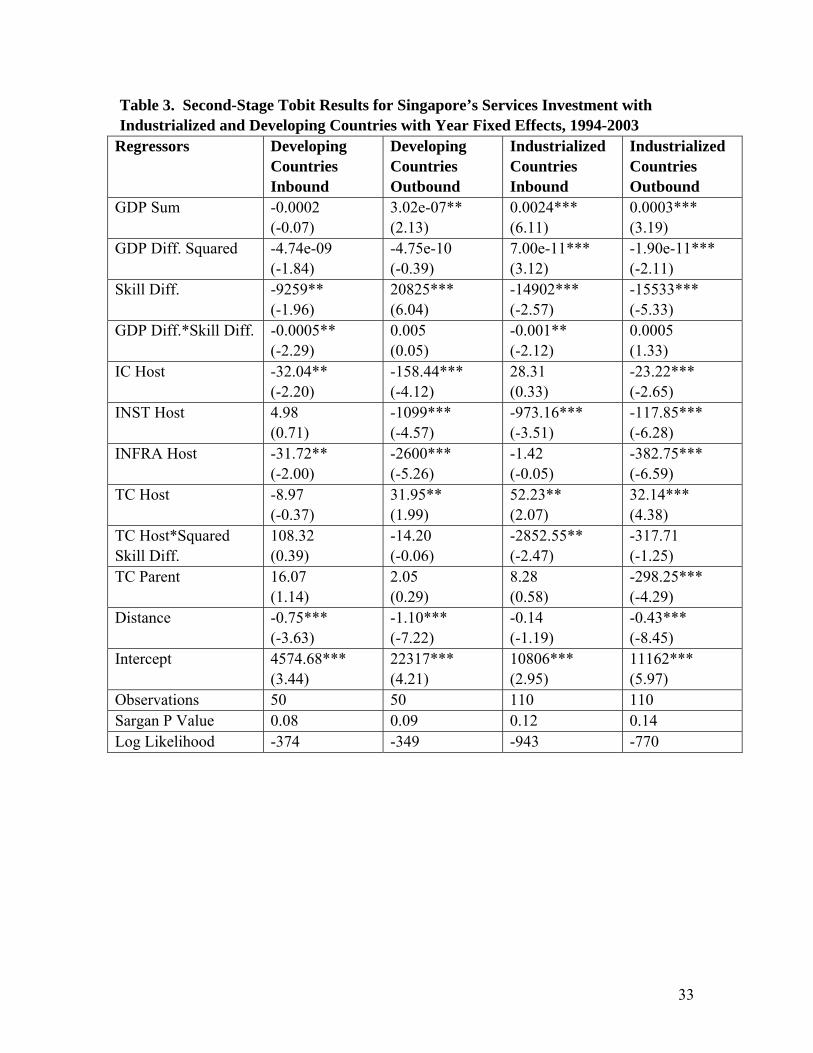
For services (Table 3), variations in joint market size are insignificant for FEI
stocks from developing countries, while they are positive and significant in all other
equations. The coefficient on squared differences in GDP is positive and significant for
inbound investment from industrialized countries, but negative and significant for
outbound FEI stocks. For inbound and outbound services investment from developing
countries the coefficients are negative but insignificant.
The impact of skill differences on inbound and outbound FEI is negative and
significant at the one percent level in the case of industrialized partners. However, for
outbound investment into developing countries it is positive and significant. For inbound
investment from developing countries, the coefficient is negative and significant at the
five percent level. Thus, the results for inbound service sector stocks from developing
countries are markedly different from those of manufacturing. Whereas for
manufacturing the skill-difference variable is positive and significant at the one percent
level, for the service sector it is negative and significant at the five percent level. Service
sector skill scarcity in parent developing countries such as Malaysia, appear to increase

24
skill seeking investment in Singapore. However, it should be remembered that inbound
services investment stocks from developing countries to Singapore are small and
furthermore, the results should be interpreted with caution as the service sector samples
for bilateral investment with both industrialized and developing countries are also very
small.
Section 4(b). Re-specifying the GDP variable to account for ASEAN Market Size
As discussed earlier, MNEs also invest in Singapore to re-invest in neighboring
developing countries. For instance, MNEs establish regional headquarters in Singapore
and re-invest in neighboring countries such as Indonesia. Thus, inward investment into
Singapore is also likely to take into consideration the entire market size of the ASEAN
region. To account for the ASEAN market size, and to establish the robustness of the
results using the Singapore market size discussed earlier, we recast the market size
variable to include the regional FEI activities for both manufacturing and services. We re-
estimate the industrialized country inbound equations separately by using the ASEAN
GDP measures to account for regional FEI activities.
The results presented in Table 4 indicate that the effect of joint market size with
ASEAN countries on inbound services FEI is positive and significant at the five percent
level while it is insignificant for inbound manufacturing investment. The coefficients on
squared difference in real GDP are insignificant in both equations.
The investment-cost in the host country and both parent and host trade-cost
indexes are insignificant for both manufacturing and services. However, while barriers to
investment and infrastructure impediments significantly reduce manufacturing
investment from industrialized countries, they have no impact on services investment.

25
Finally, there is one major difference between the results for the sample with Singapore
GDP presented in Tables 2 and 3 and the sample with ASEAN GDP presented in Table 4.
Distance has a positive and significant impact on inward manufacturing FEI stocks when
ASEAN GDP is used suggesting that distant countries such as the US and Canada invest
more heavily in Singapore manufacturing than those that are nearer, most likely to have
an easier access to markets in the ASEAN region by avoiding higher transport costs.
However, distance had an insignificant impact on service sector FEI.
Relative skill differences are negative and significant at the one percent level for
the service sector samples and but insignificant for the manufacturing sector samples.
This suggests that while service sector investment is sensitive to changes in skill
differences, manufacturing investment is not sensitive to such changes. This may be
because Singapore is attracting both high end and low end manufacturing investment.
While high end manufacturing investment stays on in Singapore, the low end investment
passes through Singapore on its way to neighboring countries. During 2003
manufacturing accounted for about forty percent of all outbound investment
(manufacturing plus services investment) by foreign MNEs with regional headquarters in
Singapore, mostly to neighboring countries8. However, inbound services investment
stocks from industrialized countries were nearly three times that of manufacturing
investment. This suggests that a majority of the inbound services investment stays on in
Singapore while majority of the manufacturing investment coming into Singapore is re-
invested in neighboring countries. Finally, the interaction between ASEAN GDP
differences and Singapore skill differences as well as the interaction between Singapore
8 Singapore Department of Statistics, 2003
26
skill differences squared and trade costs for both manufacturing and services are
insignificant
5. Implications and Concluding Remarks
Singapore’s rapid growth in skill endowments supported a significant rise in
horizontal outward FEI with the industrialized world for both manufacturing and
services. However, while increase in skill endowments increased inbound services FEI
from industrialized countries, the effect on inbound manufacturing FEI was insignificant.
Second, over the period Singapore’s skill share rose considerably in relation to those in
neighboring developing countries. This tendency supported a clear vertical orientation in
outward investment for both manufacturing and services, from Singapore to Asian
developing economies, particularly in ASEAN, as regional headquarters operations in the
former sought lower-wage labor for production in the latter. Based on the results using
ASEAN market size, some of this trend could be ascribed to incoming investments from
industrialized countries in skill-intensive regional headquarters services in Singapore,
which in turn re-invest in ASEAN. Third, a rise in Singapore skills relative to developing
countries decreases inward investment in manufacturing while it increases investment in
services, indicating that as far as services are concerned, investment by parent developing
countries such as Malaysia in Singapore, is essentially skill seeking. Finally, evidence
using ASEAN GDP indicates that distance increases investment into Singapore from
industrialized countries for both manufacturing and services. MNEs from industrialized
countries further away from Singapore such as the USA appear to invest more in
Singapore relative to countries nearer to Singapore such as Australia most likely to avoid
higher transport costs.
27
These findings have important resonance for policy issues. As part of its
economic development policy, the government of Singapore followed the
“complementary strategy” of rapidly building its skills base while remaining open to
investment from abroad. Our results indicate the policy has been successful as MNEs,
particularly from the developed economies, increasingly invest in skill-intensive activities
in Singapore services. Many international firms also use skill-abundant Singapore as a
base from which to invest in neighboring ASEAN developing countries. However, for
services, skill seeking investment from developing countries could also be a symptom of
larger skilled shortages in those countries.
More fundamentally, to the extent that foreign direct investment contributes to
economic transformations, Singapore’s success in building its labor skills improved both
its own growth prospects and the economic development of its developing-country
investment partners, such as Malaysia, Thailand and Indonesia. Thus, from the point of
view of both developing countries, particularly in ASEAN, and Singapore itself, the need
for continued skills development in Singapore should be emphasized. However, our
results also indicate that skills development and retention in the service sector should also
be emphasized among Singapore’s developing country investment partners.
28
References
Anwar, S. 2008. “Foreign Investment, Human Capital and Manufacturing Sector Growth in Singapore.” Journal of Policy Modeling 30: 447-453.
Blonigen, B.A. 2005. “A Review of the Empirical Literature on FDI Determinants.”
NBER Working Paper No. 11299. Blonigen, B.A., Davies, R.B. and Head, K. 2003. “Estimating the Knowledge-Capital
Model of the Multinational Enterprise: Comment.” American Economic Review 93: 980-994.
Blonigen, B.A. and Wang, M. 2005. “Inappropriate Pooling of Wealthy and Poor
Countries in Empirical FDI Studies.” In T.H. Moran, E.M. Graham and M. Blomstrom, editors, Does Foreign Direct Investment Promote Development? Washington DC: Peterson Institute for International Economics.
Braconier, H., Norback, P-J and Urban, D. 2005. “Reconciling the Evidence on the
Knowledge Capital Model.” Review of International Economics 13: 770-786. Carr, D.,Markusen, J.R. and Maskus, K.E. 2001. “Estimating the Knowledge-Capital
Model of the Multinational Enterprise.” American Economic Review, 91: 693-708.
Chang, P.L. 2005. “Trade, Foreign Direct Investment and Regional Competition: The
Case of Singapore.” In The Economic Prospects of Singapore, edited by W.T.H. Koh and R.S. Mariano. Boston: Addison Wesley.
Dobson, W. and Chia, S.Y. 1997. “Multinationals and East Asian Integration”
International Development Research Center, Canada. Chellaraj, G., K.E. Maskus and A. Mattoo. 2009. “Labor Skills and Foreign Direct
Investment in a Dynamic Economy: Estimating the Knowledge-Capital Model for Singapore.” East-West Center Working Paper No. 100, Honolulu, Hawaii.
Gao, T. 2003. “Ethnic Chinese Networks and International Investment: Evidence from
Inward FDI in China.” Journal of Asian Economics, 14: 611-629. Government of the People’s Republic of China, 1985-2003. Yearbook of Statistics. PRC
Department of Statistics. Government of the Philippines, 1985-2003. Yearbook of Statistics. The Philippines:
Department of Statistics Government of Singapore. 1985-2003. Statistical Yearbook of Singapore. Singapore:
Department of Statistics.

29
Government of Singapore. 1985-2003. Foreign Equity Investment in Singapore.
Singapore: Department of Statistics. Government of Singapore. 1985-2003. Singapore’s Investment Abroad. Singapore:
Department of Statistics. Hattari, R., Rajan, R.S and Thangavelu, S. 2008. “Understanding Intra-ASEAN FDI
Flows: Trends and Determinants and the Role of China and India.” Department of Economics, National University of Singapore, Department of Economics, Unpublished Paper.
Helpman, E. 1984. “A Simple Theory of International Trade with Multinational
Corporations.” Journal of Political Economy 92: 451-471. Hu, A. G. 2004. “Multinational Corporations, Patenting, and Knowledge Flow: The Case
of Singapore.” Economic Development and Cultural Change, 52: 781-800. International Labor Organization. Various years. Yearbook of Labor Statistics. Geneva:
International Labor Organization.
International Monetary Fund. Various Years. International Financial Statistics, Washington DC: International Monetary Fund.
Kee, H.L. and Hoon, H.T. 2005. “Trade, Capital Accumulation and Structural Unemployment: An Empirical Study of the Singapore Economy,” Journal of Development Economics, 77: 125-152.
Low, L., Ramstetter, E.D. and Yeung, H. W-C. 1998. “Accounting for Outward Direct Investment from Hong Kong and Singapore: Who Controls What?” In Geography and Ownership as Bases for Economic Accounting, edited by R.E. Baldwin, R. E. Lipsey and J.D. Richardson. Chicago: University of Chicago Press, 1998.
Markusen, J.R. 1984. “Multinationals, Multi-Plant Economies, and the Gains from Trade.” Journal of International Economics 16: 205-226.
Markusen, J.R. 2002. Multinational Firms and the Theory of International Trade. MIT
Press, Cambridge, MA.
OECD.http://www.oecd.org/topicstatsportal/0,2647,en_2825_495670_1_1_1_1 1,00.htm Paris: OECD.
Shin, J-S. 2005. “The Role of State in the Increasingly Globalized Economy: Implications for Singapore.” The Singapore Economic Review, 50: 103-116.
30
Sung, J. 2006. Explaining the Economic Success of Singapore: The Developmental Worker as the Missing Link. London: Edward Elgar.
United Nations. Various Years. UN Demographic Yearbook. New York: United Nations. Waldkirch, A. 2008. “The Structure of Multinational Activity: Evidence from Germany.”
Applied Economics, forthcoming. World Economic Forum. 1995-2003. Global Competitiveness Report.” Geneva: World
Economic Forum. World Economic Forum. 1984-1994. World Competitiveness Report.” Geneva: World
Economic Forum. Yeaple, S.R. 2003. “The Role of Skill Endowments in the Structure of U.S. Outward
Foreign Direct Investment.” Review of Economics and Statistics, 85: 726-734.

31
Table 1. Second-Stage Tobit Results for Singapore’s Manufacturing Bilateral Inbound and Outbound Investment with Year Fixed Effects, 1994-2003
Regressors Manufacturing Inbound
Manufacturing Outbound
Services Inbound
Services Outbound
GDP Sum 0.0003** (1.99)
0.0003*** (3.77)
0.0014*** (8.43)
3.22e-07** (1.97)
GDP Diff. Squared -6.68e-12 (-0.17)
-1.28e-11** (-1.97)
6.95e-11*** (3.98)
-7.26e-12 (-0.72)
Skill Diff. -7867 (-1.08)
8565*** (3.03)
-14381*** (-4.58)
18168*** (4.51)
GDP Diff.*Skill Diff.
-0.0003*** (-3.99)
-0.0002 (-1.02)
-0.0004*** (-3.40)
0.0001 (1.21)
IC Host -88.37** (-2.07)
-12.67** (-2.10)
-0.21 (-0.00)
-39.47*** (-4.66)
INST Host -466.26** (-2.02)
-15.46*** (-3.25)
-1994.74*** (-4.58)
-16.40*** (-2.73)
INFRA Host 2.96 (0.14)
-60.54*** (-6.75)
13.68 (0.75)
-434.72*** (-6.85)
TC Host 31.28 (0.98)
-0.22 (-0.05)
67.79*** (3.48)
-18.38 (-1.44)
TC Host*Squared Skill Diff.
-46.19 (-0.17)
18.29 (0.28)
103.49 (0.88)
102.52 (1.02)
TC Parent 12.74 (1.02)
76.06 (1.91)
-29.56*** (-2.98)
192.75 (1.76)
Distance 0.25 (1.88)
-0.22*** (-7.86)
0.03 (0.45)
-0.10*** (-2.75)
Intercept 6419 (1.75)
449 (0.44)
10776*** (3.89)
-1537 (-0.95)
Observations 160 160 160 160 Sargan P Value 0.10 0.12 0.12 0.11 Log Likelihood -1376 -1122 -1350 -1185

32
Table 2. Second-Stage Tobit Results for Singapore’s Manufacturing Investment with Industrialized and Developing Countries with Year Fixed Effects, 1994-2003
Regressors Developing Countries Inbound
Developing Countries Outbound
Industrialized Countries Inbound
Industrialized Countries Outbound
GDP Sum -0.0005 (-1.73)
-0.002 (-1.77)
-0.0004 (-0.85)
-0.00001 (-0.79)
GDP Diff. Squared 5.66e-10*** (4.44)
5.63e-09 (1.55)
8.24e-11 (1.11)
5.04e-13 (0.26)
Skill Diff. 2236*** (14.68)
5375** (2.11)
-19412 (-1.47)
-13731*** (-2.72)
GDP Diff.*Skill Diff. -0.0001** (-1.96)
-0.0007 (-1.07)
-0.0002 (-1.09)
-0.0002*** (-2.81)
IC Host -40.38*** (-15.20)
-8.38 (-0.94)
-108.34 (-0.97)
0.92 (0.52)
INST Host -318.25*** (-12.45)
-12.41*** (-2.83)
-1014** (-2.02)
-7.59** (-2.22)
INFRA Host 0.00 (0.00)
-5.46 (-0.58)
-78.73 (-1.59)
-21.28*** (-2.75)
TC Host 2.92*** (3.16)
-20.28 (-1.42)
37.50 (1.07)
3.21*** (2.63)
TC Host*Squared Skill Diff.
68.37*** (4.24)
240.70 (1.49)
-2964 (-1.15)
141.43*** (3.57)
TC Parent -0.07 (0.11)
-7.87 (-0.93)
42.13 (1.67)
-14.40** (-1.96)
Distance -0.13*** (-13.34)
-0.50*** (-4.06)
-0.70*** (-3.05)
-0.03*** (-3.90)
Intercept 5152*** (14.57)
3836*** (5.04)
10734 (1.49)
1039*** (3.13)
Observations 50 50 100 110 Sargan P Value 0.09 0.07 0.08 0.11 Log Likelihood -226 -348 -968 -583
33
Table 3. Second-Stage Tobit Results for Singapore’s Services Investment with Industrialized and Developing Countries with Year Fixed Effects, 1994-2003
Regressors Developing Countries Inbound
Developing Countries Outbound
IndustrializedCountries Inbound
IndustrializedCountries Outbound
GDP Sum -0.0002 (-0.07)
3.02e-07** (2.13)
0.0024*** (6.11)
0.0003*** (3.19)
GDP Diff. Squared -4.74e-09 (-1.84)
-4.75e-10 (-0.39)
7.00e-11*** (3.12)
-1.90e-11*** (-2.11)
Skill Diff. -9259** (-1.96)
20825*** (6.04)
-14902*** (-2.57)
-15533*** (-5.33)
GDP Diff.*Skill Diff. -0.0005** (-2.29)
0.005 (0.05)
-0.001** (-2.12)
0.0005 (1.33)
IC Host -32.04** (-2.20)
-158.44*** (-4.12)
28.31 (0.33)
-23.22*** (-2.65)
INST Host 4.98 (0.71)
-1099*** (-4.57)
-973.16*** (-3.51)
-117.85*** (-6.28)
INFRA Host -31.72** (-2.00)
-2600*** (-5.26)
-1.42 (-0.05)
-382.75*** (-6.59)
TC Host -8.97 (-0.37)
31.95** (1.99)
52.23** (2.07)
32.14*** (4.38)
TC Host*Squared Skill Diff.
108.32 (0.39)
-14.20 (-0.06)
-2852.55** (-2.47)
-317.71 (-1.25)
TC Parent 16.07 (1.14)
2.05 (0.29)
8.28 (0.58)
-298.25*** (-4.29)
Distance -0.75*** (-3.63)
-1.10*** (-7.22)
-0.14 (-1.19)
-0.43*** (-8.45)
Intercept 4574.68*** (3.44)
22317*** (4.21)
10806*** (2.95)
11162*** (5.97)
Observations 50 50 110 110 Sargan P Value 0.08 0.09 0.12 0.14 Log Likelihood -374 -349 -943 -770

34
Table 4. Second-Stage Tobit Results for Singapore’s Total and Manufacturing Inbound Investment Using ASEAN GDP with Year Fixed Effects,
Regressors Industrialized Countries Manufacturing Inbound 1994-2003
Industrialized Countries Services Inbound 1994-2003
GDP Sum OECD -0.0008 (-1.09)
0.0007** (2.43)
GDP Diff. Squared OECD -5.00e-11 (-1.09)
-3.83e-10 (-0.31)
Skill Diff. -13817 (-1.42)
-14304*** (-2.55)
GDP Diff. OECD*Skill Diff. -0.0016 (-1.30)
-0.0001 (-0.11)
IC Host 12.66 (0.61)
-167.55 (-1.74)
INST Host -1177*** (-4.14)
-825.04 (-1.63)
INFRA Host -27.85** (-2.05)
28.98 (0.65)
TC Host 43.85 (1.67)
7.14 (0.21)
TC Host*Squared Skill Diff. -547.42 (-0.76)
-1868.14 (-1.54)
TC Parent 10.81 (0.32)
32.76 (1.18)
Distance 0.18*** (2.54)
-0.37 (-0.97)
Intercept 13021*** (3.69)
13936** (2.00)
Observations 110 110 Sargan P Value 0.09 0.08 Log Likelihood -864 -946

35
Figure 1. Singapore Manufacturing Foreign Equity Investment Stocks by Sources and Destination, 2003 (Million 1990 US $)
0
10000
20000
30000
40000
50000
60000
Inbound Outbound Total
Inbound, Outbound and Total FEI Stocks
Sing
apor
e M
anuf
actu
ring
Fore
ign
Equi
tyIn
vest
men
t Sto
cks
(Mill
ion
1990
US$
)
Industrialized
Developing
Figure 2. Singapore Services Foreign Equity Investment Stocks by Sources and Destination, 2003 (Millions of 1990 US$)
0
10000
20000
30000
40000
50000
60000
70000
Inbound Outbound Total
Inbound, Outbound and Total FEI Stocks
Sin
gapo
re S
ervi
ces
Fore
ign
Inve
stm
ent S
tock
s (M
illio
n 19
90 U
S$)
IndustrializedDeveloping

36
Figure 3. Differences in Singapore Skill Endowments and the Average Skill Endowments of Industrialized and Developing Countries, 1994-2003
0
0.05
0.1
0.15
0.2
0.25
0.3
0.35
0.4
1994 1995 1996 1997 1998 1999 2000 2001 2002 2003
Year
Skill
End
owm
ent D
iffer
ence
s
Developing
Industrialized
Skill differences = (Singapore Skill Labor/Labor Force)-(Partner Skill Labor/Partner Labor Force)

37
Figure 4. Trends in Singapore Inbound Manufacturing and Services FEI Stocks from Selected Industrialized Countries, 1994-2003 (Million 1990 US$)
0
5000
10000
15000
20000
25000
30000
35000
1994 1995 1996 1997 1998 1999 2000 2001 2002 2003
Year
Inbo
und
Indu
stria
lized
Cou
ntry
M
anuf
actu
ring
and
Serv
ices
FEI
Sto
cks
(Mill
ion
1990
US$
)
ManufacturingServices
Figure 5. Trends in Singapore Outbound Manufacturing and Services FEI Stocks to Selected Industrialized Countries, 1994-2003 (Million 1990 US$)
0
2000
4000
6000
8000
10000
12000
14000
1994 1995 1996 1997 1998 1999 2000 2001 2002 2003
Year
Out
boun
d In
dust
rializ
ed C
ount
ry M
anuf
actu
ring
and
Serv
ices
FEI
Sto
cks
(Mill
ion
1990
US$
)
Manufacturing
Services
FEI is the total manufacturing and total services FEI from and to all industrialized countries in our sample

38
Figure 6. Trends in Singapore Inbound Manufacturing and Services FEI Stocks from Developing Countries, 1994-2003 (Million 1990 US$)
0
500
1000
1500
2000
2500
3000
3500
4000
4500
5000
1994 1995 1996 1997 1998 1999 2000 2001 2002 2003
Year
Inbo
und
Dev
elop
ing
Cou
ntry
Man
ufac
turin
g an
dSe
rvic
es F
EI S
tock
s (M
illio
n 19
90 U
S$)
Manufacturing
Services
Figure 7. Trends in Outbound Manufacturing and Services FEI Stocks to Developing Countries, 1994-2003 (Million 1990 US$)
0
2000
4000
6000
8000
10000
12000
14000
16000
1994 1995 1996 1997 1998 1999 2000 2001 2002 2003
Year
Out
boun
d D
evel
opin
g C
ount
ry M
anuf
actu
ring
and
Serv
ices
FEI
Sto
cks
(Mill
ion
1990
US$
)
Manufacturing
Services