the east asia crisis about and corporate finances corporate finance support€¦ · ·...
TRANSCRIPT

,p qq0Pot-ICY RESEARCH WORKING PAPER 1990
The East Asia Crisis Empirical findings aboutcorporate finance support
and Corporate Finances Krugman's view that crony
capitalism lay at the core of
The Untold Micro Story Asia's recent financial crisis.
Yhe Untold l&Iicro Story Implicit government
guarantees and poor banking
.licxCL7el Ponrleriano supervision led to poor
decisions about credit
allocation in Asia's banking-
dominated financial systems.
h-let \World Banik
( )ttice ot the Senior Vice President
D)cvcloprrient Economics
L)evelopment Prospects Group
(O)ctober 1998
Pub
lic D
iscl
osur
e A
utho
rized
Pub
lic D
iscl
osur
e A
utho
rized
Pub
lic D
iscl
osur
e A
utho
rized
Pub
lic D
iscl
osur
e A
utho
rized
Pub
lic D
iscl
osur
e A
utho
rized
Pub
lic D
iscl
osur
e A
utho
rized
Pub
lic D
iscl
osur
e A
utho
rized
Pub
lic D
iscl
osur
e A
utho
rized
POLICY RESEARCH WORKING PAPER 1990
Summary findiings
Explanations of what caused the Asian crisis have At the core of the corporate crisis were financialfocused on macroeconomic factors. Pomerleano offers a excesses that violated prudent financial practices andcomplementary perspective focusing on corporate eventually led to the inevitable financial distress.distress and corporate finance. The empirical findings support K(rugman's view: that
He presents key ratios for companies in various crony capitalism lay at the core of the crisis. Cronycountries. Using global benchmarking, he imposes a capitalism was manifested in poor policies - implicitconsistent cross-border analysis of financial risk and government guarantees and poor banking supervision -performance. He provides a statistical review of that led to poor decisions about credit allocation in thecorporate financial practices and performance in Hong banking-dominated financial system.Kong, Indonesia, the Republic of Korea, Malaysia, the Preliminary findings also suggest vast differences inPhilippines, Taiwan (China), and Thailand - economic value-added among countries (both industrialbenchmarked against corporate financial data for other and developing). In an era of increasing capital mobility,countries in Latin America and for four industrial corporations are not adhering to global standards incountries: France, Germany, Japan, and the United creating shareholder value.States. The implications for enhanced regulation and
One common pattern emerges from the analysis: supervision of the financial system are unmistakable. Theunsustainable rapid (and probably excessive) investment recent introduction of improved loan classificationin fixed assets financed by excessive borrowing in some systems and capital adequacy norms are encouraging firstAsian countries (for example, Indonesia, Korea, and steps toward better regulation and supervision. But theyThailand). must be supplemented by an improved regulatory
The result of the East Asian investment spending spree framework and better enforcement.was poor profitability, reflected in low and decliningreturns on equity and capital.
This paper is a product of the Development Prospects Group, Office of the Senior Vice President, Development Economics.Copies of the paper are available free from the World Bank, 1818 H Street NW, Washington, DC 20433. Please contactNoemi Dacanay, room l6P-198, telephone 202-473-4068, fax202-974-4802, [email protected] author may be contacted at [email protected]. October 1998. (36 pages)
The Policy Research Working Paper Series disseminates the findings of work in progress to enicourage the exchange of ideas about1developmen7t issues. An objective of the series is to get the findings out quickly, even if the presentations are less than fully polished. The
papers carry the names of the authors and should be cited accordingly. The findings, interpretations, and conclusions expressed in thispaper are entirely those of the authors. They do not necessarily represent the viewv of the Wiorld Bank, its Executive Directors, or thecountries they represent.
Produced by the Policy Research Dissemination Center

THE EAST ASIA CRISIS AND CORPORATE FINANCES
THE UNTOLD MICRO STORY
MICHAEL POMERLEANO
Jack Glen provided most helpful comments. I am grateful for dedicated researchassistance from Margaret Enis.

2
THE EAST ASIA CRISIS AND CORPORATE FINANCES - THE UNTOLD MICRO STORY
by
MICHAEL POMERLEANO'
Abstract: Explanations of the causes of the Asian crisis have focused on macroeconomic factorsleading to the crisis. This paper offers a complementary corporate distress perspective linking thecrisis to corporate finances. Key ratios for companies in various countries are presented in thepaper. The global benchmarking imposes a consistent cross-border analysis of financial risk andperformance, and sheds light on the crisis. The study provides a statistical review of the financialpractices and performance of corporates in Asia: Hong Kong, Indonesia, Korea, Malaysia,Philippines, Taiwan, and Thailand benchmarked against financials of corporates in othercountries: Latin America, and industrialized countries: France, Germany, Japan and USA. Athematic point that comes across in all the results of the corporate financial analysis isunsustainable rapid (and probably excessive) investment in fixed assets financed by excessiveborrowing in some Asian countries- e.g., Indonesia, Korea and Thailand. The East Asianinvestment-spending spree resulted in poor profitability, reflected in low, and declining return onequity, and return on capital employed. It leads to the conclusion that at the core of the corporatecrisis were financial excesses that violated prudent financial practices, and eventually lead to theinevitable financial distress we are witnessing. Therefore, the empirical findings presented in thepaper lend credence to the view advanced by Krugman that crony capitalism was at the core ofthe crisis. Crony capitalism was manifested in supportive bad policies-e.g., implicit governmentguarantees, and poor banking supervision- that lead to poor credit allocation decisions in thebanking dominated financial system. Preliminary findings suggest as well vast differences inEconomic Value Added between countries- developing and developed alike. The conclusionsfrom an economic value added approach indicate, that in an era of increasing capital mobility,corporates are not adhering to global standards in creating sharelholder value. The analysis leadsto policy conclusions.
1 Jack Glen provided most useful comments. I am grateful for dedicated research assistancefrom Margaret Enis.

3
"With leveraging, there will always exist the possibility ... of a cascading sequence of defaults that willculminate in financial implosion if it proceeds unchecked," Federal Reserve Chairman Alan Greenspan, ata May 8, 1998 Federal Reserve Bank of Chicago conference. This statement was made regarding banks indeveloping countries relying excessively on borrowing from abroad. It is, as well, very much applicable tothe corporate financing pattems of corporates in sorne Asian countries.
OVERVIEW
What Caused Asia's economic and currency crisis, and the ensuing contagion is the
subject of much debate. Most of the explanations on the causes of the crisis of the Asia
crisis have focused on macroeconomic factors, including underlying vulnerabilities2
(financial sector vulnerabilities, and inconsistent macro economic policies), emphasis on
the role of financial panic as an essential element in the crisis3 , and the distortionary
impact of guarantees on the financial system.
This paper provides an perspective on the corporate roots of the financial crisis in Asia.
McKinsey Global Institute recently studied how Germany, Japan, and the US put their
capital to use, examining capital productivity within the entire economy as well as in five
separate industries5 . The study addresses the productive use of capital: use of physical
capital (machinery and buildings) and by reference the implication for derived financial
assets-stocks. The findings are that the US outperforms Japan and Germany by roughly
one-third: the US average returns of 9 percent over a 20-year period compare with just
over 7 percent in Germnany and Japan. The higher capital productivity translated .nto
higher financial returns for equity investors. Michael Jensen's Presidential Address to the
American Finance Association documents that a large number of US corporations do not
2 World Bank, Global Development Finance, 1998
3 Radelet, Steven and Jeffrey Sachs, The Onset of the East Asian Financial Crisis, Harvard Institute forInternational Development, March 30, 1998.
4 Krugman argues that a system of implicit guarantees lead to incentives to choose the highest returninvestments regardless of risk (refereed to as the Pangloss value) See Krugman, Paul What happened toAsia? January 1998S Agrawal, Raj et al in Capital Productivity: Why the US Leads and Why it Matters , The McKinseyQuarterly, 1996 Number 3
4
earn the cost of capital6. It pursues the line of argument advanced by Frank Veneroso and
Robert Wade in The Asian Financial Crisis. the Unrecognized Risk of the IMF's Asia
Package, 19987. Veneroso and Wade argue that Asia's high-debt model of economic
development is a. consequence of the intermediation process for savings in the Asian
economies, and quest for rapid economic growth. In a similar line of inquiry the paper
explores the financial profile and performance of capital in developing countries. Key
ratios for companies in various countries are presented in the paper. The global
benchmarking imposes a consistent cross-border analysis of financial risk and
performance, and sheds light on the crisis.
The analysis extends empirically, and complements the macro leverage argument of
Veneroso and Wade by reviewing the financial profile and performance of corporations.
It concludes that there were serious problems at the micro level - excess leverage, and
poor profitability. The findings support the view advanced by Krugman that crony
capitalism, and the supportive bad policies- implicit guarantees, and poor banking
supervision- lead to poor credit decisions in the banking system, and misallocation of
resources. The evident policy implications virtually write themselves, and ensue from the
analysis.
The structure of the paper is as follows. Section A presents the financial analysis
methodology, key results and their interpretation. Section B offers a discussion of the
implications of the crisis on corporate finances, and documents that it was not an accident
that the crisis started in Thailand, in light of the profound excesses. The concluding
section offers an interpretation of the causes of the high leverage of corporates, and policy
implications for financial sector development.
6 Jensen, Michael C, The modern industrial revolution, exit, and the failure of internal control systems,The Journal of Finance, Jul 1993
7 Wade, Robert and Frank Veneroso, "The Asian Crisis: The High Debt Model vs. the Wall Street-Treasury-IMF Complex", New Left Review 228, March-April, 1998, pp.3-23

5
SECTION A: KEY SUMMARY OF FINANCIALS
The objective of the analysis in this section is to determine the performance of
corporations in Asia: Hong Kong, Indonesia, Korea, Malaysia, Philippines, Taiwan, and
Thailand. It benchmarks their financial profile and performance against the corporates in
the other countries. Their financial profile and performance is compared to corporations
in Latin America8 , and industrialized countries: France, Germany, Japan and USA. For
this purpose, I have obtained financial information on companies for 1992- 1996 from the
Financial Times Information's Extel Card database9 . Table I presents the sample size, and
coverage of GDP for the respective countries. We used as a basis for our analysis the
financial data- i.e., balance sheets; income statements and cash flows analysis of listed
non-financial companies. The companies selected for the analysis were classified as
general manufacturing, extractive industries, and utilities for which there was 5 years of
consecutive financials ending in 1996 for the respective countries. The resulted are
presented are weighted averages (by sales) of the constant sample.
Table 1- The SampleCountry Companies in the Sample'" Sales Revenue as a Percent of GDP"'Hong Kong 47 7Indonesia 122 2Korea 44 14Malaysia 211 21Philippines 29 2Singapore 92 17Taiwan 16 n/aThailand 173 5Latin America 21 n/aFrance 143 28Germany 232 26Japan 254 24USA 289 28
8 I lumped Latin America because of the small number of companies in any one country and lack of arepresentative sample.
9 Financial Times Information's Extel database is a database with fundamental data on over 13, 000companies worldwide.
'° General manufacturing, extractive industries, utilities, and consumer goods
"Average 1992-1996

6
Reviews of corporate financial practices and performance focus on relative ratio analysis.
The financing patterns are recorded in ratios: Leverage (Debt-equity), Debt sustainability
(EBITDA/Interest), Liquidity ( Current Liabilities to Total Liabilities), Tangible Fixed
Assets Growth and their financing. The corporate performance profitability is captured in
ratios of Return on Equity supplemented by Return on Capital Employed and Economic
Value Added. The ratios analysis is supplemented by an indicator of corporate financial
fragility- Altman's Z Score. Another indicator of corporate vitality calculated for this
study is Tobin q.
At the onset, it is important to point out a caveat. Due to different accounting standards
and conventions'2 , possible reporting errors and, and potential bias in a limited sample, in
isolation, any one individual statistic, might not be fully representative, and should be
interpreted with caution. However the combined evidence is reflective of underlying
patterns.
FINANCING PATTERNS
Leverage. I use the debt-equity ratio equals a company's debt divided by shareholder's
equity, and indicates how much borrowed money a company is using relative to its
equity. Table 2 and Figures 1 and 2 presents the findings. Two aspects are notable. First,
the wide differences in the Debt/Equity Ratios in Asia. The high leverage contrasts with
moderate debt-equity ratios in Hong Kong (39 percent on 12/31/96), Philippines and
Taiwan. An interesting finding is that debt-equity ratios vary widely in our sample. Latin
American, German and US companies have modest debt-equity ratios (90 percent in the
US), whereas Thai, and Korean companies generally have high debt-equity ratios (around
12 International comparison of accounting results has relevance if measured consistently, however thismeaning can be blurred in a cross-border analysis. For instance, depreciation and asset revaluationpractices differ in various countries. Although the Extel data base makes adjustments to the financialstatements of companies to enable international comparisons, and domestic accounting conventions areconverted to international common denominators, such as calculated cash flow potential inconsistenciesremain. For instance, non-consolidated statements are also common in Korea and Indonesia, and thepossibility of companies with cross shareholdings and double-leverage is not factored into the analysis.

7
150 percent)'3. The ratios presented also are lower than other reported findings of
leverage. When calculating debt/equity ratios for firms, I calculate only explicitly
reported short and long term debt, rather than liabilities, because consideration of
liabilities varies internationally'4 . Therefore the analysis understates the extent of
leverage. Further possible explanations for the differences are attributable to using only
reported debt, as well as a weighted average, rather than medians. Second, the rapidly
increasing debt equity ratios in Asia. For instance, in Thailand leverage increased from
71 percent on 12/31/92 to 155 percent on 12/31/96. Similar growth is evident in Korea,
Malaysia, and Indonesia. As subsequently documented, the build up of leverage is
attributable to the financing of rapid acquisition of fixed assets.
Table 2- Leverage See footnote 15
Total Debt/Equity 12/31/92 12/31/93 12/31/94 12/31/95 12/31/96Hong Kong 26% 23% 33% 36% 39%Indonesia 59% 54% 58% 81% 92%Korea 123% 129% 127% 1 32 N/AMalaysia 31% 29% 38% 45% 62%Philippines 81% 78% 50% 49% 69%Singapore 37% 34% 33% 45% 58%Taiwan 71% 73% 71% 67% 65%Thailand 71% 81% 103% 135% 155%Latin America 31% 35% 34% 33% 31%France 141% 133% 117% 112% 111%Germany 61% 67% 61% 59% 58%Japan 136% 139% 139% 135% 138%USA 106% 102% 97% 94% 90%
13 Corporate data on foreign exchange indebtedness was not reported in the Financial Times Information'sExtel database. However, evidence on aggregate corporate indebtedness is available from BIS. The datasuggests excessive reliance on foreign debt by corporates in Indonesia and Thailand , most of it nothedged.
"' Balance-sheet obligations can often be significant and subject to differing methods of calculation. Forexample, pensions are handled very differently in different countries: U.S. firms explicitly reflect thepension asset/liability on their balance sheet, while German firms do not. Therefore
'5 Korea debt/equity as of 12/31/1995

8
Figure 1
Leverage, 1996
180%
160%
1400%
* 120%
100%
80%
60%
40%
20%
0%
Figure 2
Increase in Leverage, 1992 vs. 1996
200%
150%
e 100% 1996
H 0%
0%~~4
I T N m X

9
Tangible Fixed Assets Growth and their financing. Capital assets are tangible "fixed
assets." The analysis in Table 3 and graph in Figure 3 suggests a rapid built up of Fixed
Assets in Asia. The average percent change in tangible Fixed Assets during the 1992-97
period is 33 percent in Indonesia; Malaysia- 20 percent; and Thailand - 29 percent. This
growth is in stark contrast the more moderate pattern Hong Kong-17 percent, and 1 -5
percent in developed countries.
Table 3 - Percent Change in Tangible Fixed Assets12/31/92 12/31/93 12/31/94 12/31/95 12/31/96 Average
Hong Kong n/a 22°/a 17% 15% 13% 17%Indonesia n/a 22% 37% 36% 35% 33%Korea n/a 11% 15% 24% i/a 17%Malaysia n/a 15%° 21% 18% 26% 20%Philippines n/a 13%1 9% 5% 15% 11%Singapore n/a 19% 32% 20% 27% 250/oTaiwan n/a 9% 3% -5% 24% 8%Thailand n/a 25% 47% 27% 17% 29%Latin America n/a -2% 8% 12% 8% 7%/France n/a 2% 1% -1% 2% 1 %Germnany n/a 2% 1% 1% 6% 3 %IJapan n/a 5%O 5°% 5% 3% 51|USA n/a 2% 3% 3% 5% 3%Figure 3
Average Percent Change in Tangible Fixed Assets,1992-1996
35%30%
25% | Ggi|G20A t G
49 ,t ON
15%O ->/ WIN10% - ~ ~ ~ ~

10
I estimate the financing patterns of new investment based on an analysis of Sources and
Uses of Funds"6. In Table 4 I use the cash flow analysis to estimate the total percent debt
funding of investment in fixed assets, and calculate Total debt financing of investment as
a ratio of investments for each year'7 .
Table 4- Debt Raised & Repaid as a % of Investments
Country 93 94 95 96 AverageHong Kong 23% 62% 36% 58% 45%Indonesia 37% 56% 103% 70% 67%Korea 86% 52% 75% 62% 69%Malaysia 19% 44% 57% 61% 45%Philippines 46% -46% 28% 73% 25%Singapore 14% 19% 66% 58% 39%Taiwan 55 /o 62% 50% 23% 47%Thailand 71% 72% 102% 69% 78%°Latin America 34% 17% 13% 10% 19%France -13% -18% -26% -1% -14%Germany 16% -8% 8% 8% 6%Japan 11% 17%1 15% 9%/ 13%USA -9% 11%° 21% 10% 8%
The results supporlt the conclusion of the increasing reliance on debt in Asian countries.
The wide disparity in funding patters are striking. Figure 4 shows that while Latin
American, German, Japanese and US companies relied on roughly 8-19 percent debt
financing, the ratios in the vulnerable countries in Asia ranges around 45- 78 percent,
with Indonesia averaging 69 percent from 93 to 96, Korea 69 percent , Malaysia 45
16 Cash flow is computed as the difference between incoming and outgoing payments. Cash Flow isderived from the Operating Profit by adjusting for items, which do not affect payments (e.g. depreciationand amortization), and items (e.g. changes in working capital) which affect payments but are not recordedin the Operating Profit.
Cash Flow statement explains the difference between cash at the beginning of the period, and cash at theend of the period. Free Cash Flow before income taxes and financial income is available for payment tostockholders, and creditors income tax payments, and for investments.
'7 Although money is fungible, and such limited analysis in isolation has deficiencies (without reviewingdividend policies, etc), the relative values are indicative of the funding profile.

11
percent, and Thailand 78 percent vs. moderate ratios in Hong Kong (45 percent), and
Philippines 25 percent.
Figure 4
Average Percent Debt Financing of New Investment,1993-96
t100%- 80%
> 60%-
*a 4Q0 - ,k
20%0/c
0%~
In this context, the key ratio medians for U.S. industrial companies (Table 5) calculated
by Standard and Poor8 , and factored in the rating process are illustrative'9. Although what
is a sustainable ratio differs by country (and industry), it is the norm to expect companies
with solid potential, and stable earnings and prudent financial policies to total debt to
capitalization is 40 percent (a Debt/Equity ratio of 66 percent). A thematic point that
comes across from the evidence on the corporate investment and funding analysis is
unsustainable rapid investment in fixed assets financed by excessive borrowing in some
Asian countries. These findings manifest the untenable business growth in Asian
countries. It is a reasonable premise that no well managed company20 can digest in a
18 Explanations and medians for the ratios for U.S. companies can be found in Standard & Poor RatingServices, Corporate Ratings Criteria.
'9 The benign interest rate environment and availability of term financing in the US suggests that the USnumbers represent an upper bound on acceptable financial practices.
20 With the possible exception of software companies.

12
prudent fashion annual growth of 30- 40 percent without stretching already thin
managerial capacity, and distribution and marketing channels.
Table 5: KEY INDUSTRIAL FINANCIAL RATIOS
Three-year (1994 to 1996) medians AAA AA A BBB BB BEBITDA interest coverage (x) 20.3 14.94 8.51 6.03 3.63 2.27Funds from operations/total debt (%) 116.4 72.3 47.5 34.7 18.4 10.9Pretax return on capital(%). 31.5 23.6 19.5 15.1 11.9 9.1Operating income/sales(%) 24 19.2 16.1 15.4 15.1 12.6Long-tenn debt/capital (%) 13.4 21.9 32.7 43.4 53.9 65.9Total debt/capitalization (%) 23.6 29.7 38.7 46.8 55.8 68.9
Total Current Liabilities/Total Liabilities. The Total Current Liabilities/Total Liabilities
ratio is simply a company's current liabilities divided by its Total Liabilities. From this
ratio, I determine the maturity structure of the companies debts, and pending refinancing
needs in Table 6 and Figure 5. A more comprehensive liquidity analysis can be
supplemented by other ratios, such as Current Ratio21.
Table 6- Total Current Liabilities/Total Liabilities______| 12/31/92 12/31/93 12/31/94 12/31/95 12/31/96 Average
Hong Kong 58% 62% 63% 64% 61% 63%Indonesia 52% 56% 56% 50% 45% 52%Korea 54% 52% 53% 52% n/a 52%Malaysia 66% 64% 61% 61% 59% 61%Philippines 51% 52% 60% 58% 54% 56%Singapore 77% 82% 80% 80% 78% 80%Taiwan 64% 66% 65% 68% 61% 65%Thailand 64% 64% 62% 60% 60% 62%Latin America 38% 33% 40% 39% 48% 40%France 51% 50% 50% 51% 52% 51%Germany 31% 31% 31% 31%% 31%% 31%Japan 57% 56% 53% 54% 56% 55%USA = 40% 35% 38% 35% 36% 36%
21 The current ratio is a company's current assets divided by its current liabilities. From this ratio, wedetermine whether a company could pay off its debts with its current assets if it needed to- i.e., a ratiogreater than 1 .

13
Figure 5
Current Liabilities/Total Liabilities, 1992-96 Average
90%
800/
70% I.
6 0/a,%'.
50%
40/o
20% E 'EE
IO/ .! :
0%
The maturity structure of debt presented for 1992-1996 indicates in Table 5 that in Asia
(Hong Kong, Indonesia, Japan, Korea, Malaysia, Philippines, Taiwan, and Thailand)
approximately 60 percent of the liabilities were current during 1992-1996; while Latin
America, and industrialized countries (France, Germany, and USA) only 30-40 percent of
the liabilities are current. A notable trend is visible in Indonesia to lengthen the maturity.
The findings suggest that a liquidity problem is imminent in the Asian crisis. Although
companies can not raise new funds, they faces the task of repaying or servicing a large
burden of short-term debts (approximately 60 percent). It is discouraging to note in this
context, that prospects for refinancing in the Asian equity and bond markets are not
promising.
EBITDA/Interest. Debt service analysis uses the ratio of operating cash flow, before
interest, taxes and depreciation (EBITDA) to annual interest on the loans or debt service.
The EBITDA coverage ratio is indicative of the ability of the cash flow to adequately pay
back the annual interest (EBITDA/JInterest) and principal (EBITDA/Interest + Principal)
on outstanding debt. The findings presented in Table 7 and Figure 6 are indicative of vast
14
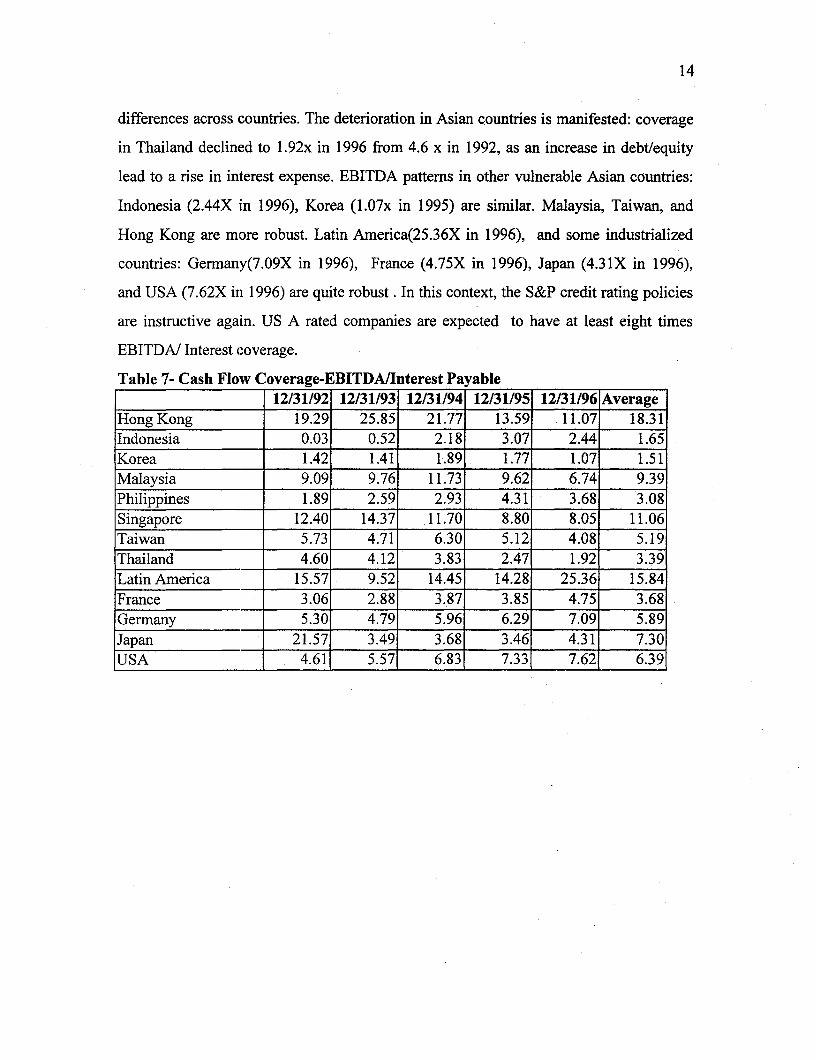
differences across countries. The deterioration in Asian countries is manifested: coverage
in Thailand declined to 1.92x in 1996 from 4.6 x in 1992, as an increase in debt/equity
lead to a rise in interest expense. EBITDA patterns in other vulnerable Asian countries:
Indonesia (2.44X in 1996), Korea (1.07x in 1995) are similar. Malaysia, Taiwan, and
Hong Kong are more robust. Latin America(25.36X in 1996), and some industrialized
countries: Germany(7.09X in 1996), France (4.75X in 1996), Japan (4.31X in 1996),
and USA (7.62X in 1996) are quite robust . In this context, the S&P credit rating policies
are instructive again. US A rated companies are expected to have at least eight times
EBITDA/ Interest coverage.
Table 7- Cash Flow Coverage-EBITDA/Interest Payable| 12/31/92 12/31/93 12/31/94 12/31/95 12/31/96 Average
Hong Kong 19.29 25.85 21.77 13.59 11.07 18.31Indonesia 0.03 0.52 2.18 3.07 2.44 1.65Korea 1.42 1.41 1.89 1.77 1.07 1.51Malaysia 9.09 9.76 11.73 9.62 6.74 9.39Philippines 1.89 2.59 2.93 4.31 3.68 3.08Singapore 12.40 14.37 11.70 8.80 8.05 11.06Taiwan 5.73 4.71 6.30 5.12 4.08 5.19Thailand 4.60 4.12 3.83 2.47 1.92 3.39Latin America 15.57 9.52 14.45 14.28 25.36 15.84France 3.06 2.88 3.87 3.85 4.75 3.68Germany 5.30 4.79 5.96 6.291 7.09 5.89Japan 21.57 3.49 3.68 3.46 4.31 7.30USA 4.61 5.57 6.83 7.33 7.62 6.39

15
Figure 6
Interest Coverage, 1996
. 30.00
~1.00
20.00
1 5.00
1 0.00
Altman 's ZScore. Developed by Edward Altman2 2 , Altman's Z-score statistical technique
calculates five ratios found in a company's financial statements: return on total assets,
sales to total assets, equity to debt, working capital to total assets, and retained earnings
to total assets. These ratios are then multiplied by predetermined weight factors, and
added together. The Z-score--yields a number between --4 and +8. Financially sound
companies show Z-scores above 2.99, while those scoring below 1.81 are financially
distressed , and face possible bankruptcy in an environment conducive to corporate
reorganizations. Scores between 1.81 and 2.99 indicate vulnerability.
The findings in Table 8 demonstrate again the considerable fragility of the corporate
sector in certain sections of Asia, as well as France. The Z performance results,
corroborate the previous findings. By 1996, the ratings in Asia evidence severe financial
distress in Indonesia at 2.66, Korea at 1.55, and Thailand at 1.5; in contrast, Malaysia at
22 Edward 1. Altman, The Z-Score Bankruptcy Model: Past, Present, and Future (New York: John Wiley &Sons, 1977), and Corporate Financial Distress and Bankruptcy, 2nd edition (New York: John Wiley &Sons, 1993). the Z Score use of multiple discriminant analysis (MDA) is designed to predict corporatefailure. See Appendix 1 for the formula. In Altman's original expost study of 33 bankrupt companies, Z-scores for 95 percent of these companies pointed to trouble or imminent bankruptcy.

16
3.9, Philippines at 3.4, Hong Kong at 6.9 , and Taiwan at 3.2 are robust. Among
industrialized countries: France at 1.8, and Japan at 2.1 manifest vulnerability.
Table 8 - Altman's Z 23 Score - The Calculation1992 1993 1994 1995 1996 Average
Hong Kong 10.585 13.710 9.307 7.179 6.9 9.54Indonesia 2.261 2.755 3.613 2.831 2.6 2.81Korea 1.341 1.469 1.573 1.547 n/a 1.48Malaysia 5.969 8.432 6.346 4.844 3.9 5.89Philippines 2.357 3.506 4.867 4.259 3.4 3.68Singapore 3.883 6.033 5.177 3.858 2.9 4.36Taiwan 2.521 3.215 3.665 2.901 3.2 3.09Thailand 3.115 4.481 2.934 2.269 1.5 2.86Latin America 0.977 0.999 1.330 1.489 1.9 1.34France 1.457 1.521 1.576 1.628 1.8 1.60Germany 3.009 3.098 3.299 3.250 3.6 3.26Japan 2.014 2.017 2.014 1.874 2.1 2.00USA 2.715 2.819 2.924 3.559 3.8 3.16Figure 7
Financial Fragility, 1996
8.07.0
0 6.0I 5.0N 4.0
3.0¢ 2.0
0.
23 Korea for 12/31/1995

17
PROFITABILITY
Return on Equity. A company's return on equity percentage (ROE) indicates how well
the common stockholders' equity investment is performing. The percentage is the result
of dividing corporate net earnings after-tax by common stockholders' equity. We compare
the ROE for the respective countries to determine how well the companies are doing in a
global context. It should be noted, however, that the return on equity can not be viewed in
isolation of the prevailing opportunity costs of alternative instruments in the domestic and
international markets.
Figure 8
Return on Equity, average 1992-96
30%
25%
100/ - t'
10%
The findings in Table 9 and Figure 8 are very surprising. While the average ROE
performance during 92-96 in Hong Kong at 25 percent, Indonesia at 13 percent, Malaysia
at 13 percent, Philippines at 10 percent, Taiwan at II percent, and USA at 12.20 percent
are outstanding, other countries reflect tepid returns. Thailand average ROE of 9.38

18
masks a rapid decline from 13 percent in 1992 to 5 percent by 1996; and Korea average
of 7 percent. Latin America's ROE of 9 percent masks high inflation rates. Some
industrialized countries: France's 5 percent, Germany's 7 percent, and Japan's percent are
surprisingly paltry rates of return.
Table 9 - Return on equity after tax
1992 1993 1994 1995 1996 Average
Hong Kong 29% 24% 27% 24% 21% 25%Indonesia 14% 12% 12% 15% 1 3%O 13%Korea 5% 4% 8% 11% n/a 7%O/Malaysia 12% 14% 14% 14% 13% 13%Philippines 4% 7% 16% 12%/o 9% 10%Singapore 10% 10% 9% 8% 8% 9%Taiwan 12% 10% 14% 12% 8% 11%Thailand 13% 10% 11% 9% 5% 10%Latin America 3% 6% 10% 12% 14% 9%France 7% 3% 6% 3% 6% 5 %Germany 7% 3% 8% 6% 11% 7%Japan 5% 3% 2% 2% 4% 4%USA 4% 8%° 16% 16% 18% 12%
Return on Capital Employed (ROCE) Pre-Tax. Return On Capital Employed or Assets
(ROCE) is a more accurate indicator of profitability. ROCE is defined as Operating
Profit24 divided by Capital Employed2 5. ROCE gives a comprehensive information about
the economic performance of the business, since both operating and non- operating
results (e.g. proceeds from sale of property) are accounted for. An added advantage is that
it permits a comparison between businesses, without regard to accounting conventions
(e.g., depreciation), and different capital mobilization and financing strategies, since the
operating profit is viewed in relation to the total funds employed. ROCE shows the rate
of return on capital employed for the period, and captures the efficiency in the total use of
capital resources.
24 Revenues-Cost of sales-Selling expenses-General administrative expenses-Research and developmentexpenses-Restructuring expenses +/-Other income / expenses.
25 Represents the necessary operating capital derived from the balance sheet assets, i.e. balance sheet totalminus financial items and fiscal items which are not considered as necessary operating capital.

19
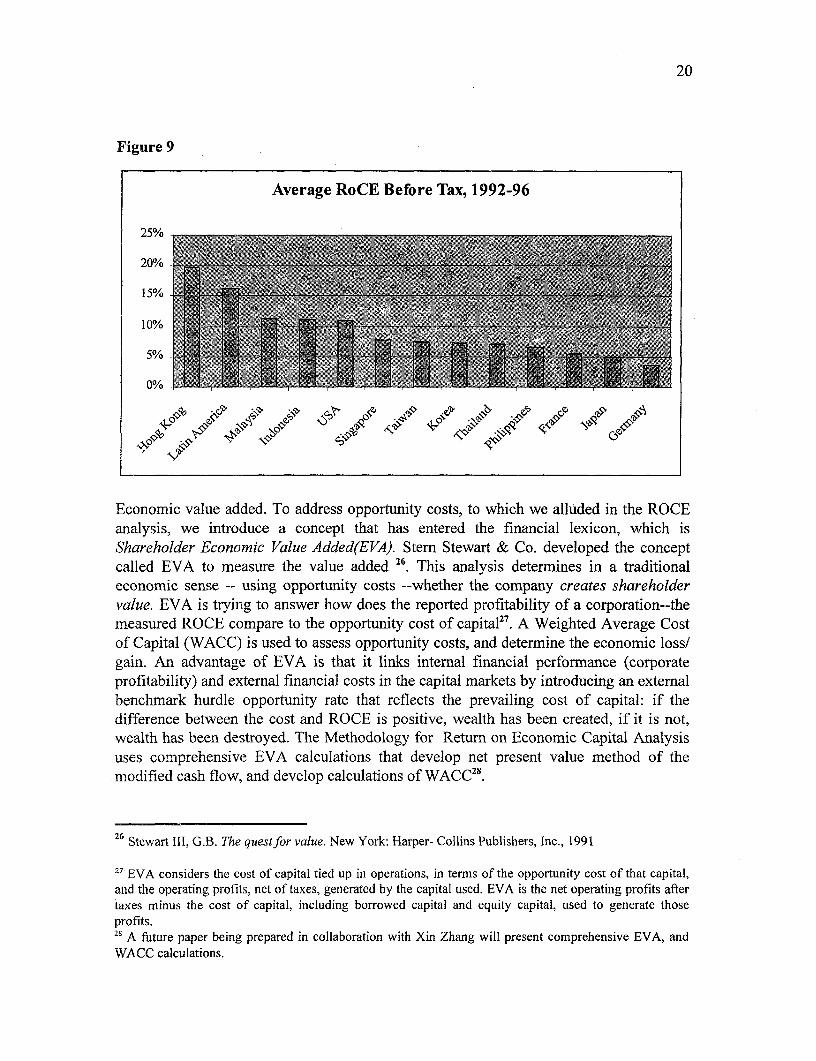
Table 10 and Figure 9 presents the findings with respect to ROCE. Average ROCE in
Hong Kong of 20 percent is solid, Indonesia at 11 percent are good in absolute terms
(however, as subsequently documented, overshadowed by domestic rates of 15-18
percent). The rest of the results for Korea, Malaysia, Philippines, Taiwan,; Latin
America, and industrialized countries: France, Germany, Japan and USA corroborate
previous findings.
The analysis of the ROCE data for Thailand, supplemented by the previous ROE and
Leverage documents that it was not an accident that the Asian crisis started in Thailand.
Financial risk portrayed by quantitative means illustrates that Thailand was an outlier in
every regard ! Virtually all the evidence presented suggests that the performance of Thai
companies has deteriorated progressively during the period: credit ratios have declined,
margins have been squeezed, and a significant decline in ROE is evident from 13 percent
in 1992 to 5 percent in 1996.
Table 10- Return on Capital Employed Pre-Tax (ROCE)1992 1993 1994 1995 1996 Average
Hong Kong 22% 21% 21% 19% 16% 20%Indonesia 12% 11% 11% 11% 10% 11%Korea 7% 6% 8% 9% n/a 8%Malaysia 12% 12% 11% 11% 10% 11%Philippines 6% 7% 7% 8% 5% 7%Singapore 9% 8% 8% 7% 7% 8%Taiwan 8% 7% 10% 7% 5% 8%Thailand 9% 7% 7% 7% 5% 7%Latin America 15% 15%1 14% 14% 23% 16%France 7% 5% 6% 5% 5% 5%Germnany 4% 2% 4% 3% 5% 4%Japan 6% 5% 4% 5%° 6% 5%USA 9% 9% 11% 12%1 13% 11%
20
Figure 9
Average RoCE Before Tax, 1992-96
25%
20% E il15%
5%G
Economic value added. To address opportunity costs, to which we alluded in the ROCEanalysis, we introduce a concept that has entered the financial lexicon, which isShareholder Economic Value Added(E VA). Stem Stewart & Co. developed the conceptcalled EVA to measure the value added 6. This analysis determines in a traditionaleconomic sense -- using opportunity costs --whether the company creates shareholdervalue. EVA is trying to answer how does the reported profitability of a corporation--themeasured ROCE compare to the opportunity cost of capital2". A Weighted Average Costof Capital (WACC) is used to assess opportunity costs, and determine the economic loss/gain. An advantage of EVA is that it links internal financial performance (corporateprofitability) and external financial costs in the capital markets by introducing an externalbenchmark hurdle opportunity rate that reflects the prevailing cost of capital: if thedifference between the cost and ROCE is positive, wealth has been created, if it is not,wealth has been destroyed. The Methodology for Return on Economic Capital Analysisuses comprehensive EVA calculations that develop net present value method of themodified cash flow, and develop calculations of WACC28.
26 Stewart 111, G.B. The questfor value. New York: Harper- Collins Publishers, Inc., 1991
27 EVA considers the cost of capital tied up in operations, in terms of the opportunity cost of that capital,and the operating profits, net of taxes, generated by the capital used. EVA is the net operating profits aftertaxes minus the cost of capital, including borrowed capital and equity capital, used to generate thoseprofits.28 A future paper being prepared in collaboration with Xin Zhang will present comprehensive EVA, andWACC calculations.

21
Although an oversimplification of rigorous EVA analysis (which uses discounted present
values), in this paper29 I limit the analysis to obtaining a rough indication of EVA by
comparing the ROCE to the following lending rates (Table 11) in the banking systems
(that proxy the cost for mobilizing debt) for 1992-1996.
Table 11: Lending interest rate1992 1993 1994 1995 1996 Average
Hong Kong 7% 7% 9% 9% 9% 8%Indonesia 24% 21% 18% 19% 19% 20%Korea 10% 9% 9% 9% 9% 9%Malaysia 9% 9% 8% 8% 9% 9%Philippines 19% 15% 15% 15% 15% 16%Singapore 6% 5% 6% 6% 6% 6%Thailand 18% 16% 14% .. .. 16%France 10% 9% 8% 8% 7% 8%Germany 14% 13% 11% 1 1% 10% 12%Japan 6%1 4% 4% 3% 3% 4%United States 6%1 6% 7% 9% 8% 7%Source: World Bank, World Development Indicators, 1998
The difference between ROCE and Lending Rates in Exhibit is indicative of the EVA
(Table 12). Only for Hong Kong, Japan, Malaysia, Singapore, and the United States
ROCE exceeds the cost of that capital base consistently over the 1992-1996 period ( and
with the exception of Hong Kong, not by a significant margin). However, there are vast
inter-temporal differences as well: trends in Economic Value Added document the
decline in EVA and deterioration in Thailand. Similarly, Japan positive EVA is largely
attributable to the low interest rate prevailing, rather than high ROCE. In contrast, the
analysis suggests that the negative EVA in Indonesia is attributable to the high prevailing
domestic interest rates. Following in Figure 10 are the finding on average economic value
added during the period.
29 For Thailand, in the absence of 95 and 96 data, I use the lending rate up to 94.

22
Table 12 ROCE-Lending Rate______ __ 1992 1993 1994 1995 1996 Average
Hong Kong 15% 14% 12% 10% 7% 12%Indonesia -12% -10% -7% -8% -9% -9%Korea -3% -3% -1% 0% n/a -2%Malaysia 3% 3% 3% 3% 1°% 3%Philippines -13% -8% -8% -7% -10% -9%Singapore 3% 3% 2% 1% I% 2%Thailand -9% -9% -7% n/a n/a -8%Latin America n/a n/a n/a n/a n/a n/aFrance -3% -4% -2% -3% -2% -3%Germany -10% -11% -7% -8% -5% -8%Japan 0% 1% 0% 2% 3% 1%USA 3j % 3_ % 4% 3% 5°/a 4%
Figure 1 0
Average Economic Value Added, 1992-1996
-15% -10% -5% 0% 5% 10% 15%
RoCE-Lending Rate I
Tobin 's Q . Tobin's q was introduced in 1969 by James Tobin to be used as a predictor of
a company's future investments. The q ratio is a market-to-book ratio: the ratio of a

23
company's equity plus debt to the value of the firm's assets, adjusted for inflation and
depreciation. The q ratio indicates whether the company has been able to create value for
shareholders with the assets under their control30 , and measures how much investors are
willing to pay for the business. A Tobin q ratio over 1 means management has added
value for shareholders; and a Tobin q ratio lower than 1 indicates value has been lost.
Therefore, the ration measures the signals created by the equity markets in the respective
markets to invest in fixed assets, or take over existing assets. In this analysis it is used as
indicative countries' growth and profitability prospects, sheding light on whether there
was an environment conducive to capital expenditures created by market valuations.
Table 13 and Figure 11 present the calculations for Tobin's q, and examine the potential
relationship between market valuations, incentives for investments in the respective
countries 31. Notable is the high level of Tobin's q in Asia: Hong Kong at 235 percent for
1992-1996, Indonesia reaching a peak of 149 percent in 1994, Korea, Malaysia at 217
percent in 1993, Philippines at 162 percent for 1993, Taiwan at 164 percent for 1994, and
Thailand at 249 percent in 1993. Latin America, and industrialized countries by
comparison have more modest average Tobin q ratios during 1992-1996: Latin America
at 34 percent, France at 54 percent, Germany at 50 percent, Japan at 97 percent and USA
at 108 percent. The findings finally offer a plausible explanation for the rapid capital
expenditures in Asian economies. They suggest that there were dominant market signals
stimulating rapid capital formation in the Asian economies, and a possible exit strategy
through the equity market. In this context, it is notable as well is that the peak of Tobin q
in Asia is around 1993-94, a period associated with large portfolio equity inflows.
30 The balance sheet reflects a company's depreciated tangible assets only, while the market value of acompany's securities is the best indicator of future profit potential, since it provides an estimate of futurecash flows attributable to all the company's assets.
31 A limitation of this analysis is the use depreciated balance sheet data, and lack of replacement costs.However, I employ Tobin q mainly in a comparative and relative sense, rather than absolute sense.

24
Table 13-Approximation of Tobin's Q - Market value to book value of assets1992 1993 1994 1995 1996 Average
Hong Kong 230% 277%/o 254% 205% 210% 235%Indonesia 77% 96% 149% 137% 136% 119%Korea 65% 77% 77% 72% 72% 72%Malaysia 149% 217% 202% 162% 157% 178%Philippines 109% 162% 162% 141% 150% 145%Singapore 88% 135% 108% 102% 91% 105%Taiwan 117% 158% 164% 124% 145% 142%Thailand 141% 249% 174% 147% 107% 164%Latin America 21% 25% n/a 38% 38% N/aFrance 52% 57% 52% 53% 58% 54%Germany 42% 51 % 50% 49% 57% 50%Japan 90% 94% 98% 89%1 96% 93lUSA 98% 95% 96% 121%° 124% 107%
Figure I 1
Tobin's Q: Market valuation/ Replacement cost(1992-96 average)
250%/ {:08_=200%
150%
100%
I 0%
,4~~-* Aw W,/ , /(

25
SECTION C: EPILOGUE To CORPORATE FINANCE PRACTICES- THE CRISIS
The data used for the previous analysis ends in December 1996. What has happened since
than? A partial picture emerges from recent investment bank research reports. We know
that damage ensuing from high leverage in a raising interest rates, and worsening
economic environment, coupled unhedged foreign currency denominated loans
exposure32 , inflicted on vulnerable corporates in Asian countries. For instance, an analysis
done by Phatra Securities in Thailand on the impact of interest rates suggests a decline of
EBITDA coverage to 1.49X by 1997, that is projected lower for 1998. Similarly,
Goldman Sachs (using the same method as that employed for Thailand by their research
cooperation partner for Thailand --Phatra Thanakit) estimated the EBITDA data for 1996,
1997 and 1998 for Asia33. Using listed non-financial companies as the basis for their
analysis, collecting financial information on these companies for 1996 and first-half 1997
and projected their operating results and financial position for 1997 and 1998. Using
assumptions regarding depreciation expenses, and average interest rates, etc. Goldman
Sachs estimates of EBITDA/Interest Expenses for companies in their sample presented
in Figure 12. The findings suggest a rapid decline in debt service capacity.
Interest Coverage: EBITDA/Interest Payable
10 8 5
E 1996
4 AMi' 9 9 7
2
0
Figure 12_
32 The debt burden was exacerbated by the fall of the Asian currencies against the U.S. dollar.
3 The results for Asia are presented separately.

26
Goldman Sachs estimates as well the number of companies with EBITDA/Interest
Expenses under 1. Assuming a close correspondence between the percentage of non
performing loans and distressed corporates, Exhibit presents an analysis done by
Goldman Sachs' 34 to estimate the companies will not be able to service debt. The
findings in Table 14 document a rapid increase in the percentage of loans (and
companies) in distress in 1998. In Indonesia 45.6 percent of corporates are distressed, in
Korea 31.5 percent of corporates, and in Malaysia 18.5 percent of corporates.
Table 14Country/Year No. of Sales as Interest Implied3 5
Cos. % of GDP Coverage Insolvent CorporationsA B CPhilippines 1996 170 26% 5.2 8.7%
1997 170 25% 3.7 10.8%1998 170 27% 3.31 18.4%1
Indonesia 1996 225 20% 3.7 8.0%1997 207 16% 2.9 15.6%
1998 207 12% 1.31 45.6%Korea 1996 667 96% 2.7 16.2%
1997 667 97% 2.2 20.7%1998 667 97% 1.71 31.5%
Malaysia 1996 479 126% 6.5 8.3%1997 479 123% 6.3 11.2%1998 479 120% 4.31 18.5%
Source: Goldman Sachs
An analysis done by Jardine Fleming to assess the impact of exposure to unhedged
foreign exchange loans suggests that Indonesian corporates are virtually insolvent.
Following in Table 15 is the aggregate balance sheet of the top 50 non-financial
companies in terms of market capitalization as of 30 September 1997 when the exchange
rate was at Rph 3,275/US$. The equity is Rph 68.78 trillion. The exhibit3 6 reflects the
3 Goldman Sachs, Asset Quality for Korean Banks, Part 11, Bottom-Up Approach for Estimating NPLs,February 19, 1998 and oither Asia research.
35 Assuming a close correspondence between corporates and non perforrning loans.
36 Jardine Fleming, Indonesia Strategy update, Completely irrational, January 21, 1998

27
impact of the depreciation of the rupiah against the US$ on company's balance sheets.
Assuming that these companies write-off the foreign exchange losses (and do not
capitalize their forex translation losses37 ) the aggregate balance sheet at the current
exchange rate of Rph 11,500/US$ will show a negative equity of Rph 79.6 trillion. ($6.98
billion @ Rph 1 1,500/US$). Similar impact is being felt throughout the Asian region.
Table 15(Rp trillion)30 September 1997 -- exchange3,275/US$ Exchange rate of Rph rate at Rphl1,500IUS$
Cash 30.05 Rph debts 24.12 Cash 30.05 Rph debts 24.12
AIR 16.55 F/X debts 207.39 A/R 16.55 FIX debts 207.39
Inventory 18.38 Others 33.88 Inventory 18.38 Others 33.88
Others 269.19 Equity 68.78 Others 120.86 Equity -79.55
334.17 334.17 185.84 185.84Source: Jardine Fleming
The erosion of equity capital, and maturity structure of debt in Asia indicates that
corporates have massive equity and debt recapitalization needs. Within the limitations of
credit extension by a distressed banking system, the prospects for credit extensions, and
new financing are limited. Similarly, recapitalization plans that rely heavily on equity
markets' capacity, and rights offerings might not be realistic in the current depressed
stock markets, and domestic bond markets are not sufficiently developed to absorb
potential demand. Therefore, the prospects of corporate to fulfill their recapitalization
needs are questionable at this time.
3 The accounting convention used does not matter. The economic impact of the loss is the same.

28
SECTION C: CONCLUSIONS AND POLICY IMPLICATIONS
Several conclusions are warranted from this financial analysis presented in the paper:
Financial benchnmarks. The findings in the paper suggest a manifested lack of financial
(and some lack of operational) discipline in some Asian countries. Thailand, Indonesia,
Korea stand as a beacon of risky practices that lead to financial distress. The investment-
spending spree contributed to erosion of profit margins, and to poor financial
performance reflected in declining, and low return on equity and return on capital
employed. Other countries in the region: Hong Kong, Malaysia and Taiwan, manifest
prudent financial conduct3".
A further surprising finding is the wide disparity in financing practices, and even more
so, operating and financial performance across the spectrum developing and developed
countries covered in the analysis. The vast differences in economic value results between
countries lead to the conclusion, that in an era of increasing capital mobility, corporates
are not adhering to global standards in creating shareholder value. The problem that some
Asian corporates face, along with French and Latin American listed corporates, is
underemployment of capital. In an era of rapid globalization, and increasingly free
capital flows, where capital can rapidly arbitrage differences in rates of return, such
disparities in underlying ROE and ROCE are probably not sustainable in the long run.
The realization thLat financial gravity laws for corporates can not be defied, and
unsustainable debt/equity ratios, and poor underlying operating results are not tenable
will eventually gain acceptance and will inevitably lead to distress similar to East Asia
corporates. the disparity in operating and financial performance in crisis and other
countries suggests a need for systemic corporate restructuring. Corporates need to
demonstrate to investors sustained EVA performance, in order to ensure sustained
availability of equity capital, and ensure improved equity markets performance.
3 It is notable that Asian countries that escaped relatively unscathed from the crisis- Hong Kong,Philippines, Singapore and Malaysia- are noted for progressive regulatory and supervisory practiceseither/and open to foreign participation in the banking system.

29
Therefore, Prospective corporate capital spending must be targeted with the overriding
criterion being the rate of return, and shareholder value. a restructuring process needs as
well to reflect a readiness to address insolvent corporates through court-supervised
reorganization or bankruptcy; promotion of voluntary restructuring of distressed and
illiquid -- but operationally viable-- corporates through debt/equity swaps, and provision
of necessary liquidity during the workout process through provision for debtor-in-
possession financing39 ; as well as recognition that some corporates might not be
salvageable.
The Macro Financial Context -Capital Market Development: There is considerable
evidence supporting the argument40 that Asia's high-debt and high-risk model of
economic development is a direct result of the savings intermediation process in the
Asian economies. The high savings rates in Asian economies, where the household sector
saves around a third of gross domestic product, were largely intermediated by banks to
businesses. The pursuit of rapid economic growth in the region limited the capacity of
internal earnings generation to buffer accumulation of debt, and resulted in high corporate
leverage. The channeling of household savings by banks to corporates lead to a highly
leveraged financial structure, with high ratios of bank liabilities to GDP, and resulted in
leveraged corporates. The resulting high levels of leverage, compared with countries
where slower-growth and more balanced financial systems, that have developed equity
and bond markets. The ensuing financial structure was inherently risky, and vulnerable
to internal and external shocks. It is interesting that most of the countries with poor
ROCE have underdeveloped capital markets, and relied heavily on bank financing.
Ironically, the key foundations that ensure the success of capital markets--transparency,
corporate accountability and governance, and proper risk pricing via the transmission of
market signals- were lacking, and were therefore underlying deficiencies of the
" Provided that the legal system has provisions for such lending, lenders can grant new credit that haspriority for repayment.
40 See Veneroso and Wade, op cit.

30
performance of corporates in Asia. These limitations possibly amplified the magnitude of
the corporate excesses, leading to the crisis.
Citing one absolute statistic- the bond market in Asia is under 20% of GDP, low by
comparison to developed bond markets - e.g., the US bond market is over 100% of
GDP. In a relative context, the comparative statistics presented in Figure 13 is
instructive. They suggest that in general, the region has exhibited over-dependence on the
banking sector and under-reliance on capital markets in absolute and relative terms. the
Exhibit documents the lack of relative balance in development of financial markets.
Figure 13: The Bond market in relative terms
Composition of Financial Assets by Type, 1995
1000
90%
80% 4
70%
Source: ~ ~ ~ ~ ~ ~ ~ ~ ~ .Emeringsia Bodaake,FiacilTie&19
marketsq complemenuity market40% MB~~~~~~~~~~~~~~~~~~~~*ank assets
30%
0%~~~~~~~~~~~~
Source: Emerging Asian Bond Market, Financial Times 1997
The implication of the analysis is that a more open, balanced and competitive financial
system, in which capital is more allocated in a more transparent fashion, and with
appropriate consideration for risk is needed in Asia4 . A first macro remedial step is
offered by the overwhelming evidence of high leverage witnessed in Asia, and analysis of
"' World Bank researchi ( see Demirguc-Kunt, Asli and Ross Levine) has documented that vibrant equitymarkets complement bank financing.

31
the underlying macro financial linkages of intermediation through the banking system.
An inescapable conclusion, is that in addition to rehabilitation of the banking system,
the policy agenda in Asia should strive for development of domestic capital markets.
Increased reliance on capital markets, and attendant benefits in terms of transparency,
risks assessment and pricing, and dispersion of risk across participants would have
salutary benefits on future corporate discipline and performance in the Asia region. It
suggests a dire need for development of a balanced financial sector, with vibrant equity
and bond markets.
Capital Flows. In the context of the high Tobin q's during a period of rapid capital
inflows, a question that needs to be explored, is whether portfolio capital inflows had an
influence on valuations? The rapid increase in foreign participation the early 90's was in
context of large closely held positions of shares and a limited float (See Figure 14).
Foreign investors now account for a significance presence in terns of ownership and
transactions in Asian capital markets4 2.
Figure 14
Percent Held by Top 5 Shareholders,top 25 companies by sales revenue
90% X80% -
70% -60% -
20% .b .
10%
42 Pomerleano, Michael, Performance of Emerging Market Equity Investments, Emerging MarketsQuarterly, Spring, 1998

32
Therefore a possible implications is that the "exuberant" valuations in East Asia were
associated with large portfolio equity inflows in an illiquid market. In such a situation
marginal flows might have had a disproportionate impact on valuations. For instance, the
following calculations for Thailand in Table 16 suggest that Equity Flow as a percentage
of Free Float Market Capitalization reached a high of 6 percent in 1993. Although the
percentage portfolio flows were significant as a percentage of free float market
capitalization additional research is required to explore this issue. Preliminary evidence
suggests that it is unlikely that portfolio equity flows had a marked impact on
valuations43.
Table 16- Thailand1990 1991 1992 1993 1994
Portfolio equity flows (US$ mill) 449 41 4 3,117 (538)Market Capitalization (US$ mill) 23896 35815 58259 130510 131479Free Float Market Capitalization (40% of total) 9,558 14,326 23,304 52,204 52,592Equity Flows/Free Float Market Capitalization 4.7% 0.3% 0.0% 6.0% -1.0%
Regulatory and Supervisory Framework. Finally, the findings deepen our understanding
of the crisis, and offer lessons for the future. There were clearly micro excesses, within a
disciplined and benign macro financial context. In the past, there were several safety
mechanisms built into the Asian financial system to manage the micro risks. Among
them, mild interest rates oppression subsidized corporations to the detriment of savers.
Second, well established long-term relations between companies and banks, which turned
debt into quasi-equity (the proverbial Asian evergreens"). This relationship suggests lax
credit allocation processes, (possibly supporting projects of politically connected
individuals and organizations), without reference to projects viability. The preponderance
of the evidence collaborates Krugman's hypothesis that crony capitalism, and the
supportive and necessary poor policies designed to "aid and abate" poor credit decisions-
implicit government guarantees, and lax banking supervision lead to poor investments,
4 See Choe, Hyuk ,Bong-Chan Kho, Rene Stultz "Do Foreign Investors Destabilize Stock Markets? TheKorean Experience in 1997" SSRN Electronic Library and Post, Mitchell A and Kimberlee Millar U S.Emerging Market Equity Funds and the 1997 Crisis in Asian Financial Markets by INVESTMENTCOMPANY INSTITUTE PERSPECTIVE Vol. 4 / No. 2 June 1998

33
and misallocation of resources. The lack of appropriate financial incentives and
institutional factors" in East Asia lead to a plausible explanation of the mixture of
currency, corporate and banking crises confronting the region. These recent liberalization
of the financial sector and imposition of market discipline, including lifting of interest
rate controls, was undertaken without adequate prudential framework. The implications
for enhanced regulation and supervision of the financial system are unmistakable. The
recent introduction of improved loan classification systems and capital adequacy norms45
are welcomed and encouraging first steps toward improved regulation and supervision,
but are nevertheless only preliminary first steps that need to be supplemented by an
enhanced regulatory framework and improved enforcement.
-END-
44 For instance, Tobin's q and the incentives for capital fornation are reflective of monetary policy, andportfolio equity inflows.
45 . The increased scrutiny to credit quality probably contributed to the recent adverse developments. Forinstance: enhanced regulatory and supervisory efforts addressed at Thai finance companies lead torevelations about their poor condition, and possibly precipitated the onset of the crisis.

34
References
1. Agrawal, Raj, Stephen Findley, Sean Greene, Kathryn Huang, Aly Jeddy, WilliamW. Lewis, and Markus Petry, Why the US leads and why it matters, The McKinseyQuarterly, 1996 #3
2. Altman, Edward 1. The Z-Score Bankruptcy Model: Past, Present, and Future (NewYork: John Wiley & Sons, 1977), and Corporate Financial Distress and Bankruptcy,2nd edition (New York: John Wiley & Sons, 1993).
3. Asian Development Bank and World Bank, Private Capital Flows to Asia- Lessonsand New Challenges, forthcoming, 1998
4. Choe, Hyuk ,Bong-Chan Kho, Rene Stultz "Do Foreign Investors Destabilize StockMarkets? The Korean Experience in 1997" SSRN Electronic Library
5. Goldman Sachs, Asset Quality for Korean Banks, Part II, Bottom-Up Approach for
Estimating NPLs, February 19, 1998 and other Asia research.
6. Jardine Fleming, Indonesia Strategy update, Completely irrational, January 21, 1998
7. Jensen, Michael C, The modern industrial revolution, exit, and the failure of internal
control systems, The Journal of Finance, Jul 1993
8. Krugman, Paul, What happened to Asia? January 1998
9. Mako, William P., Thai Corporates. Origins of Financial Distress and Measures to
Promote Voluntary Restructuring, April 8, 1998, confidential document, World Bank
10. Pomerleano, Michael, Perfornance of Emerging Market Equity Investments,Emerging Markets Quarterly, Spring, 1998
ii. Post, Mitchell A and Kimberlee Millar, U. S. Emerging Market Equity Funds and the1997 Crisis in Asian Financial Markets, INVESTMENT COMPANY INSTITUTEPERSPECTIV]E Vol. 4 /No. 2 June 1998
12. Radelet, Steven and Jeffrey Sachs, The Onset of the East Asian Financial Crisis,Harvard Institute for International Development, March 30, 1998.
13. Sheng, Andrew, The Crisis of Money in the 21st Century, City University of HongKong Guest Lecture, April 28, 1998
14. Stewart III, G.B. The quest for value. New York: Harper- Collins Publishers, Inc.,1991
15. Wade, Robert amd Frank Veneroso, "The Asian Crisis: The High Debt Model vs. theWall Street-Treasury-IMF Complex", New Left Review 228, March-April, 1998,pp.3-23
16. World Bank, Global Development Finance, 1998

35
17. World Bank, Emerging Asian Bond Market, 1996
18. World Bank, Private Capital Flows - The Road to Financial Integration, OxfordPress, 1997

36
APPENDIX 1: Altman's Z Score - The Methodology
RATIO FORMULA WEIGHTFACTOR
Return on Total Assets Earnings Before Interest and Taxes to x 3.3Total Assets
Sales to Total Assets Net Sales to Total Assets x 0.999Equity to Debt Market Value of Equity to x 0.6
Total LiabilitiesWorking Capital. to Total Working Capital to x 1.2Assets Total AssetsRetained Earnings to Total Retained Earnings to x 1.4Assets Total Assets

Policy Research Working Paper Series
ContactTitle Author Date for paper
WPS1965Manufacturing Firms in Developing James Tybout August 1998 L. TabadaCountries: How Well Do They Do, 36869and Why
WPS1966 Sulfur Dioxide Control by Electric Curtis Carlson August 1998 T. TourouguiUtilities: What Are the Gains from Dallas Burtraw 87431Trade? Maureen Cropper
Karen L. Palmer
WPS'i967 Agriculture and the Macroeconomy Maurice Schiff August 1998 A. ValdesAlberto Valdes 35491
WPSI 968 The Economics and Law of Rent Kaushik Basu August 1998 M. MasonControl Patrick Emerson 30809
WPS1969 Protecting the Poor in Vietnam's Dominique van de Walle September 1998 C. BernardoEmerging Market Economy 31148
WPS1970 Trade Liberalization and Endogenous Thomas F. Rutherford September 1998 L. TabadaGrowth in a Small Open Economy: David G. Tarr 36896A Quantitative Assessment
WPS1971 Promoting Better Logging Practices Marco Boscolo September 1998 T. Tourouguiin Tropical Forests Jeffrey R. Vincent 87431
WPS1972 Why Privatize? The Case of Geroge R. G. Clarke September 1998 P. Sintim-AboagyeArgentina's Public Provincial Banks Robert Cull 38526
WPS1973 The Economic Analysis of Sector Sethaput Suthiwart- September 1998 C. BernardoInvestment Programs Narueput 31148
WPS1974 Volatility and the Welfare Costs Pierre-Richard Agenor September 1998 S. King-Watsonof Financial Market Integration Joshua Aizenman 33730
WPS1975 Acting Globally While Thinking Gunnar S. Eskeland September 1998 C. BernardoLocally: Is the Global Environment Jian Xie 311489rotected by Transport EmissionControl Programs
WPS1976 Capital Flows to Central and Stijn Claessens September 1998 R. VoEastern Europe and the Former Daniel Oks 33722Soviet Union Rossana Polastri
WPS1977 Economic Reforms in Egypt: Rania A. Al-Mashat September 1998 S. DyEmerging Patterns and Their David A. Grigorian 32544Possible Implications
WPS1978 Behavioral Responses to Risk Jyotsna Jalan September 1998 P. Saderin Rural China Martin Ravallion 33902

Policy Research Working Paper Series
ContactTitle Author Date for paper
WPS1979 Banking on Crises: Expensive Gerard Caprio, Jr. Septermber 1998 P. Sintim-AboagyeLessons from Recent Financial 38526Crises
WPS1980 The Effect of Household Wealth Deon Filmer September 1998 S. Fallonon Educational Attainment: Lent Pritchett 38009Demographic and Health SurveyEvidence
WPS1981 Evaluating Public Expenditures James E. Anderson September 1998 L. TabadaWhen Governments Must Rely Will Martin 36896on Distortionary Taxation
WPS1982 Analyzing Financial Sectors in Alan Roe September 1998 D. CortijoTransition: Wlith Special Reference Paul Siegelbaum 84005to the Former Soviet Union Tim King
WPS1983 Pension Reform in Small Developing Thomas Charles Glaessner September 1998 M. NavarroCountries Salvador Vald6s-Prieto 84722
WPS1984 NAFTA, Capital Mobility, and Thomas Charles Glaessner September 1998 M. NavarroMexico's Financial System Daniel Oks 84722
WPS1985 The Optimality of Being Efficient: Lawrence M. Ausubel September 1998 S. VivasDesigning Auctions Peter Cramton 82809
WPS1986 Putting Auction Theory to Work: Paul Milgrom September 1998 S. VivasThe Simultaneous Ascending Auction 82809
WPS1987 Political Economy and Political Ariel Dinar September 1998 F. ToppinRisks of Institutional Reform in Trichur K. Balakrishnan 30450the Water Seotor Joseph 'Wambia
WPS1988 The Informal Sector, Firm Dynamics, Alec R. Levenson September 1998 T. Gomezand Institutionial Participation William F. Maloney 32127
WPS1989 Contingent Government Liabilities: Hana Polackova October 1998 A. PantonA Hidden Risk for Fiscal Stability 85433