the dynamics of wage discrimination and gender equity … · the dynamics of wage discrimination...
TRANSCRIPT

The dynamics of wage discrimination
and gender equity
in Moroccan labor market
SAMI ZOUARI
High Institute of Industrial ManagementUniversity of Sfax, TunisiaMobile: +216 25 241 804
Fax: +216 74 460 744Email: [email protected]
Research Capacity building on Gender and Work in the MENA Region
Second Research Seminar
March 15, 2010
SOFITEL Hotel, Maadi, Cairo, Egypt

Objectives
* The present study aims to highlight wage evolution in Moroccan labor market during the last two decades.
* It will be giving a quantitative idea on labor market issues in Morocco with focus on gender wage gap.
* Provides recommendations in order to avoid any form of discrimination against women in all recruitment steps.

Introduction
By having the same abilities and productivity level, twoworkers should be equally remunerated with noconsideration to their sex nor their ethnicity.
However, on the labor market, with the samecharacteristics, man and woman are receiving differentsalaries advantaging man: We are talking here aboutwage discrimination.
Question:
How could this gender wage gap be explained ?

Outline
1. Theoretical framework
2. The evolution of Moroccan women situation during the last two decades
3. Methodology
4. Descriptive statistics and empirical study
5. Conclusion and recommendations

1. Theoretical framework
1. Taste discrimination [Becker (1957)]
(Displeasure feeling)
2. Statistic discrimination [Phelps (1972); Arrow (1973)]
(Absence of information)
3. Interest discrimination [Lazear et Rosen (1990)] :
(Increasing benefits)

2. The evolution of Moroccan women
situation during the last two decades

2. The evolution of Moroccan women situation during the last two decades
2.1. Social context
Islamic ideology: relationship betweenman and woman based on the image of womanas a “spouse and mother”.
Family ideology: members within thefamily are considered with reference to their sex.According to this ideology man are superior towomen.

2.2. Legislation
* Morocco has ratified the Convention of Elimination of all Forms of Discrimination Against Women (CEDAW) in June 21st, 1993.
* Based on “equal work, equal wage” principal, gender discrimination has been prohibited.
* Moroccan Government has ratified International Labour Conventions in order to guarantee gender remuneration equity (ie. Convention N°100 of June 29th, 1951).
* The new Moroccan labor code protects feminist special rights (maternity, hard work, nocturnal work, etc.).
2. The evolution of Moroccan women situation during the last two decades

2.3. Political environment
* Since 1962, the Moroccan legislation has guaranteed many political rights for female citizens such as: Right to vote and to put her candidacy to the elections, right to the strike, liberty of expression, opinion, association and to adhere to all political or union organizations of her choice.
* Morocco has ratified, successively, the International Convention of Women Political Rights in November 22nd, 1976, and the International Pact of Political and Civil Rights in 1979.
* The percentage of women in the total number of deputies was 0.9% in 1993 and has risen to 10.8% in 2002. Whereas, in the Government, women represented 9.75% in 1995 and became 8% in 2002.
2. The evolution of Moroccan women situation during the last two decades

2.4. Economic context
* Moroccan female have shifted from a passive role in the society toward a very active actors within the socioeconomic development.
* In the mid 1970’s, female participation was so important especially in the labour intensive industries where women are more competitive.
* In the 1980’s, economic recession stopped the continued increasing in female labour force participation since industries were in crises and men were more likely to be employed than women.
* Development occurred during the 1990’s have turned the attention toward the gender consideration in economic and public policies establishment.
* After 2000, ...
2. The evolution of Moroccan women situation during the last two decades

0
10
20
30
40
50
60
70
80
90
Labor force participation and unemployment rates within MENA and OECD countries by sex
Labor force participation rate MALE
Labor force participation rate FEMALE
Unemployment rate MALE
Unemployment rate FEMALE

21.3
32.3 32
23.6
56.5
95 96.1
68.7
15 - 24 25 - 34 35 - 44 45 and above
Moroccan Activity rate by sex and age cohorts, 2008
Female Male

0
5
10
15
20
25
M F M F M F M F M F
15 - 24 25 - 34 35 - 44 45 and above
Total
Un
em
plo
ym
en
t ra
te
Age cohort
Moroccan unemployment rate by sex and age cohorts
2008
2000

3. Methodology
3. Methodology __________________________________________________________
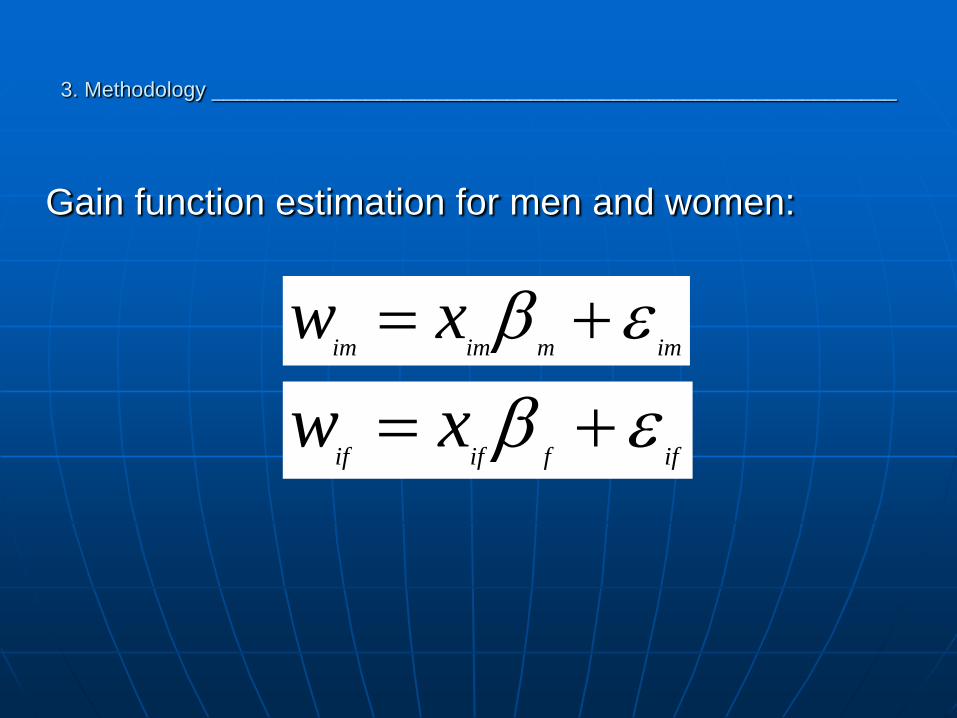
Gain function estimation for men and women:
immimimxw
iffififxw

3. Methodology __________________________________________________________
Average wage gap between men and women will be then:
(the reference is the dominant group)
)ˆˆ()(ˆfmffmmfm
xxxww

3
ff
2
mm
1
fmfm )ˆ(x)ˆ(x)xx(ww
3. Methodology __________________________________________________________
Oaxaca and Ransom (1994):
(the reference is the overall group)

3. Methodology __________________________________________________________
1. Wage gap du to characteristic differences between men
and women (endowments).
2. Additional remuneration attributed to men du to the
differences in their characteristics vs. the global group
(favoritism toward men).
3. Women loss of earning vs. the whole sample
(discrimination against women)

Selection problem (Heckman, 1979)
iii uzI
participet doesn' individual 0 ,0I
participes individual 0 ,0I
i
i
iuzif
iuzif
ii
ii
)z(
)z(
i
ii
3. Methodology___________________________________________________________

By using Heckman (1979) method, it will be possible to control for selection
when estimating the wage function.
Heckman procedure consists in estimating lambda for each individual from
the participation equation using Probit model. Then, lambda will be
introduced as a regressor in the wage equation
iiiiˆxw
3. Methodology __________________________________________________________

The average gender wage gap will be then :
In the equation above, the first two terms correspond to pure favoritism
toward males and pure discrimination against females, the third term is the
human capital component. The last term measures the contribution of
selection effects to the observed gender wage gap.
:
ˆˆˆˆˆˆ
or
xxww ffffmmmmfm
)ˆˆˆˆ()()ˆ()ˆ( ffmmfmffmmfm xxxxww
3. Methodology __________________________________________________________

Neuman and Oaxaca (2004) have decomposed the selectivity
term shown in the previous equation.
This could help by identifying other kinds of discrimination as
given by the following equation:
)6()5(
0
)4(
0 )ˆˆ(ˆ)ˆˆ(ˆ)ˆˆ(ˆˆˆˆˆfmfffmfmmffmm
3. Methodology___________________________________________________________

4. The effects of gender differences in the variables that determine
professional employment
5. The achieves of gender differences in the parameters of the Probit
selectivity equation on the male/female wage differential
6. The consequences of gender differences in the wage response to the
probability of professional employment. In other words, it reflects the wage
gap effects of gender differences in the correlation between the selectivity
equation error term and the wage equation error term as well as gender
differences in wage variability
3. Methodology___________________________________________________________

4. Descriptive statistics and empirical study

4.1. Descriptive statistics___________________________________________
Morocco Living Standard Measurement Studies
1990/91 1998/99
Total sample :IndividualsHouseholds
196773349
304575129
Selected sample:Individuals 1944 3847
Urban 66% 74%
Men 1563 2925
Women 381 922

4.1. Descriptive statistics___________________________________________

4.1. Descriptive statistics___________________________________________

Table 3 : Estimation of the weekly wage logarithm for Male, Female and both, 15 - 64, by sector (public - private),
Morocco, 1991
Variables
Public et private Public Private
Male Female Total Male Female Total Male Female Total
Experience
0,071
(0,005)***
0,032
(0,012)**
0,070
(0,005)***
0,070
(0,009)***
0,022
(0,023)
0,072
(0,009)***
0,067
(0,007)***
0,023
(0,014)
0,065
(0,006)***
Experience
square
-0,001
(0,000)***
0,000
(0,000)
-0,001
(0,000)***
-0,001
(0,000)***
0,000
(0,000)
-0,001
(0,000)***
-0,001
(0,000)***
0,000
(0,000)
-0,001
(0,000)***
Primary non
accompli
0,131
(0,043)***
0,184
(0,120)
0,213
(0,042)***
0,273
(0,083)***
1,129
(0,270)***
0,438
(0,084)***
0,096
(0,051)*
0,032
(0,137)
0,163
(0,049)***
Primary
0,316
(0,050)***
0,827
(0,147)***
0,451
(0,049)***
0,619
(0,078)***
1,410
(0,206)***
0,757
(0,077)***
0,151
(0,065)**
0,424
(0,214)**
0,281
(0,064)***
Secondary 1st
cycle
0,661
(0,063)***
1,283
(0,137)***
0,803
(0,059)***
0,858
(0,082)***
1,782
(0,205)***
1,002
(0,080)***
0,513
(0,103)***
1,112
(0,196)***
0,685
(0,093)***
Vocational
0,806
(0,077)***
1,363
(0,157)***
0,935
(0,071)***
0,927
(0,094)***
1,812
(0,212)***
1,069
(0,090)***
0,764
(0,137)***
1,218
(0,265)***
0,927
(0,125)***
Secondary 2nd
cycle
1,086
(0,101)***
1,579
(0,183)***
1,197
(0,090)***
1,168
(0,117)***
1,986
(0,226)***
1,295
(0,107)***
1,140
(0,191)***
1,805
(0,386)***
1,352
(0,175)***
University
1,536
(0,080)***
1,927
(0,177)***
1,683
(0,076)***
1,616
(0,093)***
2,247
(0,239)***
1,779
(0,092)***
1,870
(0,219)***
2,277
(0,318)***
2,047
(0,182)***
Area (dummy =
1 if urban)
0,074
(0,036)**
0,088
(0,110)
0,002
(0,036)
0,255
(0,068)***
0,633
(0,237)***
0,234
(0,070)***
0,027
(0,043)
-0,005
(0,126)
-0,059
(0,042)
N 1563 381 1944 551 138 689 1012 243 1255
R2 47,76 48,75 45,02 50,17 58,84 47,30 28,30 34,31 26,66
SD is between parenthesis.
*** Significant at 1%, ** Significant at 5%, * Significant at 10%
4.2. Empirical study___________________________________________________________________________

Table 4 : Estimation of the weekly wage logarithm for Male, Female and both, 15 - 64, by sector (public - private), Morocco, 99
Variables
Public et Private Public Private
Male Female Total Male Female Total Male Female Total
Experience
0,078
(0,004)***
0,039
(0,008)***
0,071
(0,004)***
0,079
(0,008)***
0,043
(0,018)**
0,070
(0,007)***
0,077
(0,005)***
0,040
(0,009)***
0,071
(0,004)***
Experience
square
-0,001
(0,000)***
-0,001
(0,000)***
-0,001
(0,000)***
-0,001
(0,000)***
0,000
(0,000)
-0,001
(0,000)***
-0,001
(0,000)***
-0,001
(0,000)***
-0,001
(0,000)***
Primary non
accompli
0,081
(0,031)**
0,270
(0,065)***
0,179
(0,028)***
0,163
(0,068)**
0,138
(0,174)
0,228
(0,067)***
0,077
(0,036)**
0,281
(0,072)***
0,179
(0,032)***
Primary
0,188
(0,036)***
0,486
(0,071)***
0,310
(0,033)***
0,309
(0,063)***
0,527
(0,162)***
0,413
(0,062)***
0,171
(0,043)***
0,471
(0,080)***
0,296
(0,038)***
Secondary 1st
cycle
0,556
(0,046)***
0,876
(0,075)***
0,666
(0,040)***
0,654
(0,061)***
1,063
(0,127)***
0,726
(0,058)***
0,505
(0,066)***
0,796
(0,098)***
0,635
(0,055)***
Vocational
0,652
(0,113)***
1,166
(0,196)***
0,843
(0,100)***
0,753
(0,114)***
1,286
(0,233)***
0,888
(0,108)***
0,632
(0,218)***
1,239
(0,309)***
0,912
(0,182)***
Secondary 2nd
cycle
0,850
(0,059)***
1,145
(0,105)***
0,980
(0,053)***
0,916
(0,070)***
1,310
(0,151)***
1,007
(0,067)***
0,839
(0,099)***
1,208
(0,168)***
1,016
(0,087)***
University
1,289
(0,064)***
1,565
(0,109)***
1,415
(0,056)***
1,298
(0,073)***
1,833
(0,152)***
1,422
(0,069)***
1,420
(0,124)***
1,390
(0,197)***
1,506
(0,107)***
Area (dummy =
1 if urban)
0,118
(0,028)***
0,111
(0,078)
0,054
(0,027)**
0,398
(0,060)***
0,983
(0,255)***
0,378
(0,062)***
0,093
(0,033)***
0,069
(0,085)
0,023
(0,031)
N 2925 922 3847 753 233 986 2172 689 2861
R2 43,38 43,87 41,42 47,05 52,10 42,63 27,12 23,90 24,81
SD is between parenthesis.
*** Significant at 1%, ** Significant at 5%, * Significant at 10%
4.2. Empirical study___________________________________________________________________________

Table5 : Gender wage gap evolution in Morocco, 1991 – 1999
Total Public Private
1991 1999 1991 1999 1991 1999
ln(MWW) - ln(FWW) 34,6% 30,9% 31,5% 21,8% 37,5% 33,5%
Justified wage gap -1,1% 1,5% -5,4% -13,1% 0,8% 5,9%
Unjustified wage gap 35,7% 29,4% 36,9% 34,9% 36,7% 27,6%
Figure 8 : Weekly wage gap decomposition, Morocco,
1991-1999
-40%
-20%
0%
20%
40%
60%
80%
100%
1991 1999 1991 1999 1991 1999
Total Public Privé
Po
urc
en
tag
e
Ecart de salaire expliqué Ecart de salaire inexpliqué

5. Conclusion and recommendations

* Gender wage gap has been declining during the last two decades(in the public more than in the private sector)
* Women in the public sector are more educated than men which could explain the negative wage gap in that sector
* Developing a positive discrimination process
* Necessity of abolition of any discrimination form on the labour market
* More governmental and associative effort is more likely to be essential in order to improve female education
* More investigation need to be done to highlight selection problem and discrimination among youth

Thank you !