the dynamics of bank spreads and financial structure - european
TRANSCRIPT

ISSN 1561081-0
9 7 7 1 5 6 1 0 8 1 0 0 5
WORKING PAPER SER IESNO 714 / JANUARY 2007
THE DYNAMICS OF BANK SPREADS AND FINANCIAL STRUCTURE
by Reint Gropp, Christoffer Kok Sørensenand Jung-Duk Lichtenberger

In 2007 all ECB publications
feature a motif taken from the €20 banknote.
WORK ING PAPER SER IE SNO 714 / JANUARY 2007
This paper can be downloaded without charge from http://www.ecb.int or from the Social Science Research Network
electronic library at http://ssrn.com/abstract_id=955764.
THE DYNAMICS OF BANK SPREADS AND FINANCIAL
STRUCTURE 1
by Reint Gropp 2, Christoffer Kok Sørensen 2
and Jung-Duk Lichtenberger 2
1 We would like to thank an anonymous referee, Allen Berger, Francesco Drudi, Benoit Mojon and Frank Smets, as well as participants at an ECB seminar for useful comments. All views expressed are those of the authors and do not necessarily represent those of the
ECB or the Eurosystem.2 European Central Bank, Kaiserstrasse 29, 60311 Frankfurt am Main, Germany; Corresponding author: Reint Gropp,
e-mail: [email protected]

© European Central Bank, 2007
AddressKaiserstrasse 2960311 Frankfurt am Main, Germany
Postal addressPostfach 16 03 1960066 Frankfurt am Main, Germany
Telephone +49 69 1344 0
Internethttp://www.ecb.int
Fax +49 69 1344 6000
Telex411 144 ecb d
All rights reserved.
Any reproduction, publication and reprint in the form of a different publication, whether printed or produced electronically, in whole or in part, is permitted only with the explicit written authorisation of the ECB or the author(s).
The views expressed in this paper do not necessarily reflect those of the European Central Bank.
The statement of purpose for the ECB Working Paper Series is available from the ECB website, http://www.ecb.int.
ISSN 1561-0810 (print)ISSN 1725-2806 (online)

3ECB
Working Paper Series No 714January 2007
CONTENTS
Abstract 4Non technical summary 51 Introduction 62 Determinants of banks’ price-setting 83 Econometric framework 134 The data 14 4.1 Bank spreads 14 165 Results 216 Extensions 25 6.1 Asymmetric pass-through 26 6.2 Competition and pass-through 28 6.3 Financial innovation and pass-through 347 Robustness checks 368 Conclusion 36References 38Annexes 44European Central Bank Working Paper Series 51
4.2 Explanatory variables

Abstract This paper investigates the dynamics of the pass-through between market interest rates and bank interest rates in the euro area as a function of cyclical and structural differences in the financial system. We find that overall the speed of adjustment for loans is significantly faster than for deposits, and that the pass-through is especially sluggish for demand deposits and savings deposits. Bank soundness, credit risk and interest rate risk are found to exert a significant influence on the speed of pass through. We also find evidence of faster (slower) pass-through for loans (deposits) if the change in monetary policy was up (down). Overall, we find that competition among banks and competition from financial markets result in a faster bank interest rate pass-through. Finally, we find some evidence that financial innovation speeds up the pass-through for those market segments that are most directly affected by these innovations. JEL codes: E43, G21 Key words: monetary transmission, banks, retail rates, financial structure
4ECB Working Paper Series No 714January 2007

NON-TECHNICAL SUMMARY In this paper, we analyse the dynamics of the bank interest rate pass-through of changes in
policy rates taking into account cyclical and financial structural differences across the euro
area countries. The dynamics of banks’ interest rate setting behaviour to policy rate changes is
a key element of the monetary policy transmission mechanism and hence our paper
contributes to the understanding of the way monetary policy is affecting the financing
conditions of households and non-financial corporations. While several studies on this issue
have already been carried out, we attempt to deepen the understanding of the pass-through
process by controlling for both cyclical developments and differences in financial structures
across the euro area countries. Our contribution to the literature mainly concerns the
modelling and estimation of the underlying factors driving the bank interest rate pass-through
process.
Our analysis applies a panel econometric approach including bank and market rates for the
individual euro area countries. We estimate the dynamic adjustment of bank spreads (that is,
the difference between bank interest rates and market rates of corresponding period of rate
fixation) for various bank loan and deposit categories. We control for various exogenous
factors, such as competition from other banks and from non-bank sources, bank soundness
and interest rate risk, and financial innovation.
In line with the previous literature we find that bank interest rates are sticky in the short run
and only adjust gradually over time to changes in policy rates. The degree of sluggishness is
furthermore found to vary across bank products with rates on consumer loans and on current
account deposits being the slowest to adjust. Unlike most of the literature, these results are
obtained by controlling for bank soundness, interest rate risk and the slope of the yield curve.
Furthermore, and also consistent with the literature, we find that bank rates tend to adjust
asymmetrically over the business cycle in the sense that loan rates are quicker to adjust when
interest rates are increasing than when they are declining. Vice versa, deposit rates tend to
adjust relatively quickly when interest rates are declining. The asymmetric pass-through is
evidence that banks have some degree of market power. Indeed, we find that competition
from other banks and from non-bank sources (i.e. financial markets) have a positive impact on
the speed and degree of the bank interest rate pass-through. Finally, we find support for the
notion that financial innovation (such as securitisation or the use of derivatives) increases the
speed of pass-through to those retail bank interest rates directly related to the specific
innovation. Financial innovation, however, does not appear to have effects more broadly on
the speed of pass-through.
5ECB
Working Paper Series No 714January 2007

1. INTRODUCTION
A key aspect of the transmission mechanism of monetary policy is the extent to which policy
rates affect market interest rates, in particular money market rates and eventually also
government bond yields, and how these changes, in turn, affect bank interest rates (Borio and
Fritz, 1995). This paper attempts to deepen the understanding of this mechanism. In
particular, it aims at identifying the factors that determine the price-setting behaviour of banks
in the loan and deposit markets. A thorough understanding of the bank interest rate pass-
through process is crucial from a monetary policy decision-making point of view because
changes in bank lending and deposit rates affect financial conditions of households and non-
financial corporations.
The focus of the paper is the price setting behaviour of banks in euro area countries, more
specifically the pass-through from changes in official policy rates over market rate changes to
bank interest rates. Applying a panel econometric approach, we estimate the dynamic
adjustment of bank spreads (i.e. the difference between the bank interest rate and its
corresponding market rate) for various bank loan and deposit categories to changes in
monetary policy as a function of various exogenous factors, such as bank competition,
financial structures, and financial innovation.
Bank interest rates are often found to be “sticky” in the sense that they do not respond
immediately or fully to changes in the corresponding reference market rates against which they
are priced. This has monetary policy implications as changes in the monetary policy rate hence
may not be fully reflected in the interest rates banks offer their customers. A variety of reasons
has been put forward explaining the observed sluggishness in the bank interest rate pass-
through. For loans, it has been suggested that loan rate stickiness may be a result of credit
rationing of borrowers due to problems of asymmetric information.3 According to this
hypothesis, owing to adverse selection and moral hazard problems banks may choose not to
adjust loan rates in response to a policy rate change (increase) and ration credit instead. Using
micro data Berger and Udell (1992) do not find strong evidence that credit rationing can explain
loan rate stickiness. Instead, they offer an alternative explanation that banks may offer their
long-term borrowers “implicit interest rate insurance” by smoothing bank loan rates over the
business cycle. Banks may thus offer below-market rates during periods of high interest rates
only to be compensated by above-market rates in low-interest rate periods (see also Elsas and
Krahnen (1998)).
3 Jaffee and Russell (1976) and Stiglitz and Weiss (1981); and subsequent papers Blinder and Stiglitz (1993);
Besanko and Thakor (1987a-b); Williamson (1987).
6ECB Working Paper Series No 714January 2007

For deposits, Hannan and Berger (1991) argue that the degree to which banks’ deposit rates are
sticky depend on the elasticity of deposit supply and the costs of changing the price. The
elasticity of supply may depend on structural factors, such as market concentration and the
depositor base of the bank. They find that banks adjust deposit rates in an asymmetric fashion,
as rates tend to be more rigid in the case of interest rate increases than in periods of decreasing
interest rates. Similarly, Mester and Saunders (1995) find that commercial loan rates tend to be
more rigid in the upward direction. Mojon (2001) finds similar results for six euro area countries
and notes that the asymmetry in the pass-through process partly hinges on the degree of
competition.
One strand of the empirical pass-through literature focuses on the systematic measurement of
the extent to which changes in market interest rates are passed-on to changes in retail interest
rates on loans and deposits. The methods used typically involve a dynamic econometric
framework (e.g. Vector Error-Correction Models) that distinguishes between immediate
adjustments and the long-term adjustment, i.e. after taking into account adjustment lags. In a
second step, the estimated measure of the degree of pass-through are then related to the
various determinants of the price-setting behaviour of banks (see, for example, Cottarelli and
Kouralis (1994), Borio and Fritz (1995), Mojon (2001), de Bondt (2002, 2005), Sander and
Kleimeier (2004), Kok Sørensen and Werner (2006) and Schwarzbauer (2006)). We adopt a
slightly different approach by directly estimating the response of bank interest rates/spreads to
changes in the policy rate permitting the speed of this adjustment to vary across differences in
financial structure and financial innovation across countries.
The main results of our paper are the following: First, retail bank interest rates on deposits
generally adjust only sluggishly to changes in monetary conditions, while the pass-through for
lending rates is faster. Unlike most of the empirical literature, these results are obtained by
controlling for bank soundness, interest rate risk, and the slope of the yield curve, the latter
being an indication of the presence of credit risk premia in loan spreads. Second, the
completeness of the pass-through varies substantially across different market segments. In
particular, the interest rates on mortgage loans, loans to non-financial corporations (NFCs) and
on time deposits tend to adjust quicker and more fully than rates on consumer credit and those
on demand deposits and savings deposits. Third, competition, both among banks and from
financial markets, matters significantly for the speed of adjustment. Fourth, we confirm
previous evidence on the asymmetry in the interest rate pass-through. Fifth, we find support for
the notion that financial innovation (such as securitisation or the use of derivatives) increases
the speed of pass-through to those retail bank interest rates directly related to the specific
innovation. Financial innovation, however, does not appear to have effects more broadly on the
speed of pass-through.
7ECB
Working Paper Series No 714January 2007

The paper is structured as follows: Section 2 presents a theoretical overview of the factors
underlying banks’ price setting behaviour. Section 3 outlines the econometric framework for
our investigation of the pass-through and its determinants. Section 4 describes the data used in
the study. The estimation results are contained in Section 5 and Section 6 presents a number
of extensions. Section 7 outlines some robustness checks and Section 8 concludes.
2. DETERMINANTS OF BANKS’ PRICE-SETTING
The theoretical starting point of our analysis of banks’ interest rate setting behaviour is based
on the influential papers of Klein (1971) and Monti (1972).4 In the Monti-Klein model of the
banking firm, banks maximise profits in the current period and have the capacity to set the
price in both loan and deposit markets. That is, banks have some pricing power in these
markets. Banks cannot influence the interest rates in the interbank money market or bond
market, to which they resort when seeking to borrow additional funds or a return on surplus
liquidity. The market interest rate is expected to stand between the rate on loans and the rate
on deposits. It is assumed to represent the funding costs of loans and the opportunity costs of
deposits. The cost of funds is a primary component of the marginal cost of lending, and it is
usually the only component of marginal cost that varies widely from quarter to quarter. The
other components should be relatively stable in the short-run (Ausubel (1991)). The spread
between the retail deposit rate and the market interest rate is the opportunity cost of deposits
to depositors and profitability of deposits to a bank (Hutchinson (1995)).
The Monti-Klein set-up focuses upon the modelling of each side of the balance sheet separately.
However, loan rates may be cross-subsidised from the deposit margin in order to attract
borrowers, if deposit rates are regulated or if there are favourable consumer “lock-in” effects,
once customers have been captured (Chiappori et al (1995), Freixas and Rochet (1997), ECB
(2000)). Recognising the two-sided nature of the banking problem, several authors have
modelled lending and deposit rates simultaneously. One of these models is the dealership
approach, originally proposed by Ho and Saunders (1981) who use the financial literature on
broker bid-and-ask spreads to explain bank spreads. The bank is viewed as a dynamic dealer
(i.e., merely an intermediary between demanders and suppliers of funds) that sets interest rates
on loans and deposits to balance the asymmetric arrival of loan demands and deposits supplies.
4 For an overview of the theoretical literature, see e.g. Baltensperger (1980), Santomero (1984), and Freixas
and Rochet (1997).
8ECB Working Paper Series No 714January 2007

The Monti-Klein model and Ho and Saunders (1981) and the subsequent extensions of these
models point to a variety of factors determining banks’ interest rate setting behaviour, which
we will consider in our modelling of the pass-through process.
An important determinant of the spread between lending rates and market interest rates is
credit risk, reflecting the possibility that some loans will not be fully paid back. If banks are
fully diversified, credit risk will simply be related to the aggregate state of economy; if banks
are not, each individual loan may reflect idiosyncratic credit risk. As in this paper we are
using interest rate data aggregated at the country level, we will focus on aggregate credit risk,
as reflected in standard measures of the business cycle. The level of aggregate credit risk in
the economy will determine the conditions for lending and, consequently, the reaction of the
bank to changes in market conditions. Thus, in the absence of credit rationing, we expect that
changes in credit risk will positively affect the lending spread.5 However, banks also have
other possibilities for managing credit risk, including tighter collateral requirements to back
up the loan, restrictive covenants and other non-interest characteristics of the loan. In this
paper, given data limitations, we will focus solely on interest rate effects of credit risk.6
Banks are also exposed to interest rate risk because they have to deal with demands for
loans and supplies of deposits that reach them asymmetrically in time. If a deposit arrives at a
different instant in time from a new loan demand, the bank will have to temporarily invest the
funds in the money market at the short-term market interest rate. In doing so, the bank faces
reinvestment risk at the end of the decision period should the market interest rate fall.
Similarly, if the demand for a new loan is met by the bank without a contemporaneous inflow
of deposits, the bank would have to resort to short-term borrowing in the money market to
fund the loan, thereby facing refinancing risk if the short-term interest rate goes up. Volatility
in the money market rates is therefore expected to lead to higher interest margins, as banks
will require a higher premium to compensate for the interest rate risk.7
A further source of interest rate risk arises from the fact that banks typically seek to match the
demand for long-term loans with the supply of short-term deposits.8 This maturity
transformation exposes the interest rate revenue of a bank to fluctuations in market interest
5 By contrast, in periods of credit rationing banks tend to restrict the supply of loans to riskier borrowers rather
than adjusting their rates accordingly, thereby slowing down the speed of adjustment to changes in market rates and in this case we should not expect higher margins.
6 Note that since we are interested in the difference between market rates and bank rates to similar borrowers, this limitation may not be very severe, because both in bond issuance and bank loans non-interest characteristics may be changed along similar lines through a business cycle.
7 Maudos and Fernández de Guevara (2004) further suggest that a higher correlation between the two prime sources of risk (i.e. interest rate risk and credit risk) is likely to imply higher spreads.
8 Rate-sensitive assets may be variable-rate loans and short-term loans, and rate-sensitive liabilities may be short-term time deposits and variable-rate certificate of deposits. In practice, there are many sources of interest rate risk, depending on “structural” factors such as the variability of loans, the reference indices and re-pricing intervals.
9ECB
Working Paper Series No 714January 2007

rates. For example, if a bank holds more rate-sensitive liabilities than assets, a rise in market
interest rates will reduce bank profits. To mitigate the effect of adverse changes in market
interest rates, banks often take recourse to various forms of derivatives. The transfer of the
risk will however entail a cost to the bank, which may be reflected in a higher bank spread. In
addition, to the premium demanded by the hedge counterparty (i.e. the price of the
derivative), the cost may also reflect a lost gain if, in the absence of the hedge, market interest
rates had moved into a favourable direction.
The pricing behaviour of banks is also assumed to be affected by the degree of competition
among banks, from financial markets and non-banks. As regards competition among banks,
the impact of market concentration on the pricing behaviour of banks is generally summarised
in the literature by two opposing hypothesis (see e.g. Corvoisier and Gropp, 2002). The
“structure-conduct-performance” hypothesis asserts that higher market concentration leads to
less favourable pricing to consumers due to some form of collusion among banks. In the
related relative-market-power hypothesis, only firms with large market shares and well-
differentiated products are able to exert market power in pricing deposits and loans and earn
positive profits (Berger, 1995). In contrast, the “efficient-structure hypothesis” suggests that
concentration would increase the overall efficiency of the sector. Concentration is conjectured
to arise from more efficient banks growing more rapidly than less efficient banks, or more
efficient banks taking over less efficient banks. If this is the case, banks might price their
loans and deposits more competitively even in a highly concentrated market. In addition, the
theory of contestable markets argue that banks may behave competitively also in a highly
concentrated market if the barriers to entry are low. Corvoisier and Gropp (2006) argue that
the ability of consumers to compare rates across a large number of banks in the internet may
have increased contestability and reduced the importance of physical presence in a market.
An implication of the Monti-Klein model is that spreads will be adversely affected if substitutes
to banking products are available in financial markets (Freixas and Rochet, 1997). Similarly, in
the Ho and Saunders model, the bank spreads depend on the elasticity of the demand for loans
and the supply of deposits. The less elastic the demand for loans or supply of deposits, the
higher a premium the bank will be able to apply if it exercises market power. Therefore, also
competition from non-bank financial products may matter. While most of the debt financing
of households is bank-based, non-financial corporations may also borrow funds directly through
the issuance of debt securities. In the case of lending rates to non-financial corporations, we
would therefore expect that easier access to direct debt financing puts pressure on banks to
narrow their spread (see e.g. Mojon, 2001; and Corvoisier and Gropp, 2002). Similarly, in the
case of deposit rates, we would expect that easier access to direct investment in securities or
indirectly through money market funds and investment funds (especially by households) puts
10ECB Working Paper Series No 714January 2007
pressure on banks to price their deposit rates more competitively.9
The subject of competition from non-bank financial products naturally leads to the much wider
field in the economic literature of financial innovation. For example, in Thornton (1994)
financial innovation, partly driven by deregulation, takes the form of an increased prominence
of non-bank financial intermediaries relative to banks in supplying credit and an increased
reliance on obtaining funds directly in the markets, rather than through traditional financial
intermediaries. He points, in particular, to a widening of the array of financing options available
to small and medium sized enterprises, the development of a commercial paper market, lending
by non-bank finance companies (to businesses, consumers and real estate borrowers), the
securitisation of loans, and the rising importance of mutual funds. More generally, financial
innovation refers not only to technological advances which transform the access to information,
trading channels and the means of payment, but also to the emergence of new financial
instruments and services, and more developed and complete financial markets (González-
Paramo, 2006). Tufano (2003) further observes that innovations are sometimes divided into
product and process innovation, with product innovations exemplified by new derivative
contracts, new corporate securities or new forms of pooled investment products.10 Overall, this
seems to suggest that bank spreads are likely to be affected not only by higher competition from
non-bank financial intermediaries that provide a wider choice of financing and investment
possibilities and, in some cases, address problems of incomplete markets, but also by other
types of financial innovations such as advances in the management of risk, in addressing agency
cost and information asymmetries, and in minimising transaction or search costs.
Liquidity risk is the risk of not having sufficient cash or borrowing capacity to meet deposit
withdrawals or new loan demand, thereby forcing banks to borrow emergency funds at potentially
higher cost (Angbazo, 1997). As the proportion of funds invested in cash or cash equivalents
increases, the liquidity risk of the bank declines, which may reduce the liquidity premium in bank
spreads. Similarly, by introducing liquidity risk into the Monti-Klein model (in the form of some
randomness in the volume of loans or deposits), Prisman, Slovin and Sushka (1986) show that the
cost of the bank’s resources should increase, as it includes a premium to compensate for the
expected cost of a liquidity shortage (see also Freixas and Rochet, 1997).
The level of bank capital may also affect the price-setting behaviour of banks. First, banks
9 Borio and Fritz (1995) point out that the relevance of the degree of competition in loan and deposit markets
loses part of its force once a time dimension is explicitly considered. Demand curves are likely to be more inelastic in the short-run than in the medium-run. Fixed search and switching costs, for instance, hardly seem to justify a permanent limited response to changes in the market interest rates. The forces of arbitrage between different banks, or between banks and financial disintermediation become more powerful as time elapses. At the same time, in practice, it may be difficult to distinguish stickiness in the long-term (adjustments in equilibrium) from stickiness in the short-term (adjustments between equilibria).
10 Examples of process innovations include new means of distributing securities, processing transactions, or pricing transactions.
11ECB
Working Paper Series No 714January 2007

hold capital to insulate themselves against both expected and unexpected credit risk (Saunders
and Schumacher, 2000). Specifically, while capital requirements constitute the minimum
level, banks often endogenously choose to hold more capital against unexpected credit losses
or market discipline may induce them to hold more capital (Flannery and Rangan, 2004).
However, holding equity capital is a more expensive funding source than debt (because of tax
and dilution of control reasons). Thus, banks that have a relatively high capital ratio for
regulatory or credit reasons can be expected to seek to cover some of the increase in the
average cost of capital by operating with higher interest rate spreads. Second, since capital is
considered to be the most expensive form of liabilities, holding capital above the regulatory
minimum is a credible signal of creditworthiness on the part of the bank (Claeys and Vander
Vennet, 2003). When depositors exert “depositor market discipline”, this may enable the bank
to lower its deposit funding cost and, hence, increase the deposit spread. 11
Several further extensions were made to the original Ho-Saunders model. Angbazo (1997)
introduced the effect of management efficiency (or quality). As management decisions affect the
composition of assets which are earning (high) interest, or conversely, liabilities which are low-
cost sources, more efficient management should be reflected in higher interest spreads. Maudos
and Fernández de Guevara (2004) incorporated the productive nature of the banking firm into the
original Ho-Saunders model by including the production costs associated with the process of
intermediation between deposits and loans. The average operating costs of the banking firm is
expected to affect the pricing behaviour in the sense that banks that incur high average unit costs
are likely to operate with higher interest margins. Below we use the asset weighted average
distance to default of banks in a country as a combined measure of bank quality, which is largely
motivated by the un-availability of quarterly balance sheet data for banks in Europe. Gropp et al.
(2006) have shown that the distance to default may indeed be a consistent indicator of bank
stability for European banks and potentially even the banking system (Gropp, 2004).
Berlin and Mester (1999) argue that core deposits (that is, demand and savings deposits) are
usually relatively stable and cheap compared with borrowed funds. While they argue that
access to these core deposits allows banks to smooth lending rates over the interest rate cycle,
it may also be the case that a stable pool of core deposits provides banks with cheap funding
thereby allowing them to operate with higher margins.
11 Alternatively, holding excess capital may signal a stronger incentive for banks to efficiently monitor their
borrowers (in a situation of scarce supply of high quality borrowers), e.g. Allen, Carletti and Marquez (2005).
12ECB Working Paper Series No 714January 2007

3. ECONOMETRIC FRAMEWORK We start from the following basic regression in levels:
(1) ∑=
− +++Φ+Φ+Φ++=T
jiccitciitictcjctjtci XXXPRS
010 ενναα ,
where Stci represents the spread of bank product i (demand deposits, savings deposits, time
deposits, different types of loans) at time t in country c relative to a market instrument of
comparable characteristics. PRct-j represents a measure of the policy rate in country c (one rate
for the euro area after 1999) at time t-j, where j spans from 0 to T time periods (quarters). For
the policy rate we use a 3-month money market rate which assumes a complete and
immediate pass-through from the key monetary policy rate. In the econometric specification
we will generally use two lags.12 Xct, Xit, and Xcit are country-specific, product specific and
country/product specific control variables at time t, respectively and νc and νi are country-
specific and product specific fixed effects, respectively. εi is the standard iid error term.
In order to better permit a test of the dynamic adjustments of spreads, S, in response to the
level of the policy rate and permitting a better identification, we estimate equation (1) in first
differences. This would take the form
(2) ∑=
− +++∆Ψ+∆Ψ+∆Ψ+∆+=∆T
jiccitciitictcjctjtci XXXPRS
020 εννββ ,
where all symbols are defined as before, ∆ denotes first differences and ∆PRct-j represents the
innovation of the policy rate in period t-j. We will define the innovation in the policy rate by
taking the first difference of a short-term money market rate, which means we would consider
the expected and the unexpected component of monetary policy. We should note that
estimating the model in first differences results in an elimination of structural control
variables, leaving only cyclical and other time-varying variables as controls.13
Starting from this basic specification we test a number of more refined hypotheses. First, we
examine whether different bank products exhibit different adjustment dynamics to policy
rates. Towards this end we estimate
12 We also estimated specifications with lags beyond two quarters but they were found to be insignificant. 13 One could argue that by first differencing the country and product specific effects disappear as well; however,
it seems sensible to retain them, given that even in first differences their may be unobserved country or product specific factors.
13ECB
Working Paper Series No 714January 2007

(2a) ∑∑=
− +++∆Ψ+∆Ψ+∆Ψ+∆+=∆T
jiccitciitictcjctji
itci XXXPRS
030 εννββ .
In equation (2a) we permit different effects of monetary policy innovation on the spread of
different bank products. For example, if the insurance effect is important, one would expect
the adjustment dynamics to be slower for small business loans than for large business loans.
Furthermore, we are interested in the question whether downward adjustments in the policy
rate exhibit different dynamics from upward adjustments. Hence we further estimate
(2b)
4
0 00 )1(
ενν
βββ
+++∆Ψ+∆Ψ+∆Ψ+
∆−+∆+=∆ ∑ ∑∑∑
= =−−
iccitciitictc
T
j
T
jjctji
i
upjctji
i
up
tci
XXX
PRIPRIS ,
where the indicator variable Iup is equal to 1 if monetary conditions tighten. Specification (2b)
permits different dynamics depending upon whether the last policy change was up or down.
Hence, we test whether a downward change in the policy rate results in a slower adjustment
for loan rates than for deposits rates and vice versa.
Finally, we are interested in how different characteristics of the banking system and in
financial sector development affect the dynamics of adjustment. For example we define a set
of indicator variables which reflect countries with high degrees of concentration and low
degrees of concentration in banking; one could define a set of indicator variables reflecting a
relatively strong or weak banking system; or e.g. banking systems with a high degree of
financial innovation (such as derivatives, securitisation). We will explore a multitude of such
characteristics below. Hence, letting such an indicator be denoted as Ihigh and Ilow and
(2c)
4
0 00
ενν
βββ
+++∆Ψ+∆Ψ+∆Ψ+
∆+∆+=∆ ∑ ∑∑∑
= =−−
iccitciitictc
T
j
T
jjctji
i
lowjctji
i
high
tci
XXX
PRIPRIS .
4. THE DATA 4.1. Bank spreads
The bank spreads for the period from 1994 to 2002 are calculated on the basis of the National Retail Interest Rate dataset (NRIR) of the national central banks of the Eurosystem, which are in some cases complemented by other publicly-available national series. For the period starting in 2003, the spreads are calculated on the basis of the MFI interest rate (MIR) on new
14ECB Working Paper Series No 714January 2007

14 This paper is one of the first to use the harmonised MIR statistics. Earlier contributions include Kok Sørensen
and Werner (2006) and Affinito and Farabullini (2006). 15 In fact, Ausubel (1991) measures the cost of funds of loans as the market interest rate plus the bank bond
yield spread. However, in the absence of data on bank bond spreads broken down by maturity, we use yields on government bonds as a proxy.
15ECB
Working Paper Series No 714January 2007
business. While the NRIR sample covers a longer time period, the MIR sample is of a much higher quality. The latter is collected on the basis of harmonised definitions and methods across the euro area, and available with a much higher level of detail along a number of dimensions.14 At the same time, some care should also be taken when interpreting the MIR, in particular when making comparisons across countries. Remaining influences not accounted for in the additional breakdown are, for example, differences in the fiscal and regulatory frameworks and differences in important product characteristics such as the typical maturity of the various banking products (period of initial rate fixation) and differences in the degree to which loans are secured (e.g. ECB (2002, 2004, 2005, 2006)).
The sample of quarterly data extends over the period 1994Q2 to 2004Q4 (i.e. 43 periods) covering eight product categories across nine countries. The total number of observations, i.e. 3,096 (=43*8*9) is not attained because of some data availability constraints. The detailed distribution of observations per country and product category summing to 2,579 is shown in Annex 1. There should be 42 observations in the case of one lag (=43-1), although in some cases a few data points are missing at the beginning of the sample period or data are not available.
The market interest rates are the national inter-bank deposit rates and national government bond yields for the NRIR period up to December 1998, and the corresponding euro area market interest rates thereafter.15
The spreads are calculated at the country level for eight different products: four types of loans (short-term and long-term loans to non-financial corporations, consumer credit, mortgage loans) and four types of deposits (demand deposits, savings deposits, short-term and long-term time deposits). The relative importance of these product categories is illustrated in Chart 1.
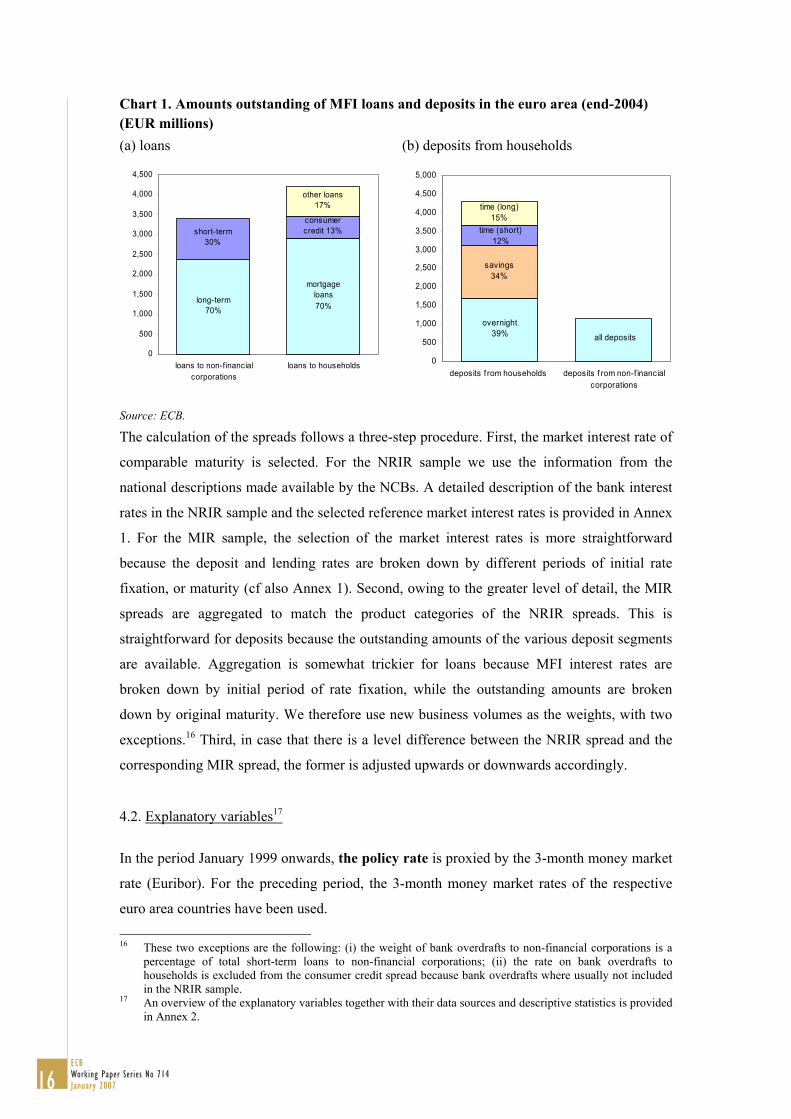
Chart 1. Amounts outstanding of MFI loans and deposits in the euro area (end-2004) (EUR millions) (a) loans (b) deposits from households
mortgage loans70%
long-term 70%
consumer credit 13%short-term
30%
other loans17%
0
500
1,000
1,500
2,000
2,500
3,000
3,500
4,000
4,500
loans to non-f inancialcorporations
loans to households
overnight 39% all deposits
savings34%
time (short) 12%
time (long) 15%
0
500
1,000
1,500
2,000
2,500
3,000
3,500
4,000
4,500
5,000
deposits f rom households deposits f rom non-f inancialcorporations
Source: ECB. The calculation of the spreads follows a three-step procedure. First, the market interest rate of
comparable maturity is selected. For the NRIR sample we use the information from the
national descriptions made available by the NCBs. A detailed description of the bank interest
rates in the NRIR sample and the selected reference market interest rates is provided in Annex
1. For the MIR sample, the selection of the market interest rates is more straightforward
because the deposit and lending rates are broken down by different periods of initial rate
fixation, or maturity (cf also Annex 1). Second, owing to the greater level of detail, the MIR
spreads are aggregated to match the product categories of the NRIR spreads. This is
straightforward for deposits because the outstanding amounts of the various deposit segments
are available. Aggregation is somewhat trickier for loans because MFI interest rates are
broken down by initial period of rate fixation, while the outstanding amounts are broken
down by original maturity. We therefore use new business volumes as the weights, with two
exceptions.16 Third, in case that there is a level difference between the NRIR spread and the
corresponding MIR spread, the former is adjusted upwards or downwards accordingly.
4.2. Explanatory variables17
In the period January 1999 onwards, the policy rate is proxied by the 3-month money market
rate (Euribor). For the preceding period, the 3-month money market rates of the respective
euro area countries have been used.
16 These two exceptions are the following: (i) the weight of bank overdrafts to non-financial corporations is a
percentage of total short-term loans to non-financial corporations; (ii) the rate on bank overdrafts to households is excluded from the consumer credit spread because bank overdrafts where usually not included in the NRIR sample.
17 An overview of the explanatory variables together with their data sources and descriptive statistics is provided in Annex 2.
16ECB Working Paper Series No 714January 2007

In the dealership model of the banking firm, interest margins vary positively with the
instantaneous variance of the interest rates on deposits and loans, that is, the volatility of
interest rates in these markets (Saunders and Schumacher (2000)). Following most of the
empirical literature (e.g. Saunders and Schumacher (2000), Maudos and Fernández de
Guevara (2004)), for interest rate risk we include a measure of the quarterly standard
deviation of the daily 3-month money market rate for deposits and of the daily 5-year
government bond yields for loans.
We use the distance-to-default of banks from Moody’s KMV (weighted by total assets) as a
combined measure of bank soundness, which may be interpreted as reflecting developments
in liquidity risk, bank capital, and management efficiency, which should have an impact on
bank spreads.18 The distance-to-default is a measure of the value of the banks’ assets and its
liabilities. Default occurs when the value of the assets (A) falls below the value of the
liabilities (L). The distance-to-default is thus the distance to the point on the asset return
distribution where A<L.
The measurement of credit risk is not straightforward and limited by data availability
considerations. Different studies have therefore used different measures. We have considered
several alternative measures (each of which has benefits and drawbacks), and, in an attempt to
capture the banks’ assessment of the future ability of borrowers to reimburse their loans,
selected the term structure risk given by the slope of the yield curve (difference in 5-year
government bond yield and 3-month interbank deposit rate) as our preferred measure.19
Following Hanweck and Rye (2004), we verify whether, for example, a flattening in the term
structure indicates a greater likelihood of recession and a related increase in credit risk, which
may be expected to increase interest margins.
The next three groups of explanatory variables are closely related. A basic determinant of price
determination is the structure of that market and the degree of competition that prevails among
its suppliers. Looking beyond the market itself, competitive conditions are further affected by
other markets that offer similar or related products (substitutes). One important driver of
competition both among banks and from non-banks is the rate of financial innovation which can
either provide new process technologies (e.g. new risk management methods) or result in the
introduction of new products into the market (e.g. securitisation or venture capital). 18 As, for example, suggested by Angbazo (1997), Saunders and Schumacher (2000), and Maudos and
Fernández de Guevara (2004). 19 The alternative measures that we also considered include the following. First, we considered the ratio of loan
write-offs, doubtful (or non-performing) loans or provisions to total loans. However, a common drawback of these measures is that they are backward-looking (reflecting realised defaults) rather than forward-looking proxies of credit risk (Brock and Franken, 2003). Second, we also considered the rate of unemployment, although like Berlin and Mester (1999), we have some concern that it is a lagging measure of economic conditions. Third, we considered the ratio of debt to quoted shares issued (for loans to non-financial corporations) and the ratio of debt to disposable income (for loans to households). Fourth, we also considered the non-financial corporate expected default frequencies (as derived from Moody’s KMV).
17ECB
Working Paper Series No 714January 2007

As regards competition among banks, we measure the degree of market concentration by the
Herfindahl indexes for different bank products, following Corvoisier and Gropp (2002). In
contrast, to the market share of the five or ten largest banks, the Herfindahl index will reflect
changes in the market structure also among smaller banks. However, in the literature it is
contested whether concentration ratios provide valuable information on the degree of
competition in the market. For example, an increase in concentration as a result of
consolidation and market deregulation may reflect that more efficient and competitive banks
are taking over less efficient ones. This could potentially increase rather than decrease
competition.20 For that reason, we complement the concentration measures with the Panzar-
Rosse H-statistic, which is an alternative indicator of banking competition (see Chart 2). The
H-statistic measures the extent to which changes in banks’ costs and expenses are being
reflected in changes in their revenues. In case of a one-to-one relationship (i.e. H=1), banks
are operating in a perfectly competitive environment (in other words, their market power is
low). Lower values of H thus indicate increasing degrees of bank market power (H=0
indicating monopoly). As the two indicators represent different ways to measure competition
they do not necessarily provide the same results. In particular, Corvoisier and Gropp (2006)
argue that the physical presence of a bank may no longer be a necessary condition for
operating in that market, because households and firms may be able to obtain loans and make
deposits through the internet. This would suggest that the H statistic, which is a measure
based on bank behaviour rather than bank presence, should be a better measure of competition
(this will to some extent be confirmed below). Chart 2 illustrates that the Herfindahl index
and the H-statistics are not highly correlated. Given that there is no single accepted measure
of competition we have estimated specifications with different measures and cross-checked
the results obtained.
20 For some recent overview studies on banking competition see Bikker (2004), Berger et al. (2004) and
Northcott (2004).
18ECB Working Paper Series No 714January 2007

Chart 2. Competition (average between 1994-2004)
050
100
150
200
mea
n of
her
f
AT BE DE ES FI FR IT NL PT
Herfindahl index
0.2
.4.6
.8m
ean
of h
stat
2
AT BE DE ES FI FR IT NL PT
h-statistic of market power
Sources: ECB, Eurostat, Claessens and Lieven (2003), Bikker (2004), Carbo et al (2005), authors’ calculations. Note: The horizontal line indicates the median across countries.
For competition from market-based finance, we first of all use the stock market
capitalisation to GDP ratio as a measure for the overall degree of capital market orientation in
the national financial system. Second, focusing on specific product segments, in the case of
lending rates to non-financial corporations we employ the ratio of debt securities issued by
non-financial corporations relative to MFI loans to non-financial corporations (see Chart 3).
We would expect a negative relation with the lending spread. Similarly, we use the size of
non-bank loans to the household sector as a proxy for the substitute means of financing for
households. We would expect that the existence of this alternative financing source for
households would have a negative effect on household loan spreads. In the case of deposit
rates, we proxy competition from market finance by the ratio of assets of money market funds
plus assets of investment funds to GDP.21
21 Rosen (2002) argues that the pricing of deposits is affected by the degree of customer sophistication, where
sophistication implies access to alternative investments providing similar services.
19ECB
Working Paper Series No 714January 2007

Chart 3. Non-bank substitutes (percentage of GDP, average between 1994-2004)
050
100
mea
n of
sha
re
AT BE DE ES FI FR IT NL PT
Stock market capitalisation
05
1015
mea
n of
bon
d
AT BE DE ES FI FR IT NL PT
Corporate bonds
020
4060
80m
ean
of n
mfh
h
AT BE DE ES FI FR IT NL PT
Non-bank loans to households
010
2030
4050
mea
n of
fund
AT BE DE ES FI FR IT NL PT
Mutual funds
Sources: ECB, NCBs, FESE, authors’ calculations. Note: The horizontal line indicates the median across countries.
The number of quantitative studies of financial innovation is modest, and measures of the
degree of financial innovation over time and across euro area countries have not been
developed. Without having the pretension of filling this gap, we adopt a rather pragmatic
approach for the purposes of this paper and measure financial innovation by a number of
indicators (all as a percentage of GDP), the choice being essentially driven by data
availability: (i) turnover in single-currency interest rate derivatives from the BIS Triennial
Central Bank Survey22; (ii) securitisation and issuance of covered bonds from the European
Securitisation Forum23; and (iii) venture capital investments from the European Venture
Capital Association. These measures are illustrated in Chart 4.
22 Single-currency interest rate interest rate derivatives include forward rate agreements (FRA), interest rate
swaps, options, warrants, caps, floors, collars, corridors and swap options (see BIS (2004)). 23 While covered bonds such as Pfandriefe or “Realkreditobligationer” have been used for several centuries in
Germany and Denmark, they are nevertheless included as a financial “innovation” because these types of specific market-based funding instrument for mortgage loans have over recent years been introduced in other EU Member States (e.g. Lichtenberger (2001)).
20ECB Working Paper Series No 714January 2007

Chart 4. Financial innovation indicators (average between 1994-2004)
0.0
1.0
2.0
3.0
4m
ean
of d
eri
AT BE DE ES FI FR IT NL PT
Derivatives as % of GDP
0.0
2.0
4.0
6.0
8.1
mea
n of
sec
u
AT BE DE ES FI FR IT NL PT
Securitisation as % of GDP
0.0
002
.000
4.0
006
.000
8m
ean
of v
c
AT BE DE ES FI FR IT NL PT
Venture capital as % of GDP
Sources: BIS (Triennial survey), European Securitisation Forum, European Venture Capital Association (EVCA), authors’ calculations. Note: The horizontal line indicates the median across countries.
5. RESULTS As a starting point to the estimation of the dynamic adjustment of bank spreads in the euro
area, we use a fairly parsimonious model in terms of the inclusion of control variables. Given
that we estimate our model in first differences and include country specific fixed effects in the
model, we do not need to control for structural characteristics that tend to remain broadly
unchanged in the short-run. Hence, we only control for variables that are likely to change over
the business cycle, such as credit risk, interest rate risk and bank soundness. Later on (when
estimating model 2c), we will take into account the role of structural characteristics in the
dynamic adjustment of bank spreads.
As our baseline model (model 1), we estimate equation (2) allowing for different slopes with
respect to the coefficients on the 3-month money market rate for loans and deposits. We find
evidence at the one percent significance levels that changes in loan spreads are negatively
related to changes in the 3-month market rate and positively related to the one-period lag of
the changes in the 3-month money market rate (see Table 1). The converse applies to changes
21ECB
Working Paper Series No 714January 2007

in deposits spreads. This may be interpreted as a sluggish pass-through: An immediate and
full adjustment of bank rates to changes in money market rates would imply that changes in
bank spreads are not affected by changes in market rates, i.e. a coefficient of zero.24 In that
case, a given change in the market rate would be fully reflected in a change in bank rates,
leaving the spread unchanged. In contrast, when lending rates adjust with a lag to a given one-
off change in market rates (for example, an increase) we would expect to observe a decrease
in the spreads this period (as bank rates adjust upwards more slowly), i.e. a negative relation
between the change in the market rate and the change in the spread. As lending rates
eventually rise there is, however, a positive relation between bank spreads and the lagged
change in the market rate. Conversely, we would expect that deposit spreads are positively
related to current changes in market rates and negatively related to the lagged change in
market rates. Second, if bank rates after a lag adjust fully to changes in market rates then we
would expect the sum of the response to current and lagged changes to equal zero.25
Against this background, we find that bank rates adjust sluggishly for both loans and deposits
and that eventually the pass-through is more complete for lending rates than for deposit rates.
Lending spreads are estimated to decrease by, on average, around 39 basis points following an
increase of 100 basis points in market rates in the same quarter (suggesting that lending rates
increased by only 62 basis points), and to increase by, on average, around 25 basis points in
response to the one-quarter lagged increase of 100 basis point in market rates. This suggests
an almost complete pass-through (86 basis points) two quarters after an increase of market
rates by 100 basis points. Accordingly, as illustrated in Chart 5, the loan spread is almost
equal to its original level after two quarters. Deposit spreads, in contrast, increase by, on
average, 59 basis points following an increase of 100 basis points in market rates in the same
period (suggesting that deposits rates increased by only 41 basis points), but decrease by, on
average, only 17 basis points in response to the lagged increase of 100 basis point in market
rates. The combined impact thus indicates that an increase of market rates by 100 basis point
results in an upwards adjustment of deposit rates after two quarters of only 58%. Accordingly,
as illustrated in Chart 6, the deposit spread remains substantially above its original level after
two quarters.
24 The approach abstracts from yield curve effects as the market rate used to calculate the spread has the same
maturity as the bank retail rate. 25 Our set-up does not allow testing for the extent to which bank rates are passed-through in a complete sense to
their long-run equilibrium. To do this, we would have to apply, for example, a cointegration approach, such as a vector-error-correction model. However, since our focus goes beyond just examining the relationship between the market rate and bank rates, we have chosen to apply a somewhat more flexible approach (controlling for main determinants of spreads), which nevertheless provides some insights into the extent of sluggishness of bank rates.
22ECB Working Paper Series No 714January 2007

Chart 5. Simulated effect on the loan spread from a 100 basis points rise in market rate (x-axis: time, quarterly frequency; y-axis: percent)
Chart 6. Simulated effect on the deposit spread of a 100 basis points rise in market rate (x-axis: time, quarterly frequency; y-axis: percent)
+100Market rate
+62 +24Loan rate
Loan spread
0.00
1.00
2.00
3.00
4.00
5.00
6.00
0 1 2
Market rate
Deposit rate
+41
Deposit spread
+100
+17
0.00
1.00
2.00
3.00
4.00
5.00
6.00
0 1 2
As regards the control variables, we find that changes in banks’ distance-to-default has a
negative effect on bank spreads, which may suggest that as banks’ financial health improves,
they price their retail products more in line with the market. In addition, an increase in the
interest rate risk facing banks, as measured by the change in the standard deviation of the 5-
year government bond yield concerning loan spreads and the change in the standard deviation
of the 3-month money market rate concerning deposit spreads, has a positive effect on bank
spreads. That is, banks facing higher uncertainty with regard to interest rate developments
tend to operate with higher spreads relative to market rates.26 Finally, the slope of the yield
curve, which is derived as the difference between the 5-year government bond yield and the
3-month money market rate, should among other things reflect market expectations to the
economic outlook (e.g. Estrella and Mishkin, 1998). We find that an increase in the slope of
the yield curve has a negative effect on loan spreads, which could be an indication that banks
demand a lower spread on loans as the economic prospects brighten and presumably lead to
lower credit risks.27 Vice versa, a worsening of the credit risk facing banks induces lenders to
demand higher spreads on their loans. By contrast, a steepening of the yield curve seems to be
26 It may be argued that the size of and changes in bank spreads are affected by the general level of interest
rates. We indirectly control for such an effect by including the standard deviation of interest rates (which arguably should be higher in absolute terms when the level of interest rates is high). However, to check the robustness of this assumption, as an alternative specification we included the level of interest rates as a control variable. The results obtained indicate, however, that the level of interest rates is not significant and that all the other coefficient estimates remain basically unchanged. We therefore exclude the level of interest rates in the subsequent regressions.
27 With respect to credit risk we also ran the regressions including more direct measures of credit risk, such as expected default frequencies of non-financial corporations, debt-to-income ratios and loan write-offs. While these indicators usually had the expected sign they were often not significant.
23ECB
Working Paper Series No 714January 2007

related to higher deposit spreads. This may reflect that banks react to improved economic
prospects, by competing more strongly for deposits.28
Table 1 Estimation results: baseline model
PR(t) PR(t-1)Pass-
through PR(t) PR(t-1)Pass-
through
Policy rate loans -0.39 *** 0.25 *** 0.86(0.02) (0.02)
deposits 0.59 *** -0.17 *** 0.58(0.02) (0.02)
nfc loans (st) -0.52 *** 0.23 *** 0.71(0.04) (0.04)
nfc loans (lt) -0.22 *** 0.11 *** 0.89(0.05) (0.04)
consumer credit -0.41 *** 0.35 *** 0.94(0.04) (0.04)
mortgages -0.36 *** 0.26 *** 0.91(0.04) (0.03)
demand deposit 0.81 *** -0.06 * 0.25(0.04) (0.03)
savings deposit 0.86 *** -0.13 *** 0.27(0.04) (0.04)
time deposit (st) 0.50 *** -0.20 *** 0.70(0.04) (0.04)
time deposits (lt) 0.23 *** -0.29 *** 1.06(0.04) (0.03)
Bank loans 0.02 *** -0.05 *** 0.02 *** -0.05 ***soundness (0.01) (0.01) (0.01) (0.01)
deposits -0.04 ** 0.01 *** -0.04 ** 0.01 ***(0.01) (0.01) (0.01) (0.01)
Yield curve slope loans -0.24 * -0.01 *** -0.24 * -0.01 ***(0.02) (0.01) (0.02) (0.01)
deposits 0.11 * 0.01 *** 0.11 * 0.01 ***(0.02) (0.01) (0.02) (0.01)
Interest rate loans 0.23 *** 0.13 *** 0.24 *** 0.12 ***risk (0.07) (0.07) (0.07) (0.06)
deposits 0.10 *** 0.22 * 0.09 *** 0.21 *(0.06) (0.06) (0.06) (0.06)
NWald statisticR-sq (overall)
Model 1 Model 2Country effects Country effects
0.34 0.43
257983.7***
257968.1***
Notes: 1) Models were estimated using fixed-effects across countries. Standard errors in parenthesis. *, **, *** indicates significance at the 10%, 5% and 1% level, respectively. 2) The column "pass-through" reports the share of changes in bank rates after two quarters to the change in the policy rate. One standard result of the pass-through literature is that different bank products may react
differently to changes in the policy rate. Hence, in model 2 we disaggregate the effects of
changes in market rates on bank spreads further and allow for different effects across
individual market segments, not just product categories (see also Table 1 above). The results
indicate that there are considerable differences depending on the loan or deposit segment, as
28 It is clear that these interpretations have to be taken with great caution, as we are estimating a reduced form
model and, hence cannot distinguish between demand and supply effects. The interpretation given suggests that supply (bank) factors dominate, which is only sensible if banks have at least some degree of market power.
24ECB Working Paper Series No 714January 2007

well as between the total effect of pass-through after two quarters and the immediate and
lagged responses. For loans, we find a more or less complete pass-through after two quarters
for basically all loans, although the rates on loans to non-financial corporations up to one year
seem to be somewhat more sluggish adjusting to only around 71% of the change in the market
rate after six months. At the same time, there are significant differences in the immediate
impact after one quarter. For example, short-term loans to NFC adjust only by around 50%
after three months and consumer credit by 59%, while the immediate impact is between 65%
to 80% for mortgages and long-term loans to NFC.
The pass-through is generally more sluggish and less complete for deposit rates, although the
differences across product groups are even more striking than for loans. For overnight
deposits and savings deposits the pass-through amounts to only around 25% to 30% even after
six months. The pass-through after one quarter is less than 20% for these products, which in
line with anecdotal evidence is likely to reflect a highly non-competitive market, the existence
of non-interest adjustments (e.g. in case of checking accounts changes in fees), or rather
unsophisticated customers. For both short-term and long-term time deposits the pass-through
is considerably quicker amounting to some 70% for short term time deposits and 100% for
long-term time deposits. The control variables retain the sign and econometric significance of
the earlier specification.
6. EXTENSIONS We carried out two types of extensions of the baseline model. First, we explore whether the
pass-through is asymmetric, using equation (2b), by distinguishing periods of policy rate
increases and decreases. Second, we test for the importance of various differences in the
structure of financial markets across countries using equation (2c). We test in particular for
the effect of competition, both within the banking market as well as from financial markets,
and for the effect of some aspects of financial innovation. We split the structural indicators
into “high” and “low” according to the time-specific median across countries. We have used
this approach rather than using a constant cross-sectional median over the full sample in order
to avoid splitting the data into fixed group of countries and to capture any structural changes
over time.29
29 The significance and magnitude of the control variables in these two types of extensions remain similar to
those of the baseline models 1 and 2, and are therefore not discussed further.
25ECB
Working Paper Series No 714January 2007

6.1 Asymmetric pass-through In order to investigate whether the pass-through is asymmetric we estimate equation (2b)
where we allow for different slopes when market rates are increasing and when they are
decreasing.30 Pass-through to retail rates could be asymmetric if either the price elasticity of
demand is low or if competition is less than perfect. In both cases banks would adjust loan
rates quicker when interest rates are increasing than when they are decreasing – and vice
versa for deposit rates. The results obtained indicate that there is some evidence of asymmetry
in the pass-through. In the more parsimonious model 3 (i.e. only distinguishing broadly
between loans and deposits), we find that loan rates tend to adjust quicker to changes in
market rates when the latter is moving upwards than when it is moving downwards (see Table
2). Although, statistically, we can not reject coefficient equality31, economically the difference
amounts to 3 points after one quarter and 10 points after two quarters. Conversely, deposit
rates tend to adjust more completely after two quarters when interest rates are declining,
which is in accordance with the findings of Hannan and Berger (1991). The differences are
somewhat larger than in the case of loan rates and statistically significant.
30 Over the sample period, the 3-month money market rate (PRt) decreased in around 60% of the total number of
quarters. 31 According to standard Wald tests of coefficient equality.
26ECB Working Paper Series No 714January 2007

Table 2. Estimation results: asymmetric model
PR(t) PR(t-1)Pass-
through PR(t) PR(t-1)Pass-
through
loans up -0.37 *** 0.29 *** 0.92(0.05) (0.04)
down -0.40 *** 0.22 *** 0.82(0.03) (0.03)
deposits up 0.64 *** -0.12 *** 0.48(0.04) (0.03)
down 0.56 *** -0.20 *** 0.64(0.03) (0.03)
nfc loans (st) up -0.58 *** 0.26 *** 0.68(0.07) (0.06)
down -0.49 *** 0.20 *** 0.71(0.05) (0.04)
nfc loans (lt) up -0.17 ** 0.12 * 0.95(0.08) (0.08)
down -0.26 *** 0.10 ** 0.85(0.05) (0.05)
consumer credit up -0.41 *** 0.41 *** 1.00(0.08) (0.06)
down -0.41 *** 0.31 *** 0.90(0.05) (0.05)
mortgages up -0.27 *** 0.28 *** 1.02(0.07) (0.06)
down -0.40 *** 0.25 *** 0.85(0.05) (0.04)
demand deposit up 0.82 *** 0.12 *** 0.06(0.07) (0.06)
down 0.81 *** -0.15 *** 0.35(0.05) (0.04)
savings deposit up 0.99 *** -0.11 ** 0.12(0.08) (0.07)
down 0.80 *** -0.15 *** 0.35(0.05) (0.05)
time deposit (st) up 0.62 *** -0.18 * 0.56(0.07) (0.06)
down 0.44 *** -0.21 *** 0.77(0.05) (0.05)
time deposits (lt) up 0.20 *** -0.34 *** 1.14(0.07) (0.06)
down 0.24 *** -0.27 *** 1.03(0.05) (0.04)
NWald statisticR-sq. (overall)
Model 3Asymmetry
0.35 0.4444.5***
Model 4Asymmetry
2579257967.6***
1) Models were estimated using fixed-effects across countries. Standard errors in parenthesis. *, **, *** indicates significance at the 10%, 5% and 1% level, respectively. 2) The column "pass-through" reports the share of changes in bank rates after two quarters to the change in the policy rate.
Broadly the same results are observed when we allow for product-specific effects (model 4).
With respect to loans we find asymmetric effects of economic importance, although statistical
significance is only found in the case of mortgage loans. Notably, the difference in speed of
27ECB
Working Paper Series No 714January 2007

adjustment is more pronounced for long-term loans compared to short term loans. In
particular, the immediate impact on loan rates is relatively strongest when interest rates are
increasing with regard to long-term loans to enterprises and loans to households for both
house purchase and for consumption, while there is no noticeable difference for short term
loans to NFC.32 The asymmetry is even stronger, and statistically more significant, for some
deposit rates. For example, after three months, a downward change in interest rates results in a
20 points pass-through for savings deposits, but an upward change is virtually not passed on
(1 point pass-through); even after six months the pass-through to savings rates is only 12
points in case of upward changes, as compared to 35 points pass-through for downward
changes. There are also large differences for short-term time deposits, while interest rate
changes are essentially symmetrically passed through in the case of long-term time deposits.
6.2 Competition and pass-through To examine the effect of competition on the dynamics of the bank spreads, we focused first
on competition between banks, and then on the effect of competition coming from financial
markets.
(i) Competition within the banking market. A main structural feature of the banking system
that potentially exerts an impact on the spreads is the degree of competition in the banking
system. We use the Panzar-Rosse H-statistic of market power using a composite H-statistics
derived as an average of estimated H-statistics for the euro area countries by various recent
studies: Carbo et al. (2005), Bikker (2004), and Claessens and Laeven (2003).33 While the
adjustment of spreads for the overall loan and deposit categories (model 5) does not differ
markedly when the degree of competition (i.e. bank market power) is high or low, we do find,
when allowing for product-specific slopes (model 6), that a higher degree of competition (i.e.
lower bank market power) results in a faster and ultimately more complete pass-through for
most loan categories (see Table 3). For example, for short-term loans in more competitive
banking markets the pass-through after three months is 56%, in less competitive markets only
43%. After six months it is 76% in competitive markets and 67% in less competitive markets,
although in this case the statistical test does not enable to reject that the coefficients are equal
(see Table 3a). Overall, while the ultimate pass-through does not differ very much, the
greatest differences are observed in the pass-through after one quarter, implying that
32 We unfortunately cannot distinguish between loans to large versus small NFCs; however, the finding that the
asymmetry is more pronounced for long-term loans compared to short-term loans is consistent with the notion that very large firms do not use much long-term financing from banks, but issue bonds instead. Hence, the market for long-term loans may be characterised by a lower price elasticity of demand compared to the market for short-term loans, in which we would expect both large and small firms to be active.
33 The results were qualitatively similar when using only the Carbo et al. (2005) study.
28ECB Working Paper Series No 714January 2007

competition in the banking system primarily affects the speed of pass-through in the short run.
This is also reflected in the Wald tests of coefficient equality (Table 3a), which generally
indicate that the immediate impact is statistically significantly stronger in more competitive
banking sectors. In the subsequent quarter the less competitive countries “catch up” resulting
in only minor (and statistically insignificant) differences in the overall long-run pass-through
(column three, Table 3a). For deposit rates, the results tend to suggest that the difference
between competitive banking markets and less competitive banking markets is small; we do,
however, find a statistically significant effect in the case of long term time deposits, where the
degree of pass-through differs by 16 points after one quarter, although after two quarters, the
pass-through is complete both in competitive and less competitive markets.34
34 We also considered alternative measures of concentration, such as the Herfindahl Hirschmann index or the
market share of the three largest banks, but the results, while being broadly consistent with the efficiency hypothesis, were not as strong as for the H-statistic. Moreover, we examined the importance of country size (measured by the size of the population). The results suggest that pass-through to lending rates tends to be somewhat higher in smaller countries than in larger countries. While the difference is small, it may reflect a generally higher contestability of the banking markets in smaller countries. At the same time, these result may also suggest, as argued by Berlin and Mester (1999), that a stable pool of core deposits (in larger countries) allows banks to smooth lending rates over the interest rate cycle.
29ECB
Working Paper Series No 714January 2007

Table 3. Estimation results: Financial structure model – banking competition (H-statistic)
PR(t) PR(t-1)Pass-
through PR(t) PR(t-1)Pass-
through
loans high -0.33 *** 0.22 *** 0.89(0.04) (0.03)
low -0.42 *** 0.26 *** 0.85(0.03) (0.03)
deposits high 0.56 *** -0.15 *** 0.59(0.04) (0.03)
low 0.61 *** -0.19 *** 0.58(0.03) (0.03)
nfc loans (st) high -0.44 *** 0.21 *** 0.76(0.06) (0.05)
low -0.57 *** 0.24 *** 0.67(0.05) (0.05)
nfc loans (lt) high -0.06 * -0.11 * 0.83(0.12) (0.12)
low -0.25 *** 0.15 *** 0.90(0.05) (0.05)
consumer credit high -0.32 *** 0.27 *** 0.95(0.06) (0.06)
low -0.48 *** 0.42 *** 0.94(0.05) (0.05)
mortgages high -0.30 *** 0.27 *** 0.97(0.06) (0.05)
low -0.39 *** 0.26 *** 0.87(0.05) (0.05)
demand deposit high 0.91 *** -0.13 ** 0.22(0.06) (0.05)
low 0.74 *** 0.00 * 0.26(0.05) (0.05)
savings deposit high 0.85 *** -0.05 * 0.20(0.09) (0.09)
low 0.87 *** -0.15 *** 0.29(0.05) (0.05)
time deposit (st) high 0.52 *** -0.18 *** 0.66(0.06) (0.05)
low 0.49 *** -0.23 *** 0.74(0.06) (0.06)
time deposits (lt) high 0.14 *** -0.18 ** 1.04(0.06) (0.05)
low 0.30 *** -0.37 *** 1.07(0.05) (0.05)
NWald statisticR-sq. (overall)
H-statistic of market power
0.35 0.44
257967.3***
257944.3***
Model 5 Model 6H-statistic of market power
1) Models were estimated using fixed-effects across countries. Standard errors in parenthesis. *, **, *** indicates significance at the 10%, 5% and 1% level, respectively. 2) The column "pass-through" reports the share of changes in bank rates after two quarters to the change in the policy rate.
30ECB Working Paper Series No 714January 2007

Table 3a. Wald tests of coefficient equality: Financial structure model – banking competition (H-statistic)
PR(t) PR(t-1) Sum
Loans 3.59 * 0.92 0.84Deposits 1.02 0.89 0.01Short-term loans to NFC 2.79 * 0.27 1.25Long-term loans to NFC 2.07 4.18 ** 0.2Consumer credit 3.84 ** 4.07 ** 0Mortgage loans 1.81 0.01 1.84Demand deposits 5.46 ** 3.61 * 0.26Savings deposits 0.04 1.22 0.71Short-term time deposits 0.14 0.48 1.08Long-term time deposits 4.54 ** 6.99 *** 0.13
Ho: high=low
Note: The table reports the F-statistic; *, **, *** indicates significance at the 10%, 5% and 1% level, respectively.
(ii) Competition from financial markets. As a starting point, we use in model 7 the market
capitalisation of the stock market (in relation to GDP) as a proxy for the overall size of the
financial markets. We expect that a larger size of the financial market would induce a more
complete and rapid pass-through as a result of stronger competition from alternative products
in particular to corporate bank loans (see Table 4). Indeed, we find that bank lending rates
adjust quicker and more completely in countries where stock markets are relatively important,
although the statistical hypothesis of coefficient equality can not be rejected (see Table 4a).
As may be expected, the capitalisation of the stock market has no impact on the speed of pass-
through to deposit rates.
31ECB
Working Paper Series No 714January 2007

Table 4. Estimation results: Financial structure model – stock market capitalisation and non-bank substitutes
PR(t) PR(t-1)Pass-
through PR(t) PR(t-1)Pass-
through
loans high -0.35 *** 0.24 *** 0.88(0.03) (0.03)
low -0.41 *** 0.25 *** 0.84(0.03) (0.03)
deposits high 0.61 *** -0.17 *** 0.56(0.03) (0.03)
low 0.57 *** -0.18 *** 0.60(0.03) (0.03)
nfc loans (st) high -0.51 *** 0.23 *** 0.72(0.05) (0.05)
low -0.53 *** 0.22 *** 0.70(0.05) (0.05)
nfc loans (lt) high -0.12 ** 0.14 ** 1.02(0.06) (0.06)
low -0.33 *** 0.12 * 0.79(0.06) (0.06)
consumer credit high -0.50 *** 0.33 *** 0.84(0.06) (0.06)
low -0.36 *** 0.36 *** 1.00(0.05) (0.05)
mortgages high -0.21 *** 0.20 *** 0.99(0.06) (0.05)
low -0.47 *** 0.32 *** 0.86(0.05) (0.04)
demand deposit high 0.80 *** -0.02 * 0.22(0.05) (0.05)
low 0.81 *** -0.09 ** 0.29(0.05) (0.05)
savings deposit high 0.87 *** -0.16 *** 0.29(0.05) (0.05)
low 0.84 *** -0.09 ** 0.25(0.07) (0.06)
time deposit (st) high 0.50 *** -0.29 *** 0.79(0.07) (0.06)
low 0.51 *** -0.15 *** 0.64(0.05) (0.05)
time deposits (lt) high 0.30 *** -0.37 *** 1.07(0.05) (0.05)
low 0.16 *** -0.21 *** 1.05(0.05) (0.05)
NWald statisticR-sq. (overall)
Non-bank substitutes
0.35 0.44
257967.1***
257944.5***
Model 7 Model 8Stock market capitalisation
1) Models were estimated using fixed-effects across countries. Standard errors in parenthesis. *, **, *** indicates significance at the 10%, 5% and 1% level, respectively. 2) The column "pass-through" reports the share of changes in bank rates after two quarters to the change in the policy rate.
32ECB Working Paper Series No 714January 2007

Table 4a. Wald tests of coefficient equality: Financial structure model – stock market capitalisation and non-bank substitutes
PR(t) PR(t-1) Sum PR(t) PR(t-1) Sum
Loans 1.72 0.19 0.73Deposits 0.66 0.06 0.99Short-term loans to NFC 0.08 0.01 0.12Long-term loans to NFC 5.87 ** 0.03 6.34 **Mortgage loans 12.58 *** 2.98 * 3.15 *Short-term time deposits 0.01 3.31 * 3.69 *Long-term time deposits 3.41 * 5.33 ** 0.12
Stock market capitalisation Non-bank substitutesHo: high=low Ho: high=low
Note: The table reports the F-statistic; *, **, *** indicates significance at the 10%, 5% and 1% level, respectively.
In order to analyse the effect of competition coming from financial markets in more detail, we
distinguish in model 8 the various bank product segments and use three more specific
measures of non-bank substitutes that may speed up the pass-through process. First, as an
alternative means for non-financial corporations to obtain debt financing, we use the
outstanding amounts of debt securities issued by non-financial corporations to GDP. Second,
with respect to loans to households we use the amount of non-bank loans to the household
sector. Third, we use the importance of mutual funds (as a percentage to GDP) as a savings
instrument offering an alternative to deposits.
The results indicate that lending spreads on long-term loans to non-financial corporations
react quicker and more completely to changes in market rates when the corporate bond market
is relatively important (see Table 4). Likewise, lending rates on mortgage loans display a
speedier pass-through when competition from non-bank lending is comparatively strong
(complete pass-through after six months in countries where non-bank loans are relatively
important against only 86% in the other group of countries). There is no such effect on the
pass-through of consumer credit rates, which however may reflect that non-bank loans to
households are primarily used to finance real estate. On the deposit side, the relative
importance of mutual funds holdings seem mainly to impact on the pass-through of short-term
time deposit rates (e.g. 79% after six months in the “high” group of countries against 64% in
countries where this type of savings instruments is less important).
33ECB
Working Paper Series No 714January 2007
6.3. Financial innovation and pass-through
Financial innovation and developments in bank activities towards more market-oriented
instruments, such as securitisation and derivatives, may potentially alter the pricing
mechanisms related to traditional bank loans and deposits. We would expect ceteris paribus
that banks are more exposed, and hence tend to react more swiftly, to movements in market
interest rates in countries where securitisation techniques and derivatives business are well-
developed.
We therefore examined the importance of the various financial innovation indicators, and the
estimation results tended to indicate that much of the impact of financial innovation is
transmitted through risk management considerations. This is, for example, examined in model
9 using as a proxy the ratio of interest rate derivatives turnover to GDP. Interest derivatives
are particularly important as a hedging device for long-term loans, but arguably should not
have much of an impact on the pass-through to short-term loans or deposits. The rates on
long-term loans to non-financial corporations and mortgages tend to adjust quicker and more
completely in countries where derivatives turnover is relatively high (see Table 5). Thus, the
pass-through to long-term loans to non-financial corporations is 35% higher and pass-through
to mortgages is around 20 points higher if there is easy access to hedge against interest rate
risk using derivatives. Differences in the coefficients are also statistically significant (see
Table 5a). For consumer credit and short-term loans to non-financial corporations, on the
other hand, we do not observe significant differences in the speed of pass-through.35
The potential impact of financial innovation transmitted through a greater completeness of the
financial system is examined in model 10 with respect to the size of securitisation as a
percentage to GDP. A very large share of all securitisation transactions in the euro area
involves mortgages. The securitisation of other loans or other types of assets by private banks
or non-financial firms, while still relatively underdeveloped in the euro area, has been
increasing fast over the past few years. Our estimation results indicate that in countries where
securitisation is relatively widespread, the pass-through of market rates to long-term rates on
loans to NFCs is around 15 basis points higher than in the other countries. The pass-through
of market rates to mortgage rates is around 10 basis points higher (although coefficient
equality can not be rejected) The larger impact for loans to NFCs, although somewhat
surprising, may reflect that a large part of the MBS transactions are secured on commercial
property (CMBS) rather than on residential property (RMBS).
35 In addition, the long-term deposit rate pass-through is unaffected by the ability to hedge. This suggests that in
this case, the depositors who do not have access to derivative markets bear the interest rate risk.
34ECB Working Paper Series No 714January 2007

Finally, a further feature of the breadth of the financial system and which could potentially
affect banks’ price-setting behaviour is the importance of venture capital.36 We expect venture
capital to have a strong effect on the speed of pass-through to long-term loans to NFC, as
venture capital and long-term loans may to some extent be substitutes. Other bank product
categories should not be affected. This is what we find in model 11, where we compare the
pass-through between countries with respectively a relatively high and low developed venture
capital market. No systematic effects of the development of venture capital markets can be
detected, but the pass-through to retail rates on long-term loans to NFCs is significantly sped
up in particular in the first quarter by around 25 points.
Table 5. Estimation results: Financial structure model – financial innovation indicators 1) Models were estimated using fixed-effects across countries. Standard errors in parenthesis. *, **, *** indicates significance at the 10%, 5% and 1% level, respectively. 2) The column "pass-through" reports the share of changes in bank rates after two quarters to the change in the policy rate.
Table 5a. Wald tests of coefficient equality: Financial structure model – financial innovation indicators
PR(t) PR(t-1) Sum PR(t) PR(t-1) Sum PR(t) PR(t-1) Sum
Long-term loans to NFC 7.56 *** 0.02 6.66 *** 0 2.76 * 2.48 6.32 ** 1.07 2.4Mortgage loans 9.52 *** 0.7 4.64 ** 1.59 0 1.32
Venture capitalHo: high=low
Interest rate derivatives SecuritisationHo: high=low Ho: high=low
Note: The table reports the F-statistic; *, **, *** indicates significance at the 10%, 5% and 1% level, respectively.
36 Although venture capital only constitutes a small portion of euro area capital markets, it represents an
important alternative source of financing for small and medium–sized, in particularly start-ups, companies with exceptional growth potential.
PR(t) PR(t-1)Pass-
through PR(t) PR(t-1)Pass-
through PR(t) PR(t-1)Pass-
through
nfc loans (st) high -0.52 *** 0.13 *** 0.62 -0.57 *** 0.22 *** 0.65 -0.52 *** 0.09 * 0.57(0.06) (0.06) (0.06) (0.06) (0.06) (0.06)
low -0.52 ** 0.29 *** 0.76 -0.46 *** 0.23 *** 0.77 -0.53 *** 0.30 *** 0.77(0.05) (0.05) (0.06) (0.05) (0.05) (0.05)
nfc loans (lt) high -0.10 * 0.13 ** 1.03 -0.22 *** 0.19 *** 0.97 -0.13 ** 0.09 * 0.96(0.06) (0.06) (0.07) (0.06) (0.06) (0.06)
low -0.36 *** 0.14 ** 0.78 -0.22 *** 0.04 * 0.82 -0.38 *** 0.19 ** 0.81(0.07) (0.07) (0.07) (0.06) (0.08) (0.08)
consumer high -0.41 *** 0.31 *** 0.90 -0.60 *** 0.51 *** 0.91 -0.42 *** 0.31 *** 0.89credit (0.06) (0.06) (0.06) (0.06) (0.06) (0.06)
low -0.42 *** 0.39 *** 0.97 -0.25 *** 0.23 *** 0.97 -0.40 *** 0.39 *** 0.99(0.06) (0.06) (0.06) (0.05) (0.06) (0.06)
mortgages high -0.22 *** 0.24 *** 1.02 -0.30 *** 0.26 *** 0.96 -0.28 *** 0.20 *** 0.92(0.06) (0.06) (0.06) (0.06) (0.06) (0.06)
low -0.46 *** 0.30 *** 0.84 -0.40 *** 0.27 *** 0.87 -0.42 *** 0.32 *** 0.90(0.05) (0.05) (0.05) (0.05) (0.05) (0.05)
NWald statisticR-sq. (overall)
Model 11Venture capital
257947.4***
Model 9Interest rate derivatives
257947.9***
Model 10Securitisation
0.36 0.36 0.36
257947.6***
35ECB
Working Paper Series No 714January 2007

7. ROBUSTNESS CHECKS
We undertook a number of robustness checks of our baseline model to ensure the consistency
of our results across a variety of model specifications (see Annex 3). We ran the regressions
using fixed effects across countries plus product dummies for broad markets (model R1) and
for individual product segments (model R2), a two-way random effects model (model R3),
and separately for loans and deposits using a seemingly unrelated regression model with
country dummies (model R4). The results obtained with these alternative specifications were
essentially the same as with the results obtained with our baseline models 1 and 2.
8. CONCLUSION This paper has investigated the dynamics of the pass-through between market interest rates
and bank interest rates in the euro area controlling for cyclical and structural differences in the
financial system. The analysis of this process provides a main contribution to a better
understanding of the effectiveness of monetary policy.
In accordance with previous empirical literature, we find that euro area banks only sluggishly
adjust their rates on loans and deposits in response to changes in market interest rates. We
also find substantial differences in the pass-through process across various bank products; in
particular, rates on demand deposits and on savings deposits display a high degree of rigidity.
Unlike most of the empirical literature, these results are obtained by controlling for bank
soundness, interest rate risk, and the slope of the yield curve, the latter being an indication of
the presence of credit risk premia in loan spreads. Our results further provide evidence of
asymmetry in the pass-through process, as banks tend to adjust loan rates quicker to changes
in policy rates when rates are going up than when they are going down – and vice versa for
deposit rates. This finding suggests, in line with the theoretical literature, that banks hold
some degree of pricing power in the markets for loans and deposits. To explore this in more
detail, we directly estimate the effect of various elements of competition facing banks on their
interest-rate setting behaviour. As expected, we find that competition from other banks and
competition from non-banks (including financial markets) tend to speed up the adjustment of
bank rates to changes in policy rates. Finally, we use our empirical model to provide some
first tentative evidence that recent financial innovations-by extending the set of financial
instruments available to banks and their customers-have strengthened the bank interest rate
pass-through.
36ECB Working Paper Series No 714January 2007

In terms of monetary policy implications these findings point to the beneficial effects on the
bank interest rate pass-through process, and hence on the monetary policy transmission
mechanism, from deeper and more competitive financial systems. Efforts to strengthen bank
competition and enhancing the availability of alternative capital market-based instruments for
financial investment, access to financing (e.g. for start-ups and other types of small and
medium enterprises) and risk management should therefore be expected to improve and
amplify the effects of monetary policy changes on bank interest rates.
37ECB
Working Paper Series No 714January 2007

REFERENCES
Affinito, M. and Farabullini, F. (2006), “An empirical analysis of national differences in the
retail bank interest rates of the euro area”, Banca d’Italia Temi di Discussione, No. 589, May.
Allen, L. (1988), “The determinants of bank interest margins: A note”, The Journal of Quantitative Analysis, Vol. 23, No. 2 (June).
Allen, F., Carletti, E. and Marquez, R. (2005), “Bank competition and the role of regulation”, Mimeo.
Angbazo, L. (1997), “Commercial bank net interest margins, default risk, interest-rate risk, and off-balance sheet banking”, Journal of Banking and Finance, 21, 55-87.
Ausubel, L.M. (1991), “The failure of competition in the credit card market”, American Economic Review, March 81, 50-81.
Baltensperger, E. (1980), ”Alternative approaches to the theory of the banking firm”, in M.K. Lewis (ed.), Financial Intermediaries, Elgar Reference Collection, London UK.
Banca d’Italia (2003), “The harmonisation of European Statistics on bank interest rates and the methodology adopted by Italy”, Supplements to the Statistical Bulletin: methodological notes and statistical information, Year XIII No. 57 (October).
Banco de Espana (2003a), “La estructura de tipos de interes en los prestamos hipotecarios sobre vivienda”, Economic Bulletin (July-August).
Banco de Espana (2003b), “La nueva estadistica sobre los tipos de interes que aplican las instituciones financieras monetarias a las sociedades y a los hogares”, Economic Bulletin (December).
Banco de Espana (2003c), “A comparison between bank rates in Spain and in the euro area”, Economic Bulletin (April).
Banque de France (1996), “Résultats 1994 et estimations 1995 de l’enquête sur la structure par taux de reference des bilans bancaires”, Monthly Digest (supplement “etudes”, second quarter).
Banque de France (1997), “Les credits au logement consentis aux ménages au premier semestre 1997”, Monthly Digest (October).
Banque de France (2004), “Les credits immobiliers consentis aux ménages en 2003”, Monthly Digest (June).
Baugnet, V. and Hradisky, M. (2004), “Determinants of Belgian bank lending rates”, Banque Nationale de Belgique.
38ECB Working Paper Series No 714January 2007

Berger, A.N. (1995), “The profit structure relationship in banking: Tests of market-power and efficient-structure hypotheses”, Journal of Money, Credit, and Banking, Vol. 27, No. 2 (May), 404-431.
Berger, A.N., Demirguc-Kunt, A., Levine, R. and Haubrich, J.G. (2004), “Bank concentration and competition: An evolution in the making”, Journal of Money, Credit, and Banking, Vol. 36, No. 3 (June, Part 2), 433-451.
Berger, A.N. and Udell, G.F. (1992), “Some evidence on the empirical significance of credit rationing”, The Journal of Political Economy, Vol. 100, No. 5 (October), 1047-1077.
Berlin, M. and Mester, L.J. (1999), “Deposits and relationship lending”, The Review of Financial Studies, Fall 1999, Vol. 12, No. 3, 579-607.
Besanko, D. and Thakor, A.V. (1987a), “Collateral and rationing: sorting equilibria in monopolistic and competitive credit markets”, International Economic Review, Vol. 28 (October), 671-689.
Besanko, D. and Thakor, A.V. (1987b), “Competitive equilibrium in the credit markets with imperfect information”, Journal of Economic Theory, Vol. 42 (June), 167-182.
Bikker, J.A. (2004), Competition and Efficiency in a Unified European Banking Market, Edvard Elgar Publishing.
BIS (2004), “Triennial Central Bank Survey 2004”.
Blinder, A.S. and Stiglitz, J.E. (1983), “Money, credit constraints, and economic activity”, American Economic Review Papers and Proceedings, Vol. 73 (May), 297-302.
Bondt, G. de (2002), “Retail interest rate pass-through: New evidence at the euro area level”, ECB Working Paper No. 136.
Bondt, G. de (2005), “interest rate pass-through: Empirical results for the euro area”, German Economic Review, Vol 6, No. 1 (February), 37-78.
Borio, E. and Fritz, W. (1995), “The response of short-term bank lending rates to policy rates: a cross-country perspective”, BIS Working Paper No. 27, May.
Brock, P.L. and Franken, H. (2003), “Measuring the determinants of average and marginal bank interest rate spreads in Chile, 1994-2001”, unpublished Working Paper.
Brock, P.L. and Rojas Suarez, L. (2000), “Understanding the behaviour of bank spreads in Latin America”, Journal of Development Economics, Vol. 63, 113-134.
Carbo, S., Humphrey, D., Maudos, J. and Molineux, P. (2005), “Cross-country comparisons of competition and pricing power in European banking”, mimeo.
Central Bank and Financial Services Authority of Ireland (2003), “Irish retail interest rates in a euro area perspective”, Quarterly Bulletin (Winter).
39ECB
Working Paper Series No 714January 2007

Chiappori, P.A., Perez-Castrillo, D. and Verdier, T. (1995), “Spatial competition in the banking system: Localisation, cross-subsidisation and the regulation of deposit insurance”, European Economic Review, Vol. 39(5), 889-918.
Claessens, S. and Laeven, L. (2003), “What drives bank competition? Some international evidence”, Mimeo.
Claeys, S. and Vander Vennet, R. (2003), ”Determinants of bank interest margins in Central and Eastern Europe: Convergence to the West?”, Universiteit Gent Working Paper No. 2003/203.
Corvoisier, S. and Gropp, R. (2002) “Bank concentration and retail interest rates” Journal of Banking and Finance 26, pp. 2155-2189.
Corvoisier, S. and Gropp, R. (2006) “Contestability, technology and banking” ECB Working Paper series (forthcoming).
Cottarelli, C., Ferri, G. and Generale, A. (1995), “Bank lending rates and financial structure in Italy: A case study”, IMF Working Paper No. 38 (April).
De Graeve, F., De Jonghe, O. and Vander Vennet, R. (2004), “The determinants of pass-through of market conditions to bank retail interest rates in Belgium”, mimeo.
De Nederlandsche Bank (2003), “Nieuwe bancaire rentestatistiek”, Statistical Bulletin (December).
De Nederlandsche Bank (2004), “Nederlandse bancaire rentetarieven in het eurogebiet”, Statistical Bulletin (December).
Dermine, J. (1986), “Deposit rates, credit rates and bank capital: the Klein-Monti model revisited”, Journal of Banking and Finance 10, pp. 99-114.
Deutsche Bundesbank (1997), “Bank interest rates – Reorganisation of the interest rate statistics”, Monthly Report (February), pp.25-32.
Deutsche Bundesbank (2004a), “Die neue EWU-Zinsstatistik – Methodik zur Erhebung des deutschen Beitrags”, Monthly Report (January).
Deutsche Bundesbank (2004b), “Kreditzinsen in der EWU und in Deutschland”, Monthly Report (February).
Doliente, J.S. (2003), “Determinants of bank net interest margin of Southeast Asia”, Mimeo.
Elsas, R. and Krahnen, J.P. (1998), “Is relationship lending special? Evidence from credit-file data in Germany”, Journal of Banking and Finance 22, 1283-1316.
Estrella, A. and Mishkin, F.S. (1998), “Predicting U.S. recessions: Financial variables as leading indicators”, The Review of Economics and Statistics 80 (1), 45-61.
40ECB Working Paper Series No 714January 2007
European Central Bank (2000), “EU Banks’ margins and credit standards”, Banking Supervision Committee.
European Central Bank (2002), Report on Financial Structures, December.
European Central Bank (2004), “Analysing MFI interest rates at the euro area level”, Monthly Bulletin, August, 28-30.
European Central Bank (2005), “The use of harmonised MFI interest rate statistics”, Monthly Bulletin, July, 85-92.
European Central Bank (2006), “Differences in MFI interest rates across euro area countries”, September.
Flannery, M. and Rangan, K. (2004) “What caused the bank capital build-up of the 1990s?” FDIC Center for Financial Research Working Paper No. 2004-03.
Freixas, X. and Rochet, J-C. (1997), Microeconomics of Banking, The MIT Press, Cambridge, Massachusetts.
Gambacorta, L. (2004), “How do banks set their interest rates?”, NBER Working Paper No. 10295.
González-Páramo, J. M. (2006), “Some observations on the measurement of economic phenomena, with special reference to the System of National Accounts”, Speech at the official dinner of the fourth meeting of the Advisory Expert Group on National Accounts, 2 February (available at www.ecb.int).
Gropp, R. (2004) “Bank Market Discipline and Indicators of Banking System Risk: The European Evidence” in: Market discipline across countries and sectors (C. Borio et al., eds.) MIT Press.
Gropp, R., Vesala, J. and Vulpes, G. (2006) “Equity and bond market signals as leading indicators of bank fragility” Journal of Money, Credit and Banking 38 (2).
Hannan, T.H. and Berger, A.N. (1991), “The rigidity of prices: Evidence from the banking industry”, American Economic Review, Vol. 81, No. 4 (September), 938-945.
Hanweck, G. and Rye, L. (2004), “The sensitivity of bank net interest margins to credit, interest rate and term structure shocks”, unpublished working paper.
Ho, T. and Saunders, A. (1981), “The determinants of bank interest margins: theory and empirical evidence”, Journal of Financial and Quantitative Analyses, 16, 581-600.
Hofmann, B. and Mizen, P. (2004), “Interest Rate Pass-Through and Monetary Transmission: Evidence from Individual Financial Institutions' Retail Rates”, Economica, vol. 71.
Hutchison, D. E. (1995), "Retail Bank Deposit Pricing: An Intertemporal Asset Pricing Approach", Journal of Money, Credit and Banking, Vol. 27, No.1 (February).
41ECB
Working Paper Series No 714January 2007

Jaffee, D.M. and Russell, T. (1976), “Imperfect information, uncertainty, and credit rationing”, Quarterly Journal of Economics, Vol. 90 (November), 651-666.
Kiser, E.K. (2003), “Modeling the whole firm: the effect of multiple inputs and financial intermediation on bank deposit rates”, Mimeo.
Klein, M. (1971), “A theory of the banking firm”, Journal of Money, Credit, and Banking, Vol. 3, 205-218.
Kok Sørensen, C. and Werner, T. (2006), ”Bank interest rate pass-through in the euro area: A cross-country comparison”, ECB Working Paper No. 580.
Lichtenberger, J. (2001), ”The economic and financial importance of mortgage bonds”in: Mortgage banks and the mortgage bond in Europe, European Mortgage Federation, Nomos Verlagsgesellschaft (Baden-Baden), 3rd edition.
Maudos, J. and Fernández de Guevara, J. (2004), “Factors explaining the interest margin in the banking sectors of the European Union”, Journal of Banking and Finance, 28, 2259-2281.
McShane, R.W. and Sharpe, I.G. (1985), “A time series/cross-section analysis of the determinants of Australian trading bank loan/deposit interest margins: 1962-1981”, Journal of Banking and Finance, 9, 115-136.
Mester, L.J. and Saunders, A. (1995), “When does the prime rate change?”, Journal of Banking and Finance, Vol. 19, No. 5 (August), 743-764.
Mitchell, D.W. (1988), “Explicit interest and demand deposit service charges: Comment”, Journal of Money, Credit and Banking, Vol. 20, No. 2, 270-274.
Mojon, B. (2001), “Financial structure and the interest rate channel of monetary policy”, Economie et Prevision No. 147, 1, pp 89-115.
Monti, M. (1972), “Deposit, credit, and interest rate determination under alternative bank objectives” in Mathematical Methods in Investment and Finance G.P. Szego and K. Shell (eds.), Amsterdam: North-Holland.
Northcott, C.A. (2004), “Competition in banking: A review of the literature”, Bank of Canada Working Paper, No.2004-24.
Österreichische Nationalbank (2003), “Eine neue harmonisierte Zinssatzstatistik für den Euroraum – Konzept, Umsetzung in Österreich und erste Ergebnisse”, Berichte und Studien (fourth quarter).
Prisman E., M. Slovin and Sushka, M. (1986), “A general model of the banking firm under conditions of monopoly, uncertainty and recourse,” Journal of Monetary Economics, 17, 293-304.
42ECB Working Paper Series No 714January 2007
Rosen, R.J. (2002), “What Goes Up Must Come Down? Asymmetries and Persistence in Bank Deposit Rates”, Journal of Financial Services Research 21:3, 173-193.
Sander, H. and Kleimeier, S. (2004), „Convergence in Euro Zone retail banking?”, LIFE Working Paper 04-005.
Santomero, A.M. (1984), “Modeling the banking firm: a survey”, Journal of Money, Credit, and Banking, Vol. 16 No. 4 (Part 2, September), 576-602.
Saunders, A. and Schumacher, L. (2000), “The determinants of bank interest rate margins: an international study”, Journal of International Money and Finance, Vol. 19, 813-832.
Schwarzbauer, W. (2006), “Financial structure and its impact on the convergence of interest rate pass-through in Europe: A time-varying interest rate pass-through model”, Institute for Advanced Studies, Economic Series: 191.
Stiglitz, J.E. and Weiss, A. (1981), “Credit Rationing in Markets with Imperfect Information”, American Economic Review 71, 393-410.
Thornton, D. (1994), “Financial innovation, deregulation and the “credit view” of monetary policy”, Federal Reserve Bank of St. Louis, January/February.
Tufano, P. (2003), “Financial innovation” in: Handbook of the economics of finance (Constantinides, G. et al, eds.), Vol. 1A, Chapter 6.
Weth, M.A. (2002), “The pass-through from market interest rates to bank lending rates in Germany”, Deutsche Bundesbank, Discussion Paper 11/02.
Williamson, S.D. (1987), “Costly monitoring, loan contracts, and equilibrium credit rationing”, Quarterly Journal of Economics, Vo. 102 (February), 135-145.
Wong, K.P. (1997), “On the determinants of bank interest margins under credit and interest rate risks”, Journal of Banking and Finance, 21, 251-271.
43ECB
Working Paper Series No 714January 2007

ANNEX 1. DESCRIPTION OF THE NRIR AND MIR SAMPLES
Table A1.1. Retail interest rates up to December 2002
(a) Overnight deposits Data description (up to 2002) Additional information Source Market rate BE Sight-deposits. NCB website 1-month DE Sight-deposits to households
(higher-yielding). NCB website 1-month
GR Sight deposits. NRIR 1-month ES Sight deposits. NRIR 1-month FR - In general, no remuneration of euro-denominated
overnight deposits. (Certain professional depositors are required by law to make deposits with the Caisse des depots et consignations, which offers (some) interest.)
- -
IE - In general, no remuneration of euro-denominated overnight deposits.
- -
IT Current account. NRIR 1-month LU Current account and other sight
deposits.
NL Ordinary demand deposit. NRIR 1-month AT Current account deposits (period of
notice = sight). NRIR 1-month
PT Transferable deposits (euro). NCB website 1-month FI Transaction account subject to
withholding tax. NRIR 1-month
(b) Deposits from households redeemable at up to 3 months notice Data description (up to 2002) Additional information Source Market rate
BE Savings deposits. Stock and new business. NRIR Three-month DE Notice period of 3 months, no
agreed maturity; mostly at variable-rate following 3-month Euribor.
Deposits over EUR 10,000 and up to EUR 25,000.
NRIR Three-month
GR Savings accounts. Commercial banks NRIR - ES Savings accounts. Banks and savings banks (simple average) NCB web Three-month FR Weighted average of stocks of
seven different types of instruments: six non-taxable savings passbooks (livrets A et livrets blues, CEL, CODEVI, LEP, Livret jeune) and one taxable savings product (livret soumis à l’impot).
The rates on the non-taxable savings passbooks used to be administred. Since August 2003, the interest rate applied to livret A, livret bleue and CODEVI equals the simple average of the twelve-month change of the consumer price index published by the INSEE and the monthly average of three-month Euribor. The rate on the LEP equals three-quarters of the rate on livret A and the rate on CEL two-thirds of the livret A. The calculation is carried out in January and July every year by the Banque de France.
NRIR Three-month
IE Clearing banks demand deposits under IEP 5,000/household.
Stock and new business NRIR -
IT Savings deposits. Stocks Three-month LU NA - - - NL Savings deposits. Three-month AT NA - - - PT NA - - - FI Other deposits subject to
withholding tax. Stocks -
44ECB Working Paper Series No 714January 2007

(d) Deposits from households with agreed maturity up to 1 year Data description (up to 2002) Additional information Market rate
BE Agreed maturity of 3 months. Three-month DE Agreed maturity of 3 months. Three-month GR Agreed maturity of 12 months. Twelve-month ES Agreed maturity over 6 and up to 12 months. Twelve-month FR n.a. - IE n.a. - IT Certificate of deposit up to 6 months. Three-month LU Other short-term debts. Three-month NL Agreed maturity up to 2 years minus 20 basis points. Twelve-month AT Agreed maturity up to 12 months. Six-month PT Agreed maturity between 181 days and 1 year. Six-month FI Term deposits subject to withholding tax Interest rate on amounts outstanding Three-month
(e) Deposits from households with agreed maturity over 2 years Data description (up to 2002) Additional information Market rate BE 5-year cash bond (“bon de caisse”) Five-year DE Original maturity of 4 years (“Sparbriefe”). Excludes Bausparkassen. Five-year GR - ES Deposits over 2 years. Five-year FR Weighted average of rate on PEL (typically original maturity
over 4 years) and 5-year government bond yield, as a proxy for the other products.
Regulated rate on “plan épargne-logement (PEL)”
Five-year
IE - IT Bonds Interest rate on outstanding amount Five-year LU Other term debt - NL 6-year fixed term time deposit. Five-year AT Original maturity over 1 year. Five-year PT Deposits with agreed maturity over 2 years Five-year FI Term deposits subject to withholding tax. Interest rate on outstanding amount -
(f) Loans with original maturity up to 1 year to non-financial corporations Data description (up to 2002) Additional information Source Market rate
BE 6-months term loan. Loans between EUR 250,000 and 375,000 (to most solvent customers). [excludes overdrafts]
NRIR 3-month
DE Wholesale current account credit, floating rate, usually secured.
Loans between EUR 0.5 to 2.5 million. NRIR 3-month
GR Original maturity up to one year, floating rate; unsecured.
NRIR 3-month
ES Commercial discount up to 3 months. WEB 3-month FR Discounts, overdrafts and other short-term
loans NRIR 3-month
IE Overdrafts and term loans up to 1 year (AA rate), floating rate; usually secured.
NRIR 3-month
IT Rate on outstanding loans with original maturity up to 18 months (50% assumed to relate to non-financial corporations).
NRIR 3-month
LU n.a. - - NL Bank base rate to enterprises, floating rate. [excludes overdrafts] NRIR 3-month AT Loans to enterprises floating rate. NRIR 3-month PT Original maturity up to 1 year. WEB 3-month FI n.a. - -
45ECB
Working Paper Series No 714January 2007

(g) Loans with original maturity over 1 year to non-financial corporations Data description (up to 2002) Additional information Source Market rate BE 5-year investment credit, fixed-rate. mostly unsecured NRIR 5-year DE Rate fixed for 4 years or more (up to Dec. 1998) and for
over 5 years (since Jan. 1999). mostly secured NRIR 5-year
GR Long-term loan, floating-rate. secured NRIR 3-month ES Loans with original maturity over 1 up to 3 years. unsecured NRIR 3-month FR Loans with original maturity over 2 years, variable-rate
(effective rate including non-interest income). NRIR 3-month
IE Term loans over 1 and up to 3 years (AA rate), floating-rate usually secured NRIR 3-month IT Rate on outstanding loans with original maturity over 18
months. NRIR 3-month
LU n.a. - - NL n.a. - - AT n.a. - - PT n.a. - - FI Lending to enterprises, floating-rate. secured NRIR 3-month
(h) Loans to households for house purchase Data description (up to 2002) Additional information Source Market rate BE Mortgage loans, fixed-rate, revisable after 5 years. NRIR 5-year DE Mortgage loans, 5-year fixed rate. NRIR 5-year GR Mortgage loans with original maturity over 5 years, fixed-
rate. (According to information from the EMF, loans with original maturity of 15 years with 1 year initial rate fixation: 30% of new business in 2000; with 5 years initial rate fixation: 50% of new business in 2002.
NRIR 5-year
ES Mortgage loans with original maturity over 3 years; fixed and variable, the share of the later has increased during the 1990s (85% at end-1997 to 98% at end-2002 of amount outstanding); variable rates mostly linked to 12-month MIBOR.
NRIR 12-month
FR Housing loans to households, fixed-rate. NRIR 5-year IE Mortgage loans, floating-rate (rates offered by building
societies). NRIR 3-month
IT Loans to households over 1.5 years, fixed and floating-rate (around 80% refer to housing loans and 20% to consumer credit).
NRIR 3-month
LU NL Mortgage loans to households, rate fixed for 5 years. NRIR 5-year AT Housing loans, floating-rate, includes also some unsecured
loans. NRIR 3-month
PT Loans for house purchase with original maturity over 5 years; fixed and floating rate, includes also some unsecured loans.
NRIR 3-month
FI Housing loans to households, floating-rate. NRIR 3-month
46ECB Working Paper Series No 714January 2007

(j) Loans to households for consumption Data description (up to 2002) Additional information Source Market rate BE [Loans with original maturity over 1 year, fixed-rate for 3
years (links with 1-5 ipf).] Loans for new car purchase. NRIR 2-year
DE Instalment credit, rate fixed for 3 to 5 years, presumably mostly secured.
Loans between EUR 5,000 and 15,000.
NRIR 4-year
GR Personal loans with original maturity over 1 year, fixed-rate, unsecured.
NRIR 2-year
ES Personal loans (mostly to households). WEB 2-year FR Personal loans and other loans over EUR 1,524 [Original
maturity over 3 months; at end-2003, residual maturity up to 1 year (41%), over 1 up to 5 years (52%) and over 5 years (6%); prêts personnels and crédits affectés at fixed-rate (around 75% of stocks between 1999 and 2003) and credits renouvlables at variable-rate (25%)].
Loans up to EUR 21,500 (generally).
NRIR 2-year
IE Overdrafts and term loans A rate/lending to consumers, floating-rate, unsecured.
NRIR 1-month
IT n.a. - - LU NL n.a. - - AT Consumer credit (usually long-term), secured. NRIR 2-year PT Consumer credit to households with original maturity
between 2-5 years, fixed and floating-rate, secured and unsecured.
NRIR 2-year
FI Consumer credit to households, floating-rate, secured. NRIR 2-year
Table A1.2. MFI interest rates on new business as from January 2003
Market Segment Market rate Deposits Overnight 1-month
Redeemable at notice up to 3 months 3-month
With agreed maturity up to 1 year (households) 6-month
With agreed maturity over 2 years (households) 5-year
Loans Bank overdrafts 1-month
Floating rate and up to 1 year initial rate fixation 3-month
Over 1 and up to 5 years initial rate fixation 3-year
Over 5 years initial rate fixation 7-year
Over 5 and up to 10 years initial rate fixation (mortgages only) 7-year
Over 10 years initial rate fixation (mortgages only) 10-year
Table A2.3. Number of observations per country and per product category
Overnight Redeemable at notice
up to 1 year
over 1 year
consump-tion
house purchase up to 3m up to 1y over 2y
Belgium 42 42 42 42 42 42 42 42 336Germany 42 32 42 42 32 42 42 42 316Spain 42 42 42 42 42 42 42 42 336France 42 42 42 42 42 42 0 42 294Italy 42 39 0 39 42 39 39 39 279Netherlands 42 0 0 42 42 42 42 42 252Austria 38 0 38 38 35 0 38 33 220Portugal 42 0 42 42 42 0 42 42 252Finland 0 42 42 42 42 42 42 42 294
332 239 290 371 361 291 329 366 2579
To non-financial corporations
To households
Loans Deposits
With agreed maturity
Note: Shaded cells indicate that a few observations are missing.
47ECB
Working Paper Series No 714January 2007

ANNEX 2. DESCRIPTION OF THE EXPLANATORY VARIABLES
Table A2.1. Descriptive and data sources Variable Measurement (proxy) Abbr.
Policy rate Three-month money market rate. NCBs, Reuters, Bloomberg.
Bank soundness Distance-to-default of banks. KMV Moody’s.
Slope of the yield curve
5-year government bond yield minus 3-month interbank deposit rate: Hofmann and Mizen (2004), Brock and Franken (2003).
NCBs, Reuters, Bloomberg.
Interest rate risk Quarterly standard deviation of daily interest rates in money and bond markets (e.g. Saunders and Schumacher (2000), Maudos and Fernandez de Guevara (2004)).
NCBs, Reuters, Bloomberg.
Competition (banks)
H-statistic of market power. Claessens and Lieven (2003), Bikker (2004) and Carbo et al (2005).
Competition (market finance)
Ratio of outstanding quoted shares as a percentage of GDP ECB, FESE, Eurostat.
Ratio of outstanding debt securities issued by non-financial corporations as a % of GDP
ECB, Eurostat.
Mutual fund shares as a % of GDP. ECB, Eurostat.
Non-MFI loans as a % of GDP. ECB, Eurostat.
Financial innovation
Overall index: combination of securitisation, derivatives and venture capital
Authors’ calculations.
Gross issues of securitisation as a % of GDP. Euopean Securitisation Forum.
Single-currency interest rates derivatives as a % of GDP. BIS (Triennial Survey)
Venture capital investment as a % of GDP. European Venture Capital Association (EVCA)
Table A2.2. Descriptive statistics Variable Abbr. Mean Std. Dev. Min Max Changes 3-month market rate d3m -0.11 0.41 -1.65 1.64 distance-to-default ddd 0.00 0.53 -2.52 2.49 standard deviation of daily 3-month market rates dsdev 0.00 0.14 -0.79 0.95 standard deviation of daily 5-year market rates dsd5y 0.00 0.14 -0.63 0.56 slope (5-year minus 3-month) dslope 0.03 0.48 -1.53 2.00 Levels h-statistic hstat 0.79 0.21 0.23 1.13 stock market capitalisation (% of GDP) share 63.07 41.59 12.31 331.44 corporate bonds outstanding (% of GDP) bond 6.10 3.88 1.64 17.62 non-mfi loans to households (% of GDP) nmfhh 17.93 21.96 0.62 108.69 mutual funds (% of GDP) fund 30.08 12.94 3.01 66.07 securitsation (% of GDP) secu 0.02 0.03 0.00 0.10 interest-rate derivatives (% of GDP) deri 0.02 0.02 0.00 0.09 venture capital vc 0.00 0.00 0.00 0.00
48ECB Working Paper Series No 714January 2007

ANNEX 3: ROBUSTNESS CHECKS Table A3.1. Baseline model
PR(t) PR(t-1)Pass-
through PR(t) PR(t-1)Pass-
through
Policy rate loans -0.40 *** 0.24 *** 0.84(0.02) (0.02)
deposits 0.60 *** -0.17 *** 0.56(0.02) (0.02)
nfc loans (st) -0.54 *** 0.21 *** 0.67(0.04) (0.04)
nfc loans (lt) -0.24 *** 0.11 *** 0.88(0.05) (0.04)
consumer credit -0.42 *** 0.35 *** 0.93(0.04) (0.04)
mortgages -0.37 *** 0.26 *** 0.90(0.04) (0.04)
demand deposit 0.82 *** -0.05 0.23(0.04) (0.04)
savings deposit 0.89 *** -0.12 *** 0.23(0.04) (0.04)
time deposit (st) 0.52 *** -0.20 *** 0.67(0.04) (0.04)
time deposits (lt) 0.23 *** -0.30 *** 1.07(0.04) (0.04)
Bank loans 0.02 *** -0.05 *** 0.02 -0.05 ***soundness (0.02) (0.02) (0.01) (0.01)
deposits -0.04 *** 0.01 *** -0.04 *** 0.01(0.01) (0.01) (0.01) (0.01)
Yield curve loans -0.24 *** 0.01 *** -0.24 *** 0.01slope (0.02) (0.01) (0.02) (0.01)
deposits 0.11 *** 0.00 *** 0.11 *** 0.00(0.02) (0.01) (0.02) (0.01)
Interest rate loans 0.23 *** 0.13 *** 0.24 *** 0.13 **risk (0.07) (0.07) (0.07) (0.06)
deposits 0.10 *** 0.21 *** 0.09 0.20 ***(0.06) (0.06) (0.06) (0.06)
NWald statisticR-sq. (overall) 0.35 0.43
Model R1 Model R2
Fixed-effects across countries plus product dummies
Fixed-effects across countries plus product dummies
257959.0***
257955.1***
49ECB
Working Paper Series No 714January 2007

Table A3.2. Baseline model
PR(t) PR(t-1)Pass-
through PR(t) PR(t-1)Pass-
through
Policy rate loans -0.37 *** 0.25 *** 0.88 -0.38 *** 0.24 *** 0.86(0.02) (0.02) (0.02) (0.02)
deposits 0.64 *** -0.18 *** 0.54 0.60 *** -0.17 *** 0.57(0.02) (0.02) (0.01) (0.01)
Bank loans 0.01 -0.05 *** 0.02 -0.05 ***soundness (0.01) (0.01) (0.01) (0.01)
deposits -0.04 *** 0.01 -0.04 *** 0.01(0.01) (0.01) (0.01) (0.01)
Yield curve loans -0.16 *** -0.01 -0.24 *** -0.01 **slope (0.02) (0.01) (0.02) (0.01)
deposits 0.03 0.01 0.11 *** 0.00(0.01) (0.01) (0.01) (0.01)
Interest rate loans 0.18 *** 0.08 0.23 *** 0.12 ***risk (0.07) (0.07) (0.05) (0.05)
deposits 0.13 *** 0.24 *** 0.10 ** 0.21 ***(0.05) (0.05) (0.04) (0.04)
NWald statisticR-sq. (loans)R-sq. (deposits)
0.270.42
25792044.2***
2579
Model R3 Model R4
Two-way random effects SUR plus country dummies
50ECB Working Paper Series No 714January 2007

51ECB
Working Paper Series No 714January 2007
European Central Bank Working Paper Series
For a complete list of Working Papers published by the ECB, please visit the ECB’s website(http://www.ecb.int)
680 “Comparing alternative predictors based on large-panel factor models” by A. D’Agostino and D. Giannone, October 2006.
681 “Regional inflation dynamics within and across euro area countries and a comparison with the US” by G. W. Beck, K. Hubrich and M. Marcellino, October 2006.
682 “Is reversion to PPP in euro exchange rates non-linear?” by B. Schnatz, October 2006.
683 “Financial integration of new EU Member States” by L. Cappiello, B. Gérard, A. Kadareja and S. Manganelli, October 2006.
684 “Inflation dynamics and regime shifts” by J. Lendvai, October 2006.
685 “Home bias in global bond and equity markets: the role of real exchange rate volatility” by M. Fidora, M. Fratzscher and C. Thimann, October 2006
686 “Stale information, shocks and volatility” by R. Gropp and A. Kadareja, October 2006.
687 “Credit growth in Central and Eastern Europe: new (over)shooting stars?” by B. Égert, P. Backé and T. Zumer, October 2006.
688 “Determinants of workers’ remittances: evidence from the European Neighbouring Region” by I. Schiopu and N. Siegfried, October 2006.
689 “The effect of financial development on the investment-cash flow relationship: cross-country evidence from Europe” by B. Becker and J. Sivadasan, October 2006.
690 “Optimal simple monetary policy rules and non-atomistic wage setters in a New-Keynesian framework” by S. Gnocchi, October 2006.
691 “The yield curve as a predictor and emerging economies” by A. Mehl, November 2006.
692 “Bayesian inference in cointegrated VAR models: with applications to the demand for euro area M3” by A. Warne, November 2006.
693 “Evaluating China’s integration in world trade with a gravity model based benchmark” by M. Bussière and B. Schnatz, November 2006.
694 “Optimal currency shares in international reserves: the impact of the euro and the prospects for the dollar” by E. Papaioannou, R. Portes and G. Siourounis, November 2006.
695 “Geography or skills: What explains Fed watchers’ forecast accuracy of US monetary policy?” by H. Berger, M. Ehrmann and M. Fratzscher, November 2006.
696 “What is global excess liquidity, and does it matter?” by R. Rüffer and L. Stracca, November 2006.
697 “How wages change: micro evidence from the International Wage Flexibility Project” by W. T. Dickens, L. Götte, E. L. Groshen, S. Holden, J. Messina, M. E. Schweitzer, J. Turunen, and M. E. Ward, November 2006.
698 “Optimal monetary policy rules with labor market frictions” by E. Faia, November 2006.

52ECB Working Paper Series No 714January 2007
699 “The behaviour of producer prices: some evidence from the French PPI micro data” by E. Gautier, December 2006.
700 “Forecasting using a large number of predictors: Is Bayesian regression a valid alternative toprincipal components?” by C. De Mol, D. Giannone and L. Reichlin, December 2006.
701 “Is there a single frontier in a single European banking market?” by J. W. B. Bos and H. Schmiedel, December 2006.
702 “Comparing financial systems: a structural analysis” by S. Champonnois, December 2006.
703 “Comovements in volatility in the euro money market” by N. Cassola and C. Morana, December 2006.
704 “Are money and consumption additively separable in the euro area? A non-parametric approach” by B. E. Jones and L. Stracca, December 2006.
705 “What does a technology shock do? A VAR analysis with model-based sign restrictions” by L. Dedola and S. Neri, December 2006.
706 “What drives investors’ behaviour in different FX market segments? A VAR-based returndecomposition analysis” by O. Castrén, C. Osbat and M. Sydow, December 2006.
707 “Ramsey monetary policy with labour market frictions” by E. Faia, January 2007.
708 “Regional housing market spillovers in the US: lessons from regional divergences in a common monetary policy setting” by I. Vansteenkiste, January 2007.
and J. Pearlman, January 2007.
710 “Pricing of settlement link services and mergers of central securities depositories” by J. Tapking, January 2007.
711 “What “hides” behind sovereign debt ratings?” by A. Afonso, P. Gomes and P. Rother, January 2007.
M. Lippi and L. Reichlin, January 2007.
January 2007.
714 “The dynamics of bank spreads and financial structure” by R. Gropp, C. Kok Sørensen and J.-D. Lichtenberger, January 2007.
712 “Opening the black box: structural factor models with large cross-sections” by M. Forni, D. Giannone,
709 “Quantifying and sustaining welfare gains from monetary commitment” by P. Levine, P. McAdam
713 “Balance of payment crises in emerging markets: How early were the “early” warning signals?” by M. Bussière,

ISSN 1561081-0
9 7 7 1 5 6 1 0 8 1 0 0 5