the dynamic us fresh produce industry · seeds. • seed ... • streamlining the supply chain...
TRANSCRIPT

The Dynamic US Fresh Produce
Industry DR. ROBERTA COOK
Dept. of Ag and Resource Economics University of California, Davis
for UC Davis Postharvest Technology Short Course
June 19, 2015

Agenda
• Some global food demand and retailing trends • Location of production and fresh produce basics
• Fresh produce value chain • International trade • Select food industry trends • Conclusions

Key Global Demand Trends • Important shi6s are underway in the share of global popula;on accounted for by key regions with profound implica;ons for food demand in upcoming decades.
• Rising incomes in developing economies should cause fresh produce demand growth to outpace demand in developed economies.
• Since the 80s: Improved market access (reduc;on in tariff and non-‐tariff barriers), facilita;ng interna;onal trade, and increasing compe;;on between exporters.
• Since the 80s: FDI was liberalized, priva;za;on, general market liberaliza;on, and emergence of middle classes.
• Result: supermarket “revolu;on” in the developing world! • Key role of FDI: Much of the growth was driven by European and Japanese chains facing saturated markets at home.

Key Global Retail Trends • Much more rapid emergence of supermarkets in L. America and Asia than occurred in the USA and Europe. (Reardon, Thomas and Timmer, C. Peter, “The Economics of the Food System Revolu;on,” www.annualreviews.org.)
• Supermarkets s;mulate produce imports – shelf-‐space must be full yr-‐round.
• Fragmented supply chains pose big challenges. • Supermarkets s;mulate supply chain moderniza;on, and eventually contribute to the emergence of larger and more professional farmers and intermediaries. Need for scale!
• The drive to reduce transac;on costs contributes to a gradual process of streamlining the supply chain, improving quality, safety and reducing food waste and margins.
• Compe;;on means these gains translate into lower prices, benefi;ng consumers and increasing demand. Virtuous circle! Note: Walmart model, the world’s largest retailer.
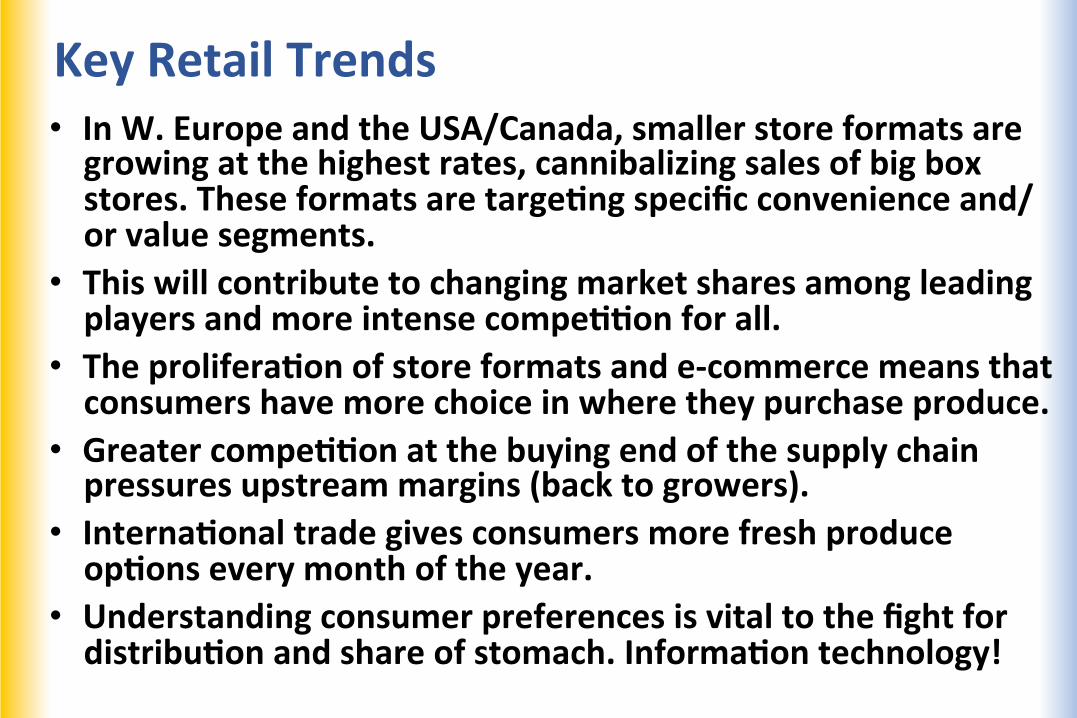
Key Retail Trends • In W. Europe and the USA/Canada, smaller store formats are growing at the highest rates, cannibalizing sales of big box stores. These formats are targe;ng specific convenience and/or value segments.
• This will contribute to changing market shares among leading players and more intense compe;;on for all.
• The prolifera;on of store formats and e-‐commerce means that consumers have more choice in where they purchase produce.
• Greater compe;;on at the buying end of the supply chain pressures upstream margins (back to growers).
• Interna;onal trade gives consumers more fresh produce op;ons every month of the year.
• Understanding consumer preferences is vital to the fight for distribu;on and share of stomach. Informa;on technology!

740 954 1,070
4,288
7,052
719 1,198
2,192
5,197
9,306
EUROPE/RUSSIA AMERICAS AFRICA ASIA TOTAL
2012 2050
World Popula;on by Region in 2012 and Projec;ons for 2050 (in millions)
Sources: United Na;ons/World Bank's official series for 1990-‐2012 (October 2012), and UN official projec;ons for 2012-‐2100 (UN Popula;on Prospects, April 2011 version) (central/mid-‐range scenario)
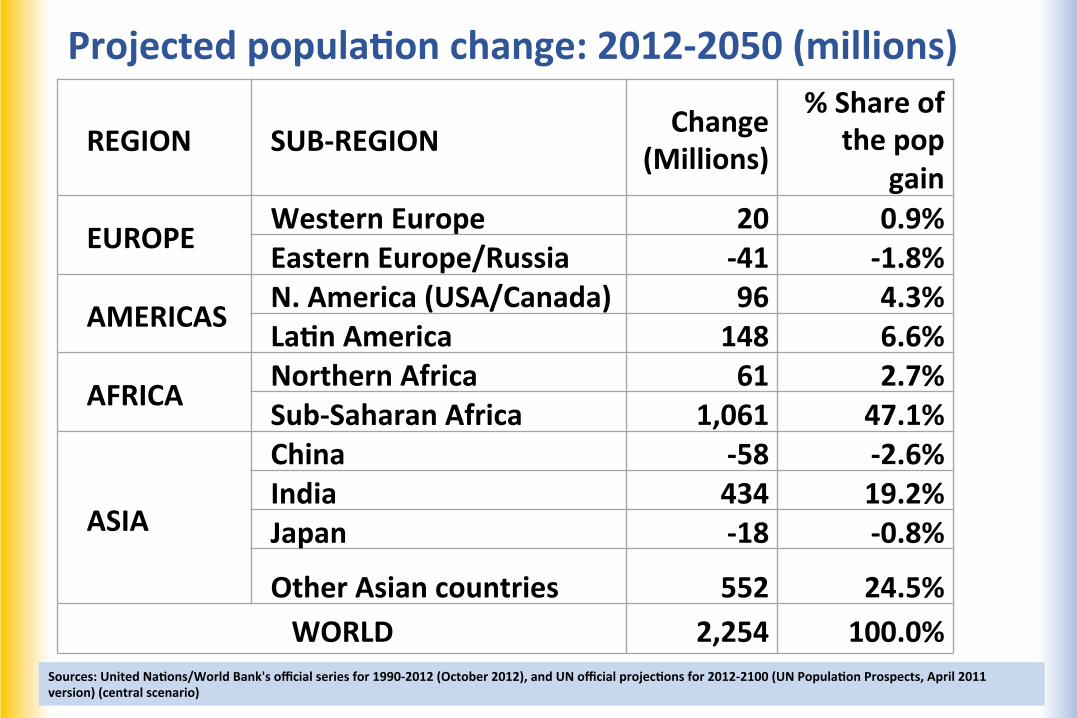
Projected popula;on change: 2012-‐2050 (millions) REGION SUB-‐REGION Change
(Millions)
% Share of the pop
gain
EUROPE Western Europe 20 0.9% Eastern Europe/Russia -‐41 -‐1.8%
AMERICAS N. America (USA/Canada) 96 4.3% La;n America 148 6.6%
AFRICA Northern Africa 61 2.7% Sub-‐Saharan Africa 1,061 47.1%
ASIA
China -‐58 -‐2.6% India 434 19.2% Japan -‐18 -‐0.8%
Other Asian countries 552 24.5% WORLD 2,254 100.0%
Sources: United Na;ons/World Bank's official series for 1990-‐2012 (October 2012), and UN official projec;ons for 2012-‐2100 (UN Popula;on Prospects, April 2011 version) (central scenario)
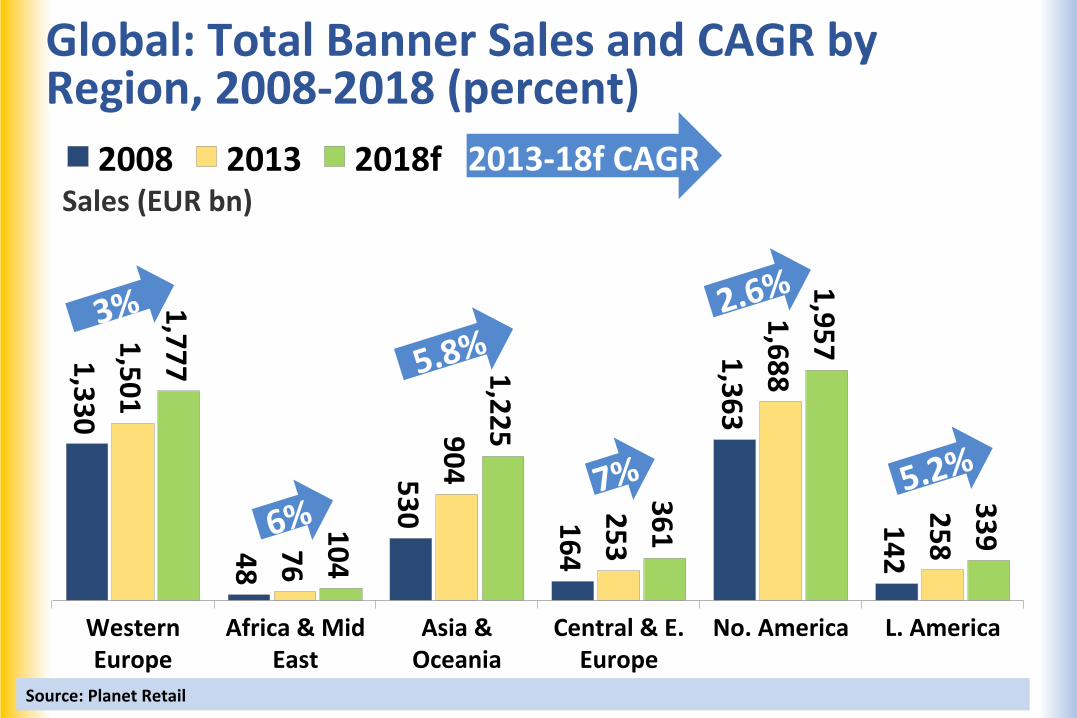
Source: Planet Retail
1,330
48
530 164
1,363
142
1,501
76
904 253
1,688
258
1,777
104
1,225
361
1,957
339
Western Europe
Africa & Mid East
Asia & Oceania
Central & E. Europe
No. America L. America
Sales (EUR bn) 2008 2013 2018f 2013-‐18f CAGR
3%
5.8% 2.6%
5.2%
6% 7%
Global: Total Banner Sales and CAGR by Region, 2008-‐2018 (percent)
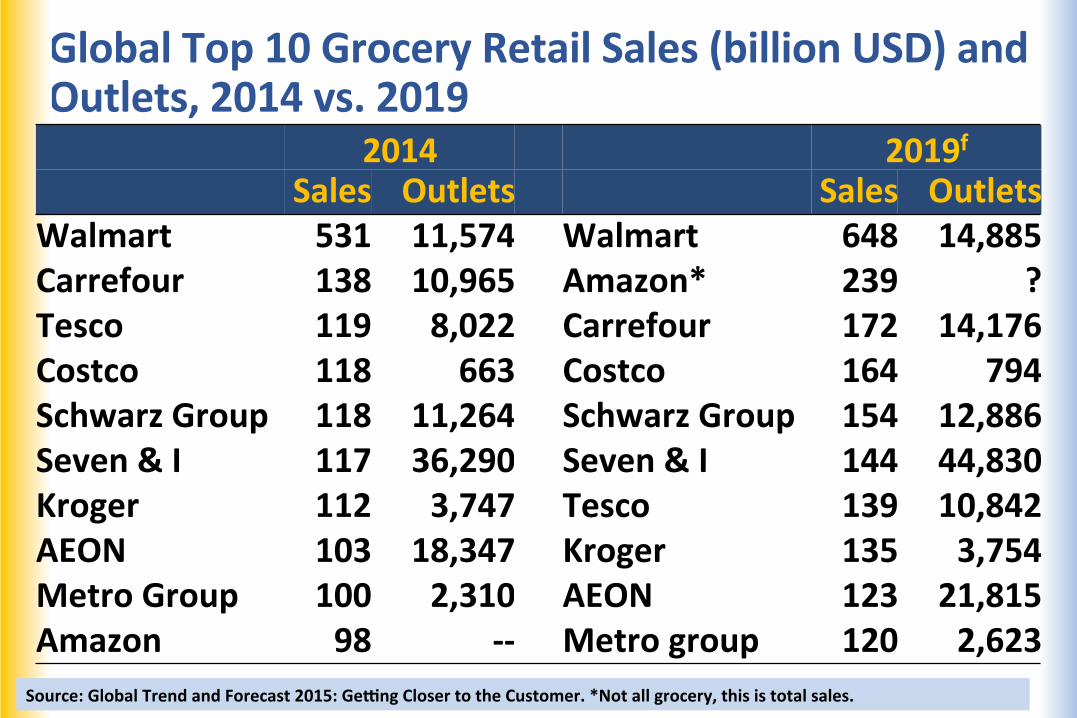
Global Top 10 Grocery Retail Sales (billion USD) and Outlets, 2014 vs. 2019
Source: Global Trend and Forecast 2015: Geong Closer to the Customer. *Not all grocery, this is total sales.
2014 2019f Sales Outlets Sales Outlets
Walmart 531 11,574 Walmart 648 14,885 Carrefour 138 10,965 Amazon* 239 ? Tesco 119 8,022 Carrefour 172 14,176 Costco 118 663 Costco 164 794 Schwarz Group 118 11,264 Schwarz Group 154 12,886 Seven & I 117 36,290 Seven & I 144 44,830 Kroger 112 3,747 Tesco 139 10,842 AEON 103 18,347 Kroger 135 3,754 Metro Group 100 2,310 AEON 123 21,815 Amazon 98 -‐-‐ Metro group 120 2,623

Supermarket Emergence in Developing Economies • European food retailer investment in developing country markets has slowed as increasing compe;;on and slower growth in home markets has caused firms like Tesco to retrench.
• Growth in local & regional chains throughout the developing world will likely reduce the share (not total sales) of the top European/US retailers there (homegrown chains will grow more rapidly). Locals benefit from infrastructure improvements introduced via FDIs.
• This trend is already underway. Between 2004 and 2014 the global combined share of the modern food retail market held by the top 30 grocery retailers declined from 28-‐23%, according to Planet Retail.

Source: Global Trend and Forecast 2015: Geong Closer to the Customer
• The big gainers will be strong local and regional players -‐ posi;oned in fast-‐growing markets in Asia, La;n America, Eastern Europe, the Middle East and Africa.
• Players such as Saigon Co-‐op, A101, Dairy Farm and Lotte Shopping in Asia are ones to watch, A-‐101 in Turkey as is Magnit in Eastern Europe.
• A series of acquisi;ons and market entries has enabled the likes of Cencosud in L. America to transform themselves into strong regional players. Cencosud is now the largest local player in L. America.
Leading Players Are Losing Share Globally
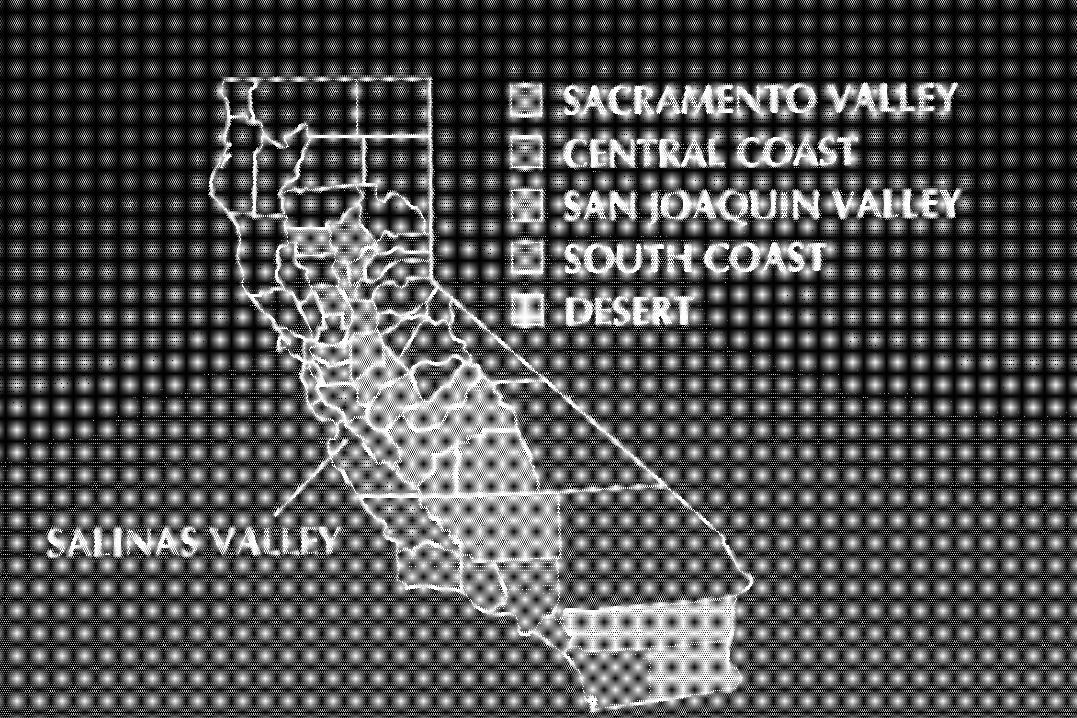
Location of production and fresh produce basics
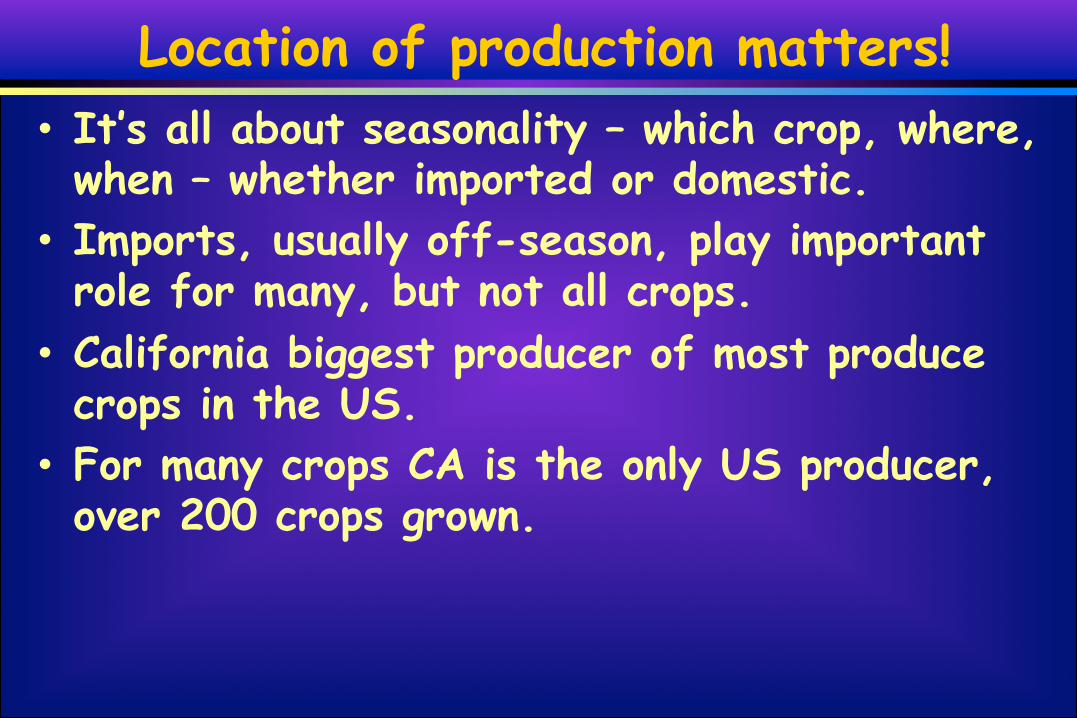
Location of production matters! • It’s all about seasonality – which crop, where, when – whether imported or domestic.
• Imports, usually off-season, play important role for many, but not all crops.
• California biggest producer of most produce crops in the US.
• For many crops CA is the only US producer, over 200 crops grown.
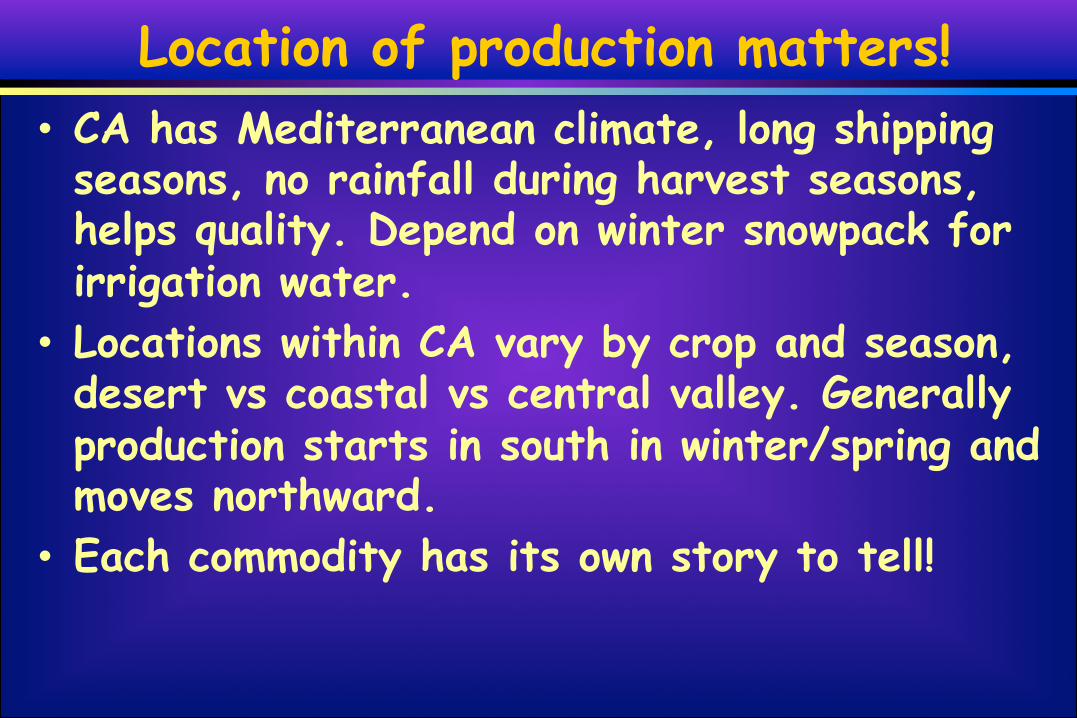
Location of production matters! • CA has Mediterranean climate, long shipping seasons, no rainfall during harvest seasons, helps quality. Depend on winter snowpack for irrigation water.
• Locations within CA vary by crop and season, desert vs coastal vs central valley. Generally production starts in south in winter/spring and moves northward.
• Each commodity has its own story to tell!
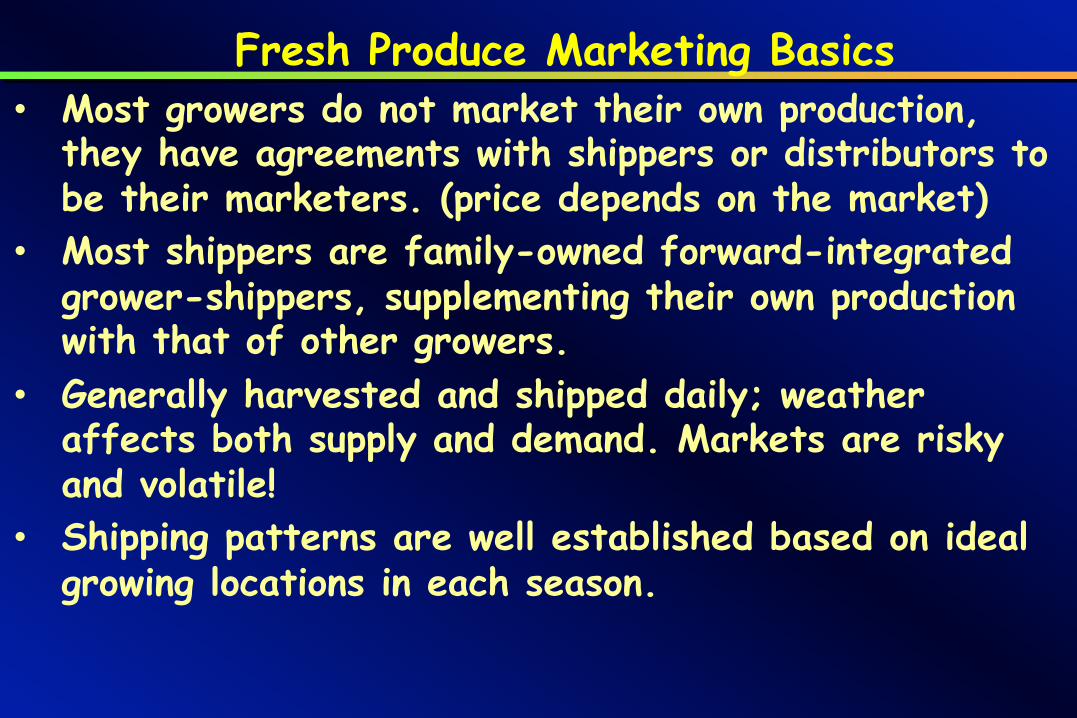
• Most growers do not market their own production,
they have agreements with shippers or distributors to be their marketers. (price depends on the market)
• Most shippers are family-owned forward-integrated grower-shippers, supplementing their own production with that of other growers.
• Generally harvested and shipped daily; weather affects both supply and demand. Markets are risky and volatile!
• Shipping patterns are well established based on ideal growing locations in each season.
Fresh Produce Marketing Basics

Seasonality of Naturipe Farms berry production locations t:rawberries
California Florida
Mexico
lueberries
Mexico Chile Florida
Georgia California.
Nort:h Carolina Indiana
New Jersey Michigan
Oregon Brit:ish Columbia
Was hingt:on
Uruguay
Argent:ina
aspberrles
Mexico
California
Mexico Guatemala
California N . Carolina Georgia Oregon
ran berries Quebec Halifax Wisconsin
Jan. M arch
i= ---
-------------Organic also available Peak of Season
April May June

Top 5 US Fresh Market Vegetable States* in 2014: Geographic concentration of production (due to climate) limits local sourcing potential, yet it is growing in the summer/fall
Source: Vegetables 2014 Summary, USDA/NASS, January 2015
Area Harvested Production Value
State % of Total
State
% of Total
State
% of Total
CA 47 CA 52 CA 60 FL 10 AZ 8 FL 10 AZ 7 FL 7 AZ 6 GA 6 WA 4 GA 4 NY 4 GA 4 NY 3
Other 28 Other 25 Other 18 *Excludes potatoes

USA Vegetable/Melon Farm Structure, 2012
• 72,267 total vegetable, potato and melon farms, including 65,814 harvesting for fresh market and 13,072 for processing (so some harvest for both markets).
• $16.8B total farmgate sales, including $6.3B in California.
• 5,768 farms selling >$1M account for 8% of farms and 87% of total value, including 1,086 farms selling >$1M (2%) in CA, contributing 36% of total value.
Sources: 2012 Census of Ag, USDA, Tables 65, p. 92 and 29 p 464.

Market Shares of Top 5 USA Fresh Fruit Producing States,* 2009
*Excludes tree nuts. Source: USDA/ERS, Gary Lucier.
Percent State USA Total
California 53% Washington – leads in apples, pears, cherries 21% Florida 8% Oregon 2% Michigan 2% Other 10% All U.S. fresh fruit 100%

USA Fruit, Berry and Nut Farm Structure, 2012
• Total of 105,737 fruit, berry, nut farms of all sizes.
• Farmgate sales of $25.9B, incl $17.6B in CA.
• 5,874 farms selling >$1million account for 6% of total fruit/berry/nut farms and contribute 76% of total value, including:
• 3,541 California farms selling >$1M which account for 3% of US fruit, berry and nut farms and contribute 54% of US total value.
Source: 2012 Census of Ag, USDA, Table 65, p 92

• Growers and shippers are price takers. • Growers receive the residual of the market price received by the shipper for their produce, less marketing charges, pick, pack and harvest, palletization, in some cases cooling, and other handling charges and mandated-marketing or other institutional fees. • Shipping point prices may not always cover total costs; when they don’t even cover variable costs (e.g. harvest/packing) product is left in field. • The shipper has incentives to continue shipping if at least covering variable costs in order to meet commitments with buyers, to maintain labor and potentially earn profit margins on cooling, harvesting and marketing; sometimes there is no return to the grower (production costs are not recouped).
Fresh Produce Marketing Basics

• Shippers have big investments in facilities,
technology, seed trials, research to improve efficiency, sustainability, precision farming. • Growers/shippers require substantial capitalization to withstand low markets. • About 20 retailers estimated to account for over 70% of US total retail food sales. • Buyer consolidation has led to shipper consolidation – fewer, bigger firms.
Fresh Produce Marketing Basics
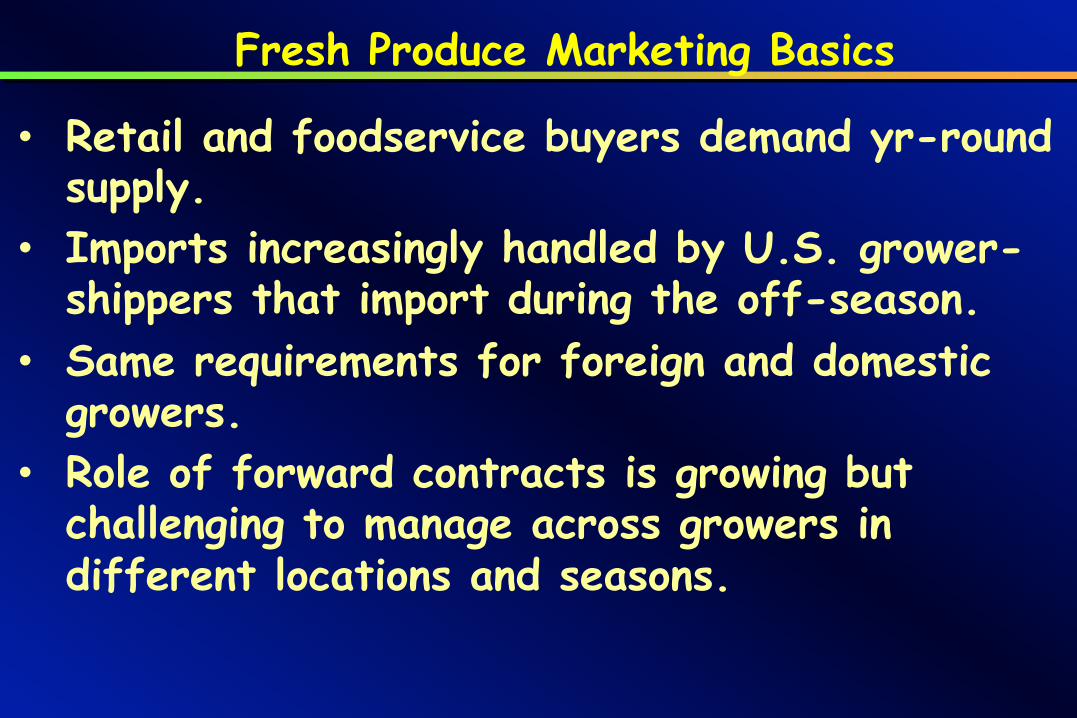
• Retail and foodservice buyers demand yr-round
supply. • Imports increasingly handled by U.S. grower-
shippers that import during the off-season. • Same requirements for foreign and domestic
growers. • Role of forward contracts is growing but
challenging to manage across growers in different locations and seasons.
Fresh Produce Marketing Basics
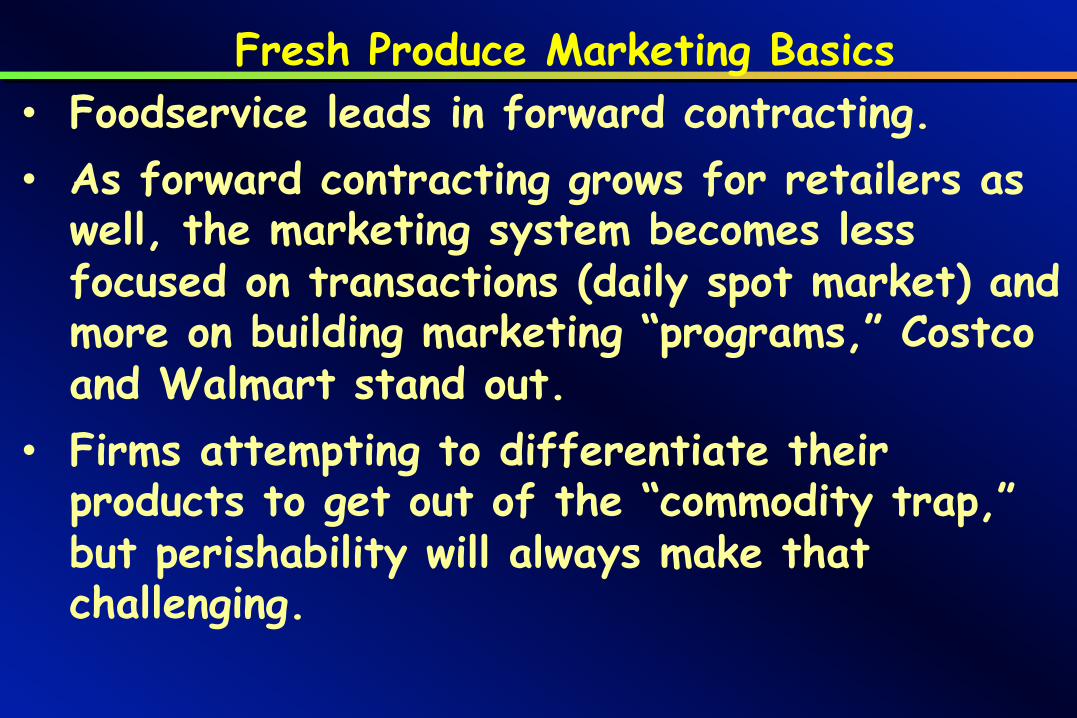
• Foodservice leads in forward contracting.
• As forward contracting grows for retailers as well, the marketing system becomes less focused on transactions (daily spot market) and more on building marketing “programs,” Costco and Walmart stand out.
• Firms attempting to differentiate their products to get out of the “commodity trap,” but perishability will always make that challenging.
Fresh Produce Marketing Basics
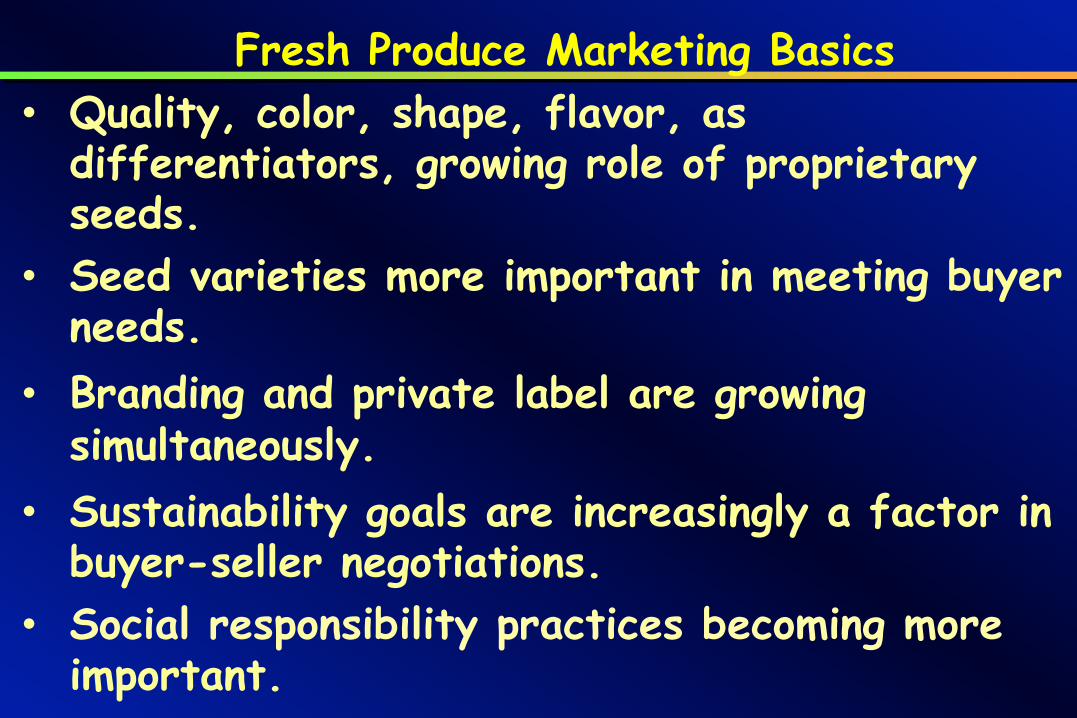
• Quality, color, shape, flavor, as
differentiators, growing role of proprietary seeds.
• Seed varieties more important in meeting buyer needs.
• Branding and private label are growing simultaneously.
• Sustainability goals are increasingly a factor in buyer-seller negotiations.
• Social responsibility practices becoming more important.
Fresh Produce Marketing Basics

• Major food safety requirements, higher cost structure. Large growers have big investments.
• Fewer, larger buyers have enabled shippers to reduce their customer lists and to focus more on understanding the needs of key accounts - becoming account-driven.
• Buyers expect suppliers to be much more data-driven in their selling/marketing approaches, requires IT investments.
• Shippers focuses more on understanding and communicating with consumers, attempting to stimulate consumer demand; social media facilitates.
Fresh Produce Marketing Trends

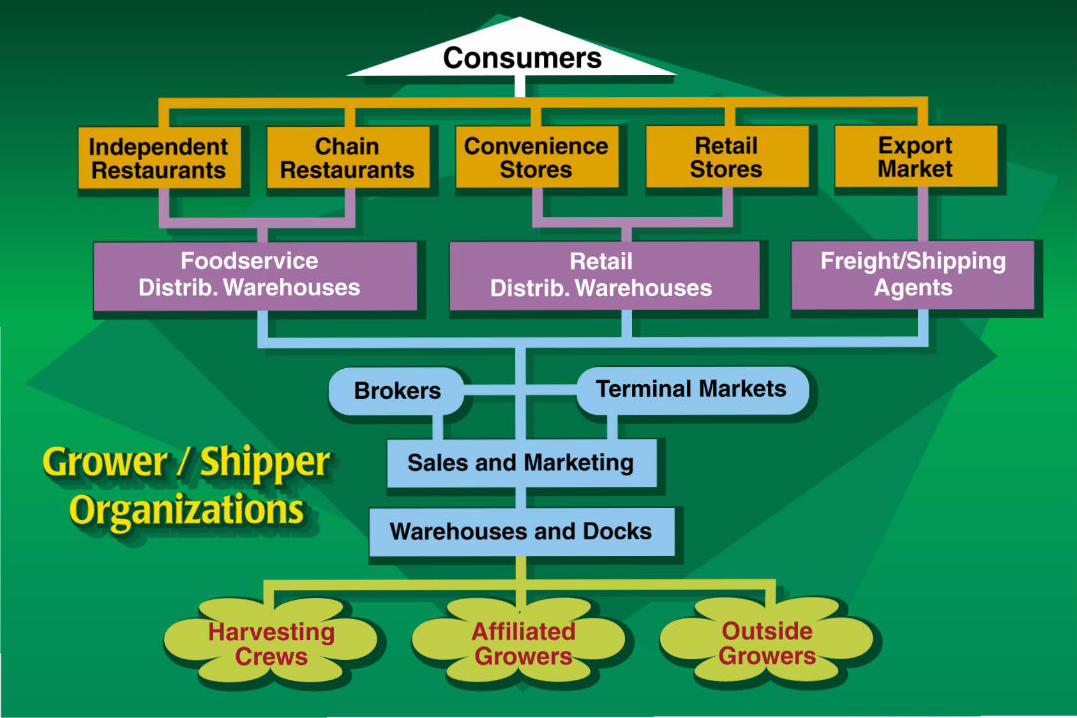
Fresh Produce Value Chain
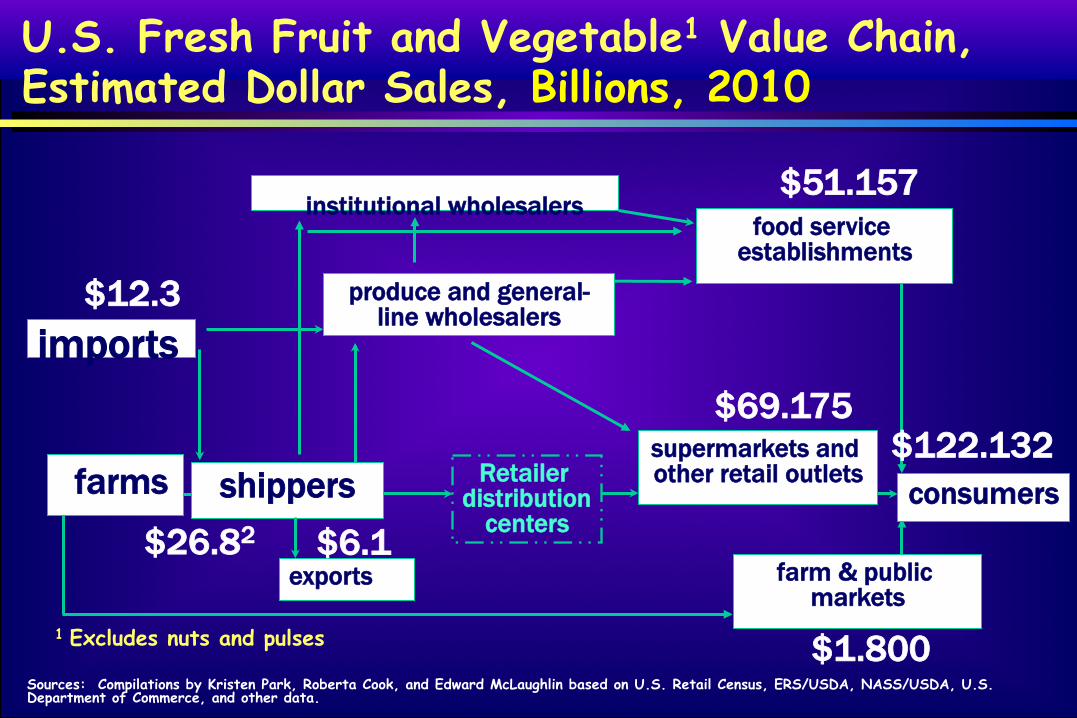
U.S. Fresh Fruit and Vegetable1 Value Chain, Estimated Dollar Sales, Billions, 2010
institutional wholesalers food service
establishments
supermarkets and other retail outlets
consumers
exports
farms shippers Retailer distribution
centers
produce and general-line wholesalers
farm & public markets
imports
$6.1 $26.82
$12.3
$51.157
$122.132 $69.175
$1.800 Sources: Compilations by Kristen Park, Roberta Cook, and Edward McLaughlin based on U.S. Retail Census, ERS/USDA, NASS/USDA, U.S. Department of Commerce, and other data.
1 Excludes nuts and pulses

Misc. Fresh Produce Trends
• Wholesalers, brokers and other intermediaries are especially pressed to add value to remain relevant; traditionally focused on independent retailers, foodservice operators & fill-in orders for large chains. • Foodservice industry is no longer expanding as it was for decades. • Seed companies are striving to develop more output-specific consumer traits, in some cases in conjunction with growers and shippers in order to capture more of the value chain.

Estimated Ranges of Losses in the U.S. Fresh Produce Distribution System
• Distribution Percent Activity Losses
• Transportation 2.80 – 5.00
• Wholesaling 2.50 – 5.03
• Retailing 2.74 – 6.58
• System losses 7.04 – 16.61 Source: Pierson, Thomas R., Allen, John R. and McLaughlin, Edward W., "Produce Losses in the U.S. Food Distribution System," MSU Agricultural Economics Report, 1983.
Update: 2010 Guestimate by Roberta Cook, Preliminary: 9-12% or $11-15 billion.
Percentage losses are based on dollar values of losses in each phase of distribution as a % of the wholesale value of products entering the distribution system.

• Streamlining the supply chain involves identifying which activities add more value than cost.
• Eliminating non-value-adding activities.
• Decreasing internal operational inefficiencies.
• Mutually beneficial tactics - promotions, packaging, logistics.
Supply Chain Imperatives
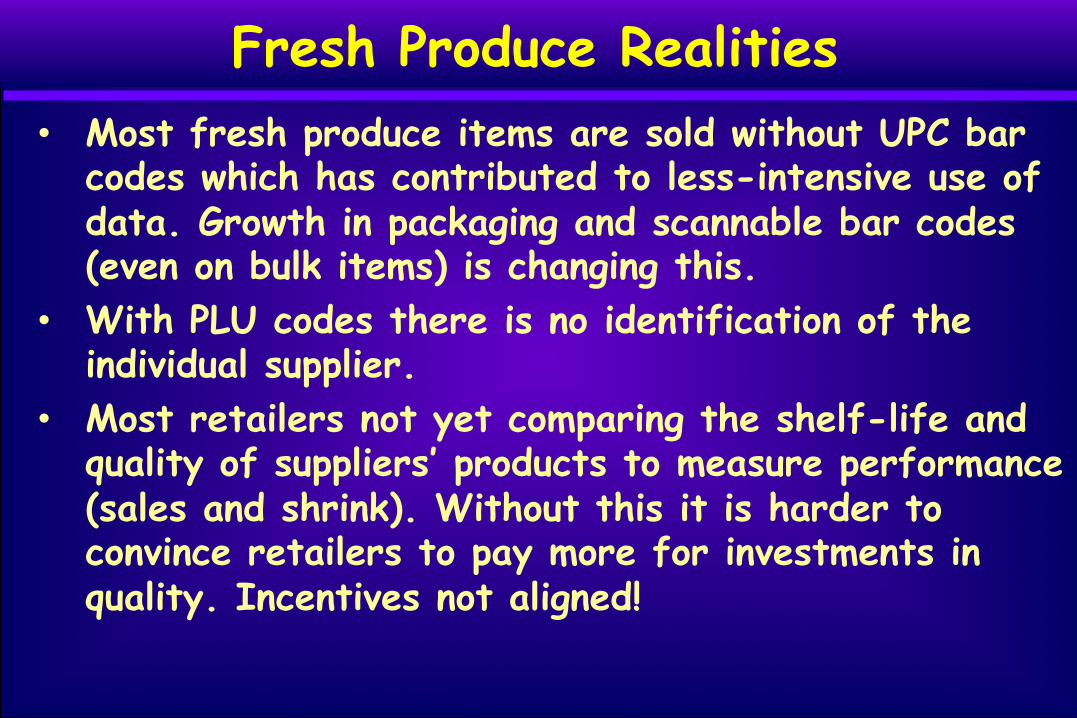
Fresh Produce Realities • Most fresh produce items are sold without UPC bar
codes which has contributed to less-intensive use of data. Growth in packaging and scannable bar codes (even on bulk items) is changing this.
• With PLU codes there is no identification of the individual supplier.
• Most retailers not yet comparing the shelf-life and quality of suppliers’ products to measure performance (sales and shrink). Without this it is harder to convince retailers to pay more for investments in quality. Incentives not aligned!

Fresh Produce Realities • The global industry needs PTI not just for
potential food safety incidents but for product identification and metrics.
• Slow implementation of PTI. Walmart announcement may be a balance tipper.
• Retailer focus on gross vs net profit is a problem as it doesn’t take into account shrink.

• Datasets whose size is beyond the ability of typical
database software programs to analyze, store, and
manage
• Volume, variety and velocity
• Making sense of the information inherent in these
massive amounts of diverse data to make better
decisions, analytics
“Big Data”

Copyrig
ht ©
2013 The
Nielse
n Co
mpany. Con
fiden
;al and
proprietary.
37
SHOPPER INSIGHTS
CONNECT
COOLER & DC INSIGHTS
RETAIL INSIGHTS TRACEABILITY
UTILIZING TECHNOLOGY TO SUPPORT THE SUPPLY CHAIN

The Produce Industry Challenge • Getting the right product to the right consumer at the right
place and price, with reasonable remaining days of shelf-life.
• Requires collaboration between suppliers and retailers, including loyalty card data and promotional efficiency.
• Shippers increasingly involved in category development but most not assisting with individual store shelf-set recommendations, unlike CPG firms, great opportunity.
• We can increase efficiency and reduce shrink through better coordination of supply and demand. This will make produce more affordable to more consumers, expand demand.

International Trade in Fresh Produce

Global Exports of Fresh Fruits and Vegetables, Million Metric Tons, 2001-‐2013E (excludes potatoes)
0
20
40
60
80
100
120
2001 2002 2003 2005 2007 2008 2009 2010 2011 2012 2013E
Fruit Vegetables
106.8
65.1
Source: Compiled by Jan Kees Boon of Fruit & Vegetable Facts u;lizing data from Eurostat and UN Comtrade (HS codes fruit: 0803-‐0810; vegetables: 0702-‐0709)

0 2,000 4,000 6,000 8,000
10,000 12,000 14,000 16,000 18,000
Thou
sand
s
Imports: Fresh Veg
Imports: Other Fresh Fruit
Imports: Bananas/plantains
Exports: Fresh Veg
Exports: Fresh Fruit
US Fresh Produce International Trade: Imports and Exports, by Key Category, $Millions US, 1994-2014
Source: US GATS online queries, BICO-10.

Fresh fruit and vegetable imports as a share of US fresh utilization/consumption, 2013/14* (despite rising imports most of US consumption is still produced here)
Item %
Vegetables, excl. melons and potatoes Melons Potatoes
28 33 9
Fruit, all Excluding Bananas
52 35
Source: Economic Research Service, USDA. *2014 for vegetables and potatoes; 2013 for melons and fruit.
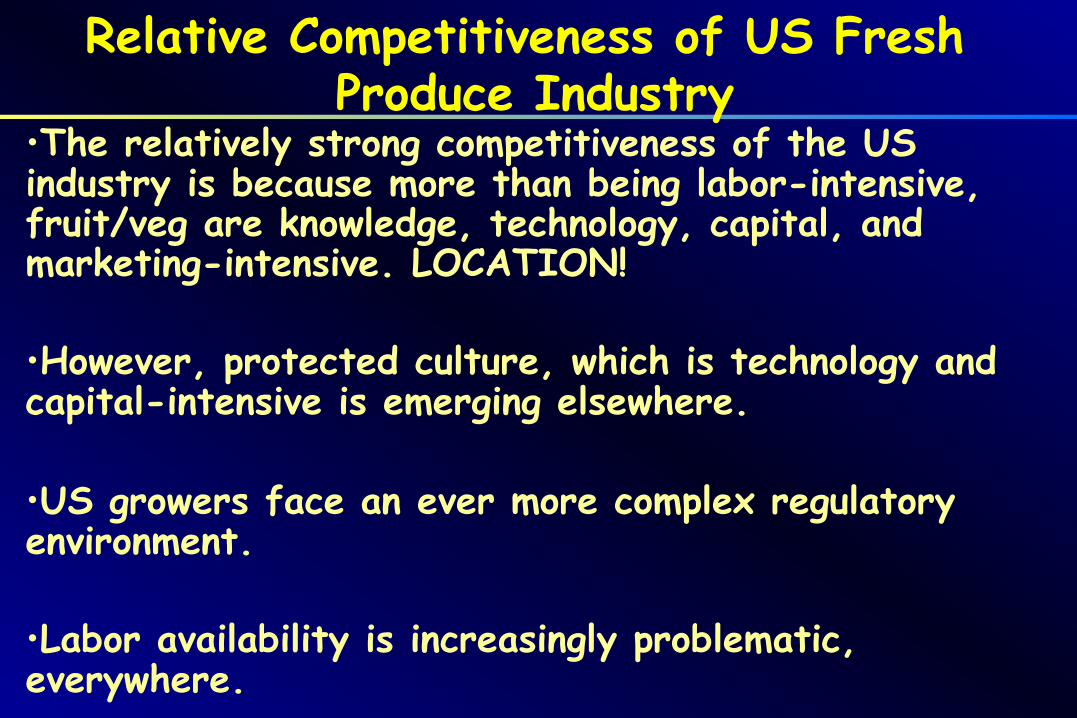
• The relatively strong competitiveness of the US industry is because more than being labor-intensive, fruit/veg are knowledge, technology, capital, and marketing-intensive. LOCATION!
• However, protected culture, which is technology and capital-intensive is emerging elsewhere.
• US growers face an ever more complex regulatory environment. • Labor availability is increasingly problematic, everywhere.
Relative Competitiveness of US Fresh Produce Industry
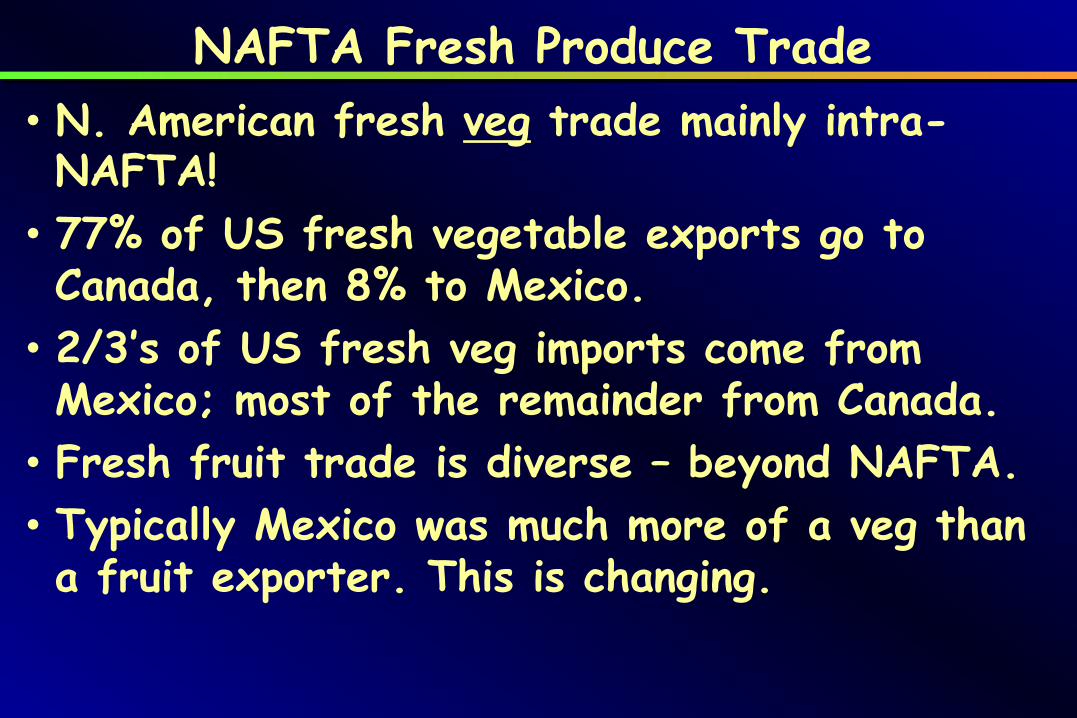
• N. American fresh veg trade mainly intra-
NAFTA! • 77% of US fresh vegetable exports go to Canada, then 8% to Mexico. • 2/3’s of US fresh veg imports come from Mexico; most of the remainder from Canada. • Fresh fruit trade is diverse – beyond NAFTA. • Typically Mexico was much more of a veg than a fruit exporter. This is changing.
NAFTA Fresh Produce Trade
0
1,000
2,000
3,000
4,000
5,000
6,000
7,000
8,000
9,000
1993 1995 1997 1999 2001 2003 2005 2007 2009 2011 2013
Thou
sand
s
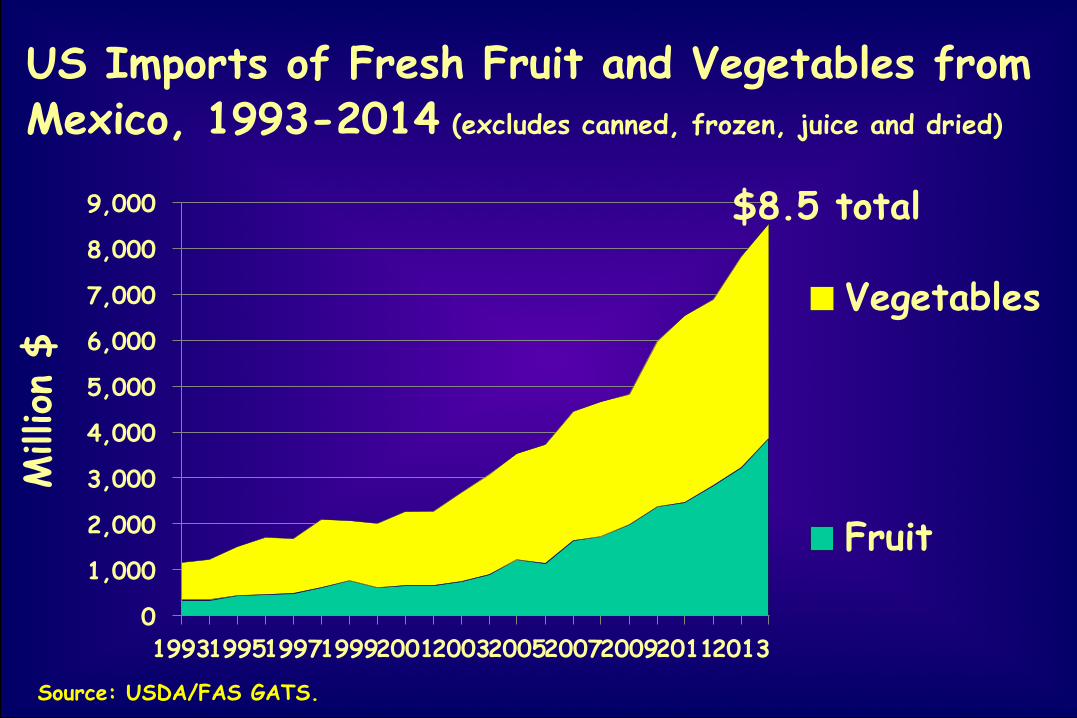
Vegetables
Fruit
Million
$ US Imports of Fresh Fruit and Vegetables from Mexico, 1993-2014 (excludes canned, frozen, juice and dried)
Source: USDA/FAS GATS.
$8.5 total
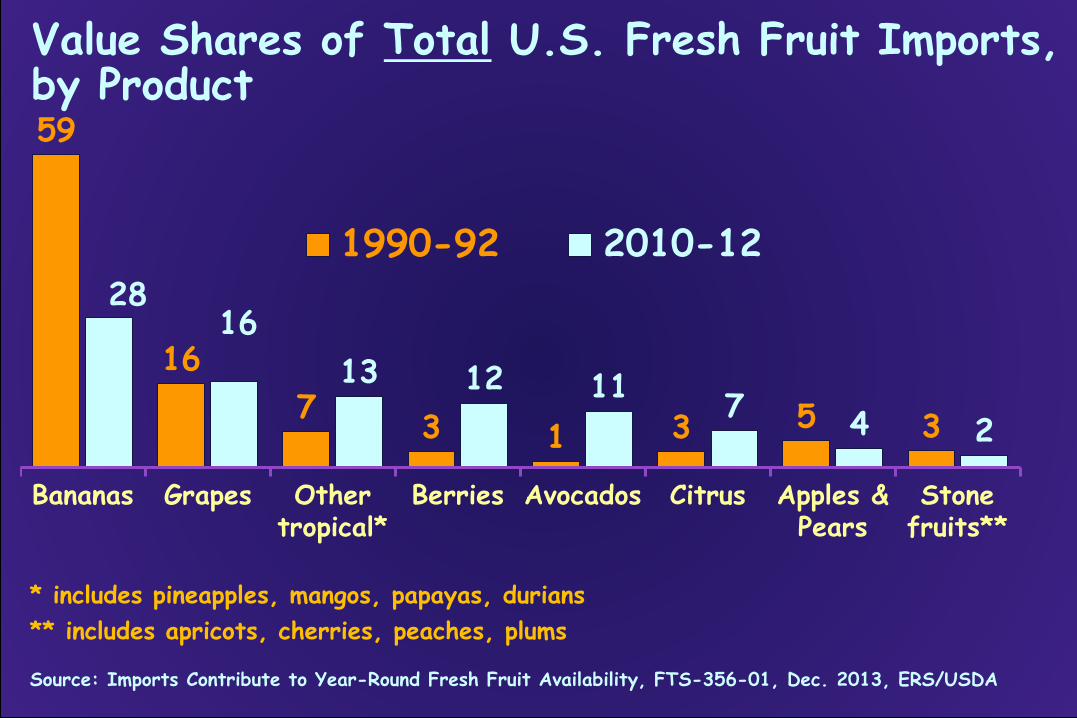
Value Shares of Total U.S. Fresh Fruit Imports, by Product
Source: Imports Contribute to Year-Round Fresh Fruit Availability, FTS-356-01, Dec. 2013, ERS/USDA
59
16 7 3 1 3 5 3
28 16
13 12 11 7 4 2
Bananas Grapes Other tropical*
Berries Avocados Citrus Apples & Pears
Stone fruits**
1990-92 2010-12
* includes pineapples, mangos, papayas, durians ** includes apricots, cherries, peaches, plums

Value Shares of Total U.S. Fresh Fruit Imports, by Region: Mexico Wins!
Source: Imports Contribute to Year-Round Fresh Fruit Availability, FTS-356-01, Dec. 2013, ERS/USDA
56
23 13
3 5
34 26
33
3 5
Equatorial countries*
Southern Hemisphere countries**
Mexico Canada Others
1990-92 2010-12
* Equatorial countries include Costa Rica, Guatemala, Ecuador, Colombia, and Honduras ** Southern Hemisphere countries include Chile, Argentina, Peru, New Zealand, Brazil, South Africa, and Australia

Select Food Industry Trends
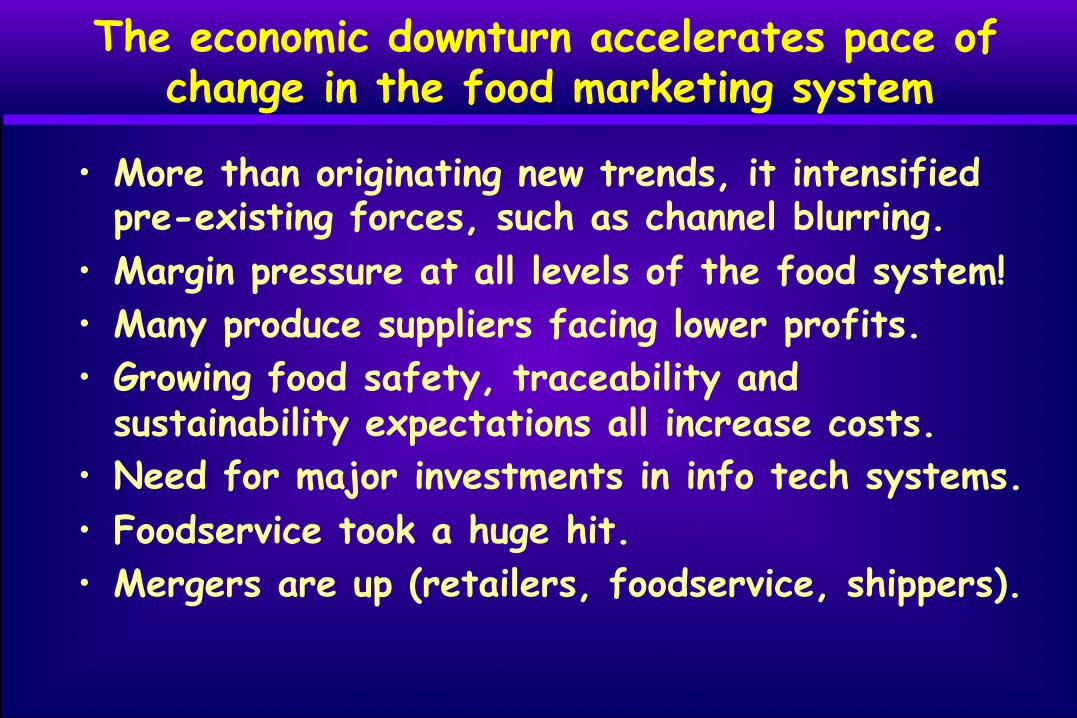
The economic downturn accelerates pace of change in the food marketing system
• More than originating new trends, it intensified pre-existing forces, such as channel blurring.
• Margin pressure at all levels of the food system! • Many produce suppliers facing lower profits. • Growing food safety, traceability and
sustainability expectations all increase costs. • Need for major investments in info tech systems. • Foodservice took a huge hit. • Mergers are up (retailers, foodservice, shippers).

US Supermarket Mergers & Acquisitions 2007-2014: Even Fewer, Larger Buyers!
Sources: The Food Institute Report, January 6, 2014; Food Industry Review 2014, The Food Institute; and The Food Institute Webinar Who's Buying Whom and What to Expect in the Future, March 3, 2015.
35
22
14 20 21 19
28
36
2007
2008
2009
2010
2011
2012
2013
2014
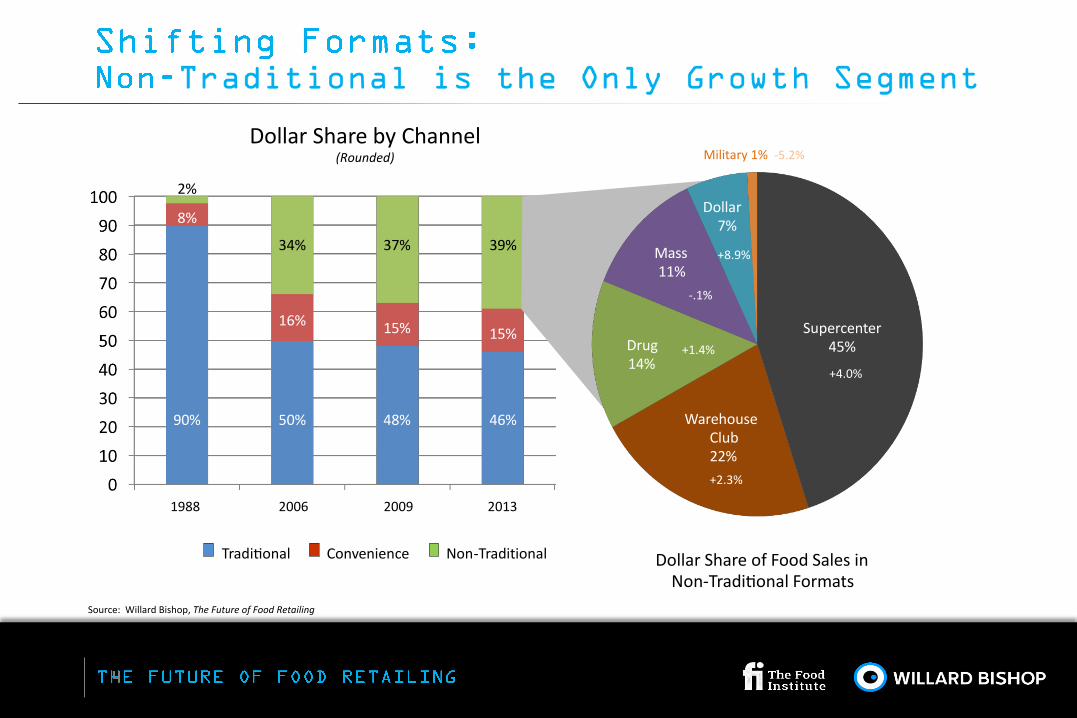
Supercenter 45%
+4.0%
Warehouse Club 22% +2.3%
Drug 14%
Mass 11%
Dollar 7%
+8.9%
Military 1% -‐5.2%
Tradi;onal Convenience Non-‐Traditional
90% 50% 48% 46%
2%
8%
16% 15% 15%
34% 37% 39%
Dollar Share by Channel (Rounded)
Dollar Share of Food Sales in Non-‐Tradi;onal Formats
Source: Willard Bishop, The Future of Food Retailing
1988 2006 2009 2013
-‐.1%
+1.4%
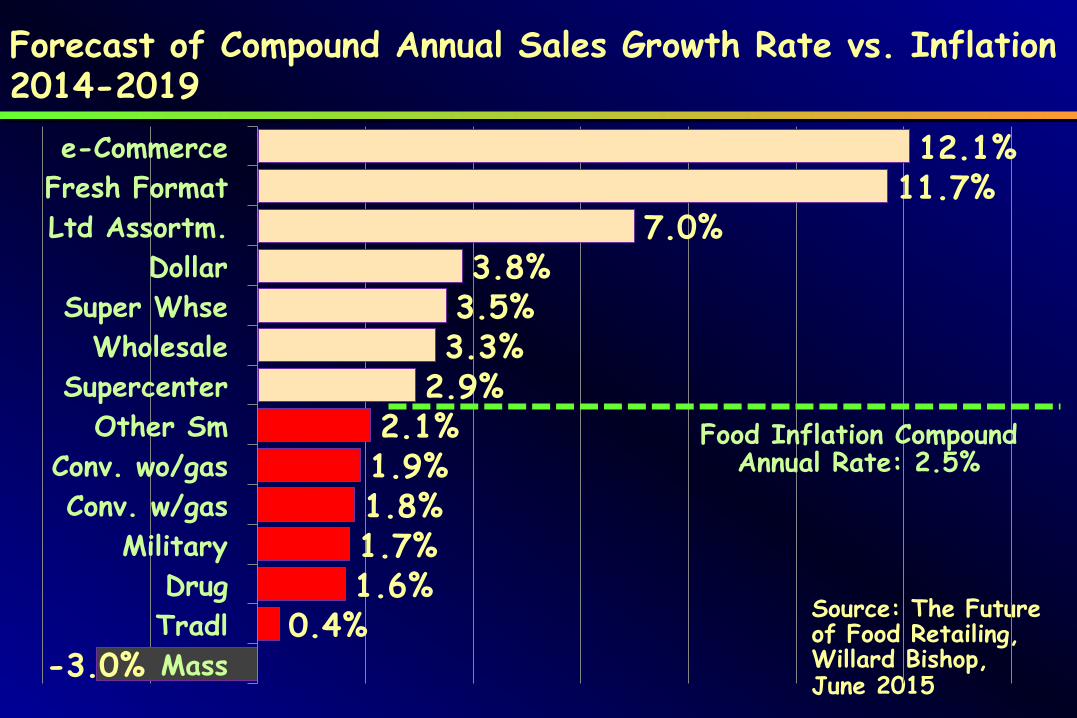
Forecast of Compound Annual Sales Growth Rate vs. Inflation 2014-2019
Source: The Future of Food Retailing, Willard Bishop, June 2015
-3.0% 0.4%
1.6% 1.7% 1.8% 1.9% 2.1%
2.9% 3.3% 3.5% 3.8%
7.0% 11.7% 12.1%
Mass Tradl Drug
Military Conv. w/gas
Conv. wo/gas Other Sm
Supercenter Wholesale
Super Whse Dollar
Ltd Assortm. Fresh Format e-Commerce
Food Inflation Compound Annual Rate: 2.5%

• Fresh produce has faced challenges due to the economy.
• Firms at all levels of the fresh produce supply chain must take management practices to a higher level
• Better information technology is a necessary but not a sufficient condition for meeting today’s/future standards for efficiency
• Firms must develop cultures of continuous improvement and innovation
• Understanding consumer segments as they relate to preferences for a product/retail format is vital
• Competitive pressure on retailers means on-going margin pressure for suppliers as well.
Conclusions

Conclusions: Becoming Marketing-Driven
• Becoming customer-centric. • Next level is to become consumer-centric. • Consumer-centrism will increasingly be achieved via supplier-customer partnerships. • Suppliers and customers must choose strategic partners – align with those who will succeed in the marketplace