the dynamic impacts of electric vehicle integration on the
TRANSCRIPT

i
THE DYNAMIC IMPACTS OF ELECTRIC VEHICLE INTEGRATION ON THE ELECTRICITY DISTRIBUTION GRID by RUI SHI A thesis submitted to The University of Birmingham for the degree of MASTER OF PHILOSOPHY
School of Electronic, Electrical and Computer Engineering The University of Birmingham November 2012

ii
To my parents

1 / 86
ACKNOWLEDGEMENTS
First and foremost, I would like to express my sincere appreciation to my supervisor,
Professor Xiao-Ping Zhang, for his support, guidance, inspiration and patience during my
study. I have greatly benefited from his knowledge and experience.
I am also grateful to Dr. Gan Li and Dr. Dechao Kong for their support and advices on my
research. Many thanks to Mr. Zhou Li and Mr. Xuan Yang, Mr. Suyang Zhou for sharing
their valuable ideas with me. I would also like to thank my dear colleagues Miss Na Deng, Mr.
Jingchao Deng, Mr. Puyu Wang, and Mr. Jianing Li for their discussions and kind assistance
during my study.
Finally, I would like to thank my families and all my friends. Without their encouragement,
support and understanding, completion of my thesis would not be possible.

2
ABSTRACT
This thesis is mainly concerned with the modeling of electric vehicle charging station
and its dynamic interactions with distribution grid.
The thesis starts with the literature review of the technical developments in wind
generation and electric vehicle integration into power grids. Then the equivalent
model of electric batteries is developed and implemented in MATLAB/Simulink. The
model is used to evaluate the terminal voltage and power variation during the battery
charging and discharging periods. The concept of electric vehicle fast charging station
is summarized and its detailed simulation model is designed for the integration of the
electric vehicle batteries with the distribution network. In addition, the modeling of a
wind turbine with DFIG is presented. As a wind generator requires the fault
ride-through ability, crowbar protection is considered in the simulation model.
Based on the above, the interactions between electric vehicle charging stations and
active distribution grid with wind turbines are investigated. The focus is to examine
the possibility of bi-direction power flow control capability of EV charging stations in
providing the voltage support for distribution network operations to improve the
fault-ride-through of adjacent wind turbines. Simulations are used to illustrate the
feasibility as well as the effectiveness of the proposed control concept. Potentially
such voltage support from EV charging station can be developed as ancillary services
in smart distribution grid operations.

3
TABLE OF CONTENTS
Chapter 1 Introduction ................................................................... 9
1.1 Background ................................................................................................. 9
1.1.1 Electric Vehicle Popularization ....................................................... 10
1.1.2 Wind Generation Development ....................................................... 12
1.2 Literature Review ..................................................................................... 15
1.3 Dissertation Outline .................................................................................. 18
1.4 Contributions and objectives ................................................................... 19
1.4.1 Contributions ...................................................................................... 19
1.4.2 Objectives ........................................................................................... 19
Chapter 2 Modeling of Electric Vehicle Batteries and Electric
Vehicle Fast-Charging Stations in the Distribution Network .... 21
2.1 Electric Vehicle Fast-Charging Station Design ......................................... 21
2.1.1 The Concept of Electric Vehicle Fast-Charging ................................. 21
2.1.2 Fast-Charging Station Design. ............................................................ 22
2.2 Modeling of Battery in Power Systems ...................................................... 24
2.2.1 Transient Model of Li-ion Battery ...................................................... 24
2.2.2 Case Studies ........................................................................................ 27
2.3 Summary ....................................................................................................... 31
Chapter 3 Modeling of Wind Power Generation with Fault
Ride-through Ability in Electricity Distribution Networks ....... 33

4
3.1 Introduction .................................................................................................. 33
3.1.1 Review on Modelling of DFIG with Wind Turbine ........................... 33
3.1.2 Wind Generator Fault Ride-through Ability ....................................... 36
3.2 Modelling Wind Turbine with DFIG ......................................................... 37
3.2.1 Modelling of DFIG ............................................................................. 37
3.2.4 Modelling of Converter Controller on Rotor Side .............................. 44
3.2.5 Modelling of Grid Side Converter Controller ..................................... 46
3.2.6 Pitch Controller ................................................................................... 47
3.2.7 Integration with Power Grid ............................................................... 48
3.3 Wind Turbine Simulations in MATLAB/SIMULINK ............................. 49
3.3.1Wind Turbine Model ............................................................................ 49
3.3.2 Induction Machine Model ................................................................... 49
3.3.3 Grid Side Converter ............................................................................ 50
3.3.4 Rotor Side Converter .......................................................................... 50
3.3.5 Crowbar Protection System ................................................................ 50
3.4 Numerical Examples .................................................................................... 51
3.4.1 Test System Description ..................................................................... 51
3.4.2 Simulation Results .............................................................................. 52
3.4 Summary ....................................................................................................... 54
Chapter 4 The Interaction between Fast-Charging Stations and
Wind Turbines in Distribution Networks .................................... 56
4.1 Introduction .................................................................................................. 56

5
4.2 Bidirectional Power Transfer between Electric Vehicle and Distribution
Grid 57
4.2.1 Interaction between Distribution Grid and Charging Station ............. 57
4.2.2 Control Strategy of Electric Vehicle Charging Station ....................... 59
4.3 Introduction of Active Distribution Network ............................................ 61
4.4 Simulation Results ....................................................................................... 62
4.5 Summary ....................................................................................................... 65
Chapter 5 Conclusions and Future Work ................................... 66
5.1 General Conclusions .................................................................................... 66
5.2 Future Work ................................................................................................. 67
References ....................................................................................... 69
Appendix Simulation System Configuration and Parameters .. 78
A.1 Simulation Configuration for Chapter 2 ............................................... 78
A.1.1 System Simulation Configuration .................................................... 78
A.1.2 Charging Station Simulation Configuration. ................................... 78
A.1.3 System Parameters ........................................................................... 78
A.2 Simulation Configuration for Chapter 3 ............................................... 79
A.2.1 System Simulation Configuration .................................................... 79
A.2.2 System Parameters ........................................................................... 79
A.3 Simulation Configuration for Chapter 4 ............................................... 79
A.3.1 System Simulation Configuration .................................................... 79
A.3.2 Charging Station Configuration ....................................................... 80

6
A.3.3 System Parameters ........................................................................... 82
List of Publications ........................................................................ 84

7
LIST OF FIGURES
Figure 1-1 The Estimated Global Alternative-Energy Vehicle Map in 2020 ...... 11
Figure 1-2 UK installed Wind Power Capacity (in MW) .................................... 13
Figure 2-1 The Structure of the Charging Circuit ................................................ 23
Figure 2-2 The Control Strategy for the AC-DC Rectifier .................................. 23
Figure 2-3 The Equivalent Circuit of a Li-Ion Battery ........................................ 25
Figure 2-4 The System Layout ............................................................................ 27
Figure 2-5 The DC voltage on the AC-DC Rectifier of CS1 in Case 1 ............... 28
Figure 2-6 The AC Voltage Profile (RMS value) at CS1 in Case 1 .................... 29
Figure 2-7 The AC Current Profile at CS1 .......................................................... 29
Figure 2-8 The AC Voltage Profile at CS2 in Case 2 .......................................... 30
Figure 2-9 The Current Profile at CS2 in Case 2 ................................................. 30
Figure 2-10 The Current Profile at CS2 in Case 3 ............................................... 31
Figure 2-11 The AC Voltage Profile at CS2 in Case 3 ........................................ 31
Figure 3-1 Fault Ride through Requirement in UK National Grid’s Grid Code . 37
Figure 3-2 The Equivalent Circuits for the DFIG ................................................ 38
Figure 3-3 Configuration of the Drive Train ....................................................... 41
Figure 3-4 The Back-to-back Converter of DFIG ............................................... 43
Figure 3-5 Control Block Diagram of the Rotor Side Converter ......................... 45
Figure 3-6 Control Block Diagram of Grid Side Converter of DFIG .................. 46
8
Figure 3-7 Blade Pitch Control for WT with DFIG ............................................. 47
Figure 3-8 The Relationship between d-q and x-y Frame of Reference .............. 48
Figure 3-9 Electricity Network Diagram ............................................................. 52
Figure 3-10 Voltage Profile at Bus 575 ............................................................... 53
Figure 3-11 Voltage Profile of the DC-link ......................................................... 53
Figure 3-12 Reactive Power Profile of the Wind Farm ....................................... 54
Figure 4-1 Charging Station Structure ................................................................. 58
Figure 4-2 The Interaction between the Grid and the Inverter ............................ 58
Figure 4-3 Control System Diagram. ................................................................... 60
Figure 4-4 A Comparison of Passive and Active Distribution Networks ............ 62
Figure 4-5 Test Electricity Distribution Grid (load in MW) ................................ 63
Figure 4-6 Voltage Profile at B2 with no Charging Station Installed .................. 63
Figure 4-7 Voltage Profile at Bus 2 with Charging Station Installed at Bus 5 .... 64
Figure 4-8 Voltage Profile at Bus 2 with Charging Station Installed at B6. ....... 65
9
Chapter 1 Introduction
Abstract
In this Chapter, the motivation for the research topics of this thesis on the dynamic
impacts of electric vehicles on the distribution grid is presented at first. Then a
literature review is carried out on research topics of electric vehicles and wind
generation as well as their current developments. Finally the organization of this
thesis is also outlined and the main contributions are described.
1.1 Background
The first industry revolution originated from the UK in the mid-19th century, as the
steam-powered energy conversion technology replaced the conventional handcraft in
the industrial production. Then, in the first decade of the 20th century, electrical
power and electrical communication emerged along with the oil-powered internal
combustion engine, giving rise to the second industrial revolution. Since late 20th
century, the Internet technology and renewable energy marked the rise of the third
industrial revolution. Distributed communication revolution converges with a new
distributed energy via smart inter-connections. Three industrial revolutions push the
social productivity to an unprecedented high level, but it also brings about many
negative influences on the environments due to the lack of rational exploitation and

10
utilization of fossil fuels and unsustainable energy production and consumption [1].
On the other hand, the limited mineable reserves of fossil fuels and their unbalanced
distribution also led to three times of global energy crises during last century. In
regarding the response to the crisis, the international community has reached an
agreement that it is necessary to reform the existing mode of energy production and
consumption, which relies on fossil fuels, to a sustainable mode with clean alternative
energy sources and low carbon emissions [2]. On the energy supply side, various
renewable generation sources are integrated into the power grid, such as solar energy,
tidal energy, and especially wind energy, whose penetration steadily grows [3]; On
the energy demand side, electric vehicles are becoming more and more popular due to
their advantages such as low exhaust emissions and high energy efficiency. The
marketplace of electric vehicles is emerging in both developed and developing
countries in recent years [4].
1.1.1 Electric Vehicle Popularization
An electric vehicle is an automobile that is propelled by its electric motor, and
equipped with a certain electric energy storage infrastructure onboard [5]. Electric
vehicles have advantages in energy efficiency and exhaust emission compared with
conventional internal combustion based automobiles [6]-[7].
In recent years, electric vehicles have been drawing great attentions from both the
governments and the public in their development and popularization. For example, in
the U.S., a series incentive policies have been launched by the government for both

11
customers and manufactures, so that a mature domestic market can be formulated in
around 2015~2017, with potential sales of 1 to 1.5 million plug-in hybrid electric
vehicles [8]; As for China, the second largest vehicle market, the government also
emphasizes its electric vehicle industry as one of the promising industry, it is
committed to establish a public transportation system based on electric vehicles [9]; In
late 2008, the European Commission launched the “European Green Cars” project
while the European Investment Bank offered an initial budget of €5 billion. Figure 1-1
is the forecast of electric vehicle market in 2020 [10].
Figure 1-1 The Estimated Global Alternative-Energy Vehicle Map in 2020
On the other hand, public infrastructures for large-scale charging should be
established in order to offer rapid and convenient services for the consumers to
support the popularization of electric vehicles. For example, the ChargePoint America
project in the U.S. is aimed at building some 5,000 charging stations to provide
charging services [11]; Moreover, the Multi-state Electric Vehicle Project is aimed at

12
building 15,000 charging points in 16 major cities and metropolitan areas in 6 states
[12]. In China, according to the three-step development plan of the State-Grid
Corporation, 75 charging stations and 6,209 charging poles had been built during
2009-2010, then 4,000 charging stations are being built in the next 5 years and finally
a complete interconnected charging network consisting of 10,000 charging stations
will be established by 2020 [13]. European governments have also proposed a series
of promotional plans for electric vehicles. For examples, the French government has
planned to establish a national wide electric vehicle charging network containing over
4 million charging points by 2020 [14]; in the UK, more than 25,000 charging points
will be installed across London as well as other cities by 2015[15].
1.1.2 Wind Generation Development
The popularization of electric vehicles will need to consider an optimization on the
power demand side for environment protection and sustainability, while the power
supply side is also undergoing a reform, which is represented by the rapid
development of wind generation.
Wind energy is considered to be clean, safe and sustainable, which now dominates the
position in the new energy area. The origin of wind energy utilization can date back to
the 19th century, when windmills were developed to extract the kinetic energy
existing in wind flows as mechanical energy. Then the first wind generator was
invented sooner and the first wind farm was built in Denmark in the late 19th century.
During 1970s-1980s, in order to overcome the energy crisis, great attention was paid

13
on sustainable energy, during this period, the first 55 kW wind generator was
developed, representing a breakthrough in modern wind power industry [16]. From
then on, not only the capacity of a wind generator reaches kW and MW levels but also
the requirements on reliability and efficiency of a wind generator become essential
[17].
In recent years, worldwide installed wind power capacity reached 239 GW by the end
of 2011, among which the five leading countries are China, USA, Germany, Spain
and India, together representing a total share of 74% of the global wind capacity [18].
UK, as the windiest country in Europe, has been exploiting wind resources since the
beginning of the 21th century as shown in [19]:
Figure 1-2 UK installed Wind Power Capacity (in MW)
The installed wind power capacity is expected to continue growing in the UK for the

14
foreseeable future, especially for offshore wind power, because UK has been
estimated to have over a third of Europe’s total offshore wind energy resource. In fact,
UK government plans 13GW of installed offshore wind power capacity by 2020, and
had completed 3 rounds of project biddings for offshore wind farms since 1998.
Currently, UK has 1.86GW of operational nameplate capacity, with a further 2.05GW
under construction [19].
Because of the inherent fluctuation and intermittence of wind energy, the large
integration of wind power generation led to a large amount of negative effects on the
power system in stability, reliability and power quality [20]. Due to these
shortcomings, wind power generation is not as reliable or controllable as the
conventional thermal power generation, so extra reserve capacity should be equipped
with the wind power generators from the prospective of power system reliability. On
the other hand, early wind generators draw reactive power during their operation,
which mainly used for voltage regulation in modern wind power generator.
With the popularization of electric vehicles in the transportation system, the electrical
energy sector will encounter a dramatic change due to this important and expected
issue. The impact of electric vehicles on power systems mainly occurs on the demand
side [21]-[22]: The number of electric vehicles directly determines the degree of their
impact on power grids. With the rapid growth of electric vehicles in recent years, their
overall charging demand will become an important part of system loads.
It has been discovered that a high penetration of electric vehicles will increase
15
electricity consumption during their charging periods, which could lead to
considerable change in the power flows, grid losses, and voltage profile patterns of
the power grid.
It is also found that the amount of intermittent renewable energy resources that can be
safely integrated into the power system may increase due to the proper utilization of
distributed electric vehicle storage capacity [23]. When the primary renewable energy
resources are available, electric vehicles can be charged to store energy and inject it
into system later when necessary. In this way, the spillage of clean energy in the
system could be avoided, so that the usage of the conventional fossil fuel units and
expensive generating units could be decreased during peak hours [24]. This will also
reduce pollutant emissions and generation costs.
1.2 Literature Review
The electric vehicle is generally made up of a drive train that at least contains an
electrical motor, a battery storage system and/or a means of recharging the battery
from an external source of electricity [23]. Its battery capacity usually ranges from
several kWh or tens of kWh to power the vehicle in all electric drive mode for several
tens of miles [24]. Moreover, an electric vehicle may have an internal combustion
engine as well, in order to extend its drive range when it runs out of its battery [25].
Research on the impact of electric vehicle charging on the power grid dated back to
the 1980s. It was discovered that the charging demand of electric vehicles tends to

16
coincide with the overall peak load [26]. Therefore, when the penetration of electric
vehicles increases, it is necessary to manage their charging demand, in order to avoid
significant increase of the overall peak load [27]-[28]. Later, the so-called smart
charging was proposed, whose target is to optimize the charging process of electric
vehicles [29]-[34]:
A control strategy was proposed in [29] to minimize the energy consumption of
electric vehicle charging in a residential use case. Another two strategies were
presented in [30] to control the charging time and energy flows of an electric car,
considering forecasted electricity price and system auxiliary service. In [30]-[31], the
potential benefits of electric vehicles as some type of auxiliary service were discussed,
and a conceptual framework for implementation was presented in [32]-[33].
However, though smart charging has demonstrated a good potential in the future
smart grid, currently most consumers in reality still prefer to charge their electric
vehicles as fast as possible. In this situation, smart charging control should not
interfere with their daily drive profile [31]-[34]. On the other hand, the fast
developing rapid charging techniques are [35] attracting more electric vehicle
consumers. Moreover, the implementation and integration of smart charging in a
system wide scale is still a long-time work in future. Therefore, currently it is still
necessary to assess the impact of uncontrolled charging of electric vehicles on the
power system.
The impact of electric vehicle charging on the power grid can be evaluated by such as

17
thermal loading, voltage regulation, phase unbalance, power losses, harmonic
distortion, and etc. [36]. These are typical metrics for both systemic and component
based analysis. Based on this, modeling of power grid components, electric vehicles,
and their integration, which reflects the above key physical quantities, becomes
important. When electric vehicles are charged, this means increased loading to the
distribution grid; when electric vehicles are discharged, this means decreased loading
to the system. This two operating scenarios of electric vehicles would have impacts
not only on the distribution grid as a whole but also on the system components.
Distribution system power loss was evaluated in [32], where load factor and variation
based objective functions were formulated. It has been proved that minimizing the
power losses is equivalent to maximizing the load factor while maximizing the load
factor is further equivalent to minimizing load variation.
An interesting aspect of electric vehicles is the possibility of integrating the vehicle to
grid (V2G) concept into the utility grid. Basically V2G has three key elements: an
interface to the distribution grid with energy flow; a control unit built for
communication; smart metering used in vehicles [37].
It has been found that the wind profile in New York matches electric vehicles
charging characteristics quite well [38]. This conclusion is based on 2 assumptions:
electric vehicles can be charged during the periods when power supply is mainly wind
power, while the V2G technology is employed to store energy in these vehicles.
When the power supply is not adequate, the V2G technology enables the electric

18
vehicles as distributed generators to stabilize the power grid with less costs and
energy losses.
This means that the V2G operation takes place at the moment of high demand while
G2V operation happens at the times of low demand. In [39], grid power loss was
reduced by minimizing the power transferred from the slack node to the outer-most
node in the system during peak load periods. On the other hand, the energy storage
from electric vehicles can be used to feed power back to grid via the node, where the
electric vehicles are connected. In principle, due to the radial topology of distribution
grids, the closer to the root node of the distribution grid, the smaller the impact of the
electric vehicle will be on the distribution grid.
1.3 Dissertation Outline
The outline of the dissertation is as follows:
Chapter 2: The equivalent model of electric batteries is developed, in order to evaluate
the terminal voltage and power variation during the battery charging and discharging
periods.
The concept of electric vehicle fast charging station is summarized and its detailed
simulation model is designed to connect the electric vehicle batteries with the
distribution network.
Chapter 3: A dynamic model of a wind turbine (WT) of the double fed induction

19
generator (DFIG) is formulated. Fault ride through ability is tested in this model.
Chapter 4:The active distribution system is proposed. And the interaction between
electric vehicle and distributed wind power generator is investigated in the
distribution system when a fault applied in the active distribution system.
Chapter 5: Conclusions are drawn.
1.4 Contributions and objectives
1.4.1 Contributions
Detailed models for the conventional Lead-acid battery and lately popularized Li-ion
battery used for an electric vehicle are proposed for power system transient analysis.
A simulation model for the fast charging station is designed, and corresponding
control strategy is developed. The system dynamic profile is presented when electric
vehicles are integrated into the distribution system.
A detailed model for DFIG (Double Fed Induction Generator) WT including fault ride
through protection is presented. The fault test is also carried out based on this model.
The interaction of wind power generation and electric vehicle charging/discharging is
tested in a proposed active distribution network. The system dynamic characteristics
are described when a fault is applied in the system.
1.4.2 Objectives
Work has been down to achieve the goals as following,

20
Building an appropriate model to reflect the electrical characteristics of distributed
energy resources (EVs and wind generators) in simulation software.
Investigating the dynamic impacts on power quality when integrating large scales EV
charging stations into distribution networks.
Investigating the reliability of active distribution network with distributed energy
resources (DERs).

21
Chapter 2 Modeling of Electric Vehicle Batteries and Electric Vehicle
Fast-Charging Stations in the Distribution Network
Abstract: In this chapter, firstly the concept of fast charging is introduced, and then
the simulation model of an electric vehicle fast-charging station is designed. Accurate
models of typical electric vehicle onboard batteries are built for power system
transient analysis. Case study is carried out at the end of this chapter with the
integration of the charging station into the existing distribution system.
2.1 Electric Vehicle Fast-Charging Station Design
2.1.1 The Concept of Electric Vehicle Fast-Charging
Fast-charging means that the battery consumes a higher voltage or higher current in
order to get fully charged in a relatively short time (e.g., less than 60 minutes). The
progress of fast-charging can be divided into three steps:
Step 1: This phase is called constant-current charging when the battery is charged at
a constant current, until its terminal voltage approaches the gassing voltage
[40];
Step 2: This phase is called constant-voltage charging, in this period, the battery is
charged at a constant voltage, and this charging voltage is equivalent to the
gassing voltage mentioned last paragraph. In the first charging period, when

22
the battery consuming high charging current, its terminal voltage and internal
resistance keep increasing. After the first charging phase finishes, the battery
voltage is maintained. However, due to the increasing internal resistance of
the battery, the charging current is gradually decreased.
Step 3: When the charging current decreases to a particular value (e.g., 0.015C [41].
C is the unit of charging rate, 1C means the battery require 1 hour to get fully
charged), the charger will keep this current value until the battery is fully
charged.
2.1.2 Fast-Charging Station Design.
According to the battery characteristics and the charging principles [42], an electric
vehicle consuming high voltage and large DC current should meet the requirements of
fast-charging. The charging circuit of a charging station usually consists of an AC-DC
rectifier connecting the charging station with the distribution network, and a DC-DC
converter connected in series with the AC-DC converter to obtain the rated DC
voltage [43]. In this chapter, an IGBT-based AC/DC rectifier and a common DC/DC
buck converter are adopted for certain reasons, which will be discussed later. The
structure of the charging circuit is shown in Figure 2-1:

23
AC-DC Rectifier DC-link DC- DC
Converter
AB
C
Battery Station
Figure 2-1 The Structure of the Charging Circuit
The AC-DC converter is configured as a two-level, three-phase half-bridge containing
6 pairs of IGBTs and diodes controlled by PWM firing signals. Its controller employs
two PI regulators to control the output DC voltage while maintaining a unity input
power factor for the AC power supply. The detailed control diagram is shown in
Figure 2-2:
0
Vabc
Iabc
PLL S in_cos
Id
Iq
Vd
Vdc_ref
Vdc
P I
P ID
P ID0
Iq_ref
Vq
Kq
Kd
Ud
Uq
Ua
Ub
Uc
DQ Inverse T ransfe
r
PWMGenerator
mDQ Transfer
Id_ref
Figure 2-2 The Control Strategy for the AC-DC Rectifier
As shown above, the AC-DC rectifier is modeled in the d-q reference frame. The
measured three-phase voltages and currents are transformed into corresponding d-q

24
frame values. The voltage-oriented control (VOC) strategy is adopted, in which Vq
equals to 0. The measured value of the DC voltage is compared with its reference
value and then sent to a PI controller as Id, which is designed for the DC voltage
control. On the other hand, the reference of Iq is 0 in order to maintain the unit power
factor for input power.
2.2 Modeling of Battery in Power Systems
To estimate the accurate impact on power capacity and determine appropriate
components to evaluate these impacts, the battery model is also important to the
simulation of electric vehicles, which needs high-fidelity to achieve meaningful
simulation results.
2.2.1 Transient Model of Li-ion Battery
The output voltage of the battery can be calculated from its open-circuit voltage, and
the voltage drop resulting from its equivalent internal impedance. Accordingly, the
battery output voltage can be expressed as
)(TEZiVV eqbattocbat Δ+×−= (2-1)
where the temperature T is assumed constant, ΔE(T ) , the temperature range is equals
to zero, so it can be neglected. The open-circuit voltage of the battery strongly
depends on battery SOC (State of Charge), which can be calculated as [44]
32 321.01178.0
2156.0685.3)35exp(031.1)(
SOCSOCSOCSOCsocVoc
×+×
−×++×−×−=
(2-2)
The battery SOC can be expressed as

25
∫−= dtCiSOCSOC usablebatinit )/( (2-3)
The equivalent internal impedance of the battery consists of a series resistor (Rseries,
Rcycle) and two RC networks (RTransient_S, CTransient_S, RTransient_L and CTransient_L), as
shown in Figure 2-3 as follows
+
-Voc(SOC)
RSeries RTransient_S
CTransient_S CTransient_L
RTransient_L
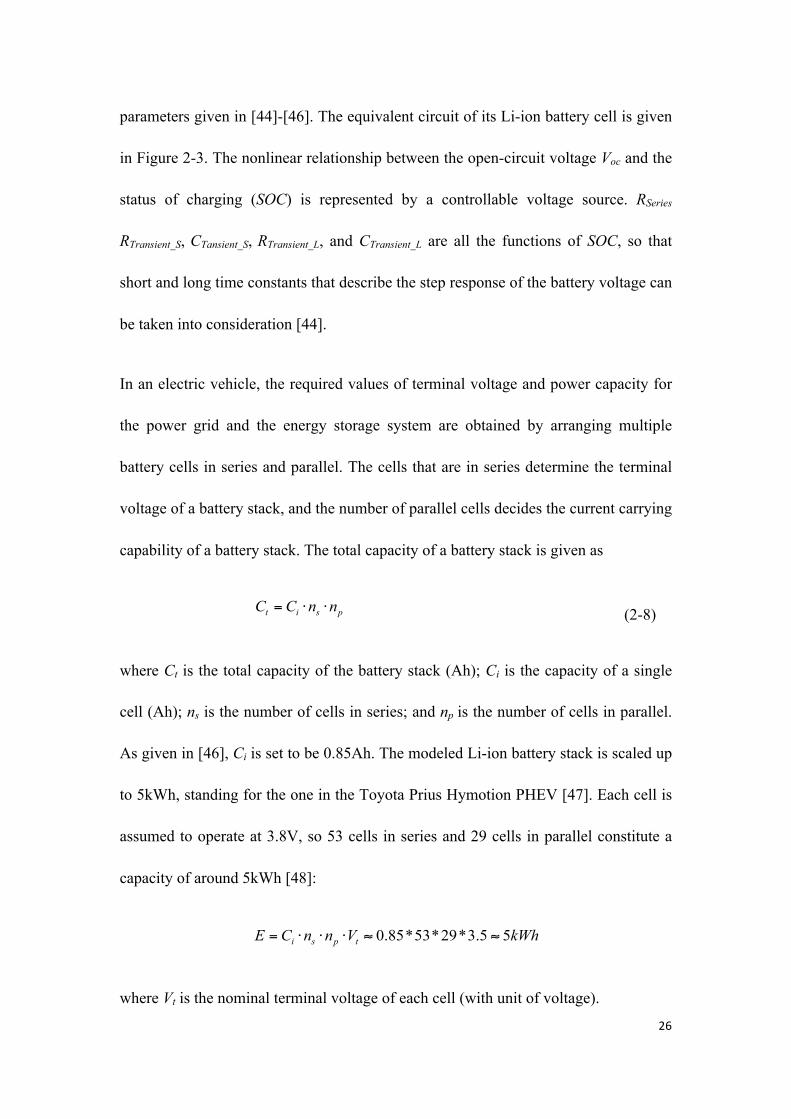
Figure 2-3 The Equivalent Circuit of a Li-Ion Battery
where RSeries is responsible for the instantaneous drop in the battery terminal voltage.
Note that, Rcycle is used to explain the increase in the battery resistance with cycling,
which is neglected in this model.
The RC components are responsible for short and long time transients in the battery
internal impedance. The values of RSeries, RTransient_S, CTransient_S, RTransient_L and
CTransient_L can be calculated from the battery SOC as following,
07446.0)37.24exp(1562.0)( +×−×= SOCSOCRseries (2-4)
04669.0)14.29exp(3208.0)(_ +×−×= SOCSOCR STransient (2-5)
6.703)51.13exp(9.752)(_ +×−×= SOCSOCC STransient (2-6)
04984.0)2.155exp(603.6)(_ +×−×= SOCSOCR LTransient (2-7)
The charging profiles of an electric vehicle is represented by the model and
26
parameters given in [44]-[46]. The equivalent circuit of its Li-ion battery cell is given
in Figure 2-3. The nonlinear relationship between the open-circuit voltage Voc and the
status of charging (SOC) is represented by a controllable voltage source. RSeries
RTransient_S, CTansient_S, RTransient_L, and CTransient_L are all the functions of SOC, so that
short and long time constants that describe the step response of the battery voltage can
be taken into consideration [44].
In an electric vehicle, the required values of terminal voltage and power capacity for
the power grid and the energy storage system are obtained by arranging multiple
battery cells in series and parallel. The cells that are in series determine the terminal
voltage of a battery stack, and the number of parallel cells decides the current carrying
capability of a battery stack. The total capacity of a battery stack is given as
t i s pC C n n= ⋅ ⋅ (2-8)
where Ct is the total capacity of the battery stack (Ah); Ci is the capacity of a single
cell (Ah); ns is the number of cells in series; and np is the number of cells in parallel.
As given in [46], Ci is set to be 0.85Ah. The modeled Li-ion battery stack is scaled up
to 5kWh, standing for the one in the Toyota Prius Hymotion PHEV [47]. Each cell is
assumed to operate at 3.8V, so 53 cells in series and 29 cells in parallel constitute a
capacity of around 5kWh [48]:
0.85*53*29*3.5 5i s p tE C n n V kWh= ⋅ ⋅ ⋅ ≈ ≈
where Vt is the nominal terminal voltage of each cell (with unit of voltage).

27
As for its implementation, the output signal of the battery stack is generated through a
Simulink model.
2.2.2 Case Studies
In this section, it is assumed that there are ten electric vehicles being charged together
in a charging station at the same time, so the total capacity of the charging station
should be no less than the summation of their rated capacity. Meanwhile, in the
realistic situation few consumers would charge an electric vehicle until the whole
battery is totally exhausted. Thus, it is assumed that the initial SOC of the battery is
20% of its rated capacity. In the simulation system shown in Figure 2-4, two charging
stations (CS1 and CS2) are connected with 400V Buses B3 and B4, respectively. The
simulation system is built and tested in Matlab/Simulink.
External Power Grid
B1(11kV)
P+jQ
Battery
11/0.4 kV
CS1
11/0.4 kV
CB CB
CS2
Line
Battery
B2(11kV)
B3(0.4kV)
B4(0.4kV)
Figure 2-4 The System Layout
Three cases are described as follows:
Case 1: CS1 and CS2 were put into operation at 2.5s simultaneously. The voltage at
28
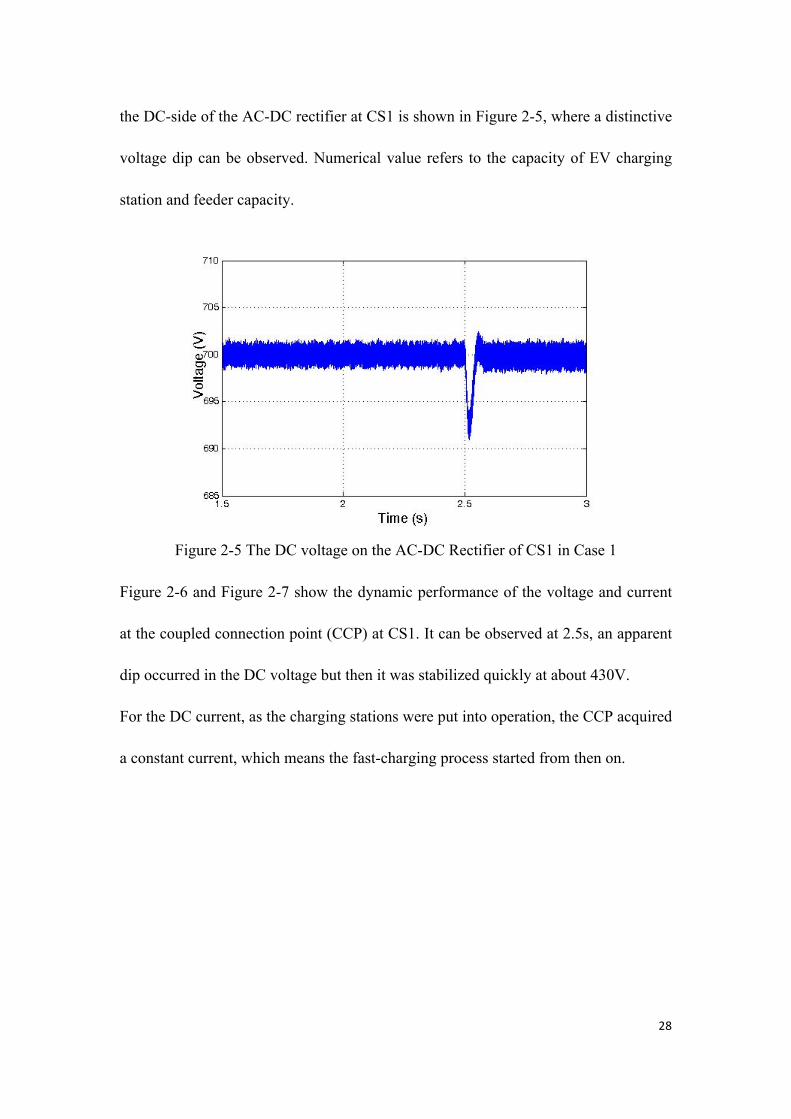
the DC-side of the AC-DC rectifier at CS1 is shown in Figure 2-5, where a distinctive
voltage dip can be observed. Numerical value refers to the capacity of EV charging
station and feeder capacity.
Figure 2-5 The DC voltage on the AC-DC Rectifier of CS1 in Case 1
Figure 2-6 and Figure 2-7 show the dynamic performance of the voltage and current
at the coupled connection point (CCP) at CS1. It can be observed at 2.5s, an apparent
dip occurred in the DC voltage but then it was stabilized quickly at about 430V.
For the DC current, as the charging stations were put into operation, the CCP acquired
a constant current, which means the fast-charging process started from then on.

29
Figure 2-6 The AC Voltage Profile (RMS value) at CS1 in Case 1
Figure 2-7 The AC Current Profile at CS1
Case 2: A permanent 3-phase short-circuit ground fault was applied at Bus B4 at 3.5s.
The current at CS2 is shown in Figure 2-9 and the reverse current was shown in the
Bus B4. The voltage at CS2 is shown in Figure 2-10.

30
Figure 2-8 The AC Voltage Profile at CS2 in Case 2
When the fault was applied, the voltage measured from CS2 decreased to a relatively
low value. During the fault, because the battery voltage was higher than the CCP
voltage, the charging mode was transferred to the discharge mode. In this situation,
the battery became a voltage source injecting power into the distribution network.
Figure 2-9 The Current Profile at CS2 in Case 2
Case 3: A transient three-phase ground fault was applied at Bus B4 at 3.5s and the
fault was cleared at 4.0s. The simulation results of the current and voltage at CS2 are
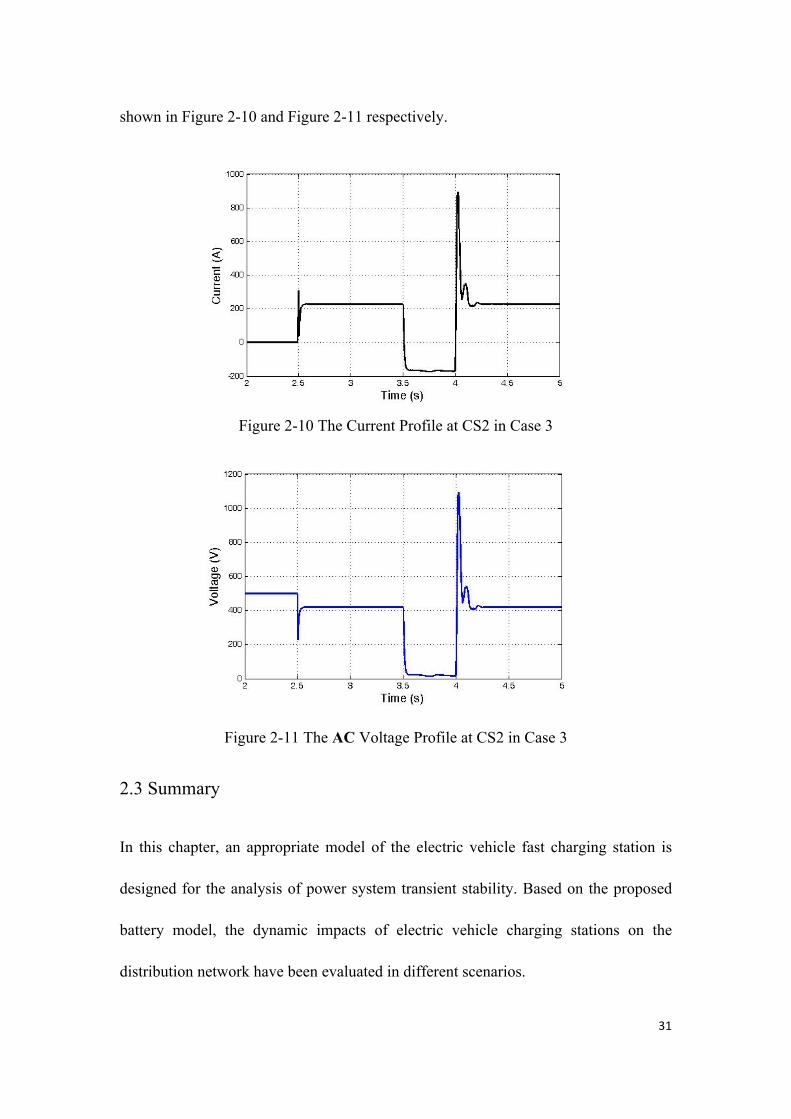
31
shown in Figure 2-10 and Figure 2-11 respectively.
Figure 2-10 The Current Profile at CS2 in Case 3
Figure 2-11 The AC Voltage Profile at CS2 in Case 3
2.3 Summary
In this chapter, an appropriate model of the electric vehicle fast charging station is
designed for the analysis of power system transient stability. Based on the proposed
battery model, the dynamic impacts of electric vehicle charging stations on the
distribution network have been evaluated in different scenarios.

32
According to the simulation results, the electric vehicles have the ability to inject
power to the utility grid when the grid fault applied, which may help to make the CCP
voltage stable and hence improve power system stability.

33
Chapter 3 Modeling of Wind Power Generation with Fault
Ride-through Ability in Electricity Distribution Networks
Abstract: In this chapter, the modeling of a wind turbine with DFIG is reviewed first.
Then an introduction to the fault ride-through ability of the wind generator is also
made in this chapter. The simulation model of the DFIG with a wind turbine is built in
Matlab/Simulink with the fault ride-through ability using the crowbar protection
principle. Case study is used to verify that the crowbar fulfills its function to prevent
excess rotor current through the rotor side converter.
3.1 Introduction
3.1.1 Review on Modelling of DFIG with Wind Turbine
The Doubly Fed Induction Generator (DFIG) is widely used in wind power generation,
in which the induction generator is assembled with a multi-phase wound rotor and a
multi-phase slip ring. The rotor winding of the DFIG is connected to the grid via slip
rings and a back-to-back voltage source converter (VSC). This converter is designed
to control the rotor current and the grid current. With its rotor currents controlled by
the converter, the active and reactive power output of such a generator can be adjusted
by varying the rotating speed of its stator.
The DFIG has several advantages over the conventional induction generator:

34
1. The DFIG has the ability to either draw or send reactive power from/to the
grid. This brings a great benefit for power system stability by allowing the
machine to support the grid operations during severe voltage disturbances (i.e.
low voltage ride-through, LVRT).
2. The control of the rotor voltages and currents will enable the induction
machine to remain synchronized with the grid while the wind turbine speed
varies. It has been recognized that the variable speed wind turbine is more
efficient than a fixed speed wind turbine, especially when the wind speed is
low.
3. The cost of the power electronic converter is lower than other solutions for
the variable speed wind turbine, because only part of the mechanical power
(typically 25%-30%) is fed to the grid through the converter, while the rest is
fed to the grid directly from the stator.
A DFIG is typically given as a fifth-order dynamic model considering both the
electromagnetic transients of the stator and the flux transients of the rotor [48] -[49].
By neglecting the stator electrical dynamics, such a fifth-order dynamic model of
DFIG with a wind turbine can be reduced to a third-order one. If the rotor electrical
dynamics are further neglected, a reduced first-order dynamic model can be obtained
[50].
The dynamic DFIG models of different orders have been compared in [51].The results
have indicated that under the torque disturbance, the responses of the fifth-order

35
model and the third-order model are similar, while that of the first-order model is
different.
The validation of the dynamic models of the DFIG has been made in [52] [52]. The
comparison has shown that the dynamics of the DFIG can be formulated properly by
the fifth-order model. Therefore, such a detailed model has been well widely used in
the dynamic simulation of the DFIG and its controllers’ design [53].
In principle, if the dynamics of the Wind Turbine (WT) with DFIG is concerned, then
the detailed model is preferred, while the third-order model becomes more attractive
in the classical electro-mechanical dynamic studies of large power systems [54].
Basically, the DFIG is driven by the drive train of the WT system. Such a driven train
is generally composed of a turbine, a gearbox, shafts and some other mechanical
components. We assume here that the gearbox and the high speed shaft are infinitely
stiff, the drive train can be represented by a two-mass model, including the turbine
and the generator [55]. In some cases, the drive train can be lumped together into an
equivalent mass model [56]-[57].
For the large-scale wind farm, aggregated models for the wind farm have been
proposed to reduce the simulation time. In [58], an equivalent one-machine model
was developed to represent the wind farm. It can be used to represent the wind farm
only when all the wind turbines are operated under the same or similar condition.
Otherwise, the detailed multi-machine model should be employed due to the effects of

36
irregular wind distribution and geographical distribution of the wind turbines [59].
3.1.2 Wind Generator Fault Ride-through Ability
Wind turbines are required to have the ability to remain connected with the electric
grid, when the grid voltage temporarily drops due to a certain fault or change in the
grid. This is defined as the so-called low voltage ride through (LVRT) or fault ride
through (FRT). The required LVRT behavior is defined in the grid code specified by
electricity grid operators. For example, the grid code issued by UK National Grid
Company requires that wind turbines should remain transiently stable and connected
to the system without tripping any other generators. For any balanced or unbalanced
voltage dip on the low voltage side, its voltage profile should be anywhere on or
above the black line as shown in Figure 3-1 [60], where V/VN (%) is the ratio of the
actual voltage on one or more phases to the nominal voltage on the low voltage side.
For avoidance of doubt, the profile beyond 140ms in Figure 3-1 is the minimum
recovery in voltage that will be accepted by the generator following the clearance of
the fault at 140ms.

37
Figure 3-1 Fault Ride through Requirement in UK National Grid’s Grid Code
3.2 Modelling Wind Turbine with DFIG
3.2.1 Modelling of DFIG
The stator voltage equations, rotor voltage equations and the flux linkage equations in
d-q reference frame can be written as follows [61].
Stator voltage equations:
dsds s ds s qs
du R idtψ
ωψ= − + (3-1)
qsqs s qs s ds
du R i
dtψ
ωψ= + + (3-2)
Rotor voltage equations:
drdr r dr r s qr
du R i sdtψ
ωψ= − + (3-3)
qrqr r qr r s dr
du R i s
dtψ
ωψ= − + (3-4)

38
Flux linkage equations:
ds ss ds m drL i L iψ = + (3-5)
qs ss qs m qrL i L iψ = + (3-6)
dr rr dr m dsL i L iψ = + (3-7)
qr rr qr m qsL i L iψ = + (3-8)
The equivalent circuits for the DFIG with direct axis (d-axis) and quadrature axis
(q-axis) are also described in Figure 3-2:
+++
++ +
- -- -
uds
Rs
udr
RrLs Lr
Lm
--
dsddtψ
s qsωψ r s qrs ωψ
drddtψ
ids idr
(a) d-axis equivalent circuit
+++
++ +
- -- -
uqs
Rs
uqr
RrLs Lr
Lm
--
dsddtψ
s dsωψ r s drs ωψ
qrddtψ
iqs iqr
(b) q-axis equivalent circuit
Figure 3-2 The Equivalent Circuits for the DFIG
where,
dsψ direct (d) axis stator flux linkages;

39
qsψ quadrature (q) axis stator flux linkages;
drψ direct (d) axis rotor flux linkage;
qrψ quadrature (q) axis rotor flux linkage;
Lm mutual inductance;
Lss stator self-inductance, Lss=Ls+Lm;
Lrr rotor self-inductance,
and Lrr=Lr+Lm;
Rr rotor resistance;
sω synchronous angular speed;
sr rotor slip;
dsi d axis stator currents;
qsi q axis stator currents;
dsv d axis stator terminal voltages;
qsv q axis stator terminal voltages;
drv d axis rotor voltages,
qrv q axis rotor voltages,
If we define qrrr
msd L
LE ψω
−=ʹ′ , drrr
msq L
LE ψω
=ʹ′ , ssss LX ω= , )(2
rr
mssss L
LLX −=ʹ′ ω ,
andr
rr
RLT =ʹ′0 , then equations for the DFIG are given by:
])([1
0qsssdqr
rr
msqsr
d iXXET
uLLEs
dtEd
ʹ′−+ʹ′ʹ′
−−ʹ′=ʹ′
ωω (3-9)

40
])([1
0dsssqdr
rr
msdsr
q iXXET
uLLEs
dtEd
ʹ′−−ʹ′ʹ′
−+ʹ′−=ʹ′
ωω (3-10)
0 0
1 1[ ( )] (1 )s ds mds s s s ds r d dr q s qs
s s rr s
X di Lu R X X i s E u E X idt T L Tω ω ω
ʹ′ʹ′ ʹ′ ʹ′ ʹ′= − + − − − − + +
ʹ′ ʹ′
(3-11)
0 0
1 1[ ( )] (1 )qss mqs s s s qs r q qr d s ds
s s rr s
diX Lu R X X i s E u E X idt T L Tω ω ω
ʹ′ʹ′ ʹ′ ʹ′ ʹ′= − + − − − − − −
ʹ′ ʹ′
(3-12)
where,
dEʹ′ d axis voltages behind the transient reactance;
qEʹ′ q axis voltages behind the transient reactance;
sX stator reactance;
sX ʹ′ stator transient reactance;
0T ʹ′ rotor circuit time constant.
3.2.2 Modeling of Drive Train
The drive train, usually represented by a two-mass model, is made up of a turbine, a
gearbox, some shafts and other mechanical components. The rotor shaft is flexibly
connected to the turbine shaft through the gearbox and coupling. The configuration of
the drive train is shown in Figure 3-3:

41
mT tθ tω
tH
shT twθshK
shD
emT gθ rω
gH
Figure 3-3 Configuration of the Drive Train
and the two-mass model is given by
shmt
t TTdtdH −=ω2 (3-13)
srtrttw sdtd
ωωωωθ
)1( −−=−= (3-14)
shemr
sg TTdtdsH −−=ω2 (3-15)
gttw θθθ −= (3-16)
dtdDKT tw
shtwshshθ
θ += (3-17)
where
Ht inertia constant of the turbine;
Hg inertia constant of the generator;
tω wind turbine angular speed;
rω generator rotor angular speed;
sr rotor slip srsrs ωωω /)( −= ;
twθ shaft twist angle;
tθ turbine rotor angle;

42
gθ generator rotor angle;
Ksh shaft stiffness coefficient;
Dsh damping coefficient;
Tsh shaft torque;
Tem electromagnetic torque of DFIG;
Tm wind turbine mechanical torque;
If neglecting the power loss in the stator, Tem is given by
ssem PT ω/= (3-18)
Tm is given by
t
wpwm
VCRT
ω
ρπ 325.0= (3-19)
where
ρ air density;
Rw wind turbine blade radius;
Vw wind speed;
Cf blade design constant coefficient;
β blade pitch angle;
λ blade tip speed ratio, wt VR /ωλ = ;
Cp power coefficient,
Ps stator active power.

43
3.2.3 Modeling of Back-to-Back Converters
+
-
+
-
vDC
+
-
iDCvr vg
ir ig
DC-Link
Rotor-side Converter
Grid-side Converter
Figure 3-4 The Back-to-back Converter of DFIG
As shown in Figure 3-4, the power balance equation can be expressed as follows,
DCgr PPP += . (3-20)
qrqrdrdrr ivivP += (3-21)
qgqgdgdgg ivivP += (3-22)
dtdvCvivP DC
DCDCDCDC −== (3-23)
where,
rP active power at the AC terminal of the rotor side converter;
DCP instantaneous active power;
dri q axis rotor currents of the grid side converter;
dgi q axis currents of the grid side converter;
dgv q axis voltages of the grid side converter;
vDC capacitor DC voltage;
gP active power at the AC terminal of the grid side converter;
C capacitance of the capacitor;
qri q axis rotor currents of the grid side converter;
qgi q axis currents of the grid side converter;

44
iDC current of the capacitor;
The power balance equation can be rewritten as
)( qrqrdrdrqgqgdgdgDC
DC ivivivivdtdvCv +−+= (3-24)
3.2.4 Modelling of Converter Controller on Rotor Side
The active power and reactive power of DFIG wind generator system is controlled
using decoupled control strategies, as proposed in [62].
On the grid side, the active and reactive power outputs are controlled by idg and iqg
respectively, where idg and iqg can be obtained by aligning the d axis of the d-q
reference frame. Thus, vqs is set to be 0, while vds equals to the magnitude of the
terminal voltage.
On the rotor side, the converter aims to control the active power output of the DFIG
by tracking the wind turbine torque, and maintains the required terminal voltage. By
aligning the d axis of the d-q reference with the stator voltage, the active power and
terminal voltage are independently controlled by idr and iqr, respectively. The control
diagram is shown in Figure 3-5:
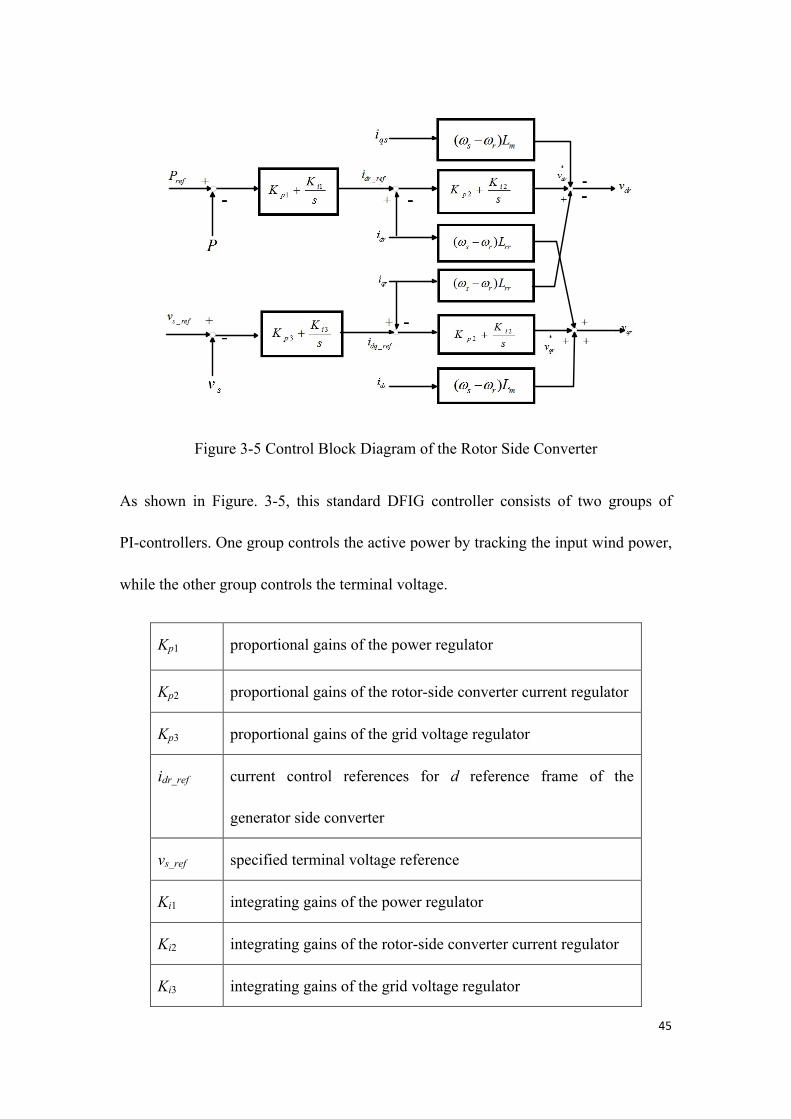
45
Figure 3-5 Control Block Diagram of the Rotor Side Converter
As shown in Figure. 3-5, this standard DFIG controller consists of two groups of
PI-controllers. One group controls the active power by tracking the input wind power,
while the other group controls the terminal voltage.
Kp1 proportional gains of the power regulator
Kp2 proportional gains of the rotor-side converter current regulator
Kp3 proportional gains of the grid voltage regulator
idr_ref current control references for d reference frame of the
generator side converter
vs_ref specified terminal voltage reference
Ki1 integrating gains of the power regulator
Ki2 integrating gains of the rotor-side converter current regulator
Ki3 integrating gains of the grid voltage regulator

46
iqr_ref current control references for q reference frame of the
generator side converter
Pref is the control reference of the active power of DFIG and is given by
3)(tB
tBref PPωω
= (3-25)
where tBω is the base of the turbine rotating speed; PB is the maximum active power
output at ωt =ωtB .
3.2.5 Modelling of Grid Side Converter Controller
As shown in Figure 3-6, the grid side converter controller is responsible for
maintaining the DC link voltage, and controlling the terminal reactive power.
Figure 3-6 Control Block Diagram of Grid Side Converter of DFIG
It consists of two groups of PI controllers as well. One group is for maintaining the
DC-Link voltage through idg, while the other group is for controlling the reactive

47
power through iqg,
Kp4 proportional gains of the DC bus voltage regulator
Kp5 proportional gains of the grid-side converter current
regulator
uDC_ref voltage control reference of the DC Link
XTg the reactance of the fed back transformer
Ki4 integrating gains of the DC bus voltage regulator
Ki5 integrating gains of the grid-side converter current
regulator
iqg_ref control reference for the q axis component of the grid
side converter current
3.2.6 Pitch Controller
The control block diagram of the pitch control is illustrated in Figure 3-7:
- -
Figure 3-7 Blade Pitch Control for WT with DFIG
In the controller, refω is the angular speed of the turbine corresponding to the rated
output active power. K6 is the pitch angle gain; Pitch_max is the maximum value of
the pitch angle, and is set to °45 ; the maximum rate of change of the pitch angle is set

48
to 2 deg/s.
It can be seen in Figure 3-7 that when the rotating speed of the turbine is lower than
the rated rotating speed, the pitch angle of the blade is kept at 0 deg. Only when the
rotating speed of the turbine is larger than the rated rotating speed, the pitch angle
controller is activated to increase the pitch angle. With the increased pitch angle, the
power extracted from the wind is decreased, and the rotating speed of the turbine can
be maintained at the rated rotating speed.
3.2.7 Integration with Power Grid
The network voltage equation and the wind turbine model are presented in x-y and d-q
reference frames, respectively. Figure 3-8 illustrates the relationship between these
two reference frames, where ϕ is the angle difference between the reference bus
voltage of the power grid and the terminal voltage of the WT, while the corresponding
transformation is given by (3-26). By using this relationship, the DFIG model can be
interfaced with the power grid equations.
qy
d
xϕ
Figure 3-8 The Relationship between d-q and x-y Frame of Reference
⎥⎦
⎤⎢⎣
⎡⎥⎦
⎤⎢⎣
⎡
−=⎥
⎦
⎤⎢⎣
⎡
y
x
q
d
ff
ff
ϕϕ
ϕϕ
cossinsincos
(3-26)

49
where df and qf are the d and q reference frame, respectively; xf and yf are
the x and y reference frame, respectively.
3.3 Wind Turbine Simulations in MATLAB/SIMULINK
Basically a wind turbine with the DFIG contains a wound rotor induction generator
and an AC/DC/AC IGBT-based PWM converter. The stator winding is connected
directly to the grid while the rotor is fed at a variable frequency through the back to
back AC/DC/AC converter. The DFIG is allowed to extract the maximum energy
from the wind at low wind speeds by optimizing the turbine speed, while minimizing
mechanical stresses on the turbine in gusts of wind.
3.3.1Wind Turbine Model
The wind turbine is pitch controlled, and the control signal for its pitch angle β is
provide by the DFIG control block. β is adjusted to prevent the generator from
over-speed operation. The wind speed is considered to be constant in the simulation
model.
3.3.2 Induction Machine Model
The developed induction generator model is a full order model with the derivation of
the stator fluxes, which can be used in the accurate transient simulation of power
systems. It should be mentioned that saturation is not considered in the model because
this only leads to small negligible error. This is due to the fact that the saturate
inductance is small enough so that the leakage flux goes through the air [63].
50
3.3.3 Grid Side Converter
The grid side converter (GSC) is modeled as a universal bridge, in which IGBTs are
connected to the IG (Induction Generator) terminals through RL filter. The GSC is
controlled to maintain the voltage of the DC-link capacitor constant. In this simulation,
the GSC model is designed as unidirectional, so power could only transfer from the
IG to the power grid. In this situation, GSC does not contribute to voltage regulation
or reactive power injection.
3.3.4 Rotor Side Converter
The rotor side converter (RSC) is modeled as a universal bridge, in which IGBTs are
connected to the IG rotor windings. The RSC can control the active power output of
the DFIG through the torque reference. This torque reference along with an estimated
flux determines the rotor current reference. The RSC model is designed to support the
grid voltage by injecting the reactive power into the power grid. A PI controller
determines the reference value of the reactive power by comparing the measured the
grid voltage and the constant voltage reference.
3.3.5 Crowbar Protection System
The crowbar protection system is considered in the simulation model in order to
protect the wind turbine against over-current when a fault is applied in the system.
The crowbar is made up of a symmetric three phase Wye-connected resistor

51
connected to the rotor through a circuit breaker. The breaker is normally opened,
unless there is any short-circuit current flows from the crowbar resistance into the
rotor, or either the rotor current or the DC-link capacitor voltage becomes abnormal.
The value of the crowbar resistance is very important since it determines the reactive
power drawn by the DFIG while the crowbar is inserted. Generally, the crowbar
resistance is selected as 20 times as large as the rotor resistance [64].
3.4 Numerical Examples
3.4.1 Test System Description
The test system used for the case study is shown in Figure 3-9. The wind farm is
connected to a 25kV electricity network through a 25kV/0.575kV transformer. The
rated capacity of the transformer is 12MVA and the ratio of its rated impedance is 5%.
Load is connected at the outlet position of the wind farm. A high-pass capacitor filter
is at the wind farm to absorb current harmonics generated by the converters. The wind
farm is connected to the 120kV network through a 30km, 25kV transmission line
through a 120kV/25kV transformer.
In this case study, the wind farm aggregates 6 units of 1.5 MW DFIG wind turbines,
as shown in Figure 3-9. A system ground fault was applied at Bus 25, i.e. the
connection point where the wind turbines were connected with the grid via the
transmission line. Three phase ground fault was triggered at t = 500ms and cleared at t
= 650ms.

52
Figure 3-9 Electricity Network Diagram
3.4.2 Simulation Results
The simulation of the wind farm has been done using the described crowbar
protection.
Before the fault occurred, the wind farm in steady state feeding 50% of its rated
power and drawing no reactive power from the gird. As shown in Figure 3-10, once
the fault occurred, the connection point voltage value is below the critical value
(generally 0.2pu), crowbar protection of the wind turbines was triggered while RSC
stopped switching. Therefore, the rotor current in the crowbar and the rotor windings
decayed.

53
Figure 3-10 Voltage Profile at Bus 575
The DC-link capacitor voltage (shown in Figure 3-11) didn’t distinctly increase after
the fault happened. But the DC-link voltage increased slightly while the crowbar was
connected. It increased dramatically when the fault cleared at t = 650ms. This is
because the DFIG absorbed reactive power from the grid after the fault was cleared.
Figure 3-11 Voltage Profile of the DC-link
The RSC started switching again after the fault was cleared, so that the DFIG fed
reactive power into the electricity network. The rotor current in the DFIG windings

54
decreased. The RSC current was equal to 0 when the crowbar triggered. The RSC
voltage was higher than the crowbar voltage.
When the fault was cleared, due to the crowbar was still connected due to the high
DC-link voltage. The DFIG absorb reactive power, which increased the voltage in the
electricity network. The DFIG drew a large amount of reactive power back to the grid,
shown in Figure 3-12.
Figure 3-12 Reactive Power Profile of the Wind Farm
3.4 Summary
In this chapter, the modeling of a wind turbine with DFIG has been presented. As a
wind generator requires the fault ride-through ability, crowbar protection was
considered in the simulation model. As the simulation results have shown that the
crowbar protection makes the DFIG wind turbine ride through faults, if the DC-link
capacitor voltage is within an acceptable range. The crowbar dissipates the excessive
active power and prevents the DC-link capacitor voltage from unnecessary increase,

55
which may lead to a higher rotor current through the RSC.
56
Chapter 4 The Interaction between Fast-Charging Stations and
Wind Turbines in Distribution Networks
4.1 Introduction
The vehicle-to-grid (V2G) concept means that the electric vehicles can act as both
distributed energy storage units and voltage source in power system with a high
penetration [65]. The V2G system has the ability to transfer energy between their
onboard batteries and the power grid when electric vehicles are plugged into charging
poles. The reliability of the power system with renewable energy can be enhanced by
V2G if enough electric vehicles are connected with the grid, because electric vehicles
can be considered as extra energy reserve storage [66].
In the transmission systems, wind generators are required to have the ability of low
voltage ride-through, which makes it remain connected with the grid even when the
grid voltage is temporarily dropped due to some faults. In the UK, the grid code
issued by the UK National Grid Company [69] is shown in Figure 3-1.
However, when the wind generator has to operate in some extreme conditions, e.g. the
grid is experiencing some extreme fault, the voltage at the connection point of the
wind generator might fall below the critical value. Under the circumstances, the wind
generator will be disconnected from the grid. If a large number of wind generators are

57
disconnected from the grid, it will cause a severe disturbance in the grid, i.e. sudden
loss of wind turbines, which will further cause the fluctuation of voltage and
frequency, and threaten the stability of the power system.
In this chapter, the research aims at verifying that the electric vehicles have the
potential ability to improve wind generator operational reliability by transferring
energy between electric vehicle battery pack and the utility grid. Case study will be
carried out by monitoring the system voltage when a fault happens in distribution
networks. According to the concept of V2G, electric vehicles are considered as
distributed energy resources and charging stations are designed to have the ability of
bi-directional power transfer.
4.2 Bidirectional Power Transfer between Electric Vehicle and
Distribution Grid
In chapter 2, the electric vehicle battery has been verified with the ability to inject
power to the grid when necessary. In this case, the electric vehicle is working in
discharging mode.
4.2.1 Interaction between Distribution Grid and Charging Station
The structure of the proposed electric vehicle charging station is made up of a
full-bridge inverter/rectifier and a DC-DC converter shown in Figure 4-1. The
positive current direction is assumed to be from the grid to the inverter as shown in
Figure 4-2.So is the positive power flow direction.

58
AC-DC Rectifier DC-link DC- DC
Converter
AB
C
Battery Station
boost
buck
Figure 4-1 Charging Station Structure
Vs(t) Vc(t)
ic(t) Lc
Figure 4-2 The Interaction between the Grid and the Inverter
The system parameters are given as follows:
( )cv t Instantaneous charging station voltage [V];
( )sv t Instantaneous grid voltage [V];
( )ci t Instantaneous charging station current [A];
δ Phase difference between ( )cv t and ( )sv t ;
θ Phase difference between ( )ci t and ( )sv t .
Assuming that the grid voltage is purely sinusoidal, high frequency components are
neglected. ( )cv t is the inverter output voltage given by the following equations:

59
( ) 2 sin( )s sv t V tω= (4-1)
( ) 2 sin( )cv t tω δ= − (4-2)
A coupling inductor is used and the two voltage sources are decoupled to ensure
power transfer from the charging station to the grid. The instantaneous line current of
the charging station can be expressed as:
( ) 2 sin( )c ci t I tω θ= − (4-3)
Since the default direction for active and reactive power transfer is from the grid to
the charging station, ( )cv t lags behind ( )sv t when the charging station operates in
charging mode; while ( )sv t lags behind ( )cv t when the charging station operates in
discharging mode. The positive direction of active power flow is also defined as from
the grid to the charging station. The positive direction of reactive power flow is
determined by the phase angle θ. If θ is positive, reactive power is sent to the grid,
while if θ is negative, reactive power is drawn from the grid and flows to the charging
station. The relationship between these variables is derived as follows
Control variable P Q
)(tvc and δ )sin(δ
c
cs
X
VV × )]cos(1[
2
δs
c
c
s
V
V
X
V−
)(tic and θ )cos(θ×× cs IV )sin(θ×× cs IV
4.2.2 Control Strategy of Electric Vehicle Charging Station
A. Control of Bidirectional AC-DC inverter

60
As shown in Figure 4-3, the AC-DC inverter has been modeled in d-q reference frame.
The three phase voltages and currents in abc frame of reference can be transformed
into those in d-q frame of reference. The voltage-oriented control (VOC) strategy [67]
based on dual PI closed-loop has been adopted. The outer loop controller is designed
to stabilize DC-link voltage, output current i*gd on d-axis, while the inner loop
controller is for DC side current control, by tracking i*gd.
X P I X P Ii*gd+
-‐+ v’gd
X-‐△vgd
vgd
gdu
1X P I X
-‐ vgdv’gq
+
+△vgq
Q*g
i*gq +-‐
-‐
igd
igq
vavbvc
udc
iga
igb
igc
iabc>=idq
udq
>=uabc
gdgqgggd uiLv +=Δ ω
gdgggq iLv ω−=Δ
gθ
uabc
>=udq
uga
ugb
ugcugd
gθ
Figure 4-3 Control System Diagram.
It can be found that the cross coupling voltage gqgg iLω and gdgiLω− are considered in the
d and q axis voltage Vgd and Vgq, respectively. d-axis current is responsible for the
DC-link voltage control, of which the reference i*gd comes from the DC-link voltage
control loop; and q-axis current is responsible for the control of reactive power Q*g.
B. Control of Bidirectional Buck–Boost DC-DC Converter
By changing the duty cycle of the DC-DC converter, both the charging current and
charging voltage can be controlled accordingly. The duty cycle reference d* can be

61
obtained by designing the closed-loop control strategies as follows.
For charging control, the duty cycle reference d* can be given by:
dtiikiikuud ip ∫ −+−+= )()(/ 2*22
*212
* (4-4)
For discharging control, the duty cycle reference d* can be given by:
dtiikiikuuud ip ∫ −+−+−= )()(/)( 2*22
*2121
* (4-5)
In (4-4) and (4-5), i2* is the reference charging/or discharging current.
4.3 Introduction of Active Distribution Network
The conventional distribution network is a passive network with unidirectional power
flow. With the development of distribution energy resources (DERs) such as wind,
solar and biomass energy, more and more distributed generation (DG) systems such
as wind power generators and PV panels are integrated into the distribution network.
With the increasing integration of DG, the infrastructure of the distribution network
have been changed from passive to active with the power injection of DERs so the
power flow also have been changed from unidirectional to bi-directional in the
distribution network. Such a change has brought challenges to the planning, operation,
control and protection of the active distribution network involving islanding of DGs,
dynamic impacts and so on [64].

62
External Power Grid
P+jQ
DERs
External Power Grid
P+jQ
Passive Distribution Networks
ActiveDistribution Networks
Power Flow Direction
Figure 4-4 A Comparison of Passive and Active Distribution Networks
4.4 Simulation Results
In order to estimate the interaction between the distributed wind energy generator
with electric charging station in the proposed active distribution network. Case study
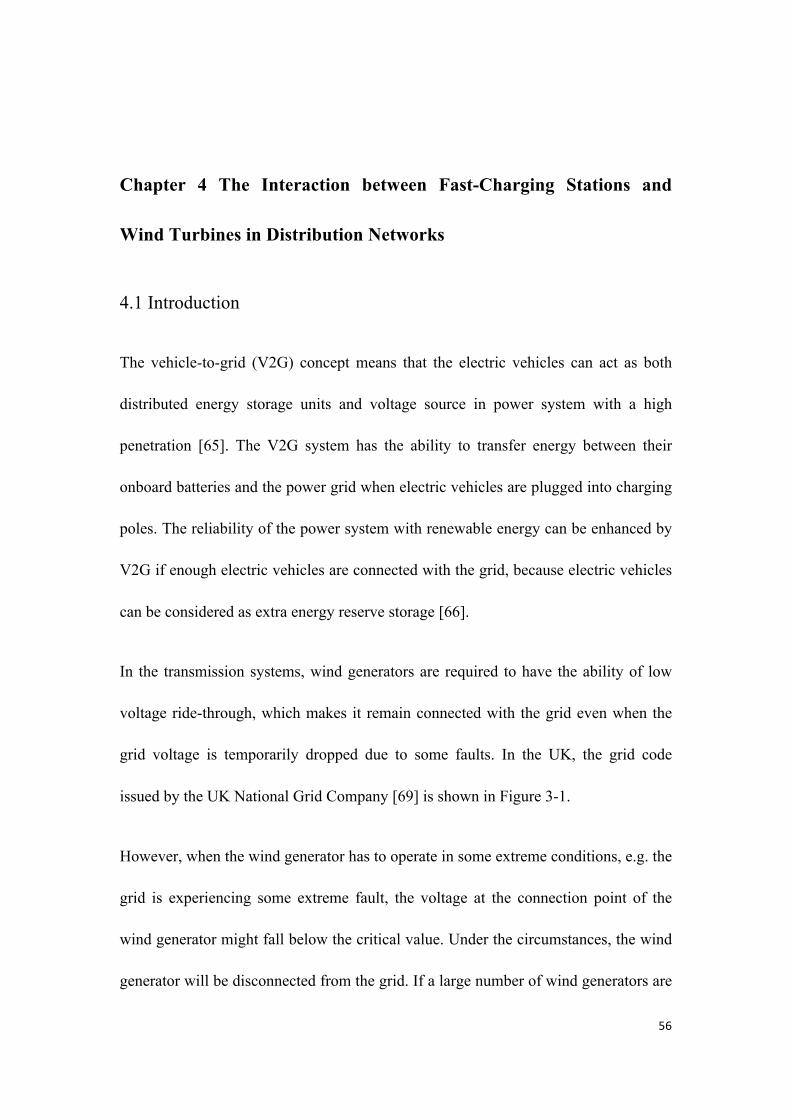
is carried out in the chosen regional distribution network as shown in Fig. 4-5.
Assuming this is a residential district with wind generators. Charging stations are
installed for those electric vehicles based on owner’s fast-charging requirements.
Simulations were carried out on the distribution grid with a wind turbine and a
charging station in Figure 4-5 where the wind generator is connected with B1. Using
the test system, three cases were carried out as follows:
Case 1: A three phase ground fault is applied at B2 and cleared 1s later. In this case,
no charging station is installed;
Case 2: A three phase ground fault is applied at B2 and cleared 1s later. In this case,
63
a charging station is installed at B5;
Case 3: Similar to Case 2 except that the charging station is installed at B6;
0.33+j0.68
B1
WT
B2 B3 B40.22+j0.04 0.22+j0.05
B5 B6
33/11kV
0.33+j0.68 0.22+j0.04
Figure 4-5 Test Electricity Distribution Grid (load in MW)
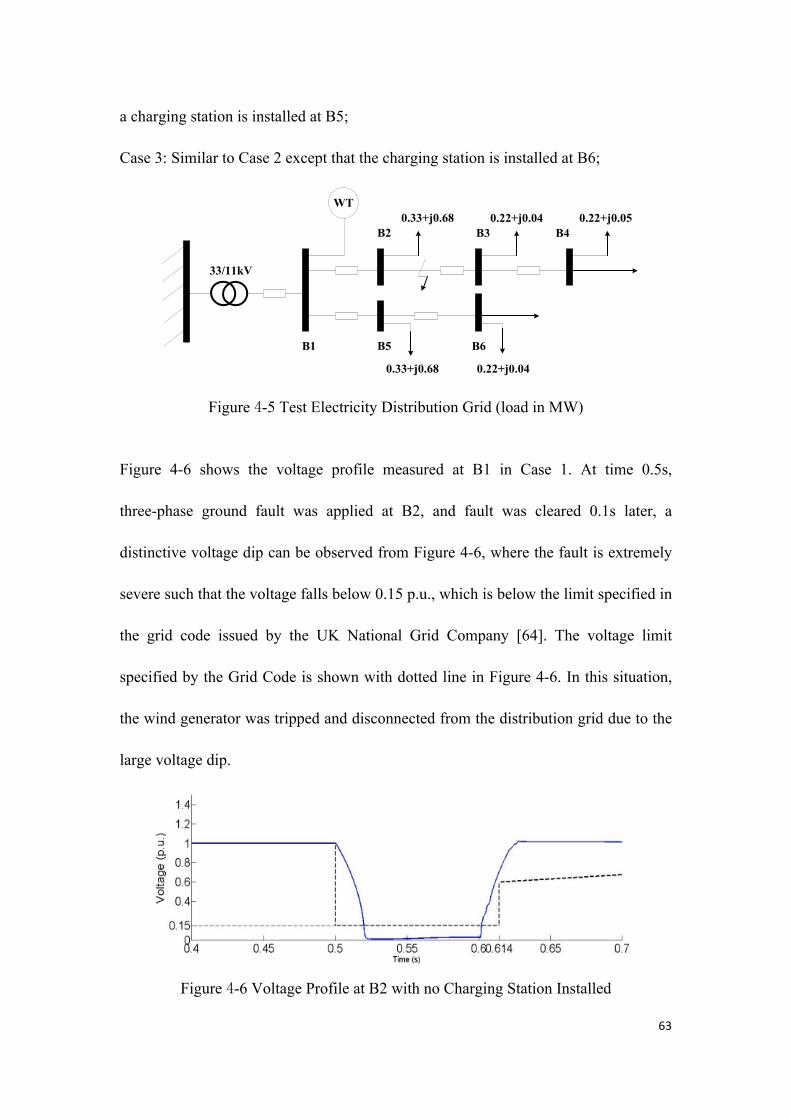
Figure 4-6 shows the voltage profile measured at B1 in Case 1. At time 0.5s,
three-phase ground fault was applied at B2, and fault was cleared 0.1s later, a
distinctive voltage dip can be observed from Figure 4-6, where the fault is extremely
severe such that the voltage falls below 0.15 p.u., which is below the limit specified in
the grid code issued by the UK National Grid Company [64]. The voltage limit
specified by the Grid Code is shown with dotted line in Figure 4-6. In this situation,
the wind generator was tripped and disconnected from the distribution grid due to the
large voltage dip.
Figure 4-6 Voltage Profile at B2 with no Charging Station Installed

64
In Case 2, the charging station is installed at B5 in the local residential district. When
the fault is applied at B2, because of the charging station has the ability to transfer
power from the electric vehicle battery to the grid, when the battery voltage is above
the voltage of the connection point. The voltage at B1 can be maintained above its
limit, as shown in Figure 4-7. Under the circumstances, the electric vehicle battery is
operating as a distributed energy source that injects power to the grid.
Figure 4-7 Voltage Profile at Bus 2 with Charging Station Installed at Bus 5
A further case study carried out by installing the charging station at a different
location within the test distribution system. In Case 3, the charging station is installed
at B6. Voltage profile measured at B1 is shown in Figure 4-8. When the fault
occurred at B2 at 0.5s, the voltage fell to 0.2 p.u, which is still above the bus voltage
limit given by the Grid Code, and then the fault was cleared at time 0.6s and after this,
the voltage was recovered.

65
Figure 4-8 Voltage Profile at Bus 2 with Charging Station Installed at B6.
4.5 Summary
This Chapter has examined that EV charging stations with bi-direction power flow
control capability can provide the voltage support for distribution network operations
to improve the fault-ride-through of adjacent wind turbines. Simulations have
illustrated the feasibility as well as the effectiveness of the proposed control concept.
Hence such voltage support from EV charging station has the great potential to be
developed as ancillary services in smart distribution grid operations.

66
Chapter 5 Conclusions and Future Work
5.1 General Conclusions
This thesis consists of two parts; the first part is on the modeling of electric vehicle
charging station. And the second part of this thesis was investigating the bi-directional
power transfer between electric vehicle and grid. Detailed conclusions are
demonstrated below:
1. The equivalent model of electric batteries has been developed and implemented in
MATLAB. The model has been used to evaluate the terminal voltage and power
variation during the battery charging and discharging periods. The concept of electric
vehicle fast charging station has been summarized and its detailed simulation model
has been designed to integrate the electric vehicle batteries with the distribution
network.
2. The modeling of a wind turbine with DFIG has been presented. As a wind
generator requires the fault ride-through ability, crowbar protection was considered in
the simulation model. As the simulation results have shown that the crowbar
protection allows fault ride-through for the DFIG wind turbine, if the DC-link
capacitor voltage is contained within an acceptable limit. The function of the crowbar
is to dissipate the excess active power and prevent the DC-link capacitor voltage from
unnecessary increase, which may lead to a higher rotor current through the RSC.
3. The interactions between electric vehicle charging stations and active distribution

67
grid have been investigated, which is considered to be the major contribution of this
thesis. This Chapter has examined that EV charging stations with bi-direction power
flow control capability can provide the voltage support for distribution network
operations to improve the fault-ride-through of adjacent wind turbines. Simulations
have illustrated the feasibility as well as the effectiveness of the proposed control
concept. Hence such voltage support from EV charging station has the great
potential to be developed as ancillary services in smart distribution grid operations.
5.2 Future Work
In regarding the topics in this research, it is necessary to do further study on the
following aspects:
• The simulation model for the electric vehicle battery and charging station is
mainly developed for power grid transient analysis. Further models will be
needed for long term simulations where the charging cycle and some other
battery parameters should be considerate in the model.
• The analysis of the interaction between electric vehicles and distribution grid
should be enhanced to include other types of distributed generators (DGs)
including CHPs, PVs, and energy storage devices, etc.
• The simulation work was developed in Matlab/Simulink, future simulation
work will need to migrate to some other advanced power system simulation

68
software packages, with more rich DG simulation models and for large scale
power grid simulations.
• Researches on commercial frameworks for ancillary services from EVs can be
developed, future researches will need to investigate the demonstration
projects of EV commercial developing worldwide, building commercial
frameworks for ancillary services based on local situation.

69
References
[1] S. Newman, The final energy crisis, 2nd Edition. London: Pluto Press, 2008.
[2] H. Michael and K. Snorre, “Depletion of fossil fuels and the impacts of global
warming,” Resource and Energy Economics, vol. 18, no. 2, pp. 115-136, Jun.
1996.
[3] European Wind Energy Association, Wind energy - The facts. London:
Earthscan, 2009.
[4] E. Ungar and K. Fell, “Plug in, turn on, and load up,” IEEE Power and Energy
Magazine, vol. 8, no. 3, pp. 30-35, May 2010.
[5] A. K. Srivastava, B. Annabathina, and S. Kamalasadan, “The challenges and
policy options for integrating plug-in hybrid electric vehicle into the electric
grid,” The Electricity Journal, vol. 23, no. 3, pp. 83-91, Mar. 2010.
[6] D. Sperling, and G. Deborah, Two billion cars: driving toward sustainability,
New York: Oxford University Press, 2009.
[7] D. B. Sandalow, Plug-in electric vehicles: what role for washington?
Washington: The Brookings Institution, 2009.
[8] E. Ungar and K. Fell, “Plug in, turn on, and load up,” IEEE Power and
Energy Magazine, vol. 8, 2010, pp. 30-35.
[9] Tingting Zhao, China accelerates electric vehicle dream, August, 2010, at
http://www.chinadaily

70
[10] JD Power & Associates. “Drive green 2020: more hope than reality?”
November 2010.
[11] http://www.chargepointamerica.com/
[12] http://www.theevproject.com/
[13] X.K. Lai, “Impact of electric vehicles on the power grid,”
http://www.gmexpo2010.com/downloads/forum/20100727%20Lai's%20Presen
tation.pdf
[14] http://www.delta-ee.com/downloads/RESEARCH_BRIEF_French%20EV%20
plan_SHOct09.pdf
[15] http://urbact.eu/fileadmin/Projects/EVUE/documents_media/London_presentat
ion_Feb_2010.pdf
[16] R. D. Richardson and G. M. Mcnerney, “Wind energy systems,” Proceedings
of the IEEE, vol. 81, no. 3, pp. 378-389, Mar. 1993.
[17] P. Musgrove, Wind energy, Cambridge: Cambridge University Press, 2009.
[18] World Wind Energy Association Head Office, World wind energy half-year
report 2011, World Wind Energy Association, Tech. Report, Aug. 2011.
[19] RenewableUK, “UK wind energy database statistics,” March 2012, [Online].
Available: http://www.bwea.com/statistics/.
[20] Y. Wu, Research on reliability evaluation and expansion planning of power
system including wind farms, Ph.D. dissertation, School of Electric Engineering,
Hefei University of Technology, Hefei, Anhui, China, 2006.

71
[21] Z. Hu, Y. Song, Z. Xu, et al., “Impacts and utilization of electric vehicles into
power systems,” Proceedings of the CSEE, vol. 32, no. 4, pp. 1-11, Feb. 2012.
[22] C. Gao and L. Zhang, “A Survey of influence of electrics vehicle charging on
power grid,” Power System Technology, vol. 35, no. 2, pp. 127-131, Feb. 2011.
[23] A. K. Srivastava, B. Annabathina, and S. Kamalasadan, “The challenges and
policy options for integrating plug-in hybrid electric vehicle into the electric
grid,” The Electricity Journal, vol. 23, no. 3, pp. 83-91, Apr. 2010.
[24] T. H. Bradleya and A. A. Frankb, “Design, demonstrations and sustainability
impact assessments for plug-in hybrid electric vehicle,” Renewable and
Sustainable Energy Reviews, vol. 13, no. 1, pp. 115-128, Jan. 2009.
[25] S. S. Williamson, “Electric drive train efficiency analysis based on varied
energy storage system usage for plug-in hybrid electric vehicle,” in
Proceedings of 2007 IEEE Power Electronics Specialists Conference, Orlando,
FL, USA, pp.1515-1520, Jul. 17-21 2007.
[26] G. T. Heydt, “The Impact of electric vehicle deployment on load management
strategies,” IEEE Transactions on Power Apparatus & System, vol. 1, no. 144,
pp. 1253-1259, May 1983.
[27] A. Heider and H. J. Haubrich, “Impact of wide-scale ev charging on the power
supply network,” in Proceedings of IEE Colloquium on Electric vehicles: A
Technology Roadmap for the Future, London, UK, vol. 6, no. 262, pp. 1-4, May
5 1998.

72
[28] K. Schneider, C. Gerkensmeyer, M. Kintner-Meyer, and M. Fletcher, “Impact
assessment of plug-in hybrid electric vehicles on pacific northwest distribution
systems,” in Proceedings of 2008 IEEE Power and Energy Society General
Meeting, Pittsburgh, PA, USA, pp. 1-6, Jul. 20-24 2008.
[29] K. Mets, T. Verschueren, W. Haerick, and etc., “Optimizing smart energy
control strategies for plug-in hybrid electric vehicle charging,” in Proceedings
of 12th IEEE/IFIP Network Operations and Management Symposium
Workshops, Osaka, Japan, pp. 293-299, Apr. 19-23 2010.
[30] N. Rotering and M. Ilic, “Optimal charge control of plug-in hybrid electric
vehicles in deregulated electricity markets,” IEEE Transactions on Power
Systems, vol. 26, no. 3, pp. 1021-1029, Aug. 2011.
[31] W. Kempton and J. Tomic, “Vehicle-to-Grid power implementation: from
stabilizing the grid to supporting large-scale renewable energy,” Journal of
Power Sources, vol. 144, no. 1, pp. 280-294, Jun. 2005.
[32] H. Turton and F. Moura, “Vehicle-to-Grid systems for sustainable
development: an integrated energy analysis,” Technological Forecasting and
Social Change, vol. 75, no. 8, pp. 1091-1108, Oct. 2008.
[33] C. Guille and G. Gross, “A conceptual framework for the vehicle-to-grid (V2G)
implementation,” Energy Policy, vol. 37, no. 11, pp. 4379-4390, Nov. 2009.
[34] W. Kempton and J. Tomic, “Vehicle-to-grid power fundamentals: calculating
capacity and net revenue,” Journal of Power Sources, vol. 144, no. 1, pp.
268-279, Jun. 2005.

73
[35] M. Etezadi-Amoli, K. Choma, and J. Stefani, “Rapid-charge electric-vehicle
stations,” IEEE Transactions on Power Delivery, vol. 25, no. 3, pp. 1883-1887,
Jul. 2010.
[36] J. Taylor, A. Maitra, M. Alexander, D. Brooks, and M. Duvall, “Evaluation of
the impact of plug-in electric vehicle loading on distribution system
operations,” In Proceedings of IEEE PES Power & Energy Society General
Meeting 2009.
[37] E. Sortomme, M. Hindi, “Coordinated charging of plug-in hybrid electric
vehicles to minimize distribution system losses.” IEEE Transaction on Smart
Grid, vol.2, no.1, March 2011.
[38] S. Shao, M. Pipattanasomporn, and S. Rahman, “Challenges of electric vehicle
penetration to the residential distribution network,” 2009 IEEE PES General
Meeting, 2009, paper 09GM0514, pp. 1–8.
[39] A. Maitra, K. S. Kook, A. Giumento, J. Taylor, D. Brooks, M. Alexander, and
M. Duvall, “Evaluation of PEV loading characteristics on Hydro-Quebecs
distribution system operations,” PHEV09, Montreal, 28- 30 September 2009.
[40] D. Linden, and T. B. Reddy, , (editors), Handbook of Batteries, 3rd edition,
McGraw-Hill, New York, NY, 2001.
[41] P. Bauer, N.Stembridge, J. Doppler, , and P. Kumar, “Battery modeling and
fast charging of EV”, 14th International Power Electronics and Motion Control
Conference, EPE-PEMC, 2010

74
[42] H.W. Kim, S.S Kim, H.S. Ko, “Modeling and control of PMSG based variable
speed”, Electric Power Systems Research, vol.11, no 1, pp. 147-154, October,
2009
[43] Y. Chen, A. Oudalov, J. S. Wang, “Integration of electric vehicle charging
system into distribution network”, 8th International Conference on Power
Electronics – ECCE Asia. Beijing, China, 2010
[44] M. Chen and G. A. Rincon-Mora, “Accurate electrical battery model capable
of predicting runtime and I-V performance,” IEEE Trans. Energy Conversion,
vol. 21, no. 2, pp. 504-511, June 2006.
[45] M. Knauff, et. al, “Simulink model of a lithium-ion battery for the hybrid
power system testbed,” Proceedings of the ASNE Itelligent Ships Symposium,
Philadelphia, PA, USA, May 2007.
[46] O. Erdinc, B.Vural, and M. Uzunoglu, “A dynamic lithium-ion battery
model considering the effects of temperature and capacity fading,” 2009
International Conference on Clean Electric Power, Capri, Italy, 9-11 June
2009.
[47] A123 Systems Hymotion Products
http://www.a123systems.com/-hymotion/products/N5_range_extender.
[48] M.C. Kisacikoglu, B. Ozpineci, L.M. Tolbert, “Examination of a PHEV
bidirectional charger system for V2G reactive power compensation,” Applied
Power Electronics Conference and Exposition (APEC), Florida, US. 21-25 Feb.
2010

75
[49] S. Muller, M. Deicke, R.W. De Doncker “Doubly fed induction generator
systems for wind turbines”, IEEE Industry Application Magazine, vol. 8, no. 3,
pp. 26-33
[50] V. Akhmatov, “Variable-speed wind turbine with doubly-fed induction
generators –Part I: modelling in dynamic simulation tools”, Wind Energy, vol.
26, no. 2, pp. 85-108
[51] T. Petru, T. Thiringer, “Modeling of wind turbines for power system studies,”
IEEE Trans. on Power Systems, vol.17, no. 4, 2002, pp.1132-1139
[52] A. Pertersson, T. Thiringer, L. Harnefors, et al. “Modeling and experimental
verification of grid interaction of a DFIG wind turbine,” IEEE Trans. on Energy
Conversion, vol.20, no.4, 2005, pp.878-886.
[53] A. Mullance, M. O’Malley , “The inertial response of induction-machine-based
wind turbine,” IEEE Trans. on Power Systems, vol.20, no.3, 2005,
pp.1496-1503
[54] J. Morren, S.W.H. de Haan , “Short-circuit current of wind turbine with doubly
fed induction generator,” IEEE Trans. on Energy Conversion, vo.22, no.1,
2007, pp.174-180
[55] J.G. Slootweg, H. Polinder, W.L. Kling, “Reduced-order modelling of wind
turbine”, In Ackermann, T. (ed.) Wind Power in Power Systems. Wiley,
England. 2005, pp.555-585

76
[56] Y. Lei, A. Mullane, G. Lightbody, et al, “Modeling of the wind turbine with
a doubly fed induction generator for grid integration studies,” IEEE Trans. on
Energy Conversion, vol.21, no.1, 2006, pp.257-264
[57] F. Mei, B.C. Pal, “Modelling and small-signal analysis of a grid connected
doubly-fed induction generator,” in Proceeding of IEEE PES General Meeting
2005, San Francisco, USA, 12-16 June 2005
[58] J.G. Slootweg, W.L. Kling, “Aggregated modelling of wind parks in power
system dynamics simulations,” Proceeding of 2003 IEEE PowerTech
Conference, Bologna, Italy, 23-26 June 2003
[59] P. Kundur, Power system stability and control, McGraw Hill, New York
[60] http://www.nationalgrid.com/NR/rdonlyres/67374C36-1635-42E8-A2B8-B7B
8B9AF2408/54093/Z_CompleteGridCode_I4R14.pdfMullance A, O’Malley M
(2005)
[61] A. Mullance, O. Malley, “The inertial response of induction-machine-based
wind turbine,” IEEE Trans. on Power Systems, vol.20, no.3, pp.1496-1503,
2010
[62] M. Yamamoto, O. Motoyoshi, “Active and reactive power control for
doubly-fed wound rotor induction generator,” IEEE Trans. on Power
Electronics, vol.6, no.4, 1991, pp.624-629
[63] V. Akhmatov, Induction Generators for Wind Power, Multi-Science Publishing
Company, Ltd., 2005.

77
[64] W. Kempton and J. Tomic, “Vehicle-to-grid power implementation:From
stabilizing the grid to supporting large-scale renewable energy,” J. Power
Sources, vol. 144, pp. 280–294, Jun. 2005.
[65] J.R. Pillai and B. Bak-Jensen, "Integration of vehicle-to-grid in the western
danish power system," IEEE Transactions on Sustainable Energy, vol. 2, pp.
12-19, 2011.
[66] N. Mohan, T.M. Undeland and W. P. Robbins, Power electronics converters,
applications, and design, Wiley India Press (p.) Ltd. Third Edition, Reprint
2009.
[67] H.W. Kim, S.S Kim, H.S. Ko, “Modeling and control of PMSG based variable
speed,” Electric Power Systems Research, October, 2009
[68] E.J. Couster, J.M.A. Myrzik, “Integration issues of distributed generation in
distribution grids,” Proceedings of the IEEE, vol. 99, no. 1, pp.28-39,
September, 2010
[69] http://www.nationalgrid.com/NR/rdonlyres/67374C36-1635-42E8-A2B8-B7B
8B9AF2408/54093/Z_CompleteGridCode_I4R14.pdf

78
Appendix Simulation System Configuration and Parameters
A.1 Simulation Configuration for Chapter 2
A.1.1 System Simulation Configuration
A.1.2 Charging Station Simulation Configuration.
A.1.3 System Parameters
External grid Base voltage 33kV

79
Maximum voltage 1.03 pu
Minimum voltage 0.97 pu
Load Reactive power 0.0749 MVAr
Active power 0.392 MW
A.2 Simulation Configuration for Chapter 3
A.2.1 System Simulation Configuration
A.2.2 System Parameters
System base voltage 25kV
Transformer 25/0.575kV,
Rated capacity 12MVA
Wind farm capacity 6*1.5 MW
A.3 Simulation Configuration for Chapter 4
A.3.1 System Simulation Configuration

80
A.3.2 Charging Station Configuration
A.3.2.1 AC-DC Rectifier Diagram

81
A.3.2.2 Grid Side PI Controller
A.3.2.3 Bi-directional DC-DC Converter and its Control Diagram

82
A.3.3 System Parameters
A.3.3.1 External Grid and Transformer Data
External Grid Base voltage 33kV
Transformer Positive and negative sequence
resistance
0.047 pu
Positive and negative sequence
reactance
0.654 pu
Zero sequence resistance 0.555 pu
Zero sequence reactance 0
Winding connection YD11
Load (in
MW/MVA)
Load 1 0.33+j0.68
Load 2 0.22+j0.04
Load 3 0.22+j0.05
Load 4 0.33+j0.68
Load 5 0.22+j0.04
A.3.3.2 Distribution Grid Data (in Per Unit)
From
Bus
To
Bus
Positive and
negative
Positive and
negative
Zero
sequence
Zero
sequence
Length
(km)

83
sequence
resistance
sequence
reactance
resistance reactance
Bus 1 Bus 2 0.2038 0.1056 0.6028 0.1014 1.504
Bus 2 Bus 3 0.2038 0.1056 0.6028 0.1014 0.500
Bus 3 Bus 4 0.0624 0.0170 0.1665 0.0170 0.236
Bus 1 Bus 5 0.2038 0.1056 0.6028 0.1014 1.504
Bus 5 Bus 6 0.2038 0.1056 0.6028 0.1014 0.511

84
List of Publications
[1] R. Shi, X.P. Zhang, et al, “Dynamic impacts of fast-charging stations for electric
vehicles on active distribution networks,” in Proceedings of 2012 IEEE
Conference on Innovative Smart Grid Technologies - Asia (ISGT Asia), Tianjin,
China. May. 20-24, 2012.
[2] R. Shi, X.P. Zhang, “Support of Wind Turbine Operations in Electricity
Distribution Grid by Electric Vehicles Charging Stations,” IEEE Transaction on
Power & Energy Letters. Submitted.