the dynamic effects of immigration on political outcomes
TRANSCRIPT

Master Thesis Department of Economics
The dynamic effects of immigration on political outcomes: Evidence from Sweden
Author: Supervisor: André Chindt Mounir Karadja
June 5, 2020

1
Abstract This paper analyzes the impact of immigration on the political support for right-wing and left-wing parties in Sweden. Municipality level data on national parliamentary elections is used over the 2006 to 2018 period. To derive causal estimates, an instrumental variable strategy is implemented based on the spatial distribution of foreign-born in 1998. The impact of immigration is divided between the share of foreign-born and the most recent inflow of immigrants, to evaluate whether a dynamic process exists. Overall, the results are consistent with the hypothesis that hostility towards immigrants is temporary. Only the most recent inflow of immigrants has a positive impact on anti-immigration voting, while the share of immigrants has a negative effect. In the context of pro-immigration support, the opposite results are revealed. By exploring the channels behind the results, concerns on neighborhood quality, and not economical competition, seems to be the driving factor of the short-run resistance towards immigration. Keywords: immigration, voting, political economy
2
Contents
1Introduction.................................................................................................................................32Background.................................................................................................................................82.1ImmigrationtoSweden..................................................................................................................82.2TheelectoralsystemandpoliticalpartiesinSweden.........................................................92.2.1Right-wingparties........................................................................................................................................92.2.2Left-wingparties......................................................................................................................................10
3Empiricalstrategy...................................................................................................................123.1Specificationandidentificationissues...................................................................................123.2TheIVstrategy................................................................................................................................133.3Thedynamicaspect.......................................................................................................................15
4Dataanddescriptivestatistics............................................................................................174.1Data.....................................................................................................................................................174.1.1Dataonelectoraloutcomes..................................................................................................................174.1.2Dataonimmigration...............................................................................................................................174.1.3Dataoncontrolvariables......................................................................................................................18
4.2Summarystatistics........................................................................................................................185Results.........................................................................................................................................205.1OLSresults........................................................................................................................................205.2Instrumentalvariableresults....................................................................................................215.3Dynamicresults..............................................................................................................................215.4Robustnesstests.............................................................................................................................225.4.1Nativemigration.......................................................................................................................................225.4.2Alternativesamples.................................................................................................................................235.4.3Alternativemodelspecifications.......................................................................................................23
6Additionalresults....................................................................................................................256.1Explanationsoftheresults.........................................................................................................256.1.1Theeconomicchannel............................................................................................................................256.1.2Theneighborhoodquality....................................................................................................................27
6.2Municipalelections........................................................................................................................296.3Turnoutratesandinvalidvotes................................................................................................30
7Conclusion.................................................................................................................................32References.......................................................................................................................................34
Figures..............................................................................................................................................38
Tables...............................................................................................................................................41Appendix.........................................................................................................................................53
3
1 Introduction Foreign immigration has been a predominant theme in the public debate among most of the European countries during the last years. The number of asylum seekers to the European Union has increased steadily during the last decades and reached a new peak in 2015 with over 1.32 million individuals seeking asylum (Eurostat, 2020a). At the same time, most of these countries have seen a sharp increase in the vote-share of far-right political parties in recent regional and national elections. Salient examples are “The Front National” in France, “The Dutch Freedom Party” in the Netherlands and “Alternative for Germany” in Germany. Moreover, several countries like Italy, Austria and Hungary, have seen a populist party govern in different coalition buildings. Even though the European far-right parties are fairly heterogeneous, where some of them show tendencies of an extreme nature, they all have a number of ideological features in common. Fears about ethnic diversity, globalization and, in particular, immigration have all played a central role in the shaping of the political agenda among those parties. The increased number of immigrants has been used to explain socio-economical concerns such as growing income inequality, unemployment and crime rates, resulting in an increased support among natives for the clear anti-immigration political programs. In Sweden the number of foreign-born has increased from around 1 million in 2000 to almost 2 million in 2018 (SCB, 2020a). The share of foreign-born is relatively large, compared to other countries in the European Union. In 2018 only Luxembourg, Cyprus and Austria had a larger share than Sweden (18.5 percent) (Eurostat, 2020b). At the same time, the share of the Swedish population born outside of Europe has increased, partly explained by the rise in arrivals of asylum refugees since the early 2000s. A majority of them have arrived from the Middle East and North Africa. Similar to the rest of Europe, the number of asylum seekers reached a peak in 2015 with the arrival of almost 163,000 refugees (SCB, 2020b). In the context of right-wing political parties in Sweden, the Sweden Democrats are the most successful party. Founded in 1988, they were elected into the parliament for the first time in 2010. In the most recent national parliament election, held in 2018, they became the third largest party with a vote share of 17.53 percent. Along with most of the other European populist parties, they promote a restrictive immigration policy and dismiss the idea of multiculturalism. In the other end of the political spectrum, it is not that clear which have been the most immigration friendly parties during the sample period. Most of the seven traditional parties in the national parliament all shared fairly equal perceptions of an open and liberal migration policy. However, in the wake of the migrant crisis in 2015, several parties drastically changed their stances in the migration debate and the only two parties to fully maintain their generous migration policies were the Left Party and the Green Party. Consequently, these two parties will represent the left-wing of the Swedish political spectrum in this paper. Their aggregated vote share has consistently been on a stable level of around 12 percent in all the parliamentary elections during the last couple of decades. A conclusion that could be drawn is that both the immigration and the support for far-right politics have increased during the last decades. In the light of this implication, this paper asks whether there exists a causal relationship between the increase in immigration and the political outcomes in Sweden. To evaluate it, I examine the vote shares of far-right and far-left political parties in 290 Swedish municipalities, differently exposed to immigration.
4
Specifically, I focus on the 2006 to 2018 period, which includes four national parliamentary elections. A major concern to tackle in studies focusing not only on an anecdotal or a cross-sectional relationship, but also on the true causal effect of immigration on political outcomes, is the potential endogenous variation in settlement of immigrants across regions in a country. One can expect that immigrants self-select into municipalities based on unobserved characteristics. If that is the case, the estimated results potentially suffer from an omitted variable bias, even though including fixed effects and a large set of control variables. Immigrants might also avoid settling down in areas with a strong right-wing political support, resulting in a reverse causality. The first studies to tackle the question of estimating the linkage between immigration and different political outcome were mostly descriptive and rely on the arguably assumption of random assignment of immigrants (see e.g. Lubbers et al., 2002; Golder, 2003; Gerdes and Waldensjo, 2008). Consequently, none of these studies presumably provided the true causal effects. To overcome the endogeneity problem, subsequent studies use various methods to instrument the actual share of immigrants residing in a specific geographical region. The availability of housing space has been widely used to predict the share of immigrants. For example, Steinmayr (2016) take advantage of the pre-existing group accommodations in Austrian communities, Vertier and Viskanic (2018) use the size of holiday villages in France and Harmon (2018) exploit the historical share of high-rise buildings in the Danish municipalities. Hangartner et al. (2019) adopt a slightly different method using the distance between several Greek Islands and Turkey to instrument their exposure to immigrants. Similarly, Mayda et al. (2016) investigate the case of the United States considering the distance between each U.S. state and the country of origin of immigrants to be a valid instrumental variable approach. Furthermore, Brunner and Kuhn (2018) argue that an exogenous determinant of the immigrant share in the municipalities of Switzerland is the immigrant share in a broader geographical area. Arguably, the most commonly used method among the existing literature relies on the assumption that recent immigration tends to follow historical settlement patterns of past immigration with the same ethnicity. Pioneered by Altonji and Card (1991), this shift-share technique has been used in several studies within various fields of economics (Card, 2001; Dustmann et al., 2005; Saiz, 2007; among others). In the context of political outcomes, Otto and Steinhardt (2014) were among the first to evolve this approach when instrumenting the share of foreigners in a district by the share of foreigners in the same district ten years earlier. More recent papers have followed and used an analogous setup when instrumenting actual immigration shares (Mendez and Cutillas, 2014; Barone et al., 2016; Halla et al., 2017; Chletsos and Roupakias, 2018; Edo et al., 2018). Following this important body of existing literature, I implement a shift-share method to address any concerns related to the potential endogenous variation in the settlement of immigrants. Using the historical spatial distribution in 1998 as a source of exogenous variation, I argue that any subsequent local shocks or political attitudes are uncorrelated to immigrants’ past residential patterns. Combining this instrumental variable approach with fixed effects and a set of control variables, both the potential omitted variable bias and the reverse causality issues are assumed to be left out.

5
A common feature in most of the studies relying on the shift-share instrument is to only use the current share of immigrants as the main independent variable. By using this approach it is not possible to make any distinction between short-term and more persistent effects of immigration. This aspect is emphasized by Jaeger et al. (2018) when they criticize the widely used shift-share instrumental method for the failure to consider any dynamic aspects. They focus on the wage effects of immigration, but it is highly relevant for political outcomes as well. To adapt the approach to not conflate the short- and long-run responses, they suggest including a lagged version of the instrumental variable in the model. Levi et al. (2020) extend this suggested approach and apply it on the case of the potential linkage between immigration and far-right voting in the UK. By the inclusion of a two-year lag of the instrumented immigration share, and further a linear transformation of the explanatory variables, they are able to split up the standard static approach to consider both the current immigration share and the recent immigration inflow. Furthermore, they show that mainly the latter one, the immigration inflow, drives the results of a positive relation between increased immigration and the support for far-right parties. Their results provide evidence to the hypothesis that hostility towards immigration is temporary. Social and economic frictions that potentially emerge at the beginning of new migrant inflows might cease with a successful integration. Over time, the presence of immigrants might not positively affect the far-right political outcomes and, thereby, the “hate at first sight” effect is what explains the estimated positive impact of immigration on right-wing votes. However, it is also conceivable to introduce the opposite theory; the initial willingness among natives to receive immigrants could gradually turn into xenophobia due to lack of a sustainable integration in the hosting country. Altogether, these two contradicting hypothesis suggest that the time aspect of immigration is of greatest importance to consider to correctly evaluate the effects on voting results. To document whether a dynamic process exists in the impact of immigration on political outcomes in Sweden, I follow the method suggested by Levi et al. (2020). By adding a two-year lag of the instrumented immigration share and performing a linear transformation, a distinction between the current immigration share and the most recent immigration inflow is possible. Applying this approach on the case of Sweden is of a particular interest considering the large yearly variation in immigration inflows during the last years. The main findings of this paper can be summarized as follows. By implementing the instrumental variable approach and including both the current share and the most recent inflow of immigrants, a dynamic process in the impact of immigration on political outcomes is revealed. The inflow of immigrants is shown to have a positive effect on the support for the Sweden Democrats, while the share of foreign-born has a negative impact. Considering the aggregated group of pro-immigration parties, the opposite results are estimated (although the negative effect of the immigration inflow is slightly insignificant). These findings indicate that the hostility towards immigrants is mainly temporary and concentrated to the arrival of new immigrants. The presence of immigrants, per se, seems not to be a source of anti-immigration sentiments. The results are robust to a number of different sample and model specifications. However, when the sample is split at the median, according to various control variables in an attempt to explore the channels behind the results, the multiple instruments drop in predictive power. Due to the weakness of the instruments, no clear conclusions can be drawn about what factors

6
are the main drivers of the positive relationship between an inflow of immigrants and anti-immigration support. Nevertheless, the different sample splits suggest that concerns about the neighborhood quality is more important than worries about labor market competition and other private economical factors. The neighborhood quality concerns could take the shape of animosity towards cultural and religious diversity, which is partly a result of prejudices. This further strengthens the hypothesis that the time path of immigration is important to examine and the immigration skepticism is mainly concentrated to the arrival of new immigrants. This paper contributes to the literature examining the impact of immigration on electoral outcomes. Among the first to study the causal effect of immigration on political support were Otto and Steinhardt (2014). Their paper focuses on the influx of immigrants to the German city of Hamburg in the 1987 to 1998 period. Consistent with the large majority of more recent work they find a positive relationship between increased immigrant shares among the local population and the support for far-right parties with a clear anti-immigration agenda. Edo et al. (2018) find similar effects when they investigate the linkage between immigration to France and the support for far-right parties in the presidential elections held between 1988 and 2012. They suggest there are heterogeneous effects based on the characteristics of the immigrants and conclude that mainly low-educated immigrants from non-western countries drive the results. The fact that only a specific group of immigrants positively affect electoral support for right wing parties has been further proved in several studies. Halla et al. (2017) reveal a positive relation between immigration to Austria and the electoral success of FPOE, a party with an anti-immigration stance. This positive linkage mainly stems from low-skilled immigrants. Harmon (2018) finds that the country of origin among the immigrants has a significant impact on the election outcomes in Denmark and only immigrants from non-western countries are positively associated with an increased vote share of parties in the right end of the political spectrum. Similarly, Mendez and Cutilla (2014) show that only African immigrants have this effect in Spain, while Brunner and Kuhn (2018) document that especially a higher share of cultural different immigrants is correlated with an increased support for anti-immigration policies in the political system of direct democracy in Switzerland. Another relevant finding is that the nexus between immigration and electoral outcomes differ between urban and rural environments. Barone et al. (2016) and Dustmann et al. (2018) both investigate this connection with far-right voting and they only find a positive effect if excluding larger cities for the cases of Italy and Denmark, respectively. Conversely, several studies establish the opposite results and reveal a negative relation between immigration and right-wing support. Steinmayr (2016) exploits the migrant crisis in 2015 to document a negative effect on far-right voting of the exposure to refugees in Austria. Closely related, Vertier and Viskanic (2018) demonstrate similar results when investigating the effect of local refugee center establishments during the migrant crisis on electoral outcomes in France. Finally, Mayda et al. (2016) focus on the House elections in the United States and suggest no significant effect on the vote share of the Republican Party when considering moderate levels of immigration. However, for larger shares of immigrants a significant positive effect is noticed. The results of these three studies all contribute to the contact hypothesis proposed by Allport (1954), stating that interaction with individuals belonging to other groups reduces prejudices and limits the scope of xenophobia.

7
When shifting focus to the other end of the political spectrum by looking at studies evaluating the influence of immigration on left-wing and typically pro-immigration parties, the literature is scarce and the conclusions even more unclear, compared to right-wing parties. A group of studies all find an overall negative influence of immigration on the left-wing political support (Barone et al., 2016; Dustmann et al., 2018; Harmon, 2018; Chletsos and Roupakias, 2018). Nevertheless, other papers show overall a positive effect (Gerdes and Waldensjo, 2008), a positive effect related to certain characteristics among the immigrants (Mendez and Cutillas, 2014), a positive effect up to a specific level of immigrants (Mayda et al., 2016) and no robust effects on the electoral support for immigration-friendly parties (Edo et al., 2018). According to this important body of literature, no clear conclusions can be drawn about the case of left-wing parties since the results heavily depend on the context of the study. The existing literature on immigration and voting in the specific case of Sweden is scarce. The only paper to estimate the potential causal connection is Mehic (2019). Using a Swedish nationwide policy experiment implemented in 2015, he finds a positive and significant impact of immigration on the increased vote share of the anti-immigration political party the Sweden Democrats between the two parliamentary elections in 2014 and 2018. Due to this policy experiment, where refugees were randomly allocated to municipalities, an exogenous variation in the share of refugees in each municipality is assumed. This paper will contribute to the literature in several ways. It extends the study by Mehic (2019) to consider a larger period of time. This implies an inclusion of several elections, which is of particular interest due to the large increase in both immigration, but also support for the Sweden Democrats during this period of time. In contrast to related Swedish immigration studies that only focus on refugee immigration, this study includes all different types of immigrants. Given the case of Sweden and the specific context of voting outcome, there is so far no study to adopt the shift share approach to overcome concerns related to the potential endogenous distribution of immigrants. Furthermore, it expands the literature on the dynamic aspect of immigration and is, to the best of my knowledge, the first paper to apply it on the political outcomes in Sweden. Finally, it complements the scarce literature evaluating the impact of immigrant on left-wing political support. The remainder of the paper is organized as follows. Section 2 describes the immigration trends in Sweden, together with a background of the political system. In section 3, the empirical strategy is presented and the identifying assumptions are discussed. Section 4 introduces the data and provides descriptive statistics. In section 5, the empirical results are revealed, along with a number of robustness tests to ensure the validity of the selected strategy. Section 6 presents a number of additional results, in an attempt to explore possible channels behind the main findings of the paper. Finally, section 7 concludes.

8
2 Background
2.1 Immigration to Sweden Immigration is a widely discussed topic in most of the European countries. In 2018, the foreign-born share of the total population in the European Union reached 11.7 percent. In Sweden the corresponding share was 18.5 percent, which implies that only Luxembourg, Cyprus and Austria had a larger share among the countries within the European Union (Eurostat, 2020b). In a historical perspective, the larger inflows of immigrants to Sweden started in the 1950s in the wake of the Second World War. After the initial wave of war refugees from the neighboring countries, the larger inflow mainly consisted of labor migrants from the Nordic countries, in particular Finland, together with Greece, Italy and other Southern European countries. In 1970, the immigrant population reached a number of over 537,000, equivalent to almost 6.7 percent of the total population (SCB, 2020c). During the following decades, the labor migrants decreased gradually and were replaced by refugees seeking asylum for political reasons. In the 1980s immigrants mainly arrived from Iran and in the early 1990s Yugoslavia became the primary source country (Migrationsverket, 2020a). Figure 1 shows the yearly inflow of immigrants during the period of time related to my study. After the increase in 2006, the next coming years exhibited a stable inflow with a yearly average of around 85,000. In 2013, primarily related to the onset of the war in Syria, the number of immigrants started to rise sharply and reached its peak in 2016 with an amount of nearly 150,000 new arrivals. However, in the succeeding two years the numbers decreased, mainly as a consequence of tightness in the Swedish migration regulation. The contemporary immigration to Sweden exhibits a fairly heterogeneous group of migrants, which can be broadly divided into three different categories. The first one constitutes of those seeking a residence permit to study or work in Sweden, including their relatives. In the second category there are refugees applying for asylum in order to seek protection from war and persecution. Finally, the relatives of previous refugees make up the third category (Migrationsverket, 2020b). As stated in Figure 1, primarily the large variation in the second category, the refugee inflow, is the main source of the total variation in immigration levels during the sample period of this paper. (Figure 1) Changing focus to the share of immigrants, in lieu of the immigration inflow, the number of foreign-born has heavily increased during the relevant years. The amount of individuals born abroad in 2004 measured around 1.1 million, while the corresponding number for 2018 reached over 1.95 million, which can be seen in Figure 2. As a consequence of the different types of immigration, there is a large variation in the characteristics of the countries from where a majority of the immigrants have arrived. Asian countries, in particular Syria, Iraq and Iran are all among the largest countries of origin, together with the geographically closely located European countries Finland, Poland and former Yugoslavia. (Figure 2)
9
2.2 The electoral system and political parties in Sweden The political decision-making in Sweden is divided into three levels, the 290 municipalities, the 21 counties and the national parliament. The elections for the three levels are all held at the same date in September, every fourth year. The most recent elections were held on September 9, 2018. There are 349 seats in the national parliament altogether. They are proportionally distributed based on the vote share each party receives in the parliamentary election. The minimum threshold is 4 percent, meaning no party below that vote share will be assigned a seat. The turnout during the last decades has been on a level between 80 and 90 percent. To have the right to vote in the parliamentary election, a Swedish citizenship is required and a minimum age of 18 years old. In the elections to municipality assembles and county councils, a Swedish citizenship is not required if the individual has been registered in Sweden for at least three consecutive years. During the modern political history in Sweden, the centre-left Social Democrats have been the dominating party. The main opposition has been the centre-right Moderate Party and in 2006 they won the parliamentary election, forming the centre-right coalition, the Alliance. They kept the position as the govern coalition in the 2010 election, but lost it in 2014 when the Social Democrats, together with the Green Party, formed a centre-left government. Finally, the election in 2018 yielded no clear winner and a lengthy process was required before the red-green coalition could remain in power.
2.2.1 Right-wing parties The, by far, most successful right-wing party in Sweden is the Sweden Democrats. With a history of an absence of right-wing populist parties in the Swedish parliament, aside from the occasional appearance of New Democracy in the early 1990s, the entrance of the Sweden Democrats has transformed the Swedish political landscape. Founded in 1988, they have made an incomparable political journey during the last decades, which can be seen in Figure 3. After receiving 2.6 percent of the national vote in the 2006 election, they broke the 4 percent threshold and were elected into the parliament for the first time in 2010. Four years later, they became the third largest party and in the most recent election, in 2018, they further increased their support to a vote share of 17.53 percent. (Figure 3) As shown in Figure 4, the support for the Sweden Democrats differs between rural and urban areas. The first ones are the strongholds in the support for the Sweden Democrats, particularly in the southern part of the country. In the latter ones, mainly the capital Stockholm and the second city Gothenburg, the support is much weaker. Also in the northern parts, traditionally strongholds of the Social Democrats and the Left Party, the support is relatively low. (Figure 4) The roots of the party lead to Swedish fascism and several of the founders had connections to neo-Nazi movements and extreme far-right parties. Originally, the party exhibited a clear anti-immigration profile based on xenophobic attitudes and biological racism (Widfeldt, 2008).

10
Gradually as the party grew, the political stance has been moderated and local representatives with racism agendas have been expelled. The nationalism has partly been replaced by social conservatism and more focus is put on traditional family values and the welfare state. However, the Sweden Democrats still favor clear immigration reduction policies and manifest a total freeze on receiving asylum seekers. They oppose multiculturalism and reject the idea of a successful integration of migrants, mainly regarding refugees from Muslim countries. Moreover, they adopt a strict stance on criminal justice and a skeptical approach to the European Union (Rydgren, 2018). As a consequence of the past linkage to white-power movements and the current stand against immigrants, the party has been isolated in the political discussion. Until the election in 2018, all other political parties have refused to cooperate with the Sweden Democrats in both the national parliament, as well as in regional parliaments and in municipal assembles (Mehic, 2019).
2.2.2 Left-wing parties Among the seven traditional political parties in the parliament, thus excluding the Sweden Democrats, it is not doubtless which of them that have advocated the most immigration-friendly policies during the last couple of decades. For a long time, they all shared quiet equal perceptions of the migration policies, which exceeded the traditional right-left ideological positions. Since the early 2000s and until the refugee crisis in 2015, they all promoted a generous migration policy. To serve as an example, the centre-right Alliance and the Green Party reached a broad agreement of a continued open migration policy in 2011. However, the large and sudden inflow of refugees in 2015 changed the political stance on immigration among a majority of the parties. Both the Moderates and the Social Democrats drastically discarded their previous principles and adopted considerably more restrictive migration policies, in order to reduce the number of asylum seekers and family migrants. The Christian Democrats and the Liberal Party both followed, even though not to the same extent and with a more hesitant approach to the turnaround. The Centre Party took an imprecise policy position by keeping the support for an open migration policy, but similarly open up the possibility to restrict the socio-economic rights for the migrants. The only two parties that fully maintained their generous migration policies were the Left Party and the Green Party (Emilsson, 2018). Furthermore, according to repeated surveys from the SOM Institute at the Gothenburg University, the supporters of the Left Party and the Green Party are those with the most negative attitudes towards a decrease of refugee receiving. They also share the most positive attitudes towards multiculturalism and the value of an equal standard of living for immigrants. Since the surveys were held in 2008, 2015 and 2018, the results are robust to the effects of the 2015 refugee inflow (Demker, 2019). Considering the big turnarounds in the migration policies in the wake of 2015, combined with the public opinion among the political supporters, arguably the Left Party and the Green Party have been the most immigration-friendly parties during the relevant period of this study. The Left Party, a former Communist Party, nowadays running a policy mainly focused on socialism and feminism. For a long time they have been promoting a more liberalized asylum policy in both Sweden and in the European Union. They call for open borders to make the European Union more accessible for refugees and promote a benevolent family-migration
11
policy. The Green Party, with an ideology of green politics, favors a return to the previous migration legalizations. They want Sweden to state as an example in the international context and to take a large responsibility in the asylum policies (Emilsson, 2018). As can be seen in Figure 4, the strongholds of the Left Party are principally localized in the northern parts of the country. The support for the Green Party, in turn, is mainly concentrated to the southern parts, specifically in the areas around the three largest cities Stockholm, Gothenburg and Malmö. An important aspect to consider is whether the three selected political parties could be treated as the same types of parties, i.e. parties with a clear stance in the immigration debate and mainly attract voters based on their position in it. As previously described, The Sweden Democrats have been the only political party with a clear anti-immigration agenda during the whole sample period and with their large focus on a restriction of immigration they can be seen as a one-policy-party. On the other hand, the Left Party and the Green Party have not been the only political parties with a positive attitude towards immigration, although they have had the most positive attitudes. Moreover, since the Left Party have a large focus on socialism and feminism and the Green Party have a clear green profile, none of them can be seen as a party with an almost entirely focus on immigration policies. This implies that a voter with a pro-immigration attitude, potentially, include a consideration of several aspects before deciding which political party to cast their vote on, compared to an individual with a strict stance against immigration. Consequently, in the absence of a left-wing party with an absolute focus on pro-immigration policies, there is probably a more direct linkage between immigration and the support for the Sweden Democrats, in comparison to the Left Party and the Green Party. This is an important aspect to keep in mind during the analysis of this paper.
12
3 Empirical strategy
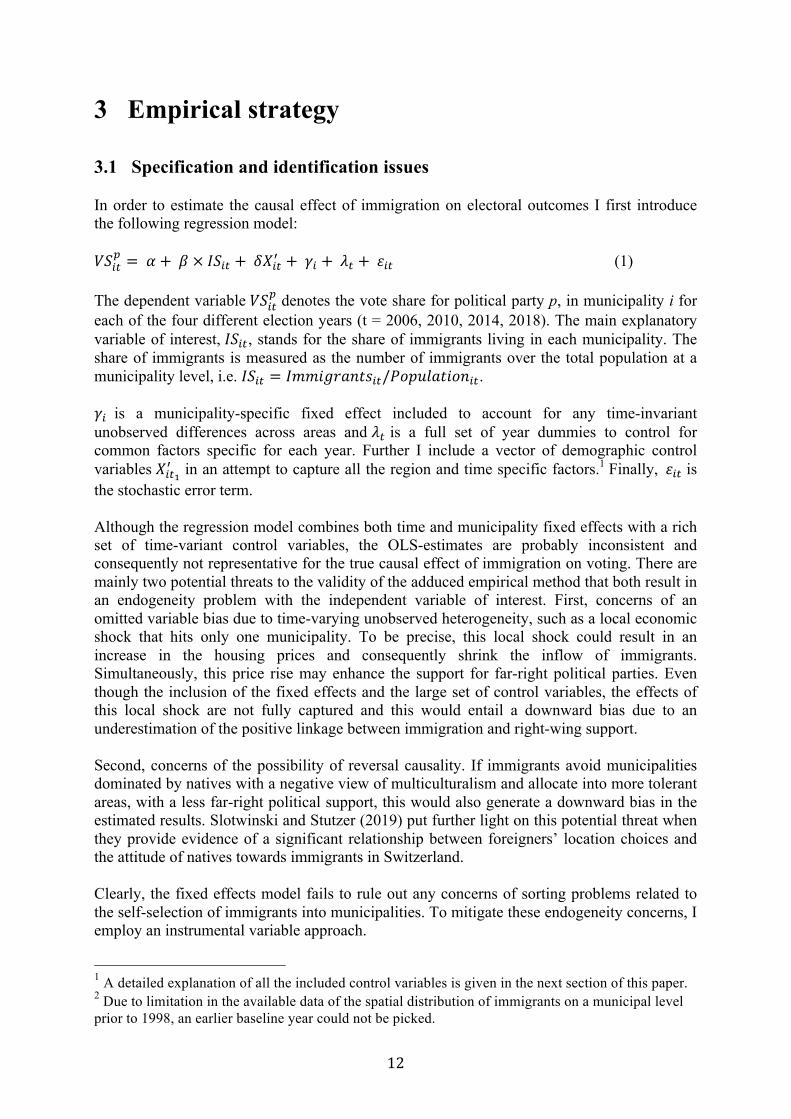
3.1 Specification and identification issues In order to estimate the causal effect of immigration on electoral outcomes I first introduce the following regression model: 𝑉𝑆!"
! = 𝛼 + 𝛽 × 𝐼𝑆!" + 𝛿𝑋!"! + 𝛾! + 𝜆! + 𝜀!" (1)
The dependent variable 𝑉𝑆!"! denotes the vote share for political party p, in municipality i for
each of the four different election years (t = 2006, 2010, 2014, 2018). The main explanatory variable of interest, 𝐼𝑆!", stands for the share of immigrants living in each municipality. The share of immigrants is measured as the number of immigrants over the total population at a municipality level, i.e. 𝐼𝑆!" = 𝐼𝑚𝑚𝑖𝑔𝑟𝑎𝑛𝑡𝑠!"/𝑃𝑜𝑝𝑢𝑙𝑎𝑡𝑖𝑜𝑛!".
𝛾! is a municipality-specific fixed effect included to account for any time-invariant unobserved differences across areas and 𝜆! is a full set of year dummies to control for common factors specific for each year. Further I include a vector of demographic control variables 𝑋!"!
! in an attempt to capture all the region and time specific factors.1 Finally, 𝜀!" is the stochastic error term. Although the regression model combines both time and municipality fixed effects with a rich set of time-variant control variables, the OLS-estimates are probably inconsistent and consequently not representative for the true causal effect of immigration on voting. There are mainly two potential threats to the validity of the adduced empirical method that both result in an endogeneity problem with the independent variable of interest. First, concerns of an omitted variable bias due to time-varying unobserved heterogeneity, such as a local economic shock that hits only one municipality. To be precise, this local shock could result in an increase in the housing prices and consequently shrink the inflow of immigrants. Simultaneously, this price rise may enhance the support for far-right political parties. Even though the inclusion of the fixed effects and the large set of control variables, the effects of this local shock are not fully captured and this would entail a downward bias due to an underestimation of the positive linkage between immigration and right-wing support. Second, concerns of the possibility of reversal causality. If immigrants avoid municipalities dominated by natives with a negative view of multiculturalism and allocate into more tolerant areas, with a less far-right political support, this would also generate a downward bias in the estimated results. Slotwinski and Stutzer (2019) put further light on this potential threat when they provide evidence of a significant relationship between foreigners’ location choices and the attitude of natives towards immigrants in Switzerland. Clearly, the fixed effects model fails to rule out any concerns of sorting problems related to the self-selection of immigrants into municipalities. To mitigate these endogeneity concerns, I employ an instrumental variable approach.
1 A detailed explanation of all the included control variables is given in the next section of this paper. 2 Due to limitation in the available data of the spatial distribution of immigrants on a municipal level prior to 1998, an earlier baseline year could not be picked.
13
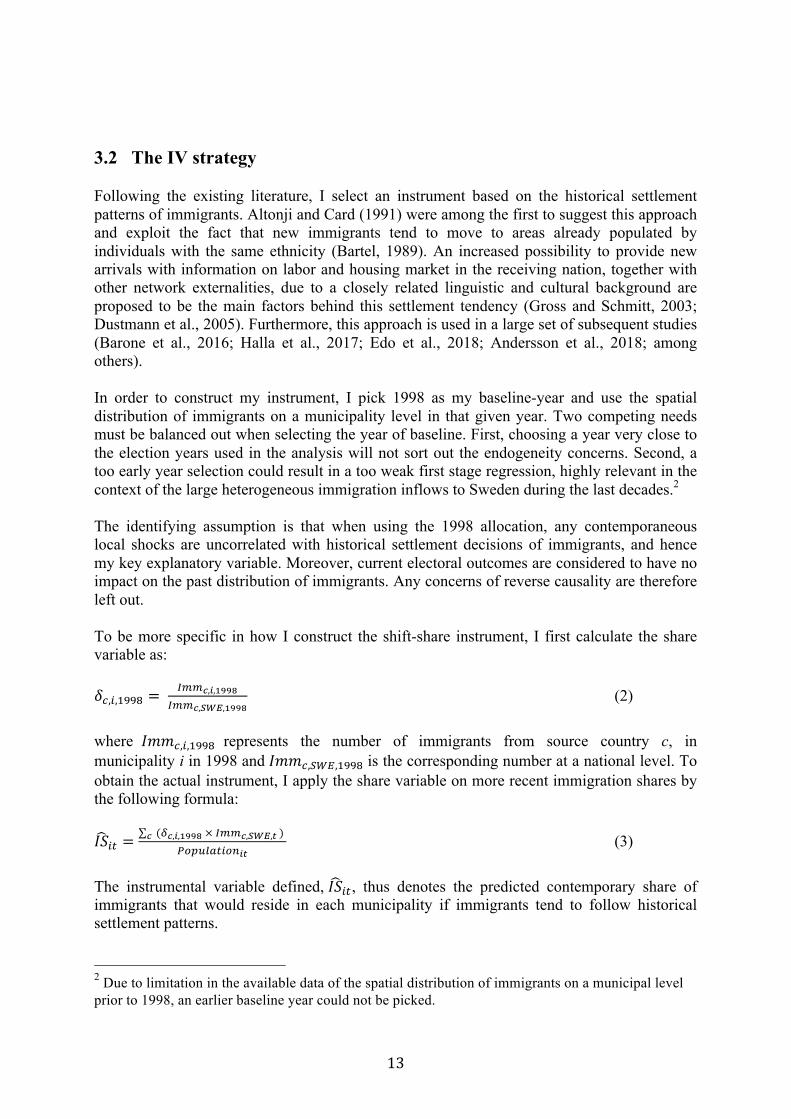
3.2 The IV strategy Following the existing literature, I select an instrument based on the historical settlement patterns of immigrants. Altonji and Card (1991) were among the first to suggest this approach and exploit the fact that new immigrants tend to move to areas already populated by individuals with the same ethnicity (Bartel, 1989). An increased possibility to provide new arrivals with information on labor and housing market in the receiving nation, together with other network externalities, due to a closely related linguistic and cultural background are proposed to be the main factors behind this settlement tendency (Gross and Schmitt, 2003; Dustmann et al., 2005). Furthermore, this approach is used in a large set of subsequent studies (Barone et al., 2016; Halla et al., 2017; Edo et al., 2018; Andersson et al., 2018; among others). In order to construct my instrument, I pick 1998 as my baseline-year and use the spatial distribution of immigrants on a municipality level in that given year. Two competing needs must be balanced out when selecting the year of baseline. First, choosing a year very close to the election years used in the analysis will not sort out the endogeneity concerns. Second, a too early year selection could result in a too weak first stage regression, highly relevant in the context of the large heterogeneous immigration inflows to Sweden during the last decades.2 The identifying assumption is that when using the 1998 allocation, any contemporaneous local shocks are uncorrelated with historical settlement decisions of immigrants, and hence my key explanatory variable. Moreover, current electoral outcomes are considered to have no impact on the past distribution of immigrants. Any concerns of reverse causality are therefore left out. To be more specific in how I construct the shift-share instrument, I first calculate the share variable as: 𝛿!,!,!""# = !""!,!,!""#
!""!,!"#,!""# (2)
where 𝐼𝑚𝑚!,!,!""# represents the number of immigrants from source country c, in municipality i in 1998 and 𝐼𝑚𝑚!,!"#,!""# is the corresponding number at a national level. To obtain the actual instrument, I apply the share variable on more recent immigration shares by the following formula: 𝐼𝑆!" =
(!!,!,!""# × !""!,!"#,! ) !
!"#$%&'(")!" (3)
The instrumental variable defined, 𝐼𝑆!", thus denotes the predicted contemporary share of immigrants that would reside in each municipality if immigrants tend to follow historical settlement patterns.
2 Due to limitation in the available data of the spatial distribution of immigrants on a municipal level prior to 1998, an earlier baseline year could not be picked.
14
For the instrument to be valid, both the exogeneity and the relevance conditions must be fulfilled.3 While the latter one is easy to test, as further discussed below, the assumption of exogeneity is only possible to test in an over-identified model. Since my chosen model is exactly identified, with the number of instruments equals the number of endogenous regressors, the exogeneity restriction is ultimately untestable. However, relying on the large literature using a similar instrument within this area of research, I argue that the choice of baseline year implies a sufficient time lag to address any endogeneity concerns. Conditional on the inclusion of both municipal fixed effects and the rich set of time-varying controls, the historical settlement patterns of immigrants are assumed to be uncorrelated to any unobserved variables that also affect the contemporary electoral outcomes.4 Choosing the immigration share in 1998 also brings the advantageous feature to precede a heavy change in the Swedish political landscape. As described in the background section, the support for the Sweden Democrats was utterly marginal until the early 2000s, while the positions of the Left Party and the Green Party as the undoubtedly most immigration friendly parties have appeared during the last decade. This guarantees that the pre-1999 settlement decisions among immigrants were not guided by any contemporary political positions and further validates the exogeneity condition of the instrument. To examine the relevance condition I test for both under-identification and weak identification of the instruments. The former one evaluates whether the instrument is correlated with the endogenous variable at all and the latter one tests if they are only weakly correlated. Anderson canonical correlations Lagrange multiplier and Kleibergen-Paap rk Lagrange multiplier are two statistics widely used for testing under-identification of a model. Since the standard errors in my specification are clustered at a municipality level due to heteroscedasticity, non-i.i.d. errors are assumed and only the latter one of the two statistics is valid (Kleibergen and Paap, 2006). Therefore, I report the Kleibergen-Paap rk LM statistic for all instrumental variable regressions to ensure that the null hypothesis, there is no correlation between the instrument and the endogenous variable, is rejected at a 90 percentage level. Although an instrument has predictive power, the first stage relationship could be weakly identified. To evaluate whether my chosen instrument is sufficiently correlated with the endogenous regressors, I report the F-statistic testing the significance of the instrument. The rule of thumb, as suggested by Stock et al. (2005), is a F-statistic above 10 to ensure no presence of weak instruments. This standard critical value is based on the Cragg-Donald F-statistic, which assumes i.i.d. errors. Since I use robust and clustered standard errors in the fixed effects regressions, the Kleibergen-Paap F-statistic is, therefore, typically preferred. In the absence of an alternative threshold value, I follow the existing literature and apply the
3 The exogeneity condition implies that the mean of the error term (u!), conditional on the control variables (W!), is independent of the instrument (Z!): E u! Z!,W! = E u! W! . The relevance condition implies that the instrument has predictive power: E X! Z!,W! ≠ E X! W! (Stock and Watson, 2014, p. 474). 4 Andersson et al. (2018) use a Swedish placement policy of refugees in the early 90’s as their baseline years to further address any concerns of endogeneity. Due to the limited availability of the required data, I could not follow their approach.

15
same rule of thumb, i.e. a Kleibergen-Paap F-statistic above 10 (see e.g. Mayda et al., 2016; Halla et al., 2017).5
3.3 The dynamic aspect So far, the proposed empirical strategy will only catch the aggregated effects of changes in the share of immigrants residing in a municipality. However, as launched by Jaeger et al. (2018) and further explored by Levi et al. (2020), an interesting aspect to examine is whether any dynamic effects exist. To be more precise, the effects of immigration in a short-term perspective, potentially, differ from the longer-term effects. By the inclusion of only one explanatory variable denoting the share of immigrants at time t, these two effects are not separated and the dynamic aspect of immigration is not fully considered. To examine whether a dynamic effect of immigration on the political outcomes exists, I adopt a finite distributed lag model, following the approach implemented by Levi et al. (2020). In this empirical framework I extend the main explanatory variable to consider both the current immigrant share and a lagged version of the immigrant share in each municipality: 𝑉𝑆!"
! = 𝛼 + 𝛽! × 𝐼𝑆!" + 𝛽! × 𝐼𝑆!,(!!!) + 𝛿𝑋!"! + 𝛾! + 𝜆! + 𝜀!" (4) 𝐼𝑆!,(!!!) denotes the share of immigrants in each municipality two years preceding an election (t-2 = 2004, 2008, 2012, 2016).6 Even though this two-year lagged variable is included, the main question how to isolate and interpret the dynamic effects still stands. To distinguish between the potential different effects of the existing share and the recent inflow of immigrants, a linear transformation of equation (4) is required as per the following: 𝑉𝑆!"
! = 𝛼 + 𝛽! × 𝐼𝑆!" + 𝛽! × Δ𝐼𝑆!" + 𝛿𝑋!"! + 𝛾! + 𝜆! + 𝜀!" (5) where 𝛽! = 𝛽! + 𝛽!, 𝛽! = −𝛽! and Δ𝐼𝑆!" = 𝐼𝑆!" − 𝐼𝑆!(!!!). This new specification allows a direct interpretation of the coefficient 𝛽! as the effect of the present share of immigrants on the outcome variable of interest. The interpretation of 𝛽!, in turn, is the effect of the change in the share of immigrants between t and t-2, equally to the inflow of immigrants during the last two years. Running any least squares estimation of equation (5) will generate both the same results and the same properties of the estimators as equation (4), once the linear transformations of 𝛽! and 𝛽! have been considered.7 However, since the standard errors of the coefficients in the two equations will differ and with the opportunity to directly interpret 𝛽! and 𝛽! as the effects of the immigration share and the immigration inflow, respectively, equation (5) is preferred.
5 In the lack of studies providing critical values of the Kleibergen-Paap F-statistic, I also report the Cragg-Donald F-statistic for all regressions. Moreover, there are similar studies with an assumption of non-i.i.d that rely solely on the Cragg-Donald F-statistic (see e.g. Barone et al., 2016).6 The share of immigrants is measured on December 31, each year, and the elections are held in September. For that reason, I argue using the two-year lag is the preferred approach to catch the effects of the recent immigration inflow on the electoral outcomes. As a robustness test, I also employ the immigration share lagged with one year. 7 To verify this I report the resulting estimates of using equation (4) in Appendix 3.

16
To overcome the potential endogeneity concerns related to the actual share of immigrants, I implement the already proposed instrumental variable strategy on both the current immigration share and the lagged share of immigrants. This solution implies two first stages: 𝐼𝑆!" = 𝑎 + 𝑏! × 𝐼𝑆!" + 𝑏! × 𝐼𝑆!,(!!!) + Γ𝑋!"! + 𝜂! + 𝜃! + 𝜇!" (6) 𝐼𝑆!(!!!) = 𝑎 + 𝑏! × 𝐼𝑆!" + 𝑏! × 𝐼𝑆!,(!!!) + Γ𝑋!"! + 𝜂! + 𝜃! + 𝜇!" (7) The two first stages then give the following second-stage regression, representative of the instrumental variable version of equation (4): 𝑉𝑆!"
! = 𝛼 + 𝛽!!"× 𝐼𝑆!" + 𝛽!!" × 𝐼𝑆!,(!!!) + 𝛿𝑋!"! + 𝛾! + 𝜆! + 𝜀!" (8) Finally, by performing the same linear transformation as of equation (5), the desired regression specification is constructed, combining both the dynamic aspect and the instrumental variable strategy: 𝑉𝑆!"
! = 𝛼 + 𝛽!!" × 𝐼𝑆!" + 𝛽!!" × Δ𝐼𝑆!" + 𝛿𝑋!"! + 𝛾! + 𝜆! + 𝜀!" (9)
17
4 Data and descriptive statistics 4.1 Data The main analysis of this paper employs data on a municipal level. In total, Sweden consisted of 290 municipals during the whole sample period. From these I merge Knivsta Municipality and Uppsala Municipality, since they formed the same municipality until 2003 and thus not listed separately in the historical immigration data from 1998, used to construct my instrumental variable. All data used in the thesis is collected from the three sources Statistics Sweden, Swedish Association of Local Authorities and Regions and The Swedish National Council for Crime Prevention.
4.1.1 Data on electoral outcomes The outcome variable is the share of votes received by the selected parties in the elections held in 2006, 2010, 2014 and 2018. The vote share is measured as the number of votes received by the specific party, divided by the total number of valid votes. In the main analysis I consider only elections to the national parliament. The main reason is the presence of several small and local parties who only participate in the local elections. Some of these parties share political agendas, such as immigration skepticism, with the large national parties and make the intermunicipal comparison more complex. However, as a supplementary analysis in the additional results section of this paper, I consider the municipality election outcomes. As already described in detail, the political party I pick to represent the right wing of the Swedish political spectrum is the Sweden Democrats, the only clear anti-immigration party during the full period of study. From the opposite side of the spectrum, the left wing, I select the Left Party and the Green Party as the parties with the most pro-immigration policies. During the whole paper I use the cumulative vote share of these two parties when I evaluate any effects on the left-wing support.
4.1.2 Data on immigration In order to construct the main explanatory variable, the share of immigrants, I exploit a data set showing the number of foreign-born individuals registered in each Swedish municipality.8 By dividing that number by the total population in each municipality, I construct the desired variable measuring the share of immigrants. In the first step of the main empirical analysis, I gather data for all the four election years. In the second step, where I also evaluate the effects of the immigration inflows, I further exploit data of the immigration shares two years preceding each of the four elections years. The usage of this data generates two implications. Firstly, an immigrant is defined as an individual born abroad. This definition of immigrants is commonly used in the literature (see e.g. Levi et al., 2020). However, it entails a non-distinguish between the different types of immigrants, such as asylum refugees, labor migrants and relatives. Ideally, it would be of interest to be able to have them separated, but due to the limitations of the data, this is
8 The statistic is measured on December 31, each year.
18
unfortunately not possible. Secondly, a person is only included if it is registered in Sweden. An asylum seeker is considered as registered once it has received a residence permit, and hence not included prior to that. This implies that foreign-born individuals residing in Sweden without a residence permit, no matter if they are waiting for a decision or stay illegally, are not included in the immigration statistics. Due to the lack of any official data on those individuals, this potential measurement error in the independent variable is left unsettled and the results may be biased downward. In the creation of the employed instrumental variable, I use data of the 1998 spatial distribution of immigrants.9 This rich set of data combines the municipal level of foreign-born individuals, with their country of birth.10 It enables calculation of the desired immigration share for each municipality. To further construct the instrument, I use data of immigrants on a national level, split into country of birth,11 for all the election years and the two years preceding. By combining these two data sets, the instrumented immigration shares are estimated.
4.1.3 Data on control variables In an attempt to characterize the municipalities, I include a large set of socioeconomic and demographic control variables.12 With respect to the inclusion of fixed effects, I consider time-variant covariates only. The total population in each municipality and the population density are added to capture any urban-specific features. To cover any socioeconomic concerns, I deploy the share of the population with a tertiary education of at least three years and the share with an income above the national median. Furthermore, the crime rate, defined as the total number of reported crimes per capita, and the employment rate among the population aged 20 to 64 are also included. All data on the control variables are available for all the four election years examined in this paper.
4.2 Summary statistics Table 1 provides a summary statistics of all the variables used in the main analysis of this paper.13 When comparing the vote shares received by the right-wing and the left-wing parties, they both exhibit similar mean values. However, there is a much larger standard deviation and greater difference between the minimum and maximum values in the right-wing support. This indicates that there is a larger variation, both over time and between municipalities, in the support for the Sweden Democrats compared to the aggregated two left-wing parties. 9 The data set states the number of foreign-born individuals registered in each municipality on January 1, 1998. 10 Not all countries are specified in the data. The nations are clustered as: Nordics, EU15 non-Nordics, Bosnia, Yugoslavia, Poland, rest of Europe, Somalia, rest of Africa, Turkey, Iran, Iraq, rest of Asia, Chile, rest of South America, US, rest of North America, Oceania, Soviet Union and unknown. 11 Since the data is on a nation specific level, I aggregate the countries into the same clusters as the data of the distribution in 1998. 12 See Appendix 1 for a detailed description of how all the variables are constructed. 13 As further described in the results chapter, six municipalities are excluded in the main analysis to ensure relevance of the instrumental variables. Those six municipalities are left out in all statistics reported in this section. In Appendix 2 a similar summary statistics is presented, including all municipalities.
19
(Table 1) Turning to the immigration variables, the mean of the actual share of immigrants over the sample period corresponds to 12.1 percent, while the mean of the instrumented immigration share is equal to 11 percent. The standard deviations of the actual and the instrumented variables are nearly identical, but the much lower minimum value and the larger maximum value among the latter one imply a less concentrated distribution of the predicted immigration shares. This tendency is further validated by Figure 5a, where the distribution of the actual immigration share is displayed, and Figure 5b, showing the corresponding distribution of the instrumented immigration share. The two figures reveal that the predicted immigration share has a larger distribution of shares below 10 percent and above 30 percent, compared to the actual immigration shares. Apart from the various concentrations of the distributions, the two figures suggest that the two variables are highly correlated. This further indicates that the predictive power of the instrument is strong enough to fulfill the relevance condition of a valid instrument, as discussed and evaluated in detail in the empirical strategy section. (Figure 5a) (Figure 5b)
20
5 Results In this section I present the empirical results in order to answer the question whether there exists a causal relationship between immigration and the support for far-right and far-left political parties. In the first sub-section I report the OLS results by exploiting the actual immigration share and in the second sub-section I employ the instrumental variable strategy. In the third sub-section, representative of the main results of this paper, I examine the dynamic process in the effects of immigration, by making a distinction between the share of immigrants and the recent inflow of immigrants. In all the three sub-sections I use two different dependent variables: the vote share for the right-wing party, the Sweden Democrats, and the aggregated vote shares for the two left-wing parties, the Left Party and the Green Party. All regressions are weighted by the size of the municipality population and the standard errors are clustered on a municipality level. Moreover, both year and municipality fixed effects are included in all regressions, together with a set of time-variant control variables. When I include all municipalities in the instrumental variable and the dynamic aspect regressions, the Kleibergen-Paap F-statistic falls below 10, which indicates that instrument is too weak.14 To overcome this potential bias, I drop the municipalities with an absolute difference between the instrumented and actual immigrant shares above the 98th percentile, in total six municipalities.15 Finally, in the fourth sub-section of this chapter I perform a number of robustness tests to evaluate potential threats to my results. This includes an estimate of the native out-migration as a response to increased immigration of foreign-born, along with evaluating the sensitivity of the results to alternative samples and re-specifications of the suggested empirical model.
5.1 OLS results Table 2 displays the OLS results with the actual share of immigrants as the main explanatory variable. In column (1) a positive and significant relationship between the immigration share and the support for the Sweden Democrats is reported. An increase of 1 percentage point in the immigration share implies an increased vote share of 0.22 percentage points. The corresponding results for the left-wing support are reported in column (2). The effect of the immigration share remains positive, but with a coefficient closer to zero and no longer significant. (Table 2) As previously described in detail, the estimates based on the actual immigration share are likely to suffer from both omitted variable bias and the presence of reverse causality. Therefore, the OLS results in this section cannot be interpreted as the true causal effects.
14 The Cragg-Donald F-statistic is still above the value of 10 in all regressions. 15 Norsjö, Sävsjö, Ånge, Norrtälje, Sigtuna and Norrköping are the municipalities with the largest absolute difference between instrumented and actual immigration shares in 2018 (|IS!,!"#$ − IS!,!"#$|).
21
5.2 Instrumental variable results Table 3 presents the results from the instrumental variable approach, where the actual immigration share is instrumented by the historical settlement patterns among immigrants. As shown in column (1), the effect on the right-wing voting has turned negative and increased in significance level. An increase of 1 percentage point in the immigration share implies a decrease in the support for the Sweden Democrats with 1.19 percentage points. Turning to the left-wing support, the estimated result remains positive but with a large increase in the magnitude and now highly significant, as can be seen in column (2). (Table 3) The negative linkage between immigration and the support for the Sweden Democrats stands in contrast to the previous findings by Mehic (2019). The contradictory results can largely be explained by the various definitions of the term immigrants. While Mehic (2019) only focuses on the most recently arrived refugees, I include the whole foreign-born population. This implies that I make no distinction between a refugee that arrived during the most recent year and a labor migrant that arrived decades ago. Since new arrivals of immigrants and the already existing share of foreign-born are likely to have divergent impacts on the public opinion of immigration, I extend the analysis to examine the dynamic process of immigration. This approach enables to distinguish between the current share of all foreign-born individuals and the most recent inflow of immigrants.
5.3 Dynamic results The results presented in Table 4, based on equations (5) and (9) to consider the dynamic processes of immigration, reveal a set of interesting findings. Starting with the effect on the right wing support, column (2) reports a positive linkage between the recent immigration inflow and the vote share. More precisely, an increased inflow of 1 percentage point is associated with an increased vote share of 2.35 percentage points for the Sweden Democrats, significant at a 5 percent significance level. The negative coefficient of the immigration share increases in magnitude and remains at a 1 percent level of significance, indicating that some of the positive effect of the immigration inflow was captured by the immigration share coefficient in the previous model specification. (Table 4) A credible interpretation of the estimates is that negative attitudes towards immigration are temporarily and mainly concentrated to the arrival of new immigrants. The immigration hostility seems to diminish over time, perhaps in conjunction with integration into the society of the new arrived. Living in a community with a large share of foreign-born is not, per se, a factor that increases anti-immigration support. This result, the disparity between the long-term and short-term impact of immigration on far-right political support, is in line with the findings of Levi et al. (2020), the closest related study that uses a similar approach as this paper. As expected and serving as a further support of the previous results, using the left-wing vote share as the outcome variable yields the opposite results as the right-wing. Since the left-wing

22
and right-wing parties have contrary agendas regarding migration, this consistency in the different impacts of immigration on the respectively support proves the robustness of my results. Revealed in column (4), an increase of 1 percentage point in the immigration inflow corresponds to 0.89 percentage points fewer votes for the two immigration friendly parties, even though the effect is slightly insignificant. Simultaneously, the estimated positive effect of the immigration share increases in magnitude, compared to the previous specification of the model where the inflow variable is excluded. Columns (1) and (3) represent the OLS results of the dynamic approach. Since the actual immigration share is used as the main explanatory variable, the results are likely to be biased and, hence, not representative for the true causal effect. The extensive differences between the OLS and IV estimates of the immigration inflow highlight the presence of the endogeneity concerns related to the usage of the actual immigration. The large increase in the impact of the immigration inflow on the right-wing support, together with the increased level of significance, suggest a downward bias in the OLS estimates, potentially a result of both reversed causality and omitted variable bias. The similarly effect on the result on the left-wing support further strengthens this theory and highlights the importance of using the instrumental variable approach.
5.4 Robustness tests
5.4.1 Native migration A potential threat to the validity of the identification strategy is the various responses of natives to the increased share of immigrants residing in the municipality. Natives with anti-immigration tendencies could decide the address the sudden influx of immigrants with a move to another municipality, instead of staying and voting far-right. If this is true, the estimated impact of immigration on the support for the Sweden Democrats (left-wing parties) will be understated (overstated). To investigate the importance of the potential native migration response, I follow an approach used by Halla et al. (2017).16 To estimate the impact of immigration allocation on the net outflow of natives, the following model is specified: Δ𝑁!" = 𝛼 + 𝛽 × Δ𝐼!" + 𝛾! + 𝜆! + 𝜀!" (6) where Δ𝑁!" is the growth in the absolute number of natives residing in municipality i between two elections and Δ𝐼!" is the corresponding growth in the number of immigrants.17 𝛽 is the parameter of interest and a statistically significant positive coefficient implies an out-migration response among natives. Table 5 shows the results when all municipalities are included (column 1) and when the six municipalities with the largest absolute difference between actual and instrumented immigration shares are excluded (column 2). The two different specifications yield similar
16 The strategy is evaluated by Peri and Sparber (2011) and is a slightly modified specification of Card (2001). 17𝛥𝑁!" = (𝑁!"! − 𝑁!"!)/(𝑁!"! + 𝐼!"!) and𝛥𝐼!" = (𝐼!"! − 𝐼!"!)/(𝑁!"! + 𝐼!"!)
23
results, both weakly positive but insignificant. This indicates that it there is no support of any strong out-migration response among natives and, consequently, it is very unlikely that it should bias my main results. (Table 5)
5.4.2 Alternative samples To validate the estimated results and to assess the sensitivity of the chosen sample specification, I perform a number of robustness tests using different selection of samples.18 The results are all revealed in Table 6. As a first test and shown in columns (1) and (2), I include the six municipalities previously excluded in the main analysis. Consequently, the Kleibergen-Paap F-statistic falls below 10, indicating that the instrument is too weak. However, the estimated coefficients and their significance levels remain roughly the same, only with a small increase in the magnitude in most of them. This implies that the exclusion of the six municipalities has no large impact on the overall results. As a second test I exclude the election held in 2006 to further address any endogeneity concerns of the instrumental variable. By having 2010 as the earliest election included, the baseline year is chosen twelve years earlier and the exclusion restriction is considerably strengthened. As can be seen in columns (3) and (4), this alternative sample specification implies no major changes in the estimated results, compared to the main specification outcomes. The only difference worth a notice is the reduced positive linkage between the immigration inflow and the right-wing voting, but remaining at the same significance level. A commonly used robustness test in the related literature is to exclude elections held during the closest years following the financial crisis in 2008 (see e.g. Edo et al., 2017). To ensure that the effects of the crisis do not bias my results, I follow this approach and exclude the election in 2010 from my main specification. The results of this third robustness test are presented in columns (5) and (6). Similarly to when excluding the election in 2006, the only notable change in the estimates is a decrease in the magnitude in the positive effect of the immigration inflow on the right-wing support. This time the coefficient is marginally insignificant due to larger standard errors. (Table 6)
5.4.3 Alternative model specifications In the final part of this section, I evaluate the robustness of the main results to various model specifications. The results of the three different model specifications are all presented in Table 7. As a first re-specification of the model I exclude the independent variable share of immigrants, leaving the immigration inflow as the only main explanatory variable. Revealed in columns (1) and (2), the relationship between the arrival of new immigrants and the support for the Sweden Democrats remains positive, with an increase in the magnitude, and highly significant. Also the corresponding negative linkage to the support for the left-wing increases in magnitude and now turns to a highly significance level. 18The robustness tests, in both this and the following sub-section, are all based on equation (9), since this is the specification of main interest.
24
A potential threat to the identification strategy is if pre-sample period political support for either far-right or far-left politics affects the contemporary support differently between the municipalities. If this potential effect is time-invariant, the fixed effects included in the model should address these concerns. However, this conceivable effect could vary both over time and between municipalities, thereby affecting the outcomes of my main specification. To evaluate this, I interact the results from the 2002 parliamentary election for the Sweden Democrats and the aggregated left-wing group, respectively, with a linear time trend and include them as additional control variables. As can be seen in columns (3) and (4), the overall results for both of the two different endings of the political spectrum remain roughly the same. As a final test I change the immigration inflow variable to consider the arrival of immigrants during the last year only.19 The outcomes of this alternative specification, showed in column (5) and (6), reinforce the conclusions drawn from the main specification. The heavily increase in the positive correlation between immigration inflow and the support for the Sweden Democrats further proves the theory that this positive relationship is mainly an immediate effect, diminishing over time. Also the negative effect of new immigration arrivals on the left-wing support is strengthened, even though it remains insignificant. (Table 7)
19Equation(9)ismodifiedsothat𝛥𝐼𝑆!" = 𝐼𝑆!" − 𝐼𝑆!(!!!).

25
6 Additional results
6.1 Explanations of the results The main analysis section of this paper focuses on whether there exists any causal relationship between immigration, divided between share and inflow, and the support for political parties with either pro-immigration or anti-immigration agendas. As concluded when including the dynamic aspect in the analysis, the share of immigrants has a negative impact on the right-wing support, while the effect of the inflow of immigrants is positive. When it comes to the left-wing support, the opposite results are identified. However, up to this point, no explanation has been given of why these causal linkages exist. Therefore, in this section I attempt to identify which factors drive the results and, specifically, focus on investigating why the most-recent inflow of immigrants has a positive (negative) impact on the right-wing (left-wing) support. Turning to the existing literature, a strand of it tries to explain natives’ voting behavior by analyzing what determines the preferences of individuals about immigration. Barone et al. (2016) and Halla et al. (2017) make equivalent summarizes when they divide the existing literature into two main channels via which immigration potentially affect political outcomes. The first channel, which could be denoted as the economic channel, relates to the employment status and income level of the native population. The second channel, in turn, concerns the neighborhood quality. This includes the competition of public services, the crime rates and the role of cultural preferences.
6.1.1 The economic channel With respect to the first channel, several studies show that fears about increased labor market competition, and hence unemployment, are among the main drivers of preferences on anti-immigration policies (see e.g. Gang et al., 2002; Algan et al., 2017). Especially unskilled and low-income natives are against immigration, while more-skilled individuals are less likely to worry about increased labor market competition (Scheve and Slaughter, 2001; Facchini and Mayda, 2009). In a more historical perspective, the overall economic conditions and the economic concerns among the population have both played an important role in the growth of different extreme right-wing parties during the early 20th century (King et al., 2008; de Bromhead et al., 2013). To examine whether any factors of the economic channel are the main drivers of the nexus between the immigration inflow and the political support, I estimate the main specification on sub-samples depending on municipality specific characteristics. More precisely, I consider a sample split at the median along the following control variables20: (i) employment, (ii) income and (iii) education, to examine whether there are any heterogeneous effects between the bottom half and the top half of the municipalities. A limitation with all the results presented in this section is the weakness of the instrumental variables used in my econometrical model with multiple endogenous variables. Once the number of observations is heavily decreased, due to a sample split at the median, the two 20 To ensure exogeneity, each sample split depends on data of the specific control variable in 2006.

26
different F-statistics used to test the significance of the instruments both fall below the suggested rule of thumb value 10.21 This indicates that the variation in the two endogenous variables is only weakly explained by the variation in the two instrumental variables. Consequently, the estimated coefficients and their significance levels must be interpreted very cautious and they are not fully representative of the true causal effects. However, the intention of this section is that the signs and the magnitudes of the estimated coefficients could, at least, serve as a brief explanation of the factors that potentially could be the drivers of the relationship between the immigration inflow and the voting results. Table 8 displays the results of the different sample splits with the right-wing support as the outcome variable. In columns (1)-(2), it can be seen that the impact of the immigration inflow on the right-wing support varies with the level of employment. In municipalities at the top half of the average employment rate, the positive relationship is much larger compared to municipalities at the bottom half. Similarly results are revealed in columns (3)-(4), where the role of income is considered. The negative attitudes towards an inflow of immigrants are stronger in municipalities with a higher average income. Finally, equal results are also shown in columns (5)-(6), where the sample is split according to the average educational level. Municipalities with a larger share of high-educated individuals are linked with a stronger opposition to the arrival of immigrants. (Table 8) The results presented in Table 9, with left-wing support as the dependent variable, partly confirm the previous findings on the impact of an immigration inflow on the support for the political right-wing. As can be seen in columns (1)-(2) and (5)-(6), the negative relationship between the new arrival of immigrants and the support for pro-immigration parties is stronger in municipalities with a higher average level of employment and education. However, when considering the average income, there is no large difference between the bottom- and the top-half of the municipalities. If any, the negative effect is larger in low-income municipalities, which is presented in columns (3)-(4). (Table 9) Overall, when considering heterogeneous characteristics of the municipalities, the results indicate that in areas with a higher socioeconomic status (i.e. a higher level of education, income and employment) there are stronger negative attitudes towards an inflow of new immigrants. This finding stands in contradiction to the theory of the economic channel in explaining what determines the preferences of individuals about immigration. However, once again it is of utmost importance to underline that these findings cannot be read as the true causal explanations of the results, due to the presence of weak first-stages in all the different regressions where the sample is split at the median. Nevertheless, it gives a hint that fears about increased labor market competition and other economic concerns among the population are not the main drivers of the estimated results.
21 To increase the precision in the estimates of the heterogeneous municipality characteristics, a sample split in tertiles or quartiles is preferred over a split at the median. However, this large sample size reduction would result in too weak instruments to allow for reliable inferences. Therefore, a sample split at the median is the adopted method.

27
Moreover, it is worth a notice that those defined as immigrants in this paper consist of a heterogeneous group of foreign-born individuals with various characteristics. The theoretical positive linkage between immigration and right-wing support among low-skilled natives, due to increased labor market competition, relies on an inflow of mainly low-skilled immigrants. Therefore, it could potentially be that in municipalities with an inflow of a large share of low-skilled immigrants, such as refugees from countries in the Middle East and Africa, there is a much stronger increase in the anti-immigration support among low-skilled individuals, compared to the overall-immigration results in Table 8. However, due limitations of the data used in this study, I am not able to make this distinction between the different types of immigrants. For that reason, a further investigation whether the effects of the economic channel depend on heterogeneous characteristics among the immigrant group is unattainable in this paper.
6.1.2 The neighborhood quality Since economical concerns, mainly through an increased labor market competition, are not proposed to be the main driver of the results, it is of interest to evaluate the importance of the neighborhood quality in shaping voting behavior. An important source of anti-immigration sentiments refers to the role of cultural preferences. Several studies have documented cultural and religious diversity associated with immigrants and how natives could perceive it as a threat (Rydgren, 2008; Hainmueller and Hangartner, 2013; among others). Closely related are concerns about compositional amenities, which is shown to be more important than concerns about wages and taxes in shaping individuals attitudes toward immigration policies (Card et al., 2012). In the existing literature, there is no clear suggestion how to evaluate the role of cultural preferences and compositional amenities concerns in shaping a political opinion about immigration. Following Edo et al. (2018), a potential strategy would be to divide the immigrants into different groups based on their country of origin. This would enable to assess if the increase in the far-right support is mainly driven by immigrants from non-western countries with different cultural and religious values. Nevertheless, as previously described, this approach is ultimately untestable due to the limitations of the data I have access to. An alternative approach to adopt is to assume that the hostility among the native population towards cultural and religious diversities is principally caused by prejudice and stereotypes. This is in line with the contact hypothesis, developed by Allport (1954), suggesting that an enhanced contact with immigrants fosters mutual understanding and decreases prejudice. It is reasonable to presume that those living in urban areas are more likely to have personal connections to foreign-born individuals with various cultural and religious expressions. This connection could go through workplaces, neighborhoods, schools or any social activity. Thereby, according to the contact hypothesis, anti-immigration sentiments are more intensified in rural areas where natives are less likely to have a frequent social contact with immigrants. To evaluate to what extent cultural preferences and concerns about compositional amenities are among the main drivers of the results, I make a sample split at the median according to the population density. As presented in columns (1) and (2) of Table 10, the positive relationship between immigration inflow and right-wing voting is much stronger and only significant in municipalities with a lower population density. These results directly support the contact hypothesis and indicate that the hostility towards cultural and religious diversities could be an

28
explanatory factor of the main results. Turning to the left-wing support, there is no major difference in the impact of immigration inflow between high- and low-density municipalities. As revealed in Table 11, columns (1) and (2), the two coefficients remain insignificant. (Table 10) (Table 11) Another potential source of anti-immigration sentiments associated with the perceived neighborhood quality, is the competition for public services. As documented by Dahlberg et al. (2012), immigration has a negative impact on individuals’ preferences for redistribution, especially pronounced for those with a higher level of income. Since public services are mainly used by children and the elderly, the quality of schooling is likely to be an important factor. An inflow of immigrants could therefore increase the competition for local children services and be perceived as a threat to the educational quality. This effect could be particularly strong in municipalities with a larger share of high-educated voters, since they are more likely to worry about schooling quality, and generate an increased political polarization (Halla et al., 2017). To estimate whether the competition for public services potentially explains at least a part of the results from the main analysis, I follow a commonly used approach and split the sample at the median according to the share of native children aged 0-14 (Barone et al., 2016; Chletsos and Roupakias, 2018; among others). This approach is based on the intuition that with a larger share of native children, there is a heightened perception that immigrants could “steal” natives’ admission to school and, thereby, worsen the educational quality. Displayed in Table 10, columns (3) and (4), the increase in the anti-immigration support caused by an inflow of immigrants is both larger and only significant in the municipalities with a large share of native kids. This indicates that competition for public services is likely to play a key role in explaining the earlier estimated positive relationship between arrivals of immigrants and right-wing voting. Turning to the left-wing support, the interpretation of the results is more ambiguous. As can be seen in columns (3) and (4) of Table 11, the negative impact of immigration inflows is only significant in the top-half of the municipalities, while the magnitude is larger in the bottom-half. A final aspect related to the neighborhood quality is the criminal activity. Several studies reveal that a possible explanation of anti-immigration support is the perception among natives that immigration increases the crime rates (see e.g. Bianchi et al., 2012). It is also shown that the positive relationship between immigration and far-right voting is stronger in areas with a higher criminal activity (Barone et al., 2016; Chletsos and Roupakias, 2018). However, Bellucci et al. (2019) launch the opposite theory, that the anti-immigration support is stronger in areas with low crime rates. The reason behind this, as they suggest, is that citizens of areas with a high criminal activity are used to it and, thereby, less sensitive to a marginal perceived rise in the delinquency rate. On the other hand, low-crime areas are more sensitive to the fear of an increase in the crime rates and, consequently, their residents have a greater willingness to avoid immigrants. To examine the role of the criminal activity, I split the sample at the median according to the municipality crime rates. As can be seen in columns (5) and (6) of both Table 10 and Table 11, the results are in line with the theory proposed by Bellucci et al. (2019). Individuals in municipalities with lower average crime rates have a stronger fear of receiving new

29
immigrants, since they potentially believe that the criminal activity will increase and, consequently, increase (decrease) their support for far-right (far-left) politics. The results in this sub-section indicate that the neighborhood quality is an important factor in explaining the positive relationship between the inflow of immigrants and the support for anti-immigration policies. The different sample splits suggest that concerns about cultural diversities, competition for public services and a fear of increased crime rates are more likely to drive the results from the main sector, compared to worries about labor market competition and other economical factors. Although, also in this section it is important to highlight that once performing the sample split, the F statistic falls below 10 and the relevance of the instruments is questionable. Therefore, it is once again essential to emphasize that none of the results in this sub-section can be interpreted as the true explanations of the results, but they could serve as guidelines of what is behind the findings from the main analysis.
6.2 Municipal elections To supplement the results in the main analysis, relying solely on the outcomes in the parliamentary elections, I consider the municipality election results in this sub-section. The elections to the 290 municipal assemblies are held at the same date as the national parliamentary elections, the first Sunday in September every fourth year. Similarly to the parliamentary elections in the main analysis, I exploit the outcomes of the four municipality elections held between 2006 and 2018.22 The main advantage of using the municipality election results as the outcome variable is that the requirements to be eligible to vote in these elections and the parliamentary elections differ. While a Swedish citizenship is required in the latter one, a non-citizen has the right to vote in the former one if the individual is a registered resident of the specific municipality and is a citizen in another country of the European Union or has been residing in Sweden for at least three consecutive years. This leads to the advantageous implication that there is a larger share of foreign-born with the right to vote in the municipality elections, compared to the parliamentary elections. A reasonable assumption to make is that foreign-born individuals with the right to vote in the municipality elections only, in general, have less prejudice towards other immigrants since they to a larger extent share cultural and religious similarities. If the findings from the previous sub-section hold, that concerns about cultural diversity and compositional amenities are among the driving factors of the estimated results, the positive impact on the support for the Sweden Democrats due to an increased immigration inflow will drop in magnitude when considering the municipality elections. Correspondingly, the impact on the immigration friendly left-wing parties is likely to be the opposite. There are mainly two drawbacks of using the municipality election vote shares, which are being highlighted by Mehic (2019). First, in many municipalities there are local parties who only participate in the local elections and not in the parliamentary elections. Some of these local parties favor similar immigration agendas as the large and established parties and usually receive a substantial share of the votes. This makes the intermunicipal comparison of
22 Data on the results of the four municipality elections is collected from Statistics Sweden and is measured as the share of valid votes received by each party.

30
both the far-right and far-left political parties more complex. In an attempt to address this potential source of bias, I run the regression with several different specifications where I (i) include all municipalities that are included in the main analysis, (ii) exclude the municipalities where the group “other parties”23 received more than 20 percent of the total votes in the 2018 election and (iii) extend the limit to exclude all the municipalities with a total vote share larger than 15 percent for the group “other parties” in the same election. The second potential threat to the validation of the estimated results is that mainly the Sweden Democrats have not always been able to fill all local seats and, consequently, left some of the seats vacant. A possible implication of this is that individuals who vote for the Sweden Democrats in parliamentary election avoid doing it in the municipal election, in a fear of wasting their votes. These two circumstances of the municipal election outcomes imply that the estimated results in this section should be interpreted with caution and are not directly comparable to the results of the main analysis. However, they could still provide important guidelines in the attempt to explain the main results. The results of all the different specifications are displayed in Table 12. As shown in columns (1), (3) and (5), the positive impact of the immigration inflow on the right-wing support in the municipal elections remains significant but drops in magnitude, compared to the parliamentary elections. These results supports the theory that if the share of voters with a foreign background increases, the instant opposition towards an inflow of immigrants decreases. The results revealed in columns (2), (4) and (6) could serve as a further proof of the theory. The negative impact of new immigrants on the support for the immigration friendly parties decreases when the municipal election results are used as outcome variable. However, the coefficients of the inflow of immigrants remain slightly insignificant in all the three specifications and are therefore interpreted with caution. (Table 12) The estimated results of the share of immigrants variable are, however, somewhat surprising and not in line with what could be expected. The coefficients on both the right-wing and left-wing supports decrease in both significance and magnitude once a larger share of foreign-born are eligible to vote. Although, the results cannot be viewed as the true causal effects, due to the two main weaknesses of using municipality election data, discussed above.
6.3 Turnout rates and invalid votes Immigration might not only have an effect on the voter’s decision on which political party they put their vote on. Potentially, an increased immigration could also affect their decision on whether or not to vote for any political party at all. Marginal voters with a strong opinion about immigration, no matter if they are pro or against, could respond to the increased immigration by an intensified willingness to make their voices heard and, consequently, raise their voting activity. Nonetheless, the opposite theory is also conceivable, that marginal voters
23 “Other parties” consists of the aggregated vote share for all political parties that are not represented in the Swedish Parliament.

31
as a protest against the current immigration policies decide to not cast a vote at all, cast an invalid vote or a blank vote. Similarly to the electoral outcomes, it is credible to believe that this potential effect of an increased immigration on the turnout rates and share of invalid votes also involves a dynamic aspect. Since the share of immigrants includes all foreign-born individuals residing in the municipality, no matter of the date of arrival, a large part of this share consists of naturalized immigrants allowed to vote. If the general voting behavior among naturalize foreign-born differs from the corresponding behavior among native, this will be reflected in the coefficient estimates of the immigration share variable. In addition, the voter’s eagerness to respond to immigration, regardless of whether this implies an increased or decreased willingness to vote for a political party, will potentially diminish over time and thereby, mainly be reflected in the inflow of immigrants and not the immigration share itself. Turning to the existing literature and the case of Sweden, Mehic (2019) finds no significant impact of immigration on the turnout rates. Dustmann et al. (2018) report similar results in Denmark, while both Barone et al. (2016) and Chletsos and Roupakias (2018) conclude that immigration negatively affects the voter turnouts in Italy and Greece, respectively. Since the immigration variables in the all the mentioned studies are not defined identically to the corresponding variables in this study, the results are therefore not directly comparable to this paper. Closer related to my approach is the study by Mayda et al. (2016), examining the immigration impact on the turnout rates in the US. They divide the immigration variable into two parts and find that the share of non-citizen immigrants has a positive impact on the turnout rates, while the effect of the citizen immigrants is not significant. To evaluate the effects of immigration on the voter turnouts and the share of protest votes, I run my preferred specification from my main analysis, the dynamic instrumental variable regression, but with the turnout rates and the share of invalid votes24 as the dependent variables. The results are displayed in Table 13, where column (1) reveals that the share of immigrants has a negative impact on the turnout rates, while the immigration inflow has a positive effect, both highly significant. Turning to column (2), where the share of invalid votes is the outcome variable, the results are the opposite. The share of foreign-born is estimated to have a significant and slightly positive effect and the recent inflow of immigrants has a significant negative impact. (Table 13) Overall, the results are consistent with the theory that increased immigration has a direct positive effect on the marginal voters willingness to influence immigration policies by casting a valid vote, instead of not cast a vote at all or cast an invalid cote. Contrariwise, in the longer run the increased immigration has the opposite effect and reduces the turnout rates.
24 The turnout rates and share of invalid votes relate to the four national parliamentary elections held between 2006 and 2018. In the election statistics reported by Statistics Sweden, blank votes are included in the share of invalid votes.
32
7 Conclusion This paper investigates the impact of immigration on electoral outcomes in Sweden, focusing on right-wing and left-wing political parties in the national parliamentary elections from 2006 to 2018. To examine whether a causal relationship exists, panel data on a municipality level is used. By implementing an instrumental variable strategy, an exogenous variation in the settlement of immigrants is generated and any endogeneity concerns about the main explanatory variables are left out. The adopted instrument relies on a shift-share methodology using the spatial distribution of immigrants in 1998. In contradiction to most of the related studies within this area of research, this paper evaluates the dynamic process in the impact of immigration on political support. To do that, I follow the evolved approach by Levi et al. (2020) and distinguish between the current share of immigrants and the most recent inflow. The main findings of this paper are in line with those of Levi et al. (2020) and provide further evidence on the importance of considering the dynamic aspect when evaluating the impact of immigration on electoral outcomes. When only including the share of immigrants, a negative effect on the right-wing support is revealed. However, by adding the most recent inflow of foreign-born as an additional explanatory variable, the negative effect of the share stands, but a positive impact of the inflow on the political anti-immigration support is exhibited. In the specific context of Sweden, this leads to the conclusion that the Sweden Democrats are not favored of the presence of foreign-born per se, but of the most recent inflow of immigrants. This lends support to the hypothesis that hostility towards immigrants is mainly temporary and concentrated to the arrival of new immigrants. Turning to the support for the left-wing political parties, the opposite results are revealed. While the share of immigrants has a positive effect on pro-immigration support, the recent inflow has a negative impact. In contradiction to the other results, the negative effect of the inflow is insignificant. A potential explanation to this is while the Sweden Democrats have a unique position in right-end of the political spectrum with a clear focus on anti-immigration policies, there is no individual political party with the corresponding position in the left-end of the spectrum. By exploring the channels behind the results, mainly focusing on the positive impact of an immigration inflow on right-wing support, concerns about the neighborhood quality, and not economical concerns, is indicated to be the driving factor. This could work through a fear of increased crime rates, concerns about competition for public services and hostility towards cultural and religious diversities, which partly stems from prejudices. These findings further strengthen the conclusion that skepticism towards immigrants is a short-run effect and mainly concentrated to the arrival of new immigrants. Consequently, the dynamic aspect of immigration is of importance to include in any analysis related to the subject of this paper. Additionally, when evaluating the municipality election results, where a larger share of foreign-born is eligible to vote, the positive impact of the immigration inflow on the right-wing support drops in magnitude. This is also in line with the theory that mainly prejudices and a fear of cultural diversity drive the hostility towards the arrival of new immigrants. Moreover, an increased inflow of immigrants generates an intensified willingness among marginal voters to make their voices heard. This takes the shape of raising turnout rates and reducing the share of invalid or blank votes.

33
A major limitation of the paper is the weakness of the first stages in the multiple instrumental variable strategy. In the main analysis, this is addressed by dropping six outlier municipalities (those with the largest absolute difference between instrumented and actual immigration share). However, when exploring the mechanisms behind the main results, the first-stages are too weak to allow for any causal inferring. Although, the additional results could still serve as guidelines of what drives the main results, but a cautious interpretation is warranted. Further research would benefit of having access to a more detailed-level data on the historical settlement of immigrants. This would entail an enhanced relevance of the shift-share instrument and, potentially, allow distinguishing between different types of immigrants. By exploring the heterogeneous characteristics of immigrants, a further explanation to why an inflow of immigrants temporarily increases anti-immigration sentiments may be provided, something that would be an interesting topic for future work.

34
References Algan, Y., S. Guriev, E. Papaioannou and E. Passari (2017). The European Trust Crisis and the Rise of Populism. Brookings Papers on Economic Activity 48 (2 (Fall)), 309-400. Allport, G.W. (1954). The Nature of Prejudice. Oxford: Addison-Wesley. Altonji, J. and D. Card (1991). The effects of immigration on the labor market outcomes of less-skilled natives. Immigration, trade and the labor market, 201–234. University of Chicago Press. Andersson, H., H. Berg, and M. Dahlberg (2018). Migrating Natives and Foreign Immigration: Is There a Preference for Ethnic Residential Homogeneity? IFAU Working Paper 2018:12. IFAU - Institute for Evaluation of Labour Market and Education Policy. Barone, G., A. D’Ignazio, G. de Blasio and P. Naticchioni (2016). Mr. Rossi, Mr. Hu and politics. The role of immigration in shaping natives’ voting behavior. Journal of Public Economics 136, 1-13. Bartel, A.P. (1989). Where do the new U.S. immigrants live? J Labor Econ 7 (4), 371–391. Bellucci, D., P. Conzo and R. Zotti (2019). Perceived Immigration And Voting Behavior. Cognetti de Martiis Working Papers 201915. University of Turin, Department of Economics and Statistics. Bianchi, M., P. Buonanno and P. Pinotti (2012), Do Immigrants Cause Crime? Journal of the European Economic Association 10(6), 1318-1347. Brunner B and A. Kuhn (2018). Immigration, Cultural Distance and Natives' Attitudes Towards Immigrants: Evidence from Swiss Voting Results. Kyklos 71(1), 28-58. Card, D. (2001). Immigrant Inflows, Native Outflows, and the Local Labor Market Impacts of Higher Immigration. Journal of Labor Economics 19, 22–64. Card, D., C. Dustmann and I. Preston (2012). Immigration, Wages, and Compositional Amenities. Journal of the European Economic Association 10 (1), 78-119. Chletsos, M. and S. Roupakias (2018). Immigration and far-right voting: Evidence from Greece. MPRA Paper 88545, University Library of Munich. Dahlberg, M., K. Edmark and H. Lundqvist (2012). Ethnic Diversity and Preferences for Redistribution. Journal of Political Economy 120 (1), 41-76. de Bromhead, A., B. Eichengreen and K.H. O’Rourke (2013). Political Extremism in the 1920s and 1930s: Do the German Lessons Generalize? Journal of Economic History 73, 371–406.

35
Demker, M. (2019). Migrationsfrågorna som ideologisk lots: partipolitisering och polarisering. In Andersson, U., Rönnerstrand, B., Öhberg, P. och Bergström, A. (red), Storm och stiltje. Gothenburg University SOM Institute. Dustmann, C., F. Fabbri, and I. Preston (2005): The impact of immigration on the British labour market. The Economic Journal 115(507), F324–F341. Dustmann, C., K. Vasiljeva and A.P. Damm (2018). Refugee Migration and Electoral Outcomes. Review of Economic Studies. Edo, A., Y. Giesing, J. Öztunc and P. Poutvaara (2018). Immigration and Electoral Support for the Far-Left and the Far-Right. CESifo Working Paper Series 6918. Emilsson, H. (2018). Continuity or change? The refugee crisis and the end of Swedish exceptionalism. MIM Working Paper Series 18:3. Malmö University. Eurostat (2020a). Asylum and first time asylum applicants by citizenship, age and sex Annual aggregated data (rounded). URL: https://appsso.eurostat.ec.europa.eu/nui/show.do?Dataset= migr_asyappctza&lang=en (visited on 05/06/2020). Eurostat (2020b). Population on 1 January by age group, sex and citizenship. URL: https:/ /appsso.eurostat.ec.europa.eu/nui/show.do?dataset=migr_pop1ctz&lang=en (visited on 05/06/2020). Facchini, G. and A.M. Mayda (2009). Does the Welfare State Affect In- dividual Attitudes toward Immigrants? Evidence across Countries. Review of Economics and Statistics 91 (2), 295-314. Gang, I.N., F.L. Rivera-Batiz and M.-S. Yun (2002). Economic strain, ethnic concentration and attitudes towards foreigners in the European Union. IZA DP 578. Gerdes, C. and E. Wadensjö (2008). The Impact of Immigration on Election Outcomes in Danish Municipalities. IZA Dicussion Paper Series 3586. Golder, M. (2003). Explaining variation In the success of extreme right parties In Western Europe. Comparative Political Studies 36(4), 432–466. Gross, D.M. and N. Schmitt (2003). The role of cultural clustering in attracting new immigrants. Journal of Regional Science 43 (2), 295–318. Hainmueller, J. and D. Hangartner (2013) Who gets a Swiss passport? A natural experiment in immigrant discrimination. American Political Science Review 107(1), 159–187. Halla, M., A.F. Wagner and J. Zweimüller (2017). Immigration and Voting for the Far Right. Journal of the European Economic Association 15 (6), 1341-1385. Hangartner, D., E. Dinas, M. Marbach, K. Matakos and D. Xefteris (2019). Does exposure to the refugee crisis make natives more hostile? American Political Science Review 113(2), 442-455.
36
Harmon, N. (2018). Immigration, Ethnic Diversity, and Political Outcomes: Evidence from Denmark. Scandinavian Journal of Economics 120 (4), 1043- 1074. Jaeger, D.A., J. Ruist and J. Stuhler (2018). Shift-Share Instruments and the Impact of Immigration. NBER Working Paper 24285. King, G., O. Rosen, M. Tanner and A.F. Wagner (2008). Ordinary Economic Voting Behavior in the Extraordinary Election of Adolf Hitler. Journal of Economic History 68, 951–996. Kleibergen, F. and R. Paap (2006). Generalized reduced rank tests using the singular value decomposition. Journal of Econometrics 133, 97–126. Levi, E., R.D. Mariani and F. Patriarca (2020) Hate at first sight? Dynamic aspects of the electoral impact of migration: the case of Ukip. J Popul Econ 33, 1–32. Lubbers, M., M. Gijsberts and P. Scheepers (2002). Extreme Right-wing Voting in Western Europe. European Journal of Political Research 41 (3), 345– 378. Mayda, A.M., G. Peri and W. Steingress (2016). Immigration to the U.S.: A problem for the Republicans or the Democrats? NBER Working Paper 21941. Mehic, A. (2019). Immigration and Right-Wing Populism: Evidence from a Natural Experiment. Department of Economics Working Paper Series 2019:5. Lund University, Department of Economics. Mendez, I. and I. M. Cutillas (2014). Has immigration affected Spanish presidential elections results? Journal of Population Economics 27 (1), 135-171. Migrationsverket (2020a). History. URL: https://www.migrationsverket.se/English/About-the-Migration-Agency/Migration-to-Sweden/History.html (visited on 05/06/2020). Migrationsverket (2020b). Different reasons for seeking a residence permit. URL: https://www.migrationsverket.se/English/About-the-Migration-Agency/Migration-to-Sweden /Different-reasons-for-seeking-a-residence-permit.html (visited on 05/06/2020). Otto, A.H. and M.F. Steinhardt (2014). Immigration and election out- comes — Evidence from city districts in Hamburg. Regional Science and Urban Economics 45, 67-79. Peri, G. and C. Sparber (2011). Assessing Inherent Model Bias: An Application to Native Displacement in Response to Immigration. Journal of Urban Economics 69, 82–91. Rydgren, J. (2008). Immigration sceptics, xenophobes or racists? Radical right-wing voting in six West European countries. European Journal of Political Research 47(6), 737–765. Rydgren, J. (2018). The Oxford Handbook of the Radical Right. New York: Oxford University Press. Saiz, A. (2007). Immigration and Housing Rents in American Cities. Journal of Urban Economics 61, 345–371.

37
SCB (2020a). Inrikes och utrikes födda efter region, ålder och kön. År 2000 - 2019. URL: http://www.statistikdatabasen.scb.se/pxweb/sv/ssd/START__BE__BE0101__BE0101E/InrUtrFoddaRegAlKon/ (visited on 05/06/2020). SCB (2020b). Asylsökande under året efter medborgarskapsland och kön. År 2002 – 2018. URL: http://www.statistikdatabasen.scb.se/pxweb/sv/ssd/START__BE__BE0101__BE0101P /Asylsokande/ (visited on 05/06/2020). SCB (2020c). Summary of population statistics 1960 - 2019. URL: https://www. scb. se/en/finding-statistics/statistics-by-subject-area/population/population-composition/populatio n-statistics/pong/tables-and-graphs/yearly-statistics--the-whole-country/summary-of-populati on-statistics/ (visited on 05/06/2020). Scheve, K.F. and M.J. Slaughter (2001). Labor Market Competition and Individual Preferences over Immigration Policy. Review of Economics and Statistics 83 (1), 133-145. Slotwinski, M. and A. Stutzer (2019). The deterrent effect of an anti-minaret vote on foreigners’ location choices. J Popul Econ 32, 1043–1095. Steinmayr, A. (2016). Exposure to Refugees and Voting for the Far-Right: (Unexpected) Results from Austria. IZA Discussion Paper 9790, Institute for the Study of Labor (IZA) Stock, J.H., H. Wright and M. Yogo (2002). A Survey of Weak Instruments and Weak Identification in Generalized Method of Moments. Journal of Business and Economics Statistics 20, 518–529. Stock, J.H. and M. Watson (2014). Introduction to Econometrics. 3rd ed. Essex: Pearson Education Unlimited. Vertier, P. and M. Viskanic (2018). Dismantling the “Jungle”: Migrant Relocation and Extreme Voting in France. CESifo Working paper 6927. Widfeldt, A. (2008). Party change as a necessity – the case of the Sweden Democrats. Representation 44 (3) , 265–276.
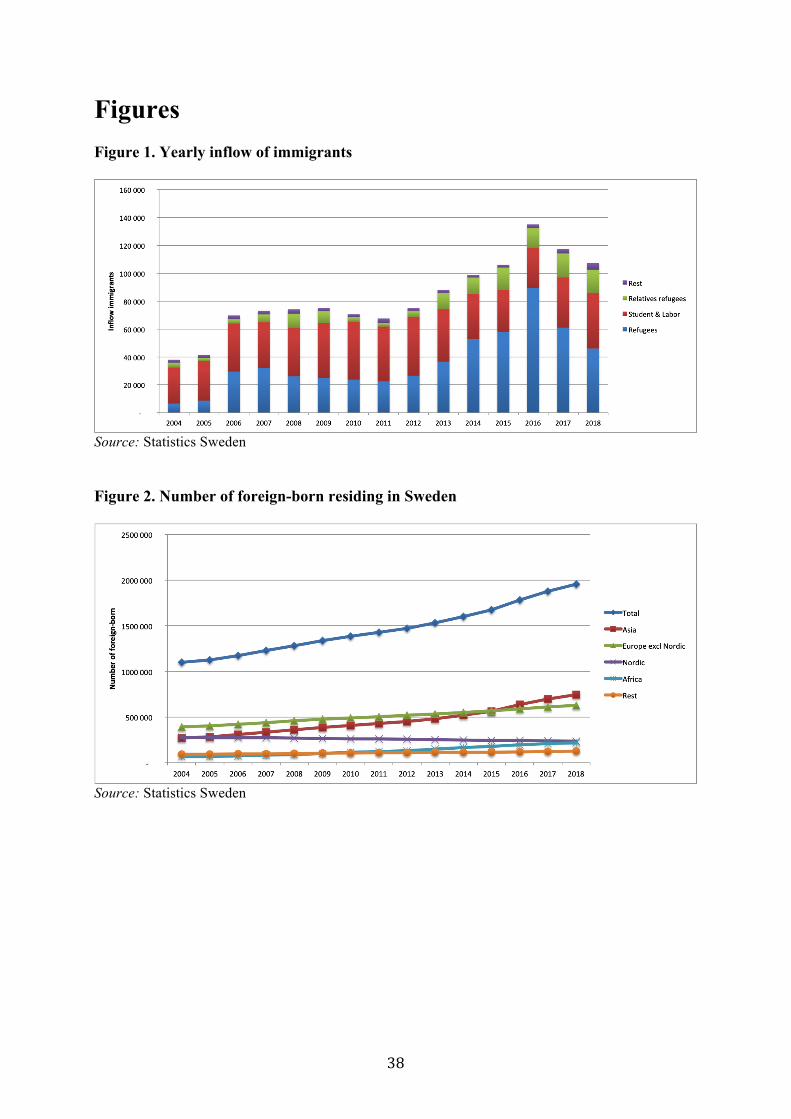
38
Figures Figure 1. Yearly inflow of immigrants
Source: Statistics Sweden Figure 2. Number of foreign-born residing in Sweden
Source: Statistics Sweden
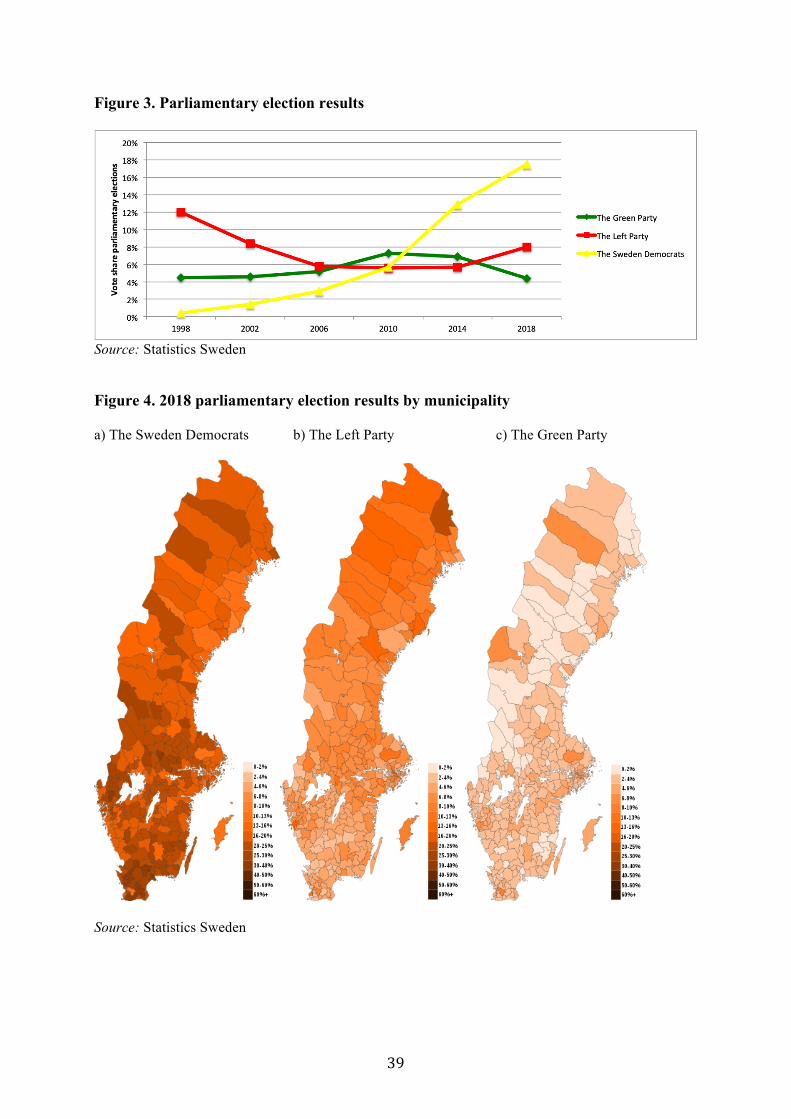
39
Figure 3. Parliamentary election results
Source: Statistics Sweden Figure 4. 2018 parliamentary election results by municipality a) The Sweden Democrats b) The Left Party c) The Green Party
Source: Statistics Sweden
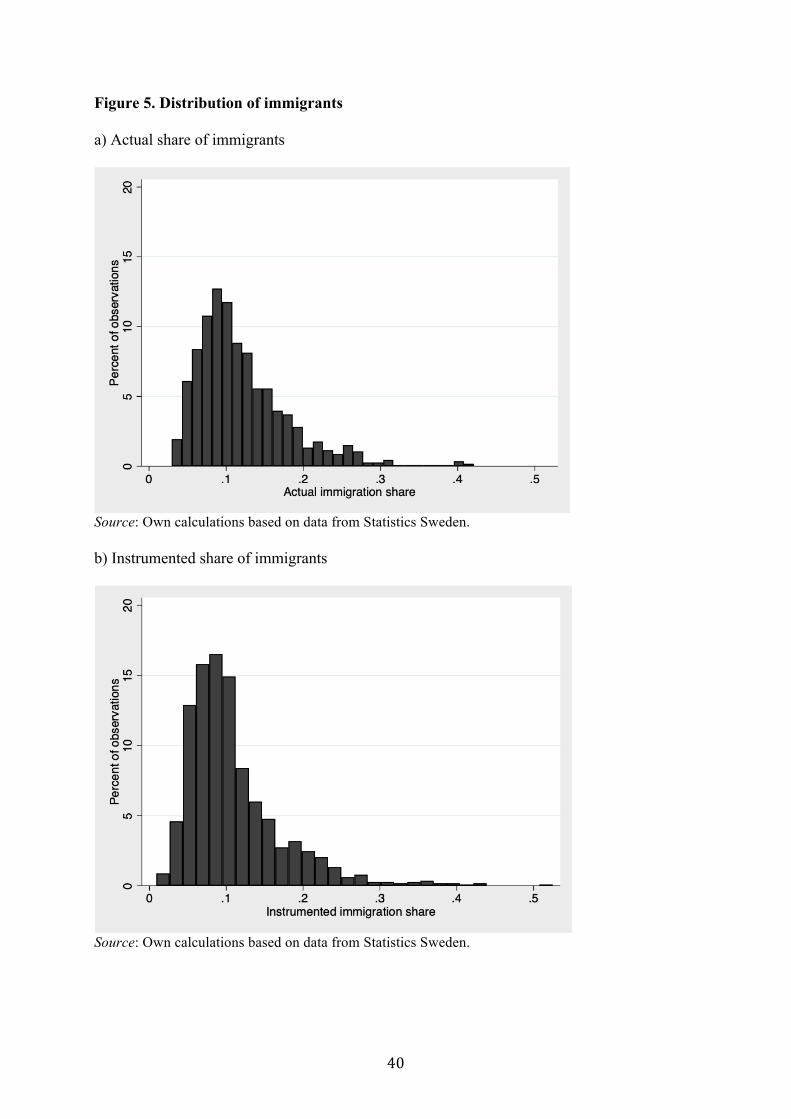
40
Figure 5. Distribution of immigrants a) Actual share of immigrants
Source: Own calculations based on data from Statistics Sweden. b) Instrumented share of immigrants
Source: Own calculations based on data from Statistics Sweden.
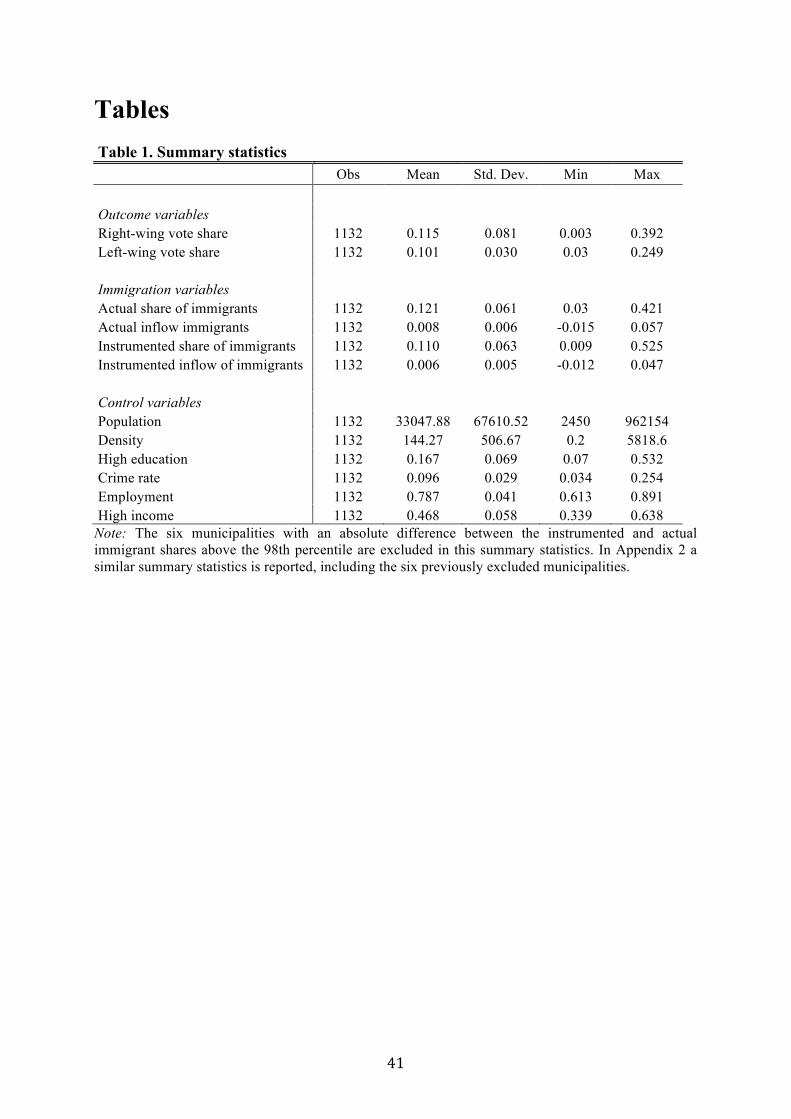
41
Tables Table 1. Summary statistics Obs Mean Std. Dev. Min Max Outcome variables Right-wing vote share 1132 0.115 0.081 0.003 0.392 Left-wing vote share 1132 0.101 0.030 0.03 0.249 Immigration variables Actual share of immigrants 1132 0.121 0.061 0.03 0.421 Actual inflow immigrants 1132 0.008 0.006 -0.015 0.057 Instrumented share of immigrants 1132 0.110 0.063 0.009 0.525 Instrumented inflow of immigrants 1132 0.006 0.005 -0.012 0.047 Control variables Population 1132 33047.88 67610.52 2450 962154 Density 1132 144.27 506.67 0.2 5818.6 High education 1132 0.167 0.069 0.07 0.532 Crime rate 1132 0.096 0.029 0.034 0.254 Employment 1132 0.787 0.041 0.613 0.891 High income 1132 0.468 0.058 0.339 0.638
Note: The six municipalities with an absolute difference between the instrumented and actual immigrant shares above the 98th percentile are excluded in this summary statistics. In Appendix 2 a similar summary statistics is reported, including the six previously excluded municipalities.

42
Table 2. OLS Results
(1) (2) OLS OLS Right-wing Left-wing Share of immigrants 0.221* 0.032 (0.118) (0.051) Population -0.001*** 0.001*** (0.001) (0.001) Density 0.001 -0.001 (0.001) (0.001) High education -0.844*** 0.373*** (0.150) (0.057) Crime rate 0.080 -0.104 (0.078) (0.071) Employment -0.301** -0.056 (0.119) (0.053) High income 0.109 0.032 (0.114) (0.053) Year FE YES YES Municipal FE YES YES Observations 1132 1132 R-squared 0.9478 0.6018
Note: The dependent variable in column (1) is the share of votes for the Sweden Democrats in the parliamentary elections, while in column (2) the aggregated share of votes for the Left Party and the Green Party in the parliamentary elections. Municipal and year fixed effects are included in all regressions. Each regression is weighted by the size of the municipality population. Robust standard errors are clustered by municipality and reported in parentheses. *, ** and *** denote significance at the 10, 5 and 1 percent level, respectively.
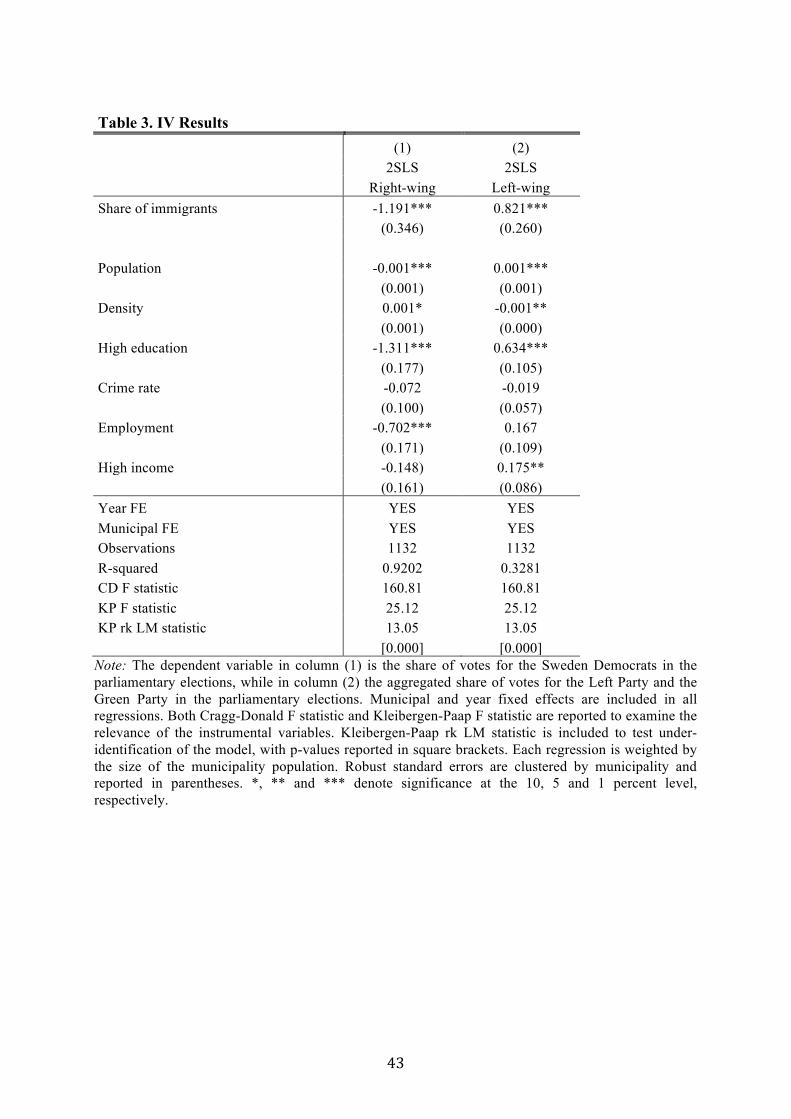
43
Table 3. IV Results
(1) (2) 2SLS 2SLS Right-wing Left-wing Share of immigrants -1.191*** 0.821*** (0.346) (0.260) Population -0.001*** 0.001*** (0.001) (0.001) Density 0.001* -0.001** (0.001) (0.000) High education -1.311*** 0.634*** (0.177) (0.105) Crime rate -0.072 -0.019 (0.100) (0.057) Employment -0.702*** 0.167 (0.171) (0.109) High income -0.148) 0.175** (0.161) (0.086) Year FE YES YES Municipal FE YES YES Observations 1132 1132 R-squared 0.9202 0.3281 CD F statistic 160.81 160.81 KP F statistic 25.12 25.12 KP rk LM statistic 13.05 13.05 [0.000] [0.000]
Note: The dependent variable in column (1) is the share of votes for the Sweden Democrats in the parliamentary elections, while in column (2) the aggregated share of votes for the Left Party and the Green Party in the parliamentary elections. Municipal and year fixed effects are included in all regressions. Both Cragg-Donald F statistic and Kleibergen-Paap F statistic are reported to examine the relevance of the instrumental variables. Kleibergen-Paap rk LM statistic is included to test under-identification of the model, with p-values reported in square brackets. Each regression is weighted by the size of the municipality population. Robust standard errors are clustered by municipality and reported in parentheses. *, ** and *** denote significance at the 10, 5 and 1 percent level, respectively.

44
Table 4. Dynamic Results
(1) (2) (3) (4) OLS 2SLS OLS 2SLS Right-wing Right-wing Left-wing Left-wing Share of immigrants 0.213* -1.326*** 0.039 0.873*** (0.119) (0.442) (0.054) (0.278) Inflow of immigrants 0.141 2.345** -0.118 -0.890 (0.148) (1.047) (0.140) (0.545) Population -0.001*** -0.001*** 0.001*** 0.001*** (0.001) (0.001) (0.001) (0.001) Density 0.001 0.001*** -0.001 -0.001** (0.001) (0.001) (0.001) (0.001) High education -0.854*** -1.470*** 0.381*** 0.694*** (0.153) (0.245) (0.058) (0.121) Crime rate 0.083 -0.011 -0.107 -0.043 (0.078) (0.096) (0.072) (0.062) Employment -0.286** -0.431** -0.070 0.064 (0.120) (0.212) (0.051) (0.087) High income 0.100 -0.291 0.039 0.230** (0.116) (0.187) (0.055) (0.102) Year FE YES YES YES YES Municipal FE YES YES YES YES Observations 1132 1132 1132 1132 R-squared 0.9479 0.9036 0.6033 0.2645 CD F statistic 33.52 33.52 KP F statistic 12.61 12.61 KP rk LM statistic 19.10 19.10 [0.000] [0.000]
Note: The dependent variable in columns (1) and (2) is the share of votes for the Sweden Democrats in the parliamentary elections, while in columns (3) and (4) the aggregated share of votes for the Left Party and the Green Party in the parliamentary elections. Municipal and year fixed effects are included in all regressions. Both Cragg-Donald F statistic and Kleibergen-Paap F statistic are reported to examine the relevance of the instrumental variables. Kleibergen-Paap rk LM statistic is included to test under-identification of the model, with p-values reported in square brackets. Each regression is weighted by the size of the municipality population. Robust standard errors are clustered by municipality and reported in parentheses. *, ** and *** denote significance at the 10, 5 and 1 percent level, respectively.
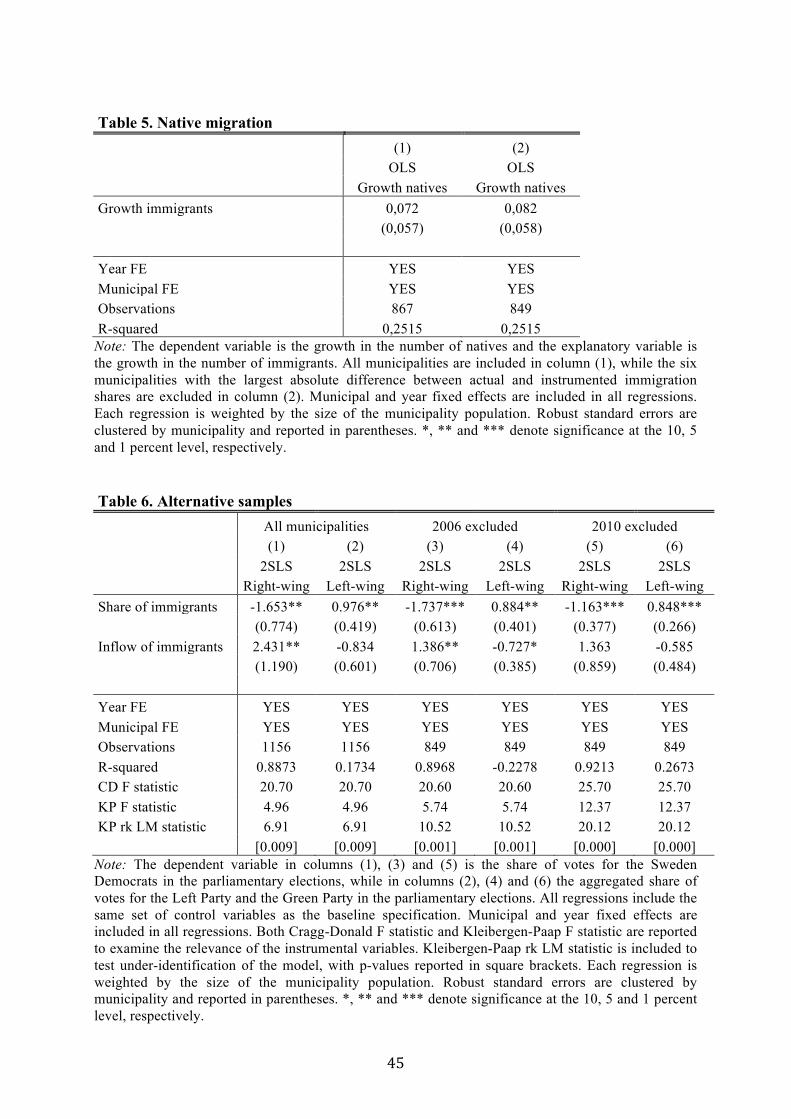
45
Table 5. Native migration
(1) (2) OLS OLS Growth natives Growth natives Growth immigrants 0,072 0,082 (0,057) (0,058) Year FE YES YES Municipal FE YES YES Observations 867 849 R-squared 0,2515 0,2515
Note: The dependent variable is the growth in the number of natives and the explanatory variable is the growth in the number of immigrants. All municipalities are included in column (1), while the six municipalities with the largest absolute difference between actual and instrumented immigration shares are excluded in column (2). Municipal and year fixed effects are included in all regressions. Each regression is weighted by the size of the municipality population. Robust standard errors are clustered by municipality and reported in parentheses. *, ** and *** denote significance at the 10, 5 and 1 percent level, respectively. Table 6. Alternative samples
All municipalities 2006 excluded 2010 excluded (1) (2) (3) (4) (5) (6) 2SLS 2SLS 2SLS 2SLS 2SLS 2SLS Right-wing Left-wing Right-wing Left-wing Right-wing Left-wing Share of immigrants -1.653** 0.976** -1.737*** 0.884** -1.163*** 0.848*** (0.774) (0.419) (0.613) (0.401) (0.377) (0.266) Inflow of immigrants 2.431** -0.834 1.386** -0.727* 1.363 -0.585 (1.190) (0.601) (0.706) (0.385) (0.859) (0.484) Year FE YES YES YES YES YES YES Municipal FE YES YES YES YES YES YES Observations 1156 1156 849 849 849 849 R-squared 0.8873 0.1734 0.8968 -0.2278 0.9213 0.2673 CD F statistic 20.70 20.70 20.60 20.60 25.70 25.70 KP F statistic 4.96 4.96 5.74 5.74 12.37 12.37 KP rk LM statistic 6.91 6.91 10.52 10.52 20.12 20.12 [0.009] [0.009] [0.001] [0.001] [0.000] [0.000]
Note: The dependent variable in columns (1), (3) and (5) is the share of votes for the Sweden Democrats in the parliamentary elections, while in columns (2), (4) and (6) the aggregated share of votes for the Left Party and the Green Party in the parliamentary elections. All regressions include the same set of control variables as the baseline specification. Municipal and year fixed effects are included in all regressions. Both Cragg-Donald F statistic and Kleibergen-Paap F statistic are reported to examine the relevance of the instrumental variables. Kleibergen-Paap rk LM statistic is included to test under-identification of the model, with p-values reported in square brackets. Each regression is weighted by the size of the municipality population. Robust standard errors are clustered by municipality and reported in parentheses. *, ** and *** denote significance at the 10, 5 and 1 percent level, respectively.

46
Table 7. Alternative model specifications
Immigration share excl Vote share 2002 Immigration inflow t-1 (1) (2) (3) (4) (5) (6) 2SLS 2SLS 2SLS 2SLS 2SLS 2SLS Right-wing Left-wing Right-wing Left-wing Right-wing Left-wing Share of immigrants -1.815*** 0.884*** -1.349*** 0.858*** (0.589) (0.277) (0.470) (0.277) Inflow of immigrants 3.724*** -1.798*** 2.558* -0.890 4.344** -1.013 (1.097) (0.561) (1.341) (0.548) (1.827) (0.771) Right-wing 2002 0.711*** (0.136) Left-wing 2002 -0.016 (0.025) Year FE YES YES YES YES YES YES Municipal FE YES YES YES YES YES YES Observations 1132 1132 1132 1132 1132 1132 R-squared 0.9041 0.2899 0.8974 0.2587 0.8911 0.2754 CD F statistic 46.69 46.69 31.08 33.83 36.09 36.09 KP F statistic 15.78 15.78 9.26 12.88 12.16 12.16 KP rk LM statistic 27.64 27.64 13.47 19.27 27.64 27.64 [0.000] [0.000] [0.000] [0.000] [0.000] [0.000]
Note: The dependent variable in columns (1), (3) and (5) is the share of votes for the Sweden Democrats in the parliamentary elections, while in columns (2), (4) and (6) the aggregated share of votes for the Left Party and the Green Party in the parliamentary elections. All regressions include the same set of control variables as the baseline specification. Municipal and year fixed effects are included in all regressions. Both Cragg-Donald F statistic and Kleibergen-Paap F statistic are reported to examine the relevance of the instrumental variables. Kleibergen-Paap rk LM statistic is included to test under-identification of the model, with p-values reported in square brackets. Each regression is weighted by the size of the municipality population. Robust standard errors are clustered by municipality and reported in parentheses. *, ** and *** denote significance at the 10, 5 and 1 percent level, respectively.
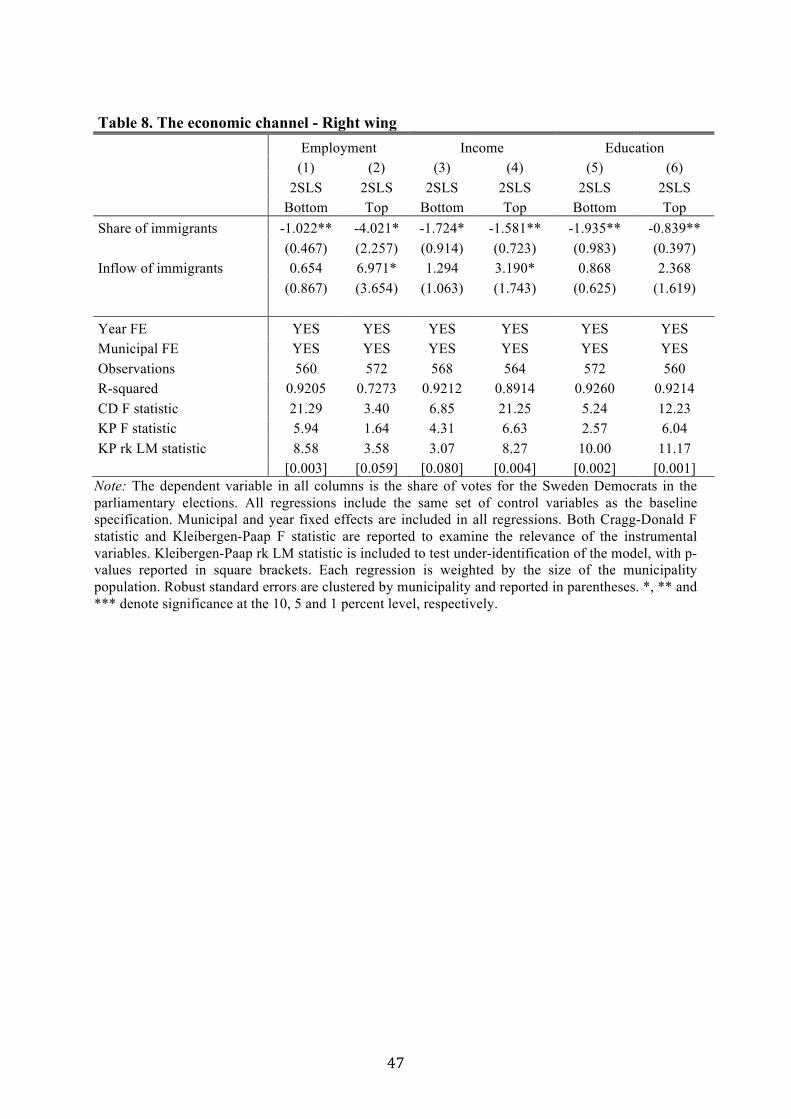
47
Table 8. The economic channel - Right wing
Employment Income Education (1) (2) (3) (4) (5) (6) 2SLS 2SLS 2SLS 2SLS 2SLS 2SLS Bottom Top Bottom Top Bottom Top Share of immigrants -1.022** -4.021* -1.724* -1.581** -1.935** -0.839** (0.467) (2.257) (0.914) (0.723) (0.983) (0.397) Inflow of immigrants 0.654 6.971* 1.294 3.190* 0.868 2.368 (0.867) (3.654) (1.063) (1.743) (0.625) (1.619) Year FE YES YES YES YES YES YES Municipal FE YES YES YES YES YES YES Observations 560 572 568 564 572 560 R-squared 0.9205 0.7273 0.9212 0.8914 0.9260 0.9214 CD F statistic 21.29 3.40 6.85 21.25 5.24 12.23 KP F statistic 5.94 1.64 4.31 6.63 2.57 6.04 KP rk LM statistic 8.58 3.58 3.07 8.27 10.00 11.17 [0.003] [0.059] [0.080] [0.004] [0.002] [0.001]
Note: The dependent variable in all columns is the share of votes for the Sweden Democrats in the parliamentary elections. All regressions include the same set of control variables as the baseline specification. Municipal and year fixed effects are included in all regressions. Both Cragg-Donald F statistic and Kleibergen-Paap F statistic are reported to examine the relevance of the instrumental variables. Kleibergen-Paap rk LM statistic is included to test under-identification of the model, with p-values reported in square brackets. Each regression is weighted by the size of the municipality population. Robust standard errors are clustered by municipality and reported in parentheses. *, ** and *** denote significance at the 10, 5 and 1 percent level, respectively.

48
Table 9. The economic channel - Left wing
Employment Income Education (1) (2) (3) (4) (5) (6) 2SLS 2SLS 2SLS 2SLS 2SLS 2SLS Bottom Top Bottom Top Bottom Top Share of immigrants 0.922** 0.530 0.191 0.815** 0.094 0.799*** (0.417) (0.445) (0.353) (0.339) (0.302) (0.246) Inflow of immigrants -0.437 -0.910 -0.856** -0.764 -0.410** -1.140 (0.561) (0.641) (0.362) (0.748) (0.164) (1.000) Year FE YES YES YES YES YES YES Municipal FE YES YES YES YES YES YES Observations 560 572 568 564 572 560 R-squared 0.3931 0.3974 0.5294 0.3796 0.4222 0.4254 CD F statistic 21.29 3.40 6.85 21.25 5.24 12.23 KP F statistic 5.94 1.64 4.31 6.63 2.57 6.04 KP rk LM statistic 8.58 3.58 3.07 8.27 10.00 11.17 [0.003] [0.059] [0.080] [0.004] [0.002] [0.001]
Note: The dependent variable in all columns is the aggregated share of votes for the Left Party and the Green Party in the parliamentary elections. All regressions include the same set of control variables as the baseline specification. Municipal and year fixed effects are included in all regressions. Both Cragg-Donald F statistic and Kleibergen-Paap F statistic are reported to examine the relevance of the instrumental variables. Kleibergen-Paap rk LM statistic is included to test under-identification of the model, with p-values reported in square brackets. Each regression is weighted by the size of the municipality population. Robust standard errors are clustered by municipality and reported in parentheses. *, ** and *** denote significance at the 10, 5 and 1 percent level, respectively.

49
Table 10. The neighborhood quality - Right wing
Density Native kids ratio Crime (1) (2) (3) (4) (5) (6) 2SLS 2SLS 2SLS 2SLS 2SLS 2SLS Bottom Top Bottom Top Bottom Top Share of immigrants -3.882* -1.164*** -1.723** -3.931*** -4.484* -0.921** (2.354) (0.408) (0.859) (1.361) (2.404) (0.394) Inflow of immigrants 3.901* 2.253 1.916 3.688*** 6.217* 1.313 (1.999) (1.382) (1.485) (1.279) (3.378) (0.979) Year FE YES YES YES YES YES YES Municipal FE YES YES YES YES YES YES Observations 568 564 568 564 564 568 R-squared 0.7331 0.9124 0.8940 0.8220 0.6897 0.9237 CD F statistic 1.46 17.38 9.62 5.82 2.34 17.45 KP F statistic 1.10 8.34 3.07 6.20 1.84 9.08 KP rk LM statistic 3.90 15.23 4.54 10.13 4.97 15.00 [0.048] [0.000] [0.033] [0.002] [0.026] [0.000]
Note: The dependent variable in all columns is the share of votes for the Sweden Democrats in the parliamentary elections. All regressions include the same set of control variables as the baseline specification. Municipal and year fixed effects are included in all regressions. Both Cragg-Donald F statistic and Kleibergen-Paap F statistic are reported to examine the relevance of the instrumental variables. Kleibergen-Paap rk LM statistic is included to test under-identification of the model, with p-values reported in square brackets. Each regression is weighted by the size of the municipality population. Robust standard errors are clustered by municipality and reported in parentheses. *, ** and *** denote significance at the 10, 5 and 1 percent level, respectively.

50
Table 11. The neighborhood quality - Left wing
Density Native kids ratio Crime (1) (2) (3) (4) (5) (6) 2SLS 2SLS 2SLS 2SLS 2SLS 2SLS Bottom Top Bottom Top Bottom Top Share of immigrants 0.441 0.810*** 1.511** -0.147 0.280 0.933*** (0.666) (0.240) (0.767) (0.481) (0.551) (0.337) Inflow of immigrants -0.650 -0.828 -1.254 -0.591* -1.014* -0.724 (0.536) (0.713) (1.191) (0.316) (0.609) (0.661) Year FE YES YES YES YES YES YES Municipal FE YES YES YES YES YES YES Observations 568 564 568 564 564 568 R-squared 0.1001 0.4702 -0.1217 0.5106 0.2506 0.3770 CD F statistic 1.46 17.38 9.62 5.82 2.34 17.45 KP F statistic 1.10 8.34 3.07 6.20 1.84 9.08 KP rk LM statistic 3.90 15.23 4.54 10.13 4.97 15.00 [0.048] [0.000] [0.033] [0.002] [0.026] [0.000]
Note: The dependent variable in all columns is the aggregated share of votes for the Left Party and the Green Party in the parliamentary elections. All regressions include the same set of control variables as the baseline specification. Municipal and year fixed effects are included in all regressions. Both Cragg-Donald F statistic and Kleibergen-Paap F statistic are reported to examine the relevance of the instrumental variables. Kleibergen-Paap rk LM statistic is included to test under-identification of the model, with p-values reported in square brackets. Each regression is weighted by the size of the municipality population. Robust standard errors are clustered by municipality and reported in parentheses. *, ** and *** denote significance at the 10, 5 and 1 percent level, respectively.
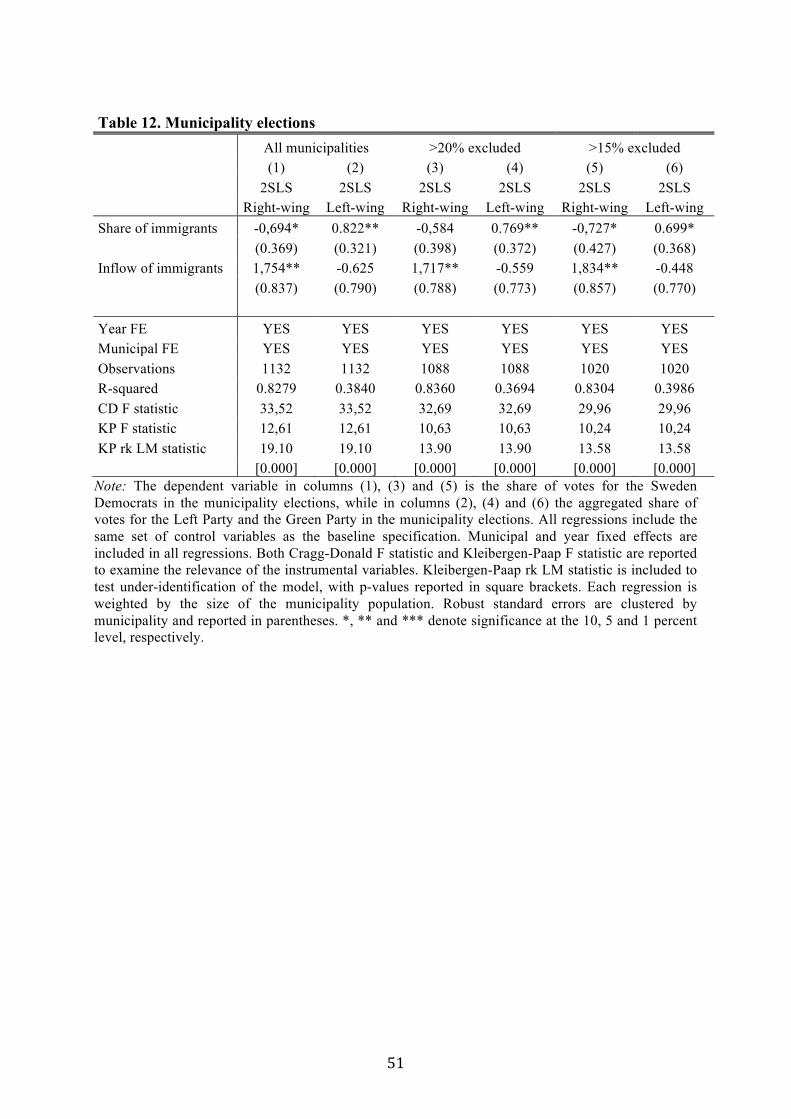
51
Table 12. Municipality elections
All municipalities >20% excluded >15% excluded (1) (2) (3) (4) (5) (6) 2SLS 2SLS 2SLS 2SLS 2SLS 2SLS Right-wing Left-wing Right-wing Left-wing Right-wing Left-wing Share of immigrants -0,694* 0.822** -0,584 0.769** -0,727* 0.699* (0.369) (0.321) (0.398) (0.372) (0.427) (0.368) Inflow of immigrants 1,754** -0.625 1,717** -0.559 1,834** -0.448 (0.837) (0.790) (0.788) (0.773) (0.857) (0.770) Year FE YES YES YES YES YES YES Municipal FE YES YES YES YES YES YES Observations 1132 1132 1088 1088 1020 1020 R-squared 0.8279 0.3840 0.8360 0.3694 0.8304 0.3986 CD F statistic 33,52 33,52 32,69 32,69 29,96 29,96 KP F statistic 12,61 12,61 10,63 10,63 10,24 10,24 KP rk LM statistic 19.10 19.10 13.90 13.90 13.58 13.58 [0.000] [0.000] [0.000] [0.000] [0.000] [0.000]
Note: The dependent variable in columns (1), (3) and (5) is the share of votes for the Sweden Democrats in the municipality elections, while in columns (2), (4) and (6) the aggregated share of votes for the Left Party and the Green Party in the municipality elections. All regressions include the same set of control variables as the baseline specification. Municipal and year fixed effects are included in all regressions. Both Cragg-Donald F statistic and Kleibergen-Paap F statistic are reported to examine the relevance of the instrumental variables. Kleibergen-Paap rk LM statistic is included to test under-identification of the model, with p-values reported in square brackets. Each regression is weighted by the size of the municipality population. Robust standard errors are clustered by municipality and reported in parentheses. *, ** and *** denote significance at the 10, 5 and 1 percent level, respectively.
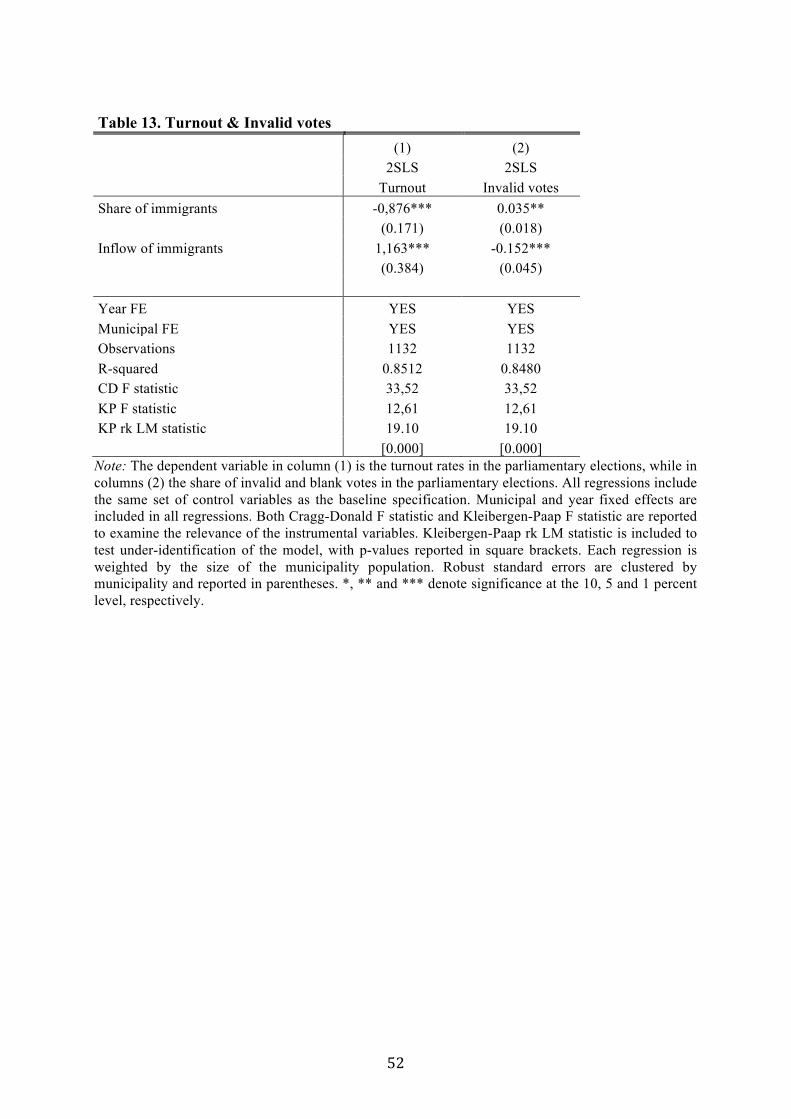
52
Table 13. Turnout & Invalid votes
(1) (2) 2SLS 2SLS Turnout Invalid votes Share of immigrants -0,876*** 0.035** (0.171) (0.018) Inflow of immigrants 1,163*** -0.152*** (0.384) (0.045) Year FE YES YES Municipal FE YES YES Observations 1132 1132 R-squared 0.8512 0.8480 CD F statistic 33,52 33,52 KP F statistic 12,61 12,61 KP rk LM statistic 19.10 19.10 [0.000] [0.000]
Note: The dependent variable in column (1) is the turnout rates in the parliamentary elections, while in columns (2) the share of invalid and blank votes in the parliamentary elections. All regressions include the same set of control variables as the baseline specification. Municipal and year fixed effects are included in all regressions. Both Cragg-Donald F statistic and Kleibergen-Paap F statistic are reported to examine the relevance of the instrumental variables. Kleibergen-Paap rk LM statistic is included to test under-identification of the model, with p-values reported in square brackets. Each regression is weighted by the size of the municipality population. Robust standard errors are clustered by municipality and reported in parentheses. *, ** and *** denote significance at the 10, 5 and 1 percent level, respectively.

53
Appendix A.1 Variable Definition and sources In Table A2 a detailed definition of all variables used in the paper, together with the sources from where the data is collected, is given.
Table A1. Definition and sources of the variables
Variable Definition Data source Outcome variables Right-wing vote share The vote share for the Sweden Democrats in the Statistics Sweden parliamentary elections Left-wing vote share Aggregated vote share for the Left Party and the Statistics Sweden Green Party in the parliamentary elections Immigration variables Actual share of immigrants Foreign-born share of the total population Statistics Sweden Historical share of immigrants Foreign-born share of the total population in 1998 Statistics Sweden Control variables Population Total population Statistics Sweden Density Population per square kilometer Statistics Sweden High education Share of the population aged 25-64 with a tertiary Swedish Association of education of at least three years Local Authorities and Regions Crime rate Total number of reported crimes per capita The Swedish National Council for Crime Prevention Employment Share of the population aged 25-64 in employment The Swedish National Council Local Authorities and Regions High income Share of the population with a taxable earned income Statistics Sweden above the nation median.
Robustness & Additional results Natives Total number of natives Statistics Sweden Turnout rate Total number of votes cast over the total number of Statistics Sweden eligible voters in the parliamentary elections Invalid votes Share of invalid votes and blank votes in the Statistics Sweden parliamentary elections Right-wing municipality Vote share for the Sweden Democrats in the Statistics Sweden vote share municipality elections Left-wing municipality Aggregated vote share for the Left Party and the Statistics Sweden vote share Green Party in the municipality elections
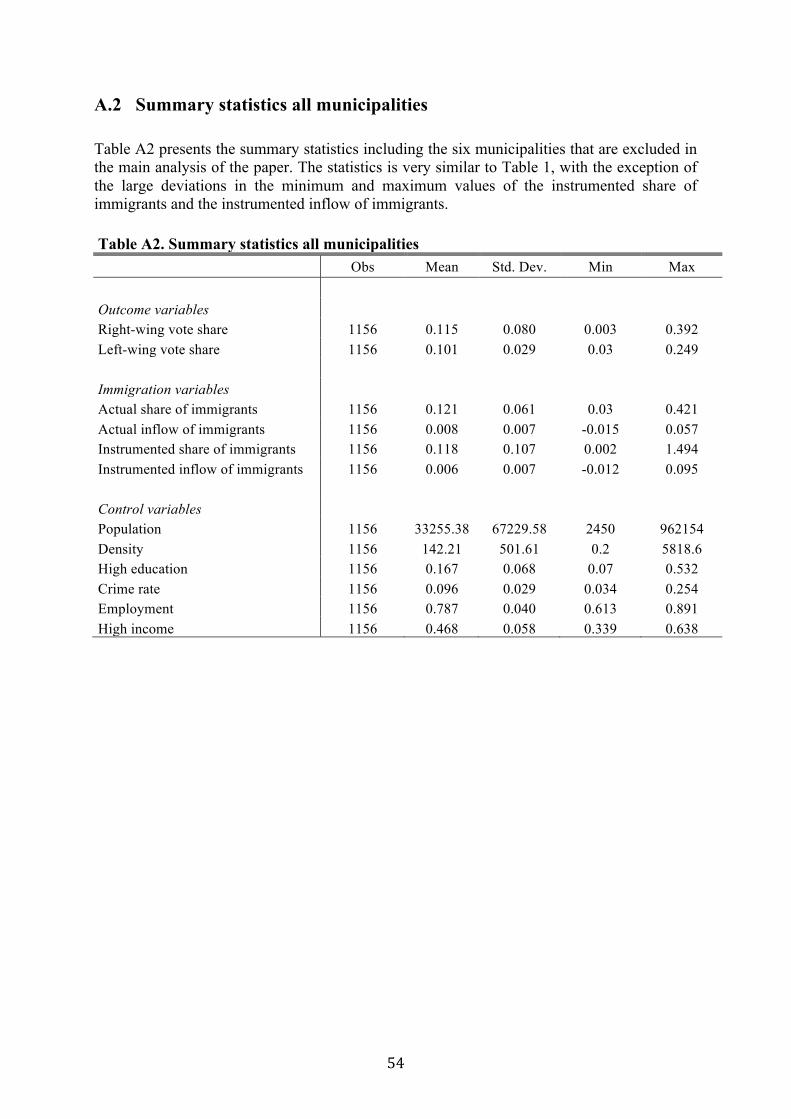
54
A.2 Summary statistics all municipalities Table A2 presents the summary statistics including the six municipalities that are excluded in the main analysis of the paper. The statistics is very similar to Table 1, with the exception of the large deviations in the minimum and maximum values of the instrumented share of immigrants and the instrumented inflow of immigrants. Table A2. Summary statistics all municipalities
Obs Mean Std. Dev. Min Max Outcome variables Right-wing vote share 1156 0.115 0.080 0.003 0.392 Left-wing vote share 1156 0.101 0.029 0.03 0.249 Immigration variables Actual share of immigrants 1156 0.121 0.061 0.03 0.421 Actual inflow of immigrants 1156 0.008 0.007 -0.015 0.057 Instrumented share of immigrants 1156 0.118 0.107 0.002 1.494 Instrumented inflow of immigrants 1156 0.006 0.007 -0.012 0.095 Control variables Population 1156 33255.38 67229.58 2450 962154 Density 1156 142.21 501.61 0.2 5818.6 High education 1156 0.167 0.068 0.07 0.532 Crime rate 1156 0.096 0.029 0.034 0.254 Employment 1156 0.787 0.040 0.613 0.891 High income 1156 0.468 0.058 0.339 0.638
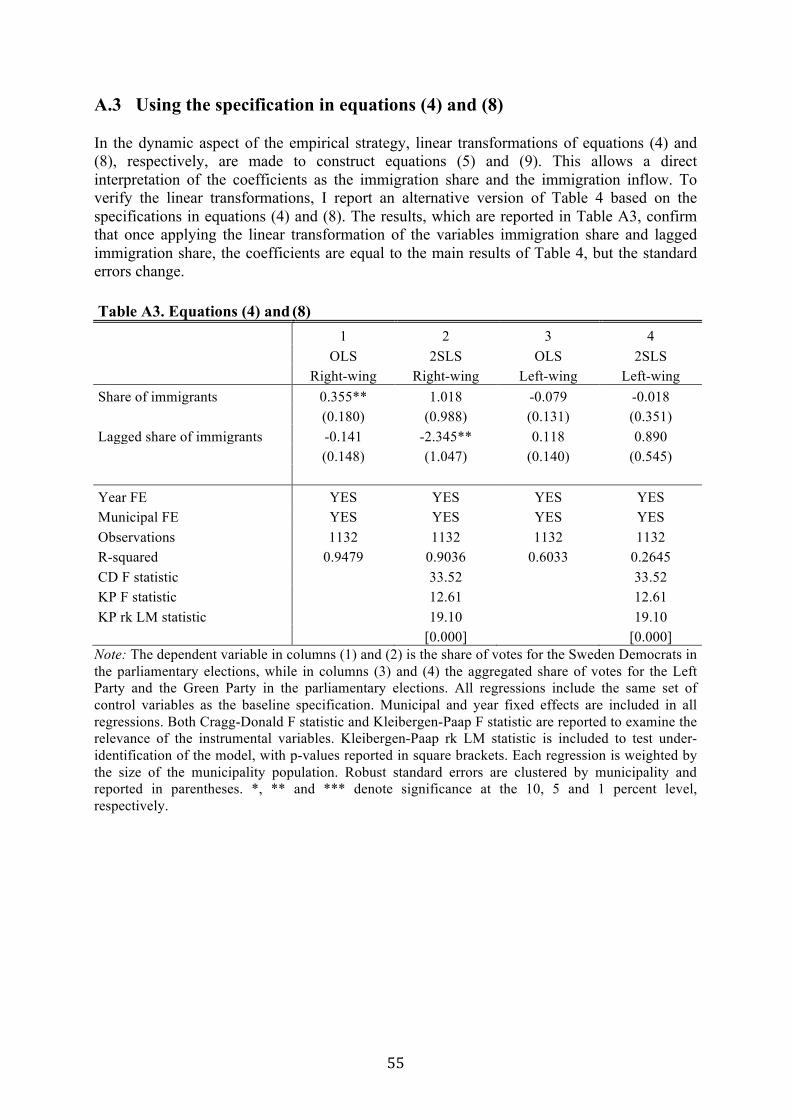
55
A.3 Using the specification in equations (4) and (8) In the dynamic aspect of the empirical strategy, linear transformations of equations (4) and (8), respectively, are made to construct equations (5) and (9). This allows a direct interpretation of the coefficients as the immigration share and the immigration inflow. To verify the linear transformations, I report an alternative version of Table 4 based on the specifications in equations (4) and (8). The results, which are reported in Table A3, confirm that once applying the linear transformation of the variables immigration share and lagged immigration share, the coefficients are equal to the main results of Table 4, but the standard errors change. Table A3. Equations (4) and (8)
1 2 3 4 OLS 2SLS OLS 2SLS Right-wing Right-wing Left-wing Left-wing Share of immigrants 0.355** 1.018 -0.079 -0.018 (0.180) (0.988) (0.131) (0.351) Lagged share of immigrants -0.141 -2.345** 0.118 0.890 (0.148) (1.047) (0.140) (0.545) Year FE YES YES YES YES Municipal FE YES YES YES YES Observations 1132 1132 1132 1132 R-squared 0.9479 0.9036 0.6033 0.2645 CD F statistic 33.52 33.52 KP F statistic 12.61 12.61 KP rk LM statistic 19.10 19.10 [0.000] [0.000]
Note: The dependent variable in columns (1) and (2) is the share of votes for the Sweden Democrats in the parliamentary elections, while in columns (3) and (4) the aggregated share of votes for the Left Party and the Green Party in the parliamentary elections. All regressions include the same set of control variables as the baseline specification. Municipal and year fixed effects are included in all regressions. Both Cragg-Donald F statistic and Kleibergen-Paap F statistic are reported to examine the relevance of the instrumental variables. Kleibergen-Paap rk LM statistic is included to test under-identification of the model, with p-values reported in square brackets. Each regression is weighted by the size of the municipality population. Robust standard errors are clustered by municipality and reported in parentheses. *, ** and *** denote significance at the 10, 5 and 1 percent level, respectively.