the diversity of louisiana’s registered nurse workforce
TRANSCRIPT

Cynthia Bienemy, PhD, RN www.lcn.lsbn.state.la.us Director, Louisiana Center for Nursing December 2015
The Diversity of Louisiana’s Registered Nurse Workforce: Race/Ethnicity and Gender

1
The Diversity of Louisiana’s Registered Nurse Workforce: Race/Ethnicity and Gender Source of Data: The Louisiana State Board of Nursing 2014 Licensure Renewal Data
Introduction
Diversifying the nation’s healthcare workforce has been identified as a necessary strategy that is needed to provide culturally relevant care to an increasingly diverse population, increase access to quality healthcare for all populations, reduce health disparities, and achieve health equity (Williams et al., 2014). Evidence suggests that racially, ethnically, and socioeconomically diverse healthcare providers are likely to practice in communities with similar populations, improving healthcare in those communities (HRSA Bureau of Health Professions, 2006; IOM Report on the Future of Nursing, 2011). Changing the demographic composition of the nursing workforce, the largest segment of Louisiana’s healthcare workforce, has the potential to foster better interaction and communication with underserved populations, thereby improving quality of care and health care outcomes, which may ultimately lead to a decrease in health care costs (AACN, 2015). While Louisiana has a diverse mix of residents in terms of race/ethnicity and gender, the registered nurse (RN) workforce is primarily White (81%) and female (89%). Minorities represent 40 percent of the population, yet only 19 percent of licensed registered nurses (RNs) residing in Louisiana are minorities (LSBN Annual Report, 2014), and even fewer (16%) are advanced practice registered nurses (APRNs). Additionally, only 11 percent of Louisiana’s nursing workforce are males (LSBN Annual Report, 2014), compared to 49 percent of the state’s total population that are males (U.S. Census Bureau, 2015). The current report represents an analysis of the 2014 Louisiana State Board of Nursing licensure renewal data that describes the diversity of Louisiana’s RN workforce in terms of race/ethnicity and gender. The report provides baseline data at both the state and regional level that can be used to establish benchmarks for initiatives for future work aimed at increasing the diversity of Louisiana’s RN workforce.
Louisiana’s RN Workforce: Race/Ethnicity
Although there has been an increase in the number of RNs in all racial/ethnic categories over the past five years, the percentage of minorities has remained basically unchanged when compared to the overall composition of Louisiana’s RN workforce (Table 1).

2
Table 1. Racial Distribution of Licensed Registered Nurses Residing in LA (2010-2014) Report Year
White
# %
Black/African American
# %
Hispanic/Latino
# %
Asian
# %
American Indian /Alaska Native
# %
Native Hawaiian/Pacific
Islander # %
No Response
2014 42,983 81% 8,235 16% 858 2% 691 1% 247 0.5% 73 0.1% 644 2013 42,275 81% 7,920 15% 821 2% 642 1% 224 0.4% 76 0.1% 598 2012 41,483 82% 7,652 15% 757 1% 619 1% 231 0.5% 66 0.1% 801 2011 40,332 82% 7,164 15% 706 1% 549 1% 195 0.4% 44 0.1% 740 2010 39,245 82% 6,768 14% 682 1% 547 1% 195 0.4% 36 0.1% 422 1 & 5 Year Variance
↑2% ↑10% ↑4% ↑22% ↑5%↑26% ↑8%↑26% ↑10% ↑27% ↓4% ↑103%
Note: Number of Respondents in 2014 = 53,087 According to the July, 2014 U.S. Census Population Projections (2015), minorities represent over forty percent of Louisiana’s population, but only nineteen percent of Louisiana’s RN workforce (Table 2). Table 2. RN Workforce and Louisiana Population According to Race/Ethnicity (2014)
White
# %
Black/African American
# %
Hispanic/ Latino
# %
Asian
# %
American Indian /
Alaska Native
# %
Native Hawaiian/
Pacific Islander
# %
Two or More Races
# %
RNs 42,983 81.0% 8,235 15.5% 858 1.6% 691 1.3% 247 0.5% 73 0.1% LA Pop.
2,758,588 59.3% 1,490,741 32.1% 224,867 4.8% 81,061 1.7% 29,373 0.6% 1,909 0.04% 63,137 1.4%
Note: Number of RN Respondents=53,087 (2014 LSBN Annual Report); Total LA Population = 4,649,676 (U. S. Census Bureau Factfinder, June 2015) The average age for RNs licensed in Louisiana in 2014 was 45 years and the median age was 44 years (LSBN Annual Report, 2015). The average age for RNs nationwide is 50 years (Budden, Zhong, and Moulton & Cimiotti 2013). In Louisiana, Asian and Native Hawaiian/Pacific Islander RNs are the youngest overall with an average age of 42 years (Table 3a). White RNs are the oldest with an average age of 46 years. Table 3a. Age of the Registered Nurse Workforce According to Race/Ethnicity (2014)
Race/Ethnicity Average Median White 46 45 Black/African American 44 43 Hispanic/Latino 43 41 Asian 42 41 American Indian/Alaska Native 44 43 Native Hawaiian/Pacific Islander 42 41
The largest percentage of RNs within all racial/ethnic groups fall within the 30-39 and 40-49 year age range (Table 3b).

3
Table 3b. Age of the Registered Nurse Workforce According to Race/Ethnicity (2014) Age White Black/
African American
Hispanic/ Latino
Asian American Indian/
Alaska Native
Native Hawaiian/
Pacific Islander
Total
<30 Years 5,010 11.7%
903 11.0%
119 13.9%
126 18.2%
26 10.5%
9 12.3%
6,193
30-39 Years 10,507 24.4%
2,383 28.9%
279 32.5%
200 28.9%
72 29.2%
25 34.3%
13,466
40-49 Years 10,304 24.0%
2,176 26.4%
204 23.8%
184 26.6%
72 29.2%
21 28.8%
12,961
50-59 Years 9,931 23.1%
1,715 20.8%
167 19.5%
91 13.2%
51 20.7%
10 13.7%
11,965
60-69 Years 6,224 14.5%
898 10.9%
76 8.9%
76 11.0%
23 9.3%
8 11.0%
7,305
70-79 Years 941 2.2%
147 1.8%
11 1.3%
14 2.0%
3 1.2%
0 0.0%
1,116
80+ Years 66 0.2%
13 0.2%
2 0.2%
0 0.0%
0 0.0%
0 0.0%
81
Total 42,983 100%
8,235 100%
858 100%
691 100%
247 100%
73 100%
53,087
The majority of all RNs in Louisiana began their nursing careers with an associate or baccalaureate degree in nursing .Over fifty percent of Asian (58.6%) and Black/African American (51.5%) RNs began their nursing careers with a baccalaureate degree in nursing (Table 4). Table 4. Race/Ethnicity of Registered Nurses Residing in Louisiana According to Basic Nursing Education (2014)
White Black/ African
American
Hispanic/ Latino
Asian American Indian/ Alaska Native
Native Hawaiian/
Pacific Islander
Total
Vocational/ Practical
873 2.0%
287 3.5%
14 1.6%
6 0.9%
7 2.8%
0 0.0%
1,187 2.2%
Diploma in Nursing
3,537 8.2%
417 5.1%
58 6.8%
44 6.4%
5 2.0%
4 5.5%
4,065 7.7%
Associate Degree In Nursing
17,768 41.3%
2,984 36.2%
392 45.7%
215 31.1%
112 45.3%
33 45.2%
21,504 40.5%
Bachelors in Nursing
19,910 46.3%
4,241 51.5%
373 43.5%
405 58.6%
116 47.0%
34 46.6%
25,079 47.2%
Masters in Nursing
866 2.0%
293 3.6%
20 2.3%
21 3.0%
7 2.8%
2 2.7%
1,209 2.3%
Doctorate - Nursing
27 0.1%
12 0.2%
1 0.1%
0 0.0%
0 0.0%
0 0.0%
40 0.1%
Other 2 0.01%
1 0.01%
0 0.0%
0 0.0%
0 0.0%
0 0.0%
3 0.01%
Total 42,983 100%
8,235 100%
858 100%
691 100%
247 100%
73 100%
53,087 100%

4
As seen in Table 5, the highest percentage of RNs with a baccalaureate degree in nursing according to race/ethnicity are Asian RNs (54.3%). Table 5. Race/Ethnicity of Registered Nurses Residing in Louisiana According to Highest Degree (2014)
White Black/ African
American
Hispanic/ Latino
Asian American Indian/ Alaska Native
Native Hawaiian/
Pacific Islander
Total
Diploma in Nursing
2,395 5.6%
194 2.4%
37 4.3%
33 4.8%
3 1.2%
1 1.4%
2663 5.0%
Associate Degree In Nursing
14,141 32.9%
2,295 27.9%
287 33.5%
137 19.8%
94 38.1%
24 32.9%
16,978 32.0%
Bachelors in Nursing
17,793 41.4%
3,741 45.4%
346 40.3%
375 54.3%
110 44.5%
32 43.8%
22,397 42.2%
Masters in Nursing
4,381 10.2%
1,094 13.3%
75 8.7%
58 8.4%
20 8.1%
2 2.7%
5,630 10.6%
PhD in Nursing
55 0.1%
33 0.4%
4 0.5%
1 0.1%
1 0.4%
0 0.0%
94 0.2%
DNP 123 0.3%
42 0.5%
2 0.2%
3 0.4
1 0.4%
0 0.0%
171 0.3%
Doc. In Nursing (i.e., DNS)
48 0.1%
15 0.2%
0 0.0%
3 0.4
0 0.0%
1 1.4%
67 0.1%
Doc. Related Field
186 0.4%
41 0.5%
5 0.6%
3 0.4
2 0.8%
0 0.0%
237 0.5%
Non-Nursing Degrees
3,861 9.0%
780 9.5%
102 11.9%
78 11.3%
16 6.5%
13 17.8%
4,850 9.1%
Total 42,983 100%
8,235 100%
858 100%
691 100%
247 100%
73 100%
53,087 100%
Table 6 shows that within racial/ethnic groups in Louisiana, the greatest percentage of RNs with a BSN or higher degree are Asian RNs (64%) followed by Black/African American RNs (60%). Approximately 54 percent of the entire RN workforce, licensed and residing in Louisiana in 2014, had a BSN or higher degree in nursing. Table 6. RN Workforce with a BSN or Higher Degree in Nursing According to Race/Ethnicity (2014)
White Black/ African
American
Hispanic/ Latino
Asian American Indian/ Alaska Native
Native Hawaiian/
Pacific Islander
All RNs in LA with a BSN or Higher
% BSN or Higher 22,586
52.6% 4,966 60.3%
432 50.4%
443 64.1%
134 54.3%
35 48.0%
28,596 53.9%
Total 42,983 8,235 858 691 247 73 53,087
5
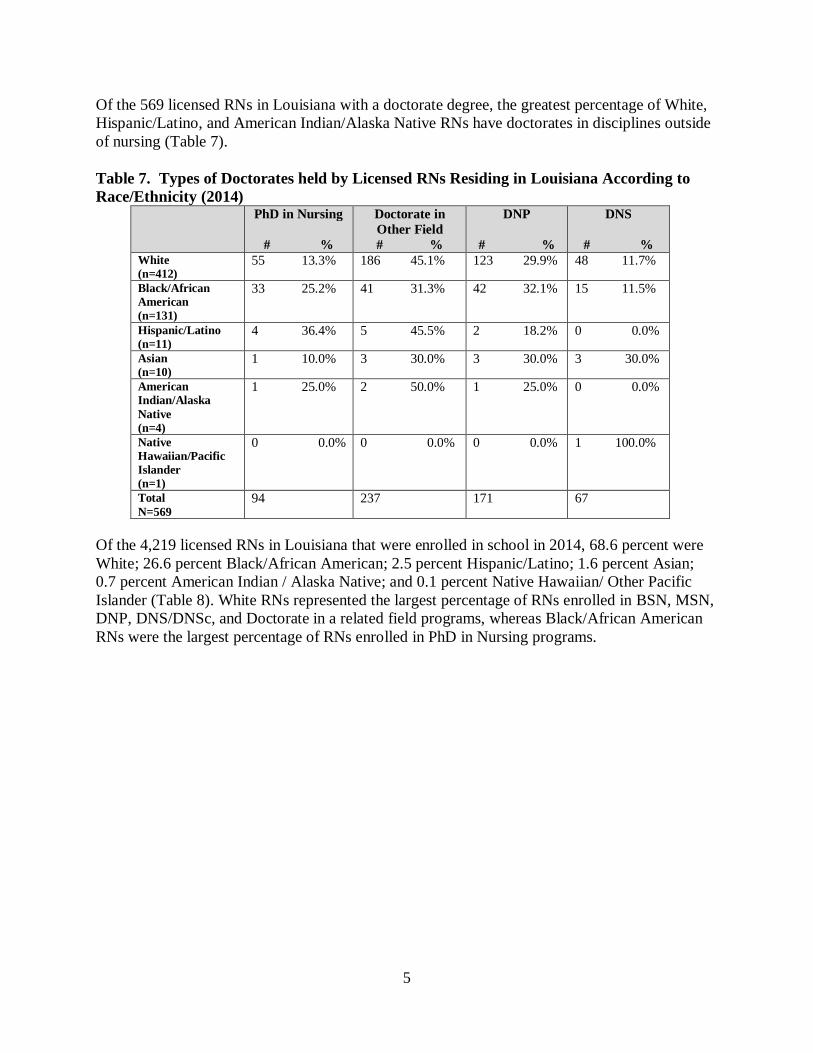
Of the 569 licensed RNs in Louisiana with a doctorate degree, the greatest percentage of White, Hispanic/Latino, and American Indian/Alaska Native RNs have doctorates in disciplines outside of nursing (Table 7). Table 7. Types of Doctorates held by Licensed RNs Residing in Louisiana According to Race/Ethnicity (2014)
PhD in Nursing
# %
Doctorate in Other Field # %
DNP
# %
DNS
# % White (n=412)
55 13.3% 186 45.1% 123 29.9% 48 11.7%
Black/African American (n=131)
33 25.2% 41 31.3% 42 32.1% 15 11.5%
Hispanic/Latino (n=11)
4 36.4% 5 45.5% 2 18.2% 0 0.0%
Asian (n=10)
1 10.0% 3 30.0% 3 30.0% 3 30.0%
American Indian/Alaska Native (n=4)
1 25.0% 2 50.0% 1 25.0% 0 0.0%
Native Hawaiian/Pacific Islander (n=1)
0 0.0% 0 0.0% 0 0.0% 1 100.0%
Total N=569
94 237 171 67
Of the 4,219 licensed RNs in Louisiana that were enrolled in school in 2014, 68.6 percent were White; 26.6 percent Black/African American; 2.5 percent Hispanic/Latino; 1.6 percent Asian; 0.7 percent American Indian / Alaska Native; and 0.1 percent Native Hawaiian/ Other Pacific Islander (Table 8). White RNs represented the largest percentage of RNs enrolled in BSN, MSN, DNP, DNS/DNSc, and Doctorate in a related field programs, whereas Black/African American RNs were the largest percentage of RNs enrolled in PhD in Nursing programs.

6
Table 8. Enrollment in Post-RN Programs According to Race/Ethnicity (2014) BSN MSN PhD DNP DNS/DNSc Doctorate/
Non-nursing
Non-Nursing
Post Graduate
Total
White 1,017 67.1%
1,311 71.7%
29 42.7%
256 64.3%
12 60.0%
61 65.6%
207 69.7%
2,893 68.6%
Black/African American
411 27.1%
443 24.2%
38 55.9%
114 28.6%
6 30.0%
27 29.0%
82 27.6%
1,121 26.6%
Hispanic/Latino 50 3.3%
30 1.6%
0 0.0%
20 5.0%
1 5.0%
0 0.0%
4 1.4%
105 2.5%
Asian 30 2.0%
28 1.5%
0 0.0%
6 1.5%
1 5.0%
1 1.1%
0 0.0%
66 1.6%
American Indian/Alaska Native
5 0.3%
14 0.8%
1 1.5%
2 0.5%
0 0.0%
3 3.2%
4 1.4%
29 0.7%
Native Hawaiian/Pacific Islander
2 0.1%
2 0.1%
0 0.0%
0 0.0%
0 0.0%
1 1.1%
0 0.0%
5 0.1%
Total 1,515 100%
1,828 100%
68 100%
398 100%
20 100%
93 100%
297 100%
4,219 100%
In 2014, minorities held approximately 15 percent of nurse executive and 18 percent of nurse manager positions in the state (Table 9). Table 9. Types of Positions Held by Licensed Registered Nurses Residing in Louisiana (2014)
Staff Nurse
Nurse Executive
Nurse Manager
Advanced Practice Faculty
Consultant Other
Health Related
Other Non-
Health Related
White 26,673 79.5%
1,025 84.9%
4,491 82.3%
3,441 84.6%
1,018 73.4%
740 85.2%
3,115 81.5%
2,320 91.3%
Black/ African American
5,526 16.5%
157 13.0%
832 15.2%
513 12.6%
328 23.7%
111 12.8%
596 15.6%
152 6.0%
Hispanic/ Latino
607 1.8%
14 1.2%
62 1.1%
53 1.3%
21 1.5%
10 1.2%
48 1.3%
37 1.5%
Asian 539 1.6%
3 0.3%
34 0.6%
39 1.0%
17 1.2%
3 0.4%
34 0.9%
19 0.8%
American Indian/ Alaska Native
149 0.4%
5 0.4%
35 0.6%
17 0.4%
3 0.2%
4 0.5%
22 0.6%
12 0.5%
Native Hawaiian/Pacific Islander
53 0.2%
3 0.3%
6 0.1%
3 0.1%
0 0.0%
1 0.1%
5 0.1%
1 0.04
Total 33,547 100%
1,207 100%
5,460 100%
4,066 100%
1,387 100%
869 100%
3,820 100%
2,541 100%
Note: Researcher – 183; Quality – 1; Discharge – 1; Utilization Review – 1 Number of Respondents=53,083.
7
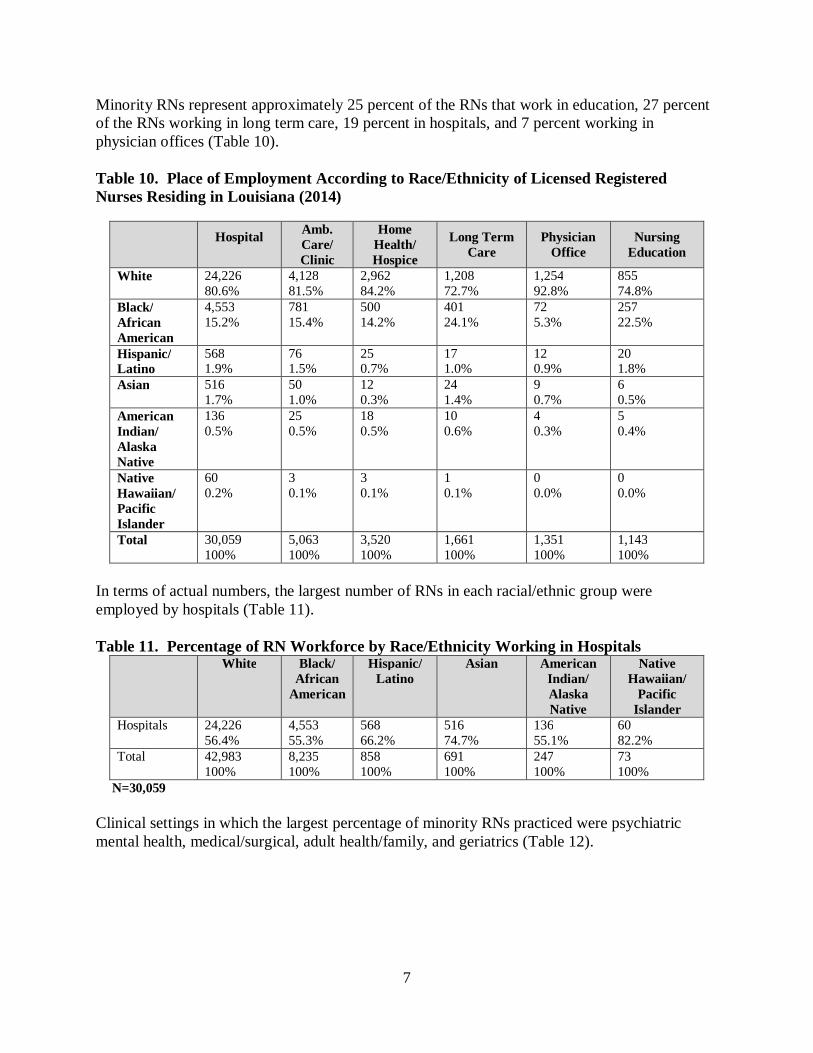
Minority RNs represent approximately 25 percent of the RNs that work in education, 27 percent of the RNs working in long term care, 19 percent in hospitals, and 7 percent working in physician offices (Table 10). Table 10. Place of Employment According to Race/Ethnicity of Licensed Registered Nurses Residing in Louisiana (2014)
Hospital
Amb. Care/ Clinic
Home Health/ Hospice
Long Term Care
Physician Office
Nursing Education
White 24,226 80.6%
4,128 81.5%
2,962 84.2%
1,208 72.7%
1,254 92.8%
855 74.8%
Black/ African American
4,553 15.2%
781 15.4%
500 14.2%
401 24.1%
72 5.3%
257 22.5%
Hispanic/ Latino
568 1.9%
76 1.5%
25 0.7%
17 1.0%
12 0.9%
20 1.8%
Asian 516 1.7%
50 1.0%
12 0.3%
24 1.4%
9 0.7%
6 0.5%
American Indian/ Alaska Native
136 0.5%
25 0.5%
18 0.5%
10 0.6%
4 0.3%
5 0.4%
Native Hawaiian/ Pacific Islander
60 0.2%
3 0.1%
3 0.1%
1 0.1%
0 0.0%
0 0.0%
Total 30,059 100%
5,063 100%
3,520 100%
1,661 100%
1,351 100%
1,143 100%
In terms of actual numbers, the largest number of RNs in each racial/ethnic group were employed by hospitals (Table 11). Table 11. Percentage of RN Workforce by Race/Ethnicity Working in Hospitals
White Black/ African
American
Hispanic/ Latino
Asian American Indian/ Alaska Native
Native Hawaiian/
Pacific Islander
Hospitals 24,226 56.4%
4,553 55.3%
568 66.2%
516 74.7%
136 55.1%
60 82.2%
Total 42,983 100%
8,235 100%
858 100%
691 100%
247 100%
73 100%
N=30,059 Clinical settings in which the largest percentage of minority RNs practiced were psychiatric mental health, medical/surgical, adult health/family, and geriatrics (Table 12).

8
Table 12. Type of Clinical Settings According to Race/Ethnicity (2014) Med
Surg Acute Care/ ICU
OR / PACU
ER Adult Health / Family
Ped/ Neo-natal
Home Health
Maternal Child Health
Psych Mental Health
Geriatrics
White 5,144 70.4%
4,530 82.5%
3,331 89.6%
3,044 86.9%
2,189 76.3%
2,261 87.4%
2,098 83.2%
2,013 85.98%
1,557 70.5%
1,480 76.4%
Black/ African American
1,788 24.5%
672 12.2%
281 7.6%
323 9.2%
585 20.4%
249 9.6%
381 15.1%
262 11.2%
593 26.9%
405 20.9%
Hispanic/ Latino
145 2.0%
134 2.4%
55 1.5%
65 1.9%
40 1.4%
49 1.9%
23 0.9%
31 1.3%
20 0.9%
22 1.1%
Asian 178 2.4%
109 2.0%
32 1.0%
46 1.3%
39 1.4%
19 0.7%
9 0.4%
23 1.0%
25 1.1%
22 1.1%
American Indian/ Alaska Native
35 0.5%
29 0.5%
15 0.4%
21 0.6%
16 0.6%
8 0.3%
8 0.3%
13 0.6%
12 0.5%
9 0.5%
Native Hawaiian/ Pacific Islander
16 0.2%
17 0.3%
2 0.1%
4 0.1%
2 0.1%
2 0.1%
2 0.1%
2 0.1%
1 0.1%
0 0.0%
TOTAL 7,306 100%
5,491 100%
3,716 100%
3,503 100%
2,871 100%
2,588 100%
2,521 100%
2,344 100%
2,208 100%
1,938 100%
The largest number of RNs within all racial/ethnic groups made between $50,001 and $75,000 a year in 2014(Table 13). Table 13. Salaries of RNs Within Racial/Ethnic Groups Working Full-Time
White Black/ African
American
Hispanic/ Latino
Asian American Indian/ Alaska Native
Native Hawaiian/
Pacific Islander
Total
$35,001 to $50,000 6,168 20.6%
1,224 18.9%
161 25.8%
130 26.0%
33 18.0%
12 21.8%
7,728 20.5%
$50,001 to $75,000 13,959 46.7%
3,350 51.7%
278 44.6%
230 45.9%
92 50.0%
21 38.2%
17,930 47.5%
$75,001 to $100,000 6,086 20.3%
1,410 21.7%
115 18.5%
89 17.8%
43 23.4%
15 27.3%
7,740 20.5%
$100,001 to $150,000 2,015 6.7%
288 4.4%
33 5.3%
20 4.0%
9 4.9%
3 5.5%
2,368 6.3%
>$150,000 631 2.1%
42 0.6%
8 1.3%
2 0.4%
2 1.1%
1 1.8%
686 1.8%
Declined 1,085 3.6%
172 2.7%
28 4.5%
30 6.0%
5 2.7%
3 5.5%
1,323 3.5%
Total RNs 29,926
6,486
623
501
184 55
37,775
Note: Number of Respondents = 37,775 The vast majority of RNs within all racial/ethnic groups, ranging from eighty-six percent of Asian RNs to seventy-eight percent of White RNs, reported working in positions in which they provided direct patient care (Table 14).

9
Table 14. Race/Ethnicity of RN Workforce Residing in Louisiana According to Direct Patient Care (2014)
White Black/ African
American
Hispanic/ Latino
Asian American Indian/ Alaska Native
Native Hawaiian/
Pacific Islander
Yes 33,588 78.2%
6,926 84.1%
709 82.6%
597 86.4%
204 82.6%
61 83.6%
No 5,106 11.9%
896 10.9%
80 9.3%
44 6.4%
23 9.3%
10 13.7%
N/A 4,278 10.0%
412 5.0%
69 8.0%
50 7.2%
20 8.1%
2 2.7%
Total 42,972 100%
8,234 100%
858 100%
691 100%
247 100%
73 100%
Note: N/A refers to retired/unemployed/not working.
Louisiana’s RN Workforce: Gender
The gender distribution for RNs licensed and residing in Louisiana has remained unchanged over the past five years with eighty-nine percent of the workforce represented by females (Table 15). Table 15. Gender Distribution of Licensed Registered Nurses Residing in LA (2010-2014)
Report Year Male # %
Female # %
2014 6,054 11% 47,677 89% 2013 5,900 11% 46,656 89% 2012 5,754 11% 45,855 89% 2011 5,596 11% 44,546 89% 2010 5,393 11% 42,905 89% 1 & 5 Year Variance ↑3% ↑12% ↑2% ↑11%
Note: Number of Respondents=53,731 According to Table 16, Louisiana’s RN workforce does not mirror its population of forty-nine percent male and fifty-one percent female. Table 16. RN Workforce and Louisiana Population by Gender (2014)
Male # %
Female # %
RN 6,054 11% 47,677 89% LA Population 2,273,939 49% 2,375,737 51%
Note: Number of RN Respondents=53,731; Total LA Population = 4,649,676 There is variation in the percentage of males and females within the RN workforce according to race/ethnicity, ranging from 16 percent of the Native Hawaiian/Pacific Islander RN workforce that are males to five percent of the Black/African American workforce represented by males (Table 17).

10
Table 17. RN Workforce According to Gender and Race/Ethnicity (2014) Male Female Total
White 5,302 12.3% 37,681 87.7% 42,983 Black/African American 445 5.4% 7,790 94.6% 8,235 Hispanic/Latino 127 14.8% 731 85.2% 858 Asian 68 9.9% 623 90.2% 691 American Indian/Alaska Native
37 15.0% 210 85.0% 247
Native Hawaiian/Pacific Islander
12 16.4% 61 83.6% 73
Total 5,991 47,096 53,087 There was very little difference in the average age of Louisiana’s RN workforce based on gender (Table 18). Male RNs (44 years) were slightly younger than female RNs (45 years). Table 18. Age of Nursing Workforce According to Gender (2014)
Average Median Male (n = 6054) 44 43 Female (n = 47,677) 45 45 Asian male RNs represented the youngest (38 years) sector of Louisiana’s RN workforce, followed by Native Hawaiian/Pacific Islander males (40years). Hispanic/Latino RNs were the youngest among the female RN population (Table 19). White female RNs were the oldest with an average age of 46 years. Table 19. Average Age of Nursing Workforce According to Gender and Race/Ethnicity (2014)
Male Female White 44 (n =5,302) 46 (n=37,681) Black/African American 41 (n=445) 44 (n=7,790) Hispanic/Latino 43 (n=127) 42 (n=731) Asian 38 (n=68) 43 (n=623) American Indian/Alaska Native
45 (n=37) 44 (n=210)
Native Hawaiian/Pacific Islander
40 (n=12) 43 (n=61)
Total 5,991 47,096 The majority of male and female RNs licensed and residing in Louisiana began their nursing career with an associate or baccalaureate degree in nursing (Table 20). A larger percentage of female RNs began their nursing careers as diploma nurses (8%) and vocational nurses (2%) when compared to male RNs (4% and 1%, respectively).
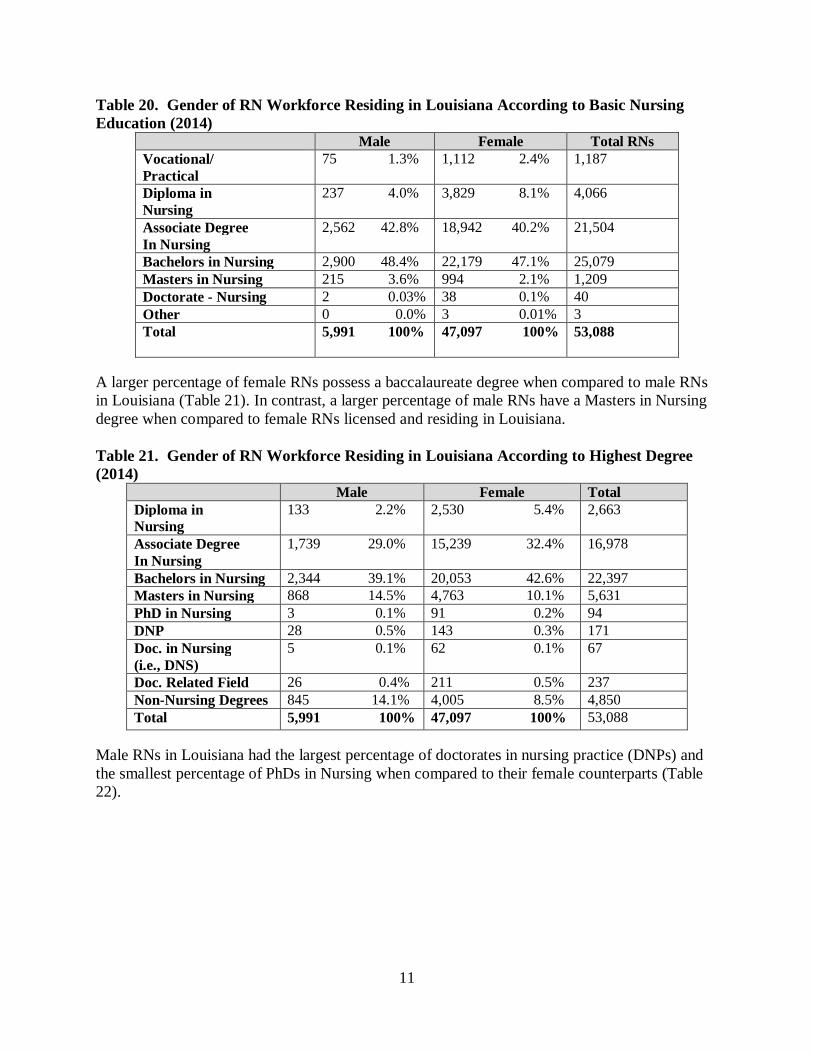
11
Table 20. Gender of RN Workforce Residing in Louisiana According to Basic Nursing Education (2014)
Male Female Total RNs Vocational/ Practical
75 1.3% 1,112 2.4% 1,187
Diploma in Nursing
237 4.0% 3,829 8.1% 4,066
Associate Degree In Nursing
2,562 42.8% 18,942 40.2% 21,504
Bachelors in Nursing 2,900 48.4% 22,179 47.1% 25,079 Masters in Nursing 215 3.6% 994 2.1% 1,209 Doctorate - Nursing 2 0.03% 38 0.1% 40 Other 0 0.0% 3 0.01% 3 Total 5,991 100%
47,097 100%
53,088
A larger percentage of female RNs possess a baccalaureate degree when compared to male RNs in Louisiana (Table 21). In contrast, a larger percentage of male RNs have a Masters in Nursing degree when compared to female RNs licensed and residing in Louisiana. Table 21. Gender of RN Workforce Residing in Louisiana According to Highest Degree (2014)
Male Female Total Diploma in Nursing
133 2.2% 2,530 5.4% 2,663
Associate Degree In Nursing
1,739 29.0% 15,239 32.4% 16,978
Bachelors in Nursing 2,344 39.1% 20,053 42.6% 22,397 Masters in Nursing 868 14.5% 4,763 10.1% 5,631 PhD in Nursing 3 0.1% 91 0.2% 94 DNP 28 0.5% 143 0.3% 171 Doc. in Nursing (i.e., DNS)
5 0.1% 62 0.1% 67
Doc. Related Field 26 0.4% 211 0.5% 237 Non-Nursing Degrees 845 14.1% 4,005 8.5% 4,850 Total 5,991 100% 47,097 100% 53,088
Male RNs in Louisiana had the largest percentage of doctorates in nursing practice (DNPs) and the smallest percentage of PhDs in Nursing when compared to their female counterparts (Table 22).

12
Table 22. Types of Doctorates held by Licensed RNs Residing in Louisiana According to Gender (2014)
PhD in Nursing Doctorate in Other Field
DNP DNS
Male (n=62)
3 4.8%
26 41.9% 28 45.2% 5 8.1%
Female (n=507)
91 18.0% 211 41.6% 143 28.2% 62 12.2%
Total N=569
94 237 171 67
There was very little difference in the percentage of male and female RNs with a BSN or higher degree in nursing in Louisiana in 2014 (Table 23). Table 23. RN Workforce with a BSN or Higher Degree in Nursing According to Gender (2014)
Male Female All RNs in LA with a BSN or Higher Degree
% BSN or Higher 3,274 54.7%
25,323 53.8%
28,597 53.9%
Total 5,991
47,097
53,088
Of the 4,219 licensed RNs in Louisiana that reported being enrolled in school in 2014, the vast majority were females (85%). Of the males that were enrolled in school, the largest number were enrolled in Masters in Nursing programs followed by BSN programs (Table 24). Approximately 23percent of the males that were enrolled in school were enrolled in a non-nursing doctorate program and 21 percent were enrolled in a DNP program. Table 24. Enrollment in Post-RN Programs According to Gender (2014)
BSN MSN PhD DNP DNS/DNSc Doctorate/ Other Field
Non-Nursing
Post Graduate
Total
Male 189 12.5%
290 15.9%
4 5.9%
82 20.6%
2 10.0%
21 22.6%
60 20.2%
648 15.4%
Female 1,326 87.5%
1,538 84.1%
64 94.1%
316 79.4%
18 90.0%
72 77.4%
237 79.8%
3,571 84.6%
Total 1,515 100%
1,828 100%
68 100%
398 100%
20 100%
93 100%
297 100%
4,219 100%
Female RNs licensed and residing in Louisiana represent the overwhelming majority of licensed RNs in each of the positions listed in Table 25. It is interesting to note that 24 percent of advanced practice registered nurses (APRNs) were male.

13
Table 25. Types of Positions Held by Licensed Registered Nurses Residing in Louisiana According to Gender (2014)
Staff Nurse
Nurse Executive
Nurse Manager
Advanced Practice Faculty
Consultant Other
Health Related
Other Non-
Health Related
Male 3,557 10.6%
183 15.2%
589 10.8%
978 24.1%
84 6.1%
67 7.7%
359 10.4%
165 6.5%
Female 29,990 89.4%
1,022 84.8%
4,871 89.2%
3,088 76.0%
1,303 93.9%
802 92.3%
3,461 90.6%
2,376 93.5%
Total 33,547 100%
1,205 100%
5,460 100%
4,066 100%
1,387 100%
869 100%
3,820 100%
2,541 100%
Note: Researcher – 183; Quality – 1; Discharge – 1; Utilization Review – 1; Number of Respondents=53,083.
The majority of RNs working in the healthcare industries listed in Table 26 are female. The healthcare industry having the largest percentage of male RNs employed were hospitals. Table 26. Place of Employment According to Gender of Licensed Registered Nurses Residing in Louisiana (2014)
Hospital
Amb. Care/ Clinic
Home Health/ Hospice
Long Term Care
Physician Office
Nursing Education
Male 4,231 14.1%
373 7.4%
232 6.6%
105 6.3%
93 6.9%
78 6.8%
Female 25,828 85.9%
4,690 92.6%
3,288 93.4%
1,556 93.7%
1,258 93.1%
1,065 93.2%
Total 30,059 100%
5,063 100%
3,520 100%
1,661 100%
1,351 100%
1,143 100%
According to Table 27, the largest percentage of male RNs licensed and residing in Louisiana can be found working in the emergency room or acute care intensive care units. Table 27. Type of Clinical Settings According to Gender (2014)
Med Surg
Acute Care/ ICU
OR / PACU
ER / Trauma
Adult Health / Family
Ped/ Neo-natal
Home Health
Maternal Child Health
Psych Mental Health
Geriatrics
Male 656 9.0%
1,058 19.3%
426 11.5%
854 24.4%
279 9.7%
76 2.9%
172 6.8%
5 0.2%
346 15.7%
109 5.6%
Female 6,650 91.0%
4,433 80.7%
3,290 88.5%
2,649 75.6%
2,592 90.3%
2,512 97.1%
2,349 93.2%
2,339 99.8%
1,862 84.3%
1,830 94.4%
TOTAL 7,306 100%
5,491 100%
3,716 100%
3,503 100%
2,871 100%
2,588 100%
2,521 100%
2,344 100%
2,208 100%
1,939 100%
According to Table 28, the percentage of male RNs earning annual incomes between $75,001 and greater than $150,000 (45%) exceeded that of female RNs (26%) substantially.
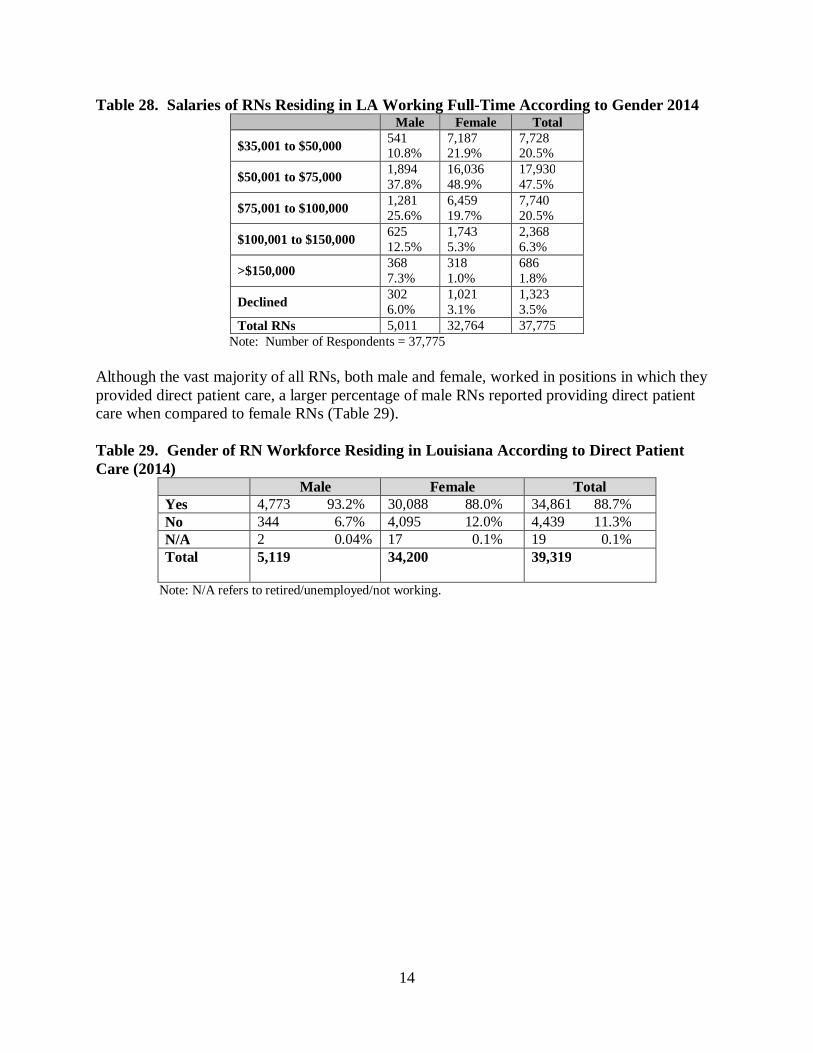
14
Table 28. Salaries of RNs Residing in LA Working Full-Time According to Gender 2014 Male Female Total
$35,001 to $50,000 541 10.8%
7,187 21.9%
7,728 20.5%
$50,001 to $75,000 1,894 37.8%
16,036 48.9%
17,930 47.5%
$75,001 to $100,000 1,281 25.6%
6,459 19.7%
7,740 20.5%
$100,001 to $150,000 625 12.5%
1,743 5.3%
2,368 6.3%
>$150,000 368 7.3%
318 1.0%
686 1.8%
Declined 302 6.0%
1,021 3.1%
1,323 3.5%
Total RNs 5,011 32,764 37,775 Note: Number of Respondents = 37,775 Although the vast majority of all RNs, both male and female, worked in positions in which they provided direct patient care, a larger percentage of male RNs reported providing direct patient care when compared to female RNs (Table 29). Table 29. Gender of RN Workforce Residing in Louisiana According to Direct Patient Care (2014)
Male Female Total Yes 4,773 93.2% 30,088 88.0% 34,861 88.7% No 344 6.7% 4,095 12.0% 4,439 11.3% N/A 2 0.04% 17 0.1% 19 0.1% Total 5,119
34,200
39,319
Note: N/A refers to retired/unemployed/not working.

15
Louisiana RN Workforce by Race/Ethnicity, Gender, and Regional Labor Market Area (RLMA) 2014
Regional Labor Market Areas (RLMAs) are economically integrated areas in which individuals can live and find employment within a reasonable distance or can feasibly change jobs without changing their place of residence (LWC, 2011). Occupational projections for all occupations are reported by the Louisiana Workforce Commission (LWC) according to the eight RLMAs in Louisiana. A map depicting Louisiana’s sixty-four parishes included within the eight RLMAs can be found in the Appendix. The population size for the eight RLMAs according to race/ethnicity and the number of RNs working in the region according to race/ethnicity are depicted in Tables 30 through 37. The gender distribution for the regional population and the RN workforce employed in the eight RLMA is depicted in Tables 38 through 45. State population statistics were taken from the U.S. Census Bureau, Population Division (2015). The information gained from the following tables may be used to identify racial/ethnic and gender gaps between the RN workforce and the population served at the regional level. Table 30. New Orleans RLMA 1 – RN and Regional Population by Race/Ethnicity RLMA 1 Total White Black/
African American
Hispanic/ Latino
Asian American Indian/ Alaska Native
Native Hawaiian/
Pacific Islander
Two or More
Pop. 1,251,849 656,286 431,817 106,194 35,720 4,584 531 16,717 % 100% 52.4% 34.5% 8.5% 2.9% 0.4% 0.04% 1.3% RN 13,786 10,400 2,612 436 260 53 25 % 100% 75.4% 18.9% 3.2% 1.9% 0.4% 0.2% Table 31. Baton Rouge RLMA 2 – RN and Regional Population by Race/Ethnicity RLMA 2 Total White Black/
African American
Hispanic/ Latino
Asian American Indian/ Alaska Native
Native Hawaiian/
Pacific Islander
Two or More
Pop. 998,813 583,444 346,225 36,784 18,284 2,698 254 11,124 % 100% 58.4% 34.7% 3.7% 1.8% 0.3% 0.03% 1.1% RN 9,389 7,475 1,644 106 119 32 13 % 100% 79.6% 17.5% 1.1% 1.3% 0.3% 0.1% Table 32. Houma RLMA 3 – RN and Regional Population by Race/Ethnicity RLMA 3 Total White Black/
African American
Hispanic/ Latino
Asian American Indian/ Alaska Native
Native Hawaiian/
Pacific Islander
Two or More
Pop. 234,382 166,966 41,264 10,632 2,160 8,962 148 4,250 % 100% 71.2% 17.6% 4.5% 0.9% 3.8% 0.06% 1.8% RN 1,801 1,654 103 13 9 20 2 % 100% 91.8% 5.7% 0.7% 0.5% 1.1% 0.1%

16
Table 33. Lafayette RLMA 4 – RN and Regional Population by Race/Ethnicity RLMA 4 Total White Black/
African American
Hispanic/ Latino
Asian American Indian/ Alaska Native
Native Hawaiian/
Pacific Islander
Two or More
Pop. 655,545 429,294 181,151 23,895 9,642 2,958 154 8,451 % 100% 65.5% 27.6% 3.6% 1.5% 0.5% 0.02% 1.3% RN 5,570 4,708 735 58 51 13 5 % 100% 84.5% 13.2% 1.0% 0.9% 0.2% 0.09% Table 34. Lake Charles RLMA 5 – RN and Regional Population by Race/Ethnicity RLMA 5 Total White Black/
African American
Hispanic/ Latino
Asian American Indian/ Alaska Native
Native Hawaiian/
Pacific Islander
Two or More
Pop. 297,271 212,577 65,516 8,855 3,094 2,111 124 4,994 % 100% 71.5% 22.0% 3.0% 1.0% 0.7% 0.04% 1.7% RN 2,582 2,224 303 21 23 7 4 % 100% 86.1% 11.7% 0.8% 0.9% 0.3% 0.2% Table 35. Alexandria RLMA 6 – RN and Regional Population by Race/Ethnicity RLMA 6 Total White Black/
African American
Hispanic/ Latino
Asian American Indian/ Alaska Native
Native Hawaiian/
Pacific Islander
Two or More
Pop. 308,348 202,289 82,754 11,583 3,371 2,776 256 5,319 % 100% 65.6% 26.8% 3.8% 1.1% 0.9% 0.08% 1.7% RN 3,264 2,858 309 27 39 27 4 % 100% 87.6% 9.5% 0.8% 1.2% 0.8% 0.1% Table 36. Shreveport RLMA 7 – RN and Regional Population by Race/Ethnicity RLMA 7 Total White Black/
African American
Hispanic/ Latino
Asian American Indian/ Alaska Native
Native Hawaiian/
Pacific Islander
Two or More
Pop. 595,090 325,438 228,698 20,161 6,811 4,478 355 9,149 % 100% 54.7% 38.4% 3.4% 1.1% 0.8% 0.06% 1.5% RN 6,443 5,050 1,189 64 76 52 12 % 100% 78.4% 18.5% 1.0% 1.2% 0.8% 0.2% Table 37. Monroe RLMA 8 – RN and Regional Population by Race/Ethnicity RLMA 8 Total White Black/
African American
Hispanic/ Latino
Asian American Indian/ Alaska Native
Native Hawaiian/
Pacific Islander
Two or More
Pop. 308,378 182,294 113,316 6,763 1,979 806 87 3,133 % 100% 59.1% 36.7% 2.2% 0.6% 0.3% 0.03% 1.0% RN 2,866 2,419 399 11 31 4 2 % 100% 84.4% 13.9% 0.4% 1.1% 0.1% 0.07%

17
RN Workforce According to RLMA and Gender
Table 38. New Orleans RLMA 1 – RN Workforce and Population by Gender RLMA 1 Total Male Female Pop. 1,251,849 605,760 646,089 % 100% 48.4% 51.6% RN 13,798 1,409 12,389 % 100% 10.2% 89.8%
Table 39. Baton Rouge RLMA 2 – RN Workforce and Population by Gender
RLMA 2 Total Male Female Pop. 998,813 488,954 509,859 % 100% 49.0% 51.0% RN 9,397 958 8,439 % 100% 10.2% 89.8%
Table 40. Houma RLMA 3 - RN Workforce and Population by Gender
RLMA 3 Total Male Female Pop. 234,382 115,625 118,757 % 100% 49.3% 50.7% RN 1,801 260 1,541 % 100% 14.4% 85.6%
Table 41. Lafayette RLMA 4 – RN Workforce and Population by Gender RLMA 4 Total Male Female Pop. 655,545 320,703 334,842 % 100% 48.9% 51.1% RN 5,573 792 4,781 % 100% 14.2% 85.8%
Table 42. Lake Charles RLMA 5 – RN Workforce and Population by Gender
RLMA 5 Total Male Female Pop. 297,271 148,093 149,178 % 100% 49.8% 50.2% RN 2,584 356 2,228 % 100% 13.8% 86.2%
Table 43. Alexandria RLMA 6 – RN Workforce and Population by Gender
RLMA 6 Total Male Female Pop. 308,348 156,061 152,287 % 100% 50.6% 49.4% RN 3,266 420 2,846 % 100% 12.9% 87.1%
Table 44. Shreveport RLMA 7 - RN Workforce and Population by Gender
RLMA 7 Total Male Female Pop. 595,090 288,606 306,484 % 100% 48.5% 51.5% NP 6,444 786 5,658 % 100% 12.2% 87.8%

18
Table 45. Monroe RLMA 8 - RN Workforce and Population by Gender RLMA 8 Total Male Female Pop. 308,378 150,137 158,241 % 100% 48.6% 51.4% RN 2,868 323 2,545 % 100% 11.3% 88.7%
Conclusions and Recommendations Based on the most current data relative to Louisiana’s RN workforce, although the numbers and percentages of racial/ethnic minority and male nurses have generally increased over the years, minority and male representation in the nursing workforce still is not representative of Louisiana’s population, both at the state and regional level. Recommendations cited in the recently released report by the National Academies of Sciences, Engineering, and Medicine entitled Assessing Progress on the Institute of Medicine Report – The Future of Nursing (December, 2015), addressed the need for states to focus their population and demographic needs by determining baseline data regarding the state’s population and workforce. It is only with this type of available data that a choice of focus, direction, and strategies can be implemented to increase the diversity of the nursing workforce. The strategies that will be utilized to increase the diversity of the nursing workforce should be data based, data driven, and evidence-based with specific outcomes identified. Findings from the current report gives Louisiana the baseline data that is needed to begin this process. Stakeholder groups such as the Louisiana Action Coalition, the Louisiana State Board of Nursing, the Department of Health and Hospitals, the Louisiana State Nurses Association, the Nursing Supply and Demand Council, AARP LA, the Louisiana Hospital Association , the Louisiana Association of Nurse Practitioners, the Louisiana Association of Nurse Anesthetists, legislators, community leaders, minority nursing organizations, and faith-based organizations, to name a few, must now come together, in a committed fashion, to not only identify strategies to increase the diversity of the nursing workforce, but to also identify and provide resources that will be needed to implement and monitor the effectiveness of our efforts. To be successful, efforts to improve the diversity of the nursing workforce must focus on each step along the professional pathway, from recruitment to educational programs, to retention and success within educational programs, to graduation and job placement, to retention and advancement within one’s nursing career. Increasing the diversity of the overall nursing workforce is a slow process, yet the pipeline can change more rapidly and will respond more quickly to efforts to increase diversity; the pipeline represents the future workforce. Changing the makeup of the pipeline depends on increasing the diversity among those who apply to, are accepted to, enroll in, and graduate from nursing degree programs (National Academies of Sciences, Engineering, and Medicine Report - Assessing Progress on the Institute of Medicine Report – The Future of Nursing, December, 2015). For those minority and male RNs that are currently in the workforce, it will be important to provide opportunities for educational advancement (i.e., BSN, Masters, Doctorate), to prepare them for advanced practice roles, faculty roles, and leadership roles where they will be in a

19
position to impact not only the provision of healthcare, and nursing education, but also contribute to the formulation of health policy at the state and national level. The road to a diverse RN workforce that mirrors Louisiana’s population will not be a fast-paced road and will probably have some bumps along the way, but the road trip will bring many people together with a common goal, which is to improve the healthcare outcomes for all of Louisiana’s citizens.

20
References American Association of Colleges of Nursing (2015). Enhancing diversity in the nursing
workforce. Retrieved from http://www.aacn.nche.edu/media-relations/fact-sheets/enhancing-diversity.
America’s Health Rankings (2015). 2015 Annual Report. Retrieved from
http://www.americashealthrankings.org/reports/annual Budden, J. S., Zhong, E. H., Moulton, P. & Cimiotti, J. P. (2013). The national council of
state boards of nursing and the national forum of state nursing workforce centers 2013 national workforce survey of registered nurses. Journal of Nursing Regulation, 4(2), 5-14.
HRSA (Health Resources and Services Administration). 2006. The rationale for
diversity in the health professions: A review of the evidence. Retrieved from http://bhpr.hrsa.gov/healthworkforce/reports/diversityreviewevidence.pdf
Institute of Medicine Report on the Future of Nursing (2011). The future of nursing:
Leading change, advancing health. Washington, D.C.: The National Academies Press. Louisiana State Board of Nursing (2015). 2014 Louisiana State Board of Nursing Annual
Report. Retrieved from 2014 http://www.lsbn.state.la.us/About/AnnualReports.aspx. Munn, C. (2013). Quality investments in Louisiana’s health: Supporting the national
quality strategy. Healthcare Journal of New Orleans, retrieved from http://www.healthcarejournalno.com/the-journal/hjno-contents-index/quality-articles/1211-quality-investments-in-louisianas-health.
The National Academies of Sciences, Engineering and Medicine (2015). Assessing Progress on
the Institute of Medicine Report: The Future of Nursing, retrieved from http://www.nap.edu/catalog/21838/assessing-progress-on-the-institute-of-medicine-report-the-future-of-nursing.
U.S. Census Bureau, Population Division (2015). New census bureau report analyzes
U.S. population projections. Retrieved from https://www.census.gov/newsroom/press-releases/2015/cb15-tps16.html.
Williams, S. D., Hansen, K., Smithey, M., Burnley, J., Koplitz, M., Koyama, K., Young,
J. & Bakos, A. (2014). Using social determinants of health to link health workforce diversity, care quality and access, and health disparities to achieve health equity in nursing. Public Health Reports 2 (129), 32-36.

21
Appendix
Regional Labor Market Areas in Louisiana
Louisiana's Eight Regional Labor Market Areas Region 1 Jefferson, Orleans, Plaquemines, St. Bernard, St. Charles, St. James, St. John the
Baptist and St. Tammany Parishes
Region 2 Ascension, East Baton Rouge, East Feliciana, Iberville, Livingston, Pointe Coupee, St. Helena, Tangipahoa, Washington, West Baton Rouge and West Feliciana Parishes
Region 3 Assumption, Lafourche and Terrebonne Parishes
Region 4 Acadia, Evangeline, Iberia, Lafayette, St. Landry, St. Martin, St. Mary and Vermilion Parishes
Region 5 Allen, Beauregard, Calcasieu, Cameron and Jefferson Davis Parishes
Region 6 Avoyelles, Catahoula, Concordia, Grant, LaSalle, Rapides, Vernon and Winn Parishes
Region 7 Bienville, Bossier, Caddo, Claiborne, DeSoto, Lincoln, Natchitoches, Red River, Sabine and Webster Parishes
Region 8: Caldwell, East Carroll, Franklin, Jackson, Madison, Morehouse, Quachita, Richland, Tensas, Union and West Carroll Parishes