the district of columbia office on aging senior needs ... · the district of columbia office on...
TRANSCRIPT
The District of Columbia Office on Aging
SENIOR NEEDS ASSESSMENTINITIAL DATA COLLECTION
September 5, 2012
FINAL REPORT
Government of the District of ColumbiaVincent C. Gray, Mayor
Senior Needs Assessment i
Acknowledgements
District of Columbia Office on Aging
Barney Neighborhood Senior Programs
Bernice Fontaneau Senior Wellness Center
Capitol Commons
Carver 2000 – Ward 7
Columbia Lighthouse for the Blind
Congress Heights – Ward 8
Downtown Cluster’s Day Care Center Asbury Methodist Church
Emmaus Services for the Aging
Family Matters of Greater Washington
Fort Lincoln I – Ward 5
Garfield House – Ward 1
Genevieve N. Johnson Day Care Program
Home Care Partners
IONA
East of the River Family Strengthening Collaborative - KEEN Senior Services
MV Transportation
Northeast Neighborhood Village
Office of Veterans Affairs
Serenity Players, Inc.
Silent Partners, Inc.
So Others Might Eat

Senior Needs Assessment ii
St. Alban’s Court – Ward 3
St. Mary’s Church
St. Mary’s Court – Ward 2
The Mayor’s Office on Asian and Pacific Islander Affairs
Vida Senior Services
Washington Center for Aging
Washington Seniors Wellness Center
GOVERNMENT OF THE DISTRICT OF COLUMBIA OFFICE ON AGING
Office of the Executive Director
500 K Street, N.E., Washington, D.C. 20002 (202) 724-5622
September 5, 2012
Dear Community Leader:
I would like to personally thank Mayor Vincent C. Gray for commissioning this Senior Needs Assessment: Initial Data Collection, which aligns with his One City vision for the District of Columbia. Through the Mayor’s vision, the District of Columbia Office on Aging (DCOA) and its community-based partners play a key role in making our City a better place for the constituents who live here. Thus, completing this study is the initial phase of understanding the needs of our seniors, persons with disabilities, and caregivers. The findings from this data collection effort will shape the agency’s policies with regards to deploying resources, overhauling obsolete programs, and establishing new programs that will improve the lives of the District’s residents.
The Senior Needs Assessment was designed to better understand the needs of older adults, the current service delivery model, and the gaps that may exist between the existing and needed services. The report includes primary research with residents and with community stakeholders who provide services to older adults. It also provides data that address the changing demographics, the current make-up of our aging community, and a glimpse of aging trends. This information will prove to be instrumental as DCOA and members of the Senior Service Network prepare to meet the needs of the more than 100,000 seniors in the District and the growing population of baby boomers.
DCOA was elated to take on this study as the last senior needs assessment was conducted in 1978. The vendor, Bazilio Cobb & Associates, utilized national and local research, focus groups, surveys, and interviews to obtain information essential to properly assess the needed information. We believe that the methods utilized provide firm footing for a comprehensive look at where the agency needs to go in the future.
It is important to note that DCOA views the Senior Needs Assessment as a beginning, not an end. The agency will use this as a living document to help chart the course for shaping the long-term services and supports system in the District of Columbia. DCOA will continue to welcome feedback from other government agencies, aging stakeholders, policy-makers, and the community at large.
I would like to thank you for taking the time to review this very important study. With your participation and insight, the Office on Aging will continue its tradition of being at the forefront of addressing senior related issues in the District of Columbia.
Sincerely,
John M. Thompson, Ph.D., FAAMA Executive Director
Senior Needs Assessment iv
About The District of Columbia Office on Aging
Mission
The mission of the District of Columbia Office on Aging (DCOA) is to advocate, plan,
implement, and monitor programs in health, education, employment, and social services which
promote longevity, independence, dignity, and choice for our senior citizens.
Who Is DCOA?
DCOA develops and carries out a comprehensive and coordinated system of health,
education, employment, and social services for the District of Columbia's residents 60 years of
age and older.
DCOA was created by DC Law 1-24 in 1975 as the District of Columbia's State and Area
Agency on Aging. It is structured to carry out advocacy, leadership, management, program, and
fiscal responsibilities. On the program level, DCOA oversees the operation of two on-site
programs, the Information and Assistance Center, and the Senior Employment and Training
program. In addition, DCOA also provides nursing home care and services to District of
Columbia disabled residents 18 years of age and older. Currently, DCOA and the District of
Columbia own two nursing facilities that are privately operated and managed. The Washington
Center for Aging Services (WCAS) is leased to Stoddard Baptist Home Foundation and JB
Johnson Nursing Facility is leased to Vital Management Team (VMT). It also funds the Senior
Service Network comprising 20 community-based nonprofit organizations that provide direct
services to the District of Columbia's elderly residents.
The 20 community-based education, government, and private organizations that make up
the Senior Service Network operate more than 30 programs for older persons. Crucial to the
Network are seven lead agencies that offer a broad range of legal, nutrition, social, and health
Senior Needs Assessment v
services. The goal of these agencies is to enhance the quality of life for older adults and their
families throughout all eight Wards of the District of Columbia. The agencies accomplish this
goal through widespread distribution of information about the variety of services and programs
offered for seniors throughout the city and ways to access them.
In 2008, DCOA began operating—with support from the Department of Health Care
Finance—the Aging and Disability Resource Center (ADRC), a one-stop resource for long-term
care information, benefits, and assistance for residents age 60 and older and persons with
disabilities age 18 and older.
Through the provision of advocacy, leadership and community programs, DCOA is
committed to serving seniors and persons living with disabilities within the District of Columbia.

Senior Needs Assessment vi
Table of Contents Acknowledgements ........................................................................................................................ i
Letter from the Director .............................................................................................................. iii
About The District of Columbia Office on Aging ..................................................................... iv
Mission ........................................................................................................................... iv
Who Is DCOA? .............................................................................................................. iv
Overview ....................................................................................................................................... 1
Problems (Table 9, pg. 89) ........................................................................................................... 3
Executive Summary ...................................................................................................................... 4
Study Background and Methodology.......................................................................................... 5
Study Background and Methodology .............................................................................. 5
Study background. ....................................................................................................... 5
Study purpose. ............................................................................................................. 6
Study methodology....................................................................................................... 6
Review of the Major Study Components ...................................................................... 10
Key informant sessions. ............................................................................................. 10
Focus groups. ............................................................................................................ 10
Surveys of seniors, persons living with a disability, and senior caregivers. ............. 11
Survey of community resources. ................................................................................ 13
Study Limitations .......................................................................................................... 15
Profile of Targeted Populations ................................................................................................. 18
Seniors (Age 60 and older) ............................................................................................ 18
Current demographics of the senior population. ...................................................... 18
Senior Needs Assessment vii
Projections of the senior population. ........................................................................ 25
Persons Living With a Disability (Ages 18-59) ............................................................ 27
Introduction. .............................................................................................................. 27
Current demographics of persons living with a disability. ....................................... 27
Senior Caregivers .......................................................................................................... 35
Current demographics of senior caregivers. ............................................................. 35
Projections of senior caregivers. ............................................................................... 41
Special Populations ....................................................................................................... 43
Lesbian, Gay, Bisexual and Transgender.................................................................. 43
Hispanic or Latino. .................................................................................................... 44
Asian and Pacific Islander. ....................................................................................... 45
Peer Comparison ......................................................................................................................... 47
The District’s Unique Status ......................................................................................... 47
The Methodology .......................................................................................................... 48
Best Practices ............................................................................................................................... 51
Background ................................................................................................................... 51
Best Practices ................................................................................................................ 54
One-stop information centers. ................................................................................... 54
Volunteer networks. ................................................................................................... 54
Underserved and special populations. ...................................................................... 55
Zoning and tax relief for “aging in place.” .............................................................. 56
Training programs..................................................................................................... 57
Publicity and outreach efforts. .................................................................................. 57
Senior Needs Assessment viii
Intergenerational programs. ..................................................................................... 58
Health. ....................................................................................................................... 59
Transportation. .......................................................................................................... 59
Needs Assessment Findings ........................................................................................................ 60
Overview ....................................................................................................................... 60
The Challenges of Everyday Life for Older Adults ...................................................... 62
Wellness and quality of life........................................................................................ 62
Safety. ........................................................................................................................ 76
Socialization and recreation...................................................................................... 78
Case management and options counseling................................................................ 84
Health and mental health. ......................................................................................... 85
Home health/in-home support. .................................................................................. 88
Nutrition. ................................................................................................................... 94
Home delivered and congregate meals. .................................................................... 97
Transportation. ........................................................................................................ 100
Employment. ............................................................................................................ 105
Caregiving and respite care. ................................................................................... 107
Medicaid/Medicare.................................................................................................. 112
Assisted living and housing placement. ................................................................... 114
Legal services. ......................................................................................................... 116
Community Resource Inventory ............................................................................................. 119
Background ................................................................................................................. 119
Methodology ............................................................................................................... 120
Senior Needs Assessment ix
Findings ....................................................................................................................... 121
Background.............................................................................................................. 121
Provider capacity to serve. ...................................................................................... 123
Office on Aging relationships. ................................................................................. 124
Special populations. ................................................................................................ 125
Health care, mental health and substance abuse section. ....................................... 128
Transportation services. .......................................................................................... 129
Abuse, Neglect, and Financial Exploitation. ........................................................... 130
Recreation services. ................................................................................................. 131
Community services and support............................................................................. 131
Conclusions ................................................................................................................. 133
Older Adults on the Way: The Baby Boom Generation ....................................................... 138
Baby Boomers Nationally ........................................................................................... 138
District of Columbia Issues ......................................................................................... 141
Conclusions ................................................................................................................................ 143
Recommendations ..................................................................................................................... 144
Outreach & Advocacy ................................................................................................. 144
Collaborations & Partnerships .................................................................................... 146
Connecting to the Community .................................................................................... 150
Support Resources ....................................................................................................... 152
Summary ..................................................................................................................... 153
References .................................................................................................................................. 154
Appendix A: Survey Instruments ............................................................................................ 159
Senior Needs Assessment x
Community Resource Inventory ................................................................................. 159
Long Survey ................................................................................................................ 170
Short Survey ................................................................................................................ 181
Demographic Profile ................................................................................................... 186
Appendix B: Focus Group Discussion Guide ......................................................................... 189
Appendix C: Focus Group Summaries ................................................................................... 192
Wards 1 and 4: Focus Group Summary ...................................................................... 192
Wards 2 and 3: Focus Group Summary ...................................................................... 201
Wards 5 and 6: Focus Group Summary ...................................................................... 210
Wards 7 and 8: Focus Group Summary ...................................................................... 216
Persons Living With a Disability: Focus Group Summary ......................................... 224
Lesbian, Gay, Bisexual and Transgender: Focus Group Summary ............................ 233
Hispanic or Latino: Focus Group Summary ............................................................... 241
Asian and Pacific Islander: Focus Group Summary ................................................... 248
Appendix D: Key Informant Discussion Guide ..................................................................... 253
Appendix E: Key Informant Summaries ................................................................................ 255
Key Informant Session I Summary ............................................................................. 255
Key Informant Session II Summary ............................................................................ 261
Appendix F: Outreach MaterialsFocus Group Flyer ............................................................ 269
Focus Group Flyer .................................................................................................................... 270
Appendix G: Community Presentation Feedback ................................................................. 272
Recommendations and Comments .............................................................................. 272
Survey Feedback ......................................................................................................... 273

Senior Needs Assessment xi
Table of Tables Table 1: .......................................................................................................................................... 1
Table 2: Distribution of Seniors by Ward ....................................................................................... 8
Table 3: Distribution of Survey Population by Ward ..................................................................... 9
Table 4: Prevalence of Disabilities by Race across the US vs. the District of Columbia. ............ 31
Table 5: Education Levels of People with Disabilities Nationally vs. the District of Columbia . 33
Table 6: Age of Predominant Care Recipient by Age of Caregiver ............................................. 37
Table 7: Prevalence of Caregivers by Race/Ethnicity .................................................................. 39
Table 8: Peer Cities Comparison Matrix ...................................................................................... 49
Table 9: Peer Designated Service Provider Comparison Matrix .................................................. 50
Table 10: Health Status ................................................................................................................. 64
Table 11: Preventive Care ............................................................................................................. 64
Table 12: Problems Faced by Respondents .................................................................................. 65
Table 13: Percentage of Major and Minor Problems Seniors Face in the District ....................... 67
Table 14: Reported Illness ............................................................................................................ 70
Table 15: Reported Physical Activity ........................................................................................... 71
Table 16: Reported Physical or Mental Disorders ........................................................................ 74
Table 17: “No Hours” Reported Participating in Recreation and Social Activities ..................... 81
Table 18: Nutritional Status .......................................................................................................... 95
Table 19: Receipt of Home Delivered Meals ............................................................................... 99
Table 20: Mode of Transportation .............................................................................................. 103
Table 21: Employment Status: Unemployed, looking for work ................................................. 106
Table 22: Caregiving Status ........................................................................................................ 109

Senior Needs Assessment xii
Table 23: Financial or Physical Burden of Caregiving ............................................................... 110
Table 24: Medicare Facts- .......................................................................................................... 113
Senior Needs Assessment xiii
Table of Figures Figure 1: National vs. District of Columbia Comparison of Senior Men and Women ................ 20
Figure 2: District vs. National, Distribution of the Minority Senior Population .......................... 21
Figure 3: Citizenship of Seniors in the District of Columbia ....................................................... 21
Figure 4: Seniors Living in Family Households, National vs. District of Columbia ................... 22
Figure 5: Education Level of Seniors in the District of Columbia ............................................... 24
Figure 6: Percentages of Types of Health Insurance Coverage .................................................... 34
Figure 7: Hours Dedicated to Caregiving by Age of Caregiver ................................................... 36
Figure 8: Percentage of Caregivers by Gender ............................................................................. 38
Figure 9: Percentage of Caregivers by Race/Ethnicity ................................................................. 39
Figure 10: Percentage of Level of Income of Caregivers ............................................................. 40
Figure 11: Education Level of Caregivers .................................................................................... 40
Figure 12: Percentage of Caregivers by Employment Status ....................................................... 41
Figure 13: Physical Activity ......................................................................................................... 73
Figure 14: Community Safety ....................................................................................................... 77
Figure 15: Reported Crime ........................................................................................................... 77
Figure 16: Rates of Victimization for Older LGBT Adults .......................................................... 78
Figure 17: Hours Spent on Socialization and Recreation Activities ............................................. 80
Figure 18: Assistance with DCOA Programs ............................................................................... 85
Figure 19: Illness in the Past Year ................................................................................................ 88
Figure 20: Government Supported Prescription Assistance and Health Care Programs .............. 88
Figure 21: Government Supported In-Home Support Services .................................................... 90
Figure 22: Government Supported In-Home Support Services among Wards ............................. 91
Senior Needs Assessment xiv
Figure 23: Government Supported In-Home Support Services among Race/Ethnicity ............... 91
Figure 24: Government Supported Nursing Home Services ........................................................ 92
Figure 25: Government Supported Nursing Home Services among Wards ................................. 93
Figure 26: Government Supported In-Home Support Services among Race/Ethnicity ............... 93
Figure 27: Reason for Transportation Difficulties ...................................................................... 105
Figure 28: Caregiving Status ...................................................................................................... 108
Figure 29: Physical or Financial Burden Among Caregivers ..................................................... 110
Figure 30: Type of Caregiving Services ..................................................................................... 111
Figure 31: Distribution by Insurance Status ............................................................................... 114
Figure 32: Type of Health Insurance .......................................................................................... 114
Figure 33: Rent vs. Own a Home................................................................................................ 115
Figure 34: Legal Concerns .......................................................................................................... 117
Figure 35: Legal Concerns by Level of Income ......................................................................... 117
Figure 36: Type of Organization................................................................................................. 121
Figure 37: Location of Organization by Ward ............................................................................ 122
Figure 38: Community Service Providers Provision of Services by Ward ................................ 122
Figure 39: DCOA Services Offered by Community Service Providers ..................................... 123
Figure 40: Community Service Provider Ability to Meet Client Needs ..................................... 124
Figure 41: Utilization of the Aging and Disability Resource Center.......................................... 125
Figure 42: Community Service Provider Services by Special Population ................................. 126
Figure 43: Special Populations to be Served by DCOA ............................................................. 127
Figure 44: Support Services Provided by Community Service Providers .................................. 128
Senior Needs Assessment xv
Figure 45: Community Service Providers Offering Transportation Services for Persons Living
with Disabilities ................................................................................................................... 129
Figure 46: Other Transportation Services Advertised ................................................................ 130
Figure 47: DCOA Provider Services .......................................................................................... 135
Figure 48: District of Columbia Out-of-Network Provider Services.......................................... 136
Senior Needs Assessment xvi
Different style guides are used for reporting purposes. However, this report was written in
American Psychological Association (APA) style. APA style is the standard writing format for
business and social and behavior science. The style is used for ease of reading and
comprehension. APA Style requires that credit be given to authors for any information borrowed
from them in the text of the report. In other words, in text citation is required to document
information borrowed. APA requires that each in text citation be included on the reference list,
at the end of the report. The following sentence is an example of how the reader might see a
citation in this report; however there are variations.
In-Text Citation
Women live longer than men and therefore they make up the majority of the senior
population (Jacobsen, Kent, Lee, Mather, 2011, p. 3).
Entry in the List of References
Jacobsen, L., Kent, M., Lee, M., & Mather, M. (2011). America's aging population.
[Population Bulletin], 66(1), 1-16. doi: 2301729261
Senior Needs Assessment 1
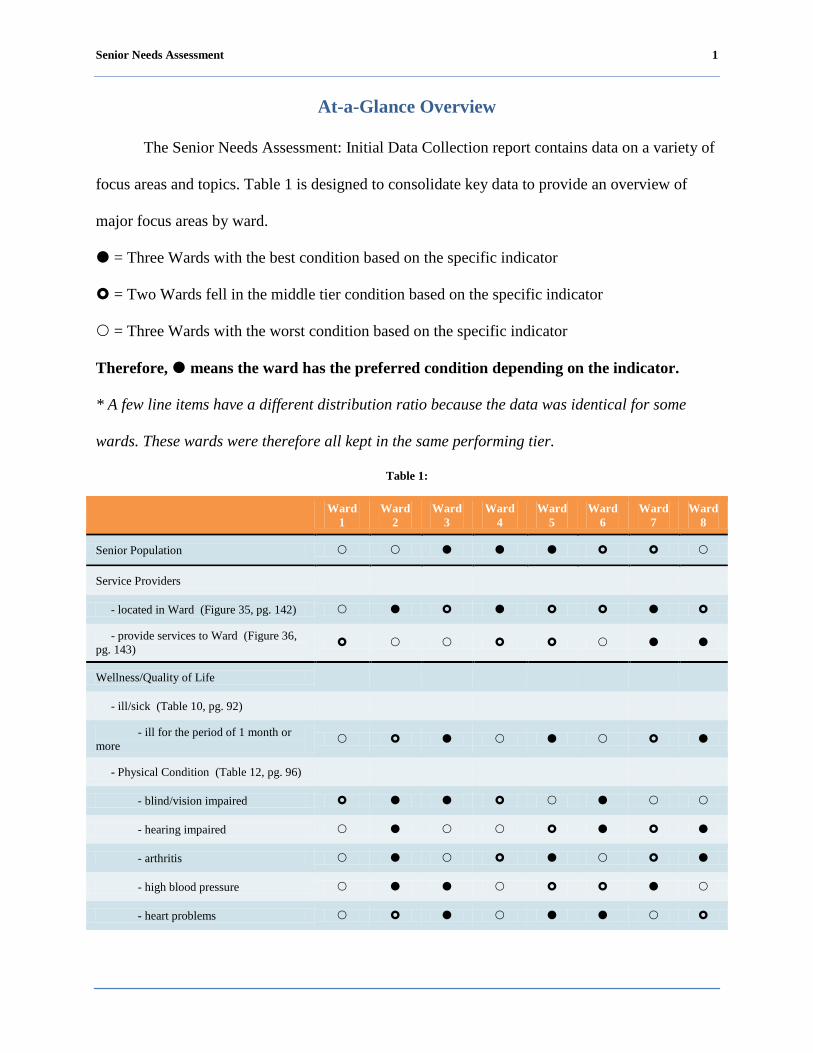
At-a-Glance Overview
The Senior Needs Assessment: Initial Data Collection report contains data on a variety of
focus areas and topics. Table 1 is designed to consolidate key data to provide an overview of
major focus areas by ward.
= Three Wards with the best condition based on the specific indicator
= Two Wards fell in the middle tier condition based on the specific indicator
= Three Wards with the worst condition based on the specific indicator
Therefore, means the ward has the preferred condition depending on the indicator.
* A few line items have a different distribution ratio because the data was identical for some
wards. These wards were therefore all kept in the same performing tier.
Table 1:
Ward
1 Ward 2 Ward
3 Ward 4 Ward
5 Ward 6 Ward
7 Ward 8
Senior Population Service Providers
- located in Ward (Figure 35, pg. 142) - provide services to Ward (Figure 36, pg. 143) Wellness/Quality of Life
- ill/sick (Table 10, pg. 92)
- ill for the period of 1 month or more - Physical Condition (Table 12, pg. 96)
- blind/vision impaired - hearing impaired - arthritis - high blood pressure - heart problems

Senior Needs Assessment 2
Ward
1 Ward 2 Ward
3 Ward 4 Ward
5 Ward 6 Ward
7 Ward 8
- diabetes - stroke - Physical Activity (Table 11, pg. 94)
- Moderate activity (1 to 6+ days a week)
Social/Recreational (Table 13, pg. 103)
- total all categories
Nutrition Status - (Table 14, pg. 118)
Receive home delivered meals (Table 15, pg. 121)
Transportation - utilization (Table 16, pg. 125)
- car
- Metro Access
- Metro bus
- senior van/shuttle
- taxi
- walk
Unemployed Looking for Work
Care giving feeling of financial or physical burden
Own your home
Senior Needs Assessment 3
Ward
1 Ward 2 Ward
3 Ward 4 Ward
5 Ward 6 Ward
7 Ward 8
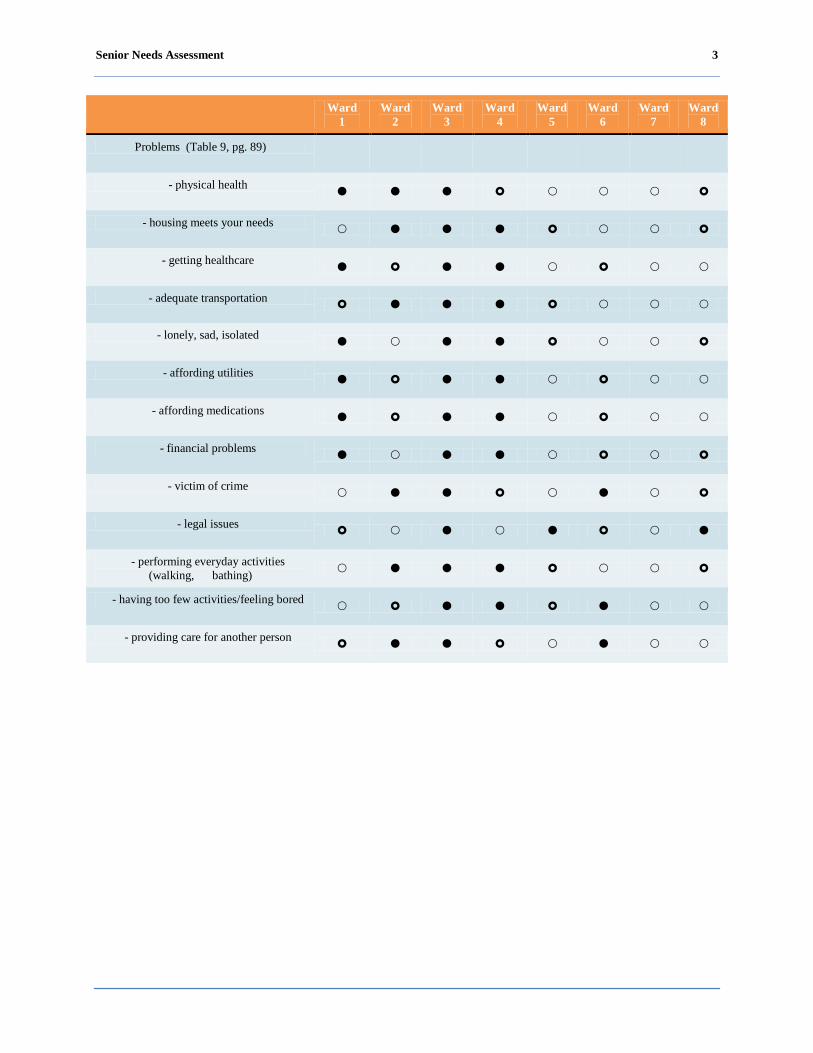
Problems (Table 9, pg. 89)
- physical health
- housing meets your needs
- getting healthcare
- adequate transportation
- lonely, sad, isolated
- affording utilities
- affording medications
- financial problems
- victim of crime
- legal issues
- performing everyday activities (walking, bathing)
- having too few activities/feeling bored
- providing care for another person

Senior Needs Assessment 4
Executive Summary
Mayor Vincent C. Gray commissioned a needs assessment to determine the needs of
seniors, persons living with disabilities, and caregivers residing in the eight wards of the District
of Columbia. The objectives of this assessment were to:
Identify community needs, assets, and gaps in services;
Identify met and unmet service needs of those seniors currently engaged and not engaged in
DCOA services and programs;
Provide descriptive analysis of clinical, behavioral, cultural, and social needs; and
Provide citywide and ward-based recommendations setting priorities for program planning
and decision making activities.
The study’s participants provided data via key informant sessions, focus groups,
telephone interviews, and surveys. Data were collected on the following 14 areas: wellness and
quality of life, safety, socialization and recreation, case management and options counseling,
health and mental health, home health/in-home support, nutrition, home delivered and
congregate meals, transportation, employment, care giving and respite care, Medicaid/Medicare,
assisted living and housing placement, and legal services. There are 16 recommendations that
have been identified as a result of this study’s findings. These recommendations are intended to
improve the unmet needs of the targeted populations through increasing interagency
collaborations, bolstering existing programs and services, and enhancing outreach and public
awareness efforts.

Senior Needs Assessment 5
Study Background and Methodology
Study Background and Methodology
Study background.
The District of Columbia Office on Aging is the State Unit on Aging (SUA) and Area
Agency on Aging (AAA) for the District of Columbia. DCOA receives funds from the Older
Americans Act (OAA) and this funding helps support many of DCOA’s home and community-
based programs and services.
DCOA is responsible for carrying out a comprehensive and coordinated system of health,
education, employment, and social services for the District of Columbia's senior population, who
are 60 years of age and older. DCOA’s overarching goal is to promote longevity, independence,
dignity, and choice for seniors. DCOA helps seniors remain in the community for as long as
possible through programs and services that include: Alzheimer’s services; adult day care;
emergency shelter; group homes; in-home support; long-term option counseling; nutrition
counseling; wellness centers; mental health referrals; assisted living; home delivered meals; legal
services; recreation/socialization; employment; and respite care services.
DCOA’s last comprehensive needs assessment was completed in 1978. Many of DCOA’s
present programs and services were developed as a result of that assessment. The senior
population has changed since 1978 and today’s seniors have a different level of engagement than
seniors of the past. To meet the demands of the newly aging population, DCOA believes it is
necessary to develop long-range plans that address the social and health needs of the newly aging
population while continuing to creatively deal with the needs of the current senior community.
Senior Needs Assessment 6
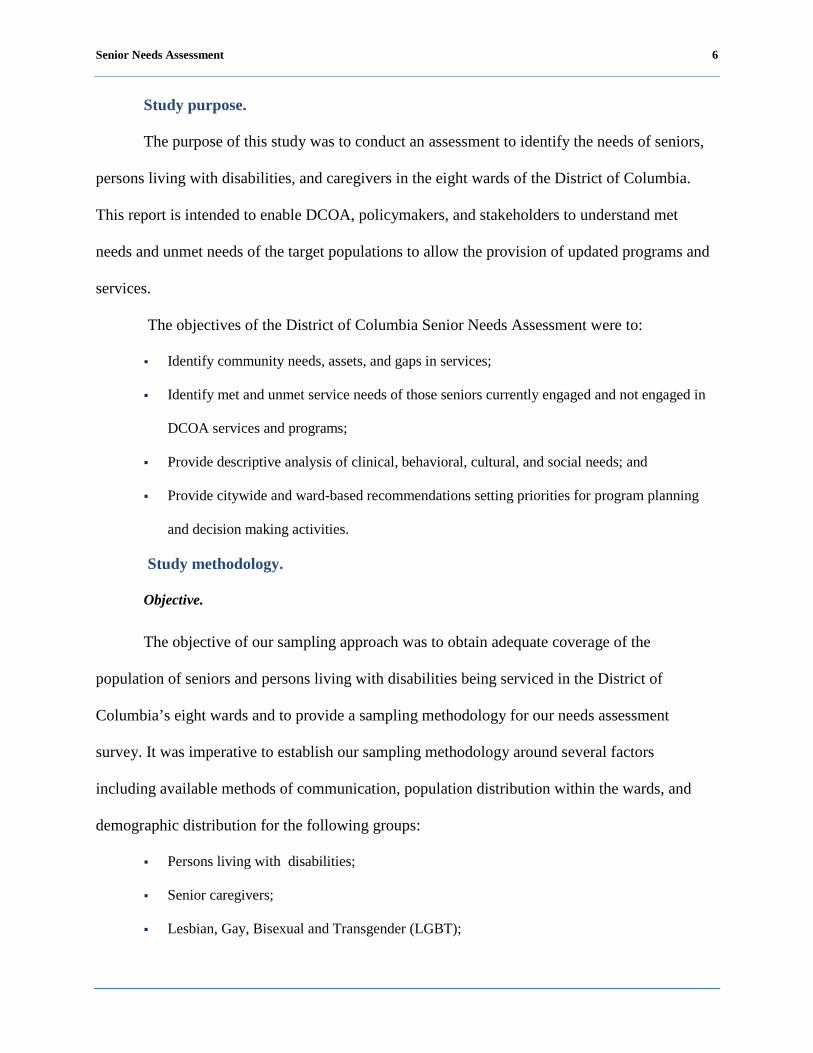
Study purpose.
The purpose of this study was to conduct an assessment to identify the needs of seniors,
persons living with disabilities, and caregivers in the eight wards of the District of Columbia.
This report is intended to enable DCOA, policymakers, and stakeholders to understand met
needs and unmet needs of the target populations to allow the provision of updated programs and
services.
The objectives of the District of Columbia Senior Needs Assessment were to:
Identify community needs, assets, and gaps in services;
Identify met and unmet service needs of those seniors currently engaged and not engaged in
DCOA services and programs;
Provide descriptive analysis of clinical, behavioral, cultural, and social needs; and
Provide citywide and ward-based recommendations setting priorities for program planning
and decision making activities.
Study methodology.
Objective.
The objective of our sampling approach was to obtain adequate coverage of the
population of seniors and persons living with disabilities being serviced in the District of
Columbia’s eight wards and to provide a sampling methodology for our needs assessment
survey. It was imperative to establish our sampling methodology around several factors
including available methods of communication, population distribution within the wards, and
demographic distribution for the following groups:
Persons living with disabilities;
Senior caregivers;
Lesbian, Gay, Bisexual and Transgender (LGBT);
Senior Needs Assessment 7
Hispanics or Latinos; and
Asian and Pacific Islanders.
Basis.
The determination of the sampling methodology was based on three factors: (1)
obligation to sample 1% of the population of seniors to decrease sample variance, (2) survey a
needs assessment of best practices and, (3) blended judgmental and statistical sampling.
Calculations for statistical sampling is based on the population size, confidence level, tolerable
deviation, expected deviation, and the distribution of seniors among the wards and corresponding
zip codes. A blended approach of judgmental and statistical sampling was used to ensure active
coverage of all wards and related demographics. The steps in the methodology were as follows:
1. Determination of method of communication;
2. Stratification of population by wards, zip codes and demographic data; and
3. Determination of sample sizes based on steps 1 and 2.
Step 1 – Determination of method of communication.
The first step was to make a determination of our sampling approach based on the
reliability of the method of communication with the population of seniors. Our methods of
communication were as follows:
Mail – 5,000 samples;
Telephone calls – 2,950 samples;
Focus groups – 109 samples;
Site visits – 411 samples ; and
Key informants – 26 samples.
Senior Needs Assessment 8
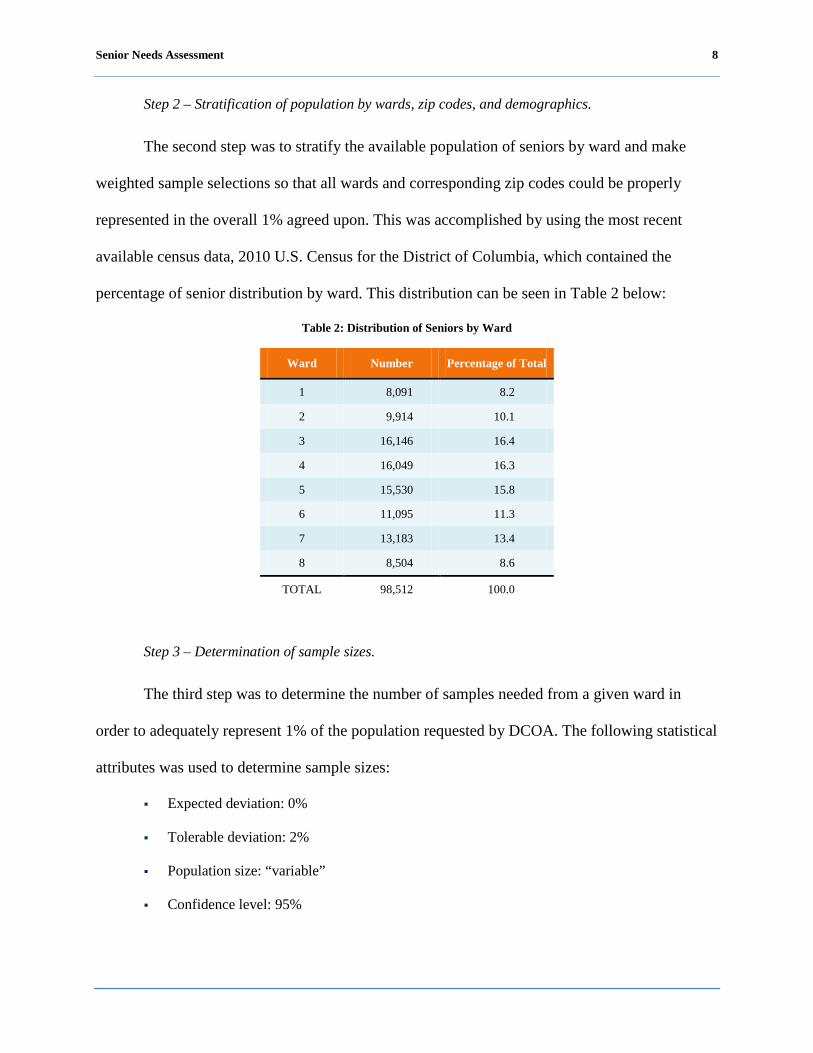
Step 2 – Stratification of population by wards, zip codes, and demographics.
The second step was to stratify the available population of seniors by ward and make
weighted sample selections so that all wards and corresponding zip codes could be properly
represented in the overall 1% agreed upon. This was accomplished by using the most recent
available census data, 2010 U.S. Census for the District of Columbia, which contained the
percentage of senior distribution by ward. This distribution can be seen in Table 2 below:
Table 2: Distribution of Seniors by Ward
Ward Number Percentage of Total
1 8,091 8.2
2 9,914 10.1
3 16,146 16.4
4 16,049 16.3
5 15,530 15.8
6 11,095 11.3
7 13,183 13.4
8 8,504 8.6
TOTAL 98,512 100.0
Step 3 – Determination of sample sizes.
The third step was to determine the number of samples needed from a given ward in
order to adequately represent 1% of the population requested by DCOA. The following statistical
attributes was used to determine sample sizes:
Expected deviation: 0%
Tolerable deviation: 2%
Population size: “variable”
Confidence level: 95%
Senior Needs Assessment 9
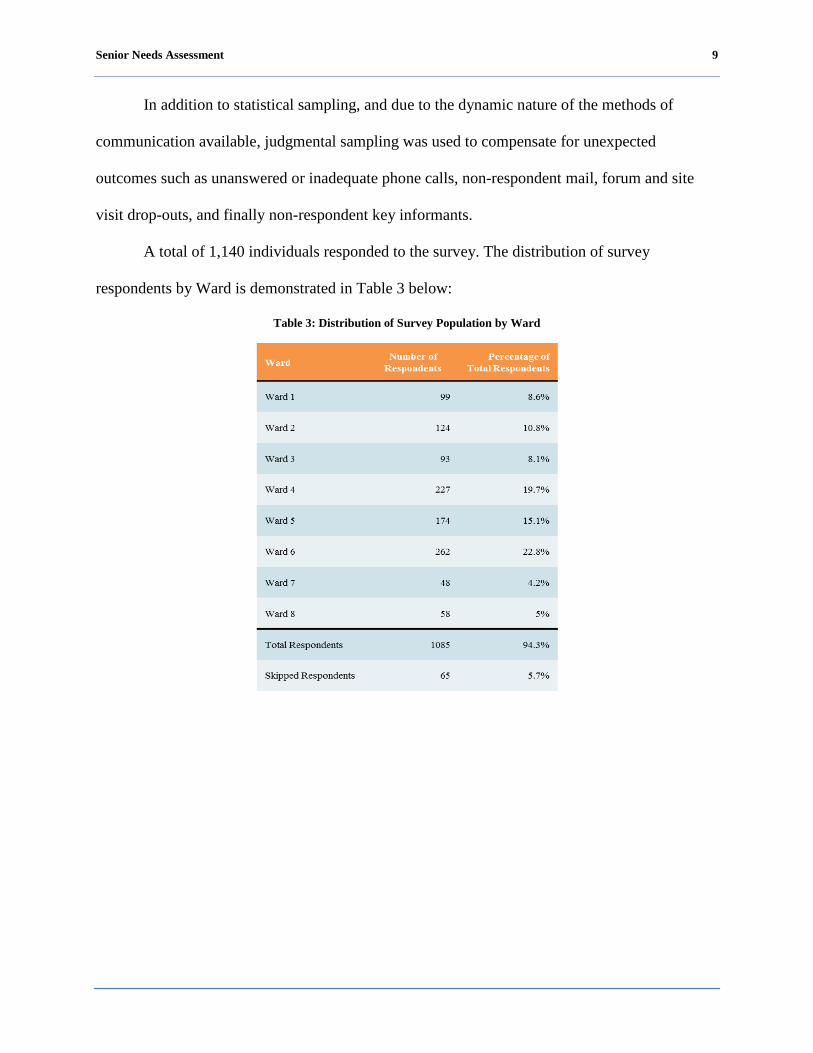
In addition to statistical sampling, and due to the dynamic nature of the methods of
communication available, judgmental sampling was used to compensate for unexpected
outcomes such as unanswered or inadequate phone calls, non-respondent mail, forum and site
visit drop-outs, and finally non-respondent key informants.
A total of 1,140 individuals responded to the survey. The distribution of survey
respondents by Ward is demonstrated in Table 3 below:
Table 3: Distribution of Survey Population by Ward
Senior Needs Assessment 10
Review of the Major Study Components
Several tools were used to create a complete picture of the needs of seniors (60 years and
older), persons living with disabilities (ages 18-59), and seniors that are caregivers. The needs
assessment consisted of key informant sessions, focus groups, telephone interviews, and written
surveys. Target populations were sampled from each of the eight wards in the District of
Columbia. Demographic characteristics and population projections were compiled using the
2010 U.S. Census.
Key informant sessions.
Two key informant sessions were facilitated. The purpose of the key informant sessions
was to explore the needs of seniors, persons living with a disability, caregivers, special
populations among providers of services, and key stakeholders that serve the target populations.
The average size of the key informant sessions was 13 participants, as well as the facilitator and
a scribe. A summary of each key informant session is included in Appendix E: Key Informant
Summaries.
Focus groups.
Eight facilitated focus groups were held. The purpose of these groups was to gather in-
depth information about the needs of special populations identified by DCOA. A facilitator and a
scribe were provided to conduct and accurately capture the views and opinions of participants.
Focus groups were held for the following groups:
Wards 1 and 4;
Wards 2 and 3;
Wards 5 and 6;
Wards 7 and 8;
LGBT;
Senior Needs Assessment 11
Persons living with a disability;
Hispanic or Latino; and
Asian and Pacific Islander.
Due to the aggressive timeline, ward-based focus groups were consolidated based on
proximity. The average size of the focus group was 19 individuals. All sessions were tape-
recorded.
Areas of discussion included:
In-home service needs;
Transportation;
Caregiving;
Adult day care services;
Elder abuse, neglect, and financial exploitation;
Employment;
Case management;
Wellness;
Nutrition; and
Health care.
Summaries of each focus group are included in Appendix C: Focus Group Summaries.
Surveys of seniors, persons living with a disability, and senior caregivers.
Long survey.
Instrument development.
The long survey, developed in partnership with DCOA, contained 49 questions. The 2004
Strengths and Needs Assessment of Older Adults in the Denver Metro Area (Hayden et al., 2004)
was used as a reference for the survey instrument.
Senior Needs Assessment 12
Topics included:
Demographic information;
Knowledge of programs and services;
Quality of life;
Socialization/Recreation;
Nutrition counseling/home delivered meals;
Wellness;
Transportation;
Security; and
Caregiving support.
Data collection.
The long survey was conducted via site visits to various living facilities and wellness
centers throughout the city’s eight Wards. Fifteen site visits were conducted over a period of two
weeks. A total of 411 long surveys were obtained.
Short survey.
Instrument development.
Due to concern about the length of the long survey, the short survey was developed for
use in telephone interviews and mail surveys. It was developed in partnership with DCOA and
contained 22 questions. All questions on the short survey were incorporated from the long
survey.
Topics included:
Demographic information;
Knowledge of programs and services;
Security;

Senior Needs Assessment 13
Transportation;
Quality of life; and
Wellness.
Data collection.
The short survey was utilized for the telephone interviews and mail survey campaign.
Telephone interviews were conducted over a period of 10 days.
A list of contact information for District of Columbia residents age 60 and older was
purchased from a direct mail fulfillment service. A quota system was used to ensure the sample
consistently reflected the proportion of seniors living in all eight wards of the District of
Columbia. Mail surveys were mailed via the direct mail fulfillment service on September 20,
2011. Included with the mail survey was a business reply envelope requiring no postage. At the
time of the report, 334 short surveys out of 5,000 were received via mail, a 6.68% rate of
response. A total of 729 short surveys were obtained via telephone and mail study methods.
Survey of community resources.
Community resource inventory survey.
Instrument development.
The Community Resource Inventory survey was developed with the collaboration of
DCOA. This survey was designed to identify community resources and to assess the capacity of
providers that serve seniors, persons living with disabilities, and senior caregivers.
Data collection.
The Community Resource Inventory was sent electronically to 178 public and private
providers of senior services throughout the District using the web-based survey tool Survey
Senior Needs Assessment 14
Monkey. Service providers and community resources were identified by DCOA as well as by
community members from key informant sessions and focus groups.
The resource inventory survey was available to providers for two weeks. Twenty
resource inventory surveys were obtained using the web-based survey tool.
Senior Needs Assessment 15
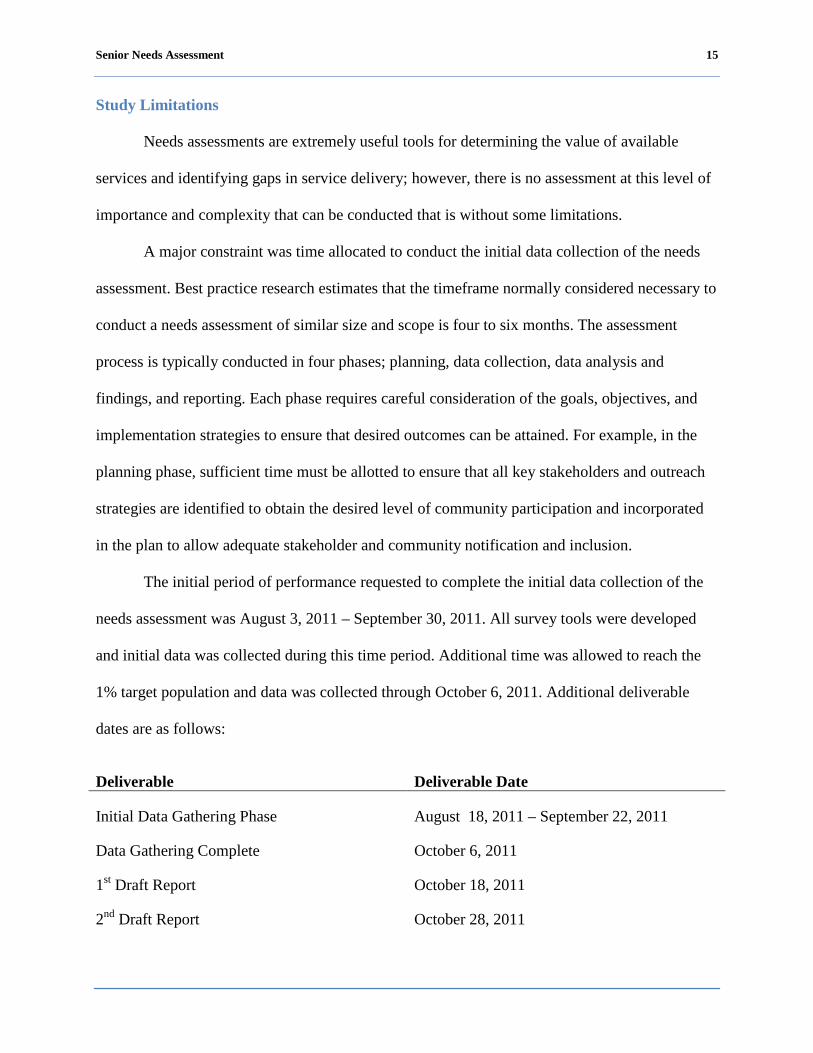
Study Limitations
Needs assessments are extremely useful tools for determining the value of available
services and identifying gaps in service delivery; however, there is no assessment at this level of
importance and complexity that can be conducted that is without some limitations.
A major constraint was time allocated to conduct the initial data collection of the needs
assessment. Best practice research estimates that the timeframe normally considered necessary to
conduct a needs assessment of similar size and scope is four to six months. The assessment
process is typically conducted in four phases; planning, data collection, data analysis and
findings, and reporting. Each phase requires careful consideration of the goals, objectives, and
implementation strategies to ensure that desired outcomes can be attained. For example, in the
planning phase, sufficient time must be allotted to ensure that all key stakeholders and outreach
strategies are identified to obtain the desired level of community participation and incorporated
in the plan to allow adequate stakeholder and community notification and inclusion.
The initial period of performance requested to complete the initial data collection of the
needs assessment was August 3, 2011 – September 30, 2011. All survey tools were developed
and initial data was collected during this time period. Additional time was allowed to reach the
1% target population and data was collected through October 6, 2011. Additional deliverable
dates are as follows:
Deliverable Deliverable Date
Initial Data Gathering Phase August 18, 2011 – September 22, 2011
Data Gathering Complete October 6, 2011
1st Draft Report October 18, 2011
2nd Draft Report October 28, 2011
Senior Needs Assessment 16
Deliverable Deliverable Date
Initial Final Report January 31, 2012
Initial Report Presentation March 1, 2012
Community Presentation #1 July 6, 2012
Community Presentation #2 July 13, 2012
Report Refinement July 13 – August 14, 2012
Final Report September 5, 2012
Another constraint was the diverse nature of the target audiences that consisted of: (1)
senior subpopulations with unique needs, such as the LGBT community where stigma can
impact full engagement; (2) seniors with English as a Second Language (ESL) and other unique
cultural characteristics that can hinder the opportunity for full participation; (3) persons living
with a disability (ages 18-59) that can require unique logistical challenges to ensure that most of
the recognized disabilities are addressed through the assessment; and (4) senior caregivers, an
emerging population where more than three in 10 U.S. households (31.2%) report that at least
one person has served as an unpaid family caregiver within the past 12 months for the survey
period.
Additionally, in some minority communities, the ability to gain trust requires multiple
opportunities for interactions. Time constraints, under these circumstances can greatly impact the
data collection activities as well as the desired outcomes.
The use of two survey instruments was also a study limitation. Due to time constraints, a
short version of the survey was developed to maximize respondent participation to meet the 1%
sample of the target population for telephone interviews and mail surveys. The short survey does
not allow identical analysis for all data elements which can limit the final results.
Senior Needs Assessment 17
Finally, the 5.8 magnitude earthquake that occurred on August 23, 2011 interrupted a
focus group activity underway and forced rescheduling for the following day which resulted in
very limited participation.
Senior Needs Assessment 18
Profile of Targeted Populations
Seniors (age 60 and older)
This section discusses findings from the 2010 U.S. Census, as well as other secondary
sources. For the purposes of this report, persons 60 and older are considered the senior
population. Where possible, we present findings for seniors age 60 and older. However, for some
areas we present data for seniors 65 and older because this is the age segment often reported by
the U.S. Census Bureau. In addition, we compare national data to the District of Columbia data.
A report by the U.S. Department of Health and Human Services Administration on Aging
[AoA] (2010), concluded that the senior population age 65 and older is the fastest growing
population in the United States. The U.S. Census Bureau (2010) pointed out that “the aging of
the [senior] population will have wide-ranging implications for the country” (Introduction
section, par 3.). In order to prepare for future aging populations, cities across the U.S. will need
to understand the changing demographics of seniors. Additionally, cities and states will need to
better understand the cost implications of the additional services that will be required to
adequately meet their needs.
Current demographics of the senior population.
Key national demographic findings among the senior population age 65 and older are:
Older women outnumber older men at 31.6 million to 25.4 million.
In 2010, 22.3% of persons ages 60 and older were minorities. Nine percent were African-
American. Persons of Hispanic origin (who may be of any race) represented 7.3% of the older
population. About 3.7% were Asian or Pacific Islander and less than 1% were American
Indian or Native Alaskan. In addition, less than 1% of persons ages 60 and older identified
themselves as being of two or more races and 1.6% of persons ages 60 and older identified
themselves as being “other” race.
Senior Needs Assessment 19
Approximately 40.2% seniors live alone.
The 65 years and older population will increase from 35 million to 55 million by 2020.
The 85 years and older population is projected to increase from 4.2 million to 6.6 million by
2020.
Minority populations are projected to increase from 5.7 million to 12.9 million by 2020
(23.6% of the elderly).
The median income of persons ages 65 and older in 2010 was estimated to be $34,381, after
adjusting for inflation.
The major sources of income as reported by older persons in 2008 were Social Security
(reported by 87% of older persons), income from assets (reported by 54%), private pensions
(reported by 28%), government employee pensions (reported by 14%), and earnings (reported
by 25%).
Age and gender.
Women live longer than men and therefore they make up the majority of the senior
population (Jacobsen, Kent, Lee, Mather, 2011, p. 3). In the United States in 2010, there were
31.6 million (55.4%) senior women ages 60 and older and 25.4 million (44.6%) senior men ages
60 and older (U.S. Census Bureau, 2010).
In comparison, in the District of Columbia, there were 57,423 (58.4%) senior women
ages 60 and older and 41,089 (41.6%) senior men ages 60 and older, which equals a gender ratio
of 71.6 males per 100 females (U.S. Census Bureau, 2010). Figure 1 graphically depicts the ratio
of women to men, showing the similarities of genders nationally and in the District of Columbia.

Senior Needs Assessment 20
Figure 1: National vs. District of Columbia Comparison of Senior Men and Women
Race and origin.
In 2010, it was estimated that in the U.S. approximately 22.3% of the senior population
were minorities. The distribution of the minority senior population was 9.0% African American,
7.3 % Hispanic (who may be of any race), 3.7% Asian, 1.6% other race, less than 1.0% mixed
and less than 1.0% was American Indian or Native Alaskan (U.S. Census Bureau, 2010).
In comparison, in the District of Columbia, it was estimated that approximately 69% of
the senior population were minorities. The distribution of the minority senior population in 2010
was 60.6% African American, 4.0% Hispanic, 2.2% Asian, less than 1% was other race, 1.7%
mixed and less than 1% American Indian and Native Alaskan. Furthermore, it was estimated that
78% of the senior population were naturalized citizens whereas 21% were not U.S. citizens (U.S.
Census Bureau, 2010). Figure 2 graphically depicts the racial composition of seniors in the
District of Columbia.

Senior Needs Assessment 21
Figure 2: District vs. National, Distribution of the Minority Senior Population
Figure 3 graphically depicts the citizenship status of seniors in the District of Columbia.
Figure 3: Citizenship of Seniors in the District of Columbia
Living arrangement.
The living arrangement of seniors is important because it is closely correlated to their
quality of life (Jacobsen, et Al., 2011). In the U.S. in 2010, the majority of seniors (57%) lived in
Source: U.S. Census Bureau, 2010
Source: U.S. Census Bureau, 2010
Senior Needs Assessment 22
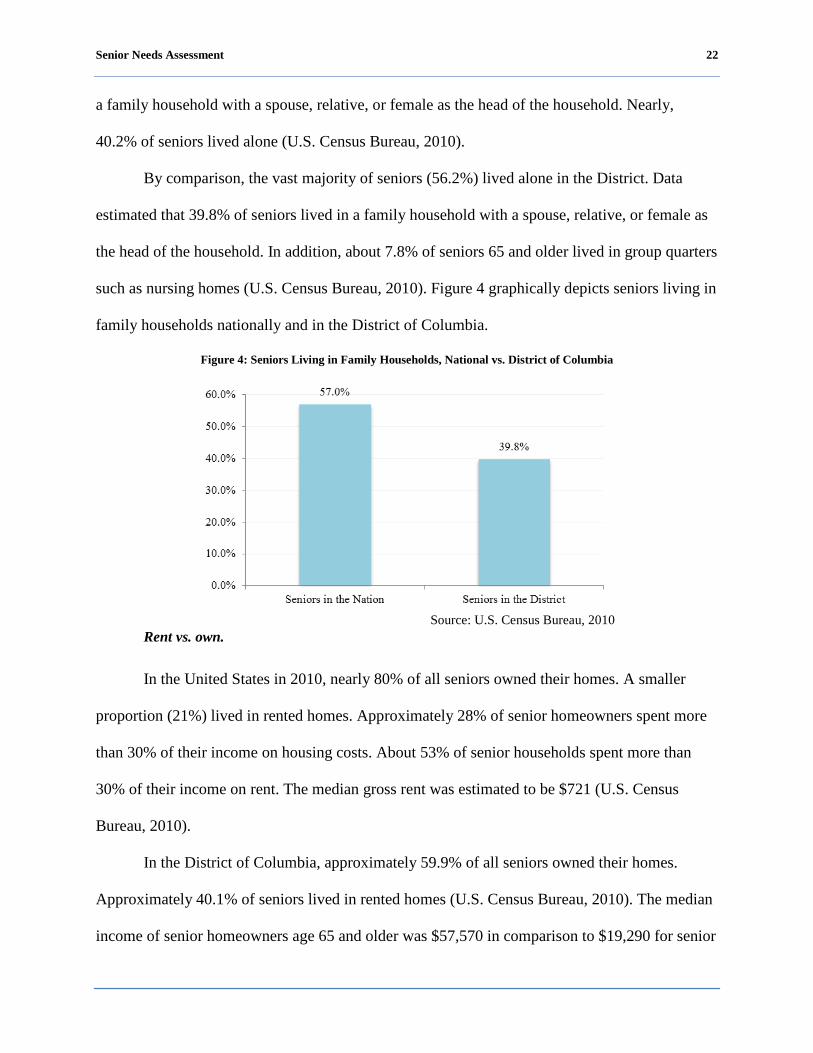
a family household with a spouse, relative, or female as the head of the household. Nearly,
40.2% of seniors lived alone (U.S. Census Bureau, 2010).
By comparison, the vast majority of seniors (56.2%) lived alone in the District. Data
estimated that 39.8% of seniors lived in a family household with a spouse, relative, or female as
the head of the household. In addition, about 7.8% of seniors 65 and older lived in group quarters
such as nursing homes (U.S. Census Bureau, 2010). Figure 4 graphically depicts seniors living in
family households nationally and in the District of Columbia.
Figure 4: Seniors Living in Family Households, National vs. District of Columbia
Rent vs. own.
In the United States in 2010, nearly 80% of all seniors owned their homes. A smaller
proportion (21%) lived in rented homes. Approximately 28% of senior homeowners spent more
than 30% of their income on housing costs. About 53% of senior households spent more than
30% of their income on rent. The median gross rent was estimated to be $721 (U.S. Census
Bureau, 2010).
In the District of Columbia, approximately 59.9% of all seniors owned their homes.
Approximately 40.1% of seniors lived in rented homes (U.S. Census Bureau, 2010). The median
income of senior homeowners age 65 and older was $57,570 in comparison to $19,290 for senior
Source: U.S. Census Bureau, 2010

Senior Needs Assessment 23
renter households (American Association of Retired Persons [AARP], Public Policy Institute
2011). Approximately 29.2% of senior homeowners spent more than 30% of their income on
housing costs. About 50.3% of senior households spent more than 30% of their income on rent.
The median gross rent was estimated to be $801 (U.S. Census Bureau, 2010).
Annual income.
In 2010, in the United States, data showed that the median income of seniors was
estimated to be $34,381, after adjusting for inflation (U.S. Census Bureau, 2010). A report by the
U.S. Census noted that there was no major change in income for seniors age 65 and older
between 2009 and 2010 (p. 9).
In comparison, in the District of Columbia, data showed that the median income for
seniors 65 and older was estimated to be $41,128, after adjusting for inflation (U.S. Census
Bureau, 2010).
Education.
Estimates for the U.S. for 2010 showed that about 24% of seniors held a bachelor’s
degree or higher. A similar proportion of approximately 24.2% of seniors attended college and
may have earned an associate’s degree. An additional 32.5% are high school graduates and the
remaining 19.3% did not graduate from high school (U.S. Census Bureau, 2010).
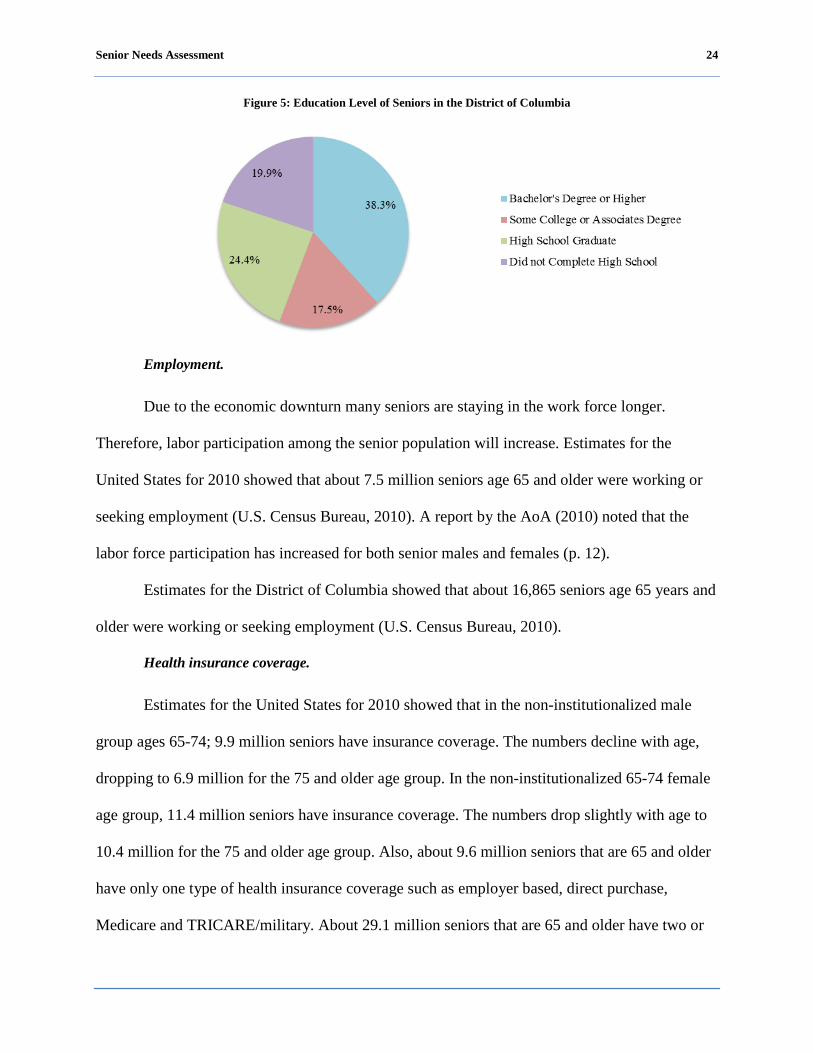
In comparison, estimates for the District of Columbia showed that about 38.3% of seniors
held a bachelor’s degree or higher. Approximately 17.5% of seniors attended college and may
have earned an associate’s degree. An additional 24.4% are high school graduates and the
remaining 19.9% did not graduate from high school (U.S. Census Bureau, 2010). Figure 5 shows
the education level of seniors in the District of Columbia.
Senior Needs Assessment 24
Figure 5: Education Level of Seniors in the District of Columbia
Employment.
Due to the economic downturn many seniors are staying in the work force longer.
Therefore, labor participation among the senior population will increase. Estimates for the
United States for 2010 showed that about 7.5 million seniors age 65 and older were working or
seeking employment (U.S. Census Bureau, 2010). A report by the AoA (2010) noted that the
labor force participation has increased for both senior males and females (p. 12).
Estimates for the District of Columbia showed that about 16,865 seniors age 65 years and
older were working or seeking employment (U.S. Census Bureau, 2010).
Health insurance coverage.
Estimates for the United States for 2010 showed that in the non-institutionalized male
group ages 65-74; 9.9 million seniors have insurance coverage. The numbers decline with age,
dropping to 6.9 million for the 75 and older age group. In the non-institutionalized 65-74 female
age group, 11.4 million seniors have insurance coverage. The numbers drop slightly with age to
10.4 million for the 75 and older age group. Also, about 9.6 million seniors that are 65 and older
have only one type of health insurance coverage such as employer based, direct purchase,
Medicare and TRICARE/military. About 29.1 million seniors that are 65 and older have two or
Senior Needs Assessment 25
more types of health insurance coverage. In addition, a small proportion of seniors (387,104) do
not have any type of insurance coverage. The number of seniors that do not have any type of
insurance coverage increased from 1.7% in 2009 to 2.0% in 2010 (U.S. Census Bureau, 2011, p.
25). In addition, the AoA (2010) reported that “about 86% of non-institutionalized Medicare
beneficiaries in 2007 had some type of supplementary coverage. Among Medicare beneficiaries
residing in nursing homes, over half (62%) were covered by Medicaid” (p. 13). Furthermore, a
report by the U.S. Census reported that “Medicare increased in 2010 to 14.5 percent and 44.3
million” (p. 24).
In comparison, estimates for the District of Columbia showed that in the non-
institutionalized 65-74 male age group, 15,821 seniors have insurance coverage. The numbers
declined with age, dropping to 10,577 for the 75 and older age group. In the non-institutionalized
65-74 female age group, 20,849 have insurance coverage. The numbers drop slightly with age to
19,466 for the 75 and older age group. Also, about 14,329 seniors that are 65 and older have only
one type of health insurance coverage such as employer based, direct purchase, Medicare and
TRICARE/military. About 51,869 seniors that are 65 and older have two or more types of health
insurance coverage. In addition, a small proportion of seniors (919) do not have any type of
insurance coverage (U.S. Census Bureau, 2010).
Projections of the senior population.
According to the AoA (2010), the nation’s senior population will grow faster than any
other segment of the total population. Much of this growth is attributed to the baby boomer
generation, individuals born between 1946 and 1964. This generation will reach age 65 between
2011 and 2030. The nation’s senior population will more than double between 2000 and 2030,
growing from 35 million to 72.1 million. The 85 and older population will increase faster than

Senior Needs Assessment 26
the other senior groups between 2009 and 2020, growing from 5.6 million to 6.6 million. The
District of Columbia’s senior population was projected to grow to 75,626 (17.4%) by 2030.
However, in 2010, the senior population had grown to 98,512.
The AoA (2010) noted that the minority population will accelerate as well between 2000
and 2020; growing from 5.7 million, which represents 16.3% of the senior population, to 12.9
million which represents 23.6% of the senior population. By 2030 the Caucasian population age
65 years and older will increase by 59% compared to 160% for older minorities; including
Hispanics (202%); African-Americans (114%); American Indians, Eskimos, and Aleuts (145%);
and Asians and Pacific Islanders (145%).
From the projections provided by AoA, it is evident that the demographic landscape of
America will change in the future. In order to prepare for the aging population, the shift in
demographics among seniors should be the driving force for local, state and federal
government’s decision making as they seek solutions to the changing demographic landscape.
Senior Needs Assessment 27
Persons Living With a Disability (Ages 18-59)
Introduction.
In seeking to identify the prevalence of persons living with disabilities among the District
of Columbia’s population, it was first necessary to define the term “disability.” Since “disability”
can be narrowly or broadly defined and there is no single universally accepted definition, for the
purpose of this report, the definition of a disability as defined by the Americans with Disability
Act of 1990 (ADA) will be used. Under the ADA, an individual is considered to have a disability
if the person: “has a physical or mental impairment that substantially limits one or more of the
major life activities of such individual; a record of such impairment; or being regarded as having
such impairment”.
The most frequently applied framework of disability comes from Saad Nagi (1969). This
framework views disability as difficulty performing socially expected activities such as work for
pay, and explicitly recognizes the interaction of the environment and pathologies/impairments to
cause disabilities. The ADA rests upon the Nagi framework. In this framework, the disability
process is represented by the movement through four interrelated stages: pathology, impairment,
functional limitation, and disability.
Current demographics of persons living with a disability.
In 2010, according to statistics, a work related limitation was reported by an estimated
8% of civilian non-institutionalized men and women ages 18-64 across the nation. By
comparison an estimated 7.9% of the civilian non-institutionalized men and women ages 18-64
in the District of Columbia reported a work limitation. Similarly, comparisons of the actual
numbers of disability prevalence in the U.S. (15,175,000 out of 189,692,000) versus in the
District of Columbia (33,000 out of 416,000) showed the same ratio of civilian non-

Senior Needs Assessment 28
institutionalized men and women reporting a work limitation as approximately one in 13 (von
Schrader, Erickson & Lee, 2010).
The American Community Survey (ACS), a continuous data collection effort conducted
by the U.S. Census Bureau, uses six questions to identify the population with disabilities. Below
are the disability questions used in the 2008 ACS:
1. Hearing Disability (asked of all ages): Is this person deaf or does he/she have serious
difficulty hearing?
2. Visual Disability (asked of all ages): Is this person blind or does he/she have serious
difficulty seeing even when wearing glasses?
3. Cognitive Disability (asked of persons ages 5 or older): Because of a physical, mental, or
emotional condition, does this person have serious difficulty concentrating, remembering, or
making decisions?
4. Ambulatory Disability (asked of persons ages 5 or older): Does this person have serious
difficulty walking or climbing stairs?
5. Self-Care Disability (asked of persons ages 5 or older): Does this person have difficulty
dressing or bathing?
6. Independent Living Disability (asked of persons ages 15 or older): Because of a
physical, mental, or emotional condition, does this person have difficulty doing errands alone
such as visiting a doctor's office or shopping?
The prevalence of disability among non-institutionalized people across the U.S. vs. the
District of Columbia can be demonstrated in the following characteristics: age; gender; race;
employment; income; health insurance coverage; and veterans’ service-connected disability.
For the purpose of this report, the primary data relevant to age and to the role of DCOA
relative to disabilities is non-institutionalized individuals of working ages 21-64.
Senior Needs Assessment 29
Age.
In 2008, the prevalence of disabilities across the U.S. was 10.4% among persons aged
21-64 compared to 8.9% for the District of Columbia. (Erickson, Lee, & von Schrader, 2010).
Gender.
The prevalence of disabilities across the U.S. for ages 21-64 in terms of overall
percentage was slightly higher among males than females. Males reporting one or more
disabilities was 10.5%; the prevalence of U.S. women aged 21-64 reporting one or more
disabilities was 10.4%, (Erickson et al., 2008).
By comparison, the prevalence of disabilities in the District of Columbia among women
ages 21-64 was higher than for males. As noted by Erickson et al. (2008), the percentage rate of
females in the District of Columbia reporting a disability was 9.8%. The prevalence for males
ages 21-64 in the District of Columbia reporting one or more disabilities was 7.8% as exhibited
by Erickson et al. (2010).
Race.

Senior Needs Assessment 30
Table 4 shows the prevalence of disabilities by race across the U.S. compared to the District of
Columbia for the population of working-people ages 21-64 years (Erickson et al., 2010). Native
Americans have the highest prevalence of disabilities nationally and African Americans have the
highest prevalence of disabilities in the District of Columbia.

Senior Needs Assessment 31
Table 4: Prevalence of Disabilities by Race across the US vs. the District of Columbia.
RACE U.S. Prevalence District of Columbia Prevalence
African American 14.3% 14.5%
Caucasian 10.2% 3.5%
Hispanic or Latino Origin 8.4% 4.2%
Asian 4.6% 2.7%
Native American 18.8% 12.6% (sample size less than 40)
Some other Race 9.8% 3.4% Source: von Schrader, Erickson & Lee (2010)
Employment.
The employment rate of U.S. working-age non-institutionalized people (ages 21-64) with
any disability was 39.5% compared to the employment rate of the same population (working-age
people with any disability) in the District of Columbia at 33.1% as revealed by Erickson et al.,
(2010). Key variables include:
a. Actively Looking for Work: The percentage of U.S. working-age people (ages
21-64) with disabilities who were not working but actively looking for work was
8.7%; whereas, during this same period, the percentage of District of Columbia
residents with disabilities actively looking for employment was 10.2% (Erickson
et al., 2010).
b. Full-time/Full-Year Employment: In 2008, the percentage of the U.S. working-
age non-institutionalized population ages 21-64 with disabilities working full-
time/full-year was 25.4%; whereas, during the same period the percentage in the
District of Columbia was 22.4% (Erickson et al., 2010).
Senior Needs Assessment 32
Income.
c. Annual Earnings: For U.S. households with any working age non-
institutionalized people with disabilities, the median annual income was $35,600.
By comparison, $40,700 was the median annual earnings of working-age non-
institutionalized people age 21-64 with disabilities working full-time/full-year in
the District of Columbia (Erickson et al., 2010).
d. Annual Household Income: In 2008, the median annual income in the U.S. of
households that include any working-age people with disabilities was $39,600
(household income was unavailable for persons living in group quarters). By
comparison, during the same period (2008) the median income of households in
the District of Columbia with any working-age people with disabilities was
$30,100 (Erickson et al., 2010).
e. Poverty: The U.S. poverty rate of working-age non-institutionalized people with
disabilities in 2008 was 25.3%. By comparison, in the District of Columbia in
2008, the poverty rate of working-age non-institutionalized people (21-64) with
disabilities was 32.9%. (Erickson et al., 2010).
f. Supplemental Security Income (SSI): The overall U.S. percentage in 2008 of
non-institutionalized working-age people with disabilities receiving SSI
payments was 17.7%. By comparison, the percentage of the District of
Columbia’s working-age people in 2008 with disabilities receiving SSI payments
was 21.2% (Erickson et al., 2010).
Senior Needs Assessment 33
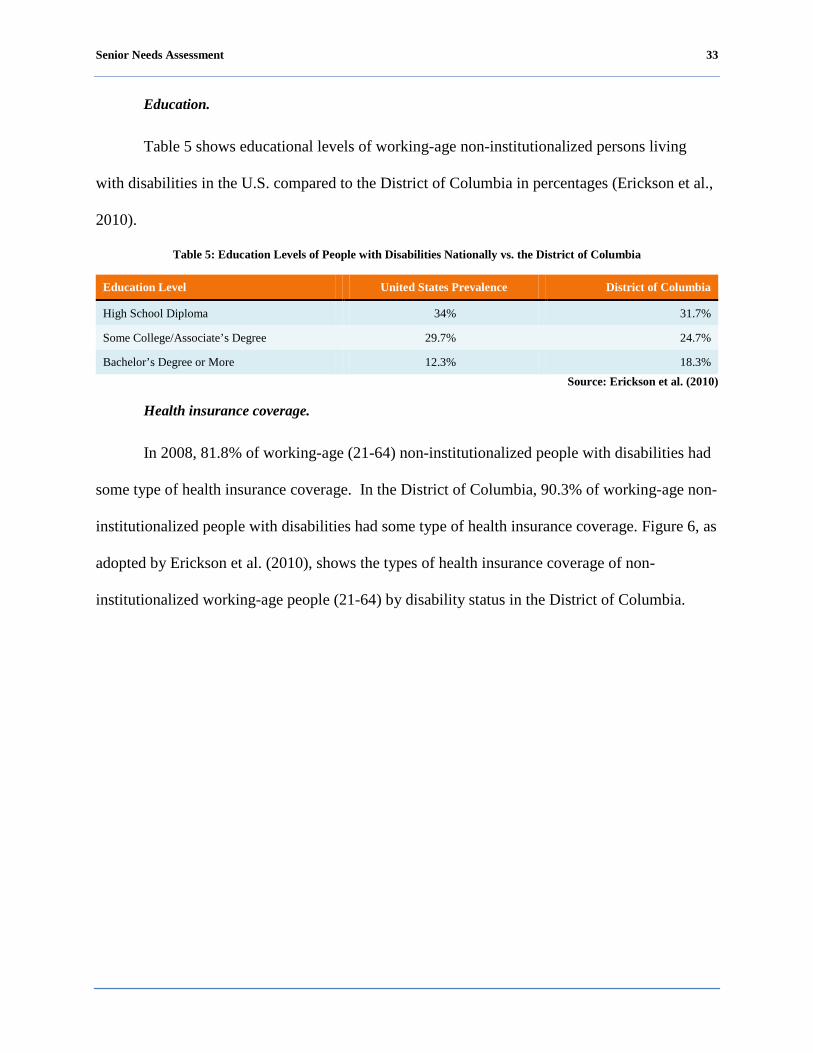
Education.
Table 5 shows educational levels of working-age non-institutionalized persons living
with disabilities in the U.S. compared to the District of Columbia in percentages (Erickson et al.,
2010).
Table 5: Education Levels of People with Disabilities Nationally vs. the District of Columbia
Education Level United States Prevalence District of Columbia
High School Diploma 34% 31.7%
Some College/Associate’s Degree 29.7% 24.7%
Bachelor’s Degree or More 12.3% 18.3% Source: Erickson et al. (2010)
Health insurance coverage.
In 2008, 81.8% of working-age (21-64) non-institutionalized people with disabilities had
some type of health insurance coverage. In the District of Columbia, 90.3% of working-age non-
institutionalized people with disabilities had some type of health insurance coverage. Figure 6, as
adopted by Erickson et al. (2010), shows the types of health insurance coverage of non-
institutionalized working-age people (21-64) by disability status in the District of Columbia.

Senior Needs Assessment 34
Figure 6: Percentages of Types of Health Insurance Coverage
9.7%
35.0%
14.5% 15.2%
47.0%
4.9%0.0%
9.8%
68.9%
15.2%
1.1%
13.5%
2.6%
10.0%
0.0%
10.0%
20.0%
30.0%
40.0%
50.0%
60.0%
70.0%
80.0%
Uninsured Employer/Union Purchased Medicare Medicaid Military/VA Indian Health Care
Healthcare Coverage, Disability vs. No Disability
Any Disability No Disability
Source: Erickson et al. (2010)
Veterans’ service-connected disability.
In 2008, there were 16.9% working-age (21-64) veterans across the U.S. with a service
connected disability (defined as a result of disease or injury incurred or aggravated during
military service as determined by Veterans Affairs). By comparison, 14.7% working age
veterans aged 21-64 in the District of Columbia had a service-connected disability (Erickson et
al., 2010).
Senior Needs Assessment 35
Senior Caregivers
Current demographics of senior caregivers.
Introduction.
By 2030, it is estimated that there will be more than 70 million Americans aged 65 and
older; and the number of Americans aged 85 and older, the fastest growing age group in the
United States, is expected to triple (Super, 2002). As the population of older Americans
increases, so will their need for assistance with activities of daily living (ADL) and long-term
health care.
The senior caregiver population is an emerging population in terms of identifying the
number of senior caregivers in the population and determining their needs and contributions to
society as a whole. Because of this emerging population, many organizations and municipalities
are beginning to focus their efforts to better understand the senior caregiver.
For the purposes of this senior needs assessment, a caregiver is a person (spouse, family
member, friend, significant other, neighbor) over the age of 60 that is unpaid and provides
assistance for a senior or person living with disabilities who is limited in their ability to perform
self-care and unable to perform some or all daily activities.
In 2009, it was estimated that approximately 65.7 million people in the U.S. have served
as unpaid caregivers. More than three in 10 U.S. households (31.2%) report that at least one
person has served as an unpaid family caregiver within the last 12 months; leading to an estimate
of 36.5 million households with a caregiver present (National Alliance for Caregiving and
AARP, 2009).
In 2009, it was reported that the average caregiver in the U.S. was a 46-year-old woman
working outside of the home and providing 20 hours or more a week of unpaid care to a relative,
Senior Needs Assessment 36
(AARP Public Policy Institute, 2008). As the age of seniors needing long-term care increases,
the age of their caregivers is also increasing. The average age of those caring for someone age 65
and older is 63 years old (National Alliance for Caregiving and AARP, 2009). In 2009, the
National Alliance for Caregiving and AARP reported that the average age of caregivers in the
United States has increased from 46.4 years in 2004 to 49.2 years in 2009. It was also reported
that the average age of care recipients has increased from 66.5 years in 2004 to 69.3 years in
2009, demonstrating the trend of increased age among both caregivers and care recipients.
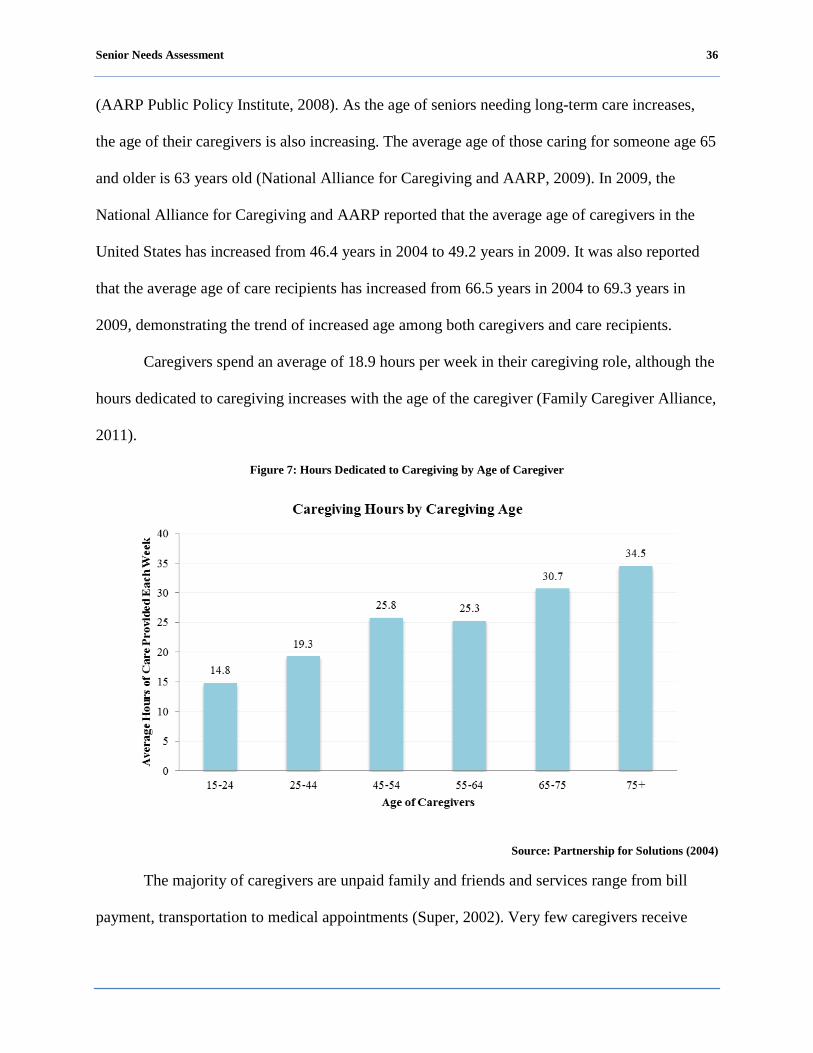
Caregivers spend an average of 18.9 hours per week in their caregiving role, although the
hours dedicated to caregiving increases with the age of the caregiver (Family Caregiver Alliance,
2011).
Figure 7: Hours Dedicated to Caregiving by Age of Caregiver
Source: Partnership for Solutions (2004)
The majority of caregivers are unpaid family and friends and services range from bill
payment, transportation to medical appointments (Super, 2002). Very few caregivers receive
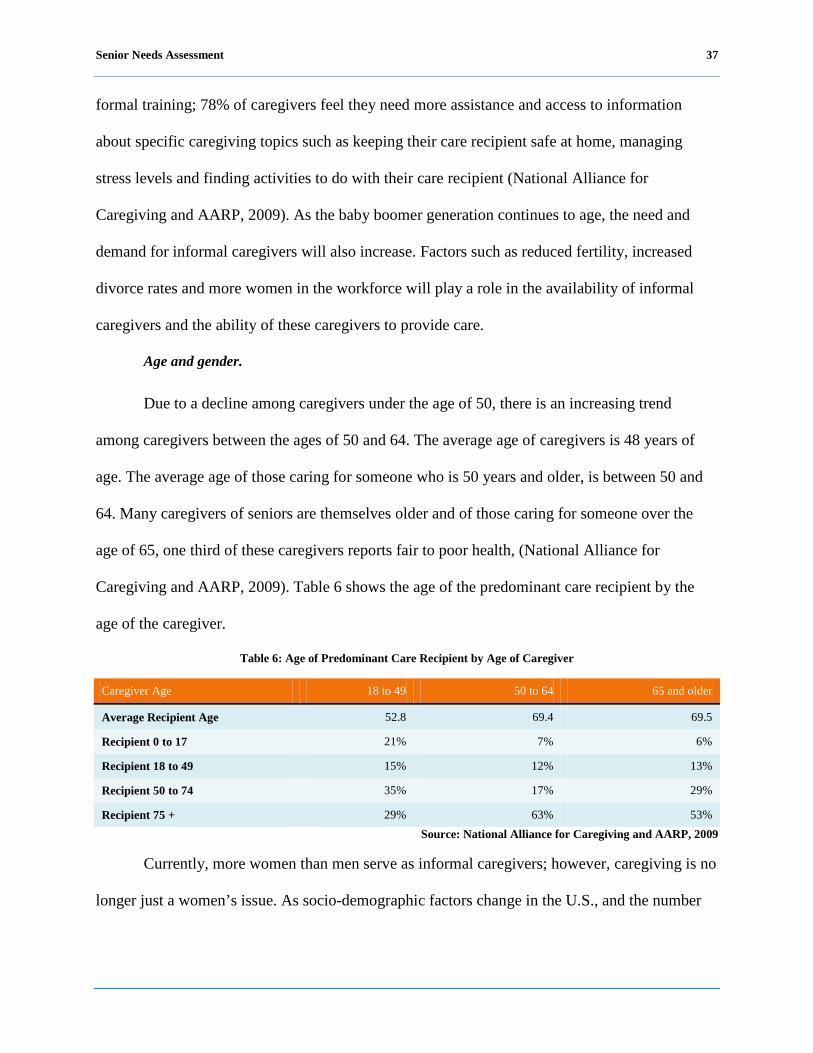
Senior Needs Assessment 37
formal training; 78% of caregivers feel they need more assistance and access to information
about specific caregiving topics such as keeping their care recipient safe at home, managing
stress levels and finding activities to do with their care recipient (National Alliance for
Caregiving and AARP, 2009). As the baby boomer generation continues to age, the need and
demand for informal caregivers will also increase. Factors such as reduced fertility, increased
divorce rates and more women in the workforce will play a role in the availability of informal
caregivers and the ability of these caregivers to provide care.
Age and gender.
Due to a decline among caregivers under the age of 50, there is an increasing trend
among caregivers between the ages of 50 and 64. The average age of caregivers is 48 years of
age. The average age of those caring for someone who is 50 years and older, is between 50 and
64. Many caregivers of seniors are themselves older and of those caring for someone over the
age of 65, one third of these caregivers reports fair to poor health, (National Alliance for
Caregiving and AARP, 2009). Table 6 shows the age of the predominant care recipient by the
age of the caregiver.
Table 6: Age of Predominant Care Recipient by Age of Caregiver
Caregiver Age 18 to 49 50 to 64 65 and older
Average Recipient Age 52.8 69.4 69.5
Recipient 0 to 17 21% 7% 6%
Recipient 18 to 49 15% 12% 13%
Recipient 50 to 74 35% 17% 29%
Recipient 75 + 29% 63% 53% Source: National Alliance for Caregiving and AARP, 2009
Currently, more women than men serve as informal caregivers; however, caregiving is no
longer just a women’s issue. As socio-demographic factors change in the U.S., and the number
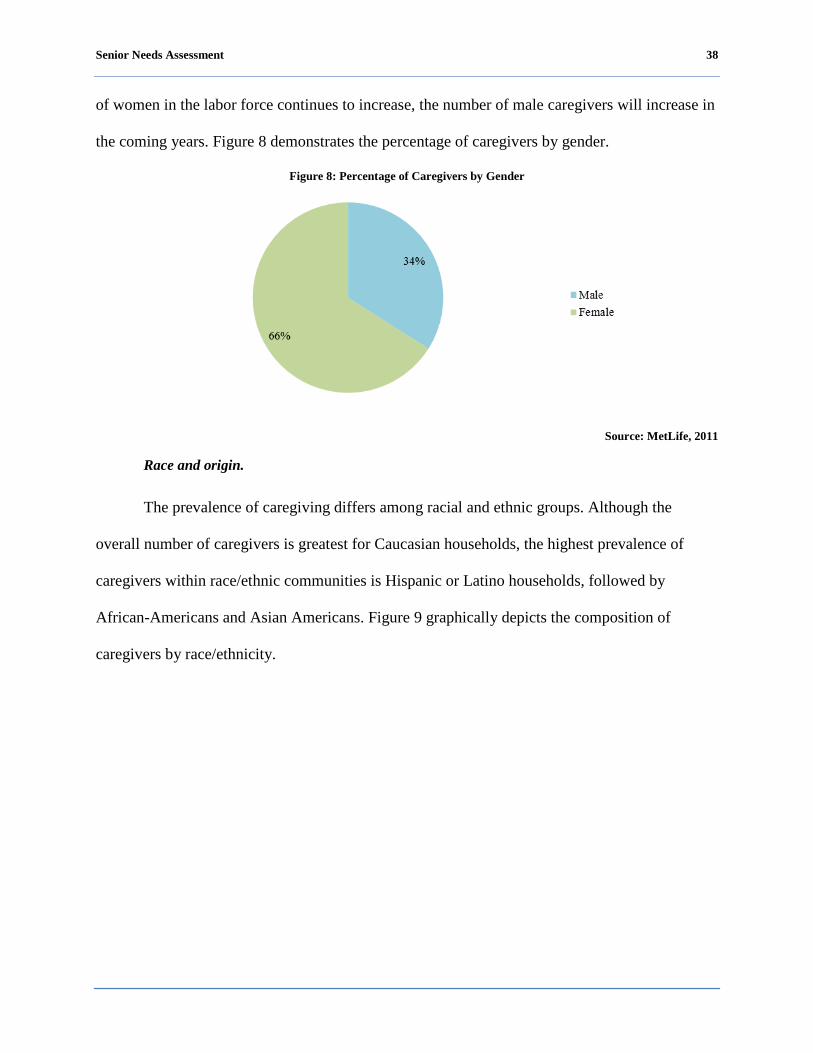
Senior Needs Assessment 38
of women in the labor force continues to increase, the number of male caregivers will increase in
the coming years. Figure 8 demonstrates the percentage of caregivers by gender.
Figure 8: Percentage of Caregivers by Gender
Source: MetLife, 2011
Race and origin.
The prevalence of caregiving differs among racial and ethnic groups. Although the
overall number of caregivers is greatest for Caucasian households, the highest prevalence of
caregivers within race/ethnic communities is Hispanic or Latino households, followed by
African-Americans and Asian Americans. Figure 9 graphically depicts the composition of
caregivers by race/ethnicity.

Senior Needs Assessment 39
Figure 9: Percentage of Caregivers by Race/Ethnicity
Source: Caregiving in the U.S., 2009
Table 7 depicts the prevalence of caregivers by race/ethnicity, demonstrating that
Hispanics, followed by African Americans, Caucasians and Asian Americans have the highest
prevalence of caregivers.
Table 7: Prevalence of Caregivers by Race/Ethnicity
Race/Ethnicity Prevalence Estimated number of Households with Caregivers
Hispanic 36.1% 4.8 million
African-American 33.6% 4.7 million
Caucasian 30.5% 25.2 million
Asian-American 20.0% 4.8 million Source: Caregiving in the U.S., 2009
Annual income.
The median household income for a caregiver providing care to a person 50 years and
older is $38,125 (National Alliance for Caregiving and AARP, 2004). Caregivers often share not
only their time, but often times contribute financially to the care of their recipient. Primary
caregivers spend an average of $232 per month on their care recipient. Figure 10 depicts the
income levels of caregivers by percentage.

Senior Needs Assessment 40
Figure 10: Percentage of Level of Income of Caregivers
Source: National Alliance for Caregiving and AARP, 2004
Level of education.
The level of education is nearly equally distributed among caregivers who have
completed high school, have some college experience and graduated from college. Research
shows that the level of education and annual income positively correlates among caregivers.
Forty-two percent (42%) of high school graduates that are caregivers report an annual income of
$30,000 or less. Among caregivers that are college graduates, 36% report an annual income of
$100,000 or more (National Alliance for Caregiving and AARP, 2009). Figure 11 represents the
level of education of caregivers.
Figure 11: Education Level of Caregivers
Source: National Alliance for Caregiving and AARP, 2004
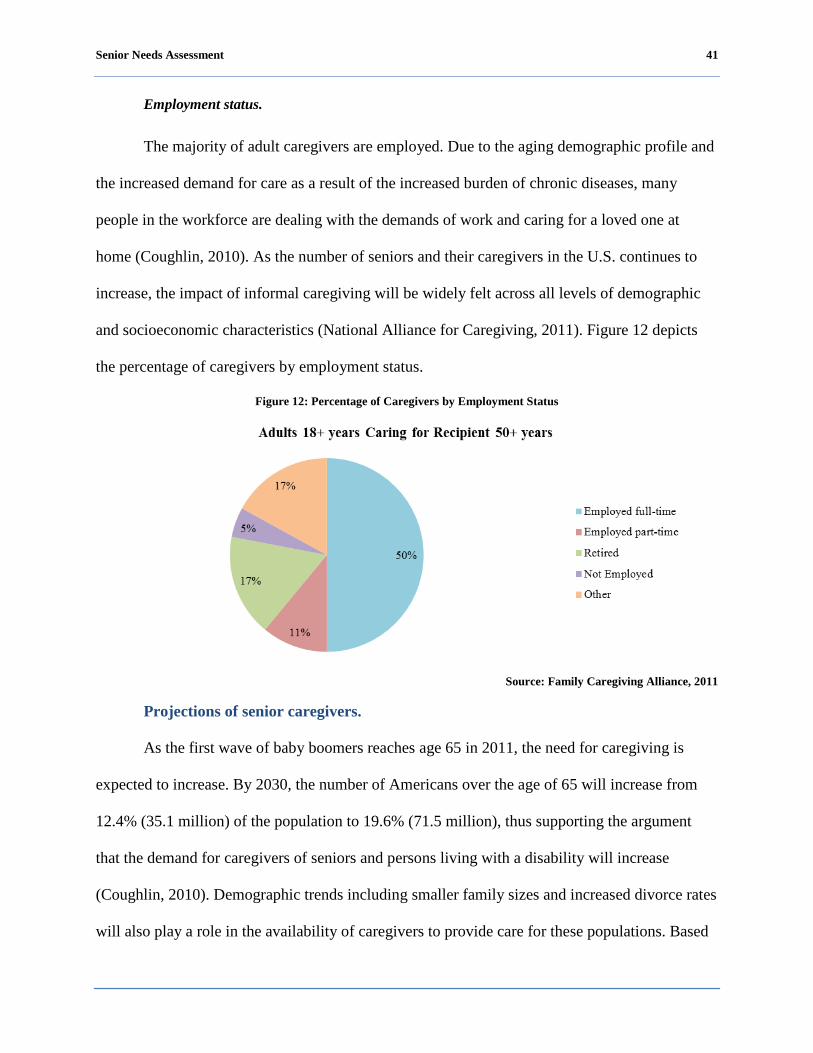
Senior Needs Assessment 41
Employment status.
The majority of adult caregivers are employed. Due to the aging demographic profile and
the increased demand for care as a result of the increased burden of chronic diseases, many
people in the workforce are dealing with the demands of work and caring for a loved one at
home (Coughlin, 2010). As the number of seniors and their caregivers in the U.S. continues to
increase, the impact of informal caregiving will be widely felt across all levels of demographic
and socioeconomic characteristics (National Alliance for Caregiving, 2011). Figure 12 depicts
the percentage of caregivers by employment status.
Figure 12: Percentage of Caregivers by Employment Status
Source: Family Caregiving Alliance, 2011
Projections of senior caregivers.
As the first wave of baby boomers reaches age 65 in 2011, the need for caregiving is
expected to increase. By 2030, the number of Americans over the age of 65 will increase from
12.4% (35.1 million) of the population to 19.6% (71.5 million), thus supporting the argument
that the demand for caregivers of seniors and persons living with a disability will increase
(Coughlin, 2010). Demographic trends including smaller family sizes and increased divorce rates
will also play a role in the availability of caregivers to provide care for these populations. Based
Senior Needs Assessment 42
on reports from the National Family Caregivers Association, the number of prospective family
caregivers will decrease from 11 in 1990 to an estimated four in 2050 per individual needing care
(National Family Caregivers Association, 2000).
While the number of caregivers is expected to decrease over the years, the economic cost
of caregiving continues to grow. The estimated economic value of unpaid caregiver contributions
was approximately $375 billion in 2007, up from $350 billion in 2006 (AARP Policy Institute,
2008). Recognizing that unpaid caregivers are a vital part of the long-term care delivery system
and economy will increasingly play a role in policy development, programs and initiatives to
support this paramount population.
As a possible result of the 2008 recession and tight budgets in American households, the
use of paid aids and housekeepers declined from 41% in 2004 to 35% in 2009. With limited
affordable respite care, persons taking on the role of caregiver may become emotionally stressed
and see a decline in their own health. Seventeen percent of caregivers feel that their own health
has gotten worse as a result of their caregiving, while 31% of caregivers consider their
caregiving role to be emotionally stressful (National Alliance for Caregiving and AARP, 2009).
Conclusion.
As the demographics in the senior population change, so will the demographics of the
caregiver population. Unpaid caregivers provide a large portion of long-term services and thus
are an important component of the U.S. economy. The needs of caregivers must be identified and
addressed locally and nationally with thoughtful and meaningful tools to provide support, both
emotionally and financially.

Senior Needs Assessment 43
Special Populations
Lesbian, Gay, Bisexual and Transgender.
At the time of the 2010 Census, the District of Columbia, along with Connecticut, Iowa,
Massachusetts, New Hampshire and Vermont had issued marriage certificates to same-sex
couples. In May of 2008, the California Supreme Court ruled to allow same-sex couples the right
to marry, but in November 2008, a ballot initiative overturned the ruling. In addition, there were
three states that recognized same-sex marriages granted by other states (Maryland, New York,
and Rhode Island), but did not perform same-sex marriages in their states.
While the census does not include population specific data on LGBT individuals, data is
available relative to a number of other characteristics.
Living arrangements.
The 2010 U.S. Census data showed, same-sex couple households nation-wide totaled less
than 1% of all households that are same-sex couple households. Whereas, in the District of
Columbia, there were 2%, same-sex couple households. Additionally, there were 552,620 same
sex unmarried partner households in the United States, representing .473% households,
compared to the 4,161 same sex unmarried partner households in the District of Columbia,
representing little over 1.5% (U.S. Census Bureau, 2010).
When comparing same-sex couple households among states, the District of Columbia had
the highest percentage of all same-sex couple households, (2%). The closest state was Vermont
with 1.09%, followed by Massachusetts at 1.02% (U.S. Census Bureau, 2010).
Behavioral factors.
The 2008 District of Columbia Behavioral Risk Factor Surveillance System (BRFSS)
Annual Report confirmed that when asked about sexual orientation, 5% indicated homosexual,
Senior Needs Assessment 44
2% bisexual and 1% indicated other. The report found that males (8%) were more likely than
females (2%) to be homosexual. Females (81%) were more likely than males (78%) to be
heterosexual and bisexual.
Hispanic or Latino.
The Hispanic or Latino population accounted for more than half the growth in the total
population of the U.S. between 2000 and 2010. During this period, Hispanic population growth
increased by 15.2 million, accounting for over half of the 27.3 million increase in the overall
U.S. population. This was a growth rate four times faster than the U.S population (U.S. Census
Bureau, 2010). In the 2010 Census it was estimated that 7.3% of the senior population in the U.S.
were Hispanics or Latinos, whereas in the District of Columbia, 4.0% were Hispanics or Latinos
(U.S. Census Bureau, 2010).
Employment.
According to national employment data, there were 2,868,339 Hispanic or Latino men
and women aged 65 years and older nationwide. Of this total, approximately 83% were neither in
the labor force or employed. Looking more closely at the data, out of the 1,187,802 Hispanic or
Latino men, 78% were not in the labor force or employed. Additional data showed that of the
259,834 men in the labor force, 89% were employed (U.S. Census Bureau, 2010).
Also, looking at Hispanic or Latino women, there were 1,620,537 aged 65 years and
older nationwide though 89% were not in the labor force. Of the 173,770 Hispanic or Latino
women aged 65 years and older that were in the labor force, 91% were employed (U.S. Census
Bureau, 2010).
U.S. Census data specific to the District of Columbia related to senior Hispanics or
Latinos, estimates there were 2,769 men and women in the District of Columbia aged 65 years
Senior Needs Assessment 45
and older. However, estimates showed that 64% of this population were not in the labor force or
employed. Additionally, it was reported that 93% of the senior Hispanic or Latino men were
employed and 19% of senior Hispanic or Latino women were employed. Notable however, and
similar to the national trend, a large number of Hispanic or Latino men and women ages 65 years
and older in the District of Columbia are not in the labor force and therefore not employed (U.S.
Census Bureau, 2010).
Health insurance coverage.
Estimates showed that 95% of the U.S Hispanic or Latino senior population 65 years and
older were insured. In addition, estimates showed that about 7% of Hispanic or Latino seniors
65-74 years and older were uninsured and for seniors 75 years and older, about 4% were
uninsured. In 2010, U.S. Census data showed that 89% of Hispanics or Latinos ages 65-74
reported having health insurance. Also 91% Hispanics or Latinos ages 75 and older reported
having health insurance (U.S. Census Bureau, 2010).
Asian and Pacific Islander.
U.S. Census data is only available on age and gender for the Asian and Pacific Islanders.
The Office of Management and Budget [OMB] defined Asian as people with origins in the
original people of the Far East, Southeast Asia, and the Indian subcontinent. These populations
represent Asian Indians, Chinese, Filipino, Japanese, Korean, Vietnamese, and other Asians. In
the 2010 U.S. Census, it was estimated that 3.7% of the senior population in the U.S. were
Asians. However, the 2010 U.S. Census data showed that the Asian population represented only
2.2 % of the District of Columbia’s population (U.S. Census Bureau, 2010).
In addition, it is estimated that Native Hawaiian or other Pacific Islanders alone or in
combination represent less than 1% of the senior U.S. population while interestingly it is
Senior Needs Assessment 46
estimated that there are no Native Hawaiian or other Pacific Islanders in the District of Columbia
(U.S. Census Bureau, 2010).
Senior Needs Assessment 47
Peer Comparison
The District’s Unique Status
The government of the District of Columbia is a unique jurisdiction when compared to
other medium sized city governments in close proximity. The District of Columbia serves its
residents as a city, county and state government depending on the type of service provided. The
District of Columbia is also distinct from the states because there are no local units or
subdivisions of government within the District of Columbia. For the purposes of the receipt and
the provision of federal aging grant program funds under the OAA, the District government is
designated as the SUA and DCOA is the District government agency that has been designated as
the AAA. This allows the District government, through DCOA, to provide services to residents
over the age of 60 and to meet their needs in a way that ensures residents a much higher level of
independence.
Senior Needs Assessment 48
The Methodology
A number of cities were considered for peer comparison based on their size and other
characteristics that made them similar in some key aspect to the District of Columbia. As a result
of collaborating with DCOA, a final determination was made to review the aging and senior
services programs in Baltimore, Maryland; Atlanta, Georgia; Columbus, Ohio; and Richmond,
Virginia. In each of these cities, the city government provides some senior services, but another
entity also provides key senior services or provides the vast majority of the senior services to the
city’s residents. In Richmond, there is only one full-time employee (FTE) devoted to the
provision of senior services. In Richmond, Columbus, and Atlanta, a regional consortium of
counties and/or cities is designated as the AAA and provides most senior services.
Table 8 and Table 9 compare DCOA to its peer cities and their services. Table 8
compares DC’s budget, number of FTEs, age of seniors being served, its population, and its
senior population to Baltimore, Atlanta, Columbus and Richmond’s. As mentioned earlier, the
District of Columbia is designated as both the SUA and AAA. Whereas in most other
jurisdictions, the SUA is designated by the state and the AAA is designated by the OAA. The
second matrix (see Table 9) shows DCOA’s services as compared to the peer city’s AAA.

Senior Needs A
ssessment
49
Table 8: Peer C
ities Com
parison Matrix
Peer Cities:
Washington, D
C
Baltim
ore, MD
A
tlanta, GA
C
olumbus, O
H
Richm
ond VA
Area A
gency on Aging
DC
OA
C
omm
ission on Aging and R
etirement
Education (CA
RE)
Atlanta R
egional C
omm
ission C
entral Ohio A
gency A
rea on Aging
Senior C
onnections, Inc.
FTE
s 39.5 incl. 19.5 local, 8 federal grant and 12 Intra-D
istrict funded
77 incl. Senior Centers, A
dvocacy &
Supportive Care, A
dministration, A
ssistive &
Directive C
are and Senor Education N
OT A
VA
ILAB
LE N
OT A
VA
ILAB
LE 1 FTE
Budget
$23,934,499 (FY 2011)
$11,585,450 (FY 2011)
NO
T AV
AILA
BLE
NO
T AV
AILA
BLE
NO
T AV
AILA
BLE
Age of Seniors
60+ 60+
60+ 60+
55+ Population
601,723 (2010) 620,961 (2010)
420,003 (2010) 787,033 (2010)
204,214 (2010) Senior Population
98,512 (2010) 110,961 (2000)
71,301 (2000)(55+) 63,316 (2000)(65+)
50,772 (2010) L
ead Agency
Y
Y
N
N
N
SER
VIC
ES
T
ransportation
W
ellness Centers
Adult D
ay Care
A
lzheimer's Services
Caregiver Support
C
ase Managem
ent
C
ounseling
Em
ergency Shelter
Em
ployment
Group H
omes
Group M
id-Day M
eals
Health Insurance C
ounseling
H
ome D
elivered Meals
In-Hom
e Support
Legal Services
Long-T
erm C
are Om
budsman
M
ultipurpose Senior Centers
Nursing H
omes
Nutrition C
ounseling
AD
RC
-One-Stop R
esource C
enter
Recreation and Socialization
Respite A
id Services
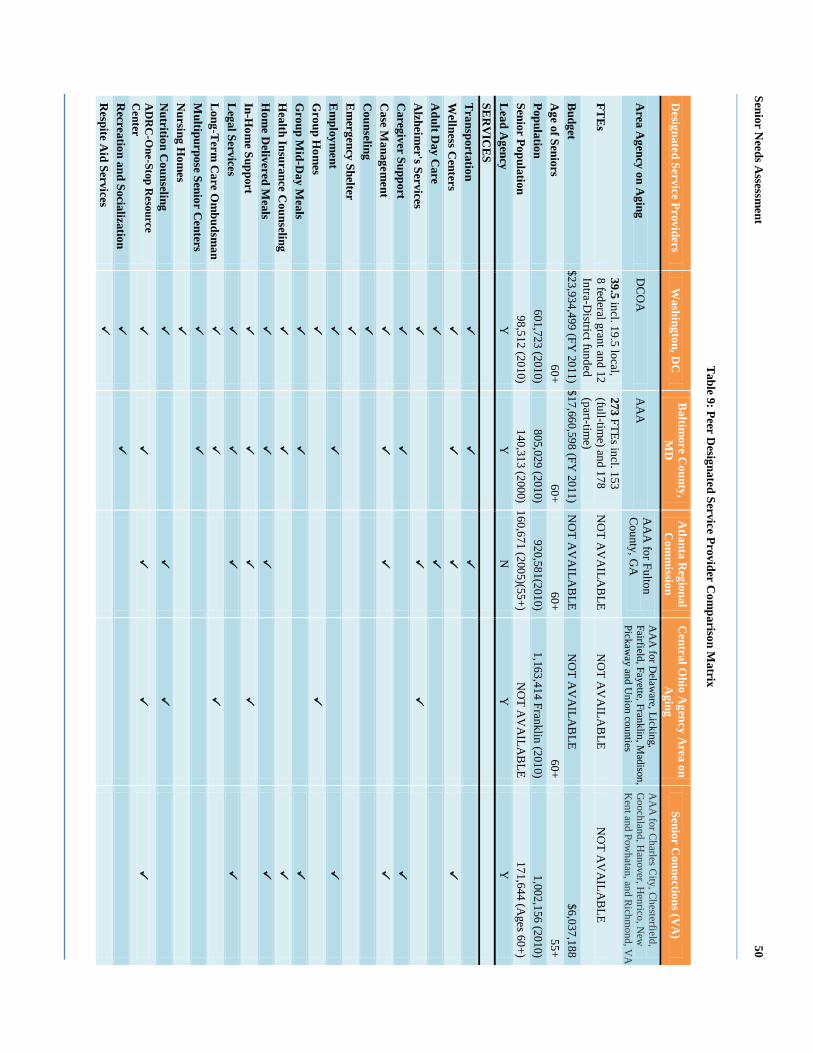
Senior Needs A
ssessment
50
Table 9: Peer D
esignated Service Provider Com
parison Matrix
Designated Service Providers
Washington, D
C
Baltim
ore County,
MD
A
tlanta Regional
Com
mission
Central O
hio Agency A
rea on A
ging Senior C
onnections (VA
)
Area A
gency on Aging
DC
OA
A
AA
A
AA
for Fulton C
ounty, GA
A
AA
for Delaw
are, Licking, Fairfield, Fayette, Franklin, M
adison, Pickaw
ay and Union counties
AA
A for C
harles City, C
hesterfield, G
oochland, Hanover, H
enrico, New
K
ent and Powhatan, and Richm
ond, VA
FTE
s 39.5 incl. 19.5 local, 8 federal grant and 12 Intra-D
istrict funded
273 FTEs incl. 153 (full-tim
e) and 178 (part-tim
e) N
OT A
VA
ILAB
LE N
OT A
VA
ILAB
LE N
OT A
VA
ILAB
LE
Budget
$23,934,499 (FY 2011) $17,660,598 (FY
2011) N
OT A
VA
ILAB
LE N
OT A
VA
ILAB
LE $6,037,188
Age of Seniors
60+ 60+
60+ 60+
55+ Population
601,723 (2010) 805,029 (2010)
920,581(2010) 1,163,414 Franklin (2010)
1,002,156 (2010) Senior Population
98,512 (2010) 140,313 (2000) 160,671 (2005)(55+)
NO
T AV
AILA
BLE
171,644 (Ages 60+)
Lead A
gency Y
Y
N
Y
Y
SE
RV
ICE
S
Transportation
Wellness C
enters
Adult D
ay Care
Alzheim
er's Services
C
aregiver Support
Case M
anagement
Counseling
Em
ergency Shelter
Em
ployment
Group H
omes
G
roup Mid-D
ay Meals
Health Insurance C
ounseling
Hom
e Delivered M
eals
In-Hom
e Support
L
egal Services
Long-T
erm C
are Om
budsman
M
ultipurpose Senior Centers
N
ursing Hom
es
Nutrition C
ounseling
A
DR
C-O
ne-Stop Resource
Center
Recreation and Socialization
R
espite Aid Services
Senior Needs Assessment 51
Best Practices
A comprehensive review of best practices in government sponsored or operated senior
programs shows a variety of programs DCOA may consider as it seeks to redesign and/or
enhance current programs to address the needs of the changing senior population. Whereas the
peer comparison shows that DCOA already has a wide array of existing programs, DCOA
recognizes that these programs may be improved by adopting some of the best practice standards
being used in other jurisdictions. This section provides a range of best practices across a broad
spectrum of senior services.
Background
This report provides a broad range of affordable and accessible senior program services
that are being successfully implemented across the nation. For most of the programs proposed,
success was a result of cooperation with legislators, government officials, community service
providers, citizen volunteers, and seniors where the appropriate menu of services was identified.
Some of the successful approaches focused on:
Examining senior services program budgets (services that can be paid for now);
Looking at what is a necessary senior service (services that should exist based on community
need);
Examining the wish list (what seniors and community service providers want); and
Determining how the proposed senior service programs rate on a comparative basis (what do
other jurisdictions provide).
In addition to the factors above, some jurisdictions gave great significance to the
comprehensive planning needs for community neighborhoods to facilitate the infrastructure to
provide greater support to the growing needs of seniors.
Senior Needs Assessment 52
Another key element in the community planning process is “walkability.” Walking, like
bike riding, promotes health, but is a more realistic option for seniors. According to the
Maryland Department of Aging (2009), guidelines for walkability include:
Local services and resources within a five-minute walk of residential neighborhoods or
within a five minute walk from public transportation;
Pedestrian-friendly designs, including wide sidewalks on both sides of the street with buffers
between sidewalks, trees to provide shade, and narrower streets to dissuade speeding;
On-street parking allowed; and
Safer street crossings, including curb cuts at cross walks, clear signage at crosswalks for both
pedestrians and motorists, extended times of crossing signals to provide adequate crossing
time, locating crosswalks at intersections with traffic lights, and adequate stop signs.
While best practices among senior services can be categorized by their potential impacts,
their ultimate effect is closely tied to government action or inaction in the areas of health care,
proper nutrition, transportation services, public safety and financial exploitation, housing
availability, employment opportunities for working seniors, civic engagement programs, aging in
place programs, caregivers and respite care options, the incidence of senior domestic abuse, and
overall senior program policy issues.
The National Association of Area Agencies on Aging, [n4a] (2011), highlighted the
results of a survey and noted that, best practices similar to the following can produce positive
outcomes as communities prepare for the projected increases in their aging populations due to
the impacts of baby boomers:
Utilizing “one-stop” senior service information centers as a means of assisting seniors and
others in identifying resources;
Senior Needs Assessment 53
Volunteer programs that can extend the benefits of any senior program effort particularly for
caregivers and respite care;
Identifying and responding to the needs of underserved groups and special populations when
these groups call for different types of approaches or services;
Government action in the areas of favorable zoning changes and tax relief can benefit seniors
as they try to age in place;
Make training resources available to benefit the full range of government agencies and
programs that can be useful to seniors;
Identify and use research programs at universities to develop innovative senior services
programs;
Widely publicize senior services especially utilizing free media such as television, radio,
print, or the internet;
Initiate intergenerational conversations to develop sensitivity among young people for senior
care issues and develop sensitivity among seniors for the issues affecting youth; and
Create innovative transportation programs that benefit seniors.

Senior Needs Assessment 54
Best Practices
One-stop information centers.
Seniors and persons living with disabilities need specialized, quick access to useful
information. The Just1Call program in Mecklenburg County, North Carolina allows seniors and
adults with disabilities to utilize a one-stop information center to access comprehensive
information and assistance, assessment of need, resource coordination, advocacy, linkage to
services and products, and follow-up. Just1Call employs social workers with bachelor’s and
master’s degrees to answer the phones and talk seniors and persons living with disabilities
through the problem-solving process. Just1Call also links senior citizens, persons living with
disabilities, families and caregivers, and service providers to needed services. The extensive
database for this program is jointly maintained by Just1Call and the United Way of Central
Carolinas as part of a public private partnership (Baskins & Eleazer, 2004). Important to note is
DCOA’s Aging and Disability Resource Center (ADRC) that serves as one-stop information
center for seniors and persons living with disabilities.
Volunteer networks.
A new concept for aging communities, the Senior Village model, is an emerging trend in
neighborhoods and communities. Member-based neighborhood networks help seniors remain in
their homes as they age by creating “aging-friendly communities” and overlaying services and
community participation (Cohen, 2011).
Cohen (2011) further explained the village model concept by using a community in the heart of
Boston, Massachusetts as an example.
In the "Beacon Hill Village Model," residents (typically age 50+) live in a community
joined together to form a nonprofit organization providing "concierge services," one-stop
Senior Needs Assessment 55
shopping for transportation, home-care, house maintenance, medical, and care-
management services. Typical membership fees are $500 to $1,000 per person or
household per year, with mature villages offering reduced-fee subsidized memberships
for people who cannot afford the full fees.
Memberships include basic transportation for shopping and excursions, and regular social
events. Additional trips and services are usually offered on a fee-for-service basis, with
membership discounts. Other activities include publishing newsletters and hosting
communal events to create a better sense of community and develop "affinity groups" for
those with shared interests.
Network operators screen service providers, using their leveraged group-buying power to
attain quality service with member discounts.
Underserved and special populations.
Underserved and special populations often have unique needs that require specialized
programs and services to bring them into the continuum of care. Placing homeless seniors into
housing facilities can dramatically lower health care costs for these seniors. It was reported that
seniors “who have experienced repeated or extended stays of a year or more on the street or in
temporary shelter and have a disability, constitute about 10% of the homeless population and
consume more than half of the homeless resources. Over a five year period, a cohort of 119 street
dwellers accounted for an astounding 18,384 emergency room visits and 871 medical
hospitalizations. The average annual health care cost for individuals living on the street was
$28,436 compared to $6,056 for individuals in the cohort who obtained housing” (Massachusetts
Housing and Shelter Alliance, 2010, p. 2).

Senior Needs Assessment 56
Zoning and tax relief for “aging in place.”
n4a (2011) stated that communities and governments should assist seniors through the
provision of tax assistance and provide relief to those in most financial need. MetLife cited New
London, Connecticut for providing property tax relief, through a privately funded entity, to a
selected group of senior women who met the established guidelines as well as providing
assistance for seniors in completing their tax forms. In addition, a referral and assistance program
operated by a senior citizens center assisted seniors with applying for rent and utility bill
assistance. Other local government taxation and finance programs offered reduced and waived
sanitation and sewer fees, housing tax credits, tax work-off programs for senior volunteers, and a
financial exploitation team.
In another example from n4a (2011), the suburban community of Stratham, New
Hampshire developed an overlay zone called Affordable Senior Housing. This allows seniors in
certain areas of town to downsize their residence and stay within their community. Developers of
these new sites must provide legal assurance that the new properties will be affordable. The
community also defines “elderly affordable” in the Multi-Family Housing section of its zoning
code.
Fort Collins, Colorado offered a senior tax work-off program that gave seniors the
opportunity to work on tasks specified by city and county agencies allowing seniors to have all
or part of their property tax liability eliminated. While the initial tasks were mostly clerical
duties, the program grew to include highly professional tasks as well. Participants are also able to
earn credit for his or her taxes at the minimum wage rate and can earn as much as the tax liability
in the county program (U.S. Department of Health and Human Services, 1987).
Senior Needs Assessment 57
Training programs.
Special effort is needed to help seniors continue to drive safely. n4a (2011) reported that
to maintain driver safety, communities should offer driving assessments and training to help
older adults remain on the road as safely as possible.
It is also important for local jurisdictions to appropriately train police, fire, Emergency
Medical Services (EMS) personnel to serve seniors and persons living with disabilities. Public
safety personnel and first responders should be trained to properly address the specialized needs
of older adults and ensure that those needs are met in community disaster plans.
As reported at the South Carolina Best Practices Conference, collaboration between
hospitals and universities can be used to educate county and nearby residents on successful aging
using a three part program. Beginning with part one, hospital and medical staff are educated on
geriatric topics allowing staff to earn certificates for completing the 11-session program. In part
two, seniors are educated during retreats and sessions on how to age successfully. Lastly in part
three of the programs, working professionals are offered an opportunity to obtain a Gerontology
Certificate or a master’s degree in Health Sciences with a major in gerontology where students
design a research project that can be implemented in the community. A key element of the
program is a weekly radio show that provides useful information on successful aging and
community information sessions and additional resources (Baskins & Eleazer, 2004).
Publicity and outreach efforts.
In looking to provide better outreach to seniors, seniors themselves can also be used to
provide community outreach services. In Omaha, Nebraska senior volunteers were trained to
provide outreach services with service and referral information on aging services that were
available. These seniors lived in the neighborhood where they volunteered and knew their

Senior Needs Assessment 58
neighbors. They visited other homebound seniors in their homes and received a much better
reception than a government official. Churches, local senior clubs and the media were the
primary sources of recruitment for the program (U.S. Department of Health and Human Services,
1987).
Intergenerational programs.
Providing opportunities for intergenerational partnerships can benefit both the seniors and
the students. In South Carolina, programs match freshman medical students with a healthy
community senior for experience using modules and geriatric assessments. This approach
allowed the medical student to develop a healthy attitude about caring for seniors and gain useful
community and social knowledge. These encounters may also encourage the student to focus
their studies on gerontology and geriatric care thus enhancing the network of physicians that
specialize in caring for senior patients (Baskins & Eleazer, 2004).
The Maryland Department of Aging (2009), reported adults 55 and older helped improve
the educational outcomes for children in grades K-3 by spending a minimum of 15 hours a week
working under the direction of classroom teachers during the school year. Fifteen to 20 adults
were placed in each school and focused on subjects including reading, writing, language, and
math. In addition, the older adult may help with library use, behavior, health promotion,
improving student attendance, and parental involvement. This program’s impact on its senior
participants was evaluated in a Washington University Center for Social Development study
which found that the program helped the mental and physical health and functions of the seniors
involved when compared to similar non-participating seniors.
Senior Needs Assessment 59
Health.
Access to affordable health care and preventive health care are key issues for seniors. If
both affordable health care and preventive services are widely provided, the potential limitations
that seniors face in conducting ADLs can be minimized. In Danville, Virginia volunteers and
partnerships have helped the city routinely conduct health screenings at 23 separate locations
including restaurants, grocery stores, shopping malls, and pharmacies. A schedule of screenings
is published by the city and the city provides for residents to receive screenings such as blood
pressure, body mass index (BMI) and referrals. Other cities provide mobile and stationary
screenings for foot care, eye care, comprehensive wellness, and hearing (n4a, 2011).
In Florida, a program entitled Senior Centers on the Move! provides healthy living fairs
hosted by senior centers in conjunction with local businesses and health care providers. These
fairs focus on concerns about depression among seniors, bone density, blood pressure, and
oxygen level. Flu shots were also provided (Department of Elder Affairs, State of Florida 2006).
Transportation.
The Independent Transportation Network (ITN) is a non-profit based community that
provides paid and unpaid volunteers to drive seniors to their destinations; as well as 24-hour
access to transportation services. Eligible seniors include those over age 65 and visually
disabled, who cannot drive themselves. The community is funded by AARP, the Transportation
Research Board, the Federal Transit Administration, the National Highway Traffic Safety
Administration, and other donors. A necessary component of the program involves shared rides
and advance planning (Baskins & Eleazer, 2004).
Senior Needs Assessment 60
Needs Assessment Findings
Overview
As the demographics of seniors, persons living with disabilities, and caregivers change in
both the U.S. and the District of Columbia, the particular needs of these groups will have to be
addressed. These populations have different health concerns that vary based on age,
race/ethnicity, income, and other demographic characteristics. Discussions with service
providers, focus groups, as well as surveys within the community shed light on a number of
issues that seniors now face and will be facing in the future. The key findings and issues of
concern that arose from the assessment activities were focused on the following focus areas:
Wellness and quality;
Safety;
Socialization and recreation;
Case management and option counseling;
Health and mental health;
Home health/in-home support;
Nutrition;
Food security;
Home delivered and congregate meals;
Transportation;
Employment;
Caregiving and respite;
Medicaid/Medicare;
Assisted living and housing placement; and
Legal services.

Senior Needs Assessment 61
Findings for each of these focus areas are discussed in the following section, where
applicable.
Senior Needs Assessment 62
The Challenges of Everyday Life for Older Adults
Wellness and quality of life.
Definition and importance.
The DCOA provides a variety of programs that target the health and wellness of seniors
and persons living with a disability. Wellness education programs include nutrition classes,
exercise, smoking cessation and other auxiliary activities and are held at wellness centers across
the District of Columbia. These programs offer seniors the opportunity to be healthy and engage
in building and maintaining relationships. DCOA wellness program activities promote good
health habits, enhance the overall wellbeing of targeted populations, help create informed health
consumers, and help to prevent unnecessary and costly medical encounters for seniors as well as
persons living with a disability.
Descriptive discussion of focus area.
Focus group participants voiced a number of concerns regarding the issues impacting the
quality of life and wellness of seniors. According to participants in all focus groups, many
seniors need help performing everyday activities to allow them to remain in their homes.
Participants reported the need for assistance with ADLs such as bathing, getting dressed, cooking
meals and administration of medications. Other activities requiring assistance included
housekeeping, shopping, transportation, and companionship. Activities mentioned most often
were: housekeeping, shopping, and administration of medications. The LGBT, Hispanic or
Latino, Asian, and persons living with disabilities focus group participants also reported similar
issues.
In addition, the majority of participants stated that their health care needs are not being
met. Participants cited there is a lack of programs to address loneliness and depression,
Senior Needs Assessment 63
transportation, and health care. Issues related to health care, mental health, and transportation
will be discussed in more detail throughout the needs assessment findings section of this report.
Also mentioned was the unfriendly or unwelcoming atmosphere at the wellness centers,
especially for the LGBT community. In addition, it was noted that it is difficult to get needed
information, and the hours of operation are not conducive for working seniors. The Hispanic or
Latino, Asian, and persons living with disabilities focus group participants did not cite any
specific issues pertaining to the District of Columbia’s wellness centers.
Focus group participants made the following recommendations to improve the quality of
life for seniors:
DCOA should create more programs and recreational activities.
DCOA should extend the hours of operation at the wellness centers so that working seniors
have the opportunity to utilize them.
DCOA should open up wellness centers in every ward.
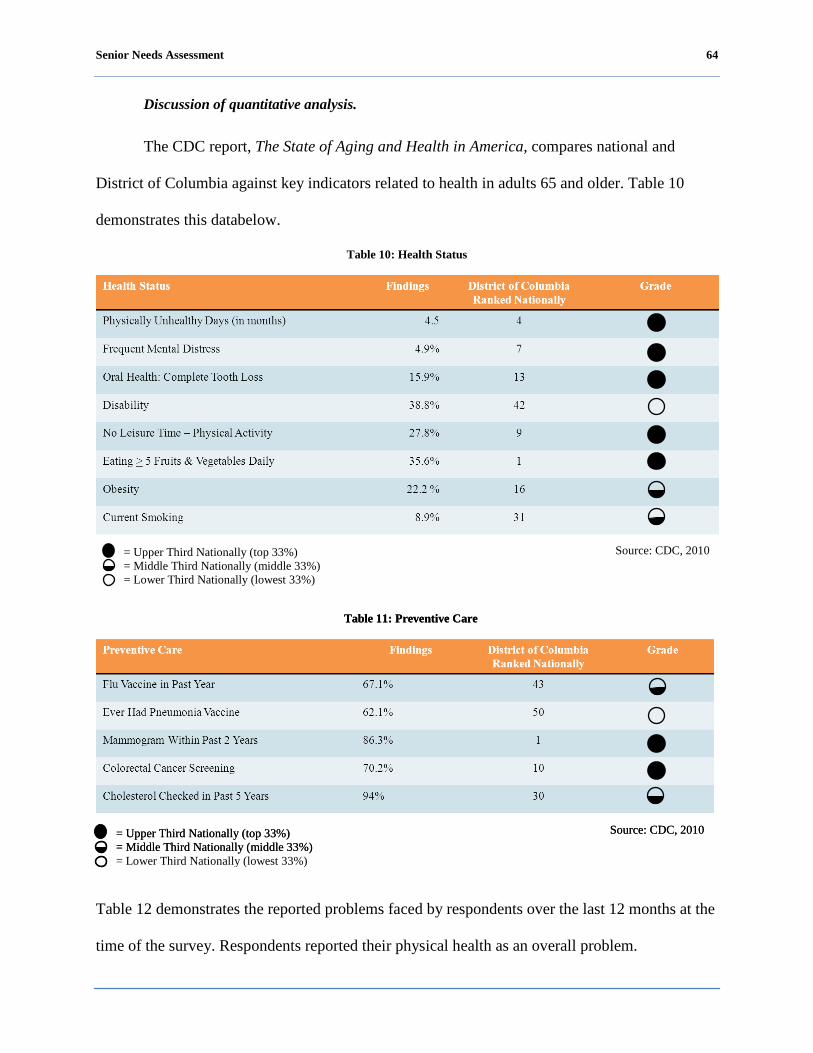
Senior Needs Assessment 64
Discussion of quantitative analysis.
The CDC report, The State of Aging and Health in America, compares national and
District of Columbia against key indicators related to health in adults 65 and older. Table 10
demonstrates this databelow.
Table 10: Health Status
Table 11: Preventive Care
Table 12 demonstrates the reported problems faced by respondents over the last 12 months at the
time of the survey. Respondents reported their physical health as an overall problem.
= Upper Third Nationally (top 33%) = Middle Third Nationally (middle 33%) = Lower Third Nationally (lowest 33%)
Source: CDC, 2010
= Upper Third Nationally (top 33%) = Middle Third Nationally (middle 33%) = Lower Third Nationally (lowest 33%)
Source: CDC, 2010
Table 11: Preventive Care
= Upper Third Nationally (top 33%) = Middle Third Nationally (middle 33%)
Source: CDC, 2010

Senior Needs Assessment 65
Table 12: Problems Faced by Respondents
Over the last 12 months, have you had a problem with any of the following? If so, how would you describe the problem?
Major Problem
Minor Problem
No Problem
Don't know/NA
Your physical health 20.14% 34.56% 35.43% 9.87%
Housing that meets your needs 6.59% 9.01% 67.83% 16.57%
Getting the healthcare you need 5.43% 8.43% 70.83% 15.31%
Having inadequate transportation 7.27% 11.45% 66.44% 14.84%
Feeling lonely, sad or isolated 4.55% 12.69% 67.54% 15.21%
Affording your utilities 7.95% 11.15% 65.86% 15.03%
Affording the medication you need 5.43% 10.86% 68.96% 14.74%
Having financial problems 10.76% 18.99% 56.40% 13.86%
Being a victim of crime 2.52% 3.78% 76.74% 16.96%
Dealing with legal issues 4.36% 8.44% 70.42% 16.78%
Performing everyday activities such as walking or bathing 5.53% 14.85% 67.18% 12.43%
Having too few activities or feeling bored 4.76% 14.27% 66.12% 14.85%
Providing care for another person 3.60% 5.16% 67.70% 23.54%
In Table 13, the responses to the problems seniors face were compared to respondent
characteristics: ward, age, gender, race/ethnicity and level of income. Key findings include:
Wards 1 and 3 reported the lowest incidence of problems overall and Ward 7 reported the
highest incidence of problems.
Among age groups, persons living with disabilities ages 18-59 reported having the most
problems in the past 12 months, while those ages 85-94 reported the most problems among
seniors citing physical health as the main problem.
Females tended to cite more problems overall than males.
Overall, Caucasians reported the fewest problems. Among minorities, Native American and
Pacific Islanders reported the highest percentages of problems followed by blacks or African
Americans.
Among income levels, those earning less than $20,000 experienced more problems than those
with higher incomes citing physical health, financial difficulties and performing everyday
Senior Needs Assessment 66
activities as greatest problems. In general, fewer problems were experienced by respondents
with higher incomes.
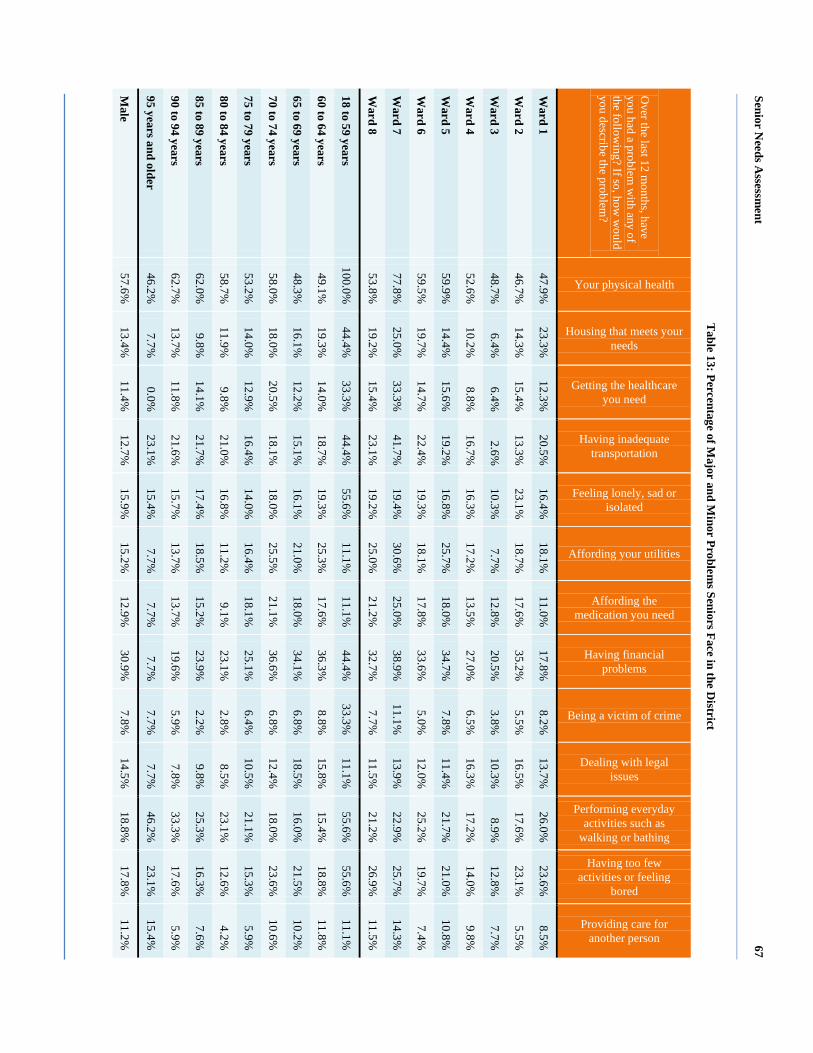
Senior Needs A
ssessment
67
Table 13: Percentage of M
ajor and Minor Problem
s Seniors Face in the District
Over the last 12 m
onths, have you had a problem
with any of
the following? If so, how
would
you describe the problem?
Your physical health
Housing that meets your needs
Getting the healthcare you need
Having inadequate transportation
Feeling lonely, sad or isolated
Affording your utilities
Affording the medication you need
Having financial problems
Being a victim of crime
Dealing with legal issues
Performing everyday activities such as
walking or bathing
Having too few activities or feeling
bored
Providing care for another person
Ward 1
47.9%
23.3%
12.3%
20.5%
16.4%
18.1%
11.0%
17.8%
8.2%
13.7%
26.0%
23.6%
8.5%
Ward 2
46.7%
14.3%
15.4%
13.3%
23.1%
18.7%
17.6%
35.2%
5.5%
16.5%
17.6%
23.1%
5.5%
Ward 3
48.7%
6.4%
6.4%
2.6%
10.3%
7.7%
12.8%
20.5%
3.8%
10.3%
8.9%
12.8%
7.7%
Ward 4
52.6%
10.2%
8.8%
16.7%
16.3%
17.2%
13.5%
27.0%
6.5%
16.3%
17.2%
14.0%
9.8%
Ward 5
59.9%
14.4%
15.6%
19.2%
16.8%
25.7%
18.0%
34.7%
7.8%
11.4%
21.7%
21.0%
10.8%
Ward 6
59.5%
19.7%
14.7%
22.4%
19.3%
18.1%
17.8%
33.6%
5.0%
12.0%
25.2%
19.7%
7.4%
Ward 7
77.8%
25.0%
33.3%
41.7%
19.4%
30.6%
25.0%
38.9%
11.1%
13.9%
22.9%
25.7%
14.3%
Ward 8
53.8%
19.2%
15.4%
23.1%
19.2%
25.0%
21.2%
32.7%
7.7%
11.5%
21.2%
26.9%
11.5%
18 to 59 years 100.0%
44.4%
33.3%
44.4%
55.6%
11.1%
11.1%
44.4%
33.3%
11.1%
55.6%
55.6%
11.1%
60 to 64 years 49.1%
19.3%
14.0%
18.7%
19.3%
25.3%
17.6%
36.3%
8.8%
15.8%
15.4%
18.8%
11.8%
65 to 69 years 48.3%
16.1%
12.2%
15.1%
16.1%
21.0%
18.0%
34.1%
6.8%
18.5%
16.0%
21.5%
10.2%
70 to 74 years 58.0%
18.0%
20.5%
18.1%
18.0%
25.5%
21.1%
36.6%
6.8%
12.4%
18.0%
23.6%
10.6%
75 to 79 years 53.2%
14.0%
12.9%
16.4%
14.0%
16.4%
18.1%
25.1%
6.4%
10.5%
21.1%
15.3%
5.9%
80 to 84 years 58.7%
11.9%
9.8%
21.0%
16.8%
11.2%
9.1%
23.1%
2.8%
8.5%
23.1%
12.6%
4.2%
85 to 89 years 62.0%
9.8%
14.1%
21.7%
17.4%
18.5%
15.2%
23.9%
2.2%
9.8%
25.3%
16.3%
7.6%
90 to 94 years 62.7%
13.7%
11.8%
21.6%
15.7%
13.7%
13.7%
19.6%
5.9%
7.8%
33.3%
17.6%
5.9%
95 years and older 46.2%
7.7%
0.0%
23.1%
15.4%
7.7%
7.7%
7.7%
7.7%
7.7%
46.2%
23.1%
15.4%
Male
57.6%
13.4%
11.4%
12.7%
15.9%
15.2%
12.9%
30.9%
7.8%
14.5%
18.8%
17.8%
11.2%
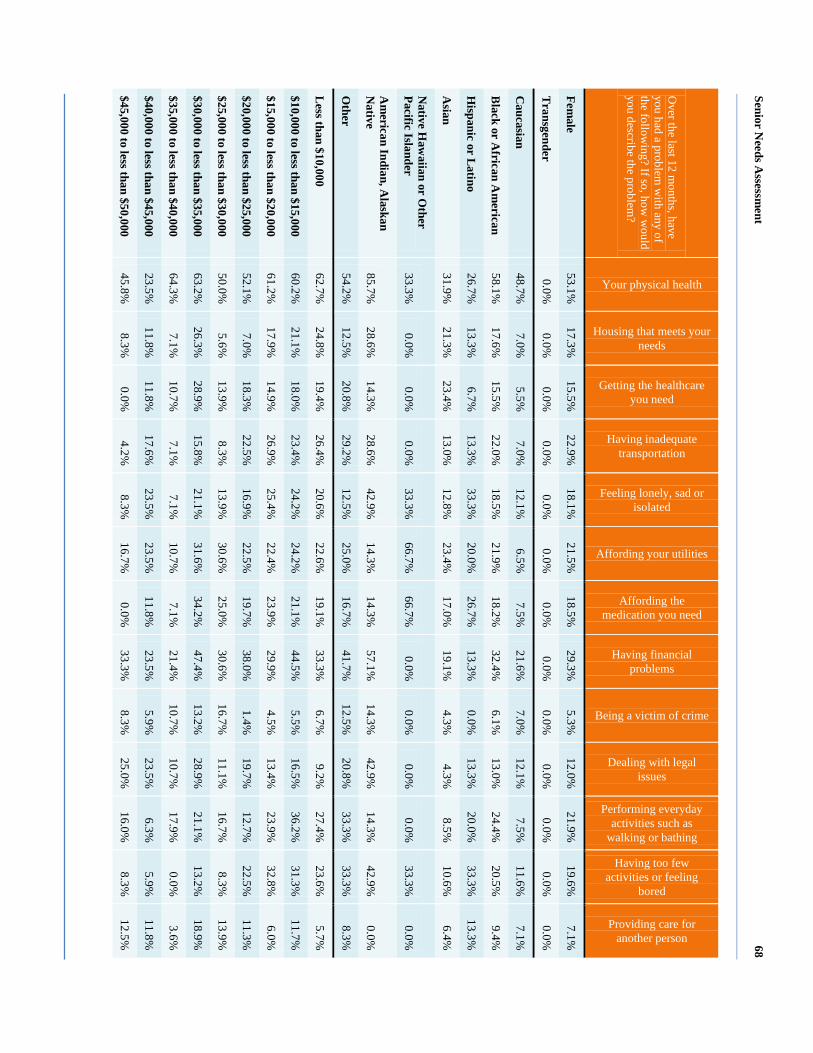
Senior Needs A
ssessment
68
Over the last 12 m
onths, have you had a problem
with any of
the following? If so, how
would
you describe the problem?
Your physical health
Housing that meets your needs
Getting the healthcare you need
Having inadequate transportation
Feeling lonely, sad or isolated
Affording your utilities
Affording the medication you need
Having financial problems
Being a victim of crime
Dealing with legal issues
Performing everyday activities such as
walking or bathing
Having too few activities or feeling
bored
Providing care for another person
Female
53.1%
17.3%
15.5%
22.9%
18.1%
21.5%
18.5%
29.3%
5.3%
12.0%
21.9%
19.6%
7.1%
Transgender
0.0%
0.0%
0.0%
0.0%
0.0%
0.0%
0.0%
0.0%
0.0%
0.0%
0.0%
0.0%
0.0%
Caucasian
48.7%
7.0%
5.5%
7.0%
12.1%
6.5%
7.5%
21.6%
7.0%
12.1%
7.5%
11.6%
7.1%
Black or A
frican Am
erican 58.1%
17.6%
15.5%
22.0%
18.5%
21.9%
18.2%
32.4%
6.1%
13.0%
24.4%
20.5%
9.4%
Hispanic or L
atino 26.7%
13.3%
6.7%
13.3%
33.3%
20.0%
26.7%
13.3%
0.0%
13.3%
20.0%
33.3%
13.3%
Asian
31.9%
21.3%
23.4%
13.0%
12.8%
23.4%
17.0%
19.1%
4.3%
4.3%
8.5%
10.6%
6.4%
Native H
awaiian or O
ther Pacific Islander
33.3%
0.0%
0.0%
0.0%
33.3%
66.7%
66.7%
0.0%
0.0%
0.0%
0.0%
33.3%
0.0%
Am
erican Indian, Alaskan
Native
85.7%
28.6%
14.3%
28.6%
42.9%
14.3%
14.3%
57.1%
14.3%
42.9%
14.3%
42.9%
0.0%
Other
54.2%
12.5%
20.8%
29.2%
12.5%
25.0%
16.7%
41.7%
12.5%
20.8%
33.3%
33.3%
8.3%
Less than $10,000
62.7%
24.8%
19.4%
26.4%
20.6%
22.6%
19.1%
33.3%
6.7%
9.2%
27.4%
23.6%
5.7%
$10,000 to less than $15,000 60.2%
21.1%
18.0%
23.4%
24.2%
24.2%
21.1%
44.5%
5.5%
16.5%
36.2%
31.3%
11.7%
$15,000 to less than $20,000 61.2%
17.9%
14.9%
26.9%
25.4%
22.4%
23.9%
29.9%
4.5%
13.4%
23.9%
32.8%
6.0%
$20,000 to less than $25,000 52.1%
7.0%
18.3%
22.5%
16.9%
22.5%
19.7%
38.0%
1.4%
19.7%
12.7%
22.5%
11.3%
$25,000 to less than $30,000 50.0%
5.6%
13.9%
8.3%
13.9%
30.6%
25.0%
30.6%
16.7%
11.1%
16.7%
8.3%
13.9%
$30,000 to less than $35,000 63.2%
26.3%
28.9%
15.8%
21.1%
31.6%
34.2%
47.4%
13.2%
28.9%
21.1%
13.2%
18.9%
$35,000 to less than $40,000 64.3%
7.1%
10.7%
7.1%
7.1%
10.7%
7.1%
21.4%
10.7%
10.7%
17.9%
0.0%
3.6%
$40,000 to less than $45,000 23.5%
11.8%
11.8%
17.6%
23.5%
23.5%
11.8%
23.5%
5.9%
23.5%
6.3%
5.9%
11.8%
$45,000 to less than $50,000 45.8%
8.3%
0.0%
4.2%
8.3%
16.7%
0.0%
33.3%
8.3%
25.0%
16.0%
8.3%
12.5%
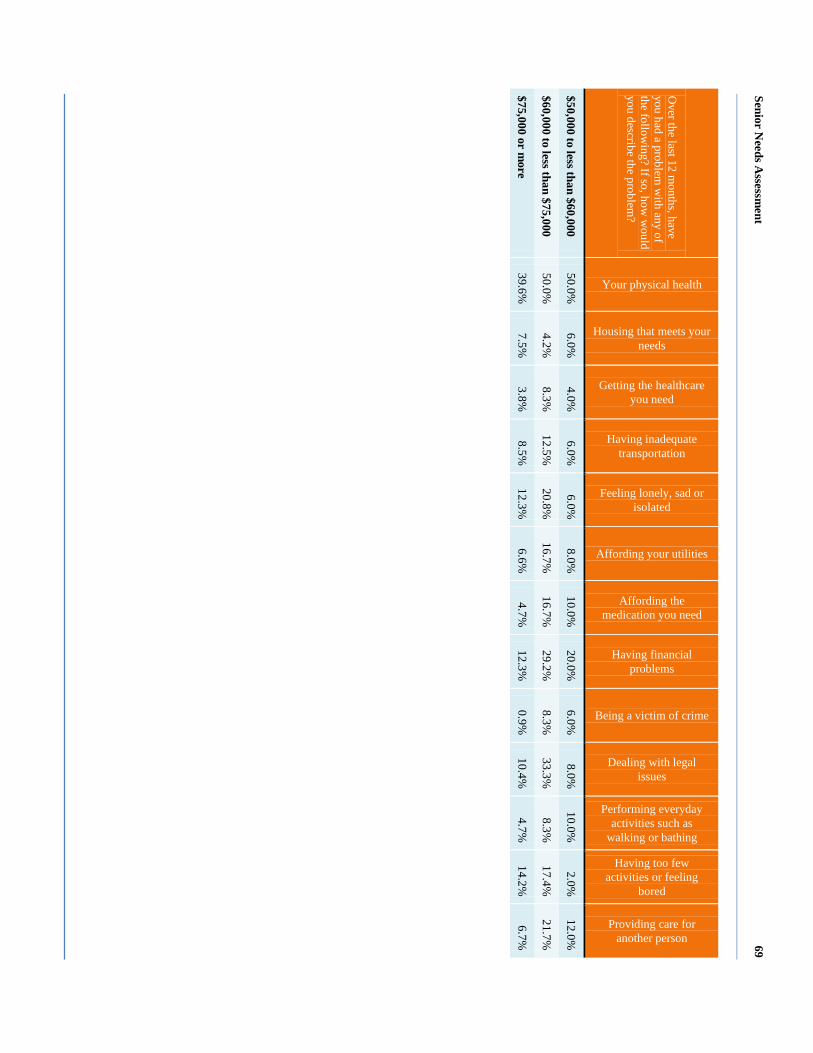
Senior Needs A
ssessment
69
Over the last 12 m
onths, have you had a problem
with any of
the following? If so, how
would
you describe the problem?
Your physical health
Housing that meets your needs
Getting the healthcare you need
Having inadequate transportation
Feeling lonely, sad or isolated
Affording your utilities
Affording the medication you need
Having financial problems
Being a victim of crime
Dealing with legal issues
Performing everyday activities such as
walking or bathing
Having too few activities or feeling
bored
Providing care for another person
$50,000 to less than $60,000 50.0%
6.0%
4.0%
6.0%
6.0%
8.0%
10.0%
20.0%
6.0%
8.0%
10.0%
2.0%
12.0%
$60,000 to less than $75,000 50.0%
4.2%
8.3%
12.5%
20.8%
16.7%
16.7%
29.2%
8.3%
33.3%
8.3%
17.4%
21.7%
$75,000 or more
39.6%
7.5%
3.8%
8.5%
12.3%
6.6%
4.7%
12.3%
0.9%
10.4%
4.7%
14.2%
6.7%

Senior Needs Assessment 70
In Table 14 below, survey respondents were asked to report extended periods of illness
within the past year. The results showed the following:
Respondents residing in Ward 1 reported the most extended periods of illness.
Persons living with disabilities ages 18-59 as well as seniors ages 90-94 also reported the
most extended periods of illness.
Males and females reported nearly equal periods or extended illness.
Table 14: Reported Illness
Over the last 12 months, have you been ill for a period of one month or more? Yes No
Ward 1 40.0% 60.0%
Ward 2 24.4% 75.6%
Ward 3 22.2% 77.8%
Ward 4 35.9% 64.1%
Ward 5 14.0% 86.0%
Ward 6 33.3% 66.7%
Ward 7 28.0% 72.0%
Ward 8 11.4% 88.6%
18 to 59 years 50.0% 50.0%
60 to 64 years 36.6% 63.4%
65 to 69 years 18.1% 81.9%
70 to 74 years 31.9% 68.1%
75 to 79 years 25.0% 75.0%
80 to 84 years 30.4% 69.6%
85 to 89 years 18.2% 81.8%
90 to 94 years 40.0% 60.0%
95 years and older 0.0% 100.0%
Male 28.0% 72.0%
Female 27.5% 72.5%
Transgender 0.0% 0.0%
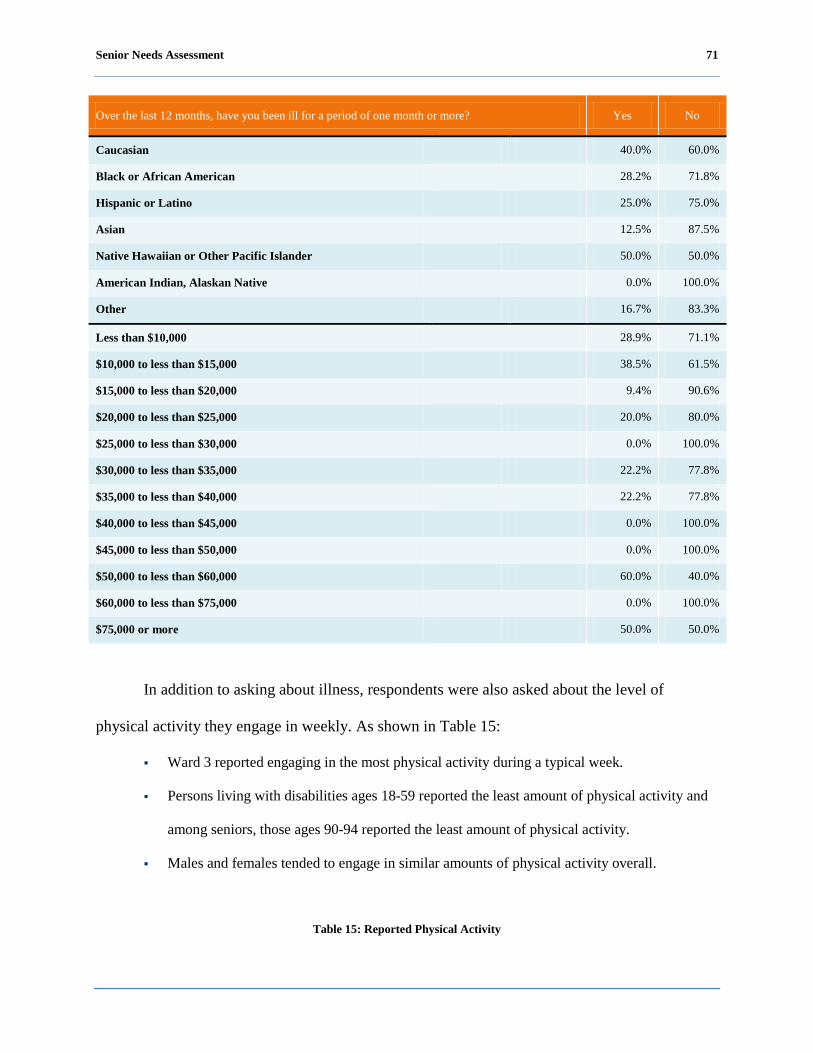
Senior Needs Assessment 71
Over the last 12 months, have you been ill for a period of one month or more? Yes No
Caucasian 40.0% 60.0%
Black or African American 28.2% 71.8%
Hispanic or Latino 25.0% 75.0%
Asian 12.5% 87.5%
Native Hawaiian or Other Pacific Islander 50.0% 50.0%
American Indian, Alaskan Native 0.0% 100.0%
Other 16.7% 83.3%
Less than $10,000 28.9% 71.1%
$10,000 to less than $15,000 38.5% 61.5%
$15,000 to less than $20,000 9.4% 90.6%
$20,000 to less than $25,000 20.0% 80.0%
$25,000 to less than $30,000 0.0% 100.0%
$30,000 to less than $35,000 22.2% 77.8%
$35,000 to less than $40,000 22.2% 77.8%
$40,000 to less than $45,000 0.0% 100.0%
$45,000 to less than $50,000 0.0% 100.0%
$50,000 to less than $60,000 60.0% 40.0%
$60,000 to less than $75,000 0.0% 100.0%
$75,000 or more 50.0% 50.0%
In addition to asking about illness, respondents were also asked about the level of
physical activity they engage in weekly. As shown in Table 15:
Ward 3 reported engaging in the most physical activity during a typical week.
Persons living with disabilities ages 18-59 reported the least amount of physical activity and
among seniors, those ages 90-94 reported the least amount of physical activity.
Males and females tended to engage in similar amounts of physical activity overall.
Table 15: Reported Physical Activity

Senior Needs Assessment 72
How many days per week do you engage in moderate physical activity for at least 30 minutes a day? Zero days 1-2 days 3-5 days 6 days or
more Don’t
know/NA
Ward 1 40.0% 5.0% 30.0% 20.0% 5.0%
Ward 2 6.1% 24.5% 30.6% 26.5% 12.2%
Ward 3 0.0% 26.3% 52.6% 21.1% 0.0%
Ward 4 15.9% 25.0% 45.5% 9.1% 4.5%
Ward 5 11.6% 16.3% 46.5% 18.6% 7.0%
Ward 6 21.4% 40.7% 28.6% 7.1% 2.1%
Ward 7 24.0% 20.0% 36.0% 16.0% 4.0%
Ward 8 0.0% 25.7% 60.0% 8.6% 5.7%
18 to 59 years 62.5% 12.5% 12.5% 0.0% 12.5%
60 to 64 years 4.8% 31.0% 40.5% 16.7% 7.1%
65 to 69 years 16.4% 26.0% 39.7% 13.7% 4.1%
70 to 74 years 12.5% 29.2% 43.1% 9.7% 5.6%
75 to 79 years 14.1% 32.9% 34.1% 11.8% 7.1%
80 to 84 years 16.9% 27.1% 37.3% 16.9% 1.7%
85 to 89 years 17.6% 26.5% 38.2% 14.7% 2.9%
90 to 94 years 18.2% 45.5% 27.3% 9.1% 0.0%
95 years and older 20.0% 20.0% 20.0% 0.0% 40.0%
Male 17.2% 27.0% 36.9% 12.3% 6.6%
Female 14.9% 29.1% 37.5% 13.5% 5.1%
Transgender 0.0% 0.0% 0.0% 0.0% 0.0%
Caucasian 11.5% 30.8% 34.6% 19.2% 3.8%
Black or African American 18.4% 28.3% 38.1% 11.4% 3.8%
Hispanic or Latino 0.0% 60.0% 20.0% 20.0% 0.0%
Asian 2.4% 31.0% 28.6% 19.0% 19.0%
Native Hawaiian or Other Pacific Islander 0.0% 0.0% 50.0% 0.0% 50.0%
American Indian, Alaskan Native 0.0% 0.0% 100.0% 0.0% 0.0%
Other 0.0% 33.3% 44.4% 22.2% 0.0%
Less than $10,000 18.6% 30.9% 33.0% 12.4% 5.2%
$10,000 to less than $15,000 21.2% 30.3% 30.3% 13.6% 4.5%
$15,000 to less than $20,000 9.4% 34.4% 46.9% 6.3% 3.1%
$20,000 to less than $25,000 7.7% 19.2% 42.3% 26.9% 3.8%
$25,000 to less than $30,000 0.0% 0.0% 75.0% 25.0% 0.0%
$30,000 to less than $35,000 33.3% 22.2% 33.3% 11.1% 0.0%

Senior Needs Assessment 73
How many days per week do you engage in moderate physical activity for at least 30 minutes a day? Zero days 1-2 days 3-5 days 6 days or
more Don’t
know/NA
$35,000 to less than $40,000 0.0% 20.0% 40.0% 30.0% 10.0%
$40,000 to less than $45,000 0.0% 33.3% 66.7% 0.0% 0.0%
$45,000 to less than $50,000 0.0% 50.0% 50.0% 0.0% 0.0%
$50,000 to less than $60,000 0.0% 16.7% 83.3% 0.0% 0.0%
$60,000 to less than $75,000 0.0% 50.0% 0.0% 50.0% 0.0%
$75,000 or more 0.0% 0.0% 100.0% 0.0% 0.0%
In Figure 13, most respondents take part in some moderate physical activity with 79%
reporting they engage in moderate physical activity at least one day a week.
Figure 13: Physical Activity
Additionally, respondents were asked to report physical or mental challenges or problems
they are currently facing. Table 16 shows the respondents’ responses. Across all wards, arthritis
and high blood pressure were the conditions most frequently reported. Results were similar
across all age groups, genders, race/ethnic groups and levels of income.
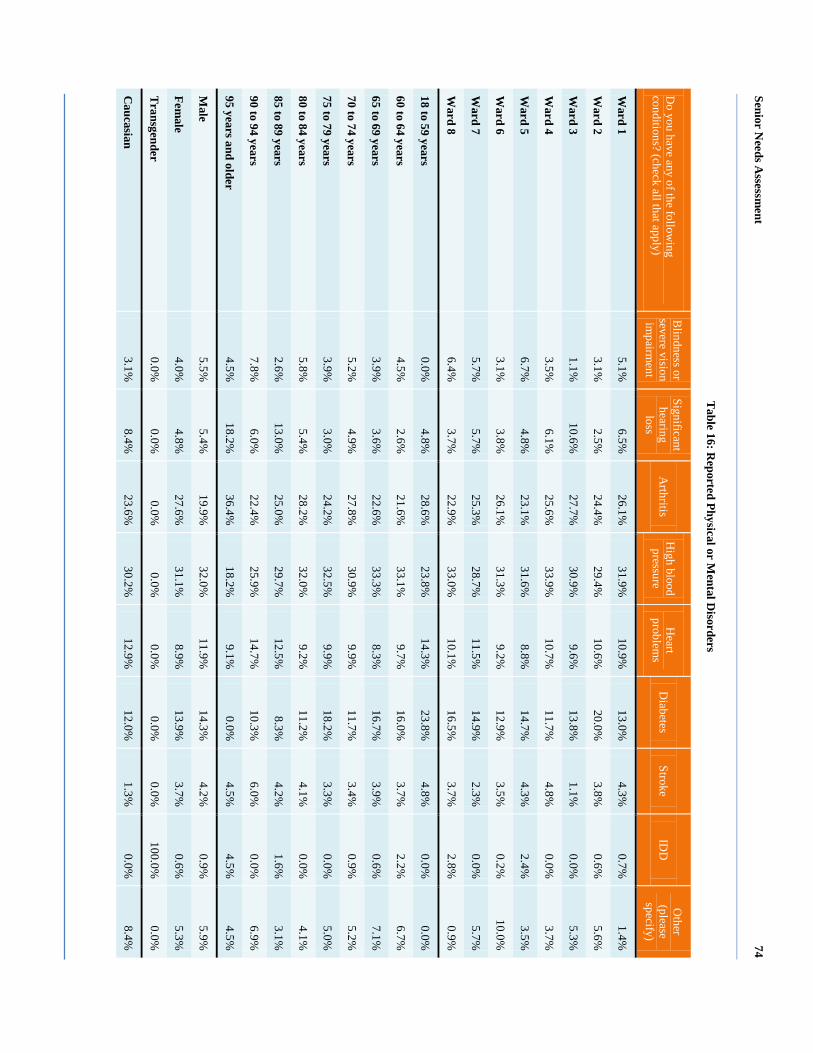
Senior Needs A
ssessment
74
Table 16: R
eported Physical or Mental D
isorders
Do you have any of the follow
ing conditions? (check all that apply)
Blindness or
severe vision im
pairment
Significant hearing
loss A
rthritis H
igh blood pressure
Heart
problems
Diabetes
Stroke ID
D
Other
(please specify)
Ward 1
5.1%
6.5%
26.1%
31.9%
10.9%
13.0%
4.3%
0.7%
1.4%
Ward 2
3.1%
2.5%
24.4%
29.4%
10.6%
20.0%
3.8%
0.6%
5.6%
Ward 3
1.1%
10.6%
27.7%
30.9%
9.6%
13.8%
1.1%
0.0%
5.3%
Ward 4
3.5%
6.1%
25.6%
33.9%
10.7%
11.7%
4.8%
0.0%
3.7%
Ward 5
6.7%
4.8%
23.1%
31.6%
8.8%
14.7%
4.3%
2.4%
3.5%
Ward 6
3.1%
3.8%
26.1%
31.3%
9.2%
12.9%
3.5%
0.2%
10.0%
Ward 7
5.7%
5.7%
25.3%
28.7%
11.5%
14.9%
2.3%
0.0%
5.7%
Ward 8
6.4%
3.7%
22.9%
33.0%
10.1%
16.5%
3.7%
2.8%
0.9%
18 to 59 years 0.0%
4.8%
28.6%
23.8%
14.3%
23.8%
4.8%
0.0%
0.0%
60 to 64 years 4.5%
2.6%
21.6%
33.1%
9.7%
16.0%
3.7%
2.2%
6.7%
65 to 69 years 3.9%
3.6%
22.6%
33.3%
8.3%
16.7%
3.9%
0.6%
7.1%
70 to 74 years 5.2%
4.9%
27.8%
30.9%
9.9%
11.7%
3.4%
0.9%
5.2%
75 to 79 years 3.9%
3.0%
24.2%
32.5%
9.9%
18.2%
3.3%
0.0%
5.0%
80 to 84 years 5.8%
5.4%
28.2%
32.0%
9.2%
11.2%
4.1%
0.0%
4.1%
85 to 89 years 2.6%
13.0%
25.0%
29.7%
12.5%
8.3%
4.2%
1.6%
3.1%
90 to 94 years 7.8%
6.0%
22.4%
25.9%
14.7%
10.3%
6.0%
0.0%
6.9%
95 years and older 4.5%
18.2%
36.4%
18.2%
9.1%
0.0%
4.5%
4.5%
4.5%
Male
5.5%
5.4%
19.9%
32.0%
11.9%
14.3%
4.2%
0.9%
5.9%
Female
4.0%
4.8%
27.6%
31.1%
8.9%
13.9%
3.7%
0.6%
5.3%
Transgender
0.0%
0.0%
0.0%
0.0%
0.0%
0.0%
0.0%
100.0%
0.0%
Caucasian
3.1%
8.4%
23.6%
30.2%
12.9%
12.0%
1.3%
0.0%
8.4%

Senior Needs A
ssessment
75
Do you have any of the follow
ing conditions? (check all that apply)
Blindness or
severe vision im
pairment
Significant hearing
loss A
rthritis H
igh blood pressure
Heart
problems
Diabetes
Stroke ID
D
Other
(please specify)
Black or A
frican Am
erican 4.7%
4.8%
24.6%
31.9%
9.5%
14.1%
4.4%
0.8%
5.1%
Hispanic or L
atino 0.0%
4.5%
40.9%
18.2%
4.5%
27.3%
4.5%
0.0%
0.0%
Asian
5.3%
3.9%
23.7%
27.6%
13.2%
19.7%
1.3%
1.3%
3.9%
Native H
awaiian or O
ther Pacific Islander
0.0%
33.3%
0.0%
33.3%
0.0%
0.0%
33.3%
0.0%
0.0%
Am
erican Indian, Alaskan N
ative 0.0%
0.0%
45.5%
36.4%
0.0%
9.1%
0.0%
0.0%
9.1%
Other
4.8%
0.0%
31.0%
31.0%
11.9%
9.5%
0.0%
4.8%
7.1%
Less than $10,000
4.1%
2.9%
24.6%
30.1%
10.3%
14.6%
4.9%
0.9%
7.7%
$10,000 to less than $15,000 5.1%
7.1%
26.0%
30.5%
10.9%
13.2%
2.6%
1.0%
3.5%
$15,000 to less than $20,000 6.1%
5.4%
24.3%
29.1%
8.1%
16.9%
4.7%
0.7%
4.7%
$20,000 to less than $25,000 4.8%
6.2%
23.3%
32.9%
12.3%
11.0%
7.5%
0.7%
1.4%
$25,000 to less than $30,000 4.5%
10.6%
27.3%
30.3%
7.6%
13.6%
1.5%
0.0%
4.5%
$30,000 to less than $35,000 5.1%
6.4%
24.4%
29.5%
10.3%
11.5%
7.7%
0.0%
5.1%
$35,000 to less than $40,000 7.1%
10.7%
21.4%
33.9%
14.3%
8.9%
1.8%
0.0%
1.8%
$40,000 to less than $45,000 4.0%
12.0%
20.0%
32.0%
4.0%
12.0%
4.0%
0.0%
12.0%
$45,000 to less than $50,000 3.7%
3.7%
33.3%
33.3%
7.4%
11.1%
0.0%
0.0%
7.4%
$50,000 to less than $60,000 1.6%
6.3%
28.6%
34.9%
9.5%
15.9%
0.0%
0.0%
3.2%
$60,000 to less than $75,000 0.0%
6.1%
21.2%
33.3%
12.1%
15.2%
3.0%
3.0%
6.1%
$75,000 or more
2.7%
3.6%
22.5%
41.4%
7.2%
15.3%
0.0%
1.8%
5.4%
Senior Needs Assessment 76
Safety.
Definition and importance.
Safety and security for seniors and persons living with disabilities aim to protect these
populations from physical or mental abuse, exploitation, and neglect. Safety concerns are of
importance because of the unnecessary strain that can lead to fearfulness, physical health issues,
and mental health issues such as depression.
Descriptive discussion of focus area.
The majority of focus group participants mentioned that they feel unsafe in their
communities. Some participants cited they do not feel safe walking to convenience stores in their
communities because these stores typically attract crime. The Hispanic or Latino, Asian and
persons living with disabilities echoed the same concern. The LGBT participants mentioned that
they do not feel safe going to the wellness centers for fear of being harassed emotionally as well
as verbally. Additionally, the LGBT participants mentioned that the District of Columbia lacks
safe meeting places for the LGBT community.
Focus group participants made the following recommendations to improve safety for
seniors:
DCOA should collaborate with the Metropolitan Police Department (MPD) to increase police
presence in communities.
The District of Columbia should provide the LGBT community a property in a safe location
so that they can organize themselves.
DCOA should provide cultural sensitivity education to the senior community, possibly at
wellness centers.
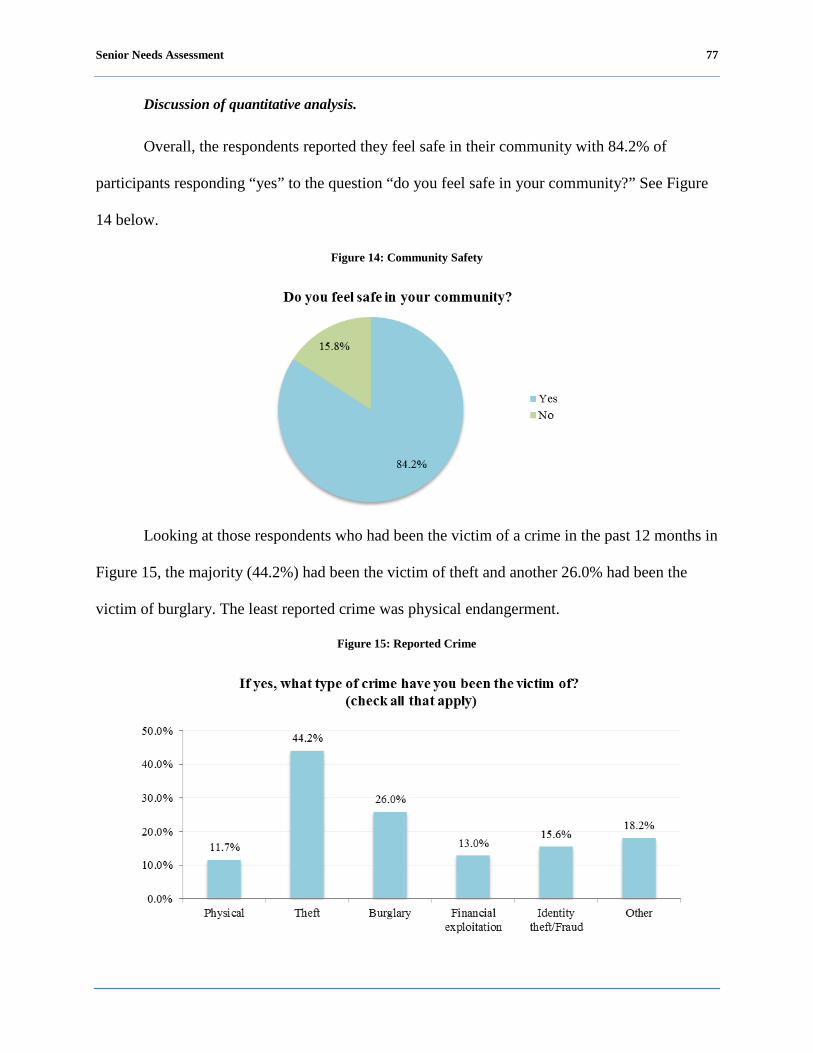
Senior Needs Assessment 77
Discussion of quantitative analysis.
Overall, the respondents reported they feel safe in their community with 84.2% of
participants responding “yes” to the question “do you feel safe in your community?” See Figure
14 below.
Figure 14: Community Safety
Looking at those respondents who had been the victim of a crime in the past 12 months in
Figure 15, the majority (44.2%) had been the victim of theft and another 26.0% had been the
victim of burglary. The least reported crime was physical endangerment.
Figure 15: Reported Crime
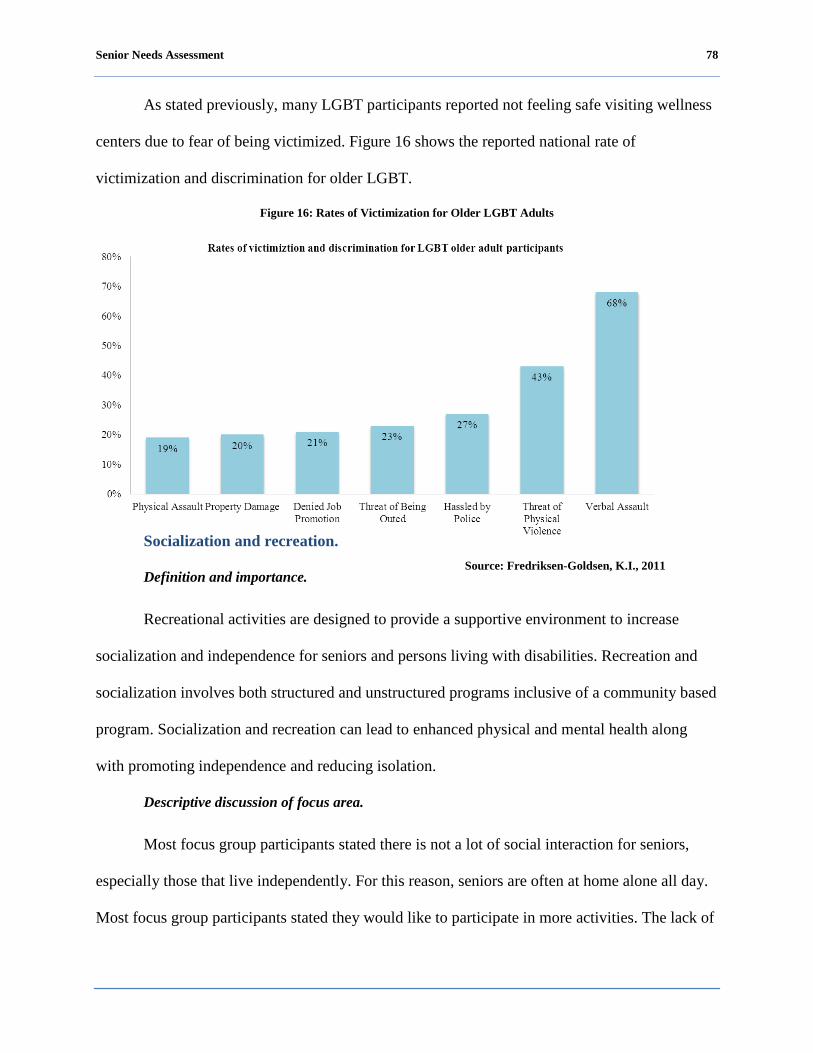
Senior Needs Assessment 78
As stated previously, many LGBT participants reported not feeling safe visiting wellness
centers due to fear of being victimized. Figure 16 shows the reported national rate of
victimization and discrimination for older LGBT.
Figure 16: Rates of Victimization for Older LGBT Adults
Socialization and recreation.
Definition and importance.
Recreational activities are designed to provide a supportive environment to increase
socialization and independence for seniors and persons living with disabilities. Recreation and
socialization involves both structured and unstructured programs inclusive of a community based
program. Socialization and recreation can lead to enhanced physical and mental health along
with promoting independence and reducing isolation.
Descriptive discussion of focus area.
Most focus group participants stated there is not a lot of social interaction for seniors,
especially those that live independently. For this reason, seniors are often at home alone all day.
Most focus group participants stated they would like to participate in more activities. The lack of
Source: Fredriksen-Goldsen, K.I., 2011

Senior Needs Assessment 79
activities was cited by the Hispanic or Latino participants as the leading cause of depression
among seniors. Asian participants noted that there are no facilities that offer activities they like
such as chess, mahjong and playing cards. Persons living with disabilities noted that they would
like to have more exercise programs at senior facilities. The LGBT participants mentioned that
they do not have a safe gathering place for socialization and recreational activities.
Focus group participants made the following recommendations to improve socialization
and recreation life for seniors:
DCOA should make wellness centers accessible for seniors on the weekends.
The directors and managers at the senior facilities in the District of Columbia should contact
the local YMCA and invite them to conduct exercises programs.
Discussion of quantitative analysis.
Socialization and recreation is important to the overall health and well-being of seniors
and the overall health of the community. Socialization and recreation encourages seniors and
persons living with a disability to be active members of the community and provides
opportunities to build networks and support systems. Figure 17 depicts the number of hours in a
typical week respondents spend participating in a variety of social and recreational activities.
Most respondents reported spending a majority of their time visiting family and friends and
participating in senior center activities.
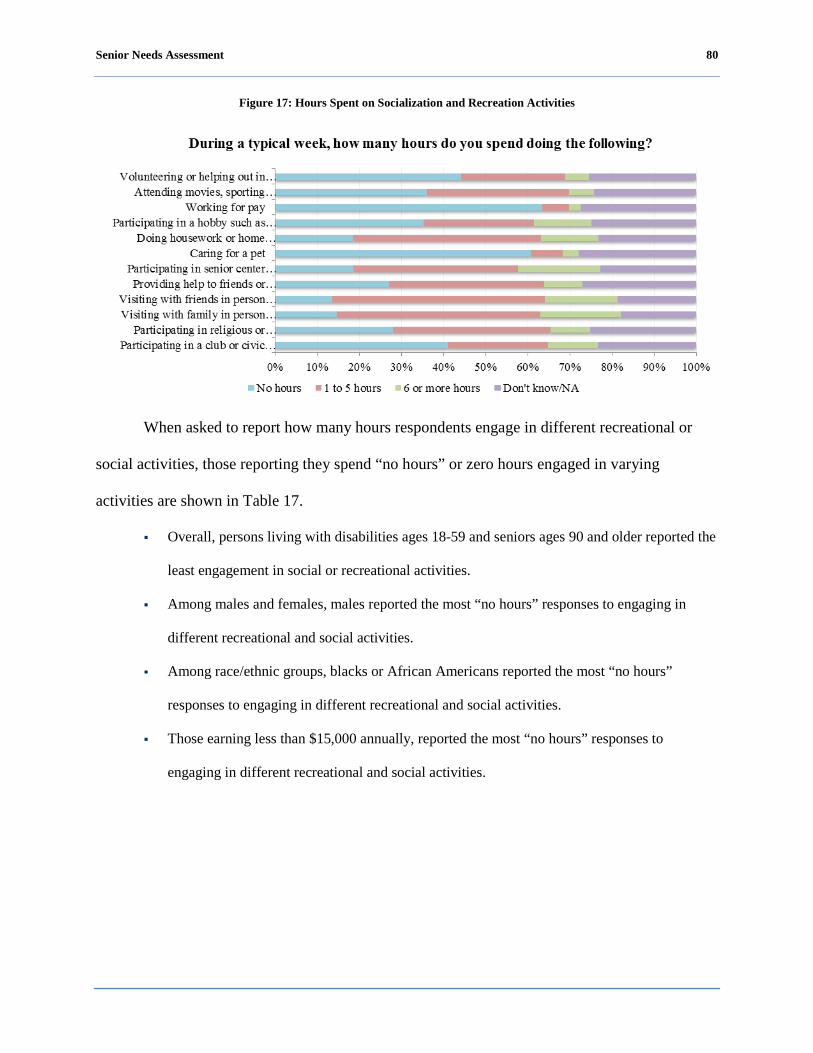
Senior Needs Assessment 80
Figure 17: Hours Spent on Socialization and Recreation Activities
When asked to report how many hours respondents engage in different recreational or
social activities, those reporting they spend “no hours” or zero hours engaged in varying
activities are shown in Table 17.
Overall, persons living with disabilities ages 18-59 and seniors ages 90 and older reported the
least engagement in social or recreational activities.
Among males and females, males reported the most “no hours” responses to engaging in
different recreational and social activities.
Among race/ethnic groups, blacks or African Americans reported the most “no hours”
responses to engaging in different recreational and social activities.
Those earning less than $15,000 annually, reported the most “no hours” responses to
engaging in different recreational and social activities.

Senior Needs A
ssessment
81
Table 17: “N
o Hours” R
eported Participating in Recreation and Social A
ctivities
During a typical w
eek, how m
any hours do you spend doing the follow
ing? (based upon the response “N
o Hours”)
Participating in a club or civic group
Participating in religious or spiritual activities with others
Visiting with family in person or on the phone
Visiting with friends in person or on the phone
Providing help to friends or relatives
Participating in senior center activities
Caring for a pet
Doing housework or home maintenance
Participating in a hobby such as art, gardening or
music
Working for pay
Attending movies, sporting events or
groups events
Volunteering or helping out in the community
Ward 1
60.0%
20.0%
20.0%
30.0%
45.0%
30.0%
60.0%
15.0%
50.0%
70.0%
70.0%
70.0%
Ward 2
40.8%
32.7%
14.3%
4.2%
18.4%
26.5%
36.7%
14.3%
24.5%
40.8%
22.4%
24.5%
Ward 3
20.0%
25.0%
15.0%
10.0%
25.0%
5.0%
40.0%
10.0%
25.0%
50.0%
30.0%
40.0%
Ward 4
22.7%
6.8%
6.8%
2.3%
20.9%
15.9%
54.5%
9.1%
29.5%
52.3%
29.5%
38.6%
Ward 5
31.8%
6.8%
20.5%
20.9%
20.5%
13.6%
65.9%
31.8%
38.6%
68.2%
38.6%
47.7%
Ward 6
55.9%
44.8%
14.7%
16.8%
35.0%
26.6%
73.2%
23.8%
45.5%
78.3%
43.4%
51.0%
Ward 7
56.0%
28.0%
16.0%
25.0%
36.0%
8.3%
76.0%
12.5%
37.5%
75.0%
45.8%
54.2%
Ward 8
28.6%
22.9%
5.7%
5.7%
17.6%
0.0%
71.4%
14.3%
22.9%
65.7%
17.1%
42.9%
18 to 59 years
100.0%
37.5%
37.5%
25.0%
62.5%
50.0%
37.5%
12.5%
62.5%
100.0%
75.0%
100.0%
60 to 64 years
43.9%
34.1%
17.1%
12.2%
26.8%
17.1%
78.0%
17.1%
31.7%
73.2%
43.9%
39.0%
65 to 69 years
46.7%
30.7%
10.7%
10.7%
25.3%
25.3%
66.7%
20.0%
38.7%
68.0%
40.0%
45.3%
70 to 74 years
41.7%
29.2%
19.4%
17.1%
28.2%
11.3%
56.9%
21.1%
33.8%
59.2%
32.4%
38.0%
75 to 79 years
36.0%
27.9%
10.5%
12.8%
22.1%
17.4%
58.1%
16.3%
30.2%
62.8%
25.6%
41.9%
80 to 84 years
38.3%
31.7%
13.3%
8.3%
28.3%
18.3%
59.3%
21.7%
36.7%
61.7%
35.0%
48.3%
85 to 89 years
20.0%
2.9%
8.6%
14.7%
17.1%
11.4%
42.9%
5.7%
22.9%
42.9%
22.9%
34.3%
90 to 94 years
45.5%
18.2%
18.2%
27.3%
54.5%
18.2%
72.7%
36.4%
54.5%
72.7%
72.7%
63.6%
95 years and older
40.0%
20.0%
20.0%
0.0%
25.0%
40.0%
60.0%
40.0%
60.0%
80.0%
40.0%
80.0%

Senior Needs A
ssessment
82
During a typical w
eek, how m
any hours do you spend doing the follow
ing? (based upon the response “N
o Hours”)
Participating in a club or civic group
Participating in religious or spiritual activities with others
Visiting with family in person or on the phone
Visiting with friends in person or on the phone
Providing help to friends or relatives
Participating in senior center activities
Caring for a pet
Doing housework or home maintenance
Participating in a hobby such as art, gardening or
music
Working for pay
Attending movies, sporting events or
groups events
Volunteering or helping out in the community
Male
50.0%
41.8%
23.0%
17.4%
35.2%
21.3%
61.5%
25.4%
40.2%
64.8%
43.4%
46.7%
Female
37.1%
21.8%
10.4%
11.5%
23.4%
17.2%
60.6%
15.8%
33.3%
62.7%
32.6%
42.7%
Transgender
0.0%
0.0%
0.0%
0.0%
0.0%
0.0%
0.0%
0.0%
0.0%
0.0%
0.0%
0.0%
Caucasian
51.9%
37.0%
22.2%
11.1%
25.9%
25.9%
44.4%
14.8%
37.0%
59.3%
44.4%
55.6%
Black or A
frican Am
erican
44.8%
30.4%
15.4%
16.0%
30.0%
19.1%
68.6%
20.4%
38.2%
70.8%
39.8%
48.9%
Hispanic or L
atino
20.0%
20.0%
0.0%
0.0%
20.0%
0.0%
60.0%
20.0%
60.0%
60.0%
60.0%
60.0%
Asian
9.5%
7.1%
7.1%
0.0%
7.1%
16.7%
11.9%
7.1%
9.5%
11.9%
4.8%
2.4%
Native H
awaiian or O
ther Pacific Islander
50.0%
0.0%
0.0%
0.0%
0.0%
0.0%
50.0%
50.0%
50.0%
50.0%
0.0%
50.0%
Am
erican Indian, Alaskan N
ative 0.0%
0.0%
0.0%
0.0%
0.0%
0.0%
0.0%
0.0%
0.0%
0.0%
0.0%
0.0%
Other
33.3%
22.2%
11.1%
0.0%
33.3%
0.0%
66.7%
12.5%
25.0%
62.5%
12.5%
25.0%
Less than $10,000
45.9%
35.7%
16.8%
14.9%
31.6%
27.0%
58.7%
23.5%
37.2%
60.2%
39.3%
42.3%
$10,000 to less than $15,000
41.2%
38.2%
20.6%
19.1%
26.5%
17.6%
66.2%
20.6%
41.2%
72.1%
50.0%
52.9%
$15,000 to less than $20,000
37.5%
6.3%
6.3%
18.8%
19.4%
6.3%
68.8%
12.5%
40.6%
68.8%
28.1%
40.6%
$20,000 to less than $25,000
26.9%
11.5%
7.7%
11.5%
15.4%
3.8%
64.0%
7.7%
23.1%
73.1%
23.1%
38.5%
$25,000 to less than $30,000
25.0%
0.0%
0.0%
0.0%
25.0%
0.0%
75.0%
0.0%
25.0%
100.0%
25.0%
50.0%
$30,000 to less than $35,000
55.6%
22.2%
0.0%
0.0%
22.2%
0.0%
77.8%
11.1%
44.4%
55.6%
11.1%
44.4%
$35,000 to less than $40,000
50.0%
20.0%
20.0%
10.0%
10.0%
10.0%
60.0%
20.0%
40.0%
80.0%
30.0%
60.0%

Senior Needs A
ssessment
83
During a typical w
eek, how m
any hours do you spend doing the follow
ing? (based upon the response “N
o Hours”)
Participating in a club or civic group
Participating in religious or spiritual activities with others
Visiting with family in person or on the phone
Visiting with friends in person or on the phone
Providing help to friends or relatives
Participating in senior center activities
Caring for a pet
Doing housework or home maintenance
Participating in a hobby such as art, gardening or
music
Working for pay
Attending movies, sporting events or
groups events
Volunteering or helping out in the community
$40,000 to less than $45,000
16.7%
0.0%
0.0%
0.0%
16.7%
0.0%
66.7%
0.0%
0.0%
50.0%
0.0%
0.0%
$45,000 to less than $50,000
25.0%
25.0%
25.0%
0.0%
50.0%
25.0%
75.0%
25.0%
25.0%
75.0%
25.0%
75.0%
$50,000 to less than $60,000
33.3%
16.7%
0.0%
0.0%
16.7%
0.0%
83.3%
0.0%
16.7%
50.0%
0.0%
16.7%
$60,000 to less than $75,000
0.0%
0.0%
0.0%
0.0%
50.0%
0.0%
50.0%
0.0%
50.0%
100.0%
0.0%
50.0%
$75,000 or more
0.0%
25.0%
0.0%
0.0%
25.0%
0.0%
50.0%
0.0%
25.0%
25.0%
25.0%
50.0%
Table 17 dem
onstrates by Ward, age, gender, race/ethnicity and incom
e the responses for the reported “no hours” (or zero
hours reported) spent during a typical week engaging in recreational and social activities.
Senior Needs Assessment 84
Case management and options counseling.
Definition and importance.
Case management services include the assessment of need and the coordination,
implementation, and monitoring of a service plan designed to mobilize resources and services to
meet the needs of the client, achieve positive health outcomes, and maintain relationships with
family and friends. The overall goal of case management is to allow the client to achieve the
optimum level of wellness and functional capability.
Options counseling seeks to identify and resolve problems of a senior or person living
with a disability through evaluation and therapy. Similar to case management, counseling aims to
improve the emotional and personal capacity and allow participants to maintain their maximum
functioning and independence.
Descriptive discussion of focus area.
Over half of the focus group participants did not know that case management services
existed. However, participants mentioned that seniors need assistance with the following
services: transportation, recreation, and advocacy.
Additionally, the Hispanic or Latino, Asian, and persons living with disabilities focus
group participants were not aware of case management services. Nevertheless, the Hispanic or
Latino focus group participants mentioned that they need assistance with the following services:
affordable and adequate housing, health care, in-home care, income assistance, and low cost
health care. The Asian focus group participants stated they need help with income assistance;
LGBT participants voiced they need help with adult day care; and persons living with disabilities
voiced a need for help with transportation.
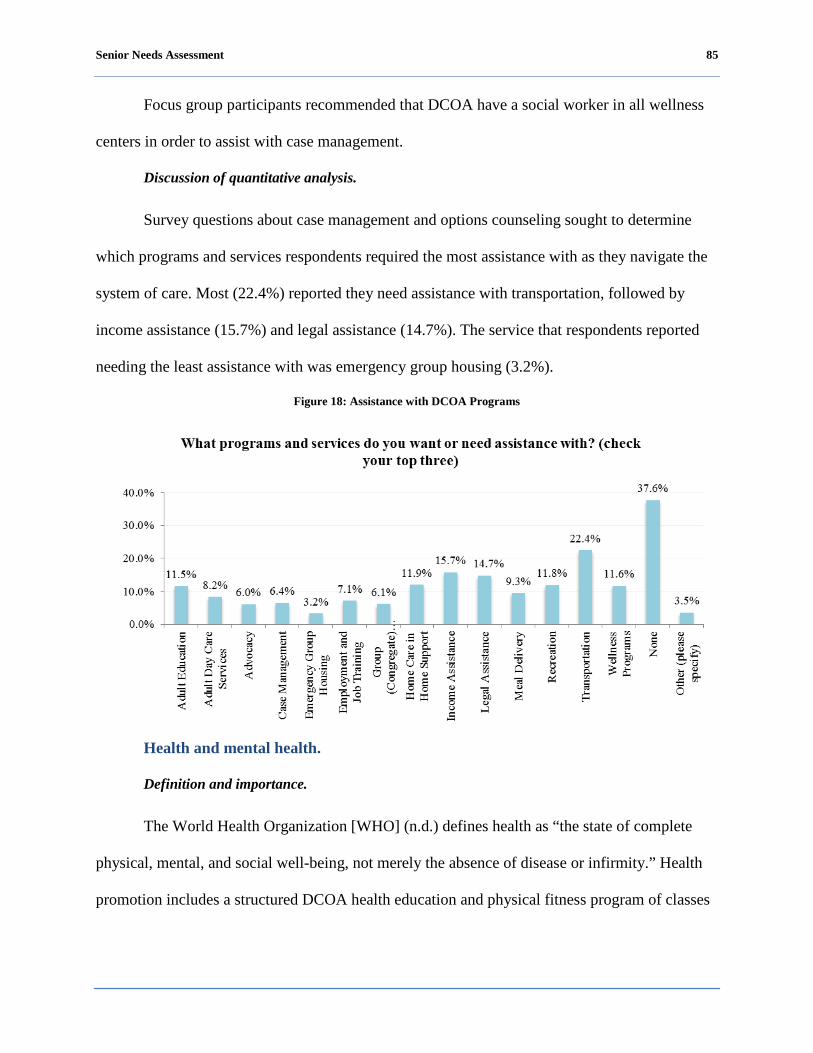
Senior Needs Assessment 85
Focus group participants recommended that DCOA have a social worker in all wellness
centers in order to assist with case management.
Discussion of quantitative analysis.
Survey questions about case management and options counseling sought to determine
which programs and services respondents required the most assistance with as they navigate the
system of care. Most (22.4%) reported they need assistance with transportation, followed by
income assistance (15.7%) and legal assistance (14.7%). The service that respondents reported
needing the least assistance with was emergency group housing (3.2%).
Figure 18: Assistance with DCOA Programs
Health and mental health.
Definition and importance.
The World Health Organization [WHO] (n.d.) defines health as “the state of complete
physical, mental, and social well-being, not merely the absence of disease or infirmity.” Health
promotion includes a structured DCOA health education and physical fitness program of classes
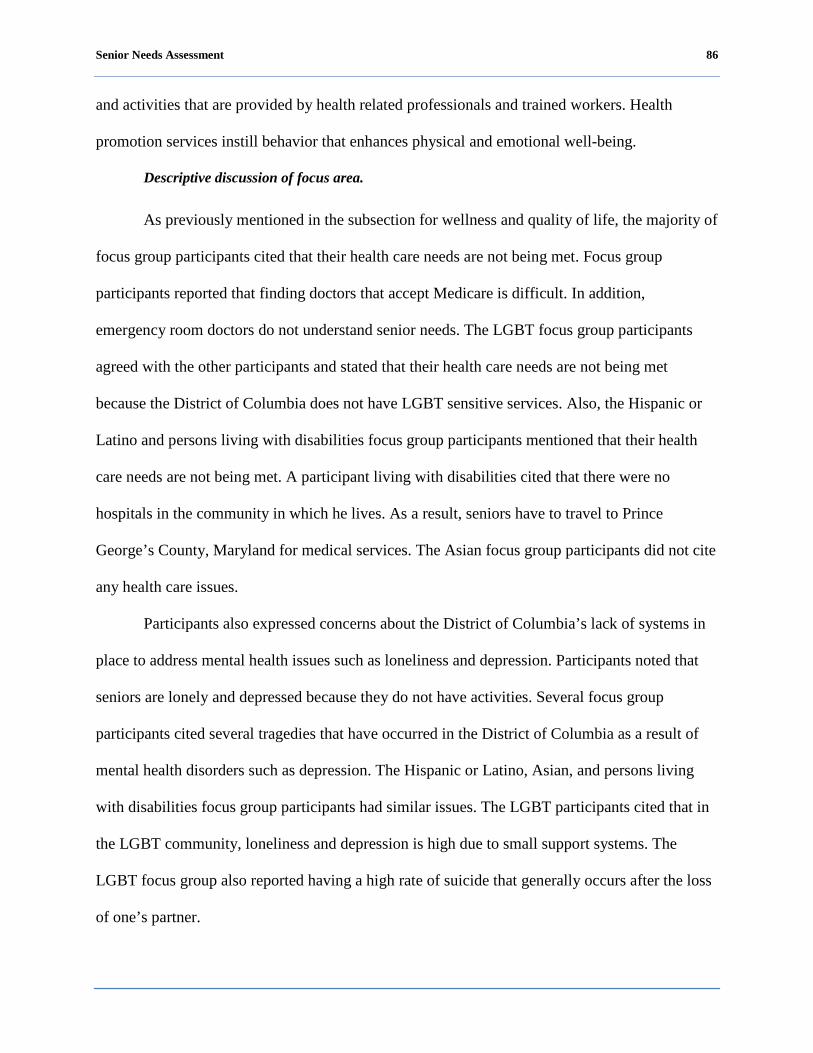
Senior Needs Assessment 86
and activities that are provided by health related professionals and trained workers. Health
promotion services instill behavior that enhances physical and emotional well-being.
Descriptive discussion of focus area.
As previously mentioned in the subsection for wellness and quality of life, the majority of
focus group participants cited that their health care needs are not being met. Focus group
participants reported that finding doctors that accept Medicare is difficult. In addition,
emergency room doctors do not understand senior needs. The LGBT focus group participants
agreed with the other participants and stated that their health care needs are not being met
because the District of Columbia does not have LGBT sensitive services. Also, the Hispanic or
Latino and persons living with disabilities focus group participants mentioned that their health
care needs are not being met. A participant living with disabilities cited that there were no
hospitals in the community in which he lives. As a result, seniors have to travel to Prince
George’s County, Maryland for medical services. The Asian focus group participants did not cite
any health care issues.
Participants also expressed concerns about the District of Columbia’s lack of systems in
place to address mental health issues such as loneliness and depression. Participants noted that
seniors are lonely and depressed because they do not have activities. Several focus group
participants cited several tragedies that have occurred in the District of Columbia as a result of
mental health disorders such as depression. The Hispanic or Latino, Asian, and persons living
with disabilities focus group participants had similar issues. The LGBT participants cited that in
the LGBT community, loneliness and depression is high due to small support systems. The
LGBT focus group also reported having a high rate of suicide that generally occurs after the loss
of one’s partner.

Senior Needs Assessment 87
Focus group participants made the following recommendations to improve their physical
and mental health:
DCOA should work with the District of Columbia to build a hospital in the community to
provide better travel time access.
DCOA should establish a number for seniors to call to receive information on mental health.
DCOA should establish a Listening Service dedicated to really listening to the concerns of
seniors.
DCOA should assist senior housing facilities in establishing floor captains and block captains
(for seniors that live in private homes in residential neighborhoods) in order to ensure that
seniors’ needs are met.
DCOA should create a system, such as home visits, to make connections with homebound
seniors.
Discussion of quantitative analysis.
Most (72.5%) respondents reported they had not been ill for a period of one month or
more in the past year, while 27.5% of respondents reported they had been ill for a period of one
month or more in the past year as shown in Figure 19.
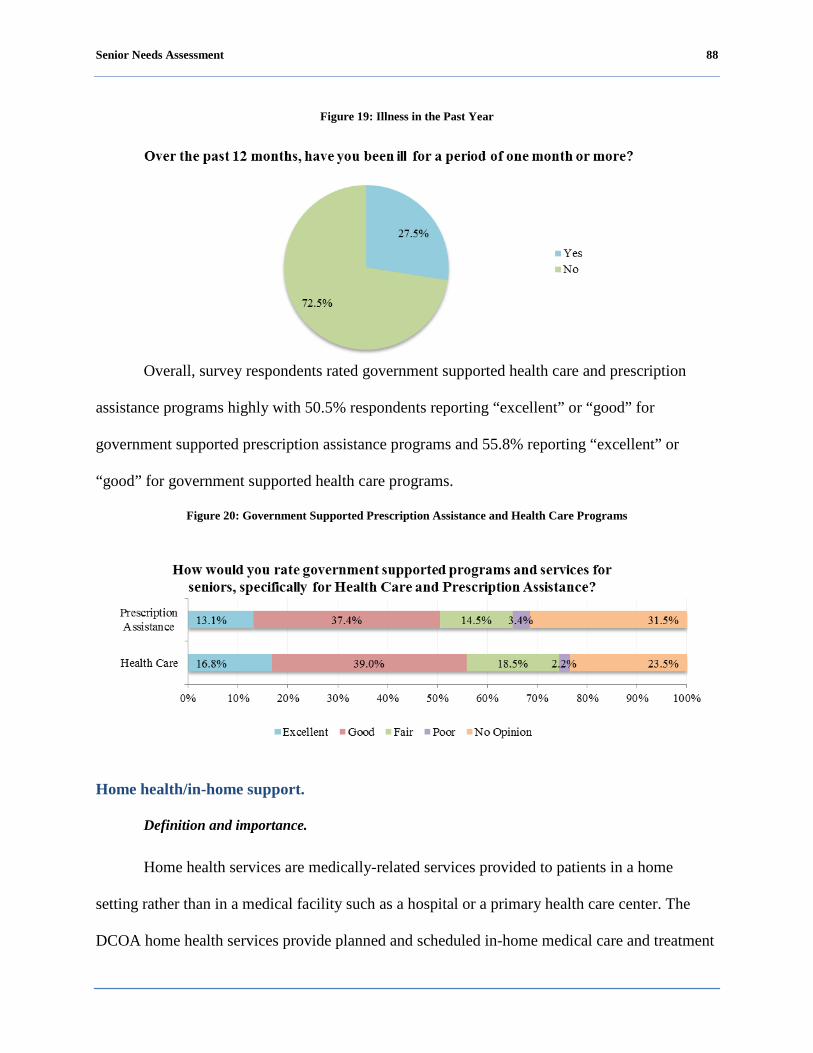
Senior Needs Assessment 88
Figure 19: Illness in the Past Year
Overall, survey respondents rated government supported health care and prescription
assistance programs highly with 50.5% respondents reporting “excellent” or “good” for
government supported prescription assistance programs and 55.8% reporting “excellent” or
“good” for government supported health care programs.
Figure 20: Government Supported Prescription Assistance and Health Care Programs
Home health/in-home support.
Definition and importance.
Home health services are medically-related services provided to patients in a home
setting rather than in a medical facility such as a hospital or a primary health care center. The
DCOA home health services provide planned and scheduled in-home medical care and treatment
Senior Needs Assessment 89
for infirm, disabled, or chronically ill individuals to help avoid or forestall institutionalization.
Home health services provide the necessary health care to allow a participant to remain as
independent as possible.
Descriptive discussion of focus area.
As mentioned earlier in the wellness subsection of this report, focus group participants
mentioned they need in-home support with activities including: housekeeping, shopping, and
administration of medications. The LGBT, Hispanic or Latino, Asian, and persons living with
disabilities focus group participants had similar issues.
In addition, the majority of focus group participants stated that their home health care
needs are not included in particular services provided by home health care aides. Issues most
often cited about home care aides were: (1) the aides do not work the hours they are scheduled to
work; (2) the aides do not perform the duties that they are hired to perform; and (3) the
participants receive improper care. The persons living with disabilities mentioned similar
concerns. The LGBT focus group participants mentioned that there are no home health care
providers that are trained to deliver healthcare to LGBT people. The Hispanic or Latino and
Asian focus group participants cited that in-home health care needs are not being met because of
language barriers.
Focus group participants made the following recommendations to improve home health
and in-home health needs for seniors:
DCOA should monitor home health care agencies to ensure that home health aides’ time
reported is accurate and work is being performed.
DCOA should work with the home health care agencies to improve assessments to determine
the adequate amount of time needed for in-home health care.
DCOA should ensure that home health agencies employee aides are certified.
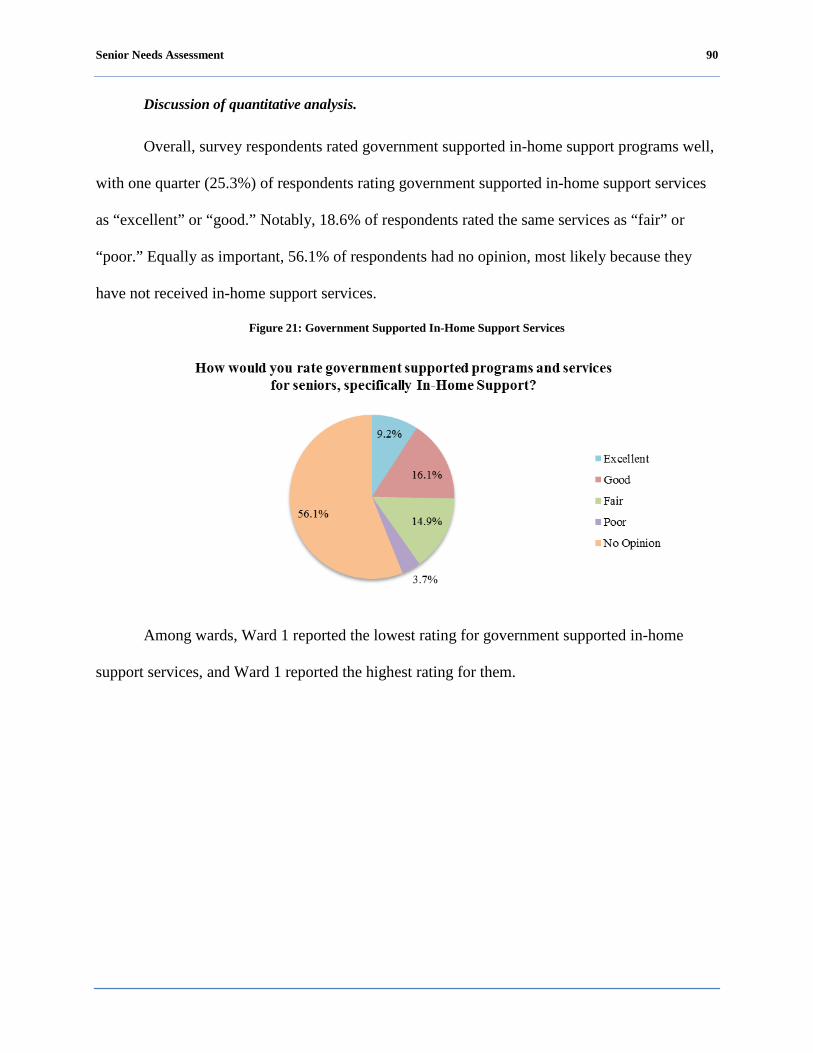
Senior Needs Assessment 90
Discussion of quantitative analysis.
Overall, survey respondents rated government supported in-home support programs well,
with one quarter (25.3%) of respondents rating government supported in-home support services
as “excellent” or “good.” Notably, 18.6% of respondents rated the same services as “fair” or
“poor.” Equally as important, 56.1% of respondents had no opinion, most likely because they
have not received in-home support services.
Figure 21: Government Supported In-Home Support Services
Among wards, Ward 1 reported the lowest rating for government supported in-home
support services, and Ward 1 reported the highest rating for them.

Senior Needs Assessment 91
Figure 22: Government Supported In-Home Support Services among Wards
Among different races and ethnicities, Hispanic or Latinos reported the highest
dissatisfaction with government supported in-home support services and blacks or African-
Americans reported the highest satisfaction.
Figure 23: Government Supported In-Home Support Services among Race/Ethnicity
One quarter (25.1%) of survey respondents rated government supported nursing home
services as “good” or “fair,” while smaller percentages rated the services as “excellent” (3.5%)
or “poor” (5.5%). A larger percentage of respondents (65.9%) reported they had “no opinion”
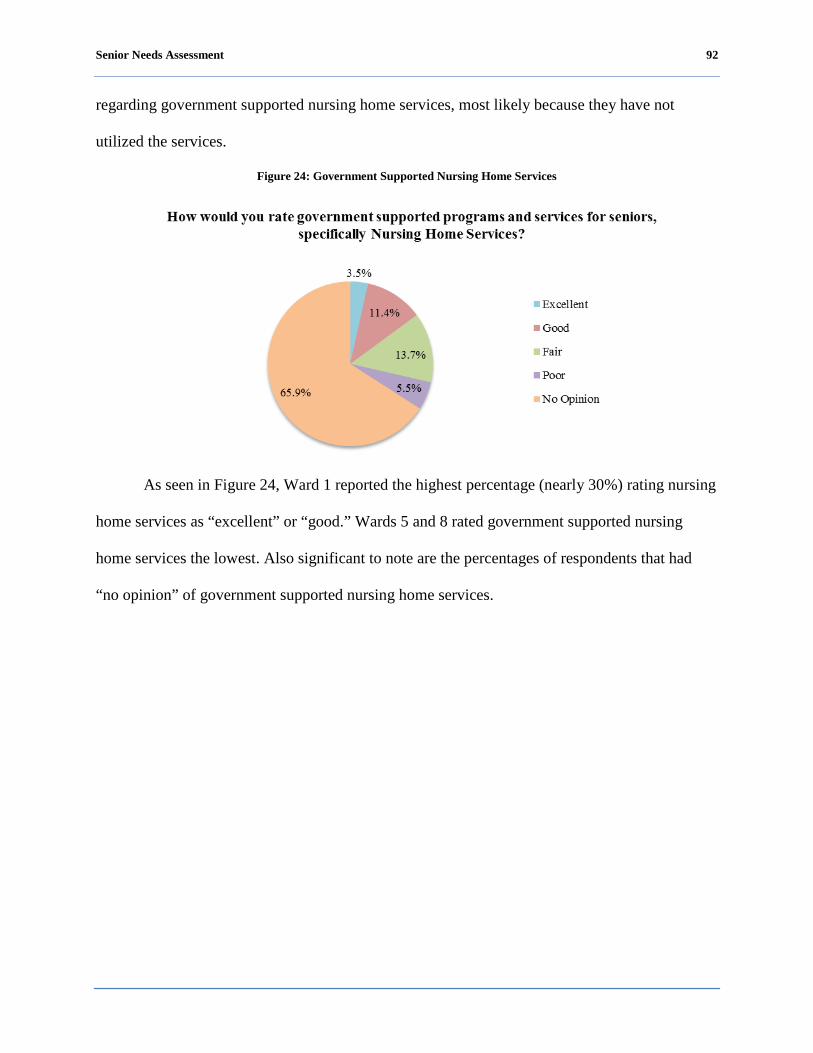
Senior Needs Assessment 92
regarding government supported nursing home services, most likely because they have not
utilized the services.
Figure 24: Government Supported Nursing Home Services
As seen in Figure 24, Ward 1 reported the highest percentage (nearly 30%) rating nursing
home services as “excellent” or “good.” Wards 5 and 8 rated government supported nursing
home services the lowest. Also significant to note are the percentages of respondents that had
“no opinion” of government supported nursing home services.
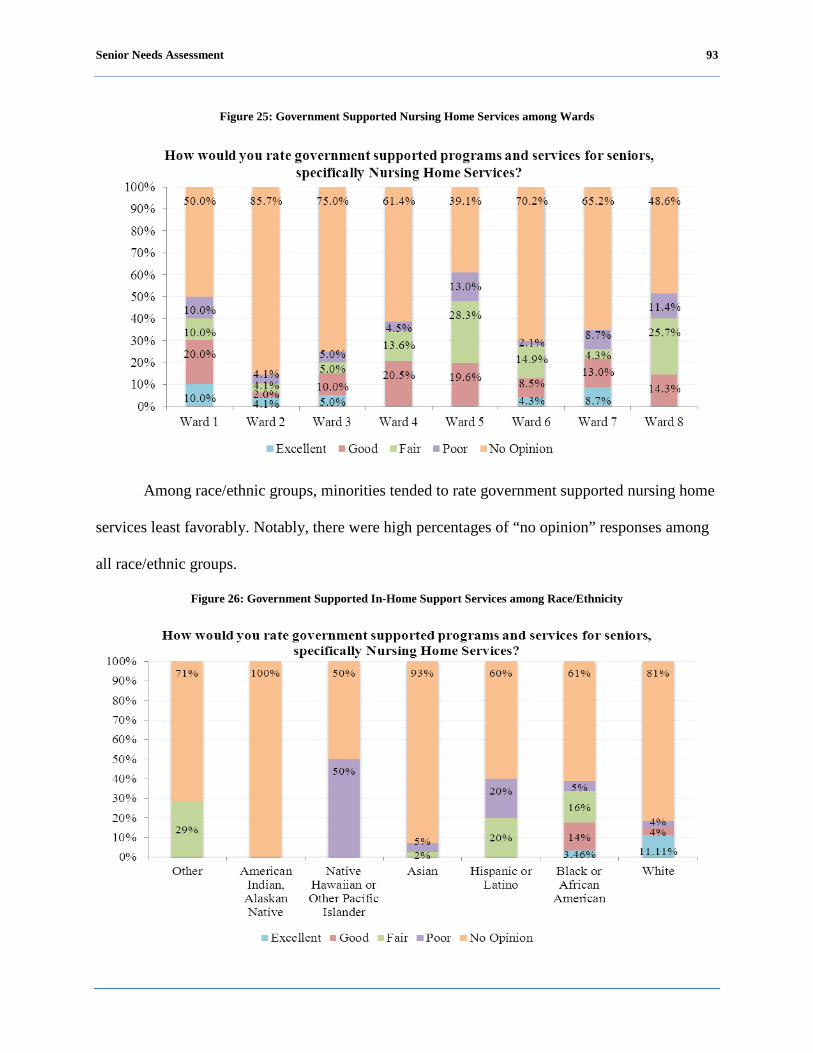
Senior Needs Assessment 93
Figure 25: Government Supported Nursing Home Services among Wards
Among race/ethnic groups, minorities tended to rate government supported nursing home
services least favorably. Notably, there were high percentages of “no opinion” responses among
all race/ethnic groups.
Figure 26: Government Supported In-Home Support Services among Race/Ethnicity
Senior Needs Assessment 94
Nutrition.
Definition and importance.
Food insecurity is defined as not having access at all times to enough food for an active,
healthy lifestyle due to a lack of resources (Johnson, 2008). The issue of food security is of
particular importance among special populations such as seniors and persons living with
disabilities, particularly those with low incomes. Food security plays a vital role in combating
poor physical health, mental health and malnutrition.
Descriptive discussion of focus area.
The majority of the focus group participants stated they had enough food to eat in the past
12 months; however, they knew of other seniors who did not have enough food to eat during this
same time period. Similarly, the Asian and persons living with disabilities participants also
reported having enough food to eat in the past 12 months; however, they too knew of other
seniors who did not have enough food to eat during this same time period. On the other hand,
participants in Wards 2 and 3 mentioned that during the past 12 months they did not have enough
food to eat due to insufficient income and the lack of transportation to food banks. The Hispanic
or Latino focus group participants also reported lack of transportation as a reason why they did
not always have access to enough nutritious food.
In addition, participants mentioned that some seniors cannot afford to eat nutritionally
balanced healthy food. Many seniors are on a fixed income and they have difficulty paying their
bills so affording nutritional food is a challenge. One participant noted that she is aware of a
senior that eats fast food such as hamburgers and French fries every day because that is the only
meal that he can afford. One participant in Ward 7 mentioned that supermarkets are not
accessible while another participant stated that there is a lack of fresh produce where they shop.

Senior Needs Assessment 95
Similarly, participants in the Hispanic or Latino and Asian groups cited that seniors cannot
afford to eat nutritionally balanced healthy food. Also, due to medical conditions it is hard to eat
a balanced diet.
Focus group participants recommend that DCOA collaborate with the District of
Columbia Human Services to implement a program to provide seniors with food stamps or
vouchers to help supplement their food allowance so that they can purchase healthier foods.
Discussion of quantitative analysis.
To help determine nutritional status, respondents were asked to provide how often, in the
past month, they have needed help getting enough food or the right kinds of food to eat. The
results, as reported in Table 18, show:
Residents living in Ward 2 reported most often that they needed “a lot” or “some” help
getting enough food or the right kinds of food to eat in the past month.
Among age groups, persons living with disabilities ages 18-59, reported most often that they
needed “a lot” or “some” help getting enough food or the right kinds of food to eat in the past
month.
Among race/ethnic groups, Asians reported most often that they needed “a lot” or “some”
help getting enough food or the right kinds of food to eat in the past month.
Respondents earning less than $15,000 annually most often indicated that they needed “a lot”
or “some” help getting enough food or the right kinds of food to eat in the past month.
Table 18: Nutritional Status
In the past month, have you needed help trying to get enough food or the right kinds of food to eat? If so, how much? A lot Some None Don’t
know
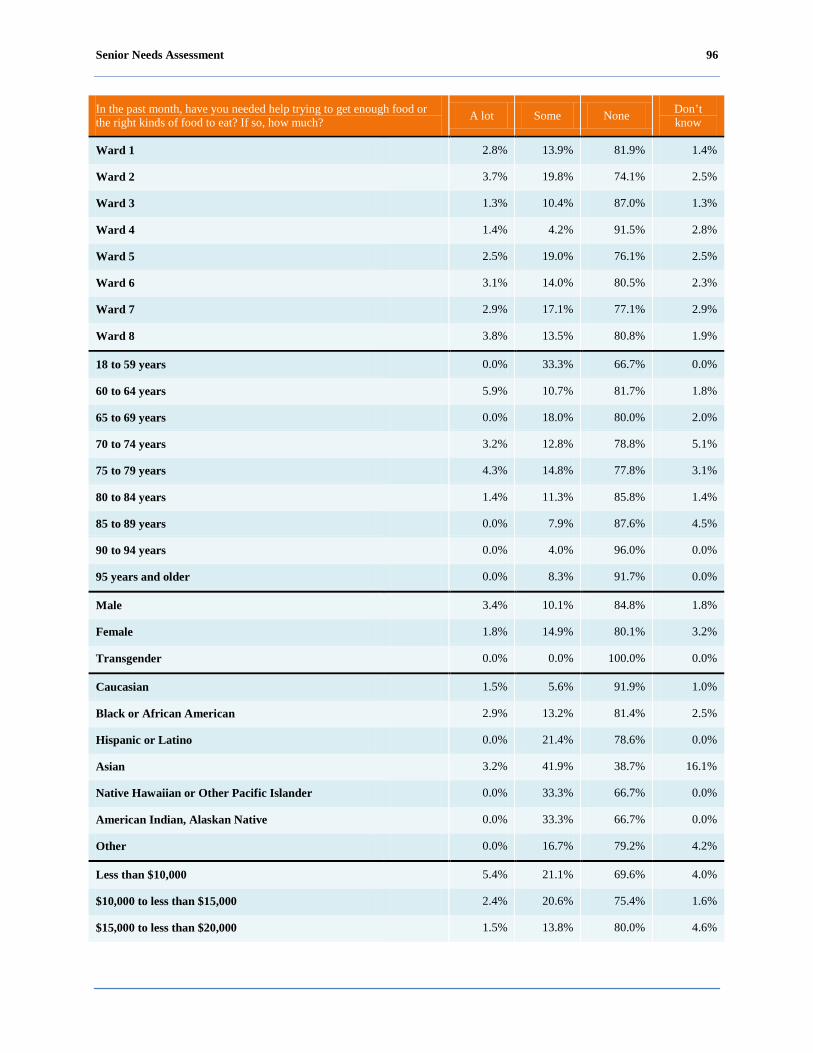
Senior Needs Assessment 96
In the past month, have you needed help trying to get enough food or the right kinds of food to eat? If so, how much? A lot Some None Don’t
know
Ward 1 2.8% 13.9% 81.9% 1.4%
Ward 2 3.7% 19.8% 74.1% 2.5%
Ward 3 1.3% 10.4% 87.0% 1.3%
Ward 4 1.4% 4.2% 91.5% 2.8%
Ward 5 2.5% 19.0% 76.1% 2.5%
Ward 6 3.1% 14.0% 80.5% 2.3%
Ward 7 2.9% 17.1% 77.1% 2.9%
Ward 8 3.8% 13.5% 80.8% 1.9%
18 to 59 years 0.0% 33.3% 66.7% 0.0%
60 to 64 years 5.9% 10.7% 81.7% 1.8%
65 to 69 years 0.0% 18.0% 80.0% 2.0%
70 to 74 years 3.2% 12.8% 78.8% 5.1%
75 to 79 years 4.3% 14.8% 77.8% 3.1%
80 to 84 years 1.4% 11.3% 85.8% 1.4%
85 to 89 years 0.0% 7.9% 87.6% 4.5%
90 to 94 years 0.0% 4.0% 96.0% 0.0%
95 years and older 0.0% 8.3% 91.7% 0.0%
Male 3.4% 10.1% 84.8% 1.8%
Female 1.8% 14.9% 80.1% 3.2%
Transgender 0.0% 0.0% 100.0% 0.0%
Caucasian 1.5% 5.6% 91.9% 1.0%
Black or African American 2.9% 13.2% 81.4% 2.5%
Hispanic or Latino 0.0% 21.4% 78.6% 0.0%
Asian 3.2% 41.9% 38.7% 16.1%
Native Hawaiian or Other Pacific Islander 0.0% 33.3% 66.7% 0.0%
American Indian, Alaskan Native 0.0% 33.3% 66.7% 0.0%
Other 0.0% 16.7% 79.2% 4.2%
Less than $10,000 5.4% 21.1% 69.6% 4.0%
$10,000 to less than $15,000 2.4% 20.6% 75.4% 1.6%
$15,000 to less than $20,000 1.5% 13.8% 80.0% 4.6%
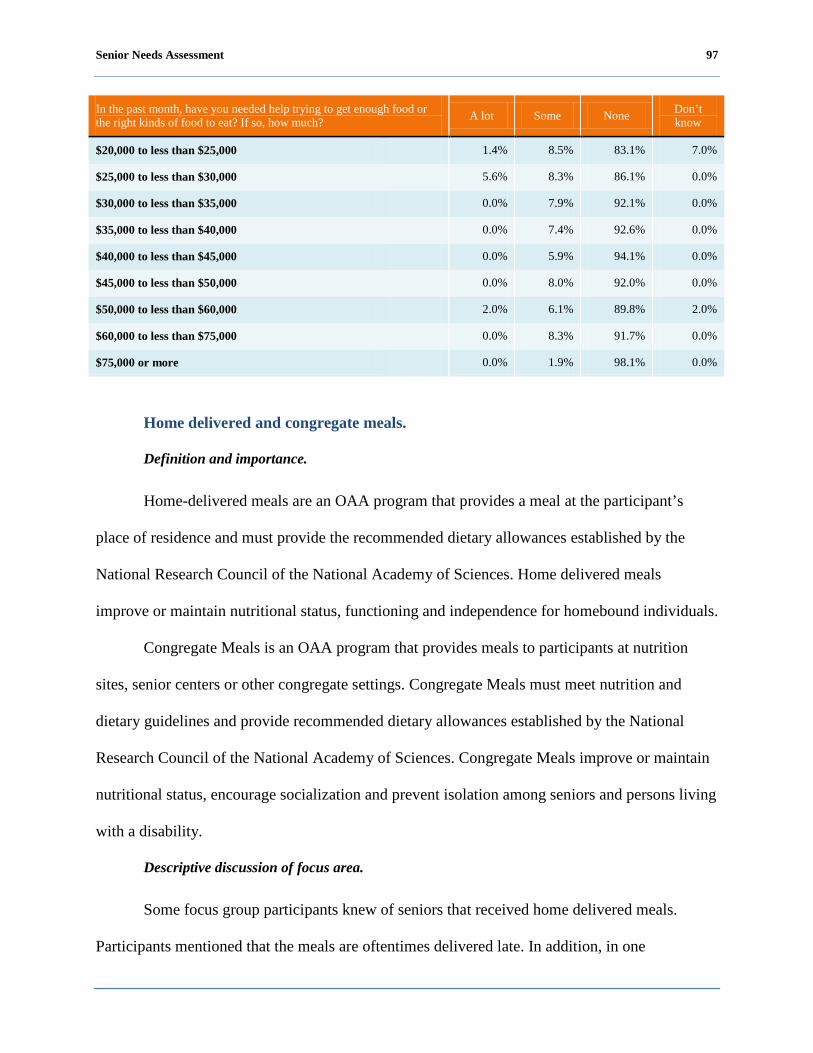
Senior Needs Assessment 97
In the past month, have you needed help trying to get enough food or the right kinds of food to eat? If so, how much? A lot Some None Don’t
know
$20,000 to less than $25,000 1.4% 8.5% 83.1% 7.0%
$25,000 to less than $30,000 5.6% 8.3% 86.1% 0.0%
$30,000 to less than $35,000 0.0% 7.9% 92.1% 0.0%
$35,000 to less than $40,000 0.0% 7.4% 92.6% 0.0%
$40,000 to less than $45,000 0.0% 5.9% 94.1% 0.0%
$45,000 to less than $50,000 0.0% 8.0% 92.0% 0.0%
$50,000 to less than $60,000 2.0% 6.1% 89.8% 2.0%
$60,000 to less than $75,000 0.0% 8.3% 91.7% 0.0%
$75,000 or more 0.0% 1.9% 98.1% 0.0%
Home delivered and congregate meals.
Definition and importance.
Home-delivered meals are an OAA program that provides a meal at the participant’s
place of residence and must provide the recommended dietary allowances established by the
National Research Council of the National Academy of Sciences. Home delivered meals
improve or maintain nutritional status, functioning and independence for homebound individuals.
Congregate Meals is an OAA program that provides meals to participants at nutrition
sites, senior centers or other congregate settings. Congregate Meals must meet nutrition and
dietary guidelines and provide recommended dietary allowances established by the National
Research Council of the National Academy of Sciences. Congregate Meals improve or maintain
nutritional status, encourage socialization and prevent isolation among seniors and persons living
with a disability.
Descriptive discussion of focus area.
Some focus group participants knew of seniors that received home delivered meals.
Participants mentioned that the meals are oftentimes delivered late. In addition, in one
Senior Needs Assessment 98
participant’s opinion, the meals are not healthy because they are served with too much processed
meat and the food is too salty. Also, a few participants cited that there is a lack of information
about how to get congregate meals or delivered meals. A participant in the persons living with
disabilities focus group mentioned that food is not tasty and not visually appealing. None of the
other groups had an opinion on home delivered meals. Participants in the Asian group mentioned
that the congregate meals are not of good quality. None of the other groups had an opinion on
congregate meals.
Focus group participants made the following recommendations to improve the nutritional
needs of seniors:
DCOA should select home delivered vendors with similar high quality of food.
DCOA should screen potential vendors better to ensure that they have the ability to prepare
nutritionally balanced and tasty food.
Discussion of quantitative analysis.
As Table 15 shows, home delivered meals are delivered most widely to:
Ward 6
Seniors aged 90-94 years old
Males
Blacks or African Americans
Those earning less than $30,000 annually
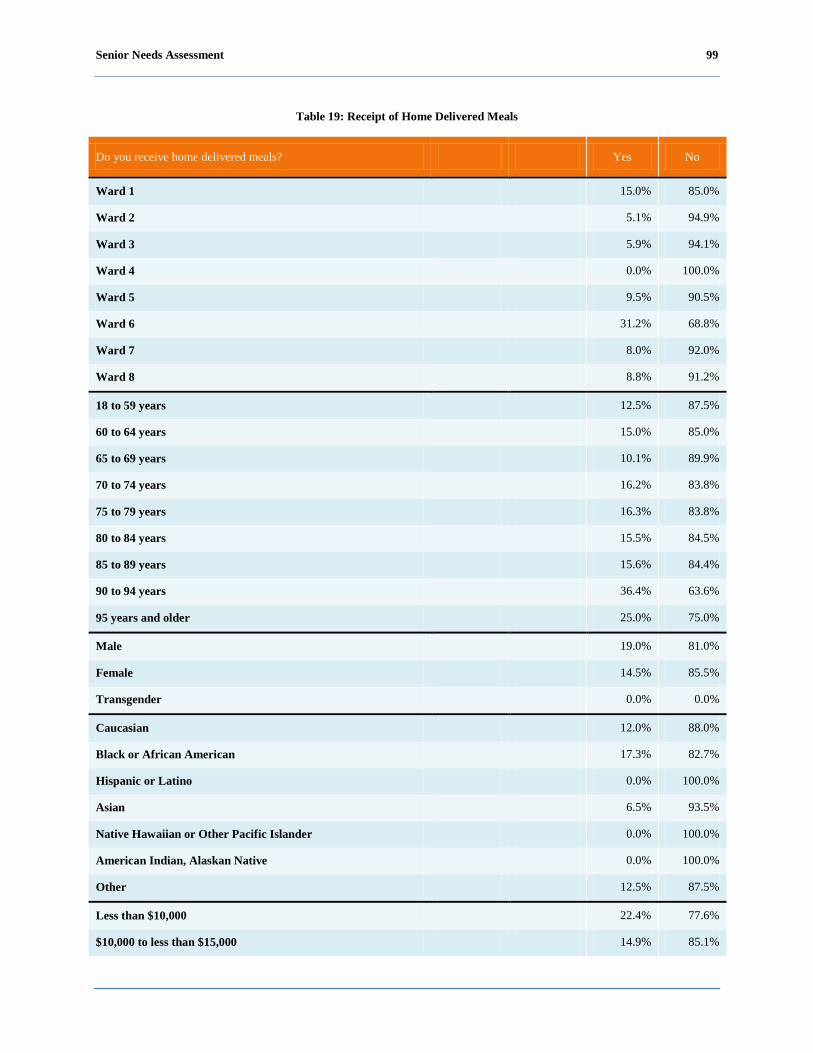
Senior Needs Assessment 99
Table 19: Receipt of Home Delivered Meals
Do you receive home delivered meals? Yes No
Ward 1 15.0% 85.0%
Ward 2 5.1% 94.9%
Ward 3 5.9% 94.1%
Ward 4 0.0% 100.0%
Ward 5 9.5% 90.5%
Ward 6 31.2% 68.8%
Ward 7 8.0% 92.0%
Ward 8 8.8% 91.2%
18 to 59 years 12.5% 87.5%
60 to 64 years 15.0% 85.0%
65 to 69 years 10.1% 89.9%
70 to 74 years 16.2% 83.8%
75 to 79 years 16.3% 83.8%
80 to 84 years 15.5% 84.5%
85 to 89 years 15.6% 84.4%
90 to 94 years 36.4% 63.6%
95 years and older 25.0% 75.0%
Male 19.0% 81.0%
Female 14.5% 85.5%
Transgender 0.0% 0.0%
Caucasian 12.0% 88.0%
Black or African American 17.3% 82.7%
Hispanic or Latino 0.0% 100.0%
Asian 6.5% 93.5%
Native Hawaiian or Other Pacific Islander 0.0% 100.0%
American Indian, Alaskan Native 0.0% 100.0%
Other 12.5% 87.5%
Less than $10,000 22.4% 77.6%
$10,000 to less than $15,000 14.9% 85.1%

Senior Needs Assessment 100
Do you receive home delivered meals? Yes No
$15,000 to less than $20,000 12.9% 87.1%
$20,000 to less than $25,000 0.0% 100.0%
$25,000 to less than $30,000 50.0% 50.0%
$30,000 to less than $35,000 0.0% 100.0%
$35,000 to less than $40,000 11.1% 88.9%
$40,000 to less than $45,000 0.0% 100.0%
$45,000 to less than $50,000 0.0% 100.0%
$50,000 to less than $60,000 0.0% 100.0%
$60,000 to less than $75,000 0.0% 100.0%
$75,000 or more 0.0% 100.0%
Transportation.
Definition and importance.
The DCOA transportation services make it possible for individuals to participate in
nutrition, social and recreation activities in the District of Columbia. DCOA provides
transportation through the Washington Elderly Handicapped Transportation Service (WEHTS),
the Call 'N' Ride Transportation Program, and the Washington Metropolitan Area Transit
Authority (WMATA).
Descriptive discussion of focus area.
The three modes of transportation mostly used by focus group participants were: (1) drive
or ride in car; (2) Metrobus or Metrorail; and (3) MetroAccess. The majority of participants in
Wards 1 and 4 drive and a few take the Metrobus or Metrorail to travel locally. The majority of
participants in Wards 2 and 3 take the Metrobus or Metrorail, whereas a few participants drive
when they go places. The majority of participants in Wards 5 and 6 take MetroAccess for health
care services, while a few drive. The majority of participants in Wards 7 and 8 take the Metrobus

Senior Needs Assessment 101
or Metrorail, however a few take MetroAccess for health care services. The majority of LGBT
participants stated they drive or take the Metrobus or Metrorail. The majority of Hispanic or
Latino and Asian participants take the Metrobus or Metrorail or walk. The majority of
participants in the persons living with disabilities group take the Metrobus or Metrorail, while a
few take MetroAccess.
The majority of participants in all groups noted that are not happy with services provided
by a current transportation vendor. The main reason cited was that the service is constantly late
picking up passengers and as a result seniors arrive late for their appointments. It was mentioned
that buses do not arrive on time and this impacts the arrival for their doctor appointments as well.
Participants cited that after 7:00 p.m. transportation is limited which can be a problem for seniors
that want to participate in evening events. In addition, the fares for MetroAccess, Metrobus, and
Metrorail are not affordable for seniors. As mentioned in the discussion about nutrition, many
seniors are on a fixed income and they have difficulty paying their bills so they cannot afford to
pay high transportation fares. Furthermore, participants mentioned that transportation is not
easily accessible. It was also noted that the proximity of bus stops is often not convenient for
seniors who often have to walk blocks to take a bus.
Focus group participants made the following recommendations to improve transportation:
DCOA should collaborate with Washington Metropolitan Area Transit Authority (WMATA)
to train bus drivers to remove passengers seated in reserved seats for seniors and persons
living with disabilities.
DCOA should collaborate with WMATA to offer free or reduced fares for seniors.
DCOA should provide taxi vouchers to help seniors with transportation needs.
Senior Needs Assessment 102
Discussion of quantitative analysis.
Across the District of Columbia, the most widely used method of transportation is driving
or riding in a car, followed by Metrobus or Metrorail and MetroAccess among seniors and
persons living with disabilities as demonstrated in Table 20.
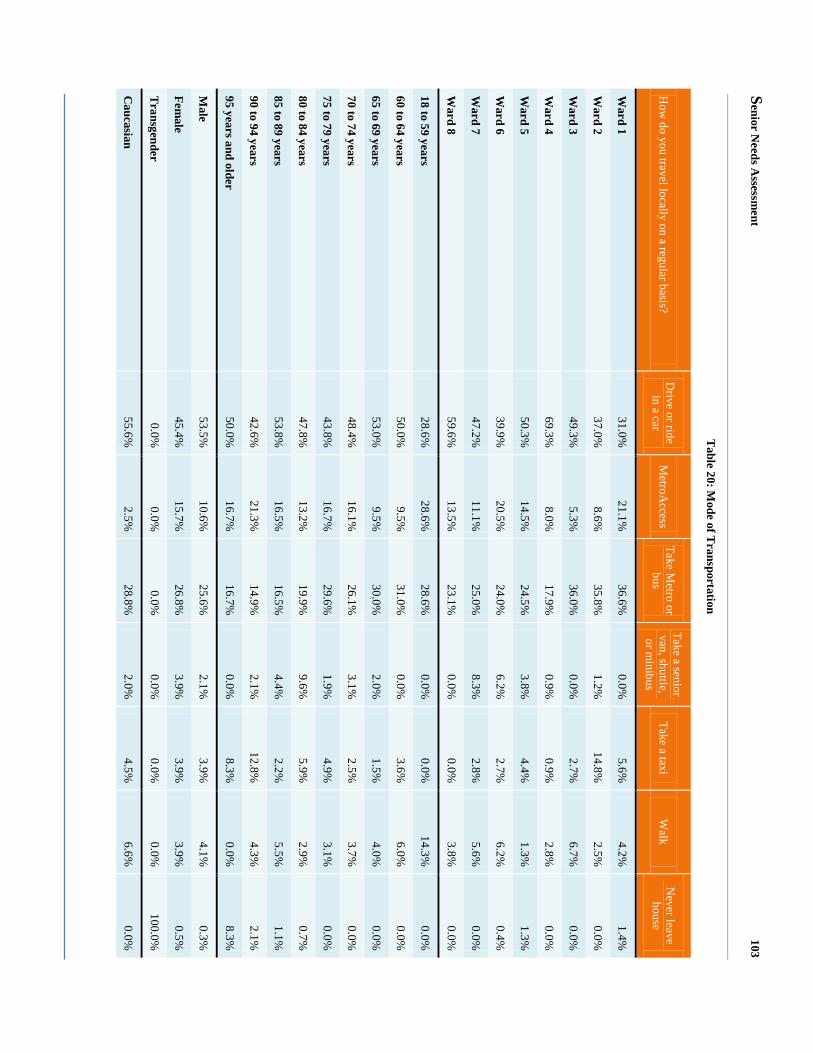
Senior N
eeds Assessm
ent 103
Table 20: M
ode of Transportation
How
do you travel locally on a regular basis? D
rive or ride in a car
MetroA
ccess Take M
etro or bus
Take a senior van, shuttle, or m
inibus Take a taxi
Walk
Never leave
house
Ward 1
31.0%
21.1%
36.6%
0.0%
5.6%
4.2%
1.4%
Ward 2
37.0%
8.6%
35.8%
1.2%
14.8%
2.5%
0.0%
Ward 3
49.3%
5.3%
36.0%
0.0%
2.7%
6.7%
0.0%
Ward 4
69.3%
8.0%
17.9%
0.9%
0.9%
2.8%
0.0%
Ward 5
50.3%
14.5%
24.5%
3.8%
4.4%
1.3%
1.3%
Ward 6
39.9%
20.5%
24.0%
6.2%
2.7%
6.2%
0.4%
Ward 7
47.2%
11.1%
25.0%
8.3%
2.8%
5.6%
0.0%
Ward 8
59.6%
13.5%
23.1%
0.0%
0.0%
3.8%
0.0%
18 to 59 years 28.6%
28.6%
28.6%
0.0%
0.0%
14.3%
0.0%
60 to 64 years 50.0%
9.5%
31.0%
0.0%
3.6%
6.0%
0.0%
65 to 69 years 53.0%
9.5%
30.0%
2.0%
1.5%
4.0%
0.0%
70 to 74 years 48.4%
16.1%
26.1%
3.1%
2.5%
3.7%
0.0%
75 to 79 years 43.8%
16.7%
29.6%
1.9%
4.9%
3.1%
0.0%
80 to 84 years 47.8%
13.2%
19.9%
9.6%
5.9%
2.9%
0.7%
85 to 89 years 53.8%
16.5%
16.5%
4.4%
2.2%
5.5%
1.1%
90 to 94 years 42.6%
21.3%
14.9%
2.1%
12.8%
4.3%
2.1%
95 years and older 50.0%
16.7%
16.7%
0.0%
8.3%
0.0%
8.3%
Male
53.5%
10.6%
25.6%
2.1%
3.9%
4.1%
0.3%
Female
45.4%
15.7%
26.8%
3.9%
3.9%
3.9%
0.5%
Transgender
0.0%
0.0%
0.0%
0.0%
0.0%
0.0%
100.0%
Caucasian
55.6%
2.5%
28.8%
2.0%
4.5%
6.6%
0.0%

Senior N
eeds Assessm
ent 104
How
do you travel locally on a regular basis? D
rive or ride in a car
MetroA
ccess Take M
etro or bus
Take a senior van, shuttle, or m
inibus Take a taxi
Walk
Never leave
house
Black or A
frican Am
erican 48.7%
17.5%
23.6%
3.6%
2.6%
3.5%
0.6%
Hispanic or L
atino 33.3%
8.3%
58.3%
0.0%
0.0%
0.0%
0.0%
Asian
8.3%
5.6%
58.3%
0.0%
22.2%
5.6%
0.0%
Native H
awaiian or O
ther Pacific Islander 50.0%
0.0%
50.0%
0.0%
0.0%
0.0%
0.0%
Am
erican Indian, Alaskan N
ative 57.1%
14.3%
28.6%
0.0%
0.0%
0.0%
0.0%
Other
54.2%
8.3%
12.5%
4.2%
8.3%
8.3%
4.2%
Less than $10,000
29.9%
23.2%
32.9%
4.4%
5.0%
4.4%
0.3%
$10,000 to less than $15,000 32.5%
15.4%
35.8%
5.7%
3.3%
5.7%
1.6%
$15,000 to less than $20,000 50.7%
13.4%
25.4%
4.5%
1.5%
4.5%
0.0%
$20,000 to less than $25,000 59.4%
11.6%
18.8%
0.0%
7.2%
1.4%
1.4%
$25,000 to less than $30,000 65.7%
11.4%
17.1%
2.9%
2.9%
0.0%
0.0%
$30,000 to less than $35,000 63.2%
10.5%
21.1%
0.0%
5.3%
0.0%
0.0%
$35,000 to less than $40,000 77.8%
3.7%
7.4%
3.7%
3.7%
3.7%
0.0%
$40,000 to less than $45,000 41.2%
5.9%
35.3%
5.9%
0.0%
11.8%
0.0%
$45,000 to less than $50,000 76.0%
4.0%
4.0%
0.0%
0.0%
16.0%
0.0%
$50,000 to less than $60,000 74.0%
2.0%
18.0%
0.0%
2.0%
4.0%
0.0%
$60,000 to less than $75,000 62.5%
8.3%
16.7%
4.2%
4.2%
4.2%
0.0%
$75,000 or more
64.8%
1.9%
22.9%
0.0%
5.7%
3.8%
1.0%
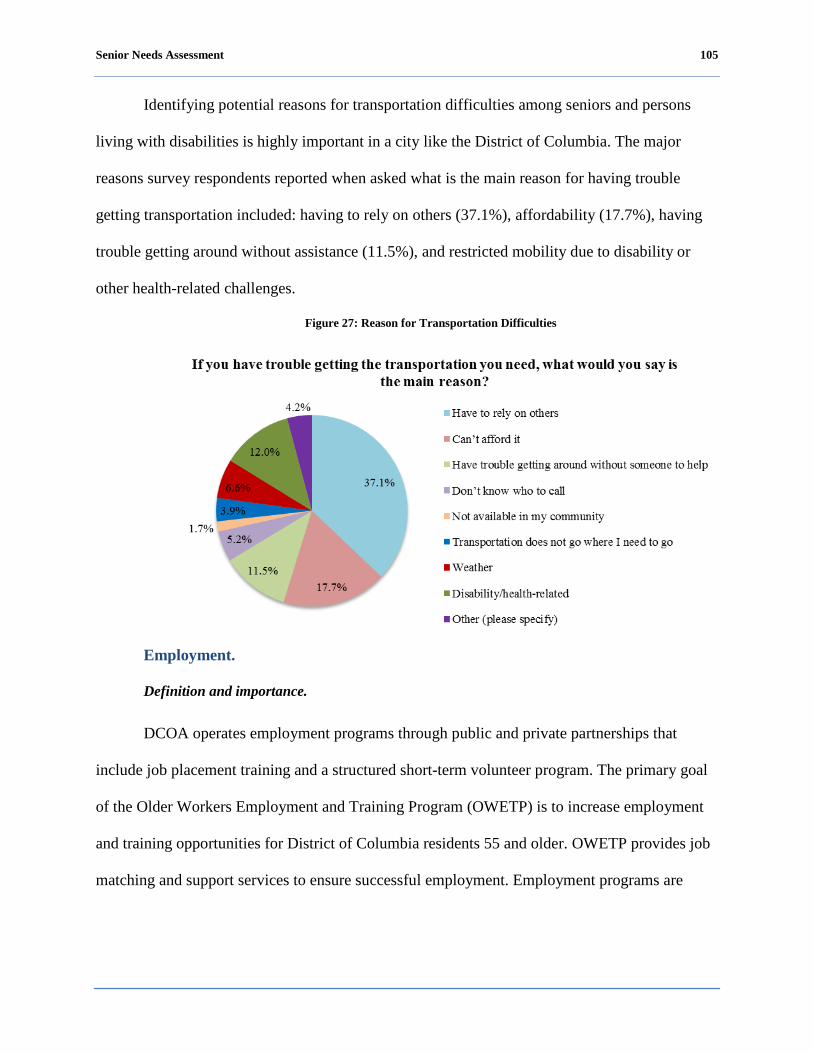
Senior Needs Assessment 105
Identifying potential reasons for transportation difficulties among seniors and persons
living with disabilities is highly important in a city like the District of Columbia. The major
reasons survey respondents reported when asked what is the main reason for having trouble
getting transportation included: having to rely on others (37.1%), affordability (17.7%), having
trouble getting around without assistance (11.5%), and restricted mobility due to disability or
other health-related challenges.
Figure 27: Reason for Transportation Difficulties
Employment.
Definition and importance.
DCOA operates employment programs through public and private partnerships that
include job placement training and a structured short-term volunteer program. The primary goal
of the Older Workers Employment and Training Program (OWETP) is to increase employment
and training opportunities for District of Columbia residents 55 and older. OWETP provides job
matching and support services to ensure successful employment. Employment programs are

Senior Needs Assessment 106
important because they give older workers an opportunity to earn additional income, develop an
expanded support system and promote personal growth.
Descriptive discussion of focus area.
The unemployment rate for persons 55 and older has increased sharply since the
beginning of the recession in December 2007. Nationally, unemployment rates for seniors are
lower than those for other age groups and the national average (Bureau of Labor Statistics,
2010). The majority of focus group participants that were unemployed and looking for work
cited they feel they are denied employment due to their age.
Discussion of quantitative analysis.
Table 21 represents the proportion of District seniors and persons living with disabilities
reporting they are unemployed but looking for work. Ward 7 reported the highest percentage of
persons unemployed but looking for work at the time of the survey. Additionally, persons living
with disabilities ages 18-59 reported the highest percentage of persons unemployed but looking
for work at the time of the survey.
Table 21: Employment Status: Unemployed, looking for work
What is your current employment status? Unemployed, looking for work
Ward 1 4.2%
Ward 2 2.5%
Ward 3 2.2%
Ward 4 3.6%
Ward 5 6.4%
Ward 6 3.9%
Ward 7 10.6%
Ward 8 0.0%
18 to 59 years 10.0%
60 to 64 years 7.4%
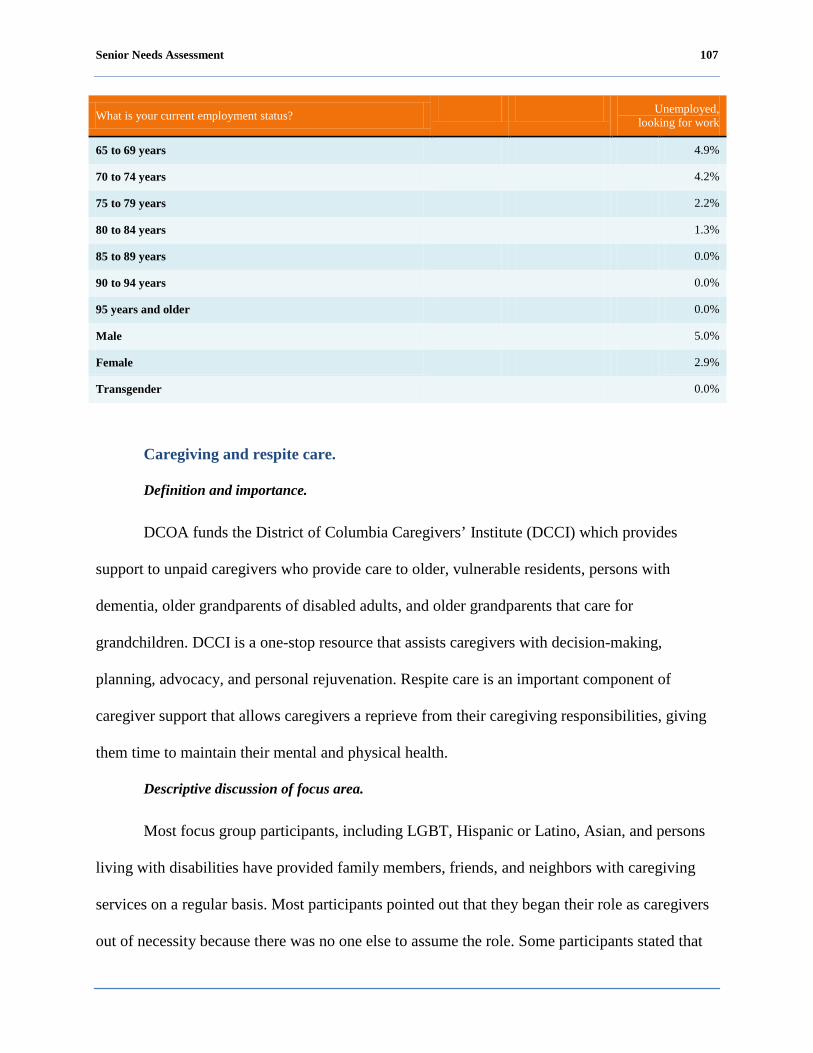
Senior Needs Assessment 107
What is your current employment status? Unemployed, looking for work
65 to 69 years 4.9%
70 to 74 years 4.2%
75 to 79 years 2.2%
80 to 84 years 1.3%
85 to 89 years 0.0%
90 to 94 years 0.0%
95 years and older 0.0%
Male 5.0%
Female 2.9%
Transgender 0.0%
Caregiving and respite care.
Definition and importance.
DCOA funds the District of Columbia Caregivers’ Institute (DCCI) which provides
support to unpaid caregivers who provide care to older, vulnerable residents, persons with
dementia, older grandparents of disabled adults, and older grandparents that care for
grandchildren. DCCI is a one-stop resource that assists caregivers with decision-making,
planning, advocacy, and personal rejuvenation. Respite care is an important component of
caregiver support that allows caregivers a reprieve from their caregiving responsibilities, giving
them time to maintain their mental and physical health.
Descriptive discussion of focus area.
Most focus group participants, including LGBT, Hispanic or Latino, Asian, and persons
living with disabilities have provided family members, friends, and neighbors with caregiving
services on a regular basis. Most participants pointed out that they began their role as caregivers
out of necessity because there was no one else to assume the role. Some participants stated that

Senior Needs Assessment 108
sometimes they feel the financial and emotional burden of caring for someone. Most participants
were not aware of any support programs such as respite care for caregivers.
Focus group participants recommended that DCOA provide support for family
caregivers.
Discussion of quantitative analysis.
Survey respondents were asked a series of questions about caregiving, of which 21.4% of
survey respondents reported they provide care for one or more family members or friends on a
regular basis.
Figure 28: Caregiving Status
As shown in Table 22, blacks or African Americans reported the highest percentage of
senior caregivers. Additionally, respondents ages 80-84 years old reported the highest percentage
of senior caregivers providing care to a family member or friend.

Senior Needs Assessment 109
Table 22: Caregiving Status
Do you provide care for one or more family members or friends on a regular basis?
Yes No
Caucasian 25.0% 75.0%
Black or African American 33.5% 66.5%
Hispanic or Latino 19.0% 81.0%
Asian 28.5% 71.5%
Native Hawaiian or Other Pacific Islander 20.6% 79.4%
American Indian, Alaskan Native 14.5% 85.5%
Other 12.8% 87.2%
18 to 59 years 4.0% 96.0%
60 to 64 years 0.0% 100.0%
65 to 69 years 14.1% 85.9%
70 to 74 years 22.3% 77.7%
75 to 79 years 14.3% 85.7%
80 to 84 years 46.9% 53.1%
85 to 89 years 33.3% 66.7%
90 to 94 years 0.0% 100.0%
95 years and older 28.0% 72.0%
Overall, looking at Figure 29, the majority (59.6%) of respondents who reported they
provided caregiving services to a family member or friend stated they had not felt financially or
physically burdened by their caregiving in the past month. However, nearly one-third (31.9%) of
respondents reported they had “frequently” or “sometimes” experienced a physical or financial
burden in the past month as the result of their caregiving.
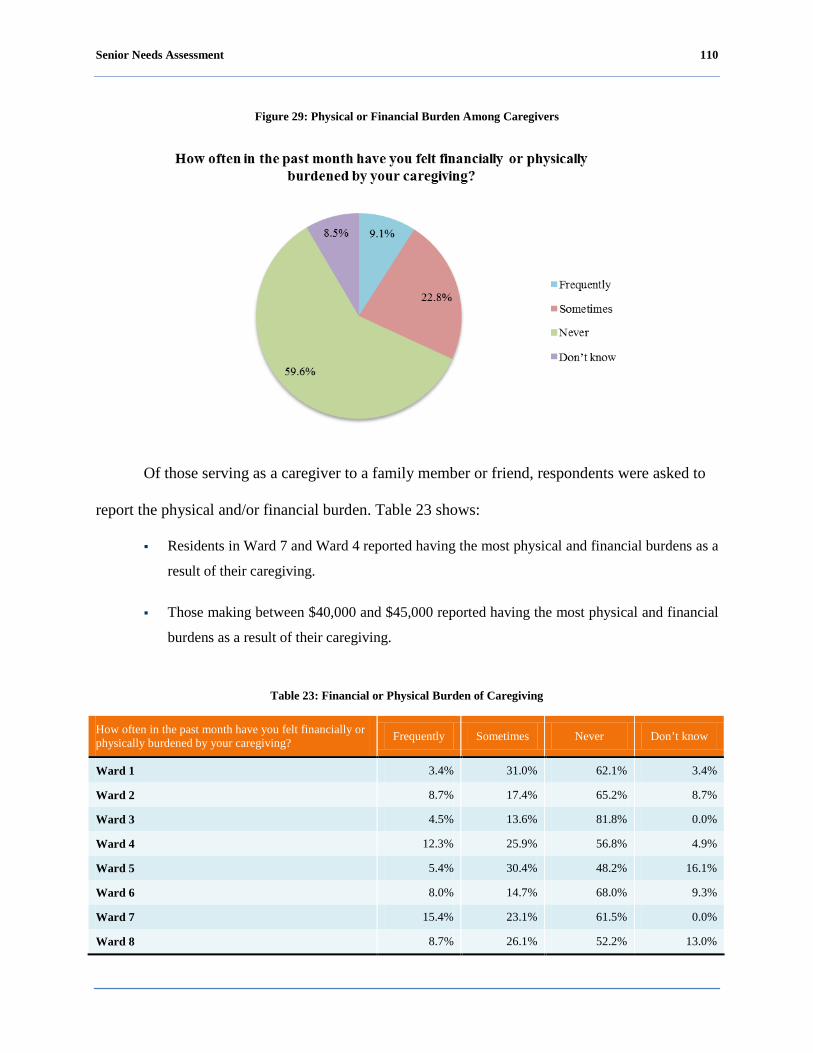
Senior Needs Assessment 110
Figure 29: Physical or Financial Burden Among Caregivers
Of those serving as a caregiver to a family member or friend, respondents were asked to
report the physical and/or financial burden. Table 23 shows:
Residents in Ward 7 and Ward 4 reported having the most physical and financial burdens as a
result of their caregiving.
Those making between $40,000 and $45,000 reported having the most physical and financial
burdens as a result of their caregiving.
Table 23: Financial or Physical Burden of Caregiving
How often in the past month have you felt financially or physically burdened by your caregiving? Frequently Sometimes Never Don’t know
Ward 1 3.4% 31.0% 62.1% 3.4%
Ward 2 8.7% 17.4% 65.2% 8.7%
Ward 3 4.5% 13.6% 81.8% 0.0%
Ward 4 12.3% 25.9% 56.8% 4.9%
Ward 5 5.4% 30.4% 48.2% 16.1%
Ward 6 8.0% 14.7% 68.0% 9.3%
Ward 7 15.4% 23.1% 61.5% 0.0%
Ward 8 8.7% 26.1% 52.2% 13.0%
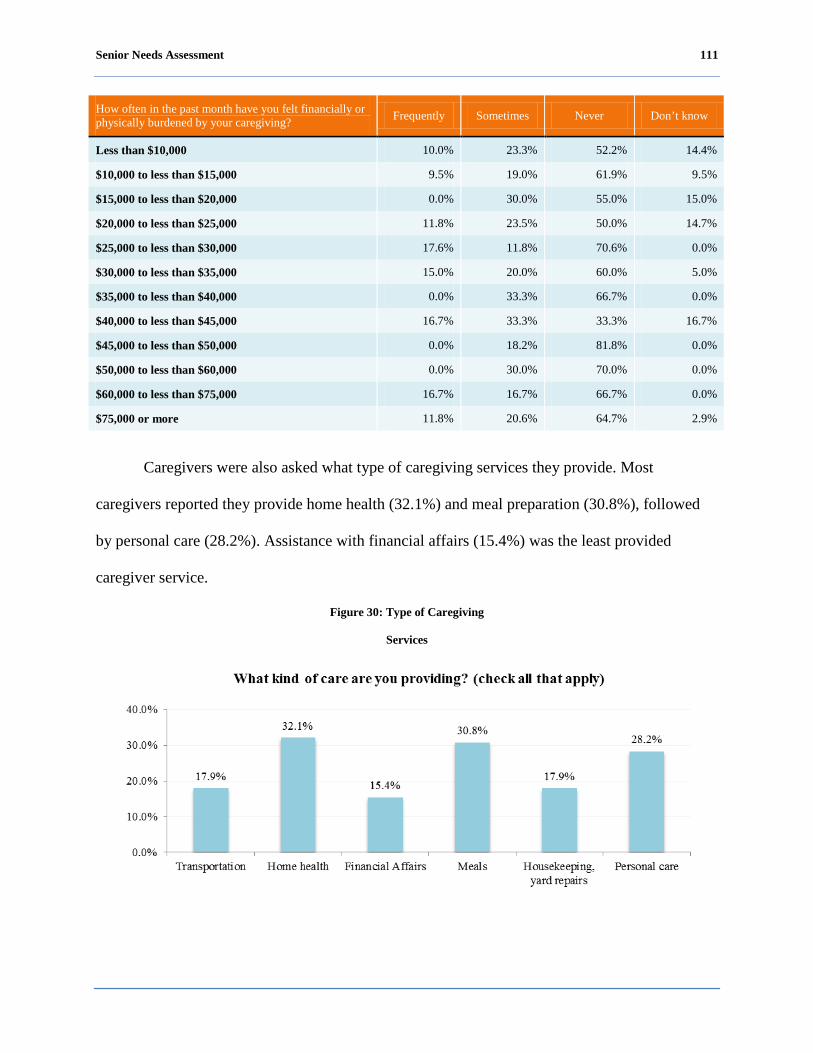
Senior Needs Assessment 111
How often in the past month have you felt financially or physically burdened by your caregiving? Frequently Sometimes Never Don’t know
Less than $10,000 10.0% 23.3% 52.2% 14.4%
$10,000 to less than $15,000 9.5% 19.0% 61.9% 9.5%
$15,000 to less than $20,000 0.0% 30.0% 55.0% 15.0%
$20,000 to less than $25,000 11.8% 23.5% 50.0% 14.7%
$25,000 to less than $30,000 17.6% 11.8% 70.6% 0.0%
$30,000 to less than $35,000 15.0% 20.0% 60.0% 5.0%
$35,000 to less than $40,000 0.0% 33.3% 66.7% 0.0%
$40,000 to less than $45,000 16.7% 33.3% 33.3% 16.7%
$45,000 to less than $50,000 0.0% 18.2% 81.8% 0.0%
$50,000 to less than $60,000 0.0% 30.0% 70.0% 0.0%
$60,000 to less than $75,000 16.7% 16.7% 66.7% 0.0%
$75,000 or more 11.8% 20.6% 64.7% 2.9%
Caregivers were also asked what type of caregiving services they provide. Most
caregivers reported they provide home health (32.1%) and meal preparation (30.8%), followed
by personal care (28.2%). Assistance with financial affairs (15.4%) was the least provided
caregiver service.
Figure 30: Type of Caregiving
Services
Senior Needs Assessment 112
Medicaid/Medicare.
Definition and importance.
Medicare covers most people 65 or older and those with long-term disabilities. Part A, a
hospital insurance plan, also pays for home health visits and hospice care. Part B, a medical plan,
pays for doctors' services, tests, and other health care providers’ services.
Medicaid is a joint federal-state program that covers low-income people under age 65 and
those who have exhausted Medicare benefits. It pays for hospital care, doctors' services, nursing-
home care, home health services, family planning, and screening. Medicare/Medicaid
information and benefits are essential to allowing seniors and persons living with a disability the
ability to experience continuous health care coverage and benefits that allow them to maintain
optimum health.
As shown in Table 24, when compared to the nation, the proportion of Medicare
beneficiaries in the District of Columbia nearly equals the national percentage within age groups.
However, there are vast differences in the proportion of Blacks and Whites that receive Medicare
in the District of Columbia versus the nation.

Senior Needs Assessment 113
Table 24: Medicare Facts-At-a-Glance
Descriptive discussion of focus area.
Focus group participants were not asked to respond to questions related to insurance
status. Therefore, there is no descriptive discussion in this area.
Discussion of quantitative analysis.
The District of Columbia has a very comprehensive system for health insurance with a
very small proportion of residents having no form of health insurance as demonstrated below.
Facts DC US Notes # % # %
Medicare Beneficiaries - - - - - % total enrollees Adults 19-64 11,100 15 7,232,800 16 Elderly 65-74 30,900 42 19,251,500 43 Elderly 75-84 20,100 27 12,394,800 28 Elderly 85+ 10,400 14 4,810,600 11
Medicare Beneficiaries by Race/Ethnicity - - - - - % total enrollees White 16,700 23 34,353,400 77 Black 50,500 69 4,423,400 10 Hispanic 4,200 6 3,502,900 8 Other NSD NSD 2,047,600 5
Duals as a % of Medicare Beneficiaries 29 - 21 -
Medicare Spending by Residence - - - - Total Spending (in millions) $856 - $471,260 - Per Enrollee Medicare Spending $11,157 - $10,365 -
Medicare Advantage Penetration - 9.7 - 25.6 - % of total enrollees Source: Henry J. Kaiser Family Foundation, 2010
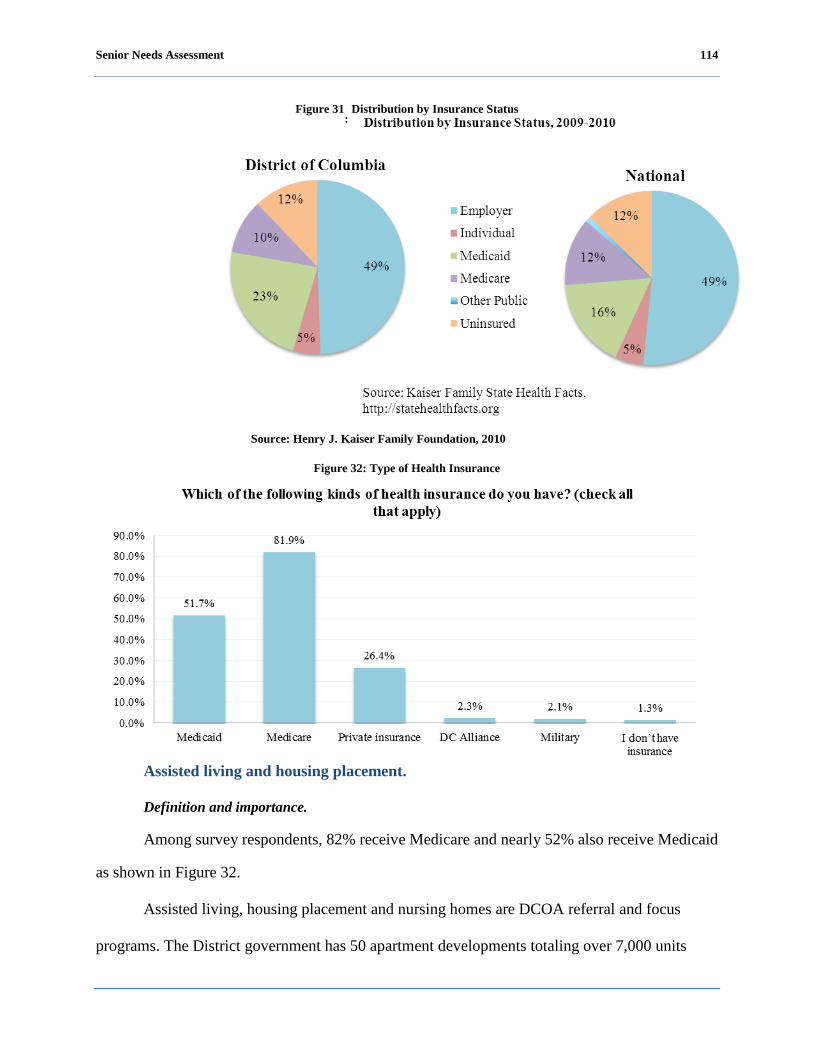
Senior Needs Assessment 114
Figure 31
: Distribution by Insurance Status
Among survey respondents, 82% receive Medicare and nearly 52% also receive Medicaid
as shown in Figure 32.
Figure 32: Type of Health Insurance
Assisted living and housing placement.
Definition
and importance.
Assisted living, housing placement and nursing homes are DCOA referral and focus
programs. The District government has 50 apartment developments totaling over 7,000 units
Source: Henry J. Kaiser Family Foundation, 2010
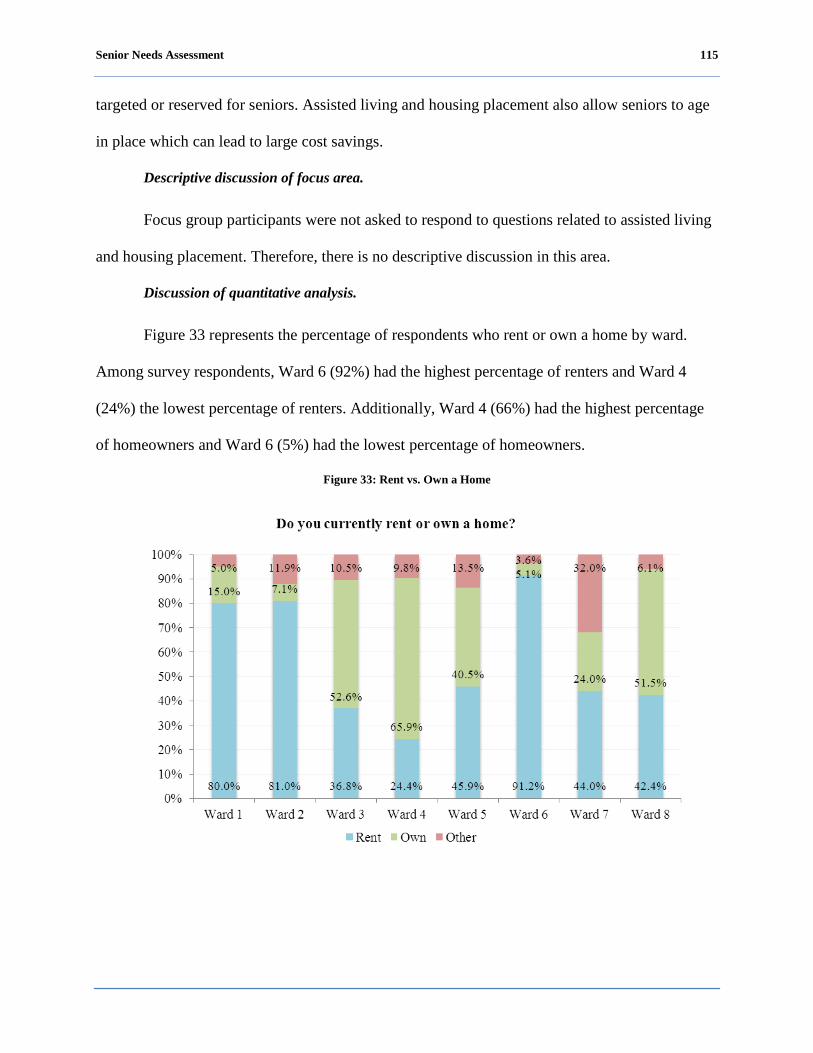
Senior Needs Assessment 115
targeted or reserved for seniors. Assisted living and housing placement also allow seniors to age
in place which can lead to large cost savings.
Descriptive discussion of focus area.
Focus group participants were not asked to respond to questions related to assisted living
and housing placement. Therefore, there is no descriptive discussion in this area.
Discussion of quantitative analysis.
Figure 33 represents the percentage of respondents who rent or own a home by ward.
Among survey respondents, Ward 6 (92%) had the highest percentage of renters and Ward 4
(24%) the lowest percentage of renters. Additionally, Ward 4 (66%) had the highest percentage
of homeowners and Ward 6 (5%) had the lowest percentage of homeowners.
Figure 33: Rent vs. Own a Home
Senior Needs Assessment 116
Legal services.
Definition and importance.
Legal services provides assistance to people otherwise unable to afford legal
representation and access to the court system. There are a number of delivery models for legal
services that include staff attorneys, private lawyers or firms, or a non-profit community legal
clinic. DCOA refers clients to legal services provided through individual or class case
representation by an attorney or personnel supervised by an attorney. Individual legal
representation is also employed to assist clients who need to complete a public benefits
application, recertification, and/or appeal process. Legal services seek to protect and secure
rights, benefits and entitlements for seniors, persons living with a disability and their caregivers.
Descriptive discussion of focus area.
Participants cited that they were concerned about the following abuse issues: taking
money or personal property, not having personal care needs met, neglect, and emotional abuse.
One participant believed that seniors are abused due to illiteracy. The Hispanic or Latino group
stated that they would like to have more information about abuse. In addition, as previously
mentioned in the employment section, seniors that are unemployed looking for work believe that
they are being taken advantage of due to their age.
Discussion of quantitative analysis.
Survey respondents reported having the most legal concerns with Social Security benefits
(39.2%), preparing a will or trust (37.2%), and Medicare benefits (36.0%). Of least concern was
physical or financial abuse (8.7%) as depicted in Figure 34.
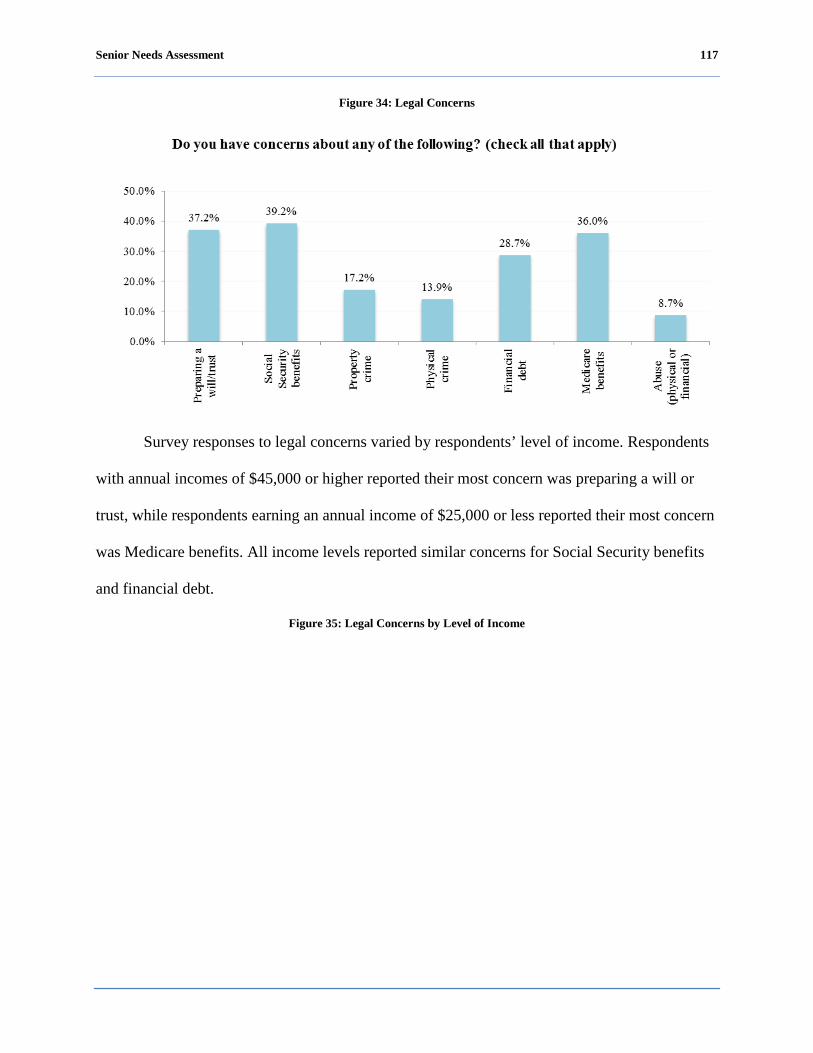
Senior Needs Assessment 117
Figure 34: Legal Concerns
Survey responses to legal concerns varied by respondents’ level of income. Respondents
with annual incomes of $45,000 or higher reported their most concern was preparing a will or
trust, while respondents earning an annual income of $25,000 or less reported their most concern
was Medicare benefits. All income levels reported similar concerns for Social Security benefits
and financial debt.
Figure 35: Legal Concerns by Level of Income
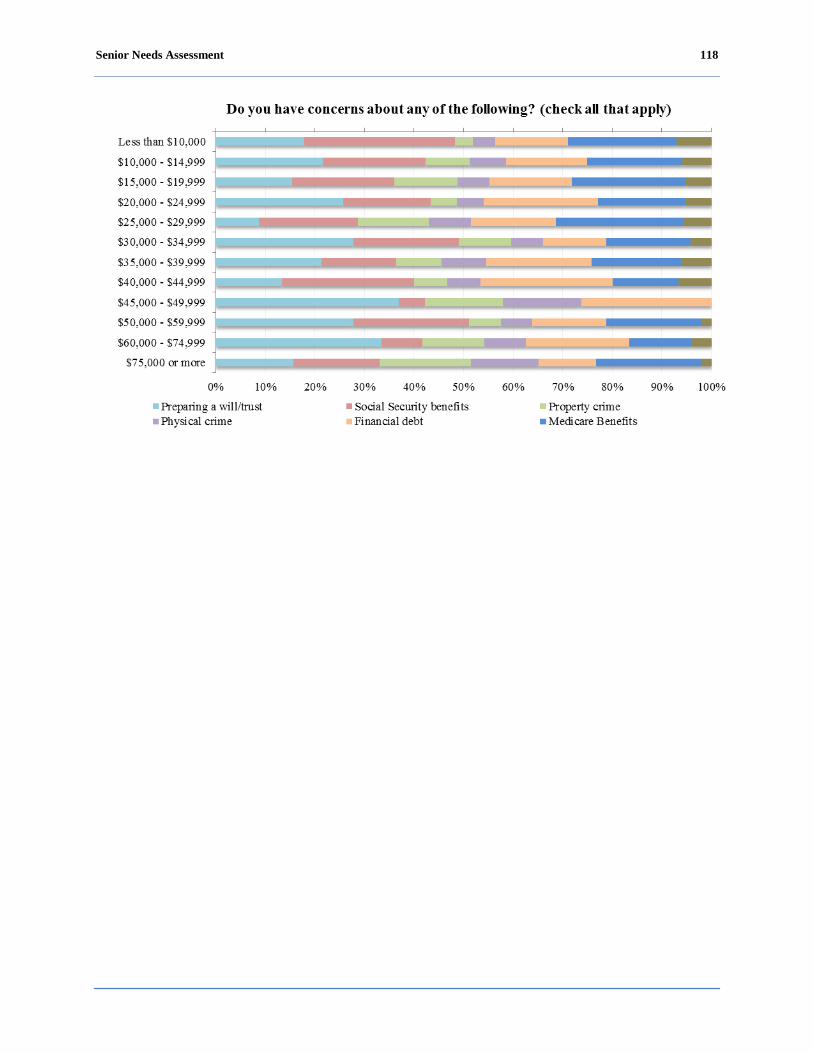
Senior Needs Assessment 118

Senior Needs Assessment 119
Community Resource Inventory
Background
Understanding of the local and national agencies that study and advise on public policy
issues as well as provide actual service delivery to seniors, persons living with disabilities, senior
caregivers, and other special populations affords these communities the ability to access services
from the federal government, foundations, state and regional governments, national
commissions, consortia, and non-profit advocacy organizations headquartered in the District of
Columbia. The views of community service providers are essential to determining the needs of
the District of Columbia community and can offer a sound basis for providing additional or
different types of services. Aside from the actual recipients of services, community service
providers have the most insight into those recipients of services compared to any other segment
of the population. Unlike individual service recipients, community service providers can often
see more of the overall effectiveness of services in place and can provide useful advice in this
context. These experiences often lead to valuable suggestions and recommendations regarding
innovative or more efficient service options.
Senior Needs Assessment 120
Methodology
In consultation with DCOA, a survey instrument was designed to gain insight into the
needs of the target populations: seniors (age 60 and older), persons living with disabilities (age
18-59 years), senior caregivers, and special populations within these groups. The purpose of the
survey was to identify the services offered and to help determine identifiable gaps in service
delivery and in the capacity of current community service providers.
The community resource inventory survey was distributed to 178 community service
providers, inside and outside of DCOA senior service network. Twenty community providers
responded to the survey representing a response rate of 11%. In addition to the community
resource inventory, there were a number of other survey activities employed to assess the level,
type, and quality of services being provided to the groups identified for this report.
This section is divided into topical areas that identify services provided and determine
services that should be provided. These topical areas are: health care, transportation, abuse,
neglect, financial exploitation, recreation, and community services and support. In many cases,
other District government agencies provide services directly to clients. In those instances, DCOA
augments those services or may facilitate the delivery of services by providing case management,
options counseling, or referral services.
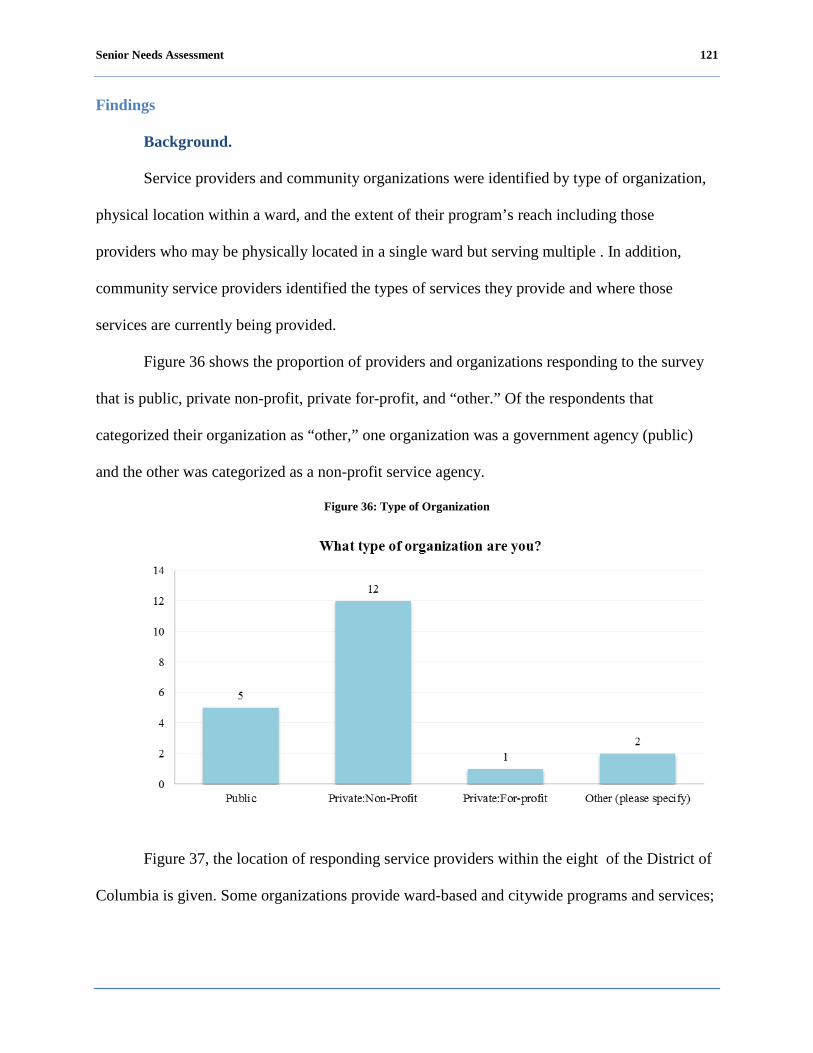
Senior Needs Assessment 121
Findings
Background.
Service providers and community organizations were identified by type of organization,
physical location within a ward, and the extent of their program’s reach including those
providers who may be physically located in a single ward but serving multiple . In addition,
community service providers identified the types of services they provide and where those
services are currently being provided.
Figure 36 shows the proportion of providers and organizations responding to the survey
that is public, private non-profit, private for-profit, and “other.” Of the respondents that
categorized their organization as “other,” one organization was a government agency (public)
and the other was categorized as a non-profit service agency.
Figure 36: Type of Organization
Figure 37, the location of responding service providers within the eight of the District of
Columbia is given. Some organizations provide ward-based and citywide programs and services;

Senior Needs Assessment 122
therefore it was also important to capture the extent of the provider’s services throughout the
District of Columbia.
Figure 37: Location of Organization by Ward
Figure 38 graphs the Wards in which responding service providers state their
organization provides services.
Figure 38: Community Service Providers Provision of Services by Ward

Senior Needs Assessment 123
As Figure 38 depicts, of the responding organizations, 80% of the organizations provide
services to Ward 7, 70% of the organizations provide services to Ward 8, 65% of the
organizations provide services to Ward 1 and Ward 4, 60% of the organizations provide services
to Ward 5, 55% of the organizations provide services to Ward 6 and Ward 2, and 50% of the
organizations provide services to Ward 3. This information indicates that a number of the
responding organizations provide services to multiple demonstrating that clients from all parts
of the District have access to some services.
Figure 39 shows DCOA programs and services provided by responding organizations.
Responses that indicate “other” included: home-delivered meals, crisis intervention, caregiver
support services, volunteer legal assistance, and nutrition education and counseling.
Figure 39: DCOA Services Offered by Community Service Providers
Provider capacity to serve.
The capacity of service providers to serve and meet the needs of clients can play an
important role in decisions to increase or decrease funding and create policies or programs to
support agencies. The community resource inventory showed that the responding providers
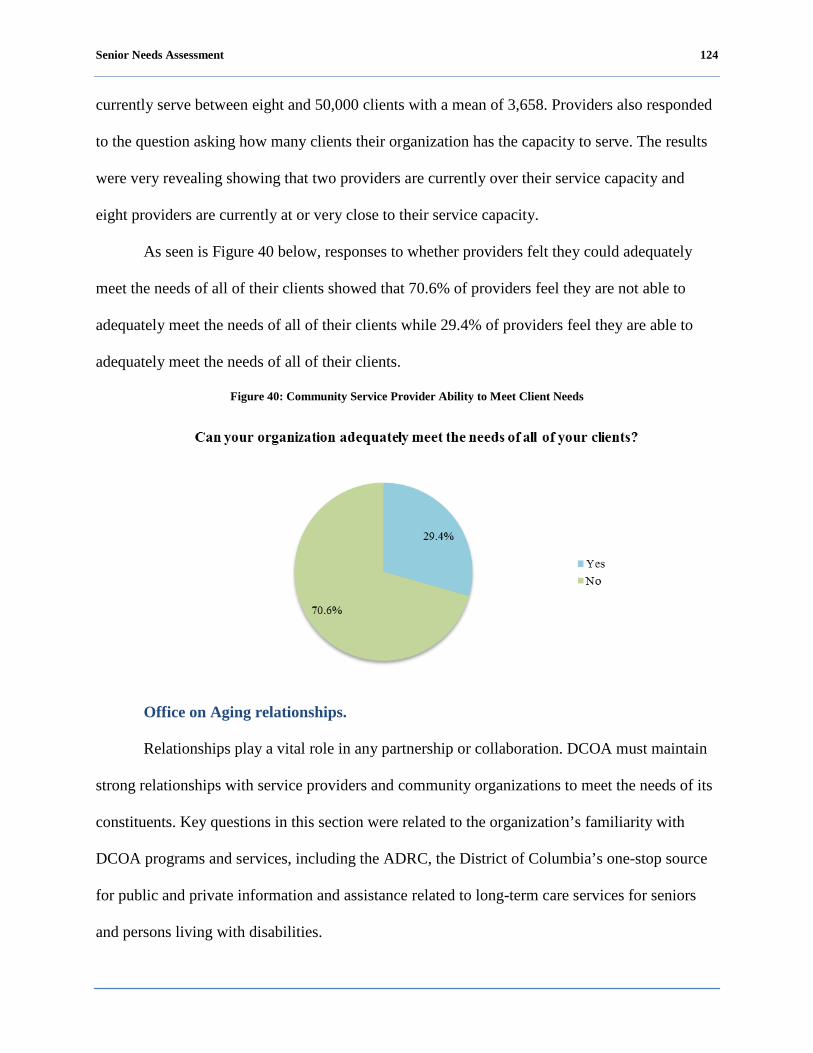
Senior Needs Assessment 124
currently serve between eight and 50,000 clients with a mean of 3,658. Providers also responded
to the question asking how many clients their organization has the capacity to serve. The results
were very revealing showing that two providers are currently over their service capacity and
eight providers are currently at or very close to their service capacity.
As seen is Figure 40 below, responses to whether providers felt they could adequately
meet the needs of all of their clients showed that 70.6% of providers feel they are not able to
adequately meet the needs of all of their clients while 29.4% of providers feel they are able to
adequately meet the needs of all of their clients.
Figure 40: Community Service Provider Ability to Meet Client Needs
Office on Aging relationships.
Relationships play a vital role in any partnership or collaboration. DCOA must maintain
strong relationships with service providers and community organizations to meet the needs of its
constituents. Key questions in this section were related to the organization’s familiarity with
DCOA programs and services, including the ADRC, the District of Columbia’s one-stop source
for public and private information and assistance related to long-term care services for seniors
and persons living with disabilities.
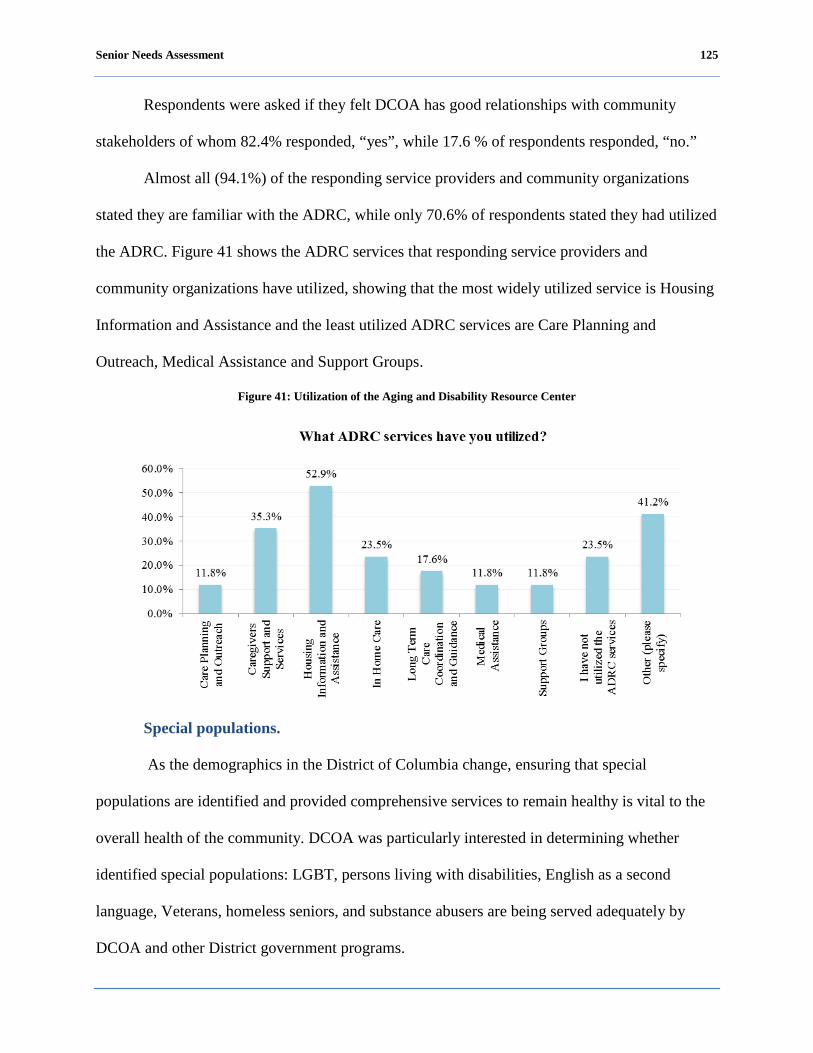
Senior Needs Assessment 125
Respondents were asked if they felt DCOA has good relationships with community
stakeholders of whom 82.4% responded, “yes”, while 17.6 % of respondents responded, “no.”
Almost all (94.1%) of the responding service providers and community organizations
stated they are familiar with the ADRC, while only 70.6% of respondents stated they had utilized
the ADRC. Figure 41 shows the ADRC services that responding service providers and
community organizations have utilized, showing that the most widely utilized service is Housing
Information and Assistance and the least utilized ADRC services are Care Planning and
Outreach, Medical Assistance and Support Groups.
Figure 41: Utilization of the Aging and Disability Resource Center
Special populations.
As the demographics in the District of Columbia change, ensuring that special
populations are identified and provided comprehensive services to remain healthy is vital to the
overall health of the community. DCOA was particularly interested in determining whether
identified special populations: LGBT, persons living with disabilities, English as a second
language, Veterans, homeless seniors, and substance abusers are being served adequately by
DCOA and other District government programs.
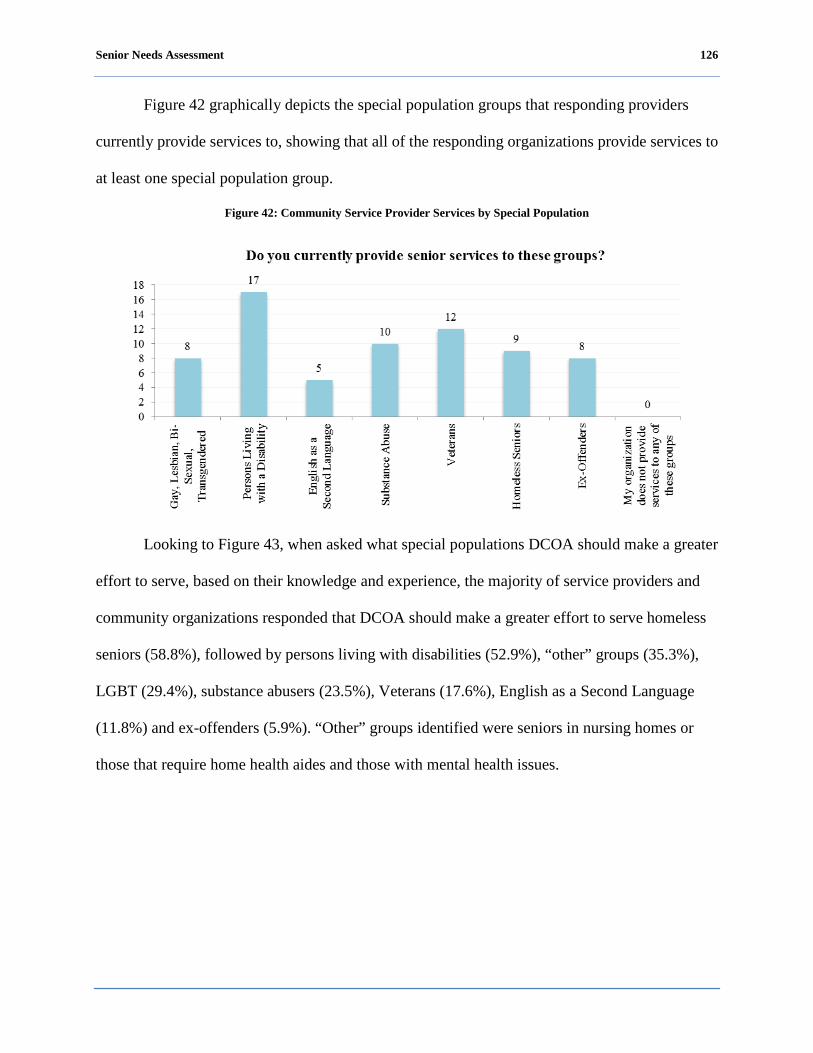
Senior Needs Assessment 126
Figure 42 graphically depicts the special population groups that responding providers
currently provide services to, showing that all of the responding organizations provide services to
at least one special population group.
Figure 42: Community Service Provider Services by Special Population
Looking to Figure 43, when asked what special populations DCOA should make a greater
effort to serve, based on their knowledge and experience, the majority of service providers and
community organizations responded that DCOA should make a greater effort to serve homeless
seniors (58.8%), followed by persons living with disabilities (52.9%), “other” groups (35.3%),
LGBT (29.4%), substance abusers (23.5%), Veterans (17.6%), English as a Second Language
(11.8%) and ex-offenders (5.9%). “Other” groups identified were seniors in nursing homes or
those that require home health aides and those with mental health issues.

Senior Needs Assessment 127
Figure 43: Special Populations to be Served by DCOA
Caregivers are an important part of the long-term delivery of health care for seniors and
persons living with disabilities. In this regard, support is critical so that caregivers can maintain
their own mental, physical, and emotional health. Over half (52.9%) of the responding service
providers and community organizations reported they provide support services for caregivers
showing that the most widely offered services are advocacy and case management and the least
offered services are home maker, transportation, and financial assistance. “Other” responses
included: Alzheimer’s support, crisis intervention and counseling and referrals. Figure 44
graphically depicts how many of the responding organizations provide specific support services
to caregivers.
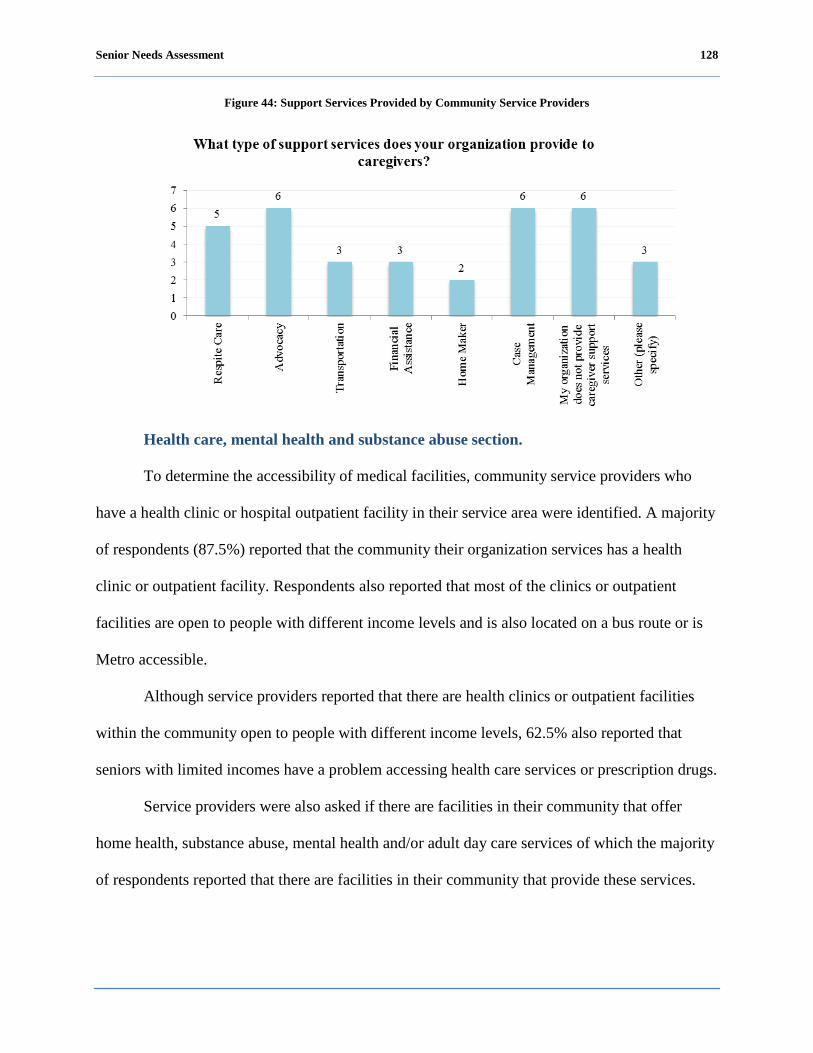
Senior Needs Assessment 128
Figure 44: Support Services Provided by Community Service Providers
Health care, mental health and substance abuse section.
To determine the accessibility of medical facilities, community service providers who
have a health clinic or hospital outpatient facility in their service area were identified. A majority
of respondents (87.5%) reported that the community their organization services has a health
clinic or outpatient facility. Respondents also reported that most of the clinics or outpatient
facilities are open to people with different income levels and is also located on a bus route or is
Metro accessible.
Although service providers reported that there are health clinics or outpatient facilities
within the community open to people with different income levels, 62.5% also reported that
seniors with limited incomes have a problem accessing health care services or prescription drugs.
Service providers were also asked if there are facilities in their community that offer
home health, substance abuse, mental health and/or adult day care services of which the majority
of respondents reported that there are facilities in their community that provide these services.
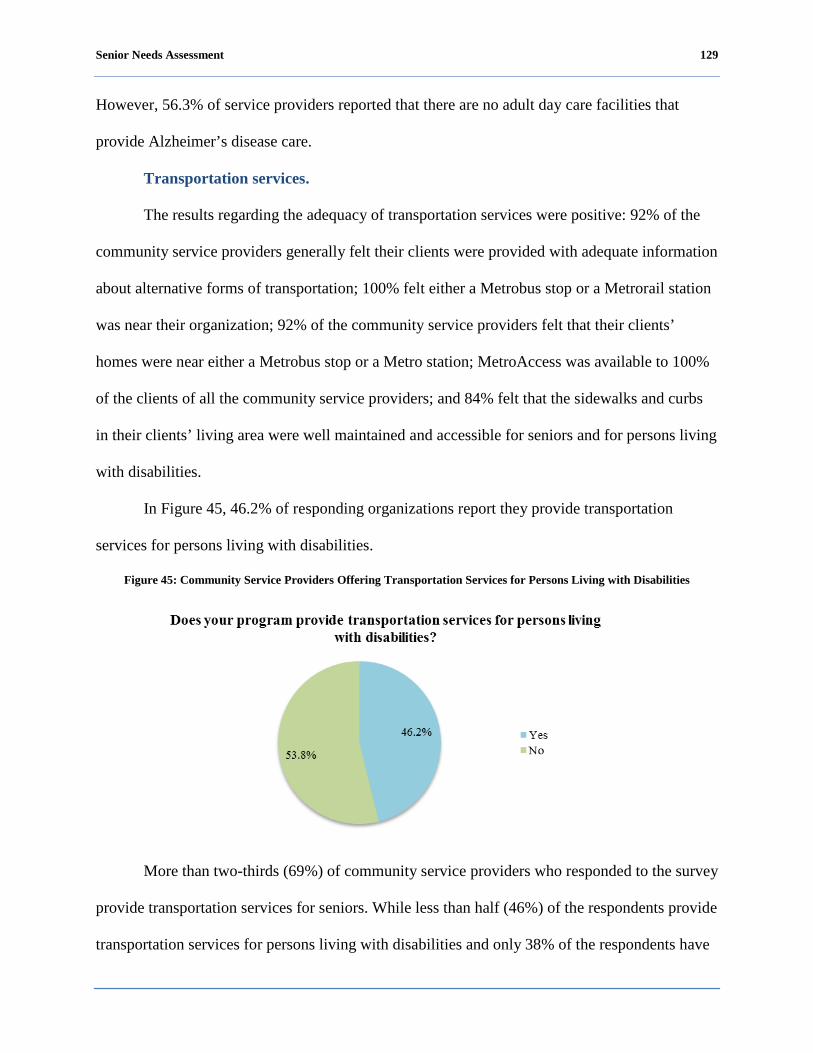
Senior Needs Assessment 129
However, 56.3% of service providers reported that there are no adult day care facilities that
provide Alzheimer’s disease care.
Transportation services.
The results regarding the adequacy of transportation services were positive: 92% of the
community service providers generally felt their clients were provided with adequate information
about alternative forms of transportation; 100% felt either a Metrobus stop or a Metrorail station
was near their organization; 92% of the community service providers felt that their clients’
homes were near either a Metrobus stop or a Metro station; MetroAccess was available to 100%
of the clients of all the community service providers; and 84% felt that the sidewalks and curbs
in their clients’ living area were well maintained and accessible for seniors and for persons living
with disabilities.
In Figure 45, 46.2% of responding organizations report they provide transportation
services for persons living with disabilities.
Figure 45: Community Service Providers Offering Transportation Services for Persons Living with Disabilities
More than two-thirds (69%) of community service providers who responded to the survey
provide transportation services for seniors. While less than half (46%) of the respondents provide
transportation services for persons living with disabilities and only 38% of the respondents have
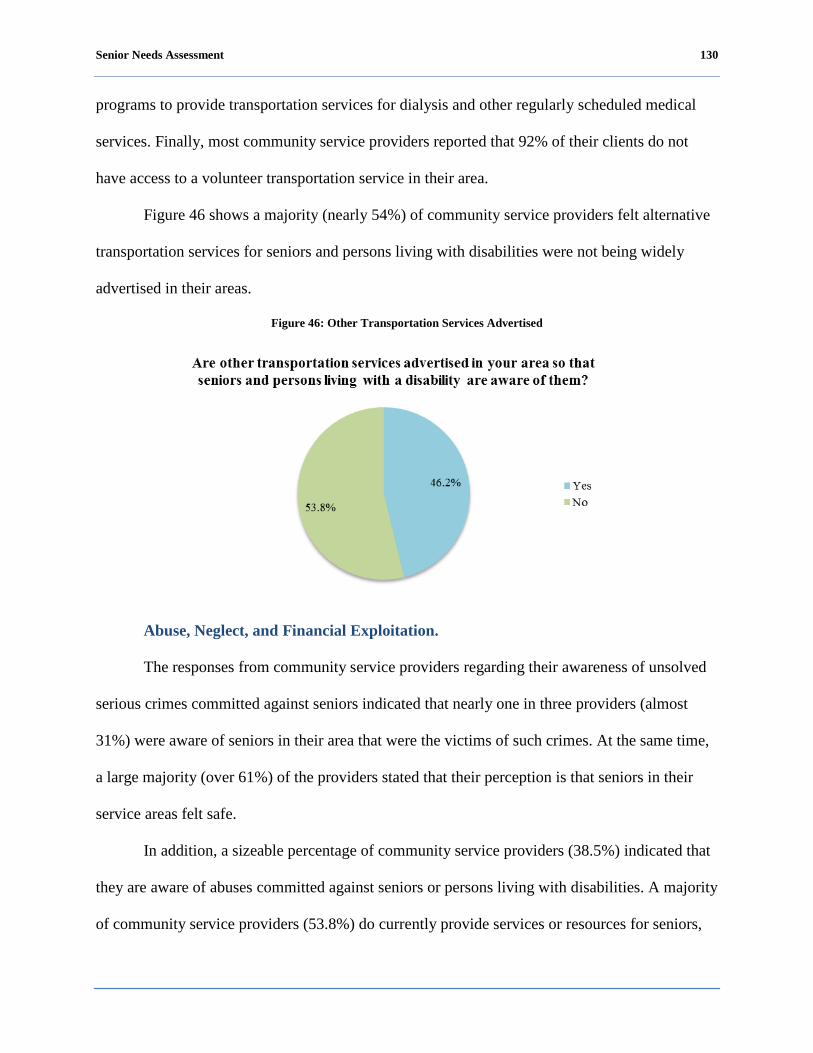
Senior Needs Assessment 130
programs to provide transportation services for dialysis and other regularly scheduled medical
services. Finally, most community service providers reported that 92% of their clients do not
have access to a volunteer transportation service in their area.
Figure 46 shows a majority (nearly 54%) of community service providers felt alternative
transportation services for seniors and persons living with disabilities were not being widely
advertised in their areas.
Figure 46: Other Transportation Services Advertised
Abuse, Neglect, and Financial Exploitation.
The responses from community service providers regarding their awareness of unsolved
serious crimes committed against seniors indicated that nearly one in three providers (almost
31%) were aware of seniors in their area that were the victims of such crimes. At the same time,
a large majority (over 61%) of the providers stated that their perception is that seniors in their
service areas felt safe.
In addition, a sizeable percentage of community service providers (38.5%) indicated that
they are aware of abuses committed against seniors or persons living with disabilities. A majority
of community service providers (53.8%) do currently provide services or resources for seniors,
Senior Needs Assessment 131
persons with disabilities and caregivers who are being physically, mentally, emotionally or
financially abused.
Recreation services.
The results of the survey regarding the availability of recreation services were very
positive. One hundred percent of the community service providers who responded to the survey
reported that there was a senior center, wellness center, or recreation center near the homes of the
seniors they serve. In the view of community service providers, the vast majority of these centers
(84%) have programs that help seniors become more self-sufficient. Ninety-two percent of the
community service providers responding to the survey reported that there were centers nearby
where seniors could exercise or engage in physical activity.
Community services and support.
While all community service providers responding to the survey reported that they were
aware of a directory of services for seniors, persons living with disabilities, and/or caregivers,
over 69% of these community service providers also reported that these services were not well
publicized.
Almost 77% of the community service providers reported there were seniors that
volunteer in their area to help other seniors; 84% of the churches in their area provide services to
seniors; and 69% of the community service providers use volunteers to provide services or
information about their programs for seniors, persons living with disabilities, and caregivers.
Only 7% of the community service providers responding to the survey reported that they
provide financial counseling services for seniors in their area. Community service providers
reported a sizeable percentage of their client group were victimized by either unscrupulous
Senior Needs Assessment 132
contractors or others, thus supporting the argument that financial counseling is a critically needed
service for seniors, persons living with disabilities, and caregivers.
Over 92% of the community service providers responding to the survey reported that they
provide opportunities for inter-generational discussions or activities with seniors. Sixty-nine
percent of these community service providers offer information about the availability of legal
services to seniors, persons living with disabilities and/or caregivers. In addition, 85% of these
providers reported that the seniors they serve need affordable housing programs and 76% of
respondents reported the availability of affordable housing as a serious problem.
Senior Needs Assessment 133
Conclusions
As the demographic composition of the District population continues to grow and
change, the needs of special populations must be identified and addressed to maintain a healthy
population. Service providers expressed that DCOA should make a greater effort to serve the
following identified special populations:
Homeless seniors;
Persons Living with Disabilities;
LGBT;
Substances Abusers;
Veterans;
English as a Second Language; and
Ex-Offenders.
Overall, although service providers reported that they feel that most seniors and persons
living with disabilities have access to health care facilities in their communities, they also
reported that seniors with limited incomes experience problems getting necessary prescription
drugs and health care services.
In general, service providers felt that transportation services are adequate for seniors and
persons living with disabilities. Fifty-four percent of service providers reported that they provide
transportation services for persons living with disabilities. However, 54% of service providers
also reported that alternative transportation services are not advertised in their service area so
that seniors and persons living with disabilities are aware of them.
Even though one-third of the community service providers know of seniors who have
been victimized by unscrupulous contractors and financial exploitation, only a small fraction of
community service providers responding offer financial counseling services for their clients.
Senior Needs Assessment 134
Community service providers also reported that the lack of affordable housing programs
for seniors and persons living with disabilities is a problem in the District of Columbia.
The following maps show the service categories by ward of DCOA network providers of
services and the out-of-network unpaid, natural supports, and additional community providers
that District seniors, persons living with disabilities and senior caregivers can access.
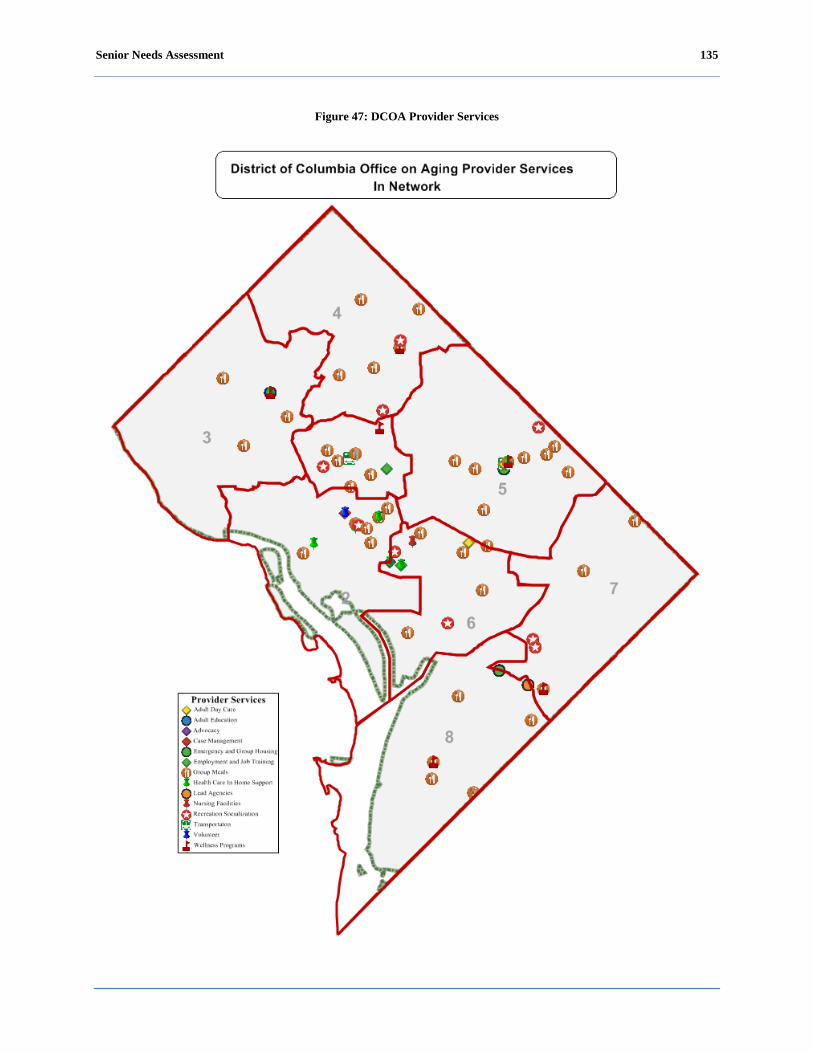
Senior Needs Assessment 135
Figure 47: DCOA Provider Services
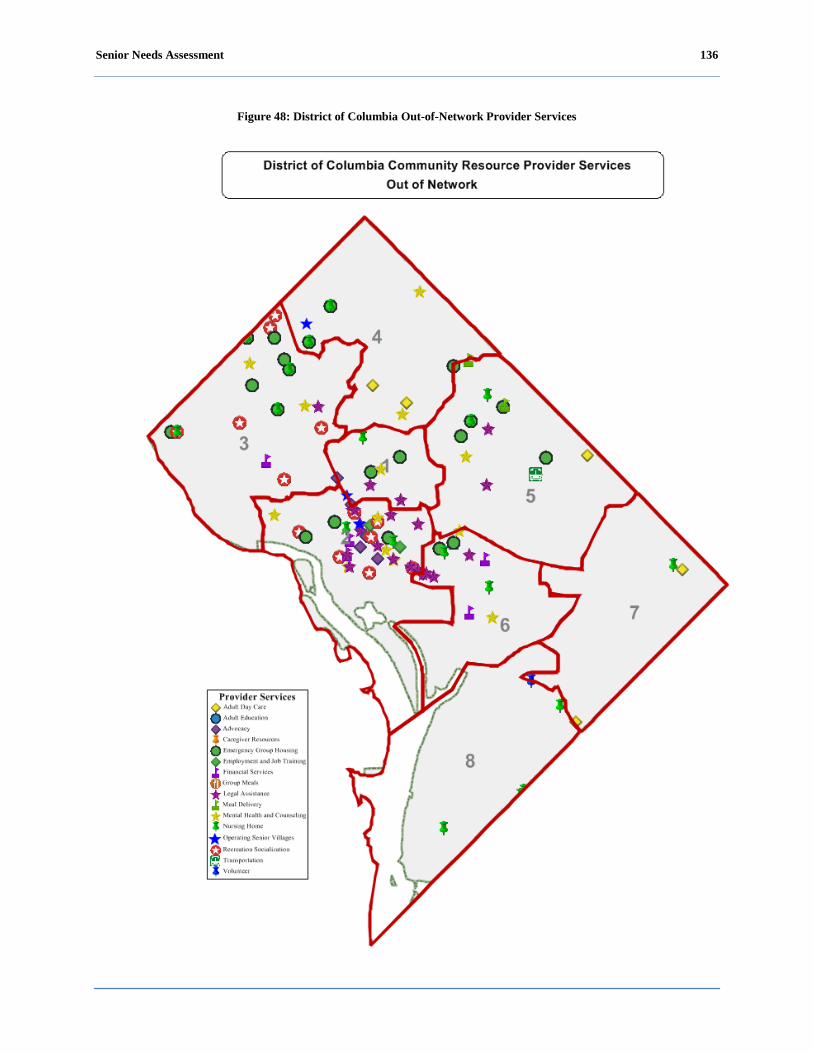
Senior Needs Assessment 136
Figure 48: District of Columbia Out-of-Network Provider Services

Senior Needs Assessment 137
The key questions in this section were related to whether community service providers
believed their services were adequate to meet the current needs of their existing and potential
client base, and whether the single DCOA point of entry, the Aging Disability Resource Center
(ADRC), was widely known and well utilized. DCOA was particularly interested in determining
whether special populations, LGBT, persons living with a disability, English as a Second
Language, veterans, homeless seniors, were being served adequately by DCOA and other
District government programs.
Finally, DCOA wanted to assess the needs of persons living with disabilities in the
context of ADL or IADL.

Senior Needs Assessment 138
Older Adults on the Way: The Baby Boom Generation
A very important group that will have a considerable impact on the ability of local, state,
and federal government agencies to provide services for seniors, caregivers, and the disabled is
the baby boomer generation. The baby boomer generation is made up of those persons born
between 1946 and 1964. In 2011, the first set of baby boomers turn 65 years old.
Baby Boomers Nationally
The U.S. Census Bureau predicts that in the years between 2010 and 2050, there will be a
rapid growth in the older population of people who are 65 years of age or older. In 2010, there
were 40.2 million people over the age of 65. By 2050, the U.S. Census Bureau projects there will
be 88.5 million people in the U.S. over the age of 65. This doubling of the number of seniors will
significantly impact local as well as federal government budgets for senior services. At the same
time, the level and type of services being requested will change depending on the specific
demographics (U.S. Census Bureau, 2010).
The U.S. Census Bureau predicts some significant changes over the next several decades:
Racial and ethnic diversity among the older population will increase. Over time, all racial
groups will increase as the percentage of Caucasians in the older population decline. The
older population is expected to be 42% minority by 2050. As of 2010, the older population
was 20% minority.
Medicare and Social Security will face some new significant policy and funding challenges.
The number of people in the oldest age group, aged 85 or older, is expected to grow from 5.9
million in 2010 to 8.7 million people in 2030. In 2050, this group is expected to reach 19
million people.
The proportion of older people over the age of 65 is projected to increase and by 2030,
there will be more than 70 million Americans over the age of 65 (The American Hospital
Senior Needs Assessment 139
Association and First Consulting Group, 2007). This increase in the number of seniors in a fairly
short period of time will present challenges to national and local policy makers and programs,
having implications on the current system of care.
The majority of older adults suffer from at least one chronic condition. The American
Hospital Association and First Consulting Group (2007) reported that by 2030 six out of 10 baby
boomers will be managing more than one chronic condition. The number of aging baby
boomers will increase the number of elderly with disabilities and the need for services.
Significant changes in policies and the manner in which health care is provided to the older
population will need to be addressed in the coming years (Long-Term Care: Aging Baby Boom
Generation Will Increase Demand and Burden on Federal and State Budget, 2002).
The Institute of Medicine (2008) “recommended a three-prong approach to addressing
the growing population of older Americans that includes: (1) enhancing geriatric competence of
the entire workforce; (2) increasing recruitment and retention of geriatric specialists and
caregivers; and (3) improving the delivery of care” (p. 1). The approach that has the greatest
implications for the way care is delivered is the third. Key principles for future care of older
adults include:
Addressing the health needs of the older population comprehensively;
Providing services efficiently; and
Encouraging older persons to be active partners in their own healthcare.
Toossi (2005) predicted that there will be a slowdown in the growth of the labor force
due to the expectancy of baby boomers decreasing their participation rates and/or leaving the
labor force. Historically, as cohorts of the U.S. population reached a certain age or retirement
age, they left the labor force. Because of the recent economic downturn, baby boomers are
remaining in the labor force longer. In many cases, their retirement funds have been dramatically

Senior Needs Assessment 140
reduced and they have no choice but to continue working. In 2014, the labor force is predicted to
be older and more diverse including large numbers of blacks or African Americans, Hispanics or
Latinos, Asians and LGBT workers that will make up the American workforce (U.S. Census,
2010).
Senior Needs Assessment 141
District of Columbia Issues
Based on new census data, the pre-senior population is the fastest-growing in the District
of Columbia, increasing by nearly 30% to about 64,000 during the last decade.
As they age, District of Columbia’s baby boomers are projected to cause a significant
increase in the senior population that mirrors the national trend, but it will not be quite as
dramatic. The local housing market may impact the demographic projections; some baby
boomers may sell their high value homes and move to lower cost areas in retirement, while
others may choose to migrate into the city to take advantage of the benefits of centralized urban
living.
Planning efforts should focus on the numbers of seniors who are expected to be in the
District of Columbia because of the number of pre-seniors that are a part of the fastest growing
population. District of Columbia’s baby boomers are more likely to have income well above the
federal poverty level than the city’s current seniors age 65 or older (U.S. Census Bureau, 2010).
District of Columbia’s baby boomers are significantly less likely to own their homes than
are baby boomers nationally. Nationwide, 70% of all households headed by a baby boomer own
their housing units; though lower in the District of Columbia, at only 42%. These figures have an
impact on aging in place options for seniors, caregivers, and government agencies (U.S. Census
Bureau, 2010).
Nationally, baby boomers have a higher level of education than any generation. In the
District of Columbia, this trend is dramatic. More than 50% of the baby boomers in the District
of Columbia had at least a bachelor’s degree in 2010 (U.S. Census Bureau, 2010).
Overall, it is not clear what all the impacts will be locally for baby boomers entering their
senior years. Higher income and education levels combined with the possibility that baby

Senior Needs Assessment 142
boomers may now stay in the workforce longer, lead to the conclusion that the types of services
that boomers will require will be quite different from the services currently provided.
Senior Needs Assessment 143
Conclusions
A very significant change in the senior population is rapidly approaching and will have a
considerable impact on the ability of local, state, and federal government agencies to provide
services. DCOA must recognize this oncoming challenge and commit to continuously expanding
its services to better serve the growing population of seniors and persons living with disabilities.
In the District of Columbia, there is expected to be a sharper contrast between younger
seniors, primarily baby boomers, who will have more education, more income in their work lives
and larger pensions in retirement as compared with older seniors (85+) who typically have less
education and less income. Based on projected population growth, it is possible to have an
entirely different set of needs identified for DCOA’s client groups in the next two decades as the
number of baby boomers enlarges the pool of seniors, disabled, and special populations. At the
same time, District government agency budgets may be reduced by continued economic stress
nationally and by declines in the size of the available workforce.
Senior Needs Assessment 144
Recommendations
This section provides recommendations drawn from best practices and needs assessment
findings. Recommendations for each of the 14 focus areas have been merged into four themes
that will be discussed as follows.
Outreach & Advocacy
Improved outreach to seniors is strongly encouraged. Feedback from a number of the
needs assessment findings expressed strong concern about the lack of information or knowledge
about programs and services for seniors. During key informant sessions, providers expressed
concern that many seniors were unaware of services available to them. During focus group
discussions, seniors and persons living with disabilities repeatedly expressed frustration about
the lack of information related to senior programs, events, and services. Oftentimes, seniors
complained that information was not available or was provided too late for their use.
Recommendation 1: Improve information dissemination. DCOA should expand ADRC
programs to raise awareness about programs such as respite support offered through the ADRC
and provide a direct response to senior inquiries. The ADRC should broadly promote their
programs and services. DCOA should organize events, like senior fairs, to better inform seniors
about its programs and services. According to the survey respondents, 77.4% of participants
were unaware of the ADRC services.
Recommendation 2: Improve outreach by creating a senior television program segment.
Seniors during focus group discussions proposed a senior program segment for DCTV. The
segment could be implemented utilizing free public television, similar to the broadcast of city
council hearings. They proposed airing the program on an established schedule, tailoring the
Senior Needs Assessment 145
programming to educate seniors about senior services and recommended soliciting input from
seniors to include in the segment.
Recommendation 3: Establish a senior based information network. The network would
serve as a communications resource to maintain a link to seniors and provide important messages
on a regular basis. One of the potential uses of the network will be to remind seniors through
automated telephone calls about important services (e.g., new transportation service for seniors
with limited mobility) or acquaint all seniors of changes in program services or similar
information.
Recommendation 4: Expand its Employment Training and Placement program to
provide seniors with greater employment opportunities. According to seniors seeking jobs, more
assistance is needed in order to help them find paid employment opportunities. DCOA should
establish programs to develop job-related skills by providing work assignments with nonprofits
and government agencies. Also, develop a senior workforce board to ensure the formation of
partnerships throughout the community and representation of older workers on the Workforce
Investment Council.
Senior Needs Assessment 146
Collaborations & Partnerships
The coordination between District government agencies is necessary because of the
legislative and fiscal mandates that define the level and types of activity that agencies can engage
in. The demographic changes that have been presented in this needs assessment and the
programmatic realities that District government agencies will face argue strongly for close
collaborations. DCOA should work closely with every major agency in the District of Columbia
to ensure that needs of seniors are addressed within all agency programs.
Recommendation 1: Strengthen collaborations with the District of Columbia
Department of Transportation (DDOT) to improve “walkability” for seniors and disabled
residents. Utilizing data regarding the concentrated locations of seniors and disabled residents in
order to design and improve walkability options is one critical step that DCOA and DDOT can
take to improve the lives of seniors and the disabled. Timely sidewalk maintenance and more
specific attention to the timing of traffic lights and the placement of stop signs are important
ways to promote walkability options as well.
Recommendation 2: Enhance collaborations with the District of Columbia Department
of Parks and Recreation (DPR) to initiate new programs to attract younger seniors to District of
Columbia recreation centers to promote physical activity and maintain the highest level of
mobility and independence. Because DCOA operates recreation, nutrition, health seminars, and
health training programs for seniors at its wellness centers and DPR operates the District of
Columbia’s recreation centers, a strong collaboration between DCOA and DPR can provide new
programs to support seniors. This partnership can also address concerns expressed in the focus
group discussions about the lack of social interaction for seniors, especially those that live
independently. In particular, the Hispanic or Latino focus group participants cited the lack of
Senior Needs Assessment 147
socialization activities as the leading cause of depressions among Hispanic or Latino seniors.
Asian participants felt there were no facilities that offer activities of interest to them, such as
chess and mahjong.
Recommendation 3: Establish or strengthen a partnership or collaboration with the
Office of Planning (OP) to help identify the best locations for community resources and
amenities. DCOA and OP should develop a focused discussion process which includes seniors
and the disabled as well as the agencies who serve them to help make and publicize decisions
regarding community resources and amenities.
Recommendation 4: Build collaborations with key District of Columbia Public Schools
(DCPS) and colleges, similar to the DCPS culinary arts program. This collaboration could pilot
programs or use existing programs that offer training and certifications to prepare young people
with an interest in geriatric services or studies in the field of gerontology. DCOA can utilize its
existing relationship with the University of the District of Columbia’s gerontology program. This
partnership can introduce an internship program providing an ongoing source of professionals to
serve the District of Columbia’s senior community and allow for the opportunity to introduce
other intergenerational partnerships.
Recommendation 5: Build a strong collaboration with the District of Columbia
Department of Mental Health (DMH). As seniors age, particularly those 85 years and older,
when fewer friends and peers remain for social interactions, they can become depressed and
often express feelings of sadness. In addition, participants in a number of focus groups cited a
lack of programs to address loneliness and depression. LGBT focus group participants reported
having high rates of suicide that generally occur after the loss of a partner. A close partnership

Senior Needs Assessment 148
with DMH can help foster programs to help seniors manage a variety of emotional and mental
health issues.
Recommendation 6: Collaborate with the District of Columbia Department of Human
Services (DHS) to enhance programs and services for low income seniors and persons living
with disabilities. These programs and services can improve access for seniors to DHS programs
like food stamps to supplement food allowances and promote healthier food purchases. The
collaboration could also include programs to provide vouchers to eligible seniors and persons
living with disabilities to assist with food purchases.
Recommendation 7: Expand the partnership with the District of Columbia Housing
Authority (DCHA) to establish a resident assistant or floor captain system within senior housing
facilities. Resident assistants or floor captains would be responsible for duties such as checking
on other seniors on a regular basis to ensure and report wellness.
Recommendation 8: Establish or strengthen collaborations with the District of Columbia
Regulatory Authority (DCRA) and the District Office of the Attorney General (OAG). This
collaboration can build programs to identify unscrupulous contractors who take advantage of
seniors, review their licensing, gather complaints, and use an effective grievance process to
benefit seniors. The OAG has the authority to prosecute contractors that harm seniors and violate
the law.
Recommendation 9: Establish or strengthen collaborations with the MPD.
Collaborations with MPD should include safety and awareness seminars for senior centers and
people with disabilities and strategies to increase police presence near senior housing complexes
and facilities with greater numbers of seniors and people with disabilities.
Senior Needs Assessment 149
Recommendation 10: Collaborate with the District of Columbia Department of Public
Works (DPW) to address the special needs of seniors with garbage pick-up challenges. A
collaboration between DCOA and DPW can address a special problem that affects seniors with
limited mobility and the disabled with less physical capability to handle their trash disposal
needs both outside and sometimes inside their homes. Help with moving “supercans” for trash
pick-up and proper return of trash cans to their suitable locations is an important need of seniors
and the disabled with limited mobility.
Recommendation 11: Strengthen the relationship with the WMATA to improve
transportation services for seniors and persons with disabilities. DCOA and WMATA must work
to improve the MetroAccess ridership experiences for seniors. In addition, DCOA should work
with WMATA to consider the needs of seniors for bus routes and similar planning.
Recommendation 12: Collaborate with non-profit or other organizations in the District
of Columbia to create safe places to support the LGBT community. During the focus group
session, they voiced concerns about the lack of social opportunities for LGBTs.
Senior Needs Assessment 150
Connecting to the Community
In times of limited resources, government agencies are forced to do more with less. A
strategy strongly supported by many of the seniors participating in focus group discussions was
to leverage the commitment from seniors to support each other. Most seniors have lived in their
communities for many years and are very familiar with their neighbors and oftentimes provide a
wide range of support.
Recommendation 1: Provide leadership to facilitate and expand the use of the “village”
model. This concept is currently underway in certain parts of the District of Columbia and has
the potential to provide a number of benefits and create a mechanism for seniors to take the lead
in providing support for their own neighborhoods. First, it takes advantage of the opportunity for
neighbors to serve as providers of basic support services. Second, the village model promotes a
sense of a social support within the community. Third, it has the potential to reduce the cost to
government agencies when the village community provides support services, such as
transportation or coordinating volunteers to help seniors with grocery needs or similar
requirements.
Although the village model may be ideal for some communities, some seniors expressed
concerns for keeping costs associated with the village model to a minimum. Because most
seniors have fixed incomes, cost of participating in village services can become a concern.
Additionally, there were recommendations to identify resources and interest in village concepts
within communities to gauge the likeliness of their success in various communities.
Recommendation 2: Weigh the feasibility of extending the hours of operations at
wellness centers on some days during the week to accommodate working seniors. This would

Senior Needs Assessment 151
allow seniors that work during the day the opportunity to participate in recreational and social
activities with their peers.
Senior Needs Assessment 152
Support Resources
During many of the focus groups, seniors and persons living with disabilities across each
race/ethnic population complained about the lack of skilled, professional and ethnical resources
to assist with their basic needs. The LGBT seniors complained about the lack of home health
care providers trained to deliver care to LGBT individuals. The Hispanic or Latino and Asian
participants cited similar concerns, especially language barriers.
Recommendation 1: Institute an evaluation or monitoring process of home health aide
services and vendors. Home health aides play an integral role in the overall long-term health and
wellness of seniors and persons living with disabilities. Many focus group participants cited
various complaints about some home health aides including tardiness, theft or property damage,
and failure to perform assigned tasks. Some seniors suggested that DCOA should ensure that
background checks of home health aides are performed and action taken promptly when
violations occur.
Recommendation 2: Expand case management and support services. Over 50% of focus
group participants were unaware that case management services existed. Particularly, Hispanic
or Latinos, Asians, and persons living with disabilities were unaware. Seniors cited a host of
services that could be improved through case management, including, housing assistance, in-
home care, income assistance, transportation, recreation, and advocacy.

Senior Needs Assessment 153
Summary
Seniors provided numerous recommendations for ways DCOA could better serve their
needs. The recommendations outlined in this report were drawn from the assessment findings
and best practices for serving similar populations. The recommendations were provided from
each of the 14 focus areas and were merged into four major themes. Overall, seniors felt that
improved outreach and advocacy; stronger collaborations and partnerships; better connections to
the community and improvements in the quality of support resources would better meet their
needs and improve their quality of life.

Senior Needs Assessment 154
References
Administration on Aging [AoA] (2010). A profile of older Americans: 2010. Washington, DC:
U. S. Department of Health and Human Services. Retrieved from http://www.aoa.gov/
American Association of Retired Persons [AARP] Public Policy Institute. (2008). Valuing the
invaluable: The economic value of family caregiving, 2008 update. Insight on the Issues.
Retrieved from http://assets.aarp.org/rgcenter/il/i13_caregiving.pdf
American Association of Retired Persons [AARP] Public Policy Institute (2011). District of
Columbia state housing profiles. Retrieved from http://assets.aarp.org/rgcenter/ppi/liv-
com/AARP-HouProf_2011-DCs.pdf
Americans with Disabilities Act of 1990, Pub. L. No. 101-336, § 2, 104 Stat. 328 (1991).
Baskins, J., & Eleazer, P. (2004). Geriatric best practices compendium, successful and
sustainable systems and methods, geriatric best practices initiative. Retrieved from
http://www.musc.edu/scgec/downloads/SC-GEC%20Best%20%Practicies%20
Compendium.pdf
Centers for Disease Control and Prevention. (n.d.) The state of aging and health in America
report: 2008-2009 District of Columbia report card. Retrieved from
http://apps.nccd.cdc.gov/SAHA/Default/ReportDetail.aspx?State=DC
Cohen, R., (2011) Aging in community, planning for sustainable communities. Retrieved from
http://www.agingcommunity.com/models/village_networks/
beacon_hill_village_boston_.html
Coughlin, J. (2010). Estimating the impact of caregiving and employment on well-being.
Outcomes and Insights in Health Management, 2(1). Retrieved from http://www.well-
beingindex.com/files/20100513_CHR_CareGiving.pdf

Senior Needs Assessment 155
Department of Elder Affairs, State of Florida (2006). Best practices in Florida’s senior centers.
Retrieved from http://elderaffairs.state.fl.us/doea/seniorcenter/BestPractices.pdf
Erickson, W, Lee, C. & von Schrader, S (2010). 2008 disability status report: The United States.
Ithaca, NY Cornell University Rehabilitation Research and Training Center on Disability
Demographics and Statistics.
Family Caregiving Alliance. (2011). Selected caregiver statistics. [Fact Sheet]. Retrieved from
http://www.caregiver.org/caregiver/jsp/content_node.jsp?nodeid=439
Fredricksen-Goldsen, K.I., Kim, J., Emlet, C.A., Muraco, A., Erosheva, E.A., Hoy-Ellis,
C.P.,…Petry, H. (2011). The aging and health report: Disparities and resilience among
lesbian, gay, bisexual and transgender older adults. Retrieved from
http://caringandaging.org/wordpress/wp-content/uploads/2011/05/Full-Report-
FINAL.pdf
Garner, T. & Byrd, A. (2008). A District of Columbia behavioral risk factor surveillance system
annual report. Retrieved from http:dchealth.dc.gov/doh/lib/doh/services/
administration_offices/phsa/behavioral_risk/pdf/BRFSS_2008_Annual_Report_Final.pdf
Institute of Medicine (2008). Retooling for an aging America: Building the health care
workforce. Retrieved from http://www.iom.edu/~/media/Files/ Report%20Files/
2008/Retooling-for-an-Aging-America-Building-the-Health-Care-Workforce/
RetoolingforanAgingAmericaBuildingtheHealthCareWorkforce.pdf
Jacobsen, L., Kent, M., Lee, M., & Mather, M. (2011). America's aging population. [Population
Bulletin], 66(1), 1-16. doi: 2301729261
Senior Needs Assessment 156
Long term care: Aging baby boom generation will increase demand and burden on federal and
state budgets: Hearing before the Special Committee on Aging (2002) (testimony of
David M. Walker).
Maryland Department of Aging (2009). Maryland communities for a lifetime: Report of the
statewide empowerment zones for seniors commission. Retrieved from
http://www.aging.maryland.gov/documents/ Commission%20Report%207-1-
09%20Final2.pdf
Massachusetts Housing and Shelter Alliance (2010). Home & healthy for good: A statewide
housing first program – Progress report. Retrieved from http://www.mhsa.net/matriarch/
documents/MHSA_HHG_December_2010_Final_Report.pdf
MetLife Mature Market Institute (2011). The MetLife study of caregiving costs to working
caregivers: Double jeopardy for baby boomers caring for their parents. Retrieved from
http://www.caregiving.org/wp-content/uploads/2011/06/mmi-caregiving-costs-working-
caregivers.pdf
Nagi, S.Z. (1969). Disability and rehabilitation. Columbus, OH: Ohio State University Press.
National Association of Area Agencies on Aging [n4a] (2011). The maturing of America,
getting communities on track for an aging population. Retrieved from
http://www.n4a.org/pdf/MOAFinalReport.pdf
National Alliance for Caregiving and AARP. (2005). Caregiving in the United States. Retrieved
from http://www.caregiving.org/data/Caregiving_in_the_US_2009_full_report.pdf
National Alliance for Caregiving and AARP. (2009). Caregiving in the U.S.: A focused look at
those caring for someone age 50 or older. Retrieved from
http://www.caregiving.org/data/FINALRegularExSum50plus.pdf
Senior Needs Assessment 157
National Institutes of Health. (2011). Disability in older adults [NIH Fact Sheet]. Retrieved from
http://report.nih.gov/NIHfactsheets/ViewFactSheet.aspx?csid=37
Super, N. (2002). Who will be there to care? The growing gap between caregiver supply and
demand. National Health Policy Forum. Washington, D.C
The American Hospital Association & First Consulting Group (2007). When I’m 64 how
boomers will change health care. Retrieved from http://aha.org/content/00-10/070508-
boomerreport.pdf
The Kaiser Family Foundation, statehealthfacts.org. Data Source: Health Insurance Coverage of
the Total Population, 2009-2010, accessed May 1, 2012.
The World Health Organization [WHO] (n.d.). Retrieved from https://apps.who.int/
aboutwho/en/definition.html
Toossi, M. (2005). Labor force projections to 2014: retiring boomers. Monthly Labor Review,
128(11), 25-44. Retrieved from http://www.cse.sc.edu/~buell/References/
U. S. Census Bureau (2010). American FactFinder [Fact Sheet]: Retrieved from
http://factfinder.census.gov
U. S. Census Bureau (2011). Income, poverty and health insurance coverage in the United
States: 2010. Retrieved from www.census.gov/prod/2010pubs/p60-238.pdf
U.S. Department of Health and Human Services, Office of the Inspector General (1987). Area
agencies on aging, selected best practices (Report No. OAI-03-87-002). Retrieved from
http://oig.hhs.gov/oei/reports/oai-03-87-0021.pdf
U.S. Department of Labor, Bureau of Labor Statistics (2010). Issues in Labor Statistics. Record
unemployment among older workers does not keep them out of the job market. Retrieved
from http://www.bls.gov/opub/ils/pdf/opbils81.pdf
Senior Needs Assessment 158
Vincent, G., K, & Velkoff, V. A. & U.S. Census Bureau (2010). The next four decades: The
older population in the United States: 2010 to 2050.Washington, DC: U.S. Dept. of
Commerce, Economics and Statistics Administration, U.S. Census Bureau.
von Schrader, S., Erickson, W. A., & Lee, C. G. (2010). Disability Statistics from the Current
Population Survey (CPS). Ithaca, NY: Cornell University Rehabilitation Research and
Training Center on Disability Demographics and Statistics (StatsRRTC). Retrieved
www.disabilitystatistics.org
Senior Needs Assessment 159
Appendix A: Survey Instruments
Community Resource Inventory
As a community service provider for the aging population in the District of Columbia, your views are very important to the District of Columbia Office on Aging (DCOA) as it assesses the services that it currently provides and those services that it needs to provide in the future. This survey is one way in which we will be soliciting your views. This survey begins with several questions that allow you to indicate your involvement with DCOA and its programs. The next parts of this survey are organized in sections to generate responses that focus on significant factors in the daily lives of aging District of Columbia residents over the age of 60, persons living with disabilities, and caregivers: health care, transportation, security, recreation, employment, case management, and community services and support. These are critical factors in determining whether the services that DCOA offers are relevant and useful to the aging population the District of Columbia. Census data projects a large increase in the number of aging people in all parts of the United States. While about 17% of District of Columbia residents are currently over age 60, the percentage of this population will increase over next two decades. As a result, it will be more important than ever for DCOA to use all of its available governmental and community resources to maintain an effective service delivery program for the District of Columbia’s aging population over the age of 60. Your responses on each part of this survey will help the District of Columbia and DCOA determine where it has gaps in its services and where it needs to leverage other government or private agency resources. We appreciate you taking the time in advance to complete this survey.
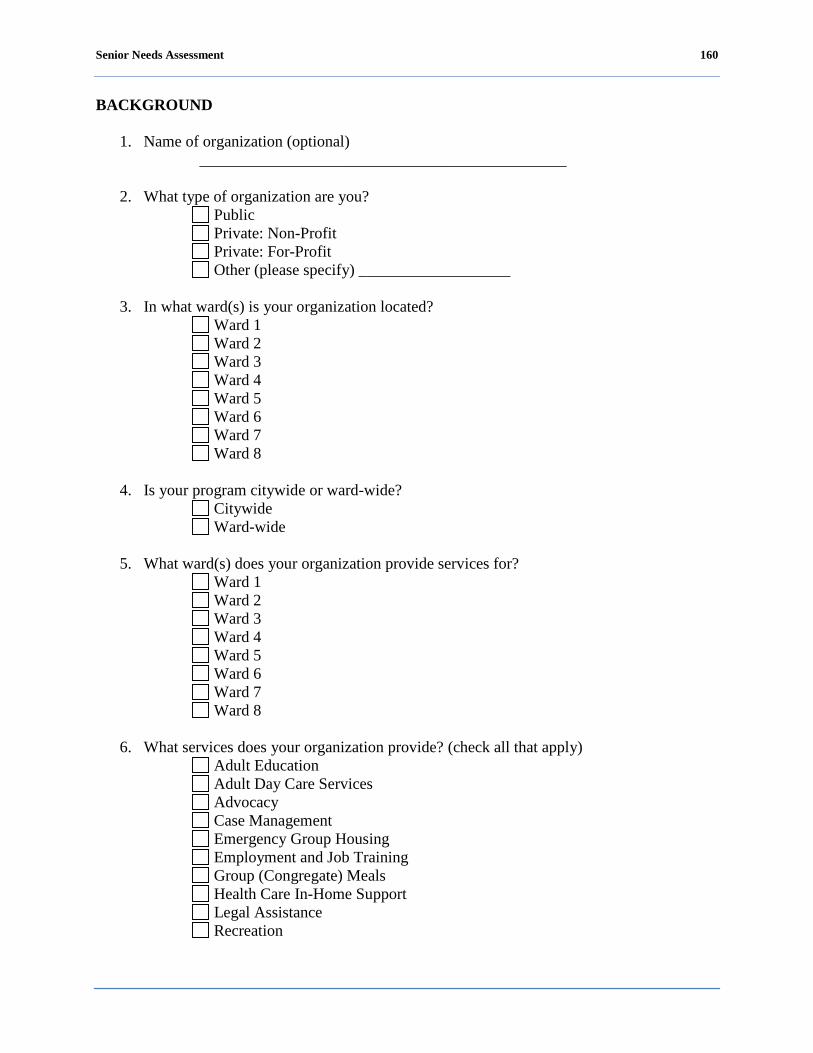
Senior Needs Assessment 160
BACKGROUND
1. Name of organization (optional) ______________________________________________
2. What type of organization are you?
Public Private: Non-Profit Private: For-Profit Other (please specify) ___________________
3. In what ward(s) is your organization located?
Ward 1 Ward 2 Ward 3 Ward 4 Ward 5 Ward 6 Ward 7 Ward 8
4. Is your program citywide or ward-wide?
Citywide Ward-wide
5. What ward(s) does your organization provide services for?
Ward 1 Ward 2 Ward 3 Ward 4 Ward 5 Ward 6 Ward 7 Ward 8
6. What services does your organization provide? (check all that apply)
Adult Education Adult Day Care Services Advocacy Case Management Emergency Group Housing Employment and Job Training Group (Congregate) Meals Health Care In-Home Support Legal Assistance Recreation

Senior Needs Assessment 161
Transportation Wellness Programs Other (please specify) ___________________
PROVIDER CAPACITY TO SERVE
1. How many clients does your organization currently serve?
________________________________________________
2. How many clients does your organization have the capacity to serve? ________________________________________________
3. Can your organization adequately meet the needs of all of your clients?
Yes No
If no, please provide any additional comments in the box below. ________________________________________________
DC OFFICE ON AGING RELATIONSHIPS
1. Is your agency familiar with DCOA?
Yes No
2. Is your organization involved in any programs with DCOA?
Yes No
3. If yes, please identify what DCOA programs your agency provides?
Adult Education Adult Day Care Services Advocacy Case Management Emergency Group Housing Employment and Job Training Group (Congregate) Meals Health Care In-Home Support Legal Assistance Recreation Transportation Wellness Programs Other (please specify) ___________________
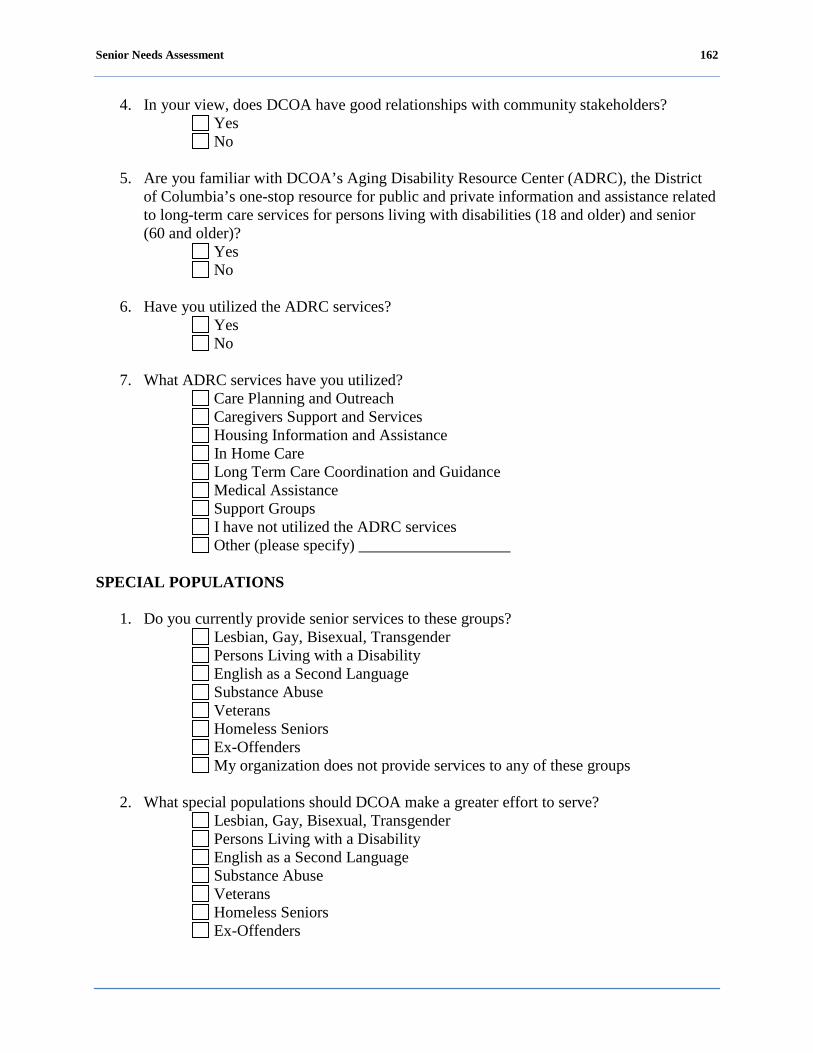
Senior Needs Assessment 162
4. In your view, does DCOA have good relationships with community stakeholders? Yes No
5. Are you familiar with DCOA’s Aging Disability Resource Center (ADRC), the District
of Columbia’s one-stop resource for public and private information and assistance related to long-term care services for persons living with disabilities (18 and older) and senior (60 and older)?
Yes No
6. Have you utilized the ADRC services? Yes No
7. What ADRC services have you utilized?
Care Planning and Outreach Caregivers Support and Services Housing Information and Assistance In Home Care Long Term Care Coordination and Guidance Medical Assistance Support Groups I have not utilized the ADRC services Other (please specify) ___________________
SPECIAL POPULATIONS
1. Do you currently provide senior services to these groups?
Lesbian, Gay, Bisexual, Transgender Persons Living with a Disability English as a Second Language Substance Abuse Veterans Homeless Seniors Ex-Offenders My organization does not provide services to any of these groups
2. What special populations should DCOA make a greater effort to serve?
Lesbian, Gay, Bisexual, Transgender Persons Living with a Disability English as a Second Language Substance Abuse Veterans Homeless Seniors Ex-Offenders

Senior Needs Assessment 163
Other (please specify) ___________________
3. Does your organization provide direct services to persons living with disabilities with any of the following activity of daily living (ADL) and/or instrumental activities of daily living (IADL) limitations?
Personal hygiene and grooming Dressing and undressing Self feeding Functional transfers (Getting from bed to wheelchair, getting onto or off of toilet, etc.)
Bowel and bladder management Walking without use of use of an assistive device (walker, cane, or crutches) or using a wheelchair
Doing housework Taking medications as prescribed Managing money Shopping for groceries or clothing Use of telephone or other form of communication Using information technology My organization does not provide these services Other (please specify) ___________________
4. Does your organization provide support services to caregivers?
Yes No
5. What type of support services does your organization provide to caregivers?
Respite Care Advocacy Transportation Financial Assistance Home Maker Case Management My organization does not provide caregiver support services Other (please specify) ___________________
6. Would your organization be willing to provide free caregiver support services on
holidays, vacations and/or weekends? Yes No My organization does not provide caregiver support services
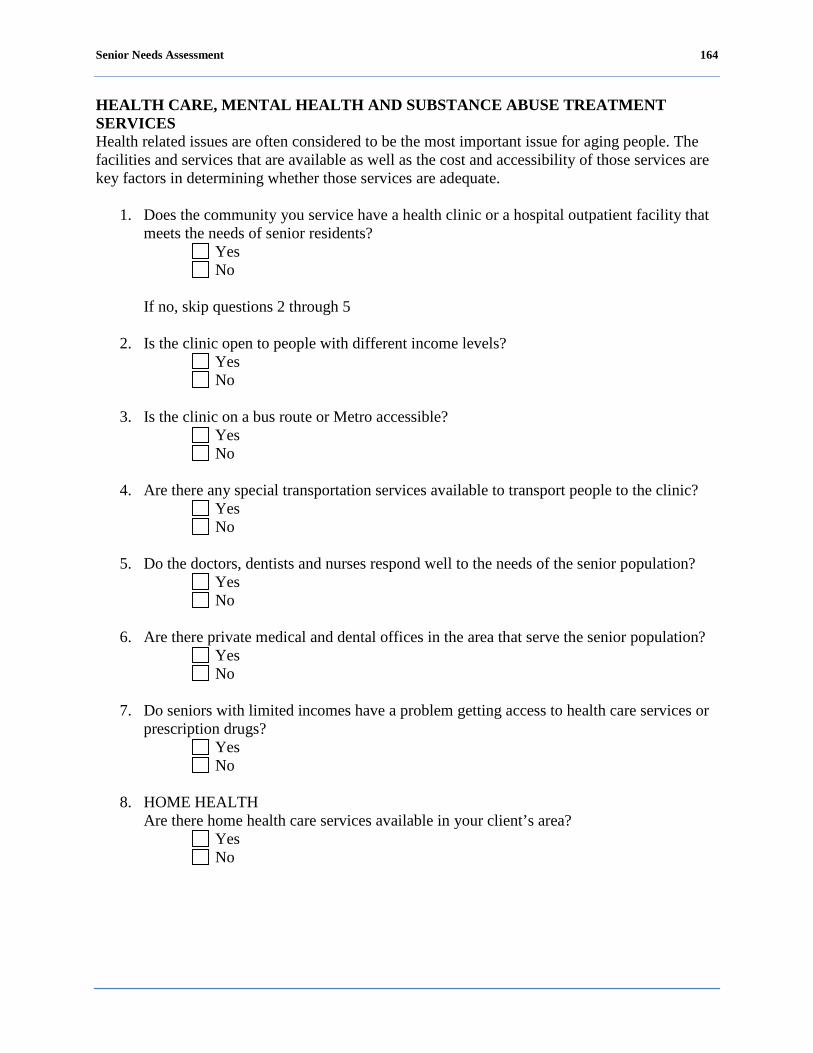
Senior Needs Assessment 164
HEALTH CARE, MENTAL HEALTH AND SUBSTANCE ABUSE TREATMENT SERVICES Health related issues are often considered to be the most important issue for aging people. The facilities and services that are available as well as the cost and accessibility of those services are key factors in determining whether those services are adequate.
1. Does the community you service have a health clinic or a hospital outpatient facility that meets the needs of senior residents?
Yes No
If no, skip questions 2 through 5
2. Is the clinic open to people with different income levels?
Yes No
3. Is the clinic on a bus route or Metro accessible?
Yes No
4. Are there any special transportation services available to transport people to the clinic?
Yes No
5. Do the doctors, dentists and nurses respond well to the needs of the senior population?
Yes No
6. Are there private medical and dental offices in the area that serve the senior population?
Yes No
7. Do seniors with limited incomes have a problem getting access to health care services or
prescription drugs? Yes No
8. HOME HEALTH
Are there home health care services available in your client’s area? Yes No
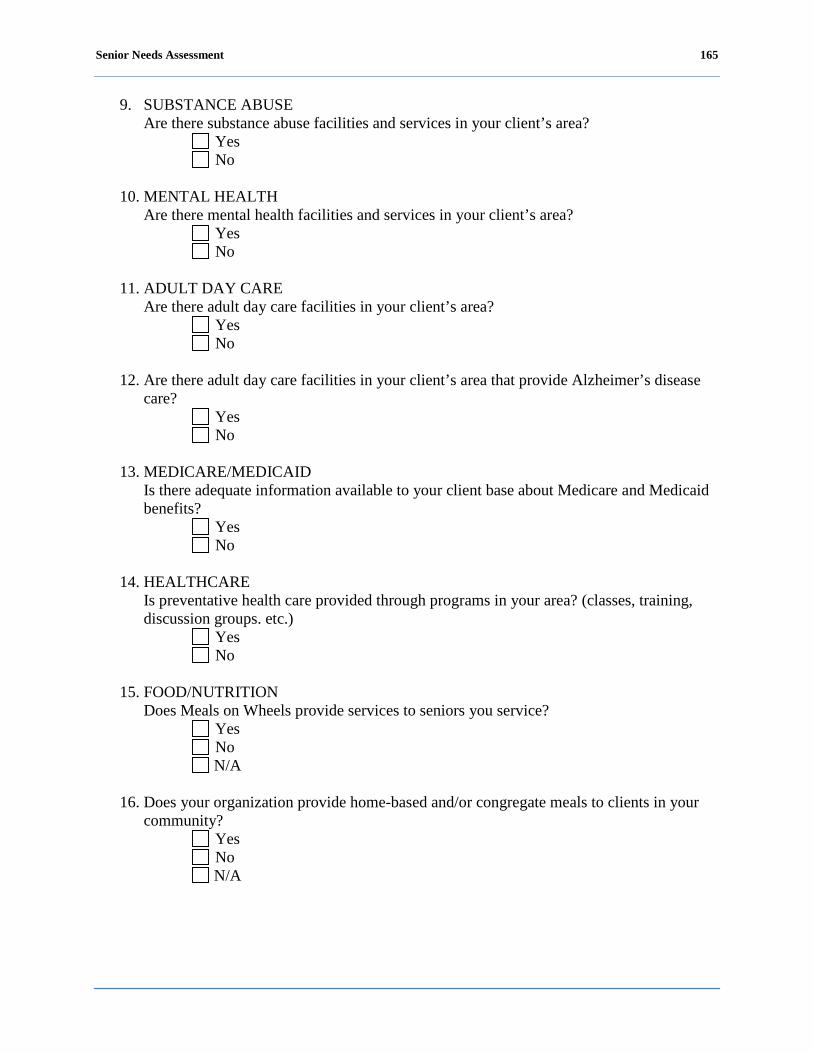
Senior Needs Assessment 165
9. SUBSTANCE ABUSE Are there substance abuse facilities and services in your client’s area?
Yes No
10. MENTAL HEALTH
Are there mental health facilities and services in your client’s area? Yes No
11. ADULT DAY CARE
Are there adult day care facilities in your client’s area? Yes No
12. Are there adult day care facilities in your client’s area that provide Alzheimer’s disease
care? Yes No
13. MEDICARE/MEDICAID
Is there adequate information available to your client base about Medicare and Medicaid benefits?
Yes No
14. HEALTHCARE
Is preventative health care provided through programs in your area? (classes, training, discussion groups. etc.)
Yes No
15. FOOD/NUTRITION
Does Meals on Wheels provide services to seniors you service? Yes No N/A
16. Does your organization provide home-based and/or congregate meals to clients in your
community? Yes No N/A
Senior Needs Assessment 166
17. Are you regularly assessing the nutritional status of the seniors you service? Yes No N/A
TRANSPORTATION SERVICES Aging people need to have sufficient mobility to maintain their self-sufficiency and independence as long as possible for a number of very sound reasons. Reduced mobility can put older people at risk for both health and socialization problems.
1. Do the providers in your area give information to patients on alternative forms of transportation services? (e.g., Washington Elderly Handicapped Transportation Service (WEHTSS), MetroAccess)
Yes No
2. Is there a Metrorail or bus stop near your organization?
Yes No
3. Are the bus stops or Metrorail in your area near the homes or residences of senior clients?
Yes No
4. Is MetroAccess service available to the clients in your area?
Yes No
5. Are the sidewalks and curbs in your area where your clients live properly maintained and
accessible for seniors and persons living with disabilities? Yes No
6. Are your client’s aware of reduced fares available for public transportation for seniors
and persons living with a disability? Yes No
7. Are other transportation services advertised in your area so that seniors and persons
living with a disability are aware of them? Yes No
8. Does your program provide transportation services for seniors?
Yes No
Senior Needs Assessment 167
9. Does your program provide transportation services for persons living with disabilities? Yes No
10. Does your program offer transportation services for dialysis or other regularly scheduled
medical services? Yes No
11. Do your clients use a volunteer transportation service in your area?
Yes No
ABUSE, NEGLECT, AND FINANCIAL EXPLOITATION Aging people are able to interact more fully with other people when they do not have concerns about their safety and security. Fear of becoming a victim of crime, abuse and/or negligence can limit their mobility significantly over time.
1. Are you aware of unsolved serious crimes committed against seniors in your area? Yes No
2. Do the seniors you service feel safe?
Yes No
3. Are you aware of seniors taking care of grandchildren and/or other young relatives who
have been incarcerated or are currently in the juvenile justice system? Yes No
4. Are you aware of seniors that have been taken advantage of by contractors doing work on
their homes? Yes No
5. Are you aware of seniors, persons living with disabilities and/or caregivers who are being
abused (physically, mentally, emotionally or financially)? Yes No
6. Does your organization provide resources to assist seniors, persons living with disabilities
and/or caregivers that are being abused (physically, mentally, emotionally or financially)? Yes No
Senior Needs Assessment 168
RECREATION SERVICES Regular recreational activity promotes necessary mobility for aging people and promotes healthy aging processes.
1. Is there a senior center, wellness center or recreation center near or in close proximity to the homes of seniors you service?
Yes No
2. Do these centers have programs that help aging people become more self-sufficient?
Yes No
3. Are there centers where the seniors you serve can go to exercise or engage in physical
activity their area? Yes No
COMMUNITY SERVICES AND SUPPORT Government needs significant connections with and significant assistance from community organizations in order to promote a healthy, well-balanced aging population. Government’s resources will be greatly challenged in the next decades as the aging population increases dramatically as a percentage of the total population.
1. Are you aware of a directory of services for seniors, persons living with disabilities and/or caregivers?
Yes No
2. Do you feel that these services are publicized and advertised so that seniors, persons
living with disabilities and caregivers are aware of them? Yes No
3. Do the seniors you serve volunteer to help other seniors?
Yes No
4. Do churches provide services for seniors that you serve in your community?
Yes No
5. How do people new to the District or system of care find out the services you provide for
seniors, people living with disabilities and/or caregivers? Yes No
Senior Needs Assessment 169
6. Do you use volunteers to help provide services and information to seniors, persons living with a disability and/or caregivers in your area?
Yes No
7. Do you provide financial counseling services for seniors in your area?
Yes No
8. Are there programs sponsored by your organization that provide opportunities for inter-
generational discussions or activities with seniors? Yes No
9. Do you offer seniors, persons living with disabilities and/or caregivers information about
receiving legal services? Yes No
10. Are the clients you serve in need of affordable housing programs?
Yes No
11. Is this a serious problem in your area?
Yes No

Senior Needs Assessment 170
Long Survey
The District of Columbia Office on Aging (DCOA) is currently involved in completing an assessment of the needs of seniors in the District of Columbia. As a senior living in the District of Columbia, your views about the available services in your community and your individual needs are very important to DCOA as it seeks to provide a comprehensive and coordinated system of health for the District of Columbia’s senior population. Please complete the below survey and return it to: Thompson, Cobb, Bazilio & Associates, PC Senior Needs Assessment 1101 15th Street NW, Suite 400 Washington, DC 20005 The District of Columbia Office on Aging wants to hear from you!
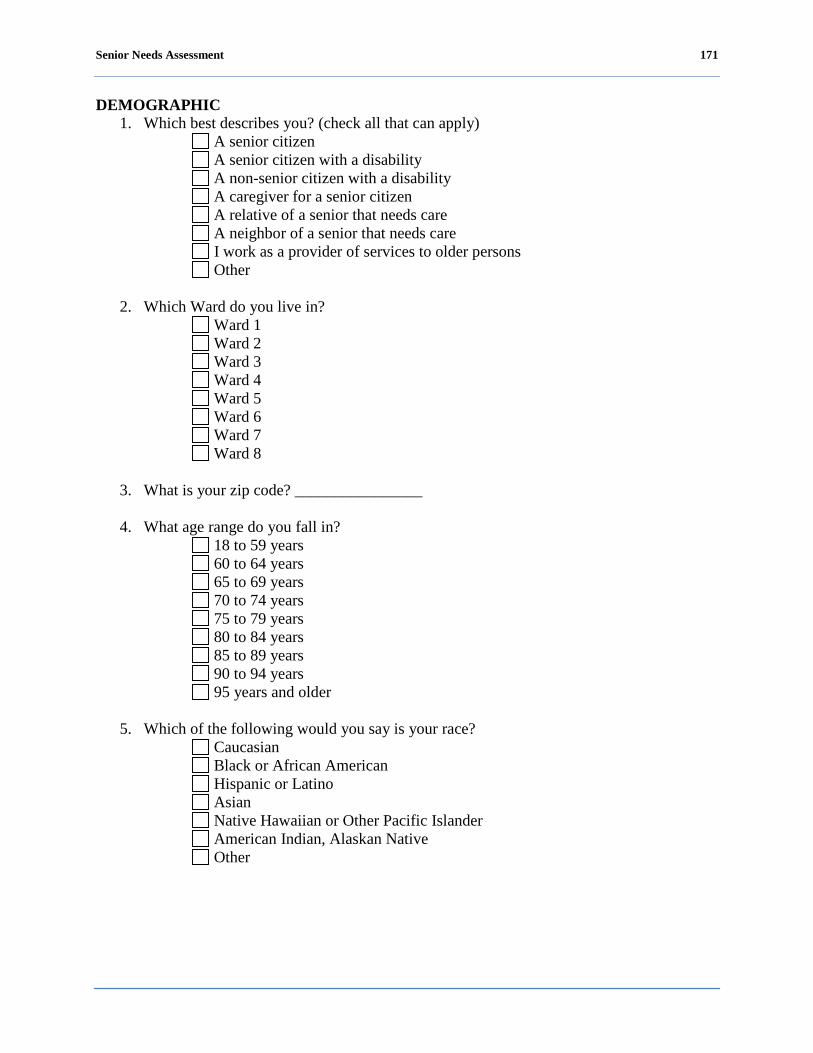
Senior Needs Assessment 171
DEMOGRAPHIC 1. Which best describes you? (check all that can apply)
A senior citizen A senior citizen with a disability A non-senior citizen with a disability A caregiver for a senior citizen A relative of a senior that needs care A neighbor of a senior that needs care I work as a provider of services to older persons Other
2. Which Ward do you live in?
Ward 1 Ward 2 Ward 3 Ward 4 Ward 5 Ward 6 Ward 7 Ward 8
3. What is your zip code? ________________
4. What age range do you fall in?
18 to 59 years 60 to 64 years 65 to 69 years 70 to 74 years 75 to 79 years 80 to 84 years 85 to 89 years 90 to 94 years 95 years and older
5. Which of the following would you say is your race?
Caucasian Black or African American Hispanic or Latino Asian Native Hawaiian or Other Pacific Islander American Indian, Alaskan Native Other
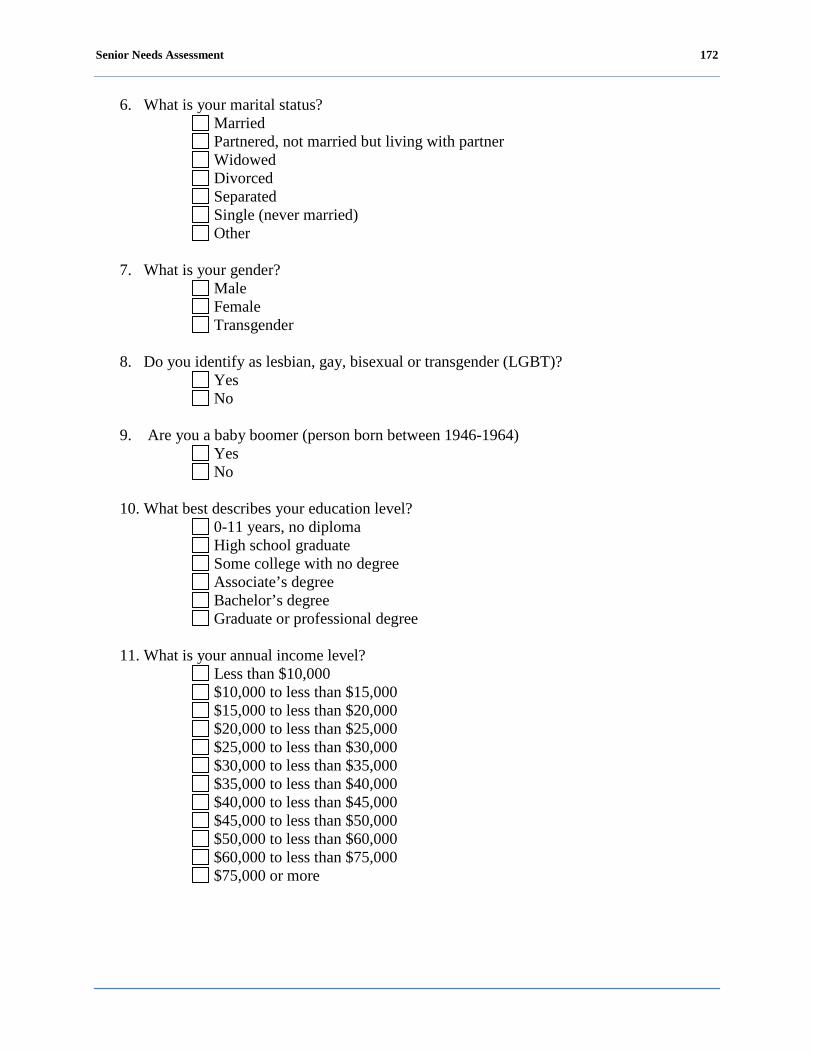
Senior Needs Assessment 172
6. What is your marital status? Married Partnered, not married but living with partner Widowed Divorced Separated Single (never married) Other
7. What is your gender? Male Female Transgender
8. Do you identify as lesbian, gay, bisexual or transgender (LGBT)? Yes No
9. Are you a baby boomer (person born between 1946-1964) Yes No
10. What best describes your education level?
0-11 years, no diploma High school graduate Some college with no degree Associate’s degree Bachelor’s degree Graduate or professional degree
11. What is your annual income level?
Less than $10,000 $10,000 to less than $15,000 $15,000 to less than $20,000 $20,000 to less than $25,000 $25,000 to less than $30,000 $30,000 to less than $35,000 $35,000 to less than $40,000 $40,000 to less than $45,000 $45,000 to less than $50,000 $50,000 to less than $60,000 $60,000 to less than $75,000 $75,000 or more
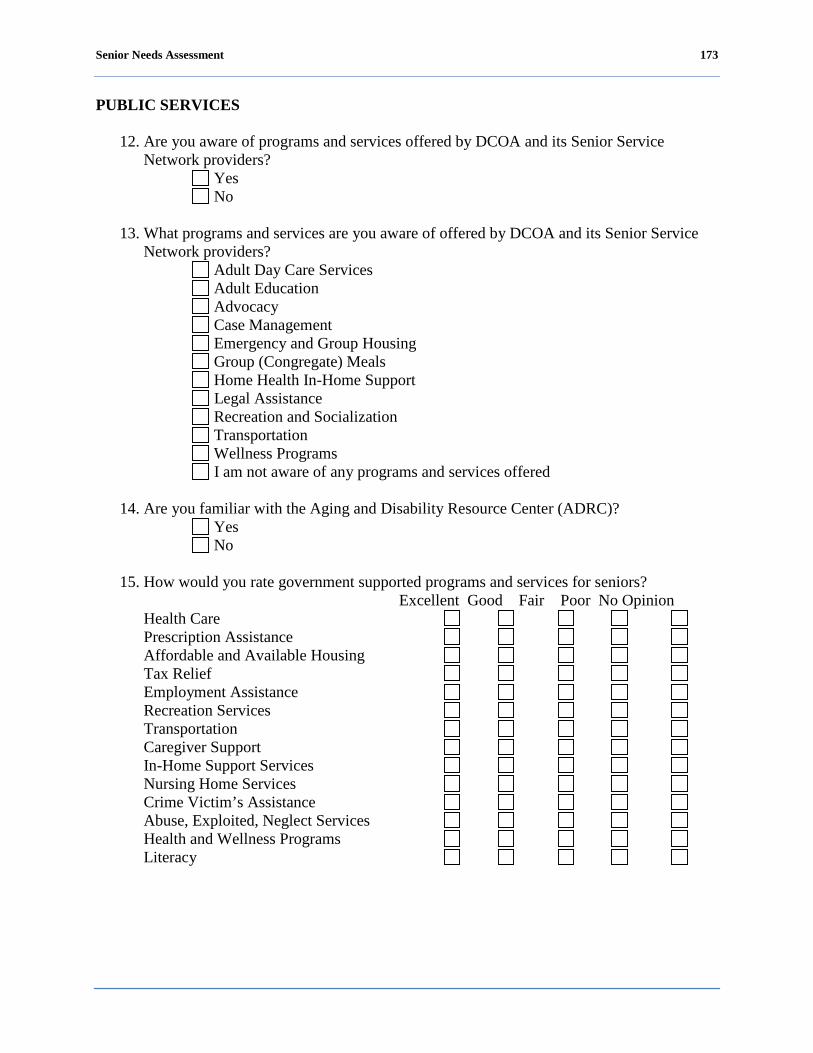
Senior Needs Assessment 173
PUBLIC SERVICES
12. Are you aware of programs and services offered by DCOA and its Senior Service Network providers?
Yes No
13. What programs and services are you aware of offered by DCOA and its Senior Service
Network providers? Adult Day Care Services Adult Education Advocacy Case Management Emergency and Group Housing Group (Congregate) Meals Home Health In-Home Support Legal Assistance Recreation and Socialization Transportation Wellness Programs I am not aware of any programs and services offered
14. Are you familiar with the Aging and Disability Resource Center (ADRC)? Yes No
15. How would you rate government supported programs and services for seniors?
Excellent Good Fair Poor No Opinion Health Care Prescription Assistance Affordable and Available Housing Tax Relief Employment Assistance Recreation Services Transportation Caregiver Support In-Home Support Services Nursing Home Services Crime Victim’s Assistance Abuse, Exploited, Neglect Services Health and Wellness Programs Literacy
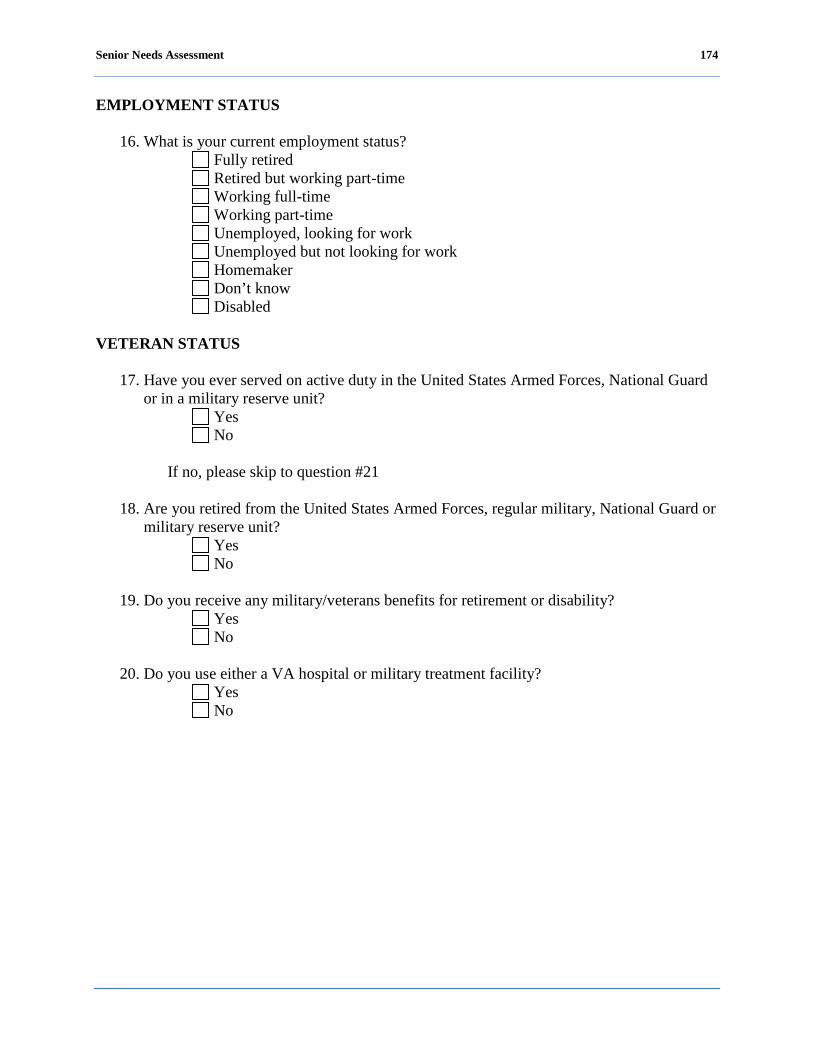
Senior Needs Assessment 174
EMPLOYMENT STATUS
16. What is your current employment status? Fully retired Retired but working part-time Working full-time Working part-time Unemployed, looking for work Unemployed but not looking for work Homemaker Don’t know Disabled
VETERAN STATUS
17. Have you ever served on active duty in the United States Armed Forces, National Guard
or in a military reserve unit? Yes No
If no, please skip to question #21
18. Are you retired from the United States Armed Forces, regular military, National Guard or military reserve unit?
Yes No
19. Do you receive any military/veterans benefits for retirement or disability?
Yes No
20. Do you use either a VA hospital or military treatment facility?
Yes No
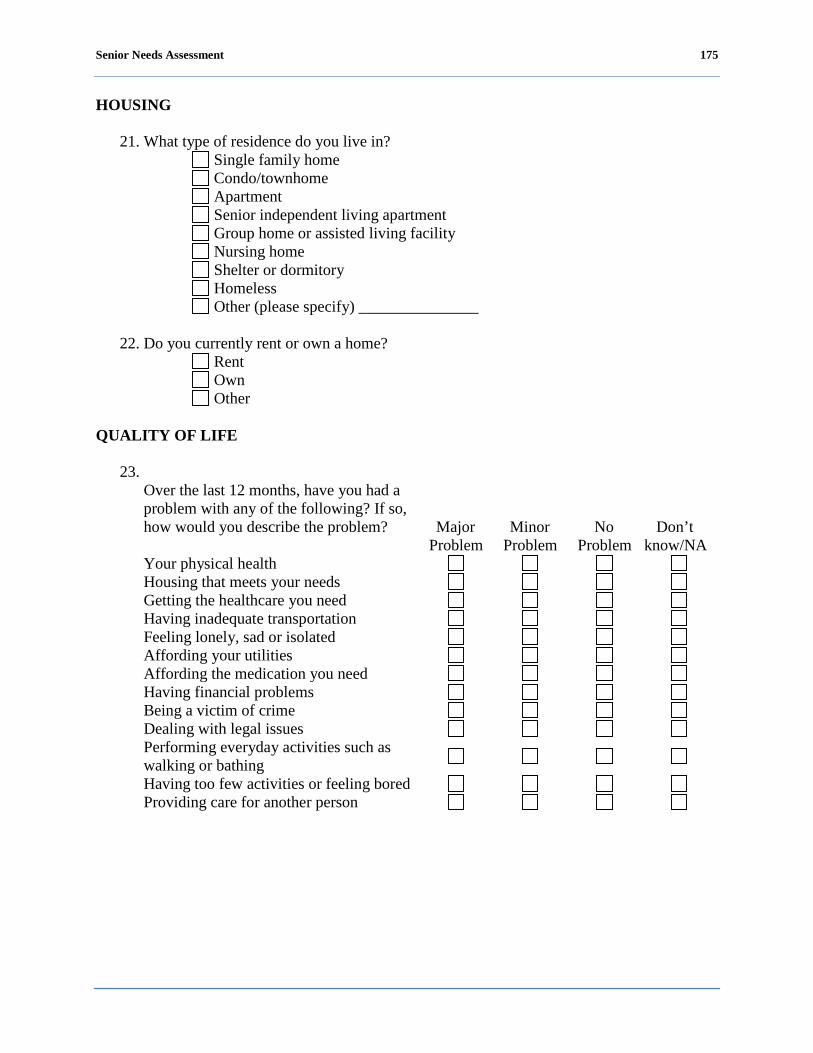
Senior Needs Assessment 175
HOUSING
21. What type of residence do you live in? Single family home Condo/townhome Apartment Senior independent living apartment Group home or assisted living facility Nursing home Shelter or dormitory Homeless Other (please specify) _______________
22. Do you currently rent or own a home?
Rent Own Other
QUALITY OF LIFE
23. Over the last 12 months, have you had a problem with any of the following? If so, how would you describe the problem?
Major Problem
Minor Problem
No Problem
Don’t know/NA
Your physical health Housing that meets your needs Getting the healthcare you need Having inadequate transportation Feeling lonely, sad or isolated Affording your utilities Affording the medication you need Having financial problems Being a victim of crime Dealing with legal issues Performing everyday activities such as walking or bathing
Having too few activities or feeling bored Providing care for another person

Senior Needs Assessment 176
24. Overall, how do you rate your quality of life? Very good Good Neither good nor bad Bad Very bad Don’t know
25. Over the past 12 months, have you been ill for a period of one month or more? Yes No
INSURANCE STATUS
26. Which of the following kinds of health insurance do you have? (check all that apply)
Medicaid Medicare Private insurance DC Alliance Military I don’t have insurance
SOCIALIZATION/RECREATION
27. During a typical week, how many hours do you spend doing the following?
No
hours
1 to 5 hours
6 or more hours
Don’t
know/NA
Participating in a club or civic group Participating in religious or spiritual activities with others
Visiting with family in person or on the phone Visiting with friends in person or on the phone
Providing help to friends or relatives Participating in senior center activities Caring for a pet Doing housework or home maintenance Participating in a hobby such as art, gardening or music
Working for pay Attending movies, sporting events or groups events
Volunteering or helping out in the community
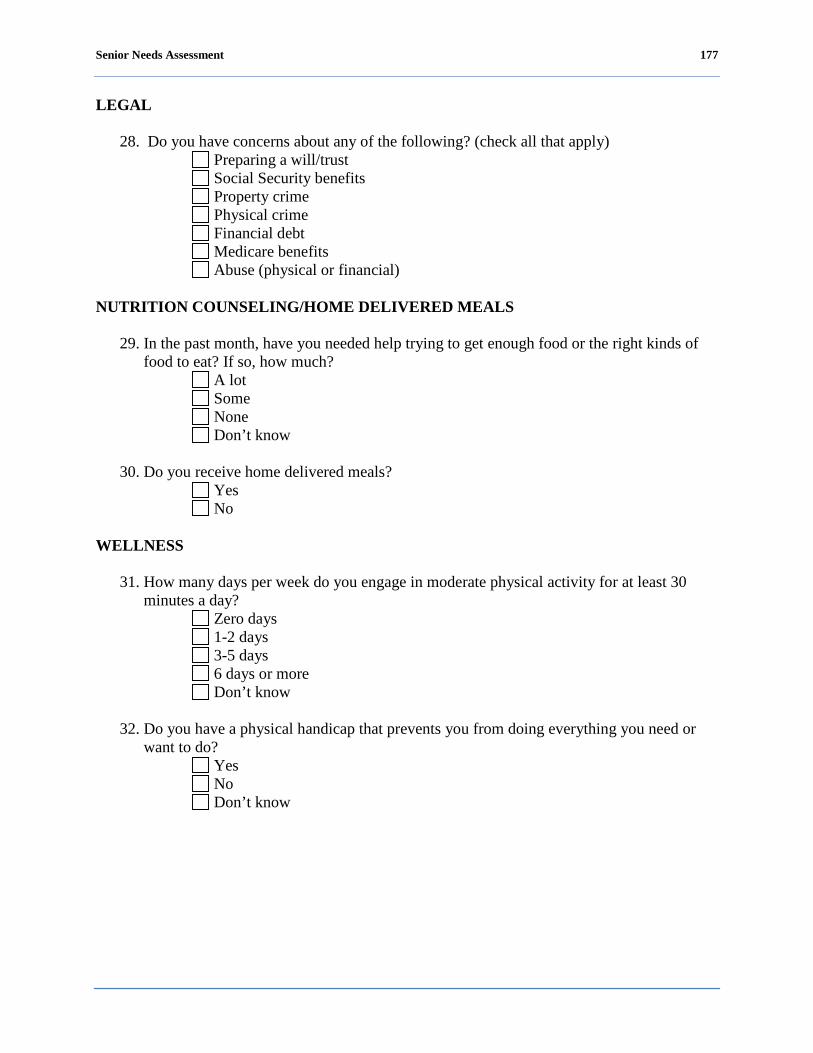
Senior Needs Assessment 177
LEGAL
28. Do you have concerns about any of the following? (check all that apply) Preparing a will/trust Social Security benefits Property crime Physical crime Financial debt Medicare benefits Abuse (physical or financial)
NUTRITION COUNSELING/HOME DELIVERED MEALS
29. In the past month, have you needed help trying to get enough food or the right kinds of
food to eat? If so, how much? A lot Some None Don’t know
30. Do you receive home delivered meals?
Yes No
WELLNESS
31. How many days per week do you engage in moderate physical activity for at least 30 minutes a day?
Zero days 1-2 days 3-5 days 6 days or more Don’t know
32. Do you have a physical handicap that prevents you from doing everything you need or
want to do? Yes No Don’t know
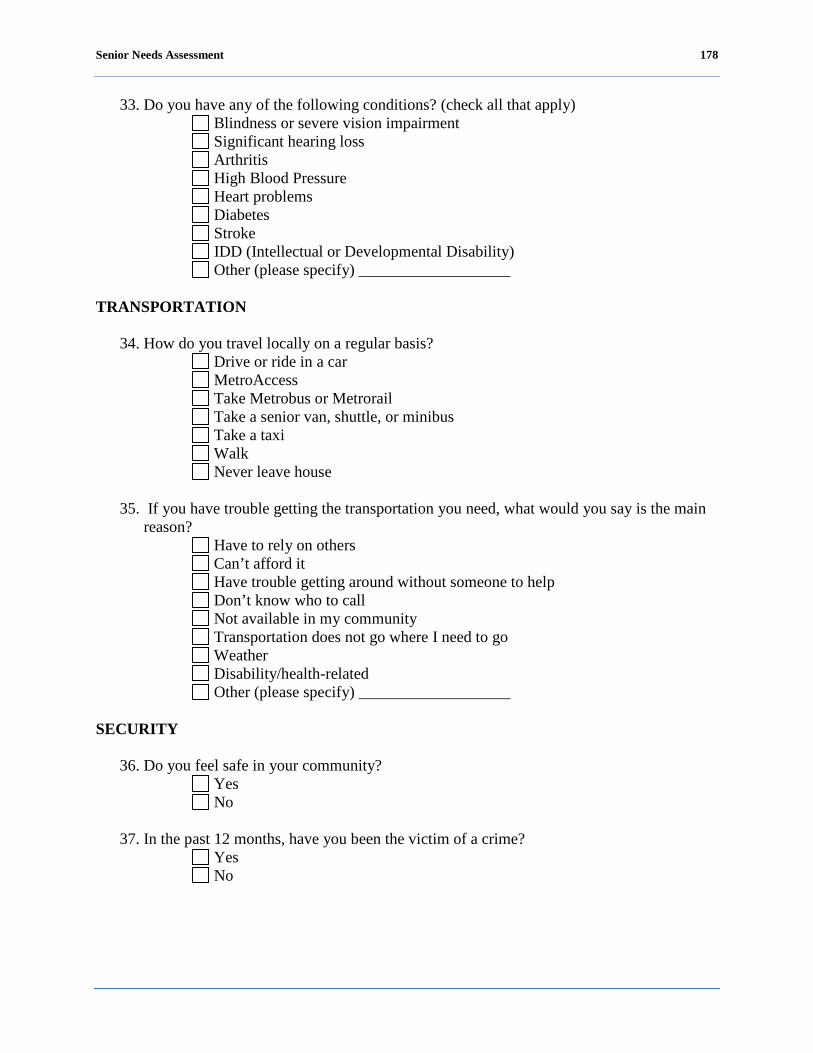
Senior Needs Assessment 178
33. Do you have any of the following conditions? (check all that apply) Blindness or severe vision impairment Significant hearing loss Arthritis High Blood Pressure Heart problems Diabetes Stroke IDD (Intellectual or Developmental Disability) Other (please specify) ___________________
TRANSPORTATION
34. How do you travel locally on a regular basis?
Drive or ride in a car MetroAccess Take Metrobus or Metrorail Take a senior van, shuttle, or minibus Take a taxi Walk Never leave house
35. If you have trouble getting the transportation you need, what would you say is the main reason?
Have to rely on others Can’t afford it Have trouble getting around without someone to help Don’t know who to call Not available in my community Transportation does not go where I need to go Weather Disability/health-related Other (please specify) ___________________
SECURITY
36. Do you feel safe in your community? Yes No
37. In the past 12 months, have you been the victim of a crime? Yes No
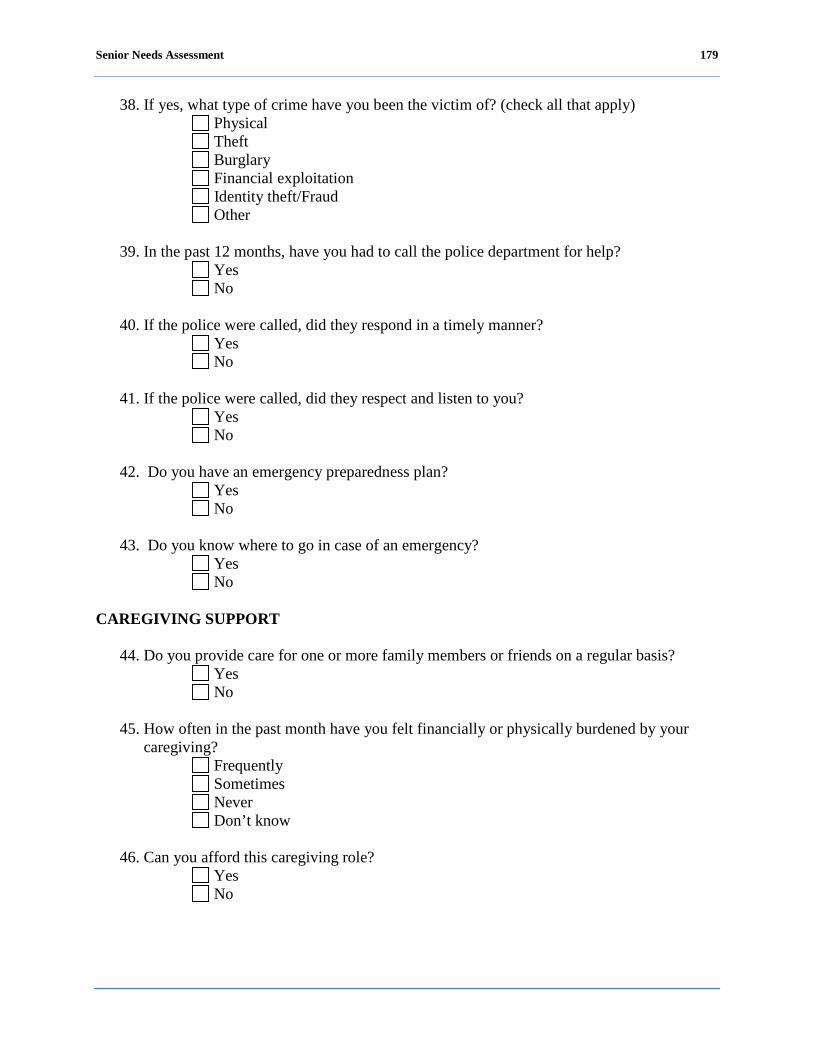
Senior Needs Assessment 179
38. If yes, what type of crime have you been the victim of? (check all that apply) Physical Theft Burglary Financial exploitation Identity theft/Fraud Other
39. In the past 12 months, have you had to call the police department for help?
Yes No
40. If the police were called, did they respond in a timely manner?
Yes No
41. If the police were called, did they respect and listen to you?
Yes No
42. Do you have an emergency preparedness plan? Yes No
43. Do you know where to go in case of an emergency?
Yes No
CAREGIVING SUPPORT
44. Do you provide care for one or more family members or friends on a regular basis?
Yes No
45. How often in the past month have you felt financially or physically burdened by your caregiving?
Frequently Sometimes Never Don’t know
46. Can you afford this caregiving role?
Yes No
Senior Needs Assessment 180
47. What kind of care are you providing? Transportation Home health Financial Affairs Meals Housekeeping, yard repairs Personal care
PROGRAMS/SERVICES
48. What programs and services do you want or need assistance with? (check your top three)
Adult Education Adult Day Care Services Advocacy Case Management Emergency Group Housing Employment and Job Training Group (Congregate) Meals Home Care in Home Support Income Assistance Legal Assistance Meal Delivery Recreation Transportation Wellness Programs None Other (please specify) ___________________
49. Where do you get your information about senior citizen services? Word of Mouth Television Newspaper Senior Beacon Radio Senior Center Friend 311 AARP Office on Aging Other (Please specify) _____________________
Senior Needs Assessment 181
Short Survey
1. Which Ward do you live in? Ward 1 Ward 2 Ward 3 Ward 4 Ward 5 Ward 6 Ward 7 Ward 8
2. What zip code do you live in? ______________________
3. What age range do you fall in?
18 to 59 years 60 to 64 years 65 to 69 years 70 to 74 years 75 to 79 years 80 to 84 years 85 to 89 years 90 to 94 years 95 years and older
4. Which of the following would you say is your race?
Caucasian Black or African American Hispanic or Latino Asian Native Hawaiian or Other Pacific Islander American Indian, Alaskan Native Other
5. What is your gender? Male Female Transgender

Senior Needs Assessment 182
6. What is your annual income level? Less than $10,000 $10,000 to less than $15,000 $15,000 to less than $20,000 $20,000 to less than $25,000 $25,000 to less than $30,000 $30,000 to less than $35,000 $35,000 to less than $40,000 $40,000 to less than $45,000 $45,000 to less than $50,000 $50,000 to less than $60,000 $60,000 to less than $75,000 $75,000 or more
7. What programs and services are you aware offered by the District of Columbia Office on
Aging (DCOA) and its Senior Service Network providers? Adult Day Care Services Adult Education Advocacy Case Management Emergency and Group Housing Group (Congregate) Meals Home Health In-Home Support Legal Assistance Recreation and Socialization Transportation Wellness Programs I am not aware of any programs and services offered
8. What is your current employment status? Fully retired Retired but working part-time Working full-time Working part-time Unemployed, looking for work Unemployed but not looking for work Homemaker Other Don’t know Disabled

Senior Needs Assessment 183
9. Over the last 12 months, have you had a problem with any of the following? If so, how would you describe the problem?
Major Problem
Minor Problem
No Problem
Don’t know/NA
Your physical health Housing that meets your needs Getting the healthcare you need Having inadequate transportation Feeling lonely, sad or isolated Affording your utilities Affording the medication you need Having financial problems Being a victim of crime Dealing with legal issues Performing everyday activities such as walking or bathing
Having too few activities or feeling bored
Providing care for another person
10. Do you have concerns about any of the following? (check all that apply) Preparing a will/trust Social Security benefits Property crime Physical crime Financial debt Medicare benefits Abuse (physical or financial)
11. In the past month, have you needed help trying to get enough food or the right kinds of
food to eat? If so, how much? A lot Some None Don’t know/NA
12. Do you have a physical handicap that prevents you from doing everything you need or
want to do? Yes No Don’t know/NA
Senior Needs Assessment 184
13. Do you have any of the following conditions? (check all that apply) Blindness or severe vision impairment Significant hearing loss Arthritis High Blood Pressure Heart problems Diabetes Stroke An emotional or mental illness that limits your daily activities Other (broken bone, operations, unexplained infirmities)
14. How do you travel locally on a regular basis? Drive or ride in a car MetroAccess Take Metrobus or Metrorail Take a senior van, shuttle, or minibus Take a taxi Walk Never leave house Don’t know
15. If you have trouble getting the transportation you need, what would you say is the main
reason? Have to rely on others Can’t afford it Have trouble getting around without someone to help Don’t know who to call Not available in my community Transportation does not go where I need to go Weather Disability/health-related Don’t know
16. In the past 12 months, have you been the victim of a crime?
Yes No
17. If yes, what type of crime have you been the victim of? (check all that apply) Physical Theft Burglary Financial exploitation Identity theft/Fraud Other
Senior Needs Assessment 185
18. Do you have an emergency preparedness plan? Yes No
19. Do you provide care for one or more family members or friends on a regular basis?
Yes No
20. How often in the past month have you felt financially or physically burdened by your caregiving?
Frequently Sometimes Never Don’t know
21. What programs and services do you want or need assistance with? (check your top three)
Adult Education Adult Day Care Services Advocacy Case Management Emergency Group Housing Employment and Job Training Group (Congregate) Meals Home Care In-Home Support Income Assistance Legal Assistance Meal Delivery Recreation Transportation Wellness Programs None Other (please specify) ______________________
22. Where do you get your information about senior citizens services?
Word of Mouth Television Newspaper Senior Beacon Radio Senior Center Friend 311 AARP Office on Aging Other (Please specify) _____________________
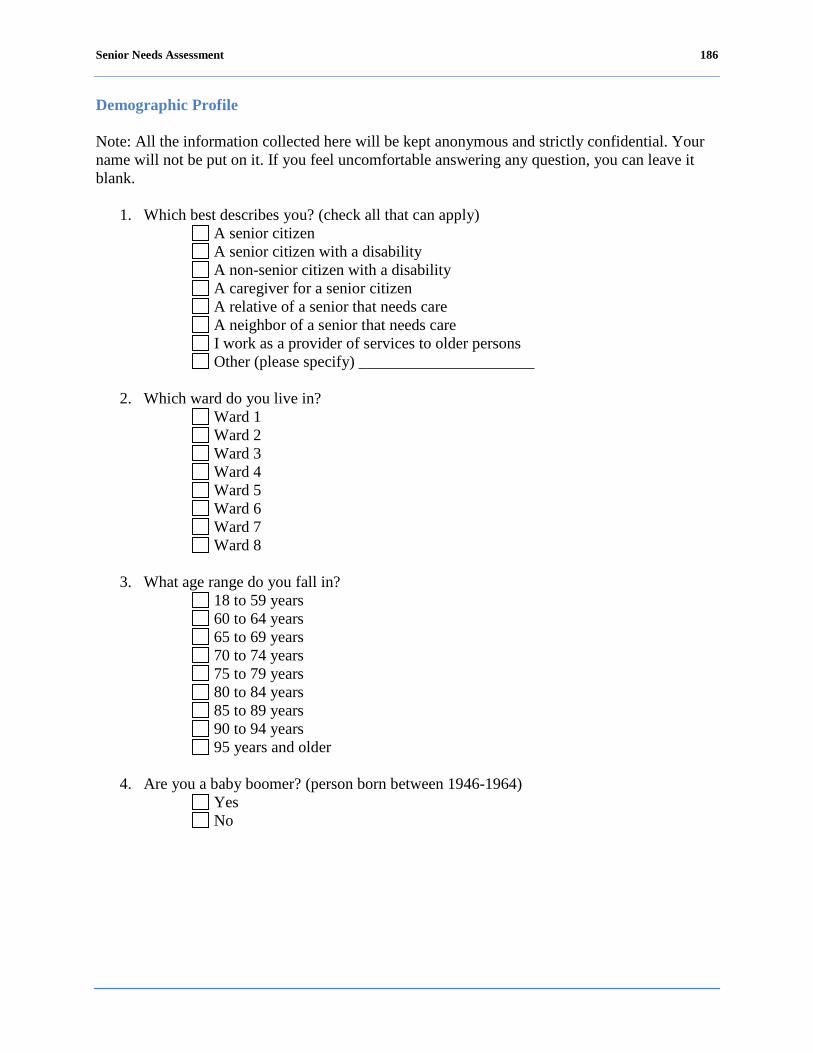
Senior Needs Assessment 186
Demographic Profile
Note: All the information collected here will be kept anonymous and strictly confidential. Your name will not be put on it. If you feel uncomfortable answering any question, you can leave it blank.
1. Which best describes you? (check all that can apply) A senior citizen A senior citizen with a disability A non-senior citizen with a disability A caregiver for a senior citizen A relative of a senior that needs care A neighbor of a senior that needs care I work as a provider of services to older persons Other (please specify) ______________________
2. Which ward do you live in?
Ward 1 Ward 2 Ward 3 Ward 4 Ward 5 Ward 6 Ward 7 Ward 8
3. What age range do you fall in?
18 to 59 years 60 to 64 years 65 to 69 years 70 to 74 years 75 to 79 years 80 to 84 years 85 to 89 years 90 to 94 years 95 years and older
4. Are you a baby boomer? (person born between 1946-1964)
Yes No
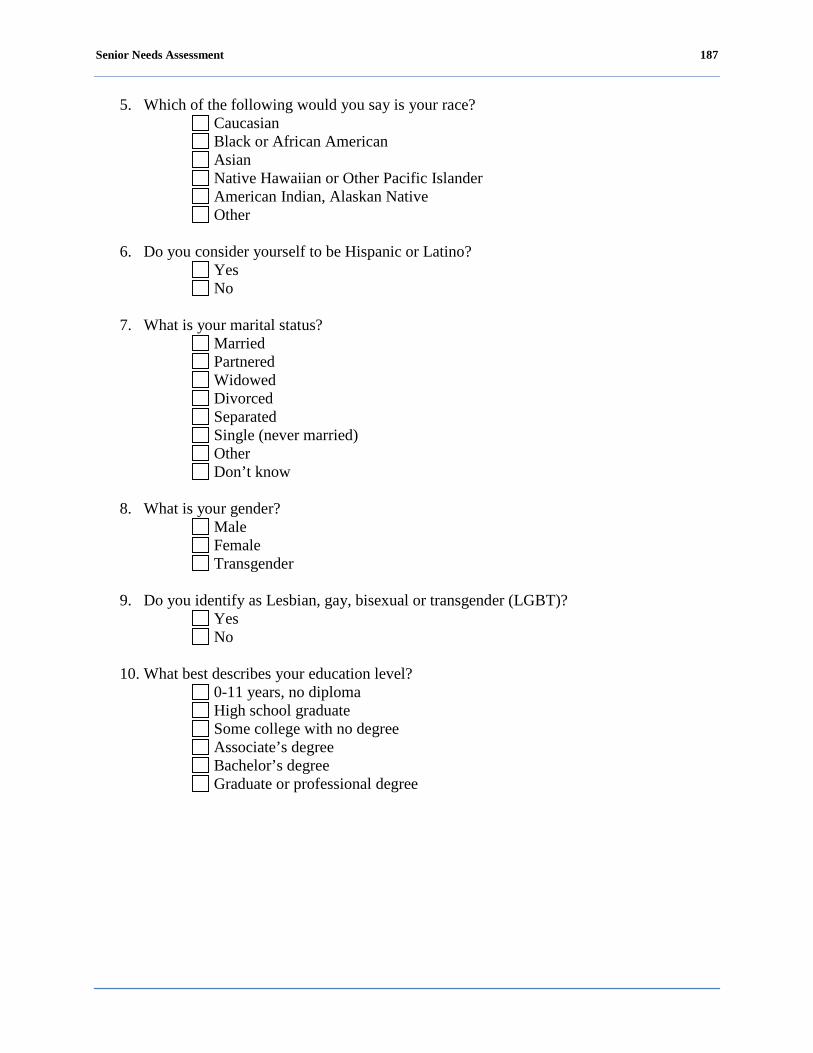
Senior Needs Assessment 187
5. Which of the following would you say is your race? Caucasian Black or African American Asian Native Hawaiian or Other Pacific Islander American Indian, Alaskan Native Other
6. Do you consider yourself to be Hispanic or Latino?
Yes No
7. What is your marital status?
Married Partnered Widowed Divorced Separated Single (never married) Other Don’t know
8. What is your gender? Male Female Transgender
9. Do you identify as Lesbian, gay, bisexual or transgender (LGBT)? Yes No
10. What best describes your education level?
0-11 years, no diploma High school graduate Some college with no degree Associate’s degree Bachelor’s degree Graduate or professional degree

Senior Needs Assessment 188
11. What is your annual income level? Less than $10,000 $10,000 to less than $15,000 $15,000 to less than $20,000 $20,000 to less than $25,000 $25,000 to less than $30,000 $30,000 to less than $35,000 $35,000 to less than $40,000 $40,000 to less than $45,000 $45,000 to less than $50,000 $50,000 to less than $60,000 $60,000 to less than $75,000 $75,000 or more
EMPLOYMENT STATUS
12. What is your current employment status? Fully retired Retired but working part-time Working full-time Working part-time Unemployed, looking for work Homemaker Unemployed but not looking for work Disabled Other
VETERAN STATUS
13. Have you ever served on active duty in the United States Armed Forces, either in the
regular military, National Guard or in a military reserve unit? Yes No
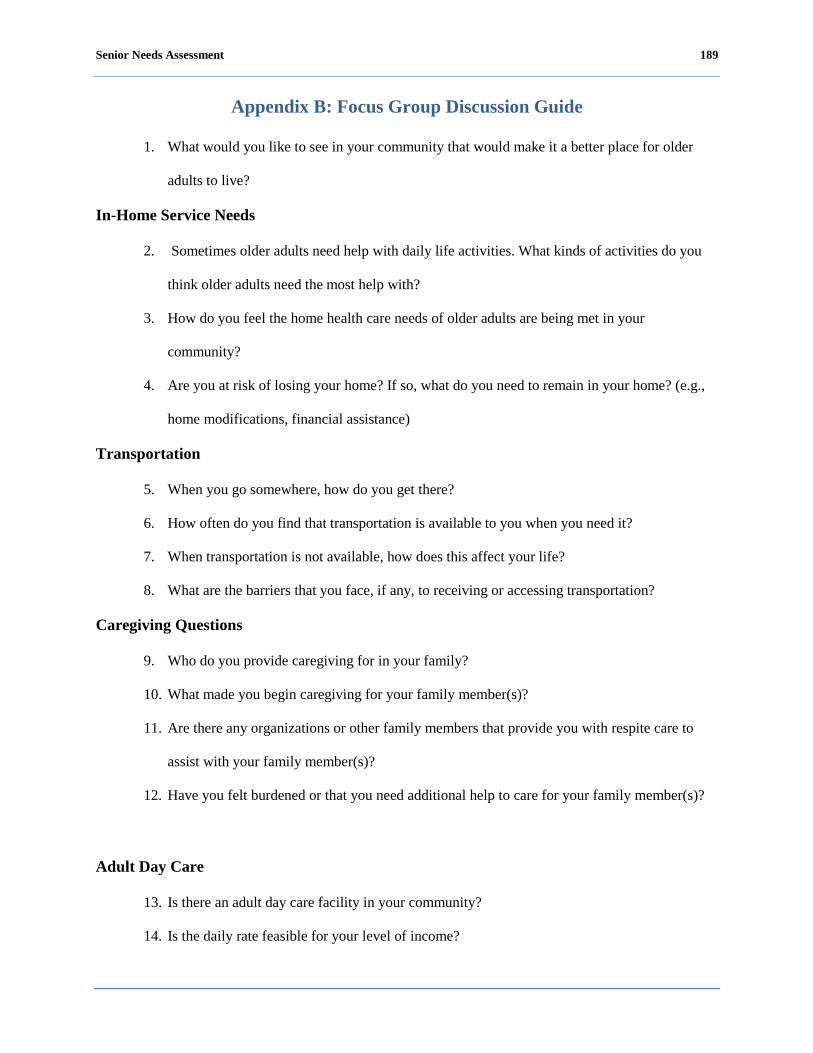
Senior Needs Assessment 189
Appendix B: Focus Group Discussion Guide
1. What would you like to see in your community that would make it a better place for older
adults to live?
In-Home Service Needs
2. Sometimes older adults need help with daily life activities. What kinds of activities do you
think older adults need the most help with?
3. How do you feel the home health care needs of older adults are being met in your
community?
4. Are you at risk of losing your home? If so, what do you need to remain in your home? (e.g.,
home modifications, financial assistance)
Transportation
5. When you go somewhere, how do you get there?
6. How often do you find that transportation is available to you when you need it?
7. When transportation is not available, how does this affect your life?
8. What are the barriers that you face, if any, to receiving or accessing transportation?
Caregiving Questions
9. Who do you provide caregiving for in your family?
10. What made you begin caregiving for your family member(s)?
11. Are there any organizations or other family members that provide you with respite care to
assist with your family member(s)?
12. Have you felt burdened or that you need additional help to care for your family member(s)?
Adult Day Care
13. Is there an adult day care facility in your community?
14. Is the daily rate feasible for your level of income?
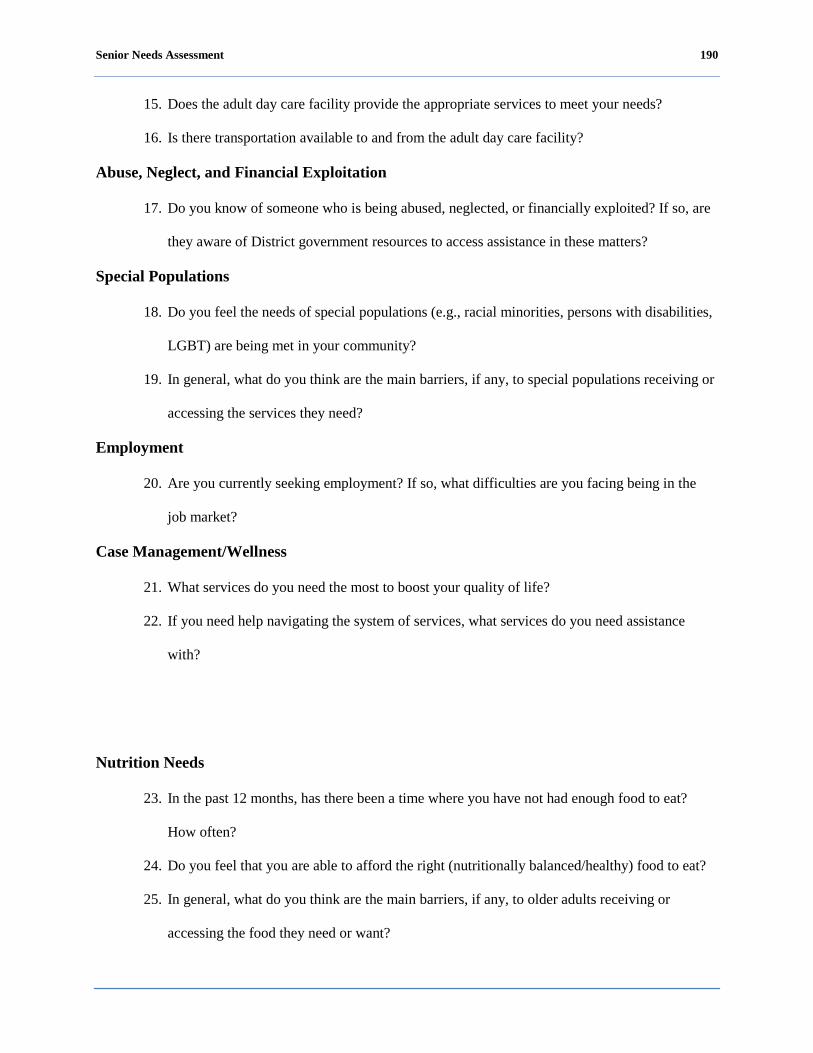
Senior Needs Assessment 190
15. Does the adult day care facility provide the appropriate services to meet your needs?
16. Is there transportation available to and from the adult day care facility?
Abuse, Neglect, and Financial Exploitation
17. Do you know of someone who is being abused, neglected, or financially exploited? If so, are
they aware of District government resources to access assistance in these matters?
Special Populations
18. Do you feel the needs of special populations (e.g., racial minorities, persons with disabilities,
LGBT) are being met in your community?
19. In general, what do you think are the main barriers, if any, to special populations receiving or
accessing the services they need?
Employment
20. Are you currently seeking employment? If so, what difficulties are you facing being in the
job market?
Case Management/Wellness
21. What services do you need the most to boost your quality of life?
22. If you need help navigating the system of services, what services do you need assistance
with?
Nutrition Needs
23. In the past 12 months, has there been a time where you have not had enough food to eat?
How often?
24. Do you feel that you are able to afford the right (nutritionally balanced/healthy) food to eat?
25. In general, what do you think are the main barriers, if any, to older adults receiving or
accessing the food they need or want?
Senior Needs Assessment 191
Health and Health Care
26. How do you feel the health care needs of older adults are being met in your community?
27. In general, what are the barriers, if any, to receiving or accessing the help you or others might
need regarding your physical health?
28. Older adults often feel isolated, lonely, or depressed. How do you think the community helps
older adults with these feelings?
29. In general, what are the barriers, if any, to receiving or accessing the help you or others might
need regarding your mental or emotional health?
General Closing Question
30. Is there any additional information that you would like to provide regarding the needs of
seniors in your community?
Senior Needs Assessment 192
Appendix C: Focus Group Summaries
Wards 1 and 4: Focus Group Summary
The focus group for Wards 1 and 4 was held at Bernice Fonteneau Senior Wellness
Center on August 23, 2011. Ten (10) seniors participated in the focus group.
The focus group facilitator asked participants a series of questions in the areas of in-home
service needs; transportation; caregiving; adult day care; abuse, neglect, and financial
exploitation; special population; employment; case management; nutrition needs; and health and
health care. While few participants offered most of the responses to each topic or question, there
was never widespread disagreement. Following are comments and observations from the focus
group with Wards 1 and 4.
1. What would you like to see in your community that would make it a better place for older
adults to live?
Police presence – on foot parole would deter crime. Police should take the time to get to
know seniors in the community.
Better lighting.
Need more parking near Metro.
Parking for shopping in the community.
Better health care – In home services are very expensive. Participant noted that she was
not simply talking about companionship.
Day care that seniors can afford on limited income.
Directory/information sharing – seniors have to read several newspapers to find out what
is going on or what services are provided. One participant recommended setting up a
computer at a recreation center in order to get information out to seniors.
Dental care.
Employment.
Senior Needs Assessment 193
In-Home Service Needs
2. Sometimes older adults need help with daily life activities. What kinds of activities do you
think older adults need the most help with?
Ten percent stated that seniors need help shopping to buy groceries.
Seniors need more recreation. Often time seniors sit at home all day and they need some
type of activities.
Help with medications.
Help with house cleaning.
3. How do you feel the home health care needs of older adults are being met in your
community?
Most participants stated that home health care needs of older adults are not being met.
4. Are you at risk of losing your home? If so, what do you need to remain in your home? (e.g.,
home modifications, financial assistance)
None of the participants indicated that they were at risk of losing their home; they did,
however, make the following observations or comments:
Knew of someone else that could use financial assistance for maintaining his or
her home.
Knew of someone else who received money from a reverse mortgage and had to
sell his or her home.
Another participant informed the group that AARP has a legal unit and all
residents are eligible to complete an in-take form to have an attorney review the
paperwork for reverse mortgages.
Another participant asked the group: “How can I get equity out of my home?”
Participants suggested that the person seek legal advice.
Transportation
Senior Needs Assessment 194
5. When you go somewhere, how do you get there?
Participants find it hard to get around the city.
One participant stated that parking meters should not be placed in neighborhoods.
Some participants stated that they take the bus.
Fifty percent of the participants stated that they drive.
Parking is difficult in the District of Columbia and a lot of people drive into Maryland to
go shopping.
It is hard to visit someone that lives in another neighborhood because you can
only park for two hours.
Going to the movies is cause for concern for getting a ticket.
Visitor parking passes are available but parking passes are not easy to obtain.
You have to go downtown and often time seniors are not able to go and get the
passes.
The District of Columbia does not give residents visitors parking passes.
Other participants stated that they use public transportation or walk.
6. How often do you find that transportation is available to you when you need it?
No Response Provided.
7. When transportation is not available, how does this affect your life?
No Response Provided.
8. What are the barriers that you face, if any, to receiving or accessing transportation?
One participant noted that, in their community, the bus only comes every hour during
non-rush hour.
Non-specific problems with the Metrorail.
Affordability of services is a barrier. Prices are so high and there should be a cap on
prices for seniors. It was suggested fares should be no more than $5 for seniors.

Senior Needs Assessment 195
Transportation is not easily accessible. Some must walk about a ½ mile to the Metrobus
stop. The bus stop is too far to walk to in the winter when it is very cold and in the
summer when it is very hot.
General Comment
Participants felt that the District of Columbia no longer caters to the needs of seniors. It
appears that that the city caters to certain other groups of residents, such as people who
ride bikes. It seems like the District of Columbia is trying to run seniors out of the city.
Caregiving
9. Who do you provide caregiving for in your family?
Half of the participants stated that they had experience providing care for someone;
mainly in Ward 4.
10. What made you begin caregiving for your family member(s)?
One participant stated that she was a caregiver for a neighbor because there was no one
caring for him, although he had a daughter.
Another participant stated that it was a matter of trust because he did not trust anyone
else to take care of his wife.
Another participant stated because of caregiver neglect.
11. Are there any organizations or other family members that provide you with respite care to
assist with your family member(s)?
Participants did not know of any organizations that provide respite care.
General Comments
There is a need for more caregiver training and matching caregivers to clients
There is a need for more devices to assist people.
The District of Columbia could use programs similar to “Daughter for the Day.” The
program is made up of volunteers that provide free assistance to seniors.
Senior Needs Assessment 196
12. Have you felt burdened or that you need additional help to care for your family member(s)?
No Response Provided.
Adult Day Care
13. Is there an adult day care facility in your community?
Most participants did not know of any adult day care facilities.
One participant stated that IONA provides adult day care but that was not in Wards 1
and 4.
One participant knew of one adult day care but was not sure which ward it is in,
Washington Center for Aging Services.
Another participant knew of a church that provides adult day care.
14. Is the daily rate feasible for your level of income?
No Response Provided.
15. Does the adult day care facility provide the appropriate services to meet your needs?
No Response Provided.
16. Is there transportation available to and from the adult day care facility?
No Response Provided.
Abuse, Neglect, and Financial Exploitation
17. Do you know of someone who is being abused, neglected, or financially exploited? If so, are
they aware of District government resources to access assistance in these matters?
Some participants knew of seniors that were financially exploited with the reverse
mortgage. Participant suggested that seniors should call legal aid for them to review the
loan documents. Legal aid will come to your home when the lender comes to review
documents with you.
A participant stated that attorneys exploited her parents financially.

Senior Needs Assessment 197
One participant noted that Adult Protective Services (APS) is supposed to assist in these
matters; however, they do not do anything. Comments were made that the Guardian
Assistance program under the Supreme Court should be granted the authority to
monitor court appointed attorneys. There is a need for more volunteers to be posted at
court appointments.
AARP has an ombudsman service that is free to seniors. Most seniors do not know about
the Guardian Assistance program or AARP’s ombudsman services.
If seniors are not computer savvy then they are left behind.
General Comments
Seniors are going to have to do more for themselves through their churches and other
organizations that they belong to.
Seniors have to start asking questions.
Special Populations
18. Do you feel the needs of special populations (e.g., racial minorities, persons with disabilities,
LGBT) are being met in your community?
One participant stated that the District of Columbia has not done enough to bring the
community together. They need to find a way to do this.
One participant stated she has noticed that other racial groups are treated different in
the center that she attends. Seniors speak different languages. There is one staff person
that speaks another language other than English; however, there is no one in the center
that speaks Spanish and there are Spanish-speaking seniors that attend the center.
One participant stated that discrimination exists.
19. In general, what do you think are the main barriers, if any, to special populations receiving or
accessing the services they need?
No Response Provided.

Senior Needs Assessment 198
Employment
20. Are you currently seeking employment? If so, what difficulties are you facing being in the
job market?
Three participants are seeking employment.
One participant thinks that she is being discriminated against because of her age and her
West Indian accent.
Participants believe that employers are simply looking for volunteers to give you a
stipend instead of a pay check.
Employers want you to be proficient in multiple areas.
Employers want seniors to work on weekends and at night. Seniors prefer to work
Monday through Friday during the day hours.
Case Management/Wellness
21. What services do you need the most to boost your quality of life?
Most participants did not know that case management exists.
22. If you need help navigating the system of services, what services do you need assistance
with?
There is a challenge obtaining information when you walk into the wellness center. When
a person walks into the center they need to feel important.
One participant stated that case managers could help with nutritional needs of seniors.
Nutrition Needs
23. In the past 12 months, has there been a time where you have not had enough food to eat?
How often?

Senior Needs Assessment 199
All of the participants have had enough food to eat in the past 12 months; however, they
knew of other seniors who have not had enough food to eat.
24. Do you feel that you are able to afford the right (nutritionally balanced/healthy) food to eat?
No Response Provided.
25. In general, what do you think are the main barriers, if any, to older adults receiving or
accessing the food they need or want?
One participant stated that there are not enough services for seniors. NutritionInc. filed
bankruptcy.
One participant stated there is a lack of information. No one knew if Meals on Wheels
still existed.
One participant stated that some seniors’ incomes are too high to receive meal and they
lack money to pay for food to be delivered from places such as Giant or other grocery
stores in the area.
One participant stated there is a lack of fresh produce where they shop.
Health and Health Care
26. How do you feel the health care needs of older adults are being met in your community?
No Response Provided.
27. In general, what are the barriers, if any, to receiving or accessing the help you or others might
need regarding your physical health?
No Response Provided.
28. Older adults often feel isolated, lonely, or depressed. How do you think the community helps
older adults with these feelings?
No Response Provided.
29. In general, what are the barriers, if any, to receiving or accessing the help you or others might
need regarding your mental or emotional health?
No Response Provided.
Senior Needs Assessment 200
General Closing Question
30. Is there any additional information that you would like to provide regarding the needs of
seniors in your community?
One participant recommended estate planning should be given to seniors before they
reach the age of 65. Persons giving the training should be persons that seniors can trust.
One participant recommended that churches become involved in educating and getting
information to seniors.
One participant recommended that wellness centers have security.
One participant recommended a bereavement program for caregivers.
One participant recommended that APS and DCOA be combined. Also, APS laws need to
be rewritten.
One participant stated the next generation is obligated to take care of seniors.
Senior Needs Assessment 201
Wards 2 and 3: Focus Group Summary
The focus group for Wards 2 and 3 was held at Emmaus Services for the Aging on
August 24, 2011. Ten seniors participated in the focus group.
The focus group facilitator asked participants a series of questions in the areas of in-home
service needs; transportation; caregiving; adult day care; abuse, neglect, and financial
exploitation; special population; employment; case management; nutrition needs; and health and
health care. While few participants offered most of the responses to each topic or question, there
was never widespread disagreement. Following are comments and observations from the focus
group with Wards 2 and 3.
1. What would you like to see in your community that would make it a better place for older
adults to live?
More police presence is needed so that seniors feel safe in their community.
Most seniors are on fixed incomes and more affordable housing is needed for seniors.
Greater access and outreach to information regarding available services to seniors.
Many seniors are not aware of the services that are offered. Furthermore many seniors
do not have the internet and need access to information in multiple forms.
Wards 2 and 3 need better updated facilities for seniors.
In-Home Service Needs
2. Sometimes older adults need help with daily life activities. What kinds of activities do you
think older adults need the most help with?
Senior Needs Assessment 202
There needs to be a better screening process for the people that take care of seniors in
their homes. Many of the home aides are unprofessional.
It was recommended that all home aides should go through a certification program
before they provide care because seniors have special needs and require special care.
Most seniors need help keeping their homes clean. Some of the homemakers state that
they are not supposed to do certain tasks.
3. How do you feel the home health care needs of older adults are being met in your
community?
A participant stated that many of the homemakers do not work the hours they are
supposed to. There should be a quality assurance check for the home aides.
It was stated that the certified home aides cost more. Because many seniors are on fixed
limited incomes, they cannot afford the certified aides.
A participant recommended the agencies that are contracted to provide home health aide
services be investigated and monitored on a regular basis.
4. Are you at risk of losing your home? If so, what do you need to remain in your home? (e.g.,
home modifications, financial assistance)
Seniors would benefit from receiving free advice on how to access resources to fix their
home so that they can continue living at home.
Seniors need assistance or breaks on their property taxes. Many seniors have been in
their homes for many years and now in their old age, their property taxes are becoming
a burden.
All of the seniors agreed that they are not aware of financial assistance to help make
home repairs/modifications or assist with rent and/or mortgage payments.
Many seniors need someone to look after their home while they are in extended hospital
care.
Transportation
Senior Needs Assessment 203
5. When you go somewhere, how do you get there?
Most of the seniors stated that they use public transportation.
Some seniors still drive and are worried how they will get around when they are no
longer able to drive because they do not feel that the transportation offered is adequate.
6. How often do you find that transportation is available to you when you need it?
MetroAccess is very unreliable and there is concern that there is very little quality
control to ensure that the MetroAccess vans are on schedule.
7. When transportation is not available, how does this affect your life?
When transportation is not available, it isolates you. Many seniors don’t have family and
may not have a church community or support system to help them.
When transportation is not available, it makes you miss appointments. Business affairs
(bills) do not get settled which may lead to further consequences.
MetroAccess is often tardy picking up seniors and shuttling them to their appointments
which affects seniors overall health and state of mental health.
Often times, taxis will not pick up seniors that use a walker or other assisted walking
device. Providing taxi vouchers would help seniors that can get around on their own
and encourage taxis to serve seniors more.
8. What are the barriers that you face, if any, to receiving or accessing transportation?
Affordability. Many of the fares have increased for MetroAccess and some seniors on
fixed incomes have to make a choice about what bills or necessities they can get from
one month to the next.
Washington Elderly Handicapped Transportation Service (WEHTSS) only serves a
limited area.
Caregiving
9. Who do you provide caregiving for in your family?
Senior Needs Assessment 204
Some of the participants stated that they care for a parent and others stated that they
provide caregiving services for other seniors and friends that lack a support system.
10. What made you begin caregiving for your family member(s)?
The participants that serve as caregivers stated that they began caregiving because they
would want someone to do the same for them if they were in need.
One participant stated that she wanted to ensure that her parents were receiving the best
care and the only way she could ensure that was to do it herself.
It was also stated that it is very expensive to have someone to come into the home to
provide caregiving services and most seniors do not have the income to provide this
service and therefore friends and family have to step in.
11. Are there any organizations or other family members that provide you with respite care to
assist with your family member(s)?
The participants were not aware of resources provided that offer respite care for
caregivers in their community.
12. Have you felt burdened or that you need additional help to care for your family member(s)?
It was stated that most people that serve as caregivers do so willingly; however,
caregivers do not always look after their own needs.
A participant also stated that sometimes there is an emotional as well as financial burden
when serving as a caregiver. There are organizations in the community that provide
support groups for caregivers. It was recommended that the District of Columbia should
provide more support groups for caregivers.
Adult Day Care
13. Is there an adult day care facility in your community?
There used to be an adult day care facility in the Ward 2 and 3 communities. It is no
longer open but greatly needed.
Senior Needs Assessment 205
The seniors were aware of at least one provider in the District of Columbia that provided
adult day care services.
It was stated that many churches have a senior citizen club where seniors can go during
the day to be together and have something to do as well as receive a meal.
One participant stated that all seniors do not want to spend time with other seniors all
day every day. Sometimes they want to be around youthful energy.
14. Is the daily rate feasible for your level of income?
No Response Provided.
15. Does the adult day care facility provide the appropriate services to meet your needs?
No Response Provided.
16. Is there transportation available to and from the adult day care facility?
No Response Provided.
Abuse, Neglect, and Financial Exploitation
17. Do you know of someone who is being abused, neglected, or financially exploited? If so, are
they aware of District government resources to access assistance in these matters?
To prevent some instances of neglect, hospitals need to provide discharge planning that
takes into consideration the needs of the seniors which includes whether or not they can
get home from the hospital, can follow the orders of the doctor, and/or pick up their
prescription.
Instances of self-neglect need to be investigated further. Many seniors have mental issues
that prevent them from asking for or accepting help. This should be taken into
consideration when dealing with seniors who clearly need help but reject it.
There is a lack of information provided to seniors about how to report or prevent abuse,
neglect, and financial exploitation. Many seniors are afraid to speak up.
Senior Needs Assessment 206
Seniors need to know their rights. It was recommended to have senior housing advocates
in different parts of the city where seniors can go to receive specialized attention and
advocacy.
Many of the seniors agreed that there should be a clear means to provide communication
to seniors that is not via the internet. It was recommended to have a senior hour on the
local public channel that discusses the services provided and how to access them. Many
seniors watch television and this would be a great way to provide information at little or
no cost.
The all-volunteer Village should not be overlooked.
Special Populations
18. Do you feel the needs of special populations (e.g., racial minorities, persons with disabilities,
LGBT) are being met in your community?
No Response Provided.
19. In general, what do you think are the main barriers, if any, to special populations receiving or
accessing the services they need?
No Response Provided.
Employment
20. Are you currently seeking employment? If so, what difficulties are you facing being in the
job market?
The seniors that are currently looking for work stated they would benefit from an
employment service that offers assistance and allows seniors to work part-time.
One participant stated that she feels that she is being discriminated against because of
her age. She stated that she will often get the response that she is over qualified, will be
required to be able to lift heavy boxes, and/or have to walk back and forth regularly.
Employers use this as a way to disqualify her.
Senior Needs Assessment 207
It was stated that the employment services currently provided are not adequate.
Often times working higher income jobs make seniors ineligible for many programs and
services. Seniors should not have to be concerned about whether or not to increase their
income because of how it will affect their benefits. It is unfair and it forces many seniors
to live poorly.
Many jobs expect for seniors to volunteer and not receive a paycheck.
Case Management/Wellness
21. What services do you need the most to boost your quality of life?
Reliable transportation is essential to being independent.
Seniors want more recreation and activities so they can be active and involved.
Advocacy. Seniors that are able should get involved with issues that they are interested in
and advocate for themselves and other seniors. It was recommended that DCOA offer
classes or programs about how to become an advocate.
22. If you need help navigating the system of services, what services do you need assistance
with?
No Response Provided.
Nutrition Needs
23. In the past 12 months, has there been a time where you have not had enough food to eat?
How often?
Yes. Some seniors that have low incomes and disabilities cannot get to the food bank due
to transportation issues.
It was also stated that many food banks do not have evening hours and seniors that must
rely on someone that works for transportation cannot get there to get the food they need.
A participant stated that many seniors that are homebound and lack a good support
system often go without food on a regular basis.
Senior Needs Assessment 208
24. Do you feel that you are able to afford the right (nutritionally balanced/healthy) food to eat?
Most seniors live on a fixed income, which limits the types of food they can purchase. It
was recommended to encourage and emphasize gleam programs in the communities.
25. In general, what do you think are the main barriers, if any, to older adults receiving or
accessing the food they need or want?
The cost of food is a major barrier.
Lack of information about where seniors can get the foods they need.
Seniors being able to access the programs that provide the services. Some programs are
in certain communities.
A senior stated that many times those in authority are unresponsive to their requests or
concerns. It was stated that when they complain or report about the poor food some of
the food banks provide, there is no response.
Some of the food provided to seniors is low quality, salty, and not nutritional.
Health and Health Care
26. How do you feel the health care needs of older adults are being met in your community?
A senior stated that it is difficult to find a doctor that will accept Medicare in this
community.
It is difficult to locate an internist in Wards 2 and 3.
27. In general, what are the barriers, if any, to receiving or accessing the help you or others might
need regarding your physical health?
No Response Provided.
28. Older adults often feel isolated, lonely, or depressed. How do you think the community helps
older adults with these feelings?
The congregate meals provide nutrition and socialization.
29. In general, what are the barriers, if any, to receiving or accessing the help you or others might
need regarding your mental or emotional health?
Senior Needs Assessment 209
No Response Provided.
General Closing Question
30. Is there any additional information that you would like to provide regarding the needs of
seniors in your community?
Doctors are reluctant to ask seniors about sexual activity. There are no seniors programs
about HIV/AIDS.
Doctors need to be aware of geriatric medicine and have better bedside manners to
determine underlying issues.
It was recommended to implement Adopt-A -Grandparent programs that will allow for
cross-generational communication.
There is also a need for children and youth programs to assist seniors that provide care
for grandchildren they are caring for.

Senior Needs Assessment 210
Wards 5 and 6: Focus Group Summary
The focus group for Wards 5 and 6 was held at the Washington Center for Wellness on
August 24, 2011. Three seniors participated in the focus group.
Note: Low participation can be attributed to an earthquake in the area the previous
day and the need to change the location of the focus group.
The focus group facilitator asked participants a series of questions in the areas of in-home
service needs; transportation; caregiving; adult day care; abuse, neglect, and financial
exploitation; special population; employment; case management; nutrition needs; and health and
health care. While few participants offered most of the responses to each topic or question, there
was never widespread disagreement. Following are comments and observations from the focus
group with Wards 5 and 6.
1. What would you like to see in your community that would make it a better place for older
adults to live?
More police in the area so that seniors feel safe and secure.
Greater access to information about the services offered to seniors would help seniors to
know what is available for them in the community.
In-Home Service Needs
2. Sometimes older adults need help with daily life activities. What kinds of activities do you
think older adults need the most help with?
Seniors need a lot of assistance buying groceries and doing heavy cleaning in their
homes.
3. How do you feel the home health care needs of older adults are being met in your
community?
The participants do not have experience with home health care aides.
Senior Needs Assessment 211
4. Are you at risk of losing your home? If so, what do you need to remain in your home? (e.g.,
home modifications, financial assistance)
Seniors need a lot of help making home repairs to stay in their homes that they have lived
in for many years. Repairs to the home can be extremely expensive and not affordable
for a senior that lives on a fixed income.
Transportation
5. When you go somewhere, how do you get there?
One senior stated that he drives. Two other seniors stated that they rely on MetroAccess
because of physical limitations.
6. How often do you find that transportation is available to you when you need it?
No Response Provided.
7. When transportation is not available, how does this affect your life?
The senior that drives stated that he helps a lot of friends that do not have transportation
and many of them go without necessary things such as food, clean clothes, or visiting the
doctor because they do not have reliable sources of transportation.
Two seniors that rely on public transportation stated they simply do not go places when
transportation is not available even if they really need something.
8. What are the barriers that you face, if any, to receiving or accessing transportation?
No Response Provided.
Caregiving
9. Who do you provide caregiving for in your family?
One participant stated that he provides care for many of his friends and people that live
in his building.
10. What made you begin caregiving for your family member(s)?
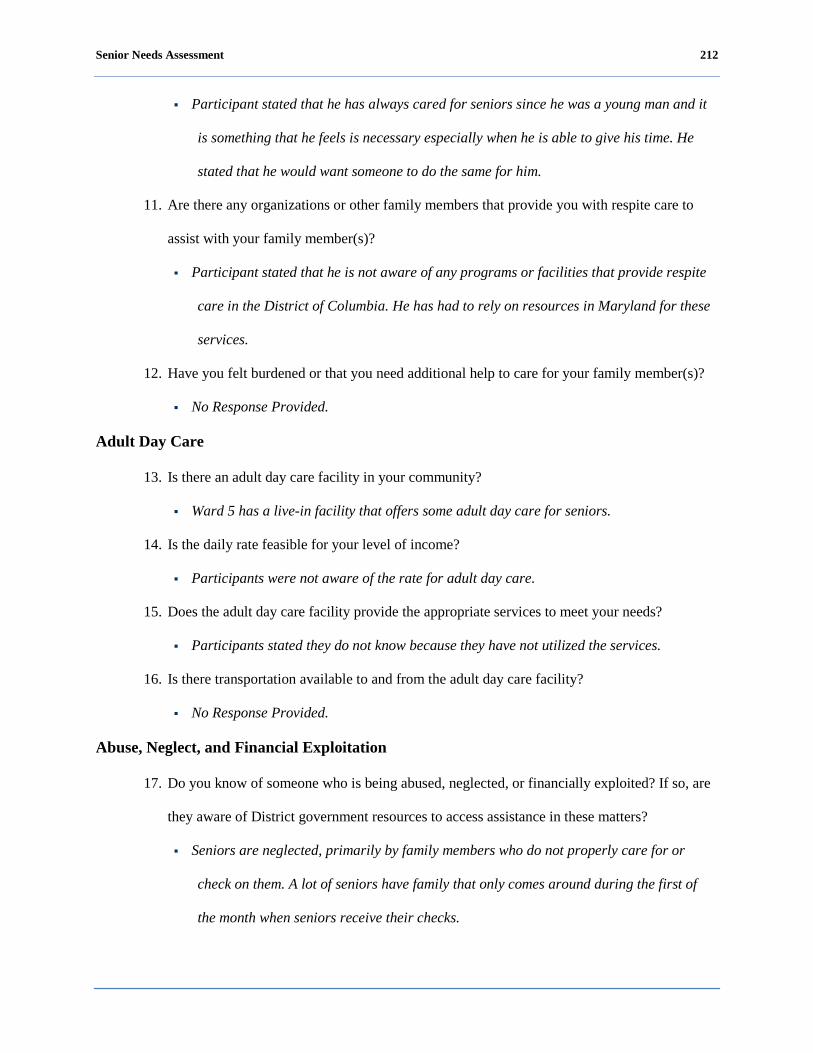
Senior Needs Assessment 212
Participant stated that he has always cared for seniors since he was a young man and it
is something that he feels is necessary especially when he is able to give his time. He
stated that he would want someone to do the same for him.
11. Are there any organizations or other family members that provide you with respite care to
assist with your family member(s)?
Participant stated that he is not aware of any programs or facilities that provide respite
care in the District of Columbia. He has had to rely on resources in Maryland for these
services.
12. Have you felt burdened or that you need additional help to care for your family member(s)?
No Response Provided.
Adult Day Care
13. Is there an adult day care facility in your community?
Ward 5 has a live-in facility that offers some adult day care for seniors.
14. Is the daily rate feasible for your level of income?
Participants were not aware of the rate for adult day care.
15. Does the adult day care facility provide the appropriate services to meet your needs?
Participants stated they do not know because they have not utilized the services.
16. Is there transportation available to and from the adult day care facility?
No Response Provided.
Abuse, Neglect, and Financial Exploitation
17. Do you know of someone who is being abused, neglected, or financially exploited? If so, are
they aware of District government resources to access assistance in these matters?
Seniors are neglected, primarily by family members who do not properly care for or
check on them. A lot of seniors have family that only comes around during the first of
the month when seniors receive their checks.

Senior Needs Assessment 213
The participants stated that they were aware of APS but they are often limited in what
they can do if a senior declines assistance. However, some seniors do deny help because
they do not want it. Some seniors have mental issues that make them isolate themselves
and deny help.
Special Populations
18. Do you feel the needs of special populations (e.g., racial minorities, persons with disabilities,
LGBT) are being met in your community?
No Response Provided.
19. In general, what do you think are the main barriers, if any, to special populations receiving or
accessing the services they need?
No Response Provided.
Employment
20. Are you currently seeking employment? If so, what difficulties are you facing being in the
job market?
None of the seniors in the group were actively seeking employment.
Case Management/Wellness
21. What services do you need the most to boost your quality of life?
Seniors need more support services in the community that make them feel wanted.
22. If you need help navigating the system of services, what services do you need assistance
with?
Seniors need help becoming independent and feeling confident in what they can do for
themselves.
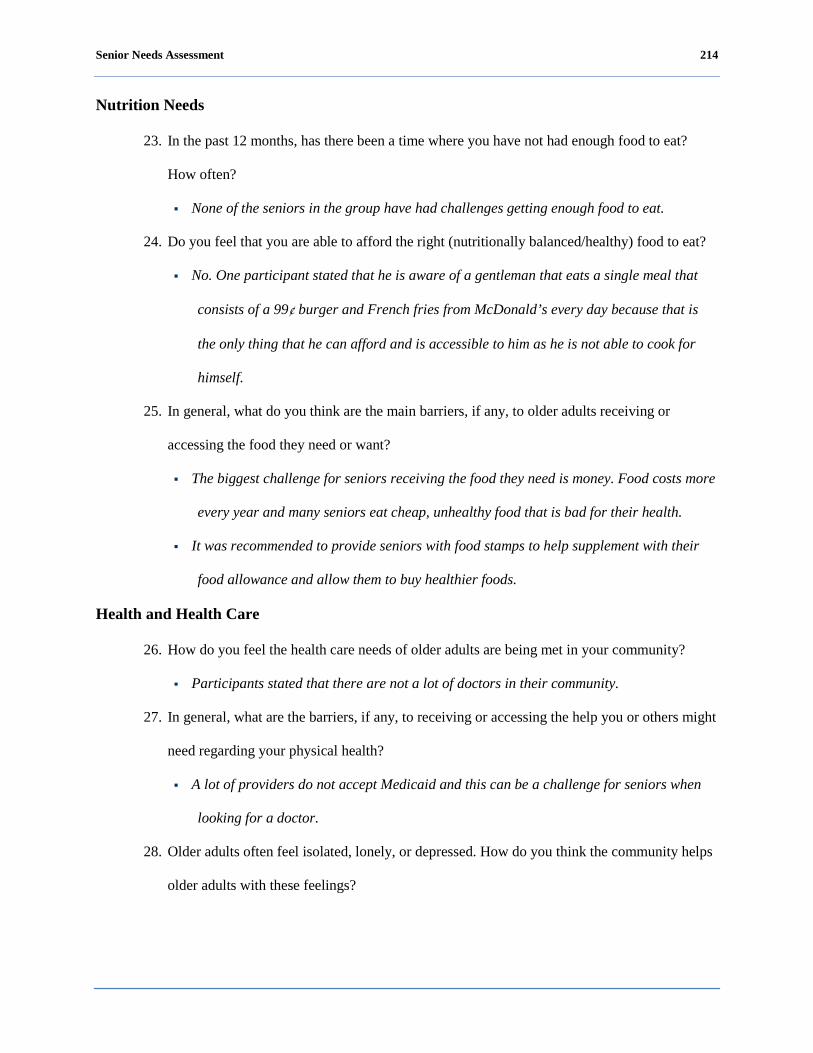
Senior Needs Assessment 214
Nutrition Needs
23. In the past 12 months, has there been a time where you have not had enough food to eat?
How often?
None of the seniors in the group have had challenges getting enough food to eat.
24. Do you feel that you are able to afford the right (nutritionally balanced/healthy) food to eat?
No. One participant stated that he is aware of a gentleman that eats a single meal that
consists of a 99¢ burger and French fries from McDonald’s every day because that is
the only thing that he can afford and is accessible to him as he is not able to cook for
himself.
25. In general, what do you think are the main barriers, if any, to older adults receiving or
accessing the food they need or want?
The biggest challenge for seniors receiving the food they need is money. Food costs more
every year and many seniors eat cheap, unhealthy food that is bad for their health.
It was recommended to provide seniors with food stamps to help supplement with their
food allowance and allow them to buy healthier foods.
Health and Health Care
26. How do you feel the health care needs of older adults are being met in your community?
Participants stated that there are not a lot of doctors in their community.
27. In general, what are the barriers, if any, to receiving or accessing the help you or others might
need regarding your physical health?
A lot of providers do not accept Medicaid and this can be a challenge for seniors when
looking for a doctor.
28. Older adults often feel isolated, lonely, or depressed. How do you think the community helps
older adults with these feelings?
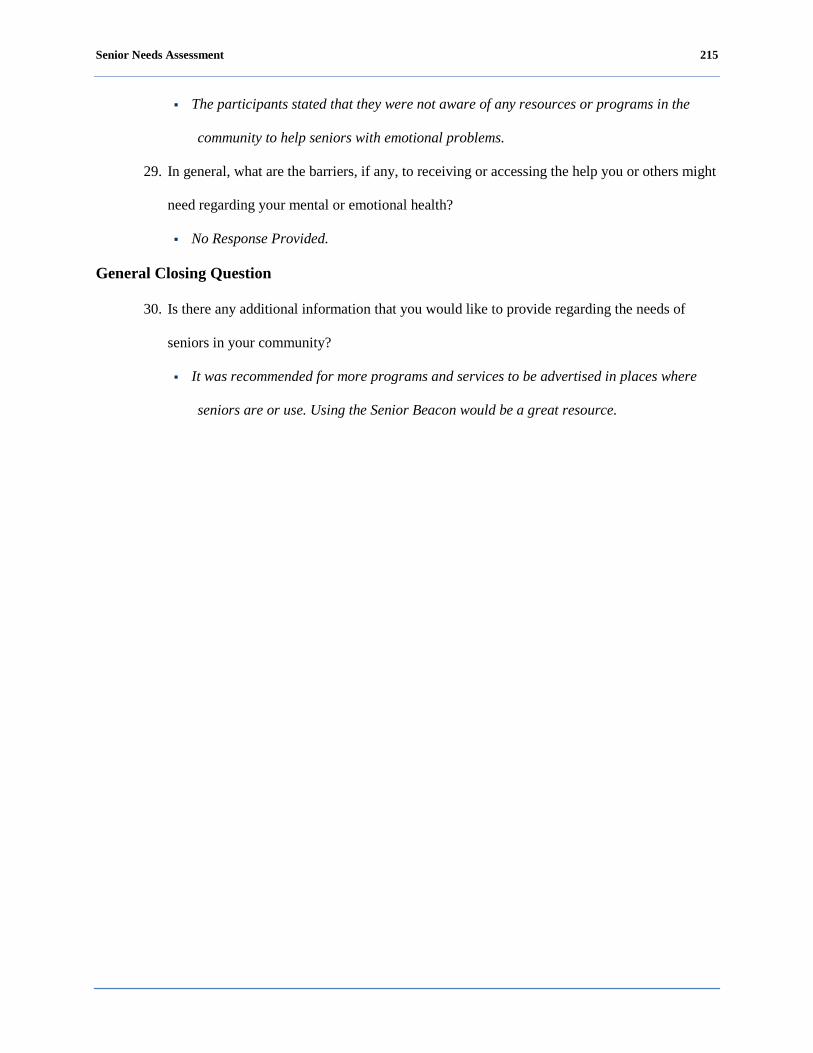
Senior Needs Assessment 215
The participants stated that they were not aware of any resources or programs in the
community to help seniors with emotional problems.
29. In general, what are the barriers, if any, to receiving or accessing the help you or others might
need regarding your mental or emotional health?
No Response Provided.
General Closing Question
30. Is there any additional information that you would like to provide regarding the needs of
seniors in your community?
It was recommended for more programs and services to be advertised in places where
seniors are or use. Using the Senior Beacon would be a great resource.
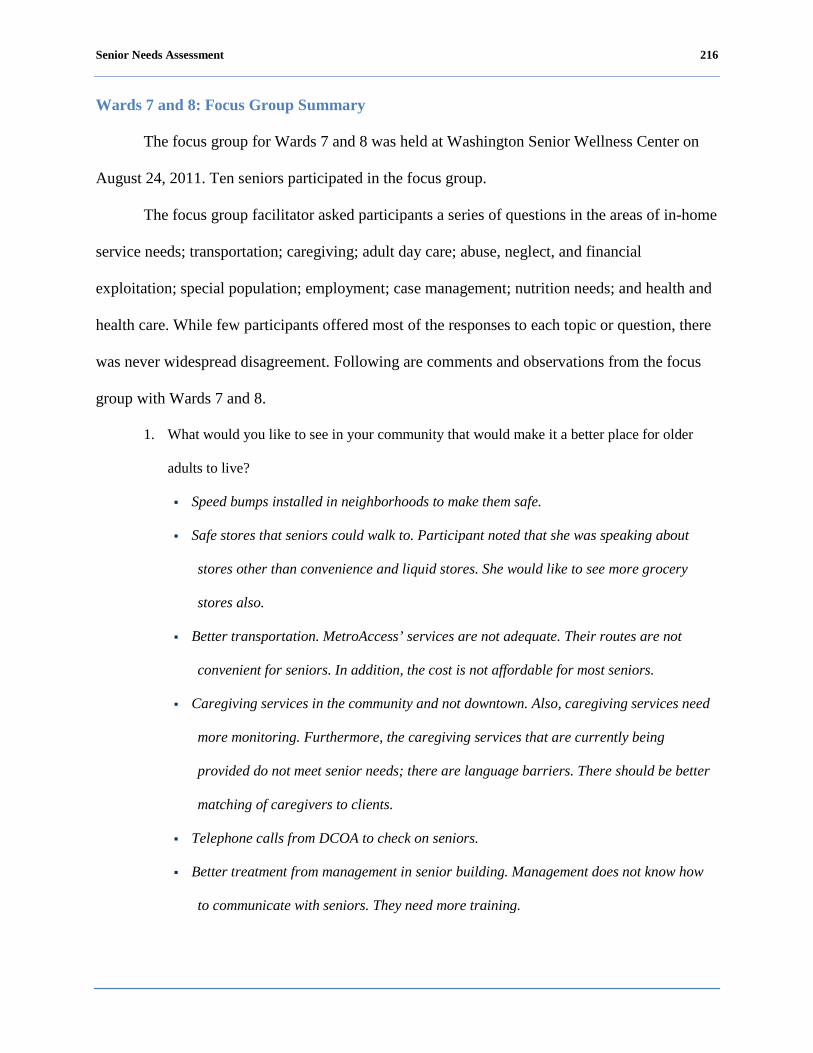
Senior Needs Assessment 216
Wards 7 and 8: Focus Group Summary
The focus group for Wards 7 and 8 was held at Washington Senior Wellness Center on
August 24, 2011. Ten seniors participated in the focus group.
The focus group facilitator asked participants a series of questions in the areas of in-home
service needs; transportation; caregiving; adult day care; abuse, neglect, and financial
exploitation; special population; employment; case management; nutrition needs; and health and
health care. While few participants offered most of the responses to each topic or question, there
was never widespread disagreement. Following are comments and observations from the focus
group with Wards 7 and 8.
1. What would you like to see in your community that would make it a better place for older
adults to live?
Speed bumps installed in neighborhoods to make them safe.
Safe stores that seniors could walk to. Participant noted that she was speaking about
stores other than convenience and liquid stores. She would like to see more grocery
stores also.
Better transportation. MetroAccess’ services are not adequate. Their routes are not
convenient for seniors. In addition, the cost is not affordable for most seniors.
Caregiving services in the community and not downtown. Also, caregiving services need
more monitoring. Furthermore, the caregiving services that are currently being
provided do not meet senior needs; there are language barriers. There should be better
matching of caregivers to clients.
Telephone calls from DCOA to check on seniors.
Better treatment from management in senior building. Management does not know how
to communicate with seniors. They need more training.
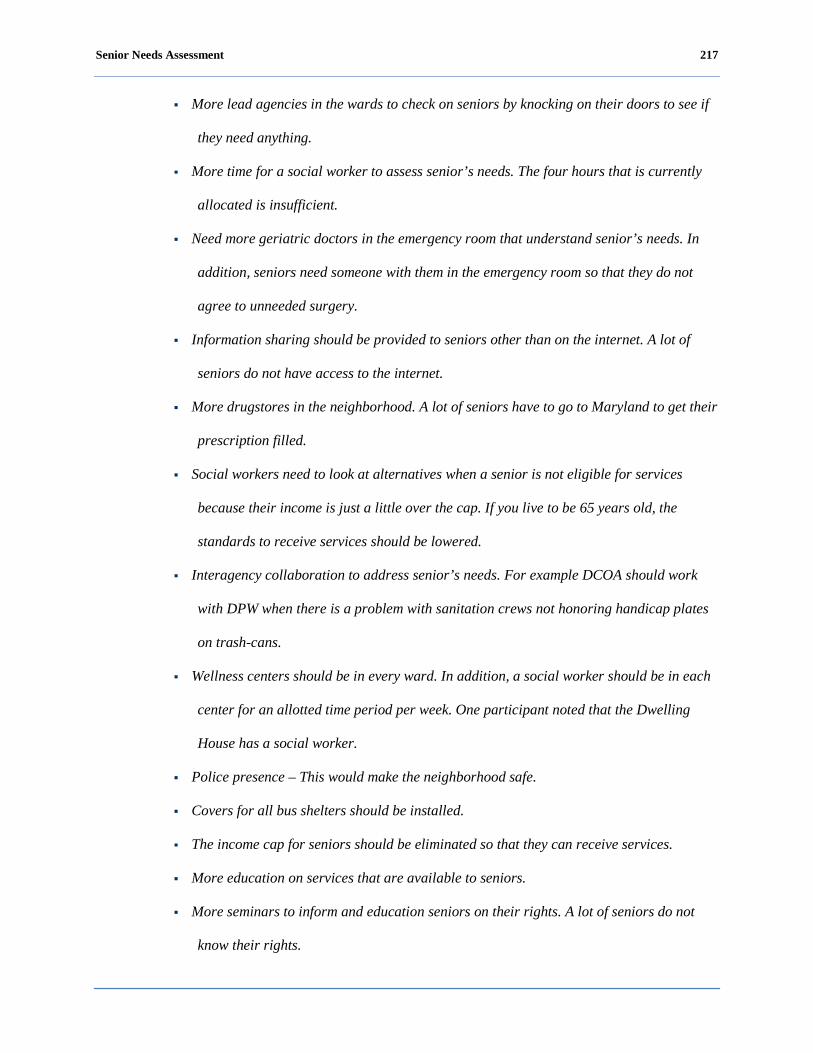
Senior Needs Assessment 217
More lead agencies in the wards to check on seniors by knocking on their doors to see if
they need anything.
More time for a social worker to assess senior’s needs. The four hours that is currently
allocated is insufficient.
Need more geriatric doctors in the emergency room that understand senior’s needs. In
addition, seniors need someone with them in the emergency room so that they do not
agree to unneeded surgery.
Information sharing should be provided to seniors other than on the internet. A lot of
seniors do not have access to the internet.
More drugstores in the neighborhood. A lot of seniors have to go to Maryland to get their
prescription filled.
Social workers need to look at alternatives when a senior is not eligible for services
because their income is just a little over the cap. If you live to be 65 years old, the
standards to receive services should be lowered.
Interagency collaboration to address senior’s needs. For example DCOA should work
with DPW when there is a problem with sanitation crews not honoring handicap plates
on trash-cans.
Wellness centers should be in every ward. In addition, a social worker should be in each
center for an allotted time period per week. One participant noted that the Dwelling
House has a social worker.
Police presence – This would make the neighborhood safe.
Covers for all bus shelters should be installed.
The income cap for seniors should be eliminated so that they can receive services.
More education on services that are available to seniors.
More seminars to inform and education seniors on their rights. A lot of seniors do not
know their rights.
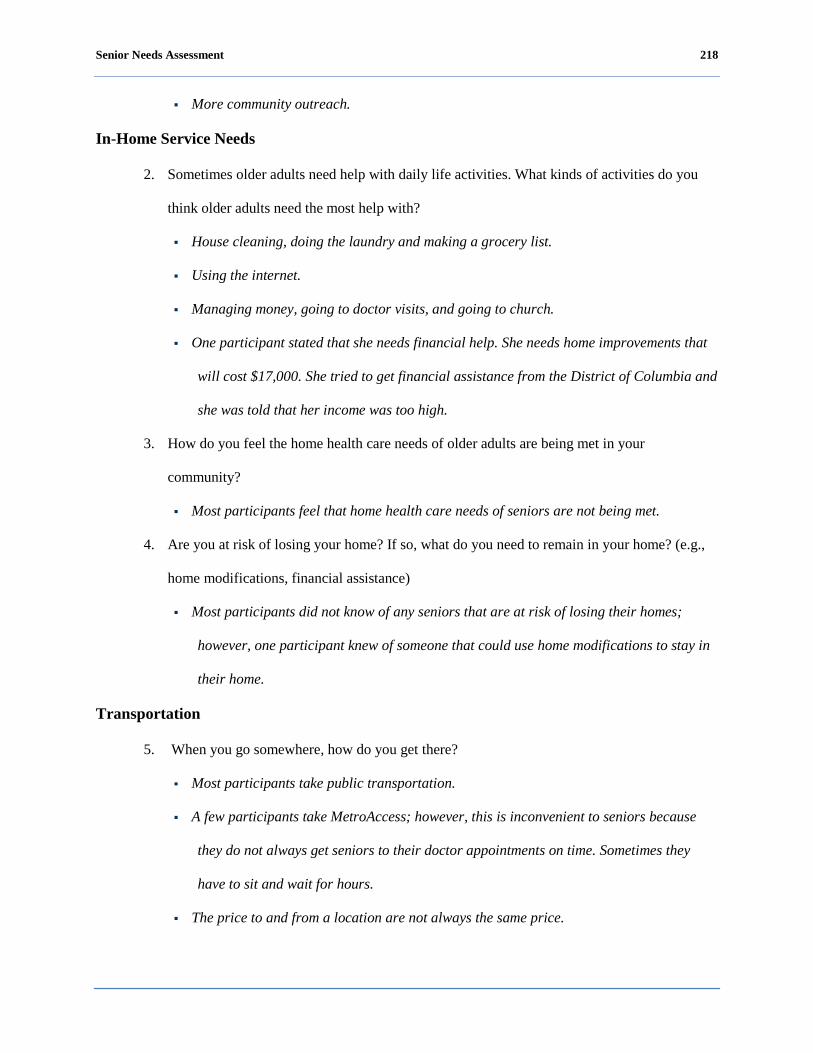
Senior Needs Assessment 218
More community outreach.
In-Home Service Needs
2. Sometimes older adults need help with daily life activities. What kinds of activities do you
think older adults need the most help with?
House cleaning, doing the laundry and making a grocery list.
Using the internet.
Managing money, going to doctor visits, and going to church.
One participant stated that she needs financial help. She needs home improvements that
will cost $17,000. She tried to get financial assistance from the District of Columbia and
she was told that her income was too high.
3. How do you feel the home health care needs of older adults are being met in your
community?
Most participants feel that home health care needs of seniors are not being met.
4. Are you at risk of losing your home? If so, what do you need to remain in your home? (e.g.,
home modifications, financial assistance)
Most participants did not know of any seniors that are at risk of losing their homes;
however, one participant knew of someone that could use home modifications to stay in
their home.
Transportation
5. When you go somewhere, how do you get there?
Most participants take public transportation.
A few participants take MetroAccess; however, this is inconvenient to seniors because
they do not always get seniors to their doctor appointments on time. Sometimes they
have to sit and wait for hours.
The price to and from a location are not always the same price.

Senior Needs Assessment 219
MetroAccess drivers do not make change; you have to have the exact fare.
One participant stated that for doctor visits she takes WEHTSS services to travel to
doctor appointments. She was pleased with this service.
6. How often do you find that transportation is available to you when you need it?
No Response Provided.
7. When transportation is not available, how does this affect your life?
Participants stated that transportation is available; however it may get you to your
doctor appointment late. Buses do not arrive on schedule.
8. What are the barriers that you face, if any, to receiving or accessing transportation?
One participant stated that service prices are so high and there should be a cap on prices
for seniors. It should be no more than $5 for seniors.
One participant stated that transportation is not easily accessible. She has to walk about
2½ blocks to the Metrobus stop.
Participants stated that they do not drive because parking is designated only for residents
that live in a particular ward. Visitors can only park for two hours.
Caregiving
9. Who do you provide caregiving for in your family?
No Response Provided.
10. What made you begin caregiving for your family member(s)?
No Response Provided.
11. Are there any organizations or other family members that provide you with respite care to
assist with your family member(s)?
Participants did not know of any respite care organizations in the District. One
participant noted that there was an organization in Maryland, Helping Hands Adult,
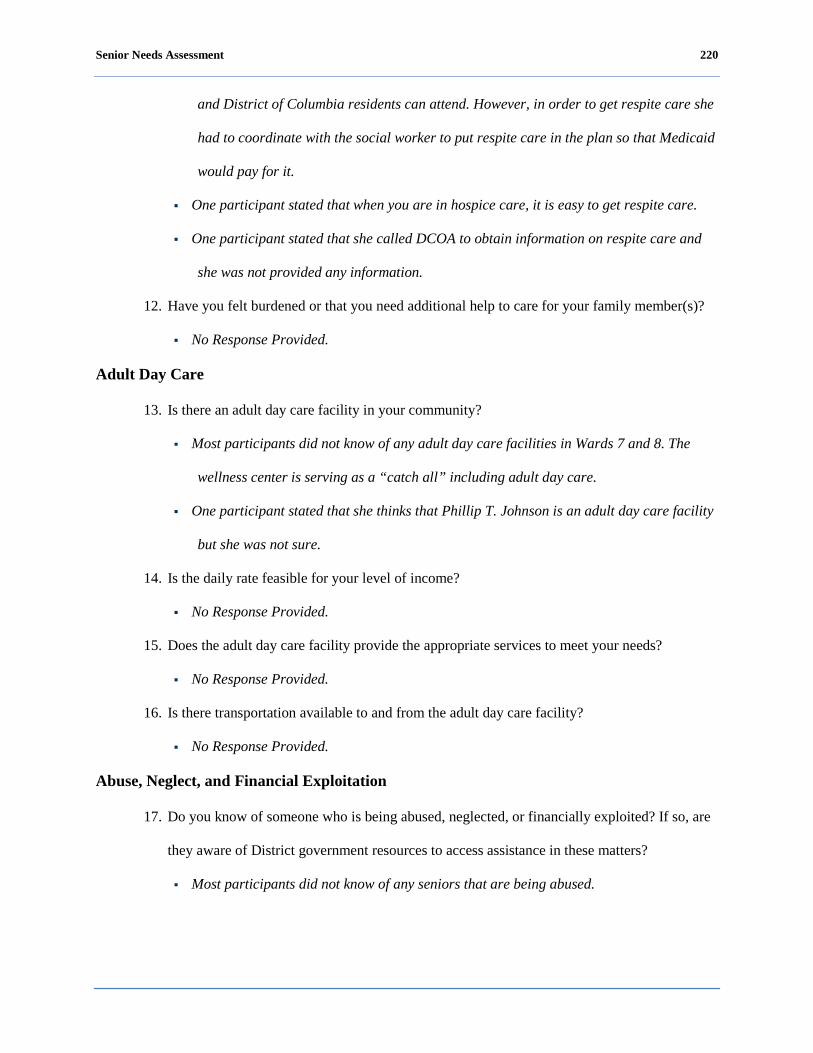
Senior Needs Assessment 220
and District of Columbia residents can attend. However, in order to get respite care she
had to coordinate with the social worker to put respite care in the plan so that Medicaid
would pay for it.
One participant stated that when you are in hospice care, it is easy to get respite care.
One participant stated that she called DCOA to obtain information on respite care and
she was not provided any information.
12. Have you felt burdened or that you need additional help to care for your family member(s)?
No Response Provided.
Adult Day Care
13. Is there an adult day care facility in your community?
Most participants did not know of any adult day care facilities in Wards 7 and 8. The
wellness center is serving as a “catch all” including adult day care.
One participant stated that she thinks that Phillip T. Johnson is an adult day care facility
but she was not sure.
14. Is the daily rate feasible for your level of income?
No Response Provided.
15. Does the adult day care facility provide the appropriate services to meet your needs?
No Response Provided.
16. Is there transportation available to and from the adult day care facility?
No Response Provided.
Abuse, Neglect, and Financial Exploitation
17. Do you know of someone who is being abused, neglected, or financially exploited? If so, are
they aware of District government resources to access assistance in these matters?
Most participants did not know of any seniors that are being abused.
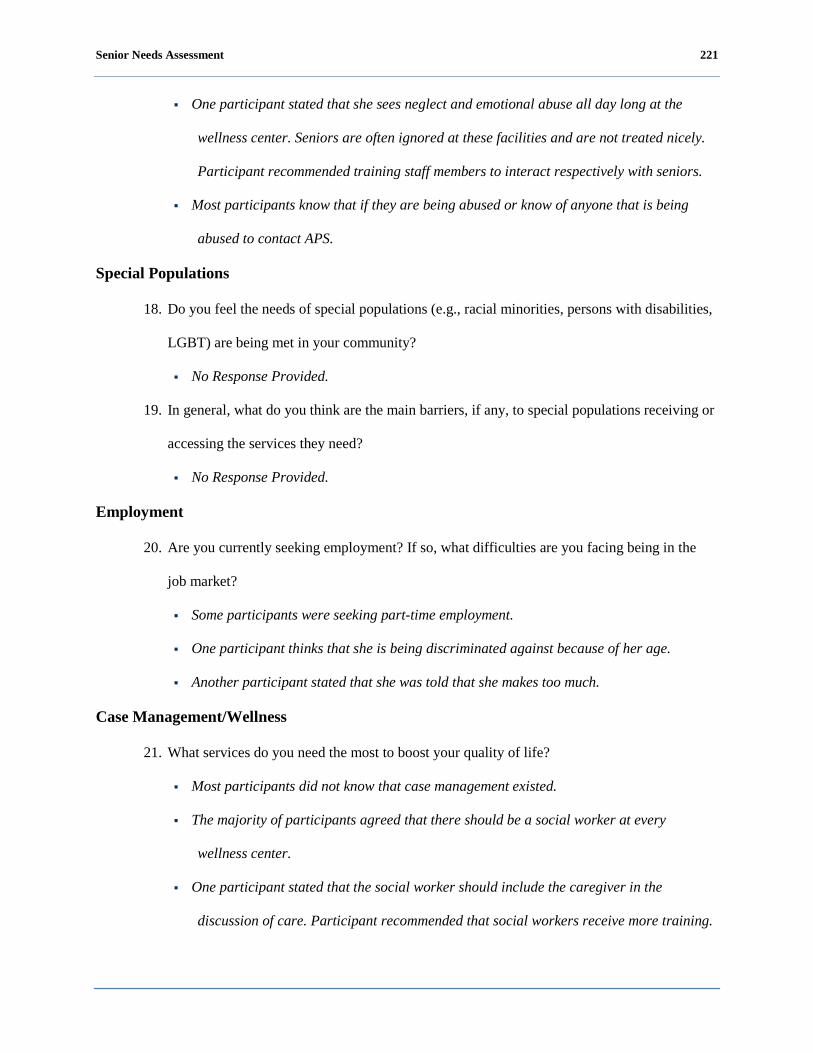
Senior Needs Assessment 221
One participant stated that she sees neglect and emotional abuse all day long at the
wellness center. Seniors are often ignored at these facilities and are not treated nicely.
Participant recommended training staff members to interact respectively with seniors.
Most participants know that if they are being abused or know of anyone that is being
abused to contact APS.
Special Populations
18. Do you feel the needs of special populations (e.g., racial minorities, persons with disabilities,
LGBT) are being met in your community?
No Response Provided.
19. In general, what do you think are the main barriers, if any, to special populations receiving or
accessing the services they need?
No Response Provided.
Employment
20. Are you currently seeking employment? If so, what difficulties are you facing being in the
job market?
Some participants were seeking part-time employment.
One participant thinks that she is being discriminated against because of her age.
Another participant stated that she was told that she makes too much.
Case Management/Wellness
21. What services do you need the most to boost your quality of life?
Most participants did not know that case management existed.
The majority of participants agreed that there should be a social worker at every
wellness center.
One participant stated that the social worker should include the caregiver in the
discussion of care. Participant recommended that social workers receive more training.
Senior Needs Assessment 222
22. If you need help navigating the system of services, what services do you need assistance
with?
No Response Provided.
Nutrition Needs
23. In the past 12 months, has there been a time where you have not had enough food to eat?
How often?
All of the participants have had enough food to eat in the past 12 months; however, they
knew of other seniors who have not had enough food to eat.
24. Do you feel that you are able to afford the right (nutritionally balanced/healthy) food to eat?
No Response Provided.
25. In general, what do you think are the main barriers, if any, to older adults receiving or
accessing the food they need or want?
One participant stated that Nutrition Inc. filed bankruptcy and the District of Columbia
did not have another vendor in place to deliver meals to seniors. Whole Foods stepped
in and donated fresh fruits and vegetables and it was the best food that had ever been
delivered to seniors.
Participant recommended that the vendors that the District of Columbia select should
have the same quality of food as Whole Foods. The vendor should be monitored and not
selected just based on price. The majority of the participants agreed.
One participant stated that Meals on Wheels delivers food that has not been kept in a
refrigerator. The food is delivered late and there is too much processed meat, therefore
the meals are not considered healthy. The food is too salty.
One participant stated that Ward 7 does not have enough supermarkets. Participant
recommended that all seniors should receive food vouchers regardless of their income
level so that they can use the vouchers at the farmer’s market in order to buy fresh
vegetables.
Senior Needs Assessment 223
Health and Health Care
26. How do you feel the health care needs of older adults are being met in your community?
One participant stated that the health care needs of seniors are not being met. Doctors
are not sensitive to the needs of seniors. A few more participants agreed.
The wait time for doctor visits is too long.
27. In general, what are the barriers, if any, to receiving or accessing the help you or others might
need regarding your physical health?
No Response Provided.
28. Older adults often feel isolated, lonely, or depressed. How do you think the community helps
older adults with these feelings?
One participant stated that the community really does not address loneliness and
depression. Often, churches will assist in this area.
One participant stated that adequate help is not available for depressed seniors. Some
Catholic organizations offer services for depressed seniors.
29. In general, what are the barriers, if any, to receiving or accessing the help you or others might
need regarding your mental or emotional health?
No Response Provided.
General Closing Question
30. Is there any additional information that you would like to provide regarding the needs of
seniors in your community?
One participant recommended that the District of Columbia establish a foster care
program for seniors.
Senior Needs Assessment 224
Persons Living With a Disability: Focus Group Summary
The focus group for persons living with a disability was held at KEEN Senior Services on
September 8, 2011. Six seniors participated in the focus group.
The focus group facilitator asked participants a series of questions in the areas of in-home
service needs; transportation; caregiving; adult day care; abuse, neglect, and financial
exploitation; special population; employment; case management; nutrition needs; and health and
health care. While few participants offered most of the responses to each topic or question, there
was never widespread disagreement. Following are comments and observations from the focus
group.
1. What would you like to see in your community that would make it a better place for older
adults to live?
A list of government agencies that provide services for people with disabilities.
Greater inter-agency collaboration.
Communication system wherein seniors can give comments and receive responses
immediately.
In-Home Service Needs
2. Sometimes older adults need help with daily life activities. What kinds of activities do you
think older adults need the most help with?
Help with feeding.
Help performing household chores such as cleaning house and cooking.
General Comments
Senior Needs Assessment 225
The majority of participants agreed that seniors should be informed of their rights and
that they should exercise their rights. A non-threatening environment should be
established in order for seniors to exercise their rights.
3. How do you feel the home health care needs of older adults are being met in your
community?
Most participants feel that home health care needs of older adults are not being met. The
following observations and comments were made:
Seniors have caregivers; however, they do not visit often. In addition, in some
cases the visits are too lengthy while in other cases the visits are too brief. One
participant recommended that a more detailed assessment of the senior’s situation
should be conducted to estimate the number of hours that they actually need
caregiving services. The assessment should be performed periodically.
Caregivers do not always work the hours that they enter on their timesheets.
Often, seniors do not know what they are signing when the caregiver gives them
their timesheet. One participant recommended that quality checks should be
conducted to ensure that caregivers are actually working the times reported. In
addition, the government needs to ensure that caregivers are certified.
4. Are you at risk of losing your home? If so, what do you need to remain in your home? (e.g.,
home modifications, financial assistance)
Most participants did not know of any seniors that are at risk of losing their homes. One
participant recommended that the government should conduct site visits to seniors’
homes to find out how they are living.
Transportation
Senior Needs Assessment 226
5. When you go somewhere, how do you get there?
Some participants take public transportation.
One participant rides with friends to go everywhere.
A few participants take MetroAccess to go to doctor appointments; however it is always
late picking up seniors. One participant knew of an instance when it took MetroAccess
eight hours to pick up a senior from the hospital.
One participant takes WEHTSS to travel to doctor appointments. She was pleased with
this service, though WEHTSS has boundary limitations.
6. How often do you find that transportation is available to you when you need it?
Most participants agree that transportation is always available; however, it is late.
7. When transportation is not available, how does this affect your life?
Most participants agreed that transportation is always available; however, buses do not
arrive on schedule and as a result, seniors may get to your doctor appointments late.
One participant stated that public transportation is limited after 7:00 pm.
8. What are the barriers that you face, if any, to receiving or accessing transportation?
One participant stated that transportation is not easily accessible. She has to walk about
1½ blocks to the Metrobus stop. The bus stop is not safe. There have been several
instances wherein seniors have been accosted.
Participants stated that sometimes the fare that MetroAccess charges is inaccurate. She
was charged for the scheduled pick up time instead of the actual pick up time.
Caregiving
9. Who do you provide caregiving for in your family?
A few participants stated that they had experience providing care for someone, mainly for
family and friends.
Senior Needs Assessment 227
10. What made you begin caregiving for your family member(s)?
One participant stated that she began caregiving out of necessity when her husband
became disabled.
One participant stated that she begin caregiving at the age of 15 because of her family
tradition of taking care of relatives, friends, and neighbors who were sick.
11. Are there any organizations or other family members that provide you with respite care to
assist with your family member(s)?
Most participants did not know of any respite care organizations in the District of
Columbia. One participant noted that there was one organization, People Helping Other
People.
General Comments
Paying for respite could be a barrier for seniors to receive respite care services if it is
not free.
The Home Care Aid takes care of family member in order for the care giver to run
errands.
Participant heard that in order to receive respite care, the family member has to have
Medicare coverage.
12. Have you felt burdened or that you need additional help to care for your family member(s)?
No Response Provided.
Adult Day Care
13. Is there an adult day care facility in your community?
Most participants did not know of any adult day care facilities.
Senior Needs Assessment 228
One participant stated that Washington Home is an adult day care facility in upper
northwest and it costs $105 per day with assistance from DCOA. The Washington
Center for Aging is another adult day care facility in the District of Columbia.
14. Is the daily rate feasible for your level of income?
No
15. Does the adult day care facility provide the appropriate services to meet your needs?
Yes, the adult day care facility has different activities. They are staffed with doctors and
nurses and they provide meals.
16. Is there transportation available to and from the adult day care facility?
No Response Provided.
Abuse, Neglect, and Financial Exploitation
17. Do you know of someone who is being abused, neglected, or financially exploited? If so, are
they aware of District government resources to access assistance in these matters?
One participant knew of seniors that are abused financially, due to illiteracy, and
emotionally. She made the following observations and comments:
There is misuse of seniors’ checking accounts, stealing of money and personal
property by the resident manager.
The resident manager speaks to seniors in a threatening manner when they ask
questions. One participant recommended that resident managers in the District of
Columbia receive the same training that the federal government provides to
resident manager that manage federally owned facilities.
The community room in the facility is not available for senior activities because it
is always rented out to other people.
When seniors go on sponsored trips such as casinos they are not properly fed;
they eat a bag of chips and a doughnut.
Senior Needs Assessment 229
Seniors are emotionally abused by the current security people who are allegedly
paid $200 to sit at the front desk and $1,000 to search seniors’ apartments in the
housing facility. Participant recommended that the District of Columbia should
provide private security service.
Most participants know that if they are being abused or know of anyone that is being
abused to contact APS. However, one participant feels that actions are not taken when
they report abuse to APS.
Special Populations
18. Do you feel the needs of special populations (e.g., racial minorities, persons with disabilities,
LGBT) are being met in your community?
No Response Provided.
19. In general, what do you think are the main barriers, if any, to special populations receiving or
accessing the services they need?
No Response Provided.
Employment
20. Are you currently seeking employment? If so, what difficulties are you facing being in the
job market?
Some participants are seeking employment. They think that they are not being hired
because of age discrimination.
Case Management/Wellness
21. What services do you need the most to boost your quality of life?
More exercise programs at senior facilities. Participant recommended that senior
facilities contact the YMCA to invite them to visit senior facilities to conduct exercise
programs.
Senior Needs Assessment 230
22. If you need help navigating the system of services, what services do you need assistance
with?
Respite care.
Transportation.
General Comment
Navigating the system is a problem. Often when you call DCOA the mailbox is full and
you are given a number to call and no one answers the telephone.
East River Family Strengthening Collaborative services are very good.
Nutrition Needs
23. In the past 12 months, has there been a time where you have not had enough food to eat?
How often?
All of the participants have had enough food to eat in the past 12 months; however, they
knew of other seniors who have not had enough food to eat.
24. Do you feel that you are able to afford the right (nutritionally balanced/healthy) food to eat?
Most participants think that they are eating the right foods; however, they are not seeing
a dietician to ensure that they are eating right.
25. In general, what do you think are the main barriers, if any, to older adults receiving or
accessing the food they need or want?
One participant stated that Meals on Wheels does not deliver nutritionally balanced and
tasty food. Participant brought a bag of food to the focus group that had been delivered
by Meals on Wheels to her husband. After examining the food, the majority of
participants agreed that the food was visually not appealing. Participants recommended
that vendors should be screened and demonstrate their ability to prepare nutritionally
balanced and tasty food.
Many seniors do not receive food that they need due to financial barriers

Senior Needs Assessment 231
Health and Health Care
26. How do you feel the health care needs of older adults are being met in your community?
One participant stated that her health care needs are being met.
27. In general, what are the barriers, if any, to receiving or accessing the help you or others might
need regarding your physical health?
There are no hospitals in the area. The closest hospital is in Prince George’s county.
Participant recommended that the District of Columbia build a hospital in the area with
a trauma unit.
28. Older adults often feel isolated, lonely, or depressed. How do you think the community helps
older adults with these feelings?
One participant stated that the community does not have an emotional support system to
handle loneliness and depression.
One participant stated that she often reaches out to try and help depressed people.
Participant recommended that communities establish floor captains for seniors that live
in housing facilities or block captains for senior that live in private homes in residential
neighborhoods.
29. In general, what are the barriers, if any, to receiving or accessing the help you or others might
need regarding your mental or emotional health?
No Response Provided.
General Closing Question
30. Is there any additional information that you would like to provide regarding the needs of
seniors in your community?

Senior Needs Assessment 232
One participant recommended that their council member be accessible to the people in
the ward that she represents.
The majority of the participants recommend that the DCOA present feedback to the
community about the results of the needs assessment.
Senior Needs Assessment 233
Lesbian, Gay, Bisexual and Transgender: Focus Group Summary
The focus group for LGBT was held in the lower level conference room at 1101 15th
Street NW, Washington, DC, on September 8, 2011. Eight seniors participated.
The focus group facilitator asked participants a series of questions in the areas of in-home
service needs; transportation; caregiving; adult day care; abuse, neglect, and financial
exploitation; special population; employment; case management; nutrition needs; and health and
health care. While few participants offered most of the responses to each topic or question, there
was never widespread disagreement. Following are comments and observations from the focus
group.
1. What would you like to see in your community that would make it a better place for older
adults to live?
Extended hours at the wellness centers so that working seniors have the opportunity to
attend them.
A safe place for LGBT to attend.
Employment opportunities.
More retirement homes that offer gradual care. There is only one in the District of
Columbia, Thomas House.
Support systems for LGBT and their partners including financial support.
Inter-agency collaboration.
In-Home Service Needs
2. Sometimes older adults need help with daily life activities. What kinds of activities do you
think older adults need the most help with?
Help with transportation.
Help with shopping.
Help with hygiene care such as taking a bath.

Senior Needs Assessment 234
General Comments
Short term health care is very expensive and most seniors cannot afford it.
If you marry in the District your benefits cannot transfer.
3. How do you feel the home health care needs of older adults are being met in your
community?
Participant stated that he tried to obtain information from DCOA in reference to home
services. He found out that DCOA does not have LGBT specific services so he had to
use private services and he ensured that the care giver could relate to a gay man
General Comments
The Office of LGBT and DCOA are working in collaboration; however, more services
need to be provided for the LGBT.
4. Are you at risk of losing your home? If so, what do you need to remain in your home? (e.g.,
home modifications, financial assistance)
One participant stated that his home needs modification; however, the District of
Columbia could not assist him because the cost for the modification is $50,000 and his
balance on the home is $30,000.
General Comments
One participant recommended that the District of Columbia hold seminars to educate
seniors on their rights and how to obtain financial assistance. The District of Columbia
should have a one-stop shop to obtain information.
Transportation
5. When you go somewhere, how do you get there?
Most participants drive and take public transportation.
Senior Needs Assessment 235
One participant takes MetroAccess to go to doctor appointments; however, it is always
late picking him up and he feels disrespected. He is not happy with the service and he
knew of other seniors that feel the same.
Addition Questions
6. What assistance would you need if you were not mobile?
Most participants stated that they would have to take MetroAccess.
7. How often do you find that transportation is available to you when you need it?
No Response Provided.
8. When transportation is not available, how does this affect your life?
No Response Provided.
9. What are the barriers that you face, if any, to receiving or accessing transportation?
No Response Provided.
Caregiving
10. Who do you provide caregiving for in your family?
Some participants have provided caregiving for friends.
11. What made you begin caregiving for your family member(s)?
Participants stated they began caregiving because their friends did not have any family
or anyone to care for them.
12. Are there any organizations or other family members that provide you with respite care to
assist with your family member(s)?
Most participants did not know of any respite care organizations in the District of
Columbia.
13. Have you felt burdened or that you need additional help to care for your family member(s)?
No Response Provided.
Senior Needs Assessment 236
Adult Day Care
14. Is there an adult day care facility in your community?
Most participants did not know of any adult day care facilities.
One participant was aware of IONA adult day care services; however, their services are
not gay friendly. Participants agreed that gay friendly adult care services are needed in
the District of Columbia.
15. Is the daily rate feasible for your level of income?
No Response Provided.
16. Does the adult day care facility provide the appropriate services to meet your needs?
No Response Provided.
17. Is there transportation available to and from the adult day care facility?
No Response Provided.
Abuse, Neglect, and Financial Exploitation
18. Do you know of someone who is being abused, neglected, or financially exploited? If so, are
they aware of District government resources to access assistance in these matters?
One participant stated that seniors need to know their rights and that most relatives steal
money from them.
Most participants know that if they are being abused or know of anyone that is being
abused to contact APS or DCOA.
General Comments
Senior Needs Assessment 237
LGBT seniors are exploited every month at the first of the month when they receive their
checks. Participant recommended that the District of Columbia should provide
education, fellowship and knowledge sharing in this area.
Special Populations
19. Do you feel the needs of special populations (e.g., racial minorities, persons with disabilities,
LGBT) are being met in your community?
The majority of the participants agreed that the LGBT needs are not being met.
Participant recommended that the District of Columbia should work with SAGE to
provide services to the LGBT community.
General Comments
Participants agreed that they would like to see events for LGBT at the local AARP level.
Participant recommended that DCOA encourage more LGBTs to get involved in the
AARP local chapter.
20. In general, what do you think are the main barriers, if any, to special populations receiving or
accessing the services they need?
Participants agreed that information about available services is a barrier. The LGBT
community needs to know that they can participate in the services without fear.
Employment
21. Are you currently seeking employment? If so, what difficulties are you facing being in the
job market?
No Response Provided.
Case Management/Wellness
22. What services do you need the most to boost your quality of life?
Senior Needs Assessment 238
One participant stated that there are LGBTs that would like to go to wellness centers, but
they feel that they are not welcome. Participant recommended that the District of
Columbia educate people on cultural sensitivity.
23. If you need help navigating the system of services, what services do you need assistance
with?
Day care.
Nutrition Needs
24. In the past 12 months, has there been a time where you have not had enough food to eat?
How often?
No Response Provided.
25. Do you feel that you are able to afford the right (nutritionally balanced/healthy) food to eat?
No Response Provided.
26. In general, what do you think are the main barriers, if any, to older adults receiving or
accessing the food they need or want?
No Response Provided.
Health and Health Care
27. How do you feel the health care needs of older adults are being met in your community?
No Response Provided.
28. In general, what are the barriers, if any, to receiving or accessing the help you or others might
need regarding your physical health?
No Response Provided.
29. Older adults often feel isolated, lonely, or depressed. How do you think the community helps
older adults with these feelings?
Senior Needs Assessment 239
One participant stated that the community does not have an emotional support system to
handle loneliness and depression for the LGBT community. The DCOA really needs to
support programs for depression because it is very high in the LGBT community.
A lot of people are committing suicide.
When people move into senior facilities, they tend to hide their identity.
One participant recommended that the District of Columbia should assist in creating a
buddy system or have someone call seniors to see how they are doing.
One participant recommended that the District of Columbia should establish a listening
service dedicated to really listening to the needs of seniors.
One participant recommended that the District of Columbia should distribute a telephone
number for people to call to get information on mental health.
30. In general, what are the barriers, if any, to receiving or accessing the help you or others might
need regarding your mental or emotional health?
No Response Provided.
General Closing Question
31. Is there any additional information that you would like to provide regarding the needs of
seniors in your community?
Senior HIV population is aging. Participant recommended that the District of Columbia
view this problem.
Participant recommended that the District should place the LGBT/SAGE property in a
safe location so that they can organize themselves.
Participant recommended that the DCOA LGBT should help organize and sponsor a
LGBT conference.
Transgenders have barriers when they try to receive services.
There are only two publications in the District of Columbia for the LGBT community.
The DC Blade no longer lists LGBT organizations.

Senior Needs Assessment 240
Participant suggested that the next time that the District of Columbia conducts focus
groups that participants receive a stipend.
The majority of the participants recommend that the DCOA present feedback to the
community about the results of the needs assessment.
Senior Needs Assessment 241
Hispanic or Latino: Focus Group Summary
1. What would you like to see in your community that would make it a better place for older
adults to live?
More transportation is needed.
Better recreation centers in all areas for seniors.
More hours for bus transfers.
More communication centers for senior citizens.
Police presence to ensure the buildings where seniors live are safe.
Less expensive adult daycares that seniors will be able to afford.
Better traffic lights and sound to cross the streets.
Better healthcare and affordable companionship.
In-Home Service Needs
2. Sometimes older adults need help with daily life activities. What kinds of activities do you
need the most help with?
Most seniors need help with home cleaning and cooking as well as activities such as
shopping for groceries.
A nurse to help with administration of medication.
Companionship on the weekend because communication centers are closed and they feel
lonely at home with no person to talk to.
3. How do you feel about the in-home health care needs of older adults that are being met in
your community?
The needs are not being met in the Spanish community; many of the home aides do not
speak Spanish.
4. Are you or someone you know at risk of losing their home? If so, what do you need to remain
in your home? (e.g.; home modifications (repairs), financial assistance)
Senior Needs Assessment 242
The participants did not state they were at risk of losing their home; however, they did
state that there is a need for financial assistance to repair their homes including the
installation of special stairs in their homes and alarms to keep them safe.
The participants stated that home modifications and equipment is very expensive, and
they are not able to afford it. They expressed that it would be great if the government
could assist them with these expenses.
Transportation
5. When you go somewhere, how do you get there?
Most of the time they take the bus or walk.
It is rare that they take a taxi because is very expensive for their income level.
6. How often do you find that transportation is available to you when you need it?
Everybody stated that they rarely ever find transportation that is available when they
need it.
7. When transportation is not available, how does this affect your life?
The participants stated that transportation plays a major role in their lives; it affects
them tremendously when it is not available.
When transportation is not available, some participants stated that they miss important
doctor’s appointments, and in other instances, they cannot attend some daily activities
that get them out of the house to socialize and participate in activities.
8. What are the barriers that you face in receiving or accessing transportation?
Participants stated that transportation is very poor. The bus schedules are not convenient
especially on the weekends and during rush hour. Sometimes two or three buses come at
the same time and there is a long period of time before another bus arrives. On some
occasions they have to wait more than an hour for a bus to come.
The bus stop is a long distance away from where they live, so they have to walk a long
way to take the bus.
Senior Needs Assessment 243
Participants also expressed that the government should take more control of the bus
schedules to facilitate their transportation and instruct the bus drivers to take control of
the senior citizen seats so that they will be available for seniors instead of young people.
Caregiving Questions (ONLY ASK IF CAREGIVERS ARE PRESENT)
No caregivers were present in the meeting.
9. Who do you provide caregiving for in your family?
10. What made you begin caregiving for your family member(s)?
11. Are there any organizations or other family members that provide you with respite care to
assist with your family member(s)?
12. Have you felt burdened or that you need additional help to care for your family member(s)?
Adult Day Care
13. Is there an adult daycare facility (a place for older adults to receive care during the day) in
your community? (If the answer is NO, go to next section).
A single participant stated that she is aware of an adult day care facility in the
community.
14. Is the daily rate feasible for your level of income?
A participant stated that the adult day care facility that she is aware of charges $4,000 a
month for their services. It is impossible for most seniors to afford the cost because most
of the participants are retired and their income will not allow them to attend.
15. Does the adult daycare facility provide the appropriate services to meet your needs?
They did not have experience to give an opinion.
16. Is there transportation available to and from the adult daycare facility?
Senior Needs Assessment 244
No experience to submit an opinion.
Abuse, Neglect, and Financial Exploitation
17. Are you or someone you know being abused, neglected, or financially exploited? If so, are
you aware of District government resources to access assistance for abuse, neglect or
financial exploitation?
The participant stated that they would like to have more information and education about
abuse, neglect, and financial exploitation. For example, they would like to have more
access to telephone numbers to report abuse. Also, they want to know the name of
organizations that will help them with situations in the case of emergencies.
Special Populations
18. Do you feel the needs of older Latinos are being met in your community?
No, they participants stated they feel their needs are ignored by the community because
many of them cannot voice their opinion in the community.
19. What do you think are the main barriers to older Latinos receiving or accessing the services
they need?
Language. The seniors stated they would like to have access to a person that speaks their
own language to understand the services available to them and their rights.
There is a lot of social, economic, and political discrimination, especially in the
government agencies.
When an older Latino applies for something it takes a much longer time to get an answer.
Sometimes there is never a response or their file gets lost.
Housing is a major problem for Hispanic or Latino citizens. Many property services do
not meet their special needs.
Employment
Senior Needs Assessment 245
20. Are you currently seeking employment? If so, what difficulties are you facing being in the
job market?
Some of the participants said they were looking for a job, but they were unsuccessful.
Many employers don’t want to hire older people because they become problems for the
company. In general they feel that they are being discriminated because of their age.
They recommended that the government create a type of business to employ the seniors
to keep them busy and still make a profit for the government and for them.
Case Management/Wellness
21. What services do you need the most to boost your quality of life?
Affordable and adequate housing.
More access to health insurance.
More help with the medication.
Financial assistance.
More recreation centers for senior citizens, especially on the weekends.
22. If you need help navigating the system of services, what services do you need assistance
with?
The seniors expressed that they did not have knowledge about the programs available to
give them these kinds of services.
Nutrition Needs
23. In the past 12 months, have there been times when you have not had enough food to eat? If
so, how often?
Many of the seniors expressed that they have very tight budgets on their fixed incomes,
and they cannot afford all of the food they need.
24. Do you feel that you are able to afford the right (nutritional and balanced/healthy) food to
eat?
Senior Needs Assessment 246
A large proportion of seniors stated that most of their income is from social security,
retirement pension and some of them don’t have any income at all and cannot afford
healthy and nutritional food.
25. What do you think are the main barriers, if any, to older adults receiving or accessing the
food they need or want?
It was stated that it is very difficult for them to have access to a balanced diet, especially
to fit their medical conditions, such as diabetes, cholesterol, and overweight.
Economic strain is a major barrier to receiving appropriate foods.
Transportation to facilities such as group meal sites and food banks.
Health and Health Care
26. How do you feel about the healthcare needs of older Latinos are being met in your
community?
Medicare, Medicaid, and other government insurances do not sufficiently help them with
the adequate medical needs; for example, medical insurance premiums and medications
are too expensive.
27. What are the barriers to receiving or accessing the help you or others need regarding your
physical health?
Money and finances.
Access to rehabilitation centers and physical therapy.
Lack of activities for seniors.
Abandonment and isolation.
28. Older adults often feel isolated, lonely, or depressed. How do you think the community helps
older adults with these feelings?
Senior Needs Assessment 247
The group stated that they do not feel that the community helps them with feelings of
depression or loneliness. Most of the time they are lonely and depressed at home with no
activities to perform.
The seniors expressed they would like for the government to create more programs and
better recreation centers to support them.
29. What are the barriers to receiving or accessing the help you or others need regarding your
mental or emotional health?
It was expressed that there is a lack of information and education about mental
programs.
General Closing Question
30. Is there any additional information that you would like to provide regarding the needs of
seniors in your community?
Transportation is a major problem for seniors. It was stated that an urgent solution is
needed for transportation problems. More buses are needed at the wellness centers to
transport seniors to the recreation activities.
Wellness centers need more economic help to implement programs that meet the seniors’
needs.

Senior Needs Assessment 248
Asian and Pacific Islander: Focus Group Summary
The focus group for District of Columbia Office on Aging was held at St. Mary’s Church
on September 14, 2011. Nine seniors participated in the focus group.
The focus group facilitator asked participants a series of questions in the areas of in home
service needs; transportation; caregiving; adult day care; abuse, neglect, and financial
exploitation; special population; employment; case management; nutrition needs; and health and
health care. Following are notes from the focus group.
1. What would you like to see in your community that would make it a better place for older
adults to live?
Several seniors stated they do not feel secure in their community. One participant stated
that she has seen gun violence in her neighborhood.
The participants stated they would like to have a facility where they can participate in
activities both outside and inside such as chess, mahjong, or playing cards.
The participants stated that they would like to see more people at locations like
pharmacies that speak their language.
In-Home Service Needs
2. Sometimes older adults need help with daily life activities. What kinds of activities do you
need the most help with?
Participants stated that most seniors need help shopping and buying groceries.
3. How do you feel the in-home health care needs of older adults are being met in your
community?

Senior Needs Assessment 249
The participants stated the main concern with in-home health care services is
communication. They cannot communicate with the aides and therefore cannot tell them
their needs.
4. Are you or someone you know at risk of losing their home? If so, what do you need to remain
in your home? (e.g., home modifications (repairs), financial assistance)
Most of the seniors stated they live in apartments and they are satisfied with the
condition. Those that own his/her home stated they could benefit from financial
assistance to maintain and repair their home.
Transportation
5. When you go somewhere, how do you get there?
The participants stated that they either take the bus or walk.
6. How often do you find that transportation is available to you when you need it?
No Response Provided.
7. When transportation is not available, how does this affect your life?
The participants stated that they either walk or ask their children to take them places. If
these options are not available they stay at home.
8. What are the barriers that you face to receiving or accessing transportation?
The fares for transportation in the District of Columbia are relatively higher than other
areas. A participant stated that Montgomery County, Maryland provides free
transportation service to seniors during certain time periods, but the District of
Columbia does not offer this or anything similar.
Caregiving Questions (ONLY ASK IF CAREGIVERS ARE PRESENT)
No caregivers were present in the meeting.
9. Who do you provide caregiving for in your family?
10. What made you begin caregiving for your family member(s)?
Senior Needs Assessment 250
11. Are there any organizations or other family members that provide you with respite care to
assist with your family member(s)?
12. Have you felt burdened or that you need additional help to care for your family member(s)?
Adult Day Care
13. Is there an adult day care facility in your community?
There is an adult day care facility in the community.
14. Is the daily rate feasible for your level of income?
The adult day care facility is affordable.
15. Does the adult day care facility provide the appropriate services to meet your needs?
None of the participating seniors use the adult day care facility. They all indicated that
they live independently.
16. Is there transportation available to and from the adult day care facility?
No Response Provided.
Abuse, Neglect, and Financial Exploitation
17. Are you or someone you know being abused, neglected, or financially exploited? If so, are
you aware of District government resources to access assistance for abuse, neglect or
financial exploitation?
None of the seniors were aware of another senior that has been abused, neglected, or
financially exploited.
Special Populations
18. Do you feel the needs of older Asians and Pacific Islanders are being met in your
community?
No Response Provided.
19. What do you think are the main barriers to older Asians and Pacific Islanders receiving or
accessing the services they need?
Senior Needs Assessment 251
The main barrier is communication. It is difficult to access services or ask for help if no
one speaks their language.
Employment
20. Are you currently seeking employment? If so, what difficulties are you facing being in the
job market?
No, all of the participants stated they are retired.
Case Management/Wellness
21. What services do you need the most to boost your quality of life?
Seniors need a safe and secure living environment to maintain a high quality of life.
Seniors also need financial assistance to help afford utilities. Each year there are
increases in utilities, but they do not receive an increase in income.
22. If you need help navigating the system of services, what services do you need assistance
with?
No Response Provided.
Nutrition Needs
23. In the past 12 months, has there been a time when you have not had enough food to eat? How
often?
The seniors stated that they have not experienced not having enough food to eat.
24. Do you feel that you are able to afford the right (nutritionally balanced/healthy) food to eat?
No, and the group meals they are provided are not good quality.
25. What do you think are the main barriers, if any, to older adults receiving or accessing the
food they need or want?
No Response Provided.
Health and Health Care

Senior Needs Assessment 252
26. How do you feel the health care needs of older Asians and Pacific Islanders are being met in
your community?
Participants who have Medicare are fully protected by the plan, but participants who
have Medicaid are not fully protected. Some of the participants stated some vaccines,
especially for seniors, are expensive.
27. What are the barriers to receiving or accessing the help you or others need regarding your
physical health?
No Response Provided.
28. Older adults often feel isolated, lonely, or depressed. How do you think the community helps
older adults with these feelings?
The community needs to help seniors a lot more, especially those that do not speak
English. Several participants stated they would like to have basic internet service so
they can stay informed and read information in their language.
29. What are the barriers to receiving or accessing the help you or others need regarding your
mental or emotional health?
No Response Provided.
General Closing Question
30. Is there any additional information that you would like to provide regarding the needs of
seniors in your community?
Many of the facilities in the community are outdated and need to be replaced.
If possible, the participants stated they would like to have a Chinese grocery store in the
District of Columbia Chinatown.
Senior Needs Assessment 253
Appendix D: Key Informant Discussion Guide
1. Based on your knowledge and experiences, what are the top three needs of:
a. Seniors
b. Persons living with disabilities
c. Caregivers
d. Special populations
in the District of Columbia?
2. Based on your knowledge and experiences, what are the major barriers to:
a. Seniors
b. Persons living with disabilities
c. Caregivers
d. Special populations
receiving the services they need?
3. What are the top three programs/services that are working well in the District of Columbia
for:
a. Seniors
b. Persons living with disabilities
c. Special populations
4. What additional services can the District of Columbia and DCOA provide to members of
special population groups to improve their quality of life and the services offered to them in
your community?
5. Are there any additional comments that you would like to provide regarding the needs of
seniors in the District of Columbia?
Senior Needs Assessment 254
6. If you use DCOA programs/services, how well is DCOA providing services to seniors living
in the District of Columbia, disabled persons between the ages of 18-59 and/or caregivers?
7. If you do not use DCOA programs/services, why not?
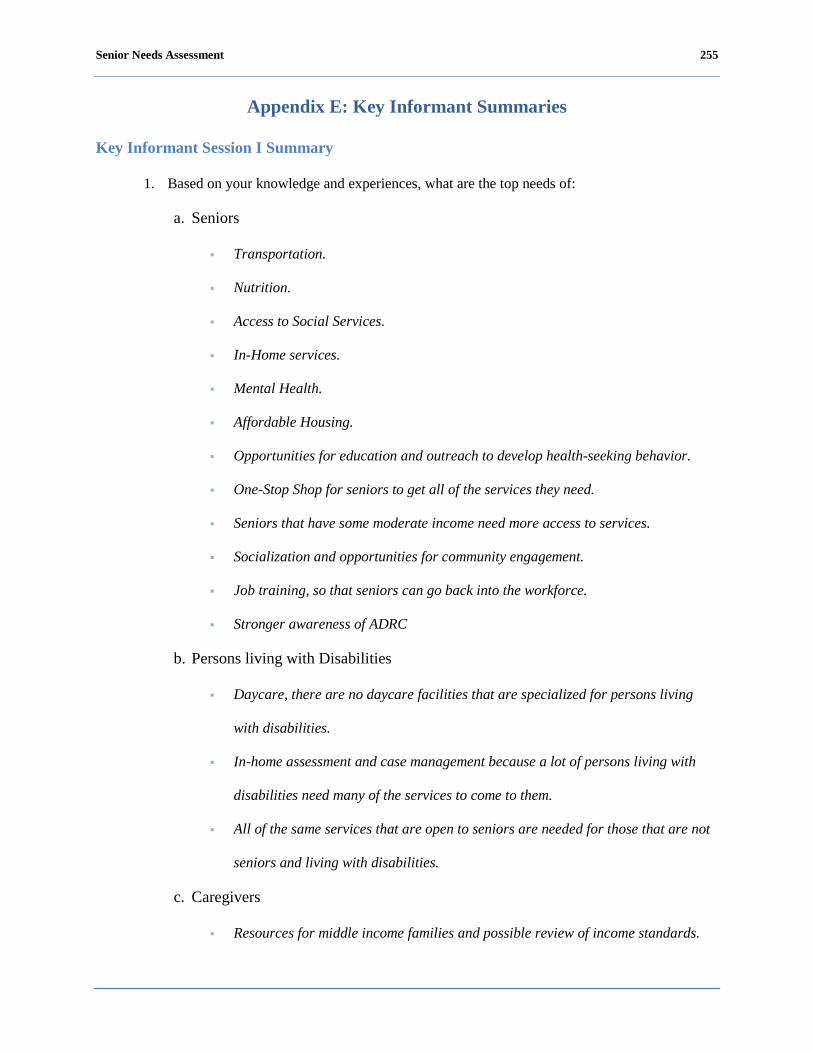
Senior Needs Assessment 255
Appendix E: Key Informant Summaries
Key Informant Session I Summary
1. Based on your knowledge and experiences, what are the top needs of:
a. Seniors
Transportation.
Nutrition.
Access to Social Services.
In-Home services.
Mental Health.
Affordable Housing.
Opportunities for education and outreach to develop health-seeking behavior.
One-Stop Shop for seniors to get all of the services they need.
Seniors that have some moderate income need more access to services.
Socialization and opportunities for community engagement.
Job training, so that seniors can go back into the workforce.
Stronger awareness of ADRC
b. Persons living with Disabilities
Daycare, there are no daycare facilities that are specialized for persons living
with disabilities.
In-home assessment and case management because a lot of persons living with
disabilities need many of the services to come to them.
All of the same services that are open to seniors are needed for those that are not
seniors and living with disabilities.
c. Caregivers
Resources for middle income families and possible review of income standards.
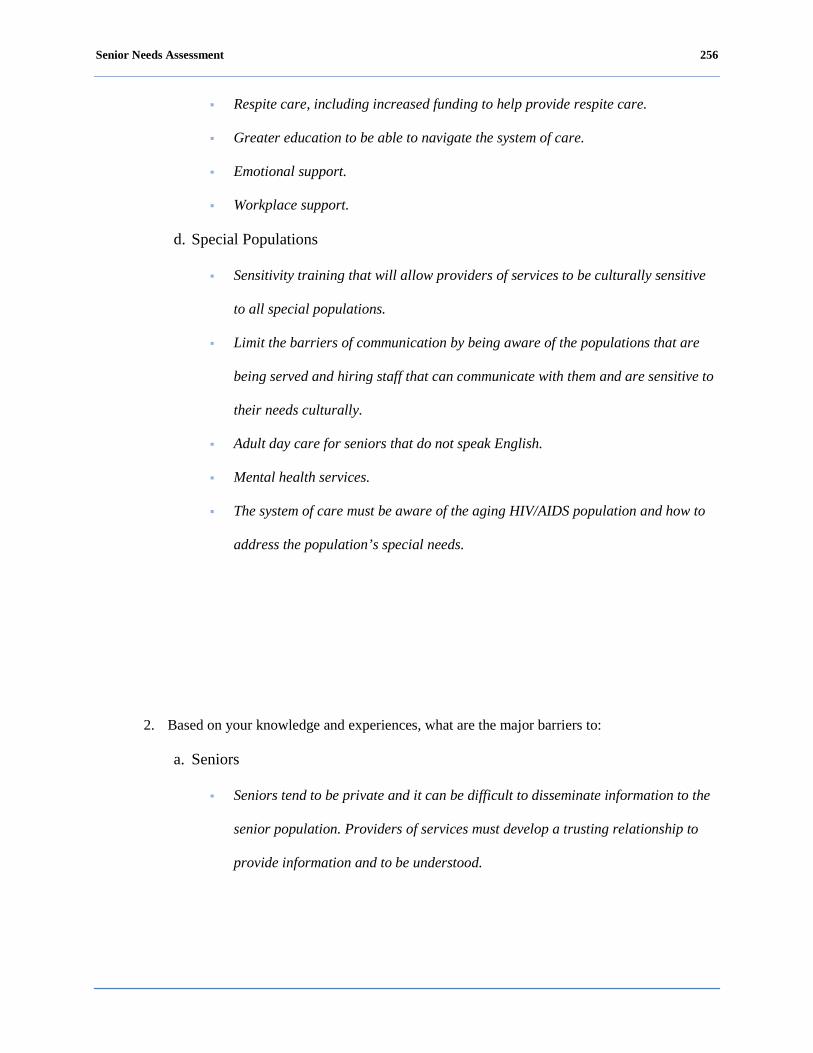
Senior Needs Assessment 256
Respite care, including increased funding to help provide respite care.
Greater education to be able to navigate the system of care.
Emotional support.
Workplace support.
d. Special Populations
Sensitivity training that will allow providers of services to be culturally sensitive
to all special populations.
Limit the barriers of communication by being aware of the populations that are
being served and hiring staff that can communicate with them and are sensitive to
their needs culturally.
Adult day care for seniors that do not speak English.
Mental health services.
The system of care must be aware of the aging HIV/AIDS population and how to
address the population’s special needs.
2. Based on your knowledge and experiences, what are the major barriers to:
a. Seniors
Seniors tend to be private and it can be difficult to disseminate information to the
senior population. Providers of services must develop a trusting relationship to
provide information and to be understood.
Senior Needs Assessment 257
There is a limited capacity (not lack of expertise) of DCOA network. There are
currently services that have wait lists, such as case management. If there were
adequate resources, providers could engage in active outreach in the community.
Mental health issues that prevent some seniors from receiving services. A
protective needs panel should be established so that providers of services can go
through the court system to get help for people who are resistant to care which is
often due to mental health issues.
b. Persons living with Disabilities
Disabilities are themselves a barrier to receiving care due to limited mobility of
some persons living with disabilities.
c. Caregivers
Income requirements for some services are a barrier to care for many caregivers.
Many caregivers make too much to receive Medicaid but they need additional
resources to provide care for their family member/friend.
d. Special Populations
The major barriers for special populations are cultural and language barriers.
Case managers and those with direct client contact need cultural sensitivity
training.
There is a need for more services and outreach materials provided in multiple
languages.
Many providers do not consider or ask seniors if they are LGBT, and many of
their needs are not being met.
e. Homeless Seniors
The system of care must address why people are homeless. For homeless seniors,
mental health and substance abuse issues can also be compounded by dementia.

Senior Needs Assessment 258
There is a lack of supportive housing for homeless seniors. There also needs to be
assurance that homeless seniors that are placed into permanent housing are
prepared and ready for permanent housing. Often, these seniors will place their
housing in jeopardy by allowing homeless friends to sleep over or by continuing
to live as if they are homeless (e.g., collecting items/hoarding, sleeping on the
floor)
f. All Groups
The lack of physicians that accept Medicaid and Medicare is a problem.
There are not a lot of college courses/programs that encourage people to go into
senior care. There need to be more programs/internships that are available within
the District of Columbia.
There is a lack of inter-agency coordination of services when problems cross
agencies. There is a great need for agencies to collaborate to address barriers.
3. What programs are working well in the District of Columbia?
Overall the key informants felt the following programs work well for all of the
populations:
Case management.
Home care health aides, although it would be better if aides could have more time
with their patients.
The Village movement (non-profit set up in the community with volunteers from
the community that are vetted and provide a variety of services including yard
work, note taking at the doctor, transportation, companionship, etc.)
Home delivered meals and congregate meals, as well as more meals offered to
accommodate different ethnicities.
WEHTSS program for transportation.
Arts programs.

Senior Needs Assessment 259
Adult day care works well but there are not enough facilities.
Wellness centers.
4. What additional services can the District of Columbia and DCOA provide to members of
special population groups to improve their quality of life and the services offered to them in
your community?
Better system to provide emergency shelters for seniors.
There is a great need for qualified and authorized people to help with medication
management for people that need medication on a regular basis.
There is a need for comprehensive medical facilities to be brought into the home.
More effort should be made to reach out to the LGBT community. The government
needs to collaborate more with the LGBT community and find a model that works
to provide proper services.
There is a need for a program/agency to check on seniors that live alone in their
homes.
There is a need for additional funding for mental health staff.
There is a great need for bilingual staff that can provide services for all major
cultural groups.
5. Additional Comments
Service providers need to be aware that the major service group is seniors over
the age of 85.
Many of the professionals that provide services are not knowledgeable about the
LGBT community and that is a problem because there is a cohort of seniors that
identify as LGBT and they require different needs in some areas than other
seniors.
There is a great need to provide additional government funding for wellness
centers to have better activities for socialization and recreation.
Senior Needs Assessment 260
More planning and collaboration between agencies to provide services for
seniors.
Companionship programs are greatly needed. There should be a volunteer match
program. Many of the programs that are currently in place can only accept
volunteers that are 60 years and older.
The providers stated that they would like to see a needs assessment focused on
each target group separately. Focusing on everyone is extremely broad.
DCOA should provide a newsletter to help communicate better with the
community.
6. If you use DCOA programs/services, how well is DCOA providing services to seniors living
in the District, disabled persons between the ages of 18-59, and/or caregivers?
The key informants stated that although DCOA offers many services, many of the
services should be updated. Organizations want to work better with DCOA and
this is an exciting time to reinvent DCOA.
DCOA has great services but there is a need for more services in the community.
(see question #4).

Senior Needs Assessment 261
Key Informant Session II Summary
1. Based on your knowledge and experiences what are the top three needs of:
a. Seniors
Healthcare
Health care management (how to get to the doctor, when to go to the doctor,
being able to navigate the system)
Useful case managers (referencing – how to get a new doctor if they don’t like
their current doctor, if they have to get a specialty and have to go to a specialty
doctor).
Visiting physicians.
Education
Diabetes is becoming one of the leading vision lost issues.
Glaucoma is also another.
More education is needed on how to prevent health issues.
They aren’t asking their doctors questions due to being embarrassed and
uneducated.
Transportation
MetroAccess can be too expensive for those on a fixed income.
If a senior is coming on their own and using MetroAccess, there is no promise
they will arrive or on time.
Meals
Many seniors don’t cook or cook very little.
Many seniors that need home delivered meals don’t receive them. A lot of seniors
east of the river do not receive a lot of the services that other seniors receive.
Communication

Senior Needs Assessment 262
Communication with seniors is different because frailty and cognitive levels must
be taken into consideration, and there needs to be a system of care that
acknowledges this.
Accessibility
There are still a lot of venues around the District of Columbia that do not meet the
ADA standards (lighting, no ramps or elevators, entryways).
b. Person Living with Disabilities
ADA Standards
Many senior living facilities are not up to code and do not meet ADA standards
(example: railing in bathrooms).
Education
It important to ensure that locations and individuals are aware of ADA laws and
putting them into practice.
c. Caregivers
Support systems
Caregivers need more support from the community and provider agencies that
includes respite care.
There needs to be a more comprehensive and enhanced approach to helping
caregivers.
Education
Navigating the system of care can be difficult and challenging and many
caregivers need assistance.
Legal Advice
Senior Needs Assessment 263
Because caregivers are often making complicated decisions for another
individual, they need to be aware of their rights, as well as the rights of the other
individual especially when dealing with insurance matters and financial decisions.
d. Special Populations
All Groups
Overall, when dealing with special populations, there needs to be assurance of
cultural competency and sensitivity.
The needs of all seniors no matter their differences are similar. For seniors that
do not speak English the issues/problems are compounded.
Spanish Speaking
A Spanish speaking person should be able to communicate with another Spanish
speaking person when they make contact to an agency or organization to receive
assistance.
There are no mental health programs that exist for the Spanish speaking
population.
There is a great deal of diversity among Spanish speaking persons and their
cultures. Among these differences there are different problems that affect specific
groups. There seems to be no cultural sensitivity that takes this into consideration.
All Spanish speaking people get grouped into one category.
Asian & Pacific Islander
Among the Asian and Pacific Islander population, depression and mental health
are large issues as a result of having limited communication with other people
that speak their language.
Cultural barriers.
Veterans

Senior Needs Assessment 264
Housing for veterans that are missing limbs is a big problem.
There is a lack of community support for those that are not receiving treatment at
a VA hospital currently.
Veterans also need more peer support and contact.
LGBT
Because many LGBT are removed from their family and may have lost a
significant other, LGBT persons need more community support and recognition of
their individual issues. When thinking about senior issues, many people and
organizations do not even ask if a person is LGBT to learn more about the specific
issues they face.
When providers were asked what are the critical services needed for all populations, they
responded as follows:
Food: congregate meals;
Nutrition/health services;
Transportation; and
Education.
2. Based on your knowledge and experiences what are the major barriers to receiving services
for:
a. All Groups
Education
Organizations that serve the individual populations need to go to the locations
where the population frequents to educate them about services and provide
information that they will not receive otherwise.
Senior Needs Assessment 265
When using promotional and informational materials, phone numbers need to still
be included instead of just web addresses which creates a barrier for those that
are not computer literate or do not have a computer.
Analysis of structural needs
Greater attention should be given to the Census as populations grow, and funds
should be dispersed accordingly to meet the needs of those populations.
b. Seniors
Literacy
Fear of losing home
When seniors have a safe place to live, free from worry that they will lose their
home, they are more likely to receive care.
System of Care
Navigating the system of care can be very difficult and daunting for seniors. They
need more help from case managers to navigate the system and access all of the
services they need.
c. Persons Living with a Disability
ADA Services
Lack of some locations and organizations that follow ADA rules and regulations
which makes it difficult for some people living with a disability to access services.
d. Special Populations
Veterans
Senior Needs Assessment 266
Some organizations and individuals are prejudice against veterans because they
do not agree with war.
The system of care was not prepared to take care of the large population of female
veterans.
LGBT
Stigma.
Refusal of services and going without care because of the lack of cultural
competency.
Isolation.
Lack of support due to a small support system.
3. What are the top three programs/services that are working well in the District:
a. Elder Fest
b. Miss Senior DC
Allows senior women the opportunity to enjoy each other and share as they
transition through different stages of being a senior.
c. Home delivered meal program
Home delivered meals is a great program but it needs more work. Meals need to
be culturally sensitive, healthy, and consistent.
d. Call N Ride (Taxi Service)
It needs more advertisement. Not enough clients are aware of the service.
Can be a challenge for non-English speaking individuals.
e. WEHTSS
Only serves a limited area and may require expansion in the future.
f. Wellness Programs at Community Centers

Senior Needs Assessment 267
A provider stated that there are services available for seniors, persons living with
a disability and caregivers in the District of Columbia, but many of the programs
need to be reevaluated and modernized to meet the needs of these populations in a
modern world.
4. What additional services can DCOA provide to members of special population groups to
improve their quality of life and the services offered to them in your community?
a. Spanish speaking
Peer Navigators
Bilingual peer navigators that can help navigate them through the system of care.
Transportation
Culturally aware drivers or transportation aides
Culturally appropriate meals
Better coordination of services
There is an overlap of services (example: If an African home health aide is placed
in the home of a Latin American senior and is supposed to prepare meals, they are
unaware of how to prepare Latin food; therefore, that client must order home
delivered meals and using a resource that someone else may need).
Additional Comments:
A provider stated that if nothing else, DCOA should be a complete resource center with
current information available.
The Department of Health (other than Medicaid and Medicare) and the Department of
Human Services are lacking greatly. There is a need for an assessment of these agencies and how
they serve seniors, persons living with a disability, and caregivers. There should be more

Senior Needs Assessment 268
collaboration among DCOA with these agencies because they also play a role in serving these
populations.

Senior Needs Assessment 269
Appendix F: Outreach Materials

Senior Needs Assessment 270
Focus Group Flyer
Senior Needs Assessment 271
Senior Survey Flyer

Senior Needs Assessment 272
Appendix G: Community Presentation Feedback
Two community presentations were held in the northwest (NW) and southeast (SE)
corridors of the District of Columbia on July 6, 2012 and July 13, 2012 respectively. Community
members, service providers and other community stakeholders were presented the key findings
of the Senior Needs Assessment: Initial Data Collection and provided the opportunity to ask
questions, provide feedback and suggest recommendations. The comments shown were captured
at the community presentation sessions.
Recommendations and Comments
Link seniors with retired Veteran’s and other intergenerational populations
Seniors need greater knowledge transportation services, especially free
Metro Access is very expensive for seniors
More study is needed for very-low income seniors
Seniors need to be made more aware of the information and services available
Address the need to inform seniors of other issues that affect/are important to them such as
hospice care and living wills
There are barriers for seniors looking for work to find employment
Many of the job placement services are based on income, which should not matter if a
senior is looking to supplement their income.
It is frustrating when looking for information; seniors are deferred to their lead agency,
particularly when the ADRC is contacted
Ensure that unpaid vs. paid caregivers are distinguished in the report
Ensure that exploited seniors are a major focus moving forward
Disseminate information about services and agencies more widely
Regularly list lead agencies in the Beacon (preferably every issue)

Senior Needs Assessment 273
Rotate focus on various organizations and services offered in the Beacon
Collaborate with meal delivery services to distribute information with meals
Survey Feedback
What is most valuable about this workshop?
Knowing that DCOA loves, cares and is concerned about the wellbeing of seniors
Knowing that seniors are being well informed
The Q & A session about presented data
Meeting the needs of seniors
Showing both national and District of Columbia data
Information on the feedback from the focus groups
The information that was provided on all Wards
The overall statistics
It was helpful to find out the needs of seniors, especially those residing in Ward 4
The information provided about the needs of the senior LGBT population
The information provided about caregivers
How would you improve this workshop?
The workshop should have focused on the ward where the presentation is done
Provide handouts for those who cannot see well or want to take information home
Provide email contact to provide further investigation suggestions
Would like to have seen less step by step explanation of data and more explanation of overall
findings
The presentation should have been longer.
More people should have been encouraged to attend the presentations
Would have like to see more ward specific information
Senior Needs Assessment 274
Present agenda with the ability to take notes
Hard copies of the presentation should have been provided
I would like to see more provider input
Bring own audio equipment
What is least valuable about this workshop?
The location was a challenge for some people to attend
Too much information was provided at one time
The information did not explain how my life may be affected