the distribution of water ice in the interior of … distribution of water ice in the interior of...
TRANSCRIPT

Icarus 190 (2007) 284–294www.elsevier.com/locate/icarus
The distribution of water ice in the interior of Comet Tempel 1
Jessica M. Sunshine a,∗, Olivier Groussin b, Peter H. Schultz c, Michael F. A’Hearn a,Lori M. Feaga a, Tony L. Farnham a, Kenneth P. Klaasen d
a Department of Astronomy, University of Maryland, Computer and Space Sciences Building, College Park, MD 20742, USAb Laboratoire d’Astrophysique de Marseille, Observatoire Astronomique de Marseille-Provence, Traverse du Siphon – Les 3 Lucs,
BP8-13376 Marseille Cedex 12, Francec Department of Geological Sciences, Brown University, Box 1846, Providence, RI 02912, USA
d Jet Propulsion Laboratory, 4800 Oak Grove Drive, Pasadena, CA 91109, USA
Received 18 February 2007; revised 23 April 2007
Available online 5 May 2007
Abstract
The Deep Impact flyby spacecraft includes a 1.05 to 4.8 µm infrared (IR) spectrometer. Although ice was not observed on the surface in theimpact region, strong absorptions near 3 µm due to water ice are detected in IR measurements of the ejecta from the impact event. Absorptionsfrom water ice occur throughout the IR dataset beginning three seconds after impact through the end of observations, ∼45 min after impact.Spatially and temporally resolved IR spectra of the ejecta are analyzed in conjunction with laboratory impact experiments. The results imply aninternal stratigraphy for Tempel 1 consisting of devolatilized materials transitioning to unaltered components at a depth of approximately onemeter. At greater depths, which are thermally isolated from the surface, water ice is present. Up to depths of 10 to 20 m, the maximum depthsexcavated by the impact, these pristine materials consist of very fine grained (∼1 ± 1 µm) water ice particles, which are free from refractoryimpurities.© 2007 Elsevier Inc. All rights reserved.
Keywords: Comet Tempel-1; Comets, composition; Interiors; Spectroscopy; Infrared observations
1. Introduction
On July 4th, 2005 the Deep Impact (DI) mission successfullyexecuted a planned impact into Comet 9P/Tempel 1 (A’Hearnet al., 2005). Two multi-spectral imagers and a near-infrared(IR) spectrometer observed the event from the flyby spacecraft(Hampton et al., 2005; Klaasen et al., 2005). The IR spec-trometer was specifically designed to capture the signatures ofpre-impact volatiles on the surface and in the ambient coma,as well as in the post-impact material ejected from the inte-rior (Sunshine et al., 2005). The spectral range (1.05 to 4.8 µm)and resolution (R = 200–800) allow for the detection of keyvolatiles both as gaseous emissions and as ice absorptions atspatial resolutions never observed before. The IR spectral data
* Corresponding author. Fax: +1 301 405 3538.E-mail address: [email protected] (J.M. Sunshine).
0019-1035/$ – see front matter © 2007 Elsevier Inc. All rights reserved.doi:10.1016/j.icarus.2007.04.024
collected prior to the impact have been used to create the firstmaps of asymmetries in CO2 and H2O emissions in the innercoma (Feaga et al., 2007), the first resolved temperature mapof a cometary nucleus (Groussin et al., 2007), and the first de-tection and mapping of water ice on the surface of a comet(Sunshine et al., 2006a).
The distribution of water ice on the surface of Tempel 1 ob-served by DI is restricted to three discrete and relatively smallareas, none of which were near the location of the impact.Sunshine et al. (2006a) note that the amount of surface waterice is insufficient to support the ambient outgassing observedfor Tempel 1, and call for sub-surface (but presumably near sur-face) sources of water. This result is consistent with the derivedsurface temperatures, which were much higher than the subli-mation point for water ice and the low thermal inertia, whichimplies a shallow thermal penetration depth (Groussin et al.,2007). Taken together, these observations of the pre-impact sur-face strongly indicate that the water ice necessary to support the

Water ice in the Deep Impact ejecta 285
observed ambient outgassing of Tempel 1 must have shallow,sub-surface, sources.
The DI impact experiment was conceived as a method for ex-posing the interior of the comet to a depth of tens of meters byrecreating a natural phenomenon observed on surfaces through-out the Solar System, whereby ejecta deposits from impactsserve as probes of interior compositions. One of the key goalsof the DI impact experiment was to determine the depth of sub-surface volatiles at the impact site. The actual DI experimentresulted in an oblique impact that hit the surface ∼20◦–35◦from the horizontal with a mass of 364 kg and a velocity of10.3 km s−1 (A’Hearn et al., 2005). The obliquity of the impactsignificantly alters the distribution of ejecta when compared tothe symmetry of a vertical impact. In particular, the low an-gle of impact leads to observable differences in the downrangeand uprange components over time, which can be used to inferstratigraphy (Schultz et al., 2007a).
The vantage point of the DI flyby provided an unparalleledspatial and temporal resolution of the impact. In particular,the various components of ejecta that originated from differentdepths in the comet were observed to separate during the craterformation process. Preliminary results from the IR spectrome-ter on the vapor phases of the ejecta are presented by A’Hearnet al. (2005). Here we report on the detection of water ice in theejecta, describe the spatial and temporal distribution of waterice in various ejecta components, and discuss how these obser-vations can be used to investigate the interior stratigraphy ofTempel 1. Preliminary results of this work were presented bySunshine et al. (2006b).
2. Background
2.1. Laboratory impact experiments
The extensive body of scientific studies on impact cra-tering, including both theoretical and computational work(e.g., Melosh, 1989; Pierazzo and Melosh, 2000; O’Keefeand Ahrens, 1994; O’Keefe et al., 2001) and experiments(Gault and Wedekind, 1978; Schultz, 1996; Sugita et al., 1998;Anderson et al., 2004) is vital for interpretation of the DI data(e.g., Schultz et al., 2007a; Ernst and Schultz, 2007; Melosh,2006; Richardson and Melosh, 2007; Holsapple and Housen,2007). Of particular note are the laboratory experiments thatwere carried out at the NASA Ames Vertical Gun specificallyto support the DI mission both prior to (Schultz et al., 2005)and after (Ernst and Schultz, 2007; Schultz et al., 2007a) theencounter. Such impact experiments take place at hyperveloci-ties (∼6 km s−1) and although they are smaller in scale and takeplace in the Earth’s gravity, they have been shown to accuratelyrepresent (with limitations) planetary-size impact phenomenaand processes (Gault et al., 1968; Gault and Wedekind, 1978;Schultz and Anderson, 1996).
As described in Schultz et al. (2007a), a major benefit oflaboratory impact experiments is that they allow for variationsin impact conditions including impact angle, impactor and tar-get material properties (e.g., particle size, porosity, volatility,and layering in the target). More specifically, experiments with
oblique (30◦) impacts into layered targets of various materialproperties currently provide a qualitative, and ultimately willlead to a quantitative, basis of comparison to the DI event. Ofparticular use is that these laboratory experiments include crit-ical information on the sources (depth of origin and materialproperties) and evolution of various ejecta components in anoblique impact.
Schultz et al. (2007a) provide a detailed description ofoblique (30◦) impacts into various layered targets and theirimplications for interpreting the DI event. Various ejecta com-ponents (uprange vs downrange) are described as a function oftime, material properties, and viewing angle from the DI flybyspacecraft. Most of the DI observations from visible imageryare consistent with laboratory oblique impact experiments intoa highly porous (perlite) layered target. In this work, we exam-ine the additional constraints provided by DI observations ofwater ice in IR spectral data and interpret their significance inlight of knowledge gained from the impact experiments.
2.2. Spectral data
As described in detail by Klaasen et al. (2007), the IR dataare calibrated using the DI science data pipeline. Data arefirst decompressed and corrected for non-linearities. A tem-perature dependent dark subtraction is then carried out be-fore conversion to radiance (absolute flux). These calibrateddata are publicly available via NASA’s Planetary Data System(http://pds.jpl.nasa.gov/). The DI IR spectrometer is a doubleprism system with a two dimensional HgCdTe focal plane arrayconsisting of 1024 columns to capture light from 1.05 to 4.8 µmand 512 rows spread spatially across the slit (see Hampton etal., 2005). The IR spectrometer is part of the High Resolu-tion Instrument (HRI), which includes a multispectral visibleimager that shares a 30 cm aperture, 10.5-m-focal-length tele-scope. The IR spectrometer has a spatial resolution of 10 µradand a field of view of 0.15◦. The IR spatial resolution is a factorof 5 times less than that of the HRI visible imager and as such,the IR data are minimally affected by the HRI telescope focusproblem (A’Hearn et al., 2005).
The IR spectrometer is operated in four different sciencemodes (Hampton et al., 2005). It was nominally designed tooperate with 2-by-2 binning in both the spatial and spectraldimensions in the binned full frame mode (512 × 256) usinginterleaved reading. Unbinned full frame data are also acquired(1024×512). In addition, the IR focal plane array can be read inbinned sub-frame modes, capturing the central half (512×128)or quarter (512×64) rows, allowing for faster integration times.The HRI instrument has no scan mirrors, and as such the spec-trometer can be targeted in one of two ways. IR spectra can becollected with the slit in a fixed position. Alternatively, the ro-tation of the spacecraft can be used to scan the slit at constantrate. Data from these scans can be used to produce three di-mensional image cubes containing two spatial and one spectraldimension. These image cubes provide spectra at every spatialpoint and images of the observed region at each wavelengthfrom 1.05 to 4.8 µm.
286 J.M. Sunshine et al. / Icarus 190 (2007) 284–294
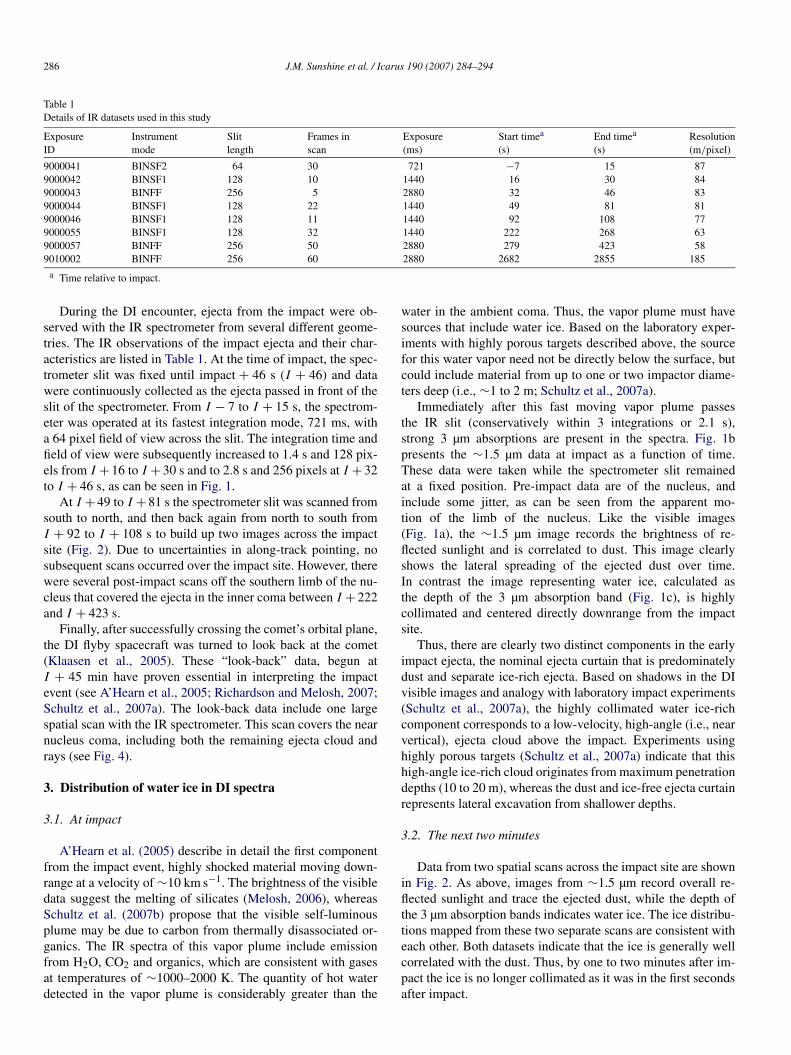
Table 1Details of IR datasets used in this study
ExposureID
Instrumentmode
Slitlength
Frames inscan
Exposure(ms)
Start timea
(s)End timea
(s)Resolution(m/pixel)
9000041 BINSF2 64 30 721 −7 15 879000042 BINSF1 128 10 1440 16 30 849000043 BINFF 256 5 2880 32 46 839000044 BINSF1 128 22 1440 49 81 819000046 BINSF1 128 11 1440 92 108 779000055 BINSF1 128 32 1440 222 268 639000057 BINFF 256 50 2880 279 423 589010002 BINFF 256 60 2880 2682 2855 185
a Time relative to impact.
During the DI encounter, ejecta from the impact were ob-served with the IR spectrometer from several different geome-tries. The IR observations of the impact ejecta and their char-acteristics are listed in Table 1. At the time of impact, the spec-trometer slit was fixed until impact + 46 s (I + 46) and datawere continuously collected as the ejecta passed in front of theslit of the spectrometer. From I − 7 to I + 15 s, the spectrom-eter was operated at its fastest integration mode, 721 ms, witha 64 pixel field of view across the slit. The integration time andfield of view were subsequently increased to 1.4 s and 128 pix-els from I + 16 to I + 30 s and to 2.8 s and 256 pixels at I + 32to I + 46 s, as can be seen in Fig. 1.
At I + 49 to I + 81 s the spectrometer slit was scanned fromsouth to north, and then back again from north to south fromI + 92 to I + 108 s to build up two images across the impactsite (Fig. 2). Due to uncertainties in along-track pointing, nosubsequent scans occurred over the impact site. However, therewere several post-impact scans off the southern limb of the nu-cleus that covered the ejecta in the inner coma between I + 222and I + 423 s.
Finally, after successfully crossing the comet’s orbital plane,the DI flyby spacecraft was turned to look back at the comet(Klaasen et al., 2005). These “look-back” data, begun atI + 45 min have proven essential in interpreting the impactevent (see A’Hearn et al., 2005; Richardson and Melosh, 2007;Schultz et al., 2007a). The look-back data include one largespatial scan with the IR spectrometer. This scan covers the nearnucleus coma, including both the remaining ejecta cloud andrays (see Fig. 4).
3. Distribution of water ice in DI spectra
3.1. At impact
A’Hearn et al. (2005) describe in detail the first componentfrom the impact event, highly shocked material moving down-range at a velocity of ∼10 km s−1. The brightness of the visibledata suggest the melting of silicates (Melosh, 2006), whereasSchultz et al. (2007b) propose that the visible self-luminousplume may be due to carbon from thermally disassociated or-ganics. The IR spectra of this vapor plume include emissionfrom H2O, CO2 and organics, which are consistent with gasesat temperatures of ∼1000–2000 K. The quantity of hot waterdetected in the vapor plume is considerably greater than the
water in the ambient coma. Thus, the vapor plume must havesources that include water ice. Based on the laboratory exper-iments with highly porous targets described above, the sourcefor this water vapor need not be directly below the surface, butcould include material from up to one or two impactor diame-ters deep (i.e., ∼1 to 2 m; Schultz et al., 2007a).
Immediately after this fast moving vapor plume passesthe IR slit (conservatively within 3 integrations or 2.1 s),strong 3 µm absorptions are present in the spectra. Fig. 1bpresents the ∼1.5 µm data at impact as a function of time.These data were taken while the spectrometer slit remainedat a fixed position. Pre-impact data are of the nucleus, andinclude some jitter, as can be seen from the apparent mo-tion of the limb of the nucleus. Like the visible images(Fig. 1a), the ∼1.5 µm image records the brightness of re-flected sunlight and is correlated to dust. This image clearlyshows the lateral spreading of the ejected dust over time.In contrast the image representing water ice, calculated asthe depth of the 3 µm absorption band (Fig. 1c), is highlycollimated and centered directly downrange from the impactsite.
Thus, there are clearly two distinct components in the earlyimpact ejecta, the nominal ejecta curtain that is predominatelydust and separate ice-rich ejecta. Based on shadows in the DIvisible images and analogy with laboratory impact experiments(Schultz et al., 2007a), the highly collimated water ice-richcomponent corresponds to a low-velocity, high-angle (i.e., nearvertical), ejecta cloud above the impact. Experiments usinghighly porous targets (Schultz et al., 2007a) indicate that thishigh-angle ice-rich cloud originates from maximum penetrationdepths (10 to 20 m), whereas the dust and ice-free ejecta curtainrepresents lateral excavation from shallower depths.
3.2. The next two minutes
Data from two spatial scans across the impact site are shownin Fig. 2. As above, images from ∼1.5 µm record overall re-flected sunlight and trace the ejected dust, while the depth ofthe 3 µm absorption bands indicates water ice. The ice distribu-tions mapped from these two separate scans are consistent witheach other. Both datasets indicate that the ice is generally wellcorrelated with the dust. Thus, by one to two minutes after im-pact the ice is no longer collimated as it was in the first secondsafter impact.

Water ice in the Deep Impact ejecta 287
Fig. 1. The Deep Impact IR spectrometer at the time of impact. (a) Visible image of the impact from the High Resolution Imager showing the approximate locationand extent of the IR slit (dashed line) with respect to the impact site (circle). From 7 s before impact (I − 7) to 46 s after the event (I + 46), the IR slit remainedat a fixed position. (b) Reflected light data at ∼1.5 µm including the pre-impact nucleus and the impact ejecta. Prior to impact the limb of the nucleus appears tomove due to spacecraft jitter. (c) The corresponding map of the relative depth of the 3 µm water ice absorption. Water ice abundance is displayed linearly with thestrongest absorptions (ice-rich) shown in white. Note that the water ice is highly collimated and centered directly downrange from the impact site, while the dustexpands laterally.
Careful examination of the data (Fig. 3), however, revealsthat water ice is absent in the uprange rays (see arrows), yetelsewhere is clearly mixed with the dust. In laboratory exper-iments with similar conditions to DI, the uprange rays are ob-served to have a very shallow depth of origin, on the order ofthe size of the impactor, ∼1 m (Schultz et al., 2007a). We cantherefore infer from the absence of water ice in the uprange raysthat at the impact site the first meter below the surface of Tem-pel 1 is devoid of water ice.
3.3. Look-back data
The final IR scan of Tempel 1 is shown in Fig. 4. These look-back data were collected 45 min after impact. As with previousdata, the brightness at ∼1.5 µm shows the ejected dust, whilethe 3 µm band depth image reveals the distribution of waterice. Two components are observed in the dust, a residual ejectacloud and bright rays. In contrast, the 3 µm absorption banddepth image indicates that only the ejecta cloud near the nucleus

288 J.M. Sunshine et al. / Icarus 190 (2007) 284–294
Fig. 2. Two IR spatial scans over the impact site from I + 49 to I + 81 s (a, b) and from I + 92 to I + 108 s (c, d) revealing water ice in the ejecta. As in Fig. 1,displayed for each scan is (a, c) a reflected light image ∼1.5 µm (gray scale) and (b, d) a map of the relative depth of the 3 µm water ice absorption (blue to white).The scans are very consistent with each other. Unlike prior IR data (Fig. 1), these scans show a generally high correlation between dust and ice-rich components ofthe ejecta.
contains water ice. This ejecta cloud represents very low-speed,high-angle ejecta that originates from the greatest penetrationdepths of the DI impactor (Schultz et al., 2005, 2007a). Thus,water ice is present in the interior of Tempel 1 at least to themaximum depth ejected by the impact, ∼10 to 20 m.
The mere presence of water ice nearly an hour after im-pact is a critical constraint on its physical properties. Manyresearchers have examined the sublimation rates of water ice asa function of particle size and purity, with pure water ice hav-ing a minimum in sublimation rate at ∼10–20 µm size particles(Patashnick and Rupprecht, 1975; Hanner, 1981; Mukai, 1986;Lichtenegger and Komle, 1991). However, the presence of evenminute amounts of impurities in the ice increases the absorp-tivity (and thus the temperature) and significantly decreases thelifetime of particles (Patashnick and Rupprecht, 1975). Life-times on the order of hours, as observed in these look-backdata, require either sub-micron pure water ice grains or dirtywater ice grains >700 µm (Mukai, 1986). As discussed below,detailed spectral modeling can be used to distinguish betweenthese two scenarios.
4. Inferred source regions for water ice in Tempel 1
Although not observed in the ambient coma or on the pre-impact nuclear surface, water ice is detected in the ejecta fromthe DI impact experiment. Strong water ice absorptions at 3 µmare observed with the IR spectrometer within 3 s of the im-pact (after the passage of the shocked vapor plume) and re-main throughout the DI flyby observations, ∼45 min afterimpact. The presence of a strong 3 µm absorption band inthe DI IR spectra is consistent with the change in slope de-tected in broad-band IR photometric observations of the im-pact event with ground-based telescopes (Schulz et al., 2006;Knight et al., 2007). Furthermore, the spectra confirm that the
change in slope is in fact due to water ice in the impact ejecta,as postulated by these researchers.
The spatial resolution and temporal coverage from the DIflyby allow for the comparison of the distribution of ice anddust ejecta over time. Analogs from laboratory impact exper-iments provide constraints on the depth of origin of variousejecta components. During the first tens of seconds after im-pact, the water ice component is highly collimated, in contrastto the laterally spreading dust. Thus, the early high-angle plumein the DI ejecta, with sources deep in the interior (Schultz etal., 2007a), includes water ice. In the subsequent two minutes,water ice occurs in the downrange ejecta, but is absent inthe uprange rays. From this distribution, we infer that waterice is depleted in the uppermost layer (∼1 m), but present inlower layers. This stratigraphy coupled with the high poros-ity inferred from numerous other observations of the impactevent (A’Hearn et al., 2005; Richardson and Melosh, 2007;Schultz et al., 2007a) should produce water in the vapor plume,as is observed. Finally, the detection of water ice in low-speed,high-angle ejecta visible near the nucleus during look-back ar-gues for the presence of water ice in the deepest ejecta originat-ing from tens of meters into the comet’s interior.
Water ice is therefore present throughout the interior 10 to20 m of Tempel 1, with the noted exception of the uppermoststrata. This is consistent with the low thermal inertia derivedby Groussin et al. (2007), which implies that solar radiationpenetrates only to a shallow depth within the interior of Tem-pel 1. More quantitative comparisons are possible by calculat-ing the characteristic length of a solar heat wave (the depthat which the amplitude of the heat wave decreases by a fac-tor e = ∼2.718), which is defined as ξ = √
kP/πρC, whereP is rotation or orbital period, k the heat conductivity, ρ thedensity, and C the specific heat capacity. With I = √
kρC andassuming typical values for each parameter: ρ = 400 kg m−3
(Richardson and Melosh, 2006), C = 1000 J kg−1 K−1, and

Water ice in the Deep Impact ejecta 289
Fig. 3. Enhanced spatial scans over the impact site from I + 94 to I + 81 show an absence of water ice in uprange rays. (a) Uprange rays (arrows) are readilydetectable in visible HRI image. IR scans acquired contemporaneously, show similar features in reflected light at ∼1.5 µm in both (b) the image and in (c) enhanced,color contoured data. In contrast, the uprange rays are absent from the water ice both in (d) the 3 µm band depth image and (e) the enhanced, color contoured version.As discussed in the text, these uprange rays have a depth of origin of approximately one projectile diameter (Schultz et al., 2007a), indicating a devolatilized layerat ∼1 m within the interior of Tempel 1.
I = 50 W K−1 m2 s1/2 (Groussin et al., 2007), we derive ξ =∼0.03 m for a rotation period of 40.8 h and ξ = ∼0.9 m foran orbital period of 5.5 years. These values correspond to aheat wave velocity or thermal lag <0.1 mm h−1. Thus, evenin polar regions that receive sunlight over extended periods, toa first order thermal processing on Tempel 1 can only occurwithin the first few meters of the surface, while deeper layersare thermally isolated from the surface. This result is generallyconsistent with the absence of water ice in the upper ∼1 m in-ferred from the IR spectra of the DI ejecta. These observationalresults constrain the various physical and numerical models thathave been developed for cometary interiors (e.g., Prialnik et al.,2004). Conservatively, analyses of the IR data of the DI ejectaare only consistent with models that call for devolatilization incomets to depths of <10 m.
5. Modeling water ice spectra
In addition to the spatial and temporal distributions of wa-ter ice and their implications for the interior composition ofTempel 1, IR spectra from the DI flyby can also be used toconstrain the particle size of the ice. Water ice spectra arehighly dependent on particle size. In large particles, absorp-tions at 1.5 and 2.0 µm dominate, whereas the 3.0 µm absorp-tion is strongest in smaller particles. As in the study of ice onthe surface on Tempel 1 (Sunshine et al., 2006a), the relativestrength of near infrared water ice absorptions can thereforebe used to determine the size of ice particles in the ejecta.Ice-rich IR spectra of the ejecta are examined in detail through-out the DI observations. The DI observations are comparedto spectra of 296 K water ice calculated with radiative trans-

290 J.M. Sunshine et al. / Icarus 190 (2007) 284–294
Fig. 4. Water ice during look-back observations 45 min after impact. (a) The box outlines the approximate location of the IR scan. As with previous datasets, theIR scan acquired during look-back provides data on the distribution of (b) dust (image from ∼1.5 µm) and (c) water ice (3 µm band depth). Comparison of thetwo reveal that water is absent from the distal rays (arrows) and concentrated in the near-nucleus ejecta cloud of slow moving materials, which based on laboratoryexperiments (Schultz et al., 2007a) originate from depths of tens of meters.
fer theory (Hapke, 1993) using optical constants from Warren(1984).
To support detailed spectral modeling, the IR data were indi-vidually calibrated to determine both the proper dark level andto correct for a relatively small amount of scattered light. Thisscattered light is the result of the anti-saturation filter cover-ing the central portion of the slit, which was designed to allowobservations over the warm nucleus (Hampton et al., 2005).After calibration, a mean spectrum was calculated using 5–6 pixels with the strongest 3 µm absorptions in each dataset.
As shown in Fig. 5, each IR spectrum is then fit with a re-flected solar continuum and a thermal continuum. Subtractingthe thermal component and dividing by the solar continuumthen yields a reflectance spectrum. However, it is difficult touniquely constrain the thermal continuum in these complexIR spectra, which include overlapping combinations of bothabsorption and emission features. Nonetheless since the con-tinuum is a smooth function, uncertainties in removal of thethermal component will affect the absolute depth, but not theshape of the 3 µm absorption feature. In this study, the amount

Water ice in the Deep Impact ejecta 291
Fig. 5. Example fit of a Deep Impact IR spectrum to a model of solar flux (shortdashed line) and a thermal continuum (long dashed line). When compared tothe modeled continuum (solar + thermal; gray), the data clearly include an en-hanced absorption at 3 µm due to water ice.
of water ice is therefore not quantified. Instead, the shape andrelative depth of the 2 and 3 µm absorptions are used to con-strain particle size of water ice.
After continuum removal, each reflectance spectrum is mod-eled as a combination of dark refractory materials and theoret-ical spectra of various particle sizes of water ice. Two modesof mixing are possible. If the ice is free from impurities andphysically separated from any darker refractory components,then measurements from the IR spectrometer are simple linearcombinations of the components. However, if the darker refrac-tory components are intimately mixed with the water ice, thena non-linear radiative transfer model is required (e.g., Hapke,1993). A simple red-sloped spectrum represents refractory ma-terials for linear mixing models, while various surrogates forwhich optical constants are available (e.g., amorphous carbon,astronomical silicates, kerogen, tholin, organics) are used fornon-linear modeling.
Results for the water ice detected within seconds of impactare shown in Fig. 6. Using a linear mixing model, the DI dataare most consistent with 0.5 µm diameter water ice particles.The resulting model, shown in Fig. 6a, matches the ice ab-sorptions present in the data at both 2 and 3 µm. However asshown in Fig. 6b, under non-linear mixing no particle size ofwater ice is found that is consistent with the observations. Us-ing large particle sizes it is possible to match the ice absorptionnear 2 µm, but these models produce very poor matches in the3 µm region. Smaller particles sizes have weak or absent 2 µmbands and 3 µm absorptions that are narrower than the data.Strictly speaking particle sizes that are smaller than the wave-length of light (i.e., <2–3 µm) should not be modeled by Hapketheory (Hapke, 1993). However, the principle effect in smallerparticles is to the increase the Rayleigh scattering, which is un-
Fig. 6. Models of the continuum-removed IR spectrum of the impact ejecta 7 safter impact. (a) The shape of the major water absorptions near 2 and 3 µm arewell matched with a linear mixing model using a spectrum of 0.5 µm diameterwater ice particles. (b) In contrast, all sizes of water ice lead to poor solutionswhen intimately mixed with dark refractory materials using non-linear models(see text for more details). These results indicate that the water ice ejected fromthe interior of Tempel 1 is free of impurities. When compared to the linearmixing model fit (a), the Deep Impact data also show evidence of emissionsdue to organics in the 3.3–3.5 µm range. More detailed characterizations of therefractory components in the ejecta are the subject of on-going efforts.
likely to affect the shape of absorptions. The results displayed inFig. 6b are from models of water ice and amorphous carbon us-ing optical constants from Edoh (1983). Non-linear mixing withother refractory materials, which have spectra that include ad-ditional distinct absorptions (e.g., absorptions in the 3.3–3.5 µmregion in organic compounds), generated similarly poor results.

292 J.M. Sunshine et al. / Icarus 190 (2007) 284–294
Fig. 7. Models of IR spectra of the impact ejecta throughout the Deep Impact flyby observations, as in Fig. 6. In all cases, the data are best fit with linear mixingmodels using spectra of 0.5 µm diameter water ice particles. Note the look-back data at impact + 45 min includes relatively strong water vapor emission at 2.7 µmin addition to the water ice absorption at 3 µm.
Three other ice-rich spectra from various observations of theDI ejecta were also modeled as shown in Fig. 7. In all cases, thedata were also most consistent with linear mixing of ∼0.5 µmdiameter water ice particles. In addition to the modeled waterice absorptions, several reproducible emission features can beseen in the IR spectra of the ejecta shown in Fig. 7. These in-clude emissions due to H2O vapor at 2.7 µm and features inthe 3.3–3.5 µm region due to organics. More detailed analysesof the non-ice components in the ejecta require different con-tinuum modeling processes, examination of the full wavelengthcoverage of the IR spectrometer, and are the subject of on-goingefforts and future papers.
6. Implications of the physical structure of the ejectedwater ice
The spectral modeling above reveals that the water ice inthe ejecta from Tempel 1 is dominated by 1 ± 1 µm diame-ter, pure particles. The combination of small particles and lackof impurities within the ice is consistent with the preservationof water ice grains on the order of an hour after ejection. Thedominance of pure, sub-micron particle sizes remains through-out our observations, from 3 s to 45 min after impact. Over thistime period, the water ice originates from various depths and isejected at a range of velocities.

Water ice in the Deep Impact ejecta 293
This uniformity in purity and particle size throughout the in-terior stratigraphy of Tempel 1 exposed by the DI experimentstrongly suggests that these properties are inherent to the waterice. Either the water ice is composed of sub-micron grains orit is made of weak grains that are broken up into sub-microngrains by the ejection process. A similar argument has beenmade for the dust ejecta (A’Hearn et al., 2005), which are no-tably larger (2–10 µm) than the water ice. Whether weak ag-gregates or fundamentally sub-micron particles, these resultsclearly indicate that the interior of Tempel 1 up to depths oftens of meters is not dominated by strongly bonded aggregatesthat might have resulted from melting, sublimation, and con-densation. As with the Wild 2 samples, it is particularly difficultto rectify our observations of ice purity with specifics of theGreenberg model of “silicates core–organics refractory mantle”cometary particles (Greenberg and Li, 1999). This model callsfor the outer layers of pre-cometary grains to be comprised ofices imbedded with “thousands of <0.01 µm particles of largeorganic molecules” overlying silicate cores. It is unlikely thatsuch superfine particles embedded in an ice mantle would com-pletely segregate as a result of an impact. In addition, the smallparticle size observed in the interior of Tempel 1 also suggeststhat the size distribution of ice in comae is primary in origin,rather than a net result of the sublimation history of ice grainsin the coma (e.g., Patashnick and Rupprecht, 1975).
The detection of water ice though most of the IR observa-tions of the impact ejecta indicates that very little of the interiorof comets, only ∼1 m, is thermally altered. This finding is con-sistent with the results from the samples returned from Wild 2(Brownlee et al., 2006; Zolensky et al., 2006), yet seeminglyat odds with the identification of aqueously altered materialsin ∼20% of the DI ejecta as inferred from Spitzer Space Tele-scope (SST) observations (Lisse et al., 2006). As suggested bythe Wild 2 team, this discrepancy may be a result of interpreta-tions based on unconstrained modeling of the complicated SSTmid-IR spectra or to fundamental differences in the two comets(Brownlee et al., 2006). However, it is also important to notethat the DI flyby and SST spectrometers differ substantially inspatial and temporal scales, viewing geometries, and spectralranges (near-IR vs mid-IR), which have varying sensitivities todifferent materials. In particular, the bulk ejecta measured onthe order of hours after impact by SST is dominated by materi-als that originate at depths of 1 to 2 impactor diameters (Schultzet al., 2007b). The ejecta seen with SST therefore differs signif-icantly from the separate ejecta components observed by the DIflyby at tens and hundred of seconds after impact, and from thelook-back geometry. Our analysis of the DI IR data indicatesthat if hydrated materials were indeed detected by SST, theymust come from the uppermost ∼1 m of the impact site, the re-gion where we conclude water has sublimed or melted. Muchof the ejecta seen by DI originates at greater depths, which arepristine and contain pure water ice that is physically separatedfrom other materials rendering the remaining components an-hydrous. Similarly, if Wild 2 and Tempel 1 have a generallycomparable bulk composition and stratigraphy, then the domi-nance of anhydrous minerals in the Wild 2 samples, which werepresumably carried from the comet by jet activity, argues that
the jets must have a depth of origin below the upper ∼1 m ofaltered substrate.
Our analysis of ejecta from spatially and temporally resolvedIR spectra of the DI impact ejecta reveal an internal stratigraphyat the impact site of evolved materials transitioning to unal-tered components at a depth of ∼1 m. This depth is consistentwith the seasonal solar radiation gradient inferred from mea-surements of the surface temperature of Tempel 1. At greaterdepths, which are thermally isolated from the surface, we findwater ice well separated from refractory materials. Furthermoredown to 10 to 20 m, these pristine materials consist of very fine-grained ice particles that are free of any impurities. Our resultson the internal composition and structure represent only onesite on a single comet, yet they serve as our only observationalconstraints on the internal stratigraphy of comets, the forma-tional structure of volatiles, and models thereof. Generalizationof these results remains the task of future exploration.
Acknowledgments
This work was supported by NASA through contract NASW-00004 from the Discovery Program to the University of Mary-land and through task order NMO710389 from the DiscoveryProgram to the Jet Propulsion Laboratory. The authors aregrateful to the numerous engineers, managers, and scientistswho contributed to the success of the Deep Impact mission andto Dale Cruickshank and an anonymous reviewer for their ef-forts in improving this manuscript.
References
A’Hearn, M.F., and 32 colleagues, 2005. Deep Impact: Excavating Comet Tem-pel 1. Science 310, 258–264.
Anderson, J.L.B., Schultz, P.H., Heineck, J.T., 2004. Experimental ejection an-gles for oblique impacts: Implications for the subsurface flow-field meltproduction in oblique impacts. Meteorit. Planet. Sci. 39, 303–320.
Brownlee, D., and 182 colleagues, 2006. Comet 81P/Wild 2 under a micro-scope. Science 314, 1711–1716.
Edoh, O., 1983. Optical properties of carbon from the far infrared to the farultraviolet. Ph.D. thesis, University of Arizona.
Ernst, C.M., Schultz, P.H., 2007. Evolution of the Deep Impact flash: Implica-tions for the nucleus surface based on laboratory experiments. Icarus 190,334–344.
Feaga, L.M., A’Hearn, M.F., Sunshine, J.M., Groussin, O., Farnham, T.L.,2007. Asymmetries in the distribution of H2O and CO2 in the inner comaof Comet 9P/Tempel 1 as observed by Deep Impact. Icarus 190, 345–356.
Gault, D.E., Wedekind, J.A., 1978. Experimental studies of oblique impacts.Proc. Lunar Sci. Conf. IX, 3843–3875.
Gault, D.E., Quaide, W.L., Oberbeck, V.R., 1968. Impact cratering mechanicsand structures. In: French, B.M., Short, N.M. (Eds.), Shock Metamorphismof Natural Materials. Mono Book Corp., Baltimore, pp. 87–99.
Greenberg, J.M., Li, A., 1999. Morphological structure and chemical composi-tion of cometary nuclei and dust. Space Sci. Rev. 90, 149–161.
Groussin, O., A’Hearn, M.F., Li, J.-Y., Thomas, P.C., Sunshine, J.M., Lisse,C.M., Meech, K.J., Farnham, T.L., Feaga, L.M., Delamere, W.A., 2007.Surface temperature of the nucleus of Comet 9P/Tempel 1. Icarus 187, 16–25.
Hampton, D.L., Baer, J.W., Huisjen, M.A., Varner, C.C., Delamere, A., Well-nitz, D.D., A’Hearn, M.F., Klaasen, K.P., 2005. An overview of the instru-ment suite for the Deep Impact mission. Space Sci. Rev. 117, 43–93.
Hanner, M.S., 1981. On the detectability of icy grains in the comae of comets.Icarus 47, 342–350.

294 J.M. Sunshine et al. / Icarus 190 (2007) 284–294
Hapke, B., 1993. Theory of Reflectance and Emittance Spectroscopy. Cam-bridge Univ. Press, New York.
Holsapple, K.A., Housen, K.R., 2007. A crater and its ejecta: An interpretationof Deep Impact. Icarus 187, 345–356.
Klaasen, K.P., Carcich, B., Grayzeck, E.J., McLaughlin, S., 2005. Deep Impact:The anticipated flight data. Space Sci. Rev. 117, 335–372.
Klaasen, P.K., and 15 colleagues, 2007. Deep Impact instrument calibration.Opt. Eng., submitted for publication.
Knight, M.M., Walsh, K.J., A’Hearn, M.F., Swaters, R.A., Zauderer, R.A.,Samarasinha, N.H., Vázquez, R., Reitsema, H., 2007. Ground-based visi-ble and near-IR observations of Comet 9P/Tempel 1 during the Deep Impactencounter. Icarus 187, 199–207.
Lichtenegger, H.I.M., Komle, N.I., 1991. Heating and evaporation of icy parti-cles in the vicinity of comets. Icarus 90, 319–325.
Lisse, C.M., and 16 colleagues, 2006. Spitzer spectral observations of the DeepImpact ejecta. Science 313, 635–640.
Melosh, H.J., 1989. Impact Cratering: A Geologic Process. Oxford Univ. Press,New York.
Melosh, H.J., 2006. Deep Impact: The first second. Lunar Planet. Sci. XXXVII.Abstract #1165.
Mukai, T., 1986. Analysis of a dirty water-ice model for cometary dust. Astron.Astrophys. 164, 397–407.
O’Keefe, J.D., Ahrens, T.J., 1994. Impact-induced melting of planetary sur-faces. Geol. Soc. Am. Special Paper 293, 103–109.
O’Keefe, J.D., Stewart, S.T., Lainhart, M.E., Ahrens, T.J., 2001. Damage androck-volatile mixture effects on impact crater formation. In: HypervelocityImpact, Proceedings of the 2000 Symposium. Int. J. Impact Eng. 26, 543–553.
Patashnick, H., Rupprecht, G., 1975. The size dependence of sublimation ratesfor interplanetary ice particles. Astrophys. J. 197, L79–L82.
Pierazzo, E., Melosh, H.J., 2000. Hydrocode modeling of oblique impacts: Thefate of the projectile understanding oblique impacts from experiments, ob-servations, and modeling. Meteorit. Planet. Sci. 35, 117–130.
Prialnik, D., Benkhoff, J., Podolak, M., 2004. Modeling the structure and ac-tivity of comet nuclei. In: Festou, M.C., Keller, H.U., Weaver, H.A. (Eds.),Comets II. Univ. of Arizona Press, Tucson, pp. 359–387.
Richardson, J.E., Melosh, H.J., 2006. Modeling the ballistic behavior of solidejecta from the Deep Impact cratering event. Proc. Lunar Sci. Conf. 37.Abstract 1836.
Richardson, J.E., Melosh, H.J., 2007. Determining Tempel 1’s gravity, mass,and density via the ballistic behavior of the Deep Impact solid ejecta andplume. Icarus, in press.
Schultz, P.H., 1996. Effect of impact angle on vaporization. J. Geophys.Res. 101, 21117–21136.
Schultz, P.H., Anderson, R.A., 1996. Asymmetry of the Manson impact struc-ture: Evidence for impact angle and direction. In: Koeberl, C., Anderson,R.R. (Eds.), The Manson Impact Structure, Iowa: Anatomy of an ImpactCrater, Geological Society of America Special Paper 302. Geol. Soc. Am.,Boulder, CO, pp. 397–417.
Schultz, P.H., Ernst, C.M., Anderson, J.L.B., 2005. Expectations for cratersize and photometric evolution from the Deep Impact collision. Space Sci.Rev. 117, 207–239.
Schultz, P.H., Eberhardy, C.A., Ernst, C.M., A’Hearn, M.F., Sunshine, J.M.,2007a. The Deep Impact oblique impact cratering experiment. Icarus 190,295–333.
Schultz, P.H., Eberhardy, C.A., Ernst, C.M., 2007b. Initial stages of the DeepImpact collision. Lunar Planet. Sci. XXXVIII. Abstract #1890.
Schulz, R., Owens, A., Rodriguez-Pascual, P.M., Lumb, D., Erd, C., Stüwe,J.A., 2006. Detection of water ice grains after the Deep Impact onto Comet9P/Tempel 1. Astron. Astrophys. 448, L53–L56.
Sugita, S., Schultz, P.H., Adams, M.A., 1998. Spectroscopic measurements ofvapor clouds due to oblique impacts. J. Geophys. Res. 103, 19427–19441.
Sunshine, J.M., A’Hearn, M.F., Groussin, O., McFadden, L.A., Klaasen, K.P.,Schultz, P.H., Lisse, C.M., 2005. Expectations for infrared spectroscopy of9P/Tempel 1 from Deep Impact. Space Sci. Rev. 117, 269–295.
Sunshine, J.M., A’Hearn, M.F., Groussin, O., Feaga, L.M., Li, J.-Y., Schultz,P.H., and the Deep Impact Science Team, 2006a. Exposed water ice depositson the surface of Comet 9P/Tempel 1. Science 311, 1453–1455.
Sunshine, J.M., and 22 colleagues, 2006b. Water ice on Tempel 1: Before, dur-ing, and after the impact event. Lunar Planet. Sci. XXXVII. Abstract #1890.
Warren, S.G., 1984. Optical constants of ice from the ultraviolet to the mi-crowave. Appl. Opt. 23, 1206–1225.
Zolensky, M.E., and 74 colleagues, 2006. Mineralogy and petrology of Comet81P/Wild 2 nucleus samples. Science 314, 1735–1739.