the distribution of two major plant groups revised …
TRANSCRIPT

i
THE DISTRIBUTION OF TWO MAJOR PLANT GROUPS (BRYOPHYTES AND
TRACHEOPHYTES) ALONG AN ALTITUDINAL GRADIENT ON NARO MORU TRACK,
MOUNT KENYA.
BY
WEKESA SARAH NEKESA, B.Ed. (Science) Egerton
A thesis submitted in partial fulfillment of the degree of Master of Science in Plant Taxonomy
and Economic Botany in the School of Biological Sciences
University of Nairobi
2015

ii
DECLARATION
I certify that this thesis is my original work and has not been presented in any other University.
Sign…………………………… …………………………
Sarah Nekesa Wekesa Date
This thesis has been submitted for examination with our approval as University Supervisors:
Sign………………………… Date ……………………
Dr. C.W. Lukhoba
School of Biological Sciences
University of Nairobi.
Sign ………………………… Date……………………
Prof. N. Gichuki
School of Biological Sciences
The University of Nairobi, Kenya

iii
DEDICATION
This work is dedicated to my dear husband George, and children David, Yang, Cissie, and
Gorrel.
And
To the nation and people of Kenya; to whom the Almighty GOD bestowed the responsibility to
conserve its splendor.

iv
ACKNOWLEDGEMENT
I wish to express my deep appreciation and very sincere gratitude to my supervisors Dr.
Catherine W. Lukhoba for encouraging me to study at the department and having introduced me
for the first time to mountain climbing and Prof. Nathan Gichuki for his untiring commitment
and for giving me endless advice all throughout the project duration.
Many thanks go to the University of Nairobi staff and students for their continued support in my
research work. . I am particularly grateful to Dr. S. M. Chuah for showing me how to identify
bryological specimens. The following technical staff from University of Nairobi is particularly
recognized for their assistance in field work and plant identification: Mr. Martin Wafula Kisyelo,
Mr. Herbert Khayo, Mr. Patrick Mutiso, Mr. William Chebii and Mr. Simon Mathenge. I wish
to also thank my husband and friend George, for shouldering the immense expenses of this
project. Last but not least, I cannot forget to remember my David, Yang, Cissie and Gee for their
continued support and perseverance from the beginning to the end of this project.
To all I pray that GOD will mightily once again use you in a special way to help others too.
AND TO MY GOD, I AM REALLY GRATEFUL FOR GIVING ME STRENGTH AND
COURAGE TO ENDURE, THANK YOU LORD, AMEN.

v
ABSTRACT
Tropical mountain forests are known as the cradle of flowering plants and have many archaic angiosperm taxa. However processes of climate change and human activities have resulted in massive degradation and loss of mountain biodiversity. In Mt. Kenya, human activities have caused the shifting of the forest base margin to higher altitudes, increased soil erosion with resultant increase in sedimentation of wetlands, rivers and water storage dams down steam posing serious and economic consequences. The presence of cryptogams are known to contribute to the good health of mountain ecosystems, however their composition, abundance and distribution in the face of the ongoing forest destruction in Mt Kenya is not clear. The aim of this study was therefore, to establish the taxonomic and ecological relationship between one group of cryptogams- the bryophytes and tracheophytes along an altitudinal gradient using Narumoru tract of the western slope of Mt. Kenya. Plants were sampled at an interval of 200m from 2400 to 4800m. The higher plants were sampled along a 50 m transect using 10m by 10 m plots while the bryophytes were sampled using 10 x5cm quadrats of the same plots where higher plants were collected. Fine-scale variations in bryophyte communities were investigated in nine microhabitats including the soil surface, humus layer, decaying lignin, stem trunks, rachises, rocks and water edges. All the specimens collected were identified in the field and later confirmed at the University of Nairobi (NAI) and National Museums of Kenya (EA) herbaria. Data analysis and descriptive and inferential measures of species diversity were done using SPSS computer program. The results showed that bryophytes had the highest diversity (50.6%) followed by angiosperms (47.3%), while gymnosperms had the lowest (1.3%). There was a general decrease in the plant species diversity from 2400m to 4600m asl, the optimum levels being at 2400 and 3000m asl (each containing over 350 species). At least five microhabitats were identified with the most diverse bryophytes being the humicolous and corticolous types (80%) while the least was aquatic (0.001%). It is hoped that data accrued from this study will aid in the conservation of the Mt Kenya mountain flora. The aim of this study was to establish the taxonomic and ecological relationship between bryophytes and tracheophytes along western slope of Mt. Kenya and this has been determined whereby the study revealed that NMT of Mt. Kenya harbors a high diversity of bryophytes and tracheophytes 81 and 83 in percentage it is 50 and 49 respectively. The study has also demonstrated that the diversity and distribution of bryophytes and the tracheophytes is influenced firstly by altitude and secondly by the microhabitats provided by natural features such as bogs, rocks and the tracheophytes themselves. Therefore, the taxonomic information of the less studied and less appreciated groups is essential in laying down the strategies to conserve Mt. Kenya.
Key words: Tracheophytes, Bryophytes, Diversity, Distribution, Microhabitat, Angiosperms, Pteridophytes, Gymnosperms.

vi
TABLE OF CONTENTS
DECLARATION ...................................................................................................................... ii
DEDICATION ........................................................................................................................ iii
ACKNOWLEDGEMENT ...................................................................................................... iv
TABLE OF CONTENTS ........................................................................................................ vi
LIST OF FIGURES ..................................................................................................................x
CHAPTER ONE .......................................................................................................................1
INTRODUCTION .....................................................................................................................1
1.1 Significance of Mountain Ecosystem in Africa ........................................................................... 1
1.2 Mountains as conservation areas for water and soil ................................................................... 4
1.3 Mountain effects on climatic zonation ......................................................................................... 6
1.4 Mountains as recreation areas for urbanized societies ............................................................... 7
1.5 Mountain forests are a wealth of biodiversity ............................................................................. 8
1.6 Environmental problems affecting mountain ecosystems......................................................... 10
1.7 Problem statement ..................................................................................................................... 11
1.8 Research aims and objectives .................................................................................................... 12
1.8.1 General aim ......................................................................................................................... 12
1.8.2 Specific objectives ............................................................................................................... 12
CHAPTER TWO .................................................................................................................... 13
LITERATURE REVIEW ....................................................................................................... 13
2.1 Characteristics of tropical mountains ....................................................................................... 13
2.2 Geological and geographical factors influencing plant distribution ......................................... 14
2.3 Environmental factors influencing plant distribution and diversity ........................................ 15
2.4 General distribution of vegetation on Mount Kenya ................................................................ 16

vii
2.4.1 State of knowledge of bryophytes ........................................................................................... 18
2.4.2 Pteridophytes ....................................................................................................................... 20
2.4.3 Gymnosperms...................................................................................................................... 21
2.4.4 Angiosperms ........................................................................................................................ 21
2.5 Conservation strategy of Mount Kenya .................................................................................... 22
2.6 Social-Economic importance of Mt Kenya ................................................................................ 23
METHODOLOGY .................................................................................................................. 24
Study Area. .............................................................................................................................. 24
Location and structure of Mt Kenya ...................................................................................... 24
3.1.1 Location of study area ......................................................................................................... 26
3.1.2 Climate of Mt. Kenya .......................................................................................................... 27
3.1.3 Land elevation and zonation of the Naro Moru track........................................................ 29
3.2 Study design ............................................................................................................................... 29
3.2.1 Site selection ........................................................................................................................ 30
3.2.2 Vegetation Sampling ........................................................................................................... 32
3.3 Data Analysis ............................................................................................................................. 33
3.3.1 Vegetation data analysis ......................................................................................................... 34
CHAPTER FOUR ................................................................................................................... 36
RESULTS ................................................................................................................................ 36
4.1 Species diversity of all the plants in Naro Moru track.............................................................. 36
4.2 Tracheophyte species richness and distribution ....................................................................... 37
4.2.1 Tracheophyte species richness by altitude .......................................................................... 37
4.2.3 Tracheophyte species distribution ...................................................................................... 38
4.2.4 Tracheophyte density .......................................................................................................... 39
4.3 Diversity of Angiosperm ............................................................................................................ 40

viii
4.4 Pteridophyte species richness, distribution and evenness ......................................................... 43
4.5 Gymnosperm diversity and distribution by altitude ................................................................. 45
4.6 Bryophyte species distribution and richness on NMT, Mt. Kenya ........................................... 45
4.6.1 Bryophyte species distribution ............................................................................................ 45
4.6.2 Bryophyte species richness.................................................................................................. 47
4.6.3 Bryophyte species abundance ............................................................................................. 47
4.6.4 Bryophyte distribution by altitude and microhabitat ........................................................ 48
4.6.5 Diversity of bryophyte species for the nine microhabitats. ................................................ 52
4.6.6 Species assemblage relationship at microhabitats .............................................................. 54
4.6.7 Bryophyte species density and evenness ............................................................................. 56
4.7 Scientific classification and key differentiating characaters of representative members of bryophytes and tracheophytes ........................................................................................................ 58
CHAPTER FIVE..................................................................................................................... 61
DISCUSSION, CONCLUSIONS AND RECOMMENDATIONS ........................................ 61
5.1 Introduction and purpose of the study ...................................................................................... 61
5.2 Distribution of Bryophytes and Tracheophytes along NMT, Mt. Kenya. ................................ 62
5.3 Influence of altitude on diversity and distribution of Bryophytes and Tracheophytes............ 64
5.4 Variation of bryophyte diversity by microhabitat .................................................................... 65
5.5 Vascular Plants .......................................................................................................................... 69
5.6 Conclusion and Recommendations............................................................................................ 69
5.6.1 Conclusion ........................................................................................................................... 69
5.6.2 Recommendations ............................................................................................................... 70
REFFERENCES ..................................................................................................................... 72
APPENDICES ......................................................................................................................... 84
APPENDIX I TRACHEOPHYTE DISTRIBUTION ON NMT, MT. KENYA.................... 84
APPENDIX II .......................................................................................................................... 91

ix
APPENDIX III ........................................................................................................................ 93
APPENDIX IV ........................................................................................................................ 98

x
LIST OF FIGURES
Figure 1.1 Three cloud-covered peaks of Mt Kenya: Lenana, Nelion and Batian .........................6
Figure 2.1 Altitudinal profile of natural vegetation along the Naro Moru Track (Source:
Decurtins, 1992). ....................................................................................................................... 17
Figure 3.1. Map of Mt. Kenya Region showing some of the seven routes into Park, (KWS,
1999) ........................................................................................................................................ 24
Figure3.2 Scattered snows on the peaks of Mount Kenya following Naro Moru route (Muigai
2008) ........................................................................................................................................ 26
Figure 3.2 A sketch map of Naro Moru Track in Mt. Kenya with red boxes showing beginning
and the end points of this study (by Author 2009)...................................................................... 27
Figure.3.3b) Layout of subplots of 2mx2m and 5cmx10cm within 10x10m plots. ..................... 31
Figure.3.3.c) Layout of plots used in sampling tracheophytes and bryophytes ........................... 31
Figure 3.2 (a-c) Sampling of some major plant groups............................................................... 32
Figure 3.3 Curating the specimens (Author) .............................................................................. 33
Figure 4.1 Total frequencies of Tracheophytes by altitude ......................................................... 38
Figure 4.2 Numbers of tracheophytes species per altitudinal level (at ±95% CL). ...................... 39
Figure 4.3 Tracheophyte species density ................................................................................... 40
Figure 4.4 Bryophyte distribution by altitude and microhabitat.................................................. 46
Figure 4.5 Bryophyte species richness at different Altitudes ..................................................... 47
Figure 4.5 (a) and (b) Distribution of Bryophytes on fallen dead decaying (lignilcolous) vascular
Plants ........................................................................................................................................ 52
Figure 4.7 Bryophyte density variations by altitude ................................................................... 57

xi
Figure 10 (a-d) Diversity of plant categories and their classification as observed on Naro Moru
Track, Mt. Kenya. ..................................................................................................................... 58
Figure 4.8 Summary of distribution of Tracheophytes and Bryophytes on NMT, Mt. Kenya. ... 60

xii
LIST OF TABLES
Table 1.1 Historical research in Mount Kenya and their areas of emphasis ..................................4
Table 4.1Taxonomic plant diversity along Naru Moru Tract, Mt. Kenya ................................... 37
Table 4.2 Diversity and species richness of Angiosperm ........................................................... 41
Table 4.3 Percentage Similarity matrix among Angiosperm species assemblages at .................. 42
the thirteen altitude levels .......................................................................................................... 42
Table 4.4 Altitudinal Pteridophyte species diversity .................................................................. 44
Table 4.6 Bryophyte species abundance by Altitude .................................................................. 48
Table 4.8 Total Bryophyte species encountered in each of the nine microhabitats in each altitude
................................................................................................................................................. 53
Table 4.9 Distribution and evenness of Bryophyte species between microhabitats ..................... 54
Table 4.10. Percentage similarity matrix among bryophyte species assemblages at the nine
Microhabitats. ........................................................................................................................... 55
1
CHAPTER ONE
INTRODUCTION
1.1 Significance of Mountain Ecosystem in Africa
Mountains cover 20.4 % of the Earth's land surface and contain 26.5% of the world's forests
(Kapos et al., 2000), and are home to 12% of the global human population. They provide
protection of watersheds and damage to transport infrastructure, are centers of biodiversity
conservation, important sources of timber, fuel wood and places for tourism, recreation and
sacredness. Also many mountains are considered as potential carbon sinks and are vital in
mitigation of climate change (Myers et al., 1988).
Africa has an approximate area of 30.221 million km² which represents 6% of the world’s land
mass with a population of 1.03 billion. Of this population, 2% get their livelihood from the
forests. In Africa, mountains contain 12 % of the world’s forests (Houghton et al., 1993). Almost
all mountain ecosystems on the African continent have significantly been decreasing in their
natural resources, (UNESCO, 1992) because more than 70% of the African workforce is engaged
in deforestation for commercial land use and agriculture (M.A., 1997).
East African mountain ecosystems are spectacular and rise above the snow line in the equatorial
region (Newmark, 2002). They provide habitation to wide range of biodiversity like the giant
apes in Bwindi forest and primates and birds in Kibale National Park in Uganda (Rogers et al.,
1982). Kenya has a total area of 585,644 km² with forests in altitudes varying from sea level to
the forested mountains over 5000m in height. Forests and wildlife are critical natural assets for

2
Kenya. They are also vital as wildlife habitats and water catchment areas (KWS, 1999). Most of
the Kenyan mountains and highland forests stand the risk of degradation because of climate
variability and human activities.
Mt. Kenya region which comprises the National Park and the Forest Reserve is among the 17
world’s biodiversity hotspots (KWS, 1999). Human encroachment through illegal farming
(KWS, 1999), grazing of livestock and logging have reduced its original forest zone from 1600m
to 1800m. The destruction of Mt. Kenya forests is the highest recorded among Kenyan forests
and has contributed upto 25% of the total loss in national forest size. The most targeted species
are; Juniperus procera, Olea africana, Vitex keniensis, Croton macrostachys species and
Newbotonia species which occur mostly on the western slopes (KWS, 2010).
Mt Kenya is reputed for its high biodiversity with the variation in rainfall and altitudinal gradient
being the determining factors. The mountain exhibits four vegetation types which are Firstly, the
montane forest belt which lies between altitudes 1800 to 3000m asl and has precipitation above
1000mm (Decurtins, 1992). In this vegetation zone, are found majority of tree species many of
which are now threatened due to close proximity to the neighboring inhabited region and its
gentle terrain. In fact this region is considered to be people friendly and does not cause any type
of mountain sickness to climbers (KWS, 2012). The next is the Ericaceous woodland, also
referred to as subalpine zone. This zone occurs between altitudes 3000m and 3400m and receives
annual rainfall of 1500mm (Decurtins, 1992). As the altitude increases, the vegetation type also
changes adapting to the changing soils and lower amount of precipitation available in the area,
giving way to third zone- the afro alpine belt at 3450m asl and an annual rainfall of 700mm

3
(Decurtins, 1992). After this, the Afro-Alpine zone in which tree groundsel and the giant lobelia
rise out of a ground vegetation of tussocky grassland and Helichrysum newii ) and the heath zone
Up to the snowline (3500-5195m asl).
According to Kenya Wildlife Service (1999), the total number of indigenous trees that had been
felled from all parts of the mountain slopes by the year 2000 was 14,622. Extensive destruction
of the Mt. Kenya forests cause long term negative impacts leading to destruction of wildlife
habitats, biodiversity and affects flows of river Ewaso Nyiro. Forest destruction impairs water
catchment, reducing water supply downstream and effectively killing the forest sector. The
various vegetation types play a major role on the mountain in hydrological cycles and their
conservation is extremely important. Therefore an understanding of the components of the
different vegetation types through monitoring and research is the only way to effect conservation
measures to ensure that Mt Kenya is saved from total destruction. In addition if Mt. Kenya is
destroyed, the many river tributaries that originate from it and feeding river Tana will dry up
leading to a reduction in power production (river Tana is the home of Kenya’s power producing
stations; Masinga, Kindaruma, Kitaru, Kamburu and Kiambere) (Tourist guide map, 2010).
Mt. Kenya vegetation is rich in biodiversity in terms of ecological systems and plant species
(Beentje, 1994) which has attracted many researchers as demonstrated in table (1.1).

4
Table 1.1 Historical research in Mount Kenya and their areas of emphasis
1.2 Mountains as conservation areas for water and soil
Almost all of the world’s rivers arise in mountains (Bandyopadhyay et al., 1997) and they are
therefore the major sources of freshwater for lowland ecosystems and communities. Worldwide,
Moreau, 1944 All vegetation belts Biodiversity inventory
Fries et al., 1948 All vegetation belts Vegetation classification
Hedberg, 1969 Montane forest Vascular Plants and Musci
Agnew, 1985 Montane zone Population study on two species
Zamierowski, 1975 Montane zone Foliar leaching of tree species
(Nanyuki and Chehe)
Rehder et al., 1981 Alpine Zone Vegetation analysis
Smith et al., 1987 Alpine Zone Population studies of
Lobelia species
Mulkey et al., 1984 Alpine Zone Predation of Senecio
keniodendron by elephants
Blackett, 1994 Montane forest Stocks and volume of 10
common trees
Bussmann, 1994 Montane forest Inventory, Ecology, Threats,
Management
Author Location on Mt. Kenya Area of Emphasis

5
214 river basins are home to 40 per cent of the world's population; the Ganges River arises from
the Himalaya, while rivers Rhine, Rhone and Danube all arise from the Alps providing water to a
population of about 400 million people (Bandyopadhyay et al., 1997).
The peaks of Africa's highest mountains, namely Mt. Kilimanjaro 5,895m, Kenya 5199m, and
the Ruwenzori 5109m range, are snow caped. These three mountains act as crucial all-year
water reservoirs and are sources of water for the regions’ world-famous game parks and also for
the irrigation of millions of hectares downstream (Newmark, 2002).
Mt. Kenya is the most important of Kenya’s five major ‘water towers’ (the others being
Aberdare range, Mau complex, Chereng’ani Hills and Mt. Elgon), and is the main water
catchment for the Ewaso Nyiro ecosystem. It provides more than 40% of the country's water
requirement and for the country's most important hydro-electric power plants such as the Seven
Forks Hydropower plants that produce over 50% of Kenya's total electricity output (UNCED,
1992). The peaks of Mt. Kenya (Figure 1.1) are constantly covered with clouds that fall back as
rain. Ewaso Nyiro River which originates from the mountain is the only river supplying water to
Samburu County, Shaba Buffalo springs national reserves in north eastern region (Bussmann,
1994).

6
Figure 1.1 Three cloud-covered peaks of Mt Kenya: Lenana, Nelion and Batian
(Taken by author, 2008)
1.3 Mountain effects on climatic zonation
Mountains are significant field laboratories for the resolution of many problems associated with
global warming (Kundzewicz & Robson., 2000). Precipitation that forms on the mountains has a
great impact on the distribution of the world’s climatic zones (Kattelmann et al., 1993).
Watanabe et al., (1994) found out that when thin mountain soils are saturated, frozen or replaced
by bare rock, overland flow is enhanced, while Fritts & Rodda (1998) discovered that vegetation
type, area coverage, and canopy density can affect hydrological interactions of a given area.
Groundwater affects surface hydrology according to land gradient, geology, land cover and
rainfall pattern.
Nelion Lenana
Batian

7
1.4 Mountains as recreation areas for urbanized societies
In developed countries, more than half of the population lives in urban areas (Price et al.,
1997). The rapid increase in global urbanization demands for leisure and recreational areas
(Williams et al., 1991) and mountains offer a rich source due to their variety of vast natural
landscapes. If taken into account that tourism employs more than 12 million people and that this
number will increase in the coming decades, it is clear that mountains will take a decisive role in
tourism, the world’s largest industry (Price et al., 1997).
In Africa, land-based tourism is a major economic activity every year generating millions of
dollars in foreign exchange earnings (Emmerton & McCarter 1994). Sites such as the pyramids
of Egypt, the Great Rift Valley of Eastern and Southern Africa as well as Africa’s major
mountains such as the Table Mountain in South Africa, Mt. Kenya in Kenya and Mt. Kilimanjaro
in Tanzania are some of the major tourist attraction features (Emmerton & McCarter 1994). Mt.
Kenya, with its rugged glacier-clad summits, afro-alpine moorlands and diverse montane forests
is one of the most impressive landscapes in Eastern Africa (Emmerton & McCarter 1994),
although it is as yet undeveloped as a recreational and tourist destination attracts both domestic
and international visitors. Between the years 1996 and 1997 there were a total of 14,000 visitors
to Mount Kenya National Park, 30 per cent of who were international tourists (KWS, 1999). The
mountain was declared a World Heritage Site in 1997 and gained international recognition as a
Biosphere Reserve in 1978 under the UNESCO’s Man and Biosphere Programme, (Hemp et al.,
2006).

8
1.5 Mountain forests are a wealth of biodiversity
Mountain forests are a wealth of biodiversity and may be the only areas left at the rate that
forests around the world are being destroyed. Eastern Arc Mountains are among the 17 most
threatened tropical eco-systems because of their biodiversity (Miltermeier et al., 2000) and are
estimated to harbor between5 to 30 million species (Erwin, 1982). The world treeless alpine life
zone alone accounts for 3% of the land surface area and hosts a vast biological richness,
exceeding that of many low elevation biotas (Longmann et al., 1974). The overall global plant
species richness of the alpine life zone alone is estimated to be around 4% of the global number
of higher plant species, (Körner, 2002). Tropical and sub-tropical mountains include major
center of global biodiversity. It is documented that moist tropical forests cover only 7% of the
earth’s surface, yet they contain more than half of the world’s species (Langdale et al., 1964).
Kenyan mountain forests are endowed with a rich array of plant and animal life and some of the
plant species such as Lobelia and Senecio species are endemic to the forest habitats, (Mazingira,
2008). These forests therefore remain refuges for a great wealth of endemic species, specialized
ecosystems and remarkable landscapes (Longmann et al., 1974).
Mt. Kenya, with a wide range in altitude, rainfall amount and eight different natural forest types,
harbors a rich biological biodiversity (Lassau et al., 2005). Large mammals of international
conservation interests in Mt. Kenya forests are; elephants, black rhinos, giant forest hogs, the
bongo and black fronted duiker. Records on plants diversity show there are over 800 plant
species belonging to 479 genera and 146 families that have been identified (Lassau et al., 2005),
excluding the bryophytes. Due to poor identification of the latter group they are inadvertently
left out (Chuah, 2003).

9
Bryophytes are second in diversity after the flowering plants but difficulties in their
identification, and lack of literature from tropical areas are a problem for their inclusion in
biodiversity surveys (Pharo et al., 1997). Bryophytes occupy all types of mountain habitats and
are ideal candidates for altitudinal gradient studies (Andrew et al., 2003). Several descriptive
studies of Bryophytes and their altitudinal zonation have been done in Sierra Nevada de Santa
Marta, Colombia (Van Reenen et al., 1984), Bolivia, Peru, and Columbia (Kessler, 2001), on Mt.
Kinabalu in Malasya (Frahm, 1990), Mt. Kilimanjaro (Pócs, 1994) and La Reunion (Ah-Peng,
2005).
Species diversity and distribution are related to geographical parameters: latitudinal and
altitudinal gradients (Lomolino, 2001), environmental variables (Whittaker et al., 2001) and
microhabitats, (Lassau et al., 2005). Temperate and arboreal forests have been more surveyed
and their biodiversity well documented. However, causes of high biodiversity in tropical areas
remain unclear due to poor or limited research (Bates et al., 2008). With the aim of describing
broad-scale tropical biodiversity patterns, recent studies have been conducted on the effect of
altitude on mammals (McCain, 2010), birds (Kaboli ,2006), Insects (Axmacher et al., 2004), and
Vascular plants (Senbeta et al., 2005).
Mt. Kenya like other tropical mountains of an old volcano flow (Ah-Peng, 2003) provides
excellent natural conditions for studies on effect of gradual change in temperature, rainfall and
vegetation. These climatic elements create distinct vegetation zonation (Hedberg, 1951). This
current study on Mt Kenya therefore aims to provide data on plant diversity and describe the
effect of various factors such as altitude, climate and human activities. The present study,

10
conducted on Mt Kenya’s Naro Moru track (NMT), aims at providing data on the effects of
altitude, climate and human activities on the mountains’s plant diversity and to relate the
association of Bryophytes and Tracheophytes.
1.6 Environmental problems affecting mountain ecosystems
According to Myers (1988), the mountain forests are exposed to many forces of destruction, such
as climate change, pollution, armed conflict, population growth, deforestation and exploitative
agriculture, mining and tourism. These problems confronting the "water towers of the world"
have prompted warnings that there is likelihood of disappearance of the forest’s unique
biodiversity (FAO, 1993). The famous snowcap of Africa's highest peak Kilimanjaro is predicted
to disappear by 2020 (Newmark, 2002). Ruwenzori's glaciers have declined from 2 Km² to less
than 0.96 Km² (May, 1986). Snow on the famous Mt. Kenya peaks is also disappearing and has
shrunk by 90% since the beginning of this century (Newmark, 2002).
Continued recession of the glaciers on the key mountains in Eastern Africa is expected to have a
devastating effect on the unique alpine ecosystems of the mountains (Newmark, 2002), as well as
the river catchment areas they serve. Deforestation is the major threat to water flow. Though
studies indicate that the slopes of Mt. Kilimanjaro are experiencing abnormally high rainfall, it is
poorly distributed and very intense where it occurs. According to (IHDPGEC, 2006) if the
current trend towards a drier and warmer climate on Mount Kilimanjaro and Kenya continues,
lower vegetation zones and savanna species will move upwards in higher altitude zones.
Deforestation on Mt. Kenya leads to decrease or loss of particular forest species like Ocotea

11
usambarensis, Vitex keniensis and Podocarpus species (Gathaara, 2000). People are living and
farming within the reserves, the introduuction of the 'shamba' system of plantation management
in 1993 resulted into opening up areas of forest in higher mountain zones (Gathaara, 2000). This
allows poachers easy access to the altitude forests and to the moorland (WUA, 2006).
Management problems have only intensified since re-designation as a National Reserve
(Gathaara, 2000).
Problem animals, such as elephants (Loxodonta africana), account for the bulk of both crop
damage and human injuries and deaths (EEIU, 2008). The elephants crave for the indigenous
trees such as Cinnamon camphora which they debark, uproot and chew them up while buffaloes
cause damage to the Hagenia-Hypericum vegetation during migration since their traditional
corridors outside the mountain have been cut off (EEIU, 2008). Also threats from visitors who
leave litter that cause a population boom of hyrax and rodents in the Teleki valley, cause damage
to vegetation (KWS, 2010).
1.7 Problem statement
The importance of substrate type and structure in Bryophyte species diversity and composition in
the functioning of tropical mountain ecosystems water catchment sources is well established
(Pharo & Beattie, 2002), but effects of microhabitat and altitude in bryophyte distribution have
received relatively little attention (Putz et al., 1986).
Research on bryophyte taxonomy and their relationship to the different species of tracheophytes
in Mt. Kenya will provide knowledge on the ecological functioning of the mountain and the

12
impact on conservation efforts needed to stem the mountain degradation.
1.8 Research aims and objectives
1.8.1 General aim The aim of this study was to establish the taxonomic and ecological relationship between
bryophytes and tracheophytes along western slope of Mt. Kenya.
1.8.2 Specific objectives
1. To determine the diversity and distribution of bryophytes and tracheophytes along Naru Moru
tract (NMT) on the western slope of Mt. Kenya.
2. To establish the ecological relationships between bryophytes and tracheophytes.
3. To provide taxonomic information needed for the conservation of those plant groups on Mt.
Kenya.
1.9 Research questions
1. How are bryophytes and tracheophytes distributed along Naro Moru track on Mt. Kenya?
2. How does rise in elevation influence the diversity and distribution of bryophytes and
tracheophytes along the Naro Moru track?
3. How does microhabitat variation control bryophyte diversity?
4. How do bryophytes associate with tracheophytes along the altitudinal gradient?
5. How can the taxonomic information on bryophytes and tracheophytes be used to improve their
conservation in Mt. Kenya?

13
CHAPTER TWO
LITERATURE REVIEW
2.1 Characteristics of tropical mountains
Understanding of the environment is a vital aspect for proper planning, utilization and
management of natural resources, that is why habitat studies have become a focal point in
ecology (Wardle, 1965).
Plants growing at high elevations in tropical mountains show a scleromorphic habit at the leaf
and plant level. This tends to increase with increasing elevation, despite the fact that alpine
landscapes are generally considered to be cool and humid environments (Wardle, 1965). High
elevation plants generally have a reduced height, total leaf area and size, thicker leaves,
epidermal cell walls, and cuticles compared to lowland plants. Also leaf pubescence is
widespread among plants growing at very high elevations (Troll, 1968).
Pronounced changes in plant vegetation structure occur with increase in elevation in tropical
mountains where tall, predominantly mesophyllous tree species are replaced by crooked,
nanophyllous species (Grubb, 1979) and finally higher elevations of the tropical alpine belt,
sclerophyllous shrubs, tussock grasses, cushion and giant rosette plants with marked
scleromorphic features are the dominant life forms. In tropical latitudes, the elevation changes in
plant physiognomy were commonly attributed to direct or indirect effects of altitudinal decrease
in temperature, changing light levels, and low soil nutrient availability (Ohsawa, 1990).

14
Water in East Africa (Beck et al., 1990) is an important limit to plant growth at high elevation.
This perception is based on the abundance of fog and lichens in many tropical alpine ecosystems
(Smith and young, 1987). Bogs are typical elements of several tropical high- elevation
landscapes such as the Ramos of Northern South America, the highlands of New Guinea (Hope,
1980) and at the top of Mt. Kenya (Coe, 1967). Another property needed for perpetuation of the
balance of biological biodiversity in a stable ecosystem depends on the ability of constituent
species to coppice (Mazingira, 2008). In Mt. Kenya ecosystem, coppicing occurs in 80% of tree
species in disturbed areas (Mazingira, 2008).
2.2 Geological and geographical factors influencing plant distribution
The number of vegetation zones in mountains depends on the height of a mountain and its
geographical location in respect to latitude (Lomolino, 2001). In the tropics, climatic zones like
geology, position in relation to sea and height of mountains are important factors that create the
diversity of the vegetation types in different mountains (Kruckberg and Robson, 1986).
Biodiversity is distributed heterogeneously across the Earth and some areas team with biological
variation (some moist tropical forests as on Mount Kenya and coral reefs), others are virtually
devoid of life (some deserts and polar regions), but most fall somewhere in between, (Lomolino,
2001). Differences in plant morphology and anatomy can be ecologically conditioned by a
plant’s location in a geologically heterogeneous landscape lined to form its function (Kruckberg
and Robson, 1986). There also exists altitudinal, latitudinal and longitudinal gradients of
variation in species diversity. The land area available for biota on the mountains declines with

15
elevation, because the mountains do not have vertical walls but slopes (Kruckberg and Robson,
1986). Tropical forests begin to exhibit plant zonation from their foot base up to their peaks
(Kruckberg and Robson, 1986). According to Mahaney (1987) and Speck (1986), soils of Mount
Kenya show altitudinal zonation. Its long-extinct volcano has been much denuded, and the
highest peaks consist of the crystalline nepheline-syenite which plugged the former vent. Around
this core are gently dipping lavas, agglomerates, and tuffs. The land elevation determines the
type of soil as a result of volcanic activities. Mount Kenya’s vegetation succession is well
developed where it emerges from the surrounding savanna. The montane forest extends upward
from a lower limit of about 2,000m to 3,000m and includes giant trees; Cinnammum camphora
and Podocarpus species.
2.3 Environmental factors influencing plant distribution and diversity
Various factors influence the growth of plants in a particular environment; moisture, soil
physical and chemical properties (Munishi, 2004). Also the distribution may show large
variations within a landscape as influenced by different environmental factors (Lovett et al.,
2000). Two richness patterns have been identified along mountain slopes: 1) A trend of
decreasing species richness with increasing land elevation and 2) a hump-shaped distribution of
species richness at mid elevation areas (Rahbek, 1995). The hump-shaped distribution of species
richness is the most typical pattern but its predominance in species-elevation studies depends
strongly on spatial grain or micro-topography along the mountain and the length of the slope
(Rahbek, 2005).
16
2.4 General distribution of vegetation on Mount Kenya
In Kenya forests, including the Mt. Kenya forest, cover only 1.7% of the country. The country’s
hydro-geography has been described by several authors and each has expressed the grave
concern about the effects of changing climatic conditions on the tropical mountains (UNESCO,
1992; Decurtins, 1992). According to Decurtins (1985), the best areas with the highest amount
of water are found on the moorland and upper forest zones of the mountain. This zone is also the
area that has tremendously changed in Mt. Kenya as the numerous glacial moraine and small
lakes have disappeared, leaving only eleven out of twenty that existed on the mountain in the
1930s (Hastenrath, 1984).
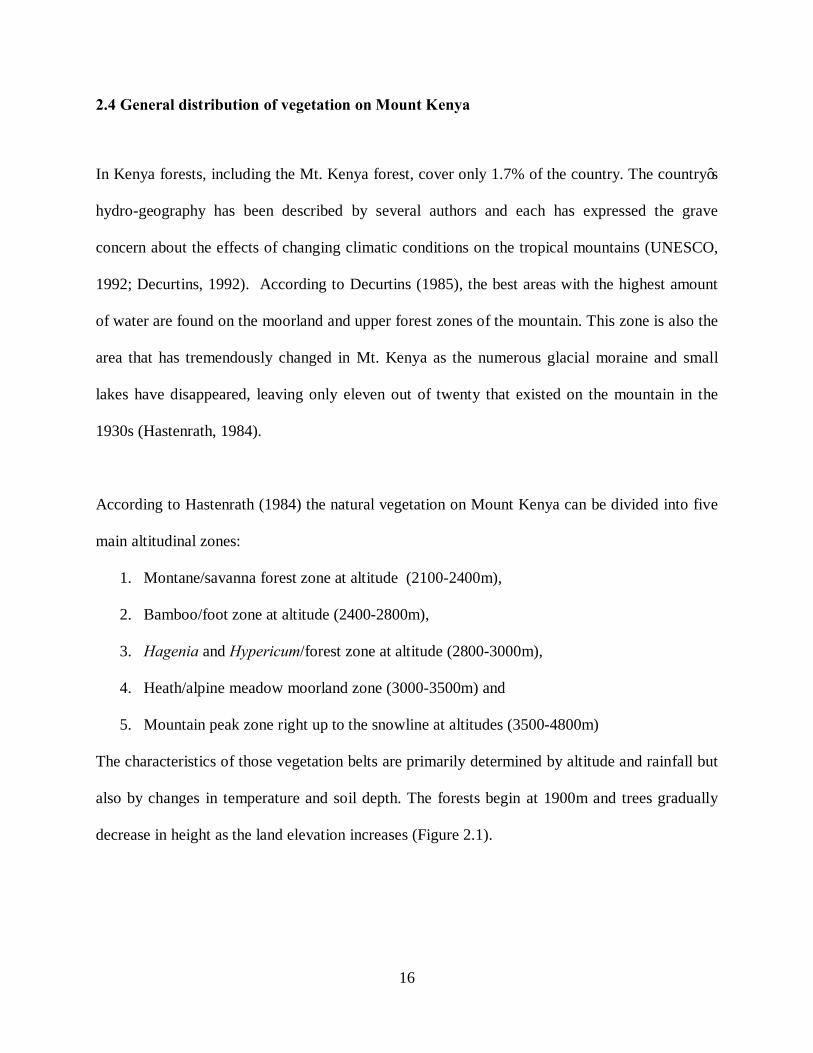
According to Hastenrath (1984) the natural vegetation on Mount Kenya can be divided into five
main altitudinal zones:
1. Montane/savanna forest zone at altitude (2100-2400m),
2. Bamboo/foot zone at altitude (2400-2800m),
3. Hagenia and Hypericum/forest zone at altitude (2800-3000m),
4. Heath/alpine meadow moorland zone (3000-3500m) and
5. Mountain peak zone right up to the snowline at altitudes (3500-4800m)
The characteristics of those vegetation belts are primarily determined by altitude and rainfall but
also by changes in temperature and soil depth. The forests begin at 1900m and trees gradually
decrease in height as the land elevation increases (Figure 2.1).

17
Hedberg (1951) published a comprehensive account of the vegetation zonation of East African
high mountains. The high mountain vegetation was divided into three large belts according to
altitude. These were Montane Forest, Ericaceous and the Alpine Belt. All these studies classified
the vegetation based on vascular plants. Among the researchers who have worked on vegetation
in Mt. Kenya, only Bussman (1992) mentioned bryophytes but he admitted that the bryophytes
and lichens had not been considered during the study. Bussman’s subsequent study in (1993)
divided the Mt. Kenya forest vegetation into six zones: Cultivated land, Sub-montane, Montane,
Sinnarundinaria zone, Sub alpine and Alpine.
Figure 2.1 Altitudinal profile of natural vegetation along the Naro Moru
Track (Source: Decurtins, 1992).
31km

18
White (1983) and Abraham (1980) classified Mount Kenya vegetation based on altitudinal
sequence and physiognomic criteria from the bottom to the top of the mountain. Several authors
used edaphic factors and partly species dominance: (Fries and Frries, 1948, Hedberg, 1951,
Knapp, 1973, Lind and Morrison, 1974, White, 1983, Trapnell and Brunt, 1987, Beenjte, 1988
while Schmitt 1991 used floristic and ecological criteria.
Chuah (2003) who collected numerous specimens of bryophyte and documented their
distribution in a wide range of habitat niches in Mt. Kenya and specimens deposited in the
University of Nairobi Herbarium (NAI), where many remained unidentified. Chuah (2003) also
generated a classification of known bryophytes without mentioning their association or
relationship with tracheophytes in Mt. Kenya. Therefore, the plant diversity of the vegetation still
remains unclear. This study sought to establish the altitudinal distribution, abundance and
diversity of bryophytes and their association with tracheophytes along an altitudinal gradient
(Naro Moru track) on the western slope of Mount Kenya.
2.4.1 State of knowledge of bryophytes
Bryophytes are one of the least studied groups of plants, yet they play a vital role in the
dynamics of plant communities. Bryophytes can absorb atmospheric water, up to 600 times their
dry weight, and retain water up to 13% of their own weight (Mwangi, 2008); and this is made
available to the tracheophytes as water flows from the bryophytes as they subsequently released
it slowly. Several plant inventories have been conducted in Mt. Kenya with no mention of the
percentage or ratio of bryophytes to tracheophytes (Hedberg, 1951; Bussmann, 1994 and Pócs,

19
1980). In his third edition (Agnew, 2013) has written about grasses, sedges, ferns and flowers,
stating that “it is particularly useful for managers of rangelands and parks, giving a high chance
of identifying any non-woody plant in upland Kenya”, but he did not include bryophytes in this
recommendation.
Characteristics of bryophytes include exhibition of alternating generations; poorly developed
root support system and water transport tissues; lack of a cuticle or poorly developed ones,
which allows them to absorb water quickly through the general surface and slowly release it to
the surrounding environment; dependence on water for successful fertilization and a dominant
gametophyte generation, (Hallingback and Hodgets., 2000). Bryophytes reproduce both by
sexual and asexual means. They also inhabit all types of ecosystems but more abundantly in
moist humid cool climates. This is a characteristic of cloud forests especially in Africa where
Bryophyte diversity is not evenly distributed (O’Shea, 1999). The available information shows
that the Sub-Saharan African moss flora is endemic to the region and the number of taxa
increases with altitude up to a certain level. The level of endemism greatly depends on habitat
diversity expressed by the number of vegetation belts (Chuah, 2003). On Mt. Kenya, the families
Grimmiaceae and Andreaeacae appear at altitudes above 3400m.
Most centers of Bryophyte diversity in tropical Africa are on mountains (Hallingback and
Hodgets, 2000), which are either of ancient crystalline or volcanic origin such as, Mountains of
Virunga, Tanzania highlands, Ethiopian highlands, Mt. Rwenzori, Mt. Elgon and Mt. Kenya.
Bryophytes are important plants in various ways: firstly they act as indicators of pollution and
natural habitat quality. Some bryophyte species (Antitrichia curtipendula, Hylocomium

20
splendens, Hypnum cuppressiforme,Fontinalis antipyretica are pollution sensitive to show
indication of pollution in the air even at very low level (Chuah, 2003), water pollution (Grime ,
1979) and monitoring of radioactive metals such as caesium; secondly, some bryophytes are used
as medicine for instance Marchantia polymorpha, Plagiochila appendicullata, Polytrichum
species, Ricca species, Philonotis fontana and Hypnum cupressiforme; thirdly, bryophytes are a
source of food for example marchantia polymorpha, Plagiogasma appendiculata, Polytrichum
spp. Ricca spp and fourthly Bryophytes have cultural and aesthetic qualities; fourthly,
bryophytes are cultivated as ornamental plants for cultivation in landscape trays (Hallingback
and Hodgets, 2000). Fifthly bryophytes are employed in scientific research as experimental
model organisms in biochemical experiments and genetic studies e.g Polytrichum commune and
are excellent experimental specimens when introducing students on the use of microscope.
Lastly, Bryophytes constitute a major portion of the biodiversity in moist forests and play a
major role in ecological functions in wetland and mountain systems. They also contribute
significantly to community structure forming mixed communities (Hallingback and Hodgets.,
2000). Mosses and lichens are usually the first plants to colonize newly exposed land and
frequently dominate in severely stressed environments. Bryophytes also encourage water
infiltration into the soil (Ah-Peng, 2007).
2.4.2 Pteridophytes
This group of tracheophytes is poorly known in the scientific field; they are vascular plants with
well differentiated plant body of shoot, stem and roots and well developed conducting tissues,
the phloem and xylem. Pteridophytes are generally sporophyte-oriented. The sporophyte is a

21
normal diploid plant while the gametophyte is haploid. The pteridophyte gametophyte is free
living and this makes them different from the angiosperms whose free living is the sporophyte
generation. Pteridophytes are found in almost all climatic regions of East Africa (Johns, 1982).
They are mostly ramicolous, terricolous and humicolous.
Pteridphytes have several economic use 1) Food; Asplenium ensforme, Ceratopteris
thalictriodes, Diplozium esculentum, Nephrolepis biserraia 2) Medicinal; Actinopteris radiata,
Adiantum aethiopium, Acrostichum aereum, 3) Pesticides; Dryopteris filixmas, Phymatosorus
scolopendria 4) Ornamentals; Lycopodium volubile, Saleginella serpens, Pteris vittata and on a
smaller scale they are used as firewood. All these plants have been documented in the Plants of
Mt. Kenya (Hedberg 1951).
2.4.3 Gymnosperms
These are Tracheophytes that bear naked seeds. They are not very many in Kenya hence not
much has been done on them in terms of research. Of the three indigenous families occurring in
Kenya, only three species are observed in Mt. Kenya; Juniperous procera, Podocarpus falcatus
and P. latifolius (Beentje, 1994).
2.4.4 Angiosperms
The total number of vascular plants on Mt. Kenya according to the record shows that by 1994
were 882 species, 479 genera and 146 families without specifying them into angiosperms,
pteridophytes or gymnosperms (Bussman, 1994). Angiosperms are vascular plants that are most

22
dominant and diverse. They are the most highly evolved group of plants. They regularly undergo
an alternation of generation of a complex, independent visible sporophyte and an inconspicuous
and reduced gametophyte. Angiosperms are found almost everywhere in each possible type of
habitat and climate (Judd et al., 2002).
Angiosperms are vital in man’s life directly. Firstly, they provide 80% of the world’s food.
Secondly, they are used for the production of organic pesticides. The plant species used include,
Chrysanthemum cinerariifolium, Acokanthera spectabilis, Melia azedarach, Acacia arabica,
Ageratum houstonianum and Annona montana. Thirdly Angiosperms are used for in traditional
medicines and as sources of conventional drugs; Achyranthus aspera, Adansonia digitata,
Albizia schimperi, Aloe secundifolia, Cassia didymobotrya, Catha edulis, Acokanthera species
among others. Others are used as spices for example, Ginger (Zingiber officinale), Parsely
(Petroselinum crispum), Rosemary (Rosemarinus vindicum), Peppermint (Mentha piperita),
Garlic (Allium salivum), Onion (Allium cepa) and Vanilla (Vanilla planifolia). All these plants
have been documented to be present on Mt. Kenya (Hedberg 1951) though the author may not
have encountered them all because of limitations in sampling procedures.
2.5 Conservation strategy of Mount Kenya
Since the discovery of the receding of the glaciers and subsequent disappearance of the forests,
Kenya Wildlife Service launched a plan for the conservation of animals and vascular plants from
1993. In 1999 the vascular plants in the Mt. Kenya region was recommended for its conservation
as this affected the natural diurnal rain pattern of the area. While the rainfall pattern is altered,

23
human activities have also affected the plant biodiversity (Osborne, 2000). This contributes to
the flooding of the river Ewaso Ngiro fed from the mountain. If the KWS (2010) strategy plan
and other concerned conservation bodies adopt the ecological information that this study will
provide, then the soils around and within the mountain will regain their vegetation cover by
having all the plants conserved. This will in turn reduce the soil erosion from the mountain base
and consequently help to curb the sedimentation in the river. As a result, the riverbed will clear
off the sediments hence reducing flooding.
2.6 Social-Economic importance of Mt Kenya
Apart from being the main water catchment system to the Ewaso Nyiro River drainage systems
which are essential for the water supply in Kenya and a source of most of the tributaries that feed
river Tana, it also serves as a source of economic value for the country as one of the main
tourist attractions of the country with high recreational value such as fishing, climbing, camping
recreational sites and general agriculture at its foot zone. It was crowned as a World Heritage
Site in 1997 and an international recognition as a Biosphere Reserve in 1978 (Hemp, et al.,
2006).

24
N
CHAPTER THREE
METHODOLOGY
Study Area.
Location and structure of Mt Kenya
Mt. Kenya is Kenya’s highest mountain, a nation icon, a climber’s Mecca, the nation’s namesake
to the country’s name, wildlife stronghold (KWS, 2004) and a UNESCO World Heritage site
(UNESCO, 1992) and a wildlife stronghold situated 175 km North- East of Nairobi. Mt. Kenya
can be approached through seven gates; the Naro Moru, the Chogoria, the Sirimon, the Kihari,
the Kamweti, the Marania and the Ithangaini. This research concentrates on Naro Moru route
herein referred to as Naro Moru Track (NMT) and which is the richest in the flora population as
compared to others, (Chuah, 2000). This study was carried out along the Naro Moru track from
the gate upto point Lenana which was a vertical distance of 38 km and an altitude height of
2400m.
Figure 3.1. Map of Mt. Kenya Region showing some of the seven routes into Park, (KWS, 1999)

25
The hydro geography of the area has been described by several authors and each has shown
grave concern of the changing climatic conditions of the mountains for instance the Conference
on Environment and Development held by UNESCO was an occasion to draw the attention of
policy makers to the increasingly grave problems besetting Mt. Kenya (UNESCO, 1992).
The National Park and the Reserve measure 715 Km² and 2,124 Km² respectively making the
total area of the mountain region to be 2, 839 Km² and mountain base diameter of 120 km
(Chuah, 1994). The National Park and the National Reserve were gazetted in December 1949
and July 2000 respectively (KWS 2010). The mountains whose peaks are usually covered with
clouds; gives rise to many river sources that provides water for intensive farming at its foot
(Chuah, 2003, Plate 2.1). The region has 20 glacial tarns of varying sizes whose water levels are
declining (e.g Teleki Tarn one of the small lakes at the peak of the mountain (Author, 2009).
Mt. Kenya like Mt. Kilimanjaro was earlier described as being snow caped, now it is scattered
with snow (Figure 3.1). The cause of the mountain losing snow at its peaks should be
established and if possible curbed.

26
Figure3.2 Scattered snows on the peaks of Mount Kenya following Naro Moru route
(Muigai 2008)
3.1.1 Location of study area This study was carried out between August 2008 and August 2009 on Mt. Kenya within
geographical GPS coordinates; {(S 00, 16965º, E 37, 15234º) at the gate of Mt. Kenya national
park and (S 00, 16680º, E 37, 18770º) at point Lenana on Mt. Kenya. Mt. Kenya lies between
altitudes 1600 and 5199m. The mountain has three summits; the Batian Batian 5199, Nelion
5188 and Lenana 4895m (Figure 1.1).

27
Figure 3.2 A sketch map of Naro Moru Track in Mt. Kenya with red boxes showing
beginning and the end points of this study (by Author 2009).
3.1.2 Climate of Mt. Kenya The climate of Mt. Kenya can be described as moist cold tropics with large diurnal temperature
variations. Kenya is positioned on the equator 0 37º S (Decurtins, 1992) and because of this; it
has equal day lengths throughout the year. The mountain has altitudinal zonation of decreasing
BATIAN (5199m)
NELION (5188m)
POINT LENANA(4895m)
MARKINDERS’ LODGE (4400m)
PICKNIC ROCK (3800m)
RADIO CONTROL STATION (3600m)
MET. STATION (3400m)
GUEST HOUSE (2405m)
N NARO MORU GATE (KWS) (2400m)

28
temperature and two main rain seasons, the long wet period that occurs between March and June
and the short wet period that occurs between December to February. This research was done
within these periods.
Mt. Kenya derives its rainfall from the moisture bearing north and south-west monsoon winds.
The air circulation is controlled by a sequence of low pressure areas which form the Inter-
tropical Convergence Zone (ICZ) (Decurtins, 1992). It moves with the sun North and South of
the equator twice a year. This makes the mountain area to experience seasonality of precipitation
which makes the mountain to experience drier areas in its northwestern side and moist areas in
the southeastern.
Rainfall increases with increase in elevation. The low rainfall ranges between 600-900 mm p.a.
at the lower slopes while the maximum ranges from 1500-2000 mm p.a. from the height of 1500-
3600 m (Decurtins, 1992). In this connection, plants are threatened. We can’t tackle the
environmental challenges without a deep understanding of plant categories association. Human
activities and their impact and our changing climate are each having an impact on the health of
plant life on a global scale (Decurtins, 1992).
The total cover of forests in Kenya is up to 1.7%. This is because the human communities living
around the forests engage in illegal logging, encroachment and denudation while wild animals
graze destructively. This in turn results in soil erosion which leads to more forests disappearing
(KWS, 1999).

29
The montane forests in this study lies between 2400m and 3600m which experiences abundant
rainfall that contributes to the high humidity and cloud cover in the region. Regions above
montane forests experience diurnal fluctuations in temperatures, intense solar radiation and
relatively low and erratic rainfall (Decurtins 1992). The zones above the montane region
sometimes experience rainfall with hailstones and even snow. These harsh conditions have and
limited the survival of both the fauna and flora which occur mostly in the rocky areas.
Solifluctions soil conditions between 3800 and 4400m support moss bryophytes than vascular
plants.
3.1.3 Land elevation and zonation of the Naro Moru track Three forest zones in the Naro Moru Track studied are shown in Table 3.1.
Table 3.1. Forest zones studied along the Naro Moru Track
Section Position/ altitude range Vegetation zones
1 Gate to Radio station
2400 – 3600 asl
Montane zone
2 Radio station to Mackinder’s
lodge
3600 – 4200 m asl
Subalpine to Alpine zones
3 4200 – 4800 m asl Alpine to – Nival zones
3.2 Study design

30
The composition of the plant communities, their structure, and density were determined. The
diameter and height of the vascular plants which hosted the bryophytes were measured by using
a tape measure, Vanier caliper as well as clinometers and range finder respectively.
3.2.1 Site selection In each zone/stratum, systematic and random sampling techniques were employed to
determine the species diversity and abundance. A 50m transect was made on
either side of the track and along it four plots of 10 by 10m were established 5m from
either side. These plots were used as major quadrants for vascular plant sampling; the
major quadrants are the same in which three smaller quadrants of 2 by 2m were made
for bryophyte sampling. In each, three bryophyte quadrants measuring 10 x5cm were
randomly selected and specimens collected from all the existing microhabitats (Figure
3.3). This was repeated after every 200m elevation (figure 3.4). A survey was carried
out to get a good understanding of the altitudinal bryophyte, pteridophyte,
gymnosperm, and angiosperm diversity and distribution.
NARO MORU TRACK
50M 50M
10m 10m 200m asl

31
50M 10m 10m
Figure.3.3a) Layout of 10x10m plots selected along NMT
10m
10m
Figure.3.3b) Layout of subplots of 2mx2m and 5cmx10cm within 10x10m plots.
The GPS coordinates were used for selecting the sampling areas and for mapping out the
distribution of plants based on the altitude.
Figure.3.3.c) Layout of plots used in sampling tracheophytes and bryophytes
2m
5cm
10cm
10mx10m.plot Vascular plant strata
2m
B
2m
C
2 x2m plot Bryophyte strata (5x10cm)
32
Vascular plants were sampled from 10 by 10m plot (Figure 3.4c (A)) while Bryophytes were
from a 10cm by 5cm quadrant (Figure 3.4c (C)). The altitude was measured with an altimeter
calibrated with a topographical map and the GSP instrument (1: 25,000).
3.2.2 Vegetation Sampling
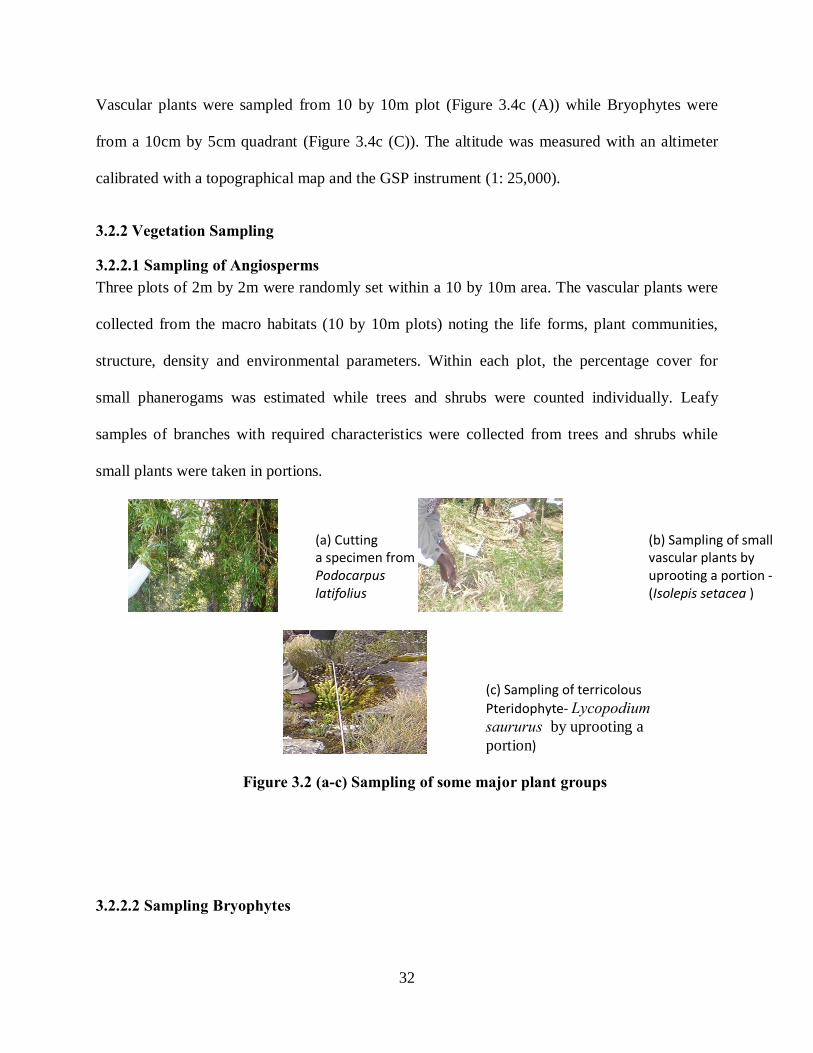
3.2.2.1 Sampling of Angiosperms Three plots of 2m by 2m were randomly set within a 10 by 10m area. The vascular plants were
collected from the macro habitats (10 by 10m plots) noting the life forms, plant communities,
structure, density and environmental parameters. Within each plot, the percentage cover for
small phanerogams was estimated while trees and shrubs were counted individually. Leafy
samples of branches with required characteristics were collected from trees and shrubs while
small plants were taken in portions.
Figure 3.2 (a-c) Sampling of some major plant groups
3.2.2.2 Sampling Bryophytes
(a) Cutting a specimen from Podocarpus latifolius
(b) Sampling of small vascular plants by uprooting a portion -(Isolepis setacea )
(c) Sampling of terricolous Pteridophyte- Lycopodium saururus by uprooting a portion)

33
Within each plot of 2 by 2m, nine micro plots of 10 by 5cm (here called relevés) were sampled.
Bryophytes were collected from all observable microhabitats namely: those collected from dead
decayed plant matter as Humicolous (Hu), decaying plant materials as Lignicolous (Li), rocks as
Rupicolous/Saxicolous (Ru), ground as Terricolous (Te) and from live plants as Corticolous
(Co). Those from tree trunks were collected at three levels: 0.0-0.5, 0.5-1 and ≥ 1m above the
ground, rachises and leaves in this text referred to as Cort1, 2 and 3 respectively though during
sampling collection they were referred to as TC1, TC2 and TC3.
Figure 3.3 Curating the specimens (Author)
3.3 Data Analysis Plant communities were recorded in the field while the analysis of the relevés and the data
analysis were based on the procedures of Braun-Blanquet. Plants collected were analyzed by
hand sorting, while high cover abundance was weighted because the Bruan-Blaquet method
which was used puts emphasis on the dominant species. The regular occurrence of species with
small cover in vegetation was also regarded as important for classification.
Paper pockets for drying Bryophyte plant samples
Plant press for drying Trcheophyte plants

34
After relevés analysis, the species were rearranged to point out differential species. The
constancy of each species within a relevé group was calculated with the programme `TAB’
(PEPPER 1988)/SPSS VER 15.0 (Norman et al., 2007) in classes of percentage.
3.3.1 Vegetation data analysis a. Species abundance
Species abundance is the number of species sampled and their total numbers. The species were
samples, listed and their numbers noted. The species abundance was also used to conduct
analysis of variance between the altitudinal levels and microhabitats of bryophytes.
b. Sample similarity
Similarity index was calculated using species abundances to compare the species collected at
different altitudes and microhabitats. Comparison was necessary because in plant ecology this is
expected to be representative of communities (Kruskal, 1964).
c. Species density
It is important in determining how many individuals of each species are present to all of them in
a particular study; calculated by dividing the number of individuals by the total area sampled
thus;
Density = Total number of species ÷ Total area sampled
Where area for different plant groups is,
For Tracheophytes is 10 x 10m = 100 m²
For Bryophytes is 5cm x 10 cm = 50 cm²

35
d. Frequency
This is the probability in percentages of encountering an individual. These values are used to
determine whether the species was encountered or not. Relative frequency reveals how many
times a species is appeared relative to all other species;
Frequency = number of sampling levels in which species A appeared divided by
number of all the levels sampled
Where number of sampling levels were for:
Tracheophytes is 13 levels x4sampling quardrats x2 because it is on both sides of the
NMT =104.
Bryophytes is 13 levels x3 quardrats of two by two x 3 quardrats where bryophytes were
sampled from=468.
e. Species diversity and richness of all plants sampled
Species diversity and richness were calculated using, the Shannon - Weiner diversity index, H´
from the Information Theory (Zar, 1996). The index formular:
H´ = -∑ рί log рί
Where,
H´ = the Shannon Diversity index
pί = the proportion of plants of the ίth species over all plants of all species
s = the number of species
s
i=1

36
The indices were then compared for differences amongst forest proximity category using
Kruskal-Wallis K test for medians (Fowler et al., 1989/1990; Zar, 1996). Correlation was used to
find the relation of bryophyte cover to altitude and this was compared with the vascular plant
cover and according to the altitude.
f. Analysis of species diversity of Bryophytes
Using presence and absence of species, bryophyte species richness was compared at each
altitude. The effects of altitude and microhabitat on bryophyte diversity were tested with a non-
parametric one-way Kruskal-Wallis test (Zar, 1996). Variation between species assemblages and
microhabitats were determined using a Correspondence Ordination Analysis (COA). Only
species with the frequency of ≥5 were analysed. Field and laboratory observations and results
from the COA were summarized. The analyses were performed by SPSS software package.
CHAPTER FOUR
RESULTS
4.1 Species diversity of all the plants in Naro Moru track

37
The study identified a total of seventy seven (77) families, one hundred and eleven (111) genera
and one hundred and sixty four (164) species and these were shared among different plant groups
as shown in table 4.1
Table 4.1Taxonomic plant diversity along Naru Moru Tract, Mt. Kenya
Plant category Family Genera Species
Bryophytes 39 (50.6%) 56 (50.5%) 81 (49.4%)
Angiosperms 31 (40.3%) 48 (43.2%) 68 (41.5%)
Pteridophytes 6 (7.8%) 6 (5.4%) 13 (7.9%)
Gymnosperms 1 (1.3%) 1(0.9%) 2 (1.2%)
Total 77 (100%) 111 (100%) 164 (100%)
4.2 Tracheophyte species richness and distribution
4.2.1 Tracheophyte species richness by altitude
Tracheophyes also refered to as vascular plants, were spread over all the altitudes except one,
4800m. They decreased with increase in altitude until 4600m where it was only one species;
Senecio purtschelleri recorded. The frequency of the species varied but at 2400m and 2600m
Achyranthus aspera dominated with a frequency of 9.9% and 10.6% respectively. In altitude
2800m, the plant species that occurred most was Sinnarundinaria alpina with a frequency of
8.8% while at 3000, 3200 and 3400 m it was Alchemilla argyrophylla with a frequency of 7.7%,
13% and 8.4% respectively.

38
At 3600m and 3800m, the dominant species was Erica arborea with the frequency of 13.6% and
18.3% in that order, at 4000 and 4200 Lobelia teleki with 37.5% and 50% respectively. At 4400
and 4600m was Senecio purtschelleri dominated with 50% and 100% in that order. The altitude
where most plant species were found was 3000m with the total frequency species occurring
standing at 364 (Figure 4.1).
Figure 4.1 Total frequencies of Vascular plants by altitude
4.2.3 Tracheophyte species distribution
Three categories of tracheophte plants were identified; pteridophytes, gymnosperms

39
and angiosperms. The study noted a higher distribution and richer diversity of tracheophytes in
the lower and mid altitudes 2400-3800m, than in the higher altitudes, 4000-4800m (Figure 4.2).
Figure 4.2 Numbers of Angiosperm species per altitudinal level (at ±95% CL).
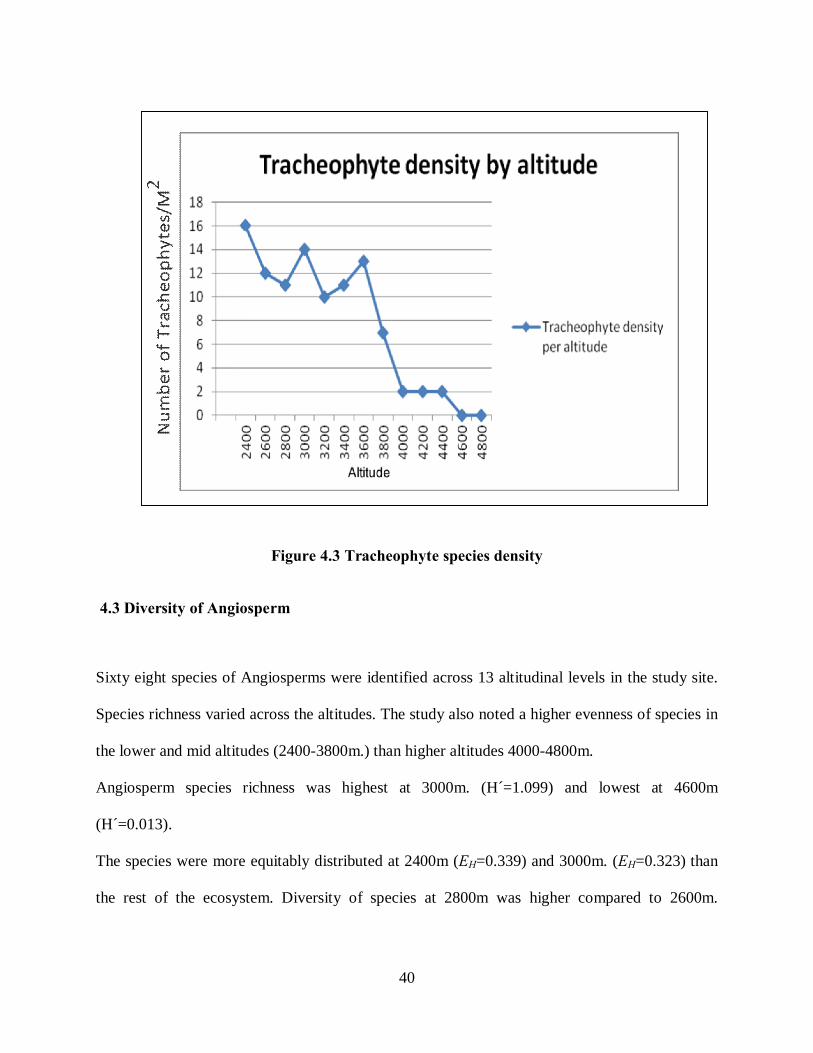
4.2.4 Tracheophyte density
The Tracheophyte plant density varied greatly across the altitudinal transcend on NMT,
Mt. Kenya, where the highest density was at 2400m and the lowest was at 4600 (Figure
4.3).
40
Figure 4.3 Tracheophyte species density
4.3 Diversity of Angiosperm
Sixty eight species of Angiosperms were identified across 13 altitudinal levels in the study site.
Species richness varied across the altitudes. The study also noted a higher evenness of species in
the lower and mid altitudes (2400-3800m.) than higher altitudes 4000-4800m.
Angiosperm species richness was highest at 3000m. (H´=1.099) and lowest at 4600m
(H´=0.013).
The species were more equitably distributed at 2400m (EH=0.339) and 3000m. (EH=0.323) than
the rest of the ecosystem. Diversity of species at 2800m was higher compared to 2600m.

41
(H´=0.902) but were more equitably distributed at 2600 (EH=0.293) than 2800m (EH =0.292,
Table 4.2).
Table 4.2 Diversity and species richness of Angiosperm
The study noted that Achyranthes aspera (Amaranthaceae) was the most commonly occurring
angiosperm species at 2400m and at 2600, accounting for 10% of all species found in the
altitudes. It was followed closely by Conyza newii accounting for 9% of all species found in
these altitudes. Commelina latifolia (Commelinaceae) accounting for 11 and 10% of species in
the altitude respectively. Plantago palmata and Cyphostemma bambusetii were the least
occurring species accounting for 2% of species in this altitude. The most common species across
the lower and mid altitudes was Erica arborea occurring in eight (2400m to 3800m) out of
thirteen altitudes whereas Senecio purtschelleri was the most common species in the higher
altitudes occurring between 3800 and 4600m. The species accounted for 50% of plants at 4600m
and 36% of plants at 4400m respectively. Angiosperm species assemblage was highest at2400-
ALTITUDE 2400 2600 2800 3000 3200 3400 3600 3800 4000 4200 4400 4600 4800
Shannon Weiner
diversity index
(H´) 1.047 0.893 0.902 1.099 0.82 0.801 0.534 0.348 0.086 0.062 0.086 0.013 0
Evenness
(EH) 0.339 0.293 0.292 0.323 0.28 0.259 0.175 0.145 0.062 0.056 0.054 0.019 0
Number of
Species 22 21 22 30 19 22 21 11 4 3 5 2 0
42
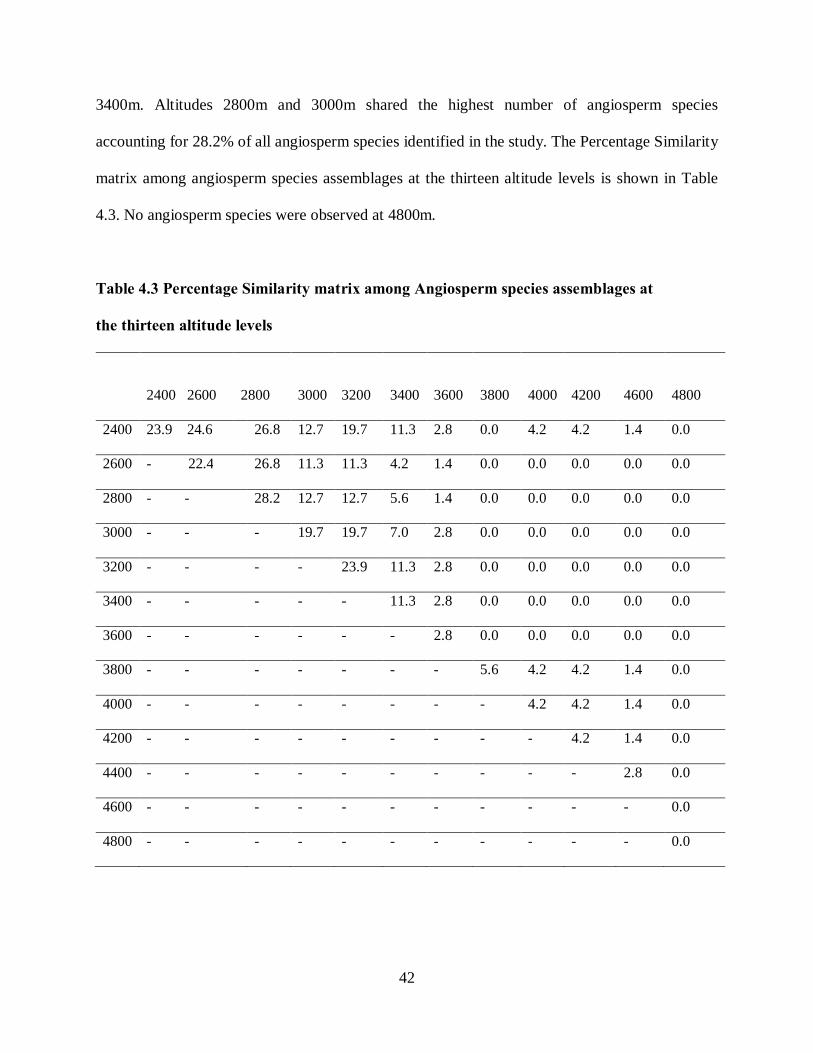
3400m. Altitudes 2800m and 3000m shared the highest number of angiosperm species
accounting for 28.2% of all angiosperm species identified in the study. The Percentage Similarity
matrix among angiosperm species assemblages at the thirteen altitude levels is shown in Table
4.3. No angiosperm species were observed at 4800m.
Table 4.3 Percentage Similarity matrix among Angiosperm species assemblages at
the thirteen altitude levels
2400 2600 2800 3000 3200 3400 3600 3800 4000
4200 4600 4800
2400 23.9 24.6 26.8 12.7 19.7 11.3 2.8 0.0 4.2 4.2 1.4 0.0
2600 - 22.4 26.8 11.3 11.3 4.2 1.4 0.0 0.0 0.0 0.0 0.0
2800 - - 28.2 12.7 12.7 5.6 1.4 0.0 0.0 0.0 0.0 0.0
3000 - - - 19.7 19.7 7.0 2.8 0.0 0.0 0.0 0.0 0.0
3200 - - - - 23.9 11.3 2.8 0.0 0.0 0.0 0.0 0.0
3400 - - - - - 11.3 2.8 0.0 0.0 0.0 0.0 0.0
3600 - - - - - - 2.8 0.0 0.0 0.0 0.0 0.0
3800 - - - - - - - 5.6 4.2 4.2 1.4 0.0
4000 - - - - - - - - 4.2 4.2 1.4 0.0
4200 - - - - - - - - - 4.2 1.4 0.0
4400 - - - - - - - - - - 2.8 0.0
4600 - - - - - - - - - - - 0.0
4800 - - - - - - - - - - - 0.0

43
4.4 Pteridophyte species richness, distribution and evenness
The study identified six families, six genera and thirteen species of Pteridophytes across the
NMT transect. The most common Pteridophyte species in the entire NMT was Lycopodium
clavatum which occurred in seven out of the thirteen altitudes (Table 4.4). Selaginella
kraussiana was the most commonly frequent pteridophyte species in the lower altitude (2400-
3200m.a.s.l) accounting for over 90% of all pteridophyte species in these altitudes whereas
Lycopodium clavatum was commonest in the higher altitudes (3600-4400m).
The highest species diversity pteridophyte was observed in 2400 and 2600m (H´=0.357 and
0.396 respectively). Species were more equitably distributed at 2600m (EH=0.246) followed
closely by 2400m. (EH=0.222) and 3800m. (EH=0.21). Species assemblages were higher in the
lower altitudes (2400-3200m.) than the higher altitudes (3600-4800m.). At altitudes 2600 and
2800m.most number of pteridophyte species was shared 30.8% while 2800 and 3000m shared
23.1% (Table 4.4).

44
Table 4.4 Altitudinal Pteridophyte species diversity
ALTITUDE 2400 2600 2800 3000 3200 3400 3600 3800 4000 4200 4400 4600 4800
1.Selaginella
kraussiana 0.93 0.92 0.95 0.94 0.93 - - - - - - - -
2.Pteridium aquilium 0.02 0.02 0.02 - - - - - - - - - -
3.Lycopodium clavatum - - 0.01 0.01 - - 1.00 0.88 0.63 1.00 1.00 - -
4.Spinium 0.01 0.02 - 0.01 0.01 - - - - - - - -
5..Pteridium aquilium - - - - 0.02 - - - - - - - -
6. Bazzaminae-abundant - - - - 0.02 - - - - - - - -
7.Commelina latifolia 0.02 0.02 0.02 0.02 - - - - - - - - -
8.Lycopodium saururus - - - - - - - 0.13 0.38 - - - -
9.Lycopodium cernuum - - - 0.02 - - - - - - - - -
10.Cheilanthes farinosa 0.02 - - - - - - - - - - - -
11..Cheilanthes
afromontane - - - - 0.02 - - - - - - - -
12. Dryopteriskirkii - - - - - 1.00 - - - - - - -
13. Aspleniumelliotte - 0.02 - - - - - - - - - - -
Number of species 5 5 4 5 5 1 1 2 2 1 1 0 0
Shannon Weiner
diversity index (H´)
0.35
7
0.39
6 0.26 0.2 0.2 0 0 0.07 0.14 0 0 0 0
Evenness (EH)
0.22
2
0.24
6 0.19 0.1 0.1 0 0 0.11 0.21 0 0 0 0

45
4.5 Gymnosperm diversity and distribution by altitude Only ttree species of Gymnosperms were identified in the study, namely Podocarpus latifolius
and Podocarpus falcatus. Podocarpus latifolius was most abundant at 3400m accounting for
75% of all plants within the altitude whereas Podocarpus falcatus was abundant at 3000m
accounting for 57% of all plants in the altitude. The species were more equitably distributed at
3000m. (EH =0.2) and 3200m. (EH =0.2) respectively. Species diversity and evenness were as
shown in table 4.9. Species assemblage was highest in the lower altitudes (2400-3400m.)
whereas no Podocarpiacae species were observed above 3400m.
Table 4.5 Gymnosperm diversity by Altitude
4.6 Bryophyte species distribution and richness on NMT, Mt. Kenya
4.6.1 Bryophyte species distribution
Bryophytes had the richest species diversity accounting for 49% of all plant species identified in
the study area (Appendix II). They also occurred in all the altitudes in the Naru Moru track
(Figure 4.4).
Altitude
Gymnosperms 2400 2600 2800 3000 3200 3400
3600-
4800
Podocarpus latifolius 0.583 0.571 0.5 0.43 0.57 0.75 -
Podocarpus falcatus 0.417 0.429 0.5 0.57 0.43 0.25 -
Number of species 2 2 2 2 2 2 -
Shannon Weiner diversity
index (H´) 0.05 0.043 0 0.04 0.04 0.13 -
Evenness (EH) 0.063 0.073 0 0.2 0.2 0.19 -

46
The species that occurred in the largest number of altitude ranges were Grimmia and Andreaea,
the two species occurred most in high altitudes where no other species were found.
Figure 4.4 Bryophyte distribution by altitude and microhabitat
Legend : -bryophytes growing on height of tree from
-tree base of 0.0 to ≤0.5m as (TA),
-tree base of 0.5 to ≤1m as (TB)
-tree base of ≥1m as (TC).
Aquatic

47
4.6.2 Bryophyte species richness
The diversity and equitability of bryophyte species varied significantly along the NMT
ecosystem. Species richness was highest at 2400m and lowest at 4600 and 4800m. At 2400m
there were 28 species of bryophytes and at 4600 and 4800m there were only two species (Figure
4.5).
Figure 4.5 Bryophyte species richness at different Altitudes
4.6.3 Bryophyte species abundance
There were 81 bryophyte species identified on NMT, Mt. Kenya. Of these species 28 were found
to be growing at altitude 2400m. The diversity and equitability of bryophyte species varied

48
significantly along the NMT, (P≤0.002) (Table 4.6). Species richness was highest at 2400m and
lowest at 4600 and 4800m respectively.
Table 4.6 Bryophyte species abundance by Altitude
Altitude
Species 2400 2600 2800 3000 3200 3400 3600 3800 4000 4200 4400 4600 4800 Total
Number
of species 28 22 9 26 15 21 18 8 12 10 5 2 2 81
Shannon
weiner (H´) 2.64 1.59 0.78 2.57 1.49 2.04 1.78 2.59 2.36 2.71 1.66 0.0 0.13
Evenness
( EH) 0.431 0.52 0.81 0.63 0.55 0.54 0.62 1.25 0.9 0.98 0.95 0.00 0.19
Grimmia longirostris was the most common species occurring at eight (8) different altitudes
between 3400-4800m. and accounting for 9.6% of all bryophytes identified on NMT. It was
followed closely by Andreaea mildbraedii which occurred at seven (7) altitudes, accounting for
8.4% of all species observed (Table 4.6). Abundance of the two species relative to each other
was similar in the higher altitudes (4400m-4800m.) while these two species were the only ones
identified at altitudes between 4600m and 4800m. At lower altitudes (2400-3200m), Neckera
spp were the most abundant accounting for 5.2% of all bryophyte species identified.
4.6.4 Bryophyte distribution by altitude and microhabitat

49
The study identified nine bryophyte microhabitats along NMT: Those growing alongside water
streams as Aquatic (Aq), on Humicolous (Hu), on lignified stems that have not started rotting as
Lignicolous (Li), on branches or twigs of trees as Ramicolous (Ra), on rock surfaces or crevices
as Rupicolous (Ru), on the ground as Terricolous (Te), on height of tree from tree base ≤0.5m as
(TA), on of tree height from tree base 0.5 ≤1m as (TB) and on of tree height from ≥1m as (TC).
There was a notable influence of altitude on bryophyte diversity and distribution. There were
also significant variation (P≤0.05) in altitudes and microhabitats; Hu and Ru microhabitats
hosted more bryophytes in the higher altitudes (3800 to 4800m). Li and Corticolous hosted more
bryophytes in the lower altitudes (2400-3400m). No bryophytes were identified in Aquatic
microhabitat except at 4200m (Table 4.8). At 2400m, TC hosted a higher number of bryophytes
compared to other microhabitats whereas none were observed in Aquatic and Rupicolous
habitats.
Bryophyte distribution at altitude 2600 in microhabitats TA, TB and TC was comparable (21%)
as well as in Te, Li and Hu (11%) but with no significant difference between microhabitats
(P≤0.099), (Table 4.7). At 2800m, Lignicolous had the highest bryophyte distribution (39%)
followed by (height from tree base ≤0.5m) TA, (20%) and TB (13%) while no bryophytes were
identified in Aquatic and Te microhabitats but with significant variation (P˂0.00, Table 4.8). At
3000m, rupicolous hosted 24% of all bryophytes whereas TA and TB hosted 21 and 20%
respectively. The distribution varied significantly
( P≤ 0.19, Table 4.7).
Table 4.7 % Bryophytes distribution by altitude and microhabitat

50
% of bryophytes encountered per Microhabitat
Altitude
m.a.s.l
Aq Hu Li Ra Ru TA TB TC Te
2400 0 5 8 18 0 13 21 33 2
2600 0 11 11 2 0 21 22 21 11
2800 0 9 39 6 4 20 13 9 0
3000 0 8 11 0 24 21 20 16 0
3200 0 5 11 11 5 27 13 22 6
3400 0 29 3 3 12 29 12 6 6
3600 0 2 8 0 17 47 26 0 0
3800 0 21 7 3 52 7 0 3 7
4000 0 43 7 0 40 0 0 0 10
4200 6 26 21 3 41 0 0 0 3
4400 0 37 0 0 61 0 0 0 3
4600 0 0 0 0 100 0 0 0 0
4800 0 0 0 0 100 0 0 0 0
Bryophytes growing alongside water streams as Aquatic (Aq), on Humicolous (Hu), on lignified
stems that have not started rotting as Lignicolous (Li), on branches or twigs of trees as
Ramicolous (Ra), on rock surfaces or crevices as Rupicolous (Ru), on the ground as Terricolous
(Te), on height of tree from tree base ≤0.5m as (TA), on of tree height from tree base 0.5 ≤1m as
(TB) and on of tree height from ≥1m as (TC). At 3200m., there was a significant variation in
the distribution of bryophytes between the habitats (P≤0.042) with TA recording the highest
number of bryophytes (27%, Table 4.8). Humicolous (bryophytes growing on humus) and TA
(bryophytes growing on tree trunks up to a heght of ≤0.5m) had comparable numbers of
bryophyte densities at 3400m each contributing 29% of all bryophytes in the altitude. Li,
(bryophytes growing on decaying matter) TC (bryophytes growing on tree trunks ≥ 1m), Te

51
(bryophytes growing on the ground) and Ra (bryophytes growing on tree branches twigs) had
lower bryophyte densities compared to Hu and TA. There was a statistical significant variation in
the distribution of bryophytes at 3600m.a.s.l with 47% of Bryophytes being hosted by TA while
53% hosted by the other microhabitats (P≤0.02). No bryophytes were identified in Aquatic (Aq.)
microhabitat except at 4200m (Table 4.7).
At 2400, TC hosted a higher number of bryophytes 62%, compared to other microhabitats
whereas none were observed in Aquatic and Rupicolous. Bryophyte diversity between the nine
microhabitats at this altitude was however statistically significant, P≤0.039.
Also another observation made during this study was that, vascular plants are important as hosts
of bryophytes while alive (Corticolous) as well as when they are dead (Lignicolous). It was
found out that 50% of the bryophytes on NMT are Lignicolous, 30% corticolous bryophytes and
others microhabitats host only 30% (Figure 4.6).
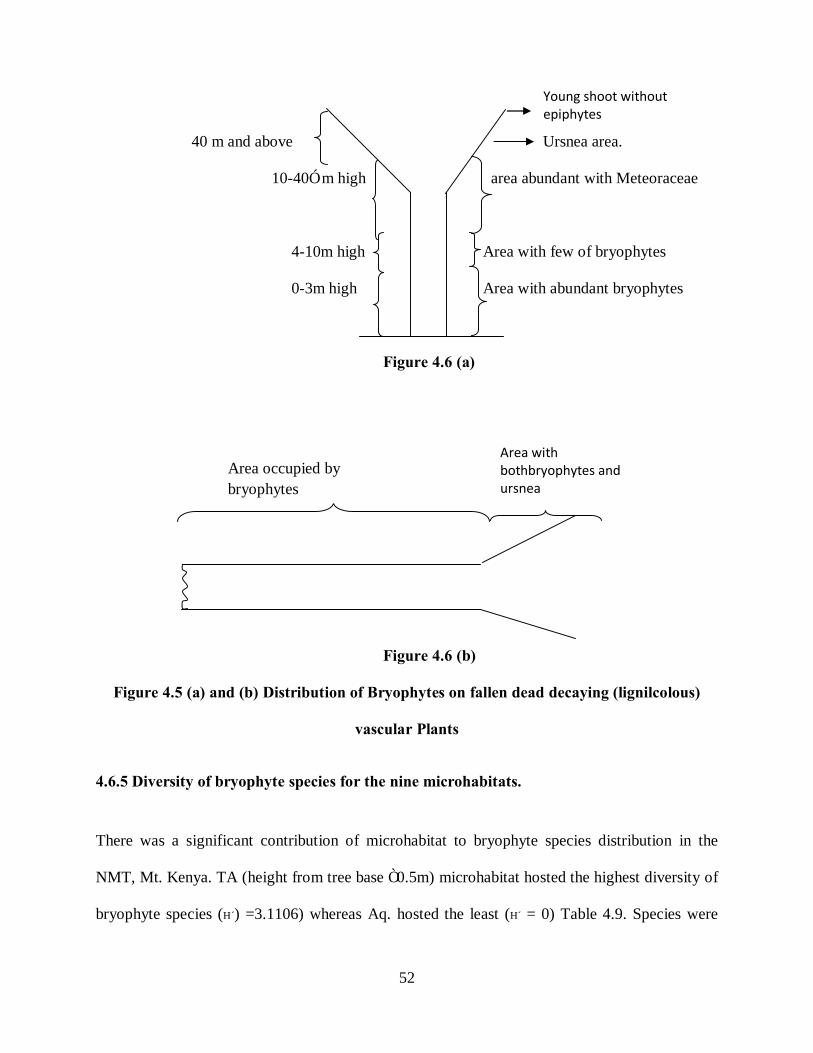
52
40 m and above Ursnea area.
10-40≥ m high area abundant with Meteoraceae
4-10m high Area with few of bryophytes
0-3m high Area with abundant bryophytes
Figure 4.6 (a)
Figure 4.6 (b)
Figure 4.5 (a) and (b) Distribution of Bryophytes on fallen dead decaying (lignilcolous)
vascular Plants
4.6.5 Diversity of bryophyte species for the nine microhabitats.
There was a significant contribution of microhabitat to bryophyte species distribution in the
NMT, Mt. Kenya. TA (height from tree base ≤0.5m) microhabitat hosted the highest diversity of
bryophyte species (H´) =3.1106) whereas Aq. hosted the least (H´ = 0) Table 4.9. Species were
Young shoot without epiphytes
Area with bothbryophytes and ursnea
Area occupied by bryophytes
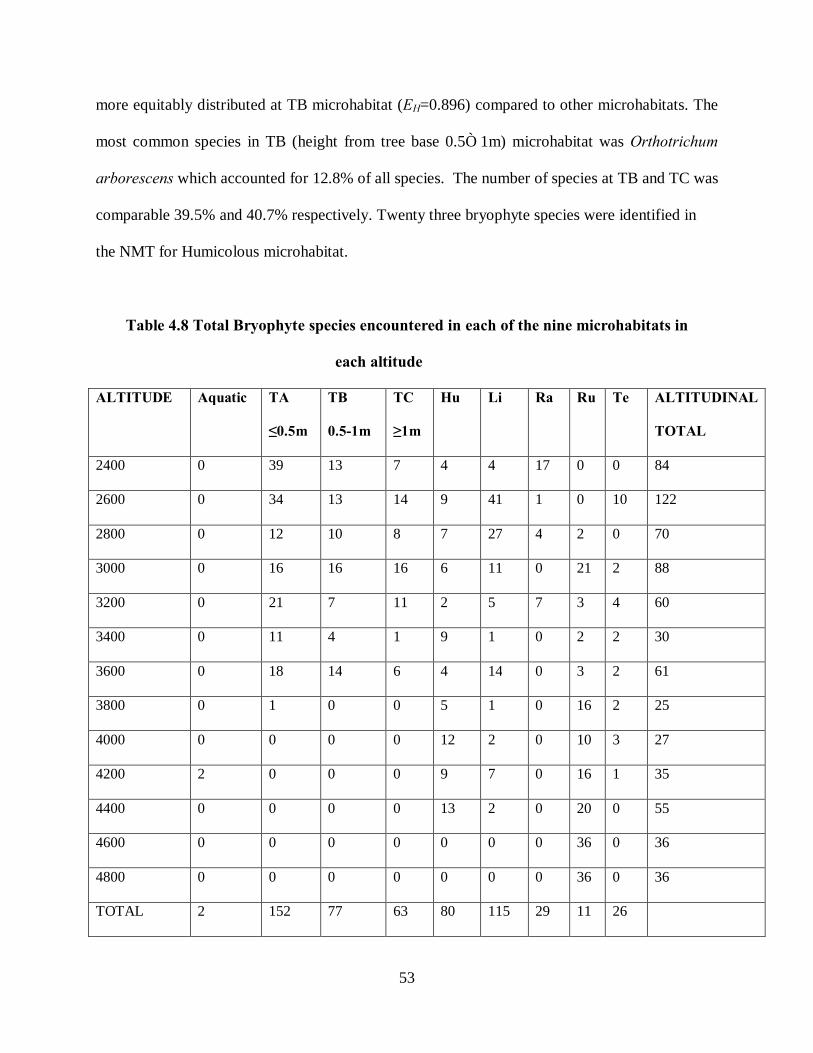
53
more equitably distributed at TB microhabitat (EH=0.896) compared to other microhabitats. The
most common species in TB (height from tree base 0.5≤ 1m) microhabitat was Orthotrichum
arborescens which accounted for 12.8% of all species. The number of species at TB and TC was
comparable 39.5% and 40.7% respectively. Twenty three bryophyte species were identified in
the NMT for Humicolous microhabitat.
Table 4.8 Total Bryophyte species encountered in each of the nine microhabitats in
each altitude
ALTITUDE Aquatic TA
≤0.5m
TB
0.5-1m
TC
≥1m
Hu Li Ra Ru Te ALTITUDINAL
TOTAL
2400 0 39 13 7 4 4 17 0 0 84
2600 0 34 13 14 9 41 1 0 10 122
2800 0 12 10 8 7 27 4 2 0 70
3000 0 16 16 16 6 11 0 21 2 88
3200 0 21 7 11 2 5 7 3 4 60
3400 0 11 4 1 9 1 0 2 2 30
3600 0 18 14 6 4 14 0 3 2 61
3800 0 1 0 0 5 1 0 16 2 25
4000 0 0 0 0 12 2 0 10 3 27
4200 2 0 0 0 9 7 0 16 1 35
4400 0 0 0 0 13 2 0 20 0 55
4600 0 0 0 0 0 0 0 36 0 36
4800 0 0 0 0 0 0 0 36 0 36
TOTAL 2 152 77 63 80 115 29 11 26

54
Table 4.9 Distribution and evenness of Bryophyte species between microhabitats
Lepodontium pungens was the most abundant species in this microhabitat accounting for 18.8%
of all species followed closely by Aulacomnium turgidum accounting for 14.1%, species were
more equitably distributed (EH=0.765). The most shared species were Orthotrichella cuspidata,
Neckera spp. and Porotrichum usagarum. There were 25 species in lignicolous with a diversity
index of (H´=2.623). Species diversity varied notably across the microhabitats while equitability
of the species was fairly even across them.
4.6.6 Species assemblage relationship at microhabitats
TA and TB were the most closely related microhabitats in the NMT ecosystem sharing 28.4% of
all bryophyte species identified. TC and TA are the second most related sharing 23.5% of all
bryophyte while TB and TC share 23.3% of all bryophyte species identified in the study. The
Microhabitats Aq Hu Li Ra Ru TA TB TC Te
Number of species 1 23 25 14 21 36 32 33 8
Shanon Weiner
diversity
index(H´)
0.000 2.399 2.623 2.107 2.354 3.111 3.017 3.018 1.434
Evenness 0.000 0.765 0.815 0.799 0.707 0.868 0.890 0.863 0.690
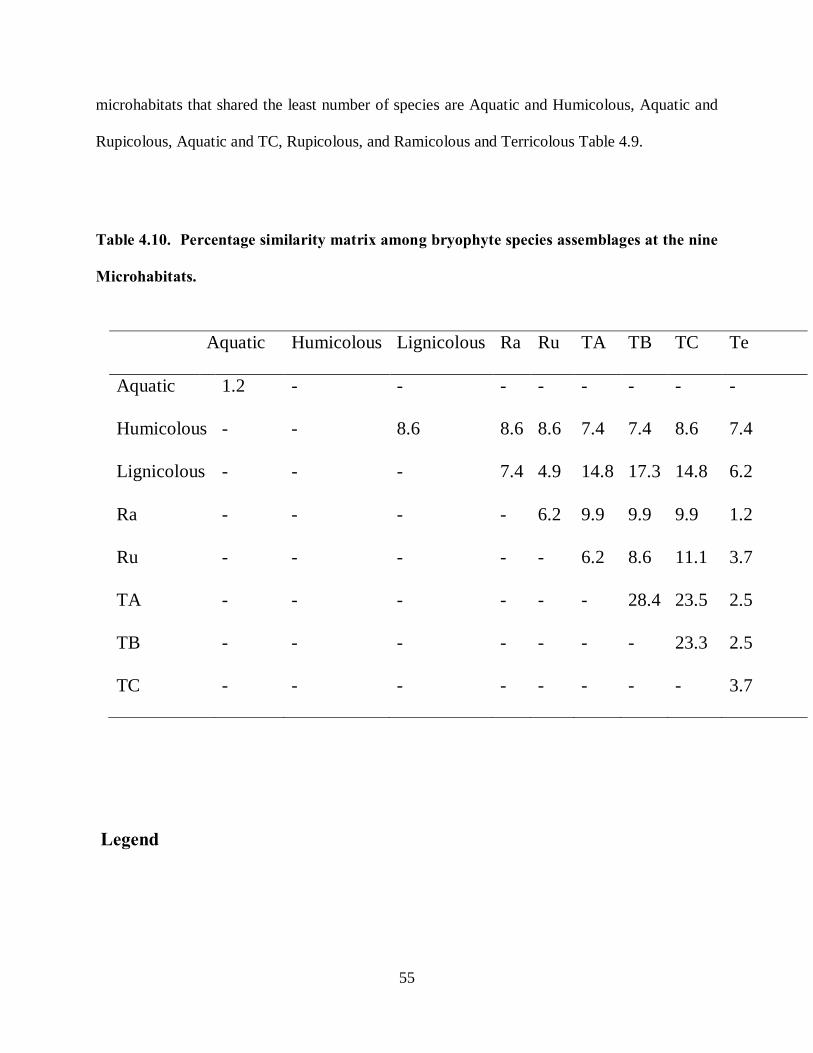
55
microhabitats that shared the least number of species are Aquatic and Humicolous, Aquatic and
Rupicolous, Aquatic and TC, Rupicolous, and Ramicolous and Terricolous Table 4.9.
Table 4.10. Percentage similarity matrix among bryophyte species assemblages at the nine
Microhabitats.
Legend
Aquatic Humicolous Lignicolous Ra Ru TA TB TC Te
Aquatic 1.2 - - - - - - - -
Humicolous - - 8.6 8.6 8.6 7.4 7.4 8.6 7.4
Lignicolous - - - 7.4 4.9 14.8 17.3 14.8 6.2
Ra - - - - 6.2 9.9 9.9 9.9 1.2
Ru - - - - - 6.2 8.6 11.1 3.7
TA - - - - - - 28.4 23.5 2.5
TB - - - - - - - 23.3 2.5
TC - - - - - - - - 3.7

56
Bryophytes growing: Near or in water- Aquatic (Aq), on Humicolous (Hu), on lignified stems
that have not started rotting as Lignicolous (Li), on branches or twigs of trees as Ramicolous
(Ra),
on rock surfaces or crevices as Rupicolous (Ru), on the ground as Terricolous (Te),
on height of tree from tree base ≤0.5m as (TA), on of tree height from tree base 0.5 ≤1m as (TB)
and on of tree height from ≥1m as (TC).
4.6.7 Bryophyte species density and evenness
Bryophytes had densities varying in all altitudes from 0.4 to 14 as shown in Figure 4.9.
At altitudes 2600m, 4600m and 4800m the density was highest and same while at 4000m it was
lowest. On the overall, the altitudes that had the most number of bryophytes observed were 2400
and 3000m asl where each recorded 350 numbers of specimens.

57
Figure 4.7 Bryophyte density variations by altitude
Overall plant distribution along NMT, Mt. Kenya.
There were four major categories of plants found on Naro Moru Track of Mt. Kenya.
Representatives of each category are shown in Figure 6 (a-d);

58
(a)Bryophyta (Marchantia porllymophia ) (b) Pteridophyta (Lycopodium saururus JPG)
(By auther) (http// commons.wikimedia.org)
(c) Gymnospermae (Podocarpus latifolius) (d) Angiospermae (Isolepis setacea)
(By auther) (By auther)
Figure 10 (a-d) Diversity of plant categories and their classification as observed on Naro
Moru Track, Mt. Kenya.
4.7 Scientific classification and key differentiating characaters of representative members of bryophytes and tracheophytes
Machantia pollymophia Lycopodium saururus
Kingdom Plantae Kingdom Plantae
Division Machantiapsida Division Lycopodiophyta
Class Jungermanniopsida Class Locopodiapiatae

59
Order Machantiales Order Locopodiales
Family Polysporangiates Family Locopodiaceae
Genus Machantia Genus Locopodium
Species Machantia pollymophia Species Locopodium saururus
The thallus is the sexual generation, Reproduces by use of rhizomes.
Lacks stomata in its sporophyte Alkaloids used in chemical
generation. Most universally recognized classification
Liverwort. Used in liver treatment.
It also reduces erosion at the stembank.
Podocarpus latifolius Isolepis setacea
Kingdom Plantae Kingdom Plantae
Division Tracheophyta Division Angiospermae
Class Coniferopsida Class Monocots
Order Coniferales Subclass Commlinids
Family Podocarpaceae Order Poales
Genus Podocarpus Family Cyperaceae
Species Podocarpus latifolius Genus Isolepis
Podocarpus latifolius grows in an Species Isolepis setacea
upright, weeping habit to 30-40 m Because of its fibrous root system,
tall in its native habitat. Hosts it binds the soil together reducing
Neckera species soil erosion. It is also medicinal for
stomach ailments.

60
In summary, the overall plant distribution can be represented on the graph as shown in Figure 4.8
which shows that tracheophytes and bryophytes do exist in almost equal numbers on Naro Moru
track and also their trend in abundance is similar. The trend between 2400m and 3200m asl,
shows that, at the beginning they both start in large numbers and decrease at 2800m, then shoot
up at 3000m.Then tracheophytes stable off between 3200 and 3400 but bryophytes keep a sharp
decreasing trend after 3600m asl to the end with little increase at 4400m asl. Tracheophytes
shoot up abit at 4000m asl then stagnates at 4600 and disappears completely at 4800m asl.
Figure 4.8 Summary of distribution of Tracheophytes and Bryophytes on NMT,
Mt. Kenya.
0
5
15
20
25
0 1000 2000 3000 4000 5000 6000Altitude
Tracheophytes Bryophytes
30
10

61
CHAPTER FIVE
DISCUSSION, CONCLUSIONS AND RECOMMENDATIONS
5.1 Introduction and purpose of the study
This study found out that tracheophytes and bryophytes do exist almost in equal numbers on
Naro Moru track as they are 83 and 81 species respectively. Tracheophytes acted as a home for
bryophytes whereas bryophytes supplied water to them (Mwangi, 2008). (Those growing
alongside water streams as Aquatic (Aq), on Humicolous (Hu), on lignified stems that have not
started rotting as Lignicolous (Li), on branches or twigs of trees as Ramicolous (Ra), on rock
surfaces or crevices as Rupicolous (Ru), on the ground as Terricolous (Te), on height of tree
from tree base ≤0.5m as (TA), on tree height from tree base 0.5 ≤1m as (TB) and on tree height
from ≥1m as (TC), these TA, TB, TC and Ra are collectively refered to as corticolous). In total
Corticolous bryophytes ranked highest in number, followed by Lignicolous and Humicolous.
The percentage of the species that thrived on tracheophytes whether alive or dead, and their
related materials was 70%; this implies that out of the 81 species identified on NMT, about 57 of
them were hosted by tracheophytes or its related materials like humicolous and lignicolous
bryophytes (Tables 8 and 9). This agreed with Mwangi (2008) where he stated that pendant
bryophytes species in Mt. Marsabit constituted 50% of all the bryophytes he identified. Some
bryophyte species that existed on their own known as Terricolous were; Warnstorfia sarmentosa,
Syntichia cavallii and as Aquatic; Philonotis fontana.
From these findings broadly, it can be believed that trees form the major structural and functional
basis of Mt. Kenya tropical forest ecosystems. This could serve as robust indicators of changes

62
and stressors at the landscape scale. In this study the spatial heterogeneity of diversity, could
have been the result of some underlying pattern or process such as biotic control, and
abiotic/biotic coupling process with spatial patterns of species richness. And this could be
extensively used to identify Mt. Kenya as a biodiversity hotspot. Therefore the assumption was
that managing an area of high species richness as was observed on Mt. Kenya, could be equated
to improved conservation outcomes. The plant richness on Mt. Kenya was a positive predictor of
a place of conservation value as indicated in this results which can be defined as a place where
species of interest are abundant. Therefore this project provides an understanding of species
diversity and distribution patterns that is important for helping managers to evaluate the
complexity and resources of Mt. Kenya forests.
5.2 Distribution of Bryophytes and Tracheophytes along NMT, Mt. Kenya.
Bryophytes were the most dominant plant group (Table 4.1and Figure 4.5), and were distributed
into organized micro-habitats. Vertically from 2400 to 4800m, the bryophyte species richness
decreased with altitude. This was attributed to the fact that the bryophyte microhabitats also
decreased on the same basis as the species composition is distinct among the microhabitats
investigated (Table 4.8). In the study of the Rumoka Volcano in the Democratic Republic of
Congo, it was reported that the mosses were neglected by samplers despite the vegetation group
being dominant in number and abundance (Skottsberge, 1927). In this study, mosses comprised
about 36% out of the 73 families identified on the track.
63
Bryophyte species richness, just as that of tracheophytess species, decreased with increase in
altitude (Table 4.7). At 2400m, both plant groups were at optimum diversity numbers with
bryophytes having 28 species (Figures 4.2 and 4.3) while tracheophyte plants had 24 species.
Actual species of tracheophytes have been documented in Appendix II. Diversity decreased until
there were only two bryophyte species (Grimmia longirostris and Andreaea mildbraedii) and one
vascular plant (Senecio purtschelleri) species at 4600m. However, the decrease in bryophyte
numbers between 2400 and 2800 in this region may be attributed to the distruction by large wild
animals like Loxondonta africana that graze a lot and scratch themselves against the trees and
logs which are the main hosts of bryophytes in the process the bryophytes are destroyed. These
results were consistent with those Frahn, (1990c) who noted changes in species composition as
floristic discontinuities. In this study, 2400 and 4800m were the altitudes at which maximum
number of species had their upper most and lower most occurrences respectively; they were
regarded as the altitudes with the highest degree of floristic change. This study also agreed with
Poc´s (1994) on the altitudinal distribution of bryophytes on Mt. Kilimanjaro in which most
bryophyte species were found between comparatively similar altitudes of 2400 and 5050 m).
The findings also agreed with Ah-Peng (2005) in which it was observed that altitudes above
750m on the East African continent could be compared well with those between 250m and 850m
on the lava flows of La Reunion. These results were also consistent with those by Grytnes et al.,
(2006) who stated that altitude influenced the biodiversity of Mt. Kenya. Similarly, these results
also agree with those of (Grytnes et al., 2006) on Mount Kinabalu who noted that plant richness
was influenced by elevation.
64
5.3 Influence of altitude on diversity and distribution of Bryophytes and Tracheophytes
The overall plant richness on the NMT varied significantly (P≤0.000) between plant categories
because of the altitudinal variance that accompanied the mountain ascend. Bryophytes recorded
the highest average richness (13.69) while gymnosperms recorded the least (0.92) (Table 4.2).
Species richness was highest at 3000m and lowest at 4800m with averages of 15.75 and 0.5
respectively. This may be accorded to the favorable climatic conditions that prevail at lower
altitudes and the unfavorable at higher altitudes. Species richness was similar at 3200m (10.25)
and 3600m (10.00) because this seems to be the transitional zones between Montane and
Subalpine zones. The tracheophytes are reducing due to the changing precipitation and soils;
(Mahaney, 1987 and Speck, 1986) found out that soils of Mt. Kenya show altitudinal zonation
and the land elevation determines the type of soil as a result of volcanic activities.
The number of shared species between altitudes was highest between 2400 and 3600m but
gradually decreasing with rise in altitude. This is because most of the bryophytes are hosted by
tracheophytes or tracheophyte related materials; (Bryophytes growing , on Humicolous (Hu), on
lignified stems that are not completely decomposed as Lignicolous (Li), on branches or twigs of
trees as Ramicolous (Ra), on height of tree from tree base ≤0.5m as (TA), on tree height from
tree base 0.5 ≤1m as (TB) and on of tree height from ≥1m as (TC).)Ra, TA, TB and TC
(collectively referred to as corticolous) or Hu and Li. The tracheophyes that hosted bryophytes
most were; Sinnarundinaria alpina, Podocarpus latifolius, Podocarpus falcatus and Ericaceae
spp. This also proved a point whereby out of 13 microhabitats for bryophytes, six were
tracheophye related. Between 2800m and 3200m, 80% of all the species of tracheophytes

65
identified in the ecosystem were observed implying that also most of the tracheophytes occured
here; (Table 4.3).
The bryophyte population increased again at 3600m and dropped at 3800m because at this
altitude, the Bog/moorland area starts and Ericaceaous spp. hosts almost all the bryophyte spp. as
TA, TB, TC and Ramicolous, Rupicolous are few. However the bryophytes remained relatively
constant between 3800 and 4400m which may be attributed to the presence of montane to
subalpine region and the tracheophytes dominating have little lignin in their stems (eg Grasses,
Alchemillas, Giant Senecio and Lobelia spp.) hence hardly able to provide a home for
bryophytes; the only microhabitats in this region for bryophytes were Rupicolous and to the least
Aquatic. The type of rain experienced in this region is in form of hailstones or snow; this also
has made it almost impossible for the survival of tracheophytes hence their low lifeforms.
5.4 Variation of bryophyte diversity by microhabitat
In the higher altitudes (4400m to 4800m) stones were frequent in most of the sampled areas and
only two species Grimmia longirostris and Andreaea mildbraedii were the ones observed to be
adapted to rocky/stone life. These also were the most common species on the NMT ecosystem
occurring in 8 and 7 altitudinal levels respectively. Nekera spp. was the most abundant in the
lower altitudes (2400-3200m.a.s.l) accounting for 5.2% of all bryophyte species identified
because this was found to be growing on the tree species of (corticolous) both the Podocarpus
and Sinnarundinaria alpina occupying the first three metres of the over forty metre tall trees.

66
Bryophytes growing alongside water streams as Aquatic (Aq), on Humicolous (Hu), on lignified
stems that have not started rotting as Lignicolous (Li), on branches or twigs of trees as
Ramicolous (Ra), on rock surfaces or crevices as Rupicolous (Ru), on the ground as Terricolous
(Te), on height of tree from tree base ≤0.5m as (TA), on of tree height from tree base 0.5 ≤1m as
(TB) and on of tree height from ≥1m as (TC). At 3800m asl, hosted the most bryophytes
because in this region there is a lot of decomposing humus from the Hyperemia grass covering
the ground, while Ru microhabitats hosted more bryophytes in the higher altitudes (4600 and
4800m) as they are the only habitats, whereas Li and Corticolous hosted more bryophytes in the
lower altitudes (2400-3400m) because most of the bryophytes here are pendant. Aquatic
microhabitat was sited only once at 4200m.
At 2400m, TA hosted a higher number of bryophytes because this is the first 1m height on the
trees where there is least wild animal disturbance and conducive moisture content for survival.
Bryophyte diversity between the nine microhabitats at this altitude was however statistically
significant (P≤0.039) (Table 4.3).
Between 3200m and 3400m, there was a significant increase in the distribution of bryophytes
due to the presence of Sinnarundinaria alpina which is host to most corticolous bryophytes. The
bamboo is host the humicolous hence these two habitats to have similar bryophyte densities. Li,
TC, Te and Ra had lower bryophyte densities compared to Hu and TA because this is an area
where many wild animals graze and also a camping site. The game animals use the trees to
scratch their backs thus destroying the bryophytes that occupy this height and at the same time,

67
at this ascend is where the camp people collect wood to burn for heating the house (Banda) at the
campsite where along with the wood; the small plants carried on are also burnt.
Microhabitats for bryophytes at 3600m were only five namely; (Bryophytes growing on
Humicolous (Hu), on lignified stems that have not completely decomposed as Lignicolous (Li),
on branches or twigs of trees as Ramicolous (Ra), on rock surfaces or crevices as Rupicolous
(Ru), on height of tree from tree base ≤0.5m as (TA), on of tree height from tree base 0.5 ≤1m as
(TB) and on of tree height from ≥1m (TC).) here referred to as corticolous bryophytes were
most at 73% because this is a transition area between montane and sub-montane and the stony
ground is just at introductory stage, rupicolous plants are not much thus hosting only 17% as
compared to the upper altitudes; while humus and decaying wood were 2% and 8% respectively.
The temperatures at these higher altitudes were also unfavorable for decomposition process since
temperatures are decreasing to lower values. It is also observed that most of the game animals
graze upto here the reason why TC hosts zero. Sphagnum spp were the only terricolous
bryophytes, here seems to have been trampled on by the game until it was not observed in the
samples hence its percentage occurrence here was zero.
At 3800m, 52% of bryophytes were mainly rupicolous because there were very few angiosperms
which did not offer habitation to bryophytes that is Ericaceae family. The rest of the
microhabitats; humicolous hosted 20% while Li, TA, TB and Te were equal each contributing
7% of all bryophytes implying that the rocky area has completely set in and only Rupicolous
bryophytes can survive in this area successfully. Rupicolous and humicolous hosted over 80% of
all bryophytes identified at 4000, 4200 and 4400m.whereas all bryophytes identified between

68
4600 and 4800 m were rupicolous because this is entirely an alpine region with soil type as very
dark stony loams with high content of organic matter and low bulky density (Lithosols &
Regosols) not much is expected for the angiosperms; angiosperms do not have adaptive features
like bryophytes. Bryophyte densities varied significantly (P≤0.05) between microhabitats in
these altitudes as shown in Table 4.6.
There was a significant contribution of microhabitat to bryophyte species distribution in the
NMT ecosystem. TA microhabitat hosted the highest diversity of species (H=3.1106) whereas
Aq hosted the least (H=0) on the overall, this signifies that tracheophytes are the main hosts for
the bryophytes regardless of their life statuses. Soil contributes to the habitation of bryophytes as
second last to the Aquatic microhabitat. Orthotrichum arborescens which accounted for 12.8%
of all species being hosted by angiosperms at the height of 0.0 ≥1 (TA &TB) on their stems
suggests that if these angiosperms are destroyed, this species will also decline in existence. The
number of species at TB and TC was comparable 39.5% and 40.7% respectively because these
are areas above the ground and not so much moisture from the ground reach this area,
cryptogams here make use of their retained water reservoirs. This is a cutting edge for
bryophytes over the other plants. Twenty three bryophyte species were identified in the NMT
from humicolous (Table 4.7). Leptodontium pungens being the most abundant species accounted
for 18.8% of all species followed by Aulacomnium turgidum which accounted for 14.1%, species
hence equitably distributed (EH=0.7651), this shows how important is the angiosperms as a home
for the Bryophytes which in turn are as important in the water cycles of Mount Kenya. The most
shared species were Orthotrichella cuspidata, Neckera sp and Porotrichum usagarum. All were
hosted by angiosperms and gymnosperms. In all, 74.2% of all the species of bryophytes

69
identified in the study were hosted by angiosperms and gymnosperms; the more reason why the
higher plants should not be destroyed anyhow.
5.5 Vascular Plants
Of the three categories of vascular plants identified under the study, gymnosperms and
angiosperms play a major role in hosting cryptogams while pteridophytes do not host the plants
at all. However, pteridophytes were also hosted by angiosperms such as Lycopodium clavatum
which was hosted by Dombeya torrida at 3600m. The study also noted a wider distribution,
richer diversity and a higher evenness of species of tracheophyte plants in the lower and mid
altitudes (2400-3800m.) just as was with the bryophytes than higher altitudes (4000 -4800m.)
and this proves how the two plant categories closely associate with each other; therefore in
conservation of the higher plants; the small ones should be our core concern too.
5.6 Conclusion and Recommendations
5.6.1 Conclusion The aim of this study was to establish the taxonomic and ecological relationship between
bryophytes and tracheophytes along western slope of Mt. Kenya and this has been determined
whereby the study revealed that NMT of Mount Kenya harbors a high diversity of bryophytes
and tracheophytes 81 and 83 in percentage it is 50 and 49 respectively, which contribute
significantly to the overall biodiversity of the ecosystem. The hygroscopic capacity of
bryophytes is 13% (Mwangi 2008) and their high water interception capacity which they release
at intervals to maintain the tracheophytes in dry spells is of great importance in maintaining the

70
forest moisture index. The study has also demonstrated that the diversity and distribution of
bryophytes and the tracheophytes is influenced firstly by altitude and secondly by the
microhabitats provided by natural features such as bogs, rocks and the tracheophytes themselves.
Bryophytes tend to be host specific and hence tracheophytes are host to specific bryophytes. The
conservation of the two is therefore inter-twined and crucial for the ecological functioning of the
mountain forests ecosystems. Therefore, the taxonomic and ecological information as provided
in this study may be vital in laying down of the strategies to conserve Mt. Kenya.
Loss of woody vegetation cover, especially of tracheophytes in Mt Kenya forest will result in
microclimate modification and the loss of substrates and habitats required for the survival of the
bryophytes since 80% of the bryophytes are hosted by the tracheophytes/tracheophyte related
materials. Water from Mt. Kenya is currently required to feed springs, rivers, marshes and other
wetlands downstream. Therefore, the taxonomic information of the less studied and less
appreciated groups is essential in laying down the strategies to conserve Mt. Kenya.
5.6.2 Recommendations
1 This was the first comprehensive study of bryophytes and their relationship with altitude, and
distribution of tracheophytes in Mt Kenya. However, in order to determine the overall Mt.
Kenya forest health, more statistical correlations are required along the track and along other
routes to the peaks of Mt. Kenya. It is therefore recommended that such studies be carried out
on other routes to Mt. Kenya so as to have a better understanding of the contribution of
bryophytes to the mountains forest biodiversity as well as its ecological and hydrological
functions.

71
2 Monitoring of the mountain’s biodiversity is recommended at reasonable intervals to
establish the fluctuations of the two plant groups. This may be of importance in establishing
the rainfall patterns on the mountain and to explain, such phenomena as erratic flooding of
the rivers downstream, drought and other climate related changes. This information will be
useful in the selection of appropriate conservation strategies, including enrichment of tree
species. Monitoring epiphyllous bryophytes in particular will help to understand effects of
forest degradation and climate change.
3 Results from this project should be incorporated into the Agro-forestry programs and County
forest policy framework in Mt. Kenya region; to involve local people on the need to conserve
and sustainably utilize the forest resources. This is because, the demand for wood, timber and
medicinal forest products as well as burning of charcoal and growing of Cannabis sativa are
serious threats to the forest reserve. Cultivation of the indigenous trees such as Olea europea
ssp. africana will mitigate against habitat destruction and hence maintain natural substrates
for bryophytes and give the forest a chance to recover its ecological health and eventually
maintain the forest as water tower for the generations to come.
4 Bryophytes are closely linked to their habitats. It is essential to consider the pattern of these
habitats on a broader scale. Maintenance of these microhabitats will mitigate against
disappearance of their affiliated biodiversity on the mountains in totality.
5 Harvesting of Bryophytes in state forests should be strictly monitored and harvesting
regulated.
6 Since bryophytes can be used to control soil erosion, this would be considered in future to
control erosion at the river banks to curb adverse erosions experienced there.

72
REFFERENCES
Abraham, K., Schreyer, W., Medenbach, O., and Gebert, W. (1980). Kulkeit, ein geordnetes
1:1Mixed-Layer-Mineral zwischen Klinochlor und Talk. Fortschritte der Mineralogie, 58:
4-5.
Agnew, A.D.Q. (2013). Upland Kenya Wild Flowers and Ferns. Third Revised Edition. Nature
Kenya the East Africa Natural History Society. 744p.
Agnew, A.D.O. (1985). Cyclic sequence in the plant communities of the Aberdare Mountain,
Kenya. Journal of East Africa History Society, 75 (183): 1-12
Ah-Peng, C., Chuah-Petiot, M., Descamps-Julien B., Bardat J., Stamenoff, P. and Strasberg D.
(2007). Bryophyte diversity and distribution along an altitudinal gradient on a lava flow in
La Réunion. Diversity and Distributions, 13 (5): 654-662.
Ah-Peng, C.and Bardat J. (2005). Check list of the bryophytes of Réunion Island (France).
Tropical Bryology, 26: 89-118.
Ah-Peng, C. (2003). Bryophyte diversity and distribution along an altitudinal
gradient on a lava flow in the Island of Reunion. PhD. University of La Reunion,
Reunion
Andrew, N.R., Rodgerson L. and Dunlop, M. (2003). Variation in invertebrate-bryophyte
community structure at different spatial scales along altitudinal gradients. Journal of
Biogeography, 30 (5): 731–746.
Axmacher, J.C., Holtmann, G., Scheuermann, L., Brehm, G., Müller-Hohenstein, K. and Fiedler,
K. (2004). Diversity of geometrid moths (Lepidoptera: Geometridae) along an Afrotropical
elevational rainforest transect. Diversity & Distributions, 10 (4): 293-302.

73
Bandyopadhyay, J., Rodda, J. C., Kattelmann, R., Kundzewicz, Z.W. and Kraemer, D. (1997).
Highland Waters- a Resource of Global Significance. In: Messerli, B. and Ives, J.D.
(Eds.). Mountains of the World: A Global Priority. New York: Parthenon. 495 pp.
Bates, B., Kundzewicz, Z. W., Wu, S. and Palutikof, J. (2008). Climate Change and Water.
IPCC Technical Paper VI of the Intergovernmental Panel on Climate Change, IPCC
Secretariat, Geneva, Switzerland.
Beck, E., Rehder, H. and Kokwaro, J.O. (1990). Classification and mapping of the
vegetation of the alpine zone of Mount Kenya (Kenya). - Geographica Bernensia African
Studies Series A8. Mt. Kenya Area.
Beentje, H.J. (1988). An Ecological and Floristic study of Taita Hills, Kenya Utafiti, 1:23- 66.
Beentje, H.J. (1994). Kenya Trees, Shrubs and Lianas. Nairobi: National Museums of Kenya,
722pp.
Blackett, H.L. (1994). Forest Inventory Report No.11: South Nandi and Ururu Forest –KIFCON.
Bussmann, R.W. (1994). The forests of Mount Kenya (Kenya). Vegetation, ecology, destruction
and management of a tropical forest ecosystem. Ph.D. Thesis, Bayreuth University,
Germany.
Bussmann, R.W. (1993). The forests of Mount Kenya (Kenya) - A phytosociological approach
with special reference to ecologial problems. Diplomarbeit, Universität Tübingen, 1-119.
Chuah, M.S. (2003). Mosses, Liverworts and Hornworts of Kenya. Journal of East African
Natural History, pp273.
Chuah, M.S., (2000). Western Mount Kenya Bryophytes II. Journal of East African Natural
History, 83(2): 199-208

74
Chuah, M.S., (1994). Western Mount Kenya Bryophytes II. Journal of East African Natural
History, 83(2): 199-208
Coe, M.J.(1967). The Ecology of the Alpine Zone of Mount Kenya. In: P. Van Oye (Ed.)
Monographiae Biologicae. Volume 17. Dr.W. Junk Publisher, The Hague.
Decurtins, S. (1992). Hydrographical investigations in the Mount Kenya subcatchment of the
Ewaso Ngiro River. Geographica Bernensiaca - African Studies Series.
Decurtins, S. (1985). Hydrogeographical Investigations on Mt. Kenya and its W and NW Slopes,
Laikipia Reports No.5, Institute of Geography, University of Berne.
Eco-Ethics International Union (EEIU) Mt. Kenya — Eastern and Central Kenya Integrated
Conservation and Development Plan — Operation Plan (2004-2007). Inter- Research
Science.
Emmerton, L. & McCarter, P. (1994). Summary of the Current Value of use of the MauForest
Complex - KIFCON.
Erwin, T.L. (1982). Tropical forests: Their richness in Coleoptera and other arthropod species.
The Coleopterists Bulletin, 36 (1): 74-75.
FAO. (1996). Forest Resources Assessment 1990 - Survey of tropical forest cover and study of
change processess. FAO Forestry Paper No. 130. Rome.
Fowler, D., Cape, J.N. and Unsworth, M.H. (1989-9). Deposition of atmospheric
pollutants on forests. Philosophical Transactions of theRoyal Society, 324: 247–265.
Frahm, J. P. (1990c). The altitudinal zonation of bryophytes on Mt. Kinabalu. Nova Hedwigia
51: 133-149.

75
Fries, R.E. and Fries T.C.E. (1948). Phytogeographical researches on Mt. Kenya and Mt.
Aberdare, British East Africa. Kungl. Svenska Vetenskapsacadamien Handlingar III. 25:
1-83.
Fries, T. H. and G. H. Rodda. (1998). The role of introduced species in the degradation of
island. Annual Review of Ecology and Systematics 29:113-140.
Gathaara, G.N. (2000). Aerial Survey of the destruction of Mt. Kenya, Imenti and Ngare Ndare
Forest Reserves (A Five Year Report for KWS (2004). Plant strategies and vegetation
processesDanuše Hodáňová, pp.254.
Grime, J.P. (1979). Plant Strategies and Vegetation Processes. Wiley, Chichester.
Grubb P. J. (1977). Control of forest growth and distribution on the tropical mountains: With
special reference to mineral nutrition. Annual Review of. Ecological systematics, 8:83-
107.
Grytnes, J. A. Heegaard, E. and Ihlen, P.G. (2006). Species richness of vascular plants,
bryophytes and lichens along an altitudinal gradient in western Norway. Acta
Oecology, 29: 241–246.
Hallingbäck, T. and Hodgetts, N. (compilers). (2000).Mosses, Liverworts, and Hornworts. Status
survey and conservation action plan for bryophytes IUCN/SSC Bryophyte Specialist
Group. IUCN, Gland, Switzerland and Cambridge, UK. 106pp.
Hallingback, T. & Hodgetts N. (2000). Status survey and conservation action plan for Mosses,
Liverworts & Hornworts. IUCN/SSC Bryophytes specialist group. IUCN, Gland,
Switzerland and Cambridge, UK in collaboration with the Swedish Threatened Species
Unit.
Hastenrath, S. (1984). The Glaciers of Equatorial East Africa. Reidel. 353p; Wass, P. ed.

76
1995.
Hedberg, O. (1995). Features of Afroalpine Plant Ecology. Journal of East African
Natural History, 85(1):81-86.
Hedberg, O. (1969). Evolution and speciation in a tropical high mountain flora. Biological
Journal of the Linnean Society. 1(1-2): 135–148.
Hedberg, O. (1951). Vegetation belts of the East African mountains. Srensk Tidskr., 45:140-199.
Hemp, A. (2006). International Human Dimensions Program on Global Environmental Change.
(IHDPGEC) Report.
Hemp, A. (2006). The banana forests of Kilimanjaro. Biodiversity and Conservation 15 (4):
1193-1217.
Hope, G. (1980). The vegetational history of Mt.Wilhelm, Puepua New Guinea. Journal of
Ecology. 64:627-663
Houghton RA, Unruh JD, Lefebvre PA. (1993). Current land use in the tropics and its
potential for sequestering carbon. Global Biogeochemical Cycles 7: 305-320
Johns, R. J. (1982). Plant Zonation. IN: J. Gressitt (Ed.), Biogeography and Ecology of New
Guinea. Dr. W. Junk Publishers, The Hague, 309-330.
Judd, W. S., Campbell, C. S., Kellogg, E. A., Stevens, P. F. and Donoghue, M. J. (2002).
Plant Systematics: A Phylogenetic Approach, 2nd edition. Sinauer Associates, Inc.,
Sunderland.
Kaboli, M. (2006). Species diversity and life form patterns along 3000 m altitudinal gradient in
the steppe vegetation of southern slopes of the Alborz Mountains, Iran. Folia
Geobotanica 48: 7-22, DOI 10.1007/s12224-012-9133-1.
Kapos V., Rhind J., Edwards M. and Price MF. (2000). Developing a map of the world’s

77
mountain forest. In: Price MF and Butts N, editors. Forest in Sustainable Mountain
Development: A State of Knowledge Report for 2000. Wallingford, UK: Commonwealth
Agricultural Bureau (CAB) International.
Kattelmann, R., (1993), Role off snowmelt in generating streamflow during spring in
East Nepal, IAHS Publishers, 218pp.
Kenya Wildlife Service Strategic Plan (2010). Kenya Wildlife Service Gecko Publishing
(formerly Travel Africa).
Kenya Wildlife Service; A Five Year Report for KWS (2004). Management and Organizational
Behavior; 4th Edition London; Pitman.
Kenya Wildlife Service Report August (1999). Aerial Survey of the Destruction of Mount
Kenya, Imenti and Nacre Ndare Forest Reserves. Land AND Marine Publications Ltd.
Kessler, M. (2001). Patterns of diversity and range size of selected plant groups along an
elevational transect in the Bolivian Andes. Biodiversity and Conservation 10 (11), 1897-
1921, 2001. 126, 2001.
Knapp, R. (1973). Die Vegetation von Afrika unter Berücksichtigung von Umwelt,
Entwicklung, Wirtschaft, Agrar- und Forstgeographie. G. Fischer. Jena. 626 pp
Körner, Ch. (2002). “Mountain biodiversity: its causes and function,” in Mountain Biodiversity:
a global assessment, edited by Körner Ch and Spehn EM, Parthenon, London, New York.
Kruckberg, A.R. and Robson, A. (1986). An essay: The stimulus of unusual geologies for plant
Speciation. Systems Botany, 11: 455 – 463.
Kruskal, J. B. (1964). Multidimensional scaling by optimizing goodness of fit to a nonmetric

78
hypothesis. Psychometrika. 29 (1): 1-27.
Kundzewiez, Z. W. and Robson, A. (ed.) (2000). Detecting trend and other changes in
hydrological data. World Climate Programme: Water, World Climate Programme Data
and Monitoring, WCDMP-45, WMO/TD no. 1013.
Langdale-Brown, I., Osmaston, H.A. and Wilson, J.G. (1964). The vegetation of Uganda
and its bearing to land-use. Entebbe Government Printers, Uganda 159pp.
Lassau, S.A., Cassis, G., Flemons, P.K.J., Wilkie, L. and Hochuli, D.F., (2005). Using high
resolution multi-spectral imagery to estimate habitat complexity in open-canopy
forests: can we predict ant community patterns? Ecography, 28 (4): 495–504.
Levins, R. (1968). Evolution in Changing Environments; Some Theoretical Explorations.
Princeton, NJ: Princeton Univ. Press. 120 pp.
Leps, J. S. milauer, P. (2003). Multivariate analysis of ecological data using CANOCO.
Cambridge University Press web page).
Lind, E.M and Morission, M.E.S, (1974). East African Vegetation. Longman Group Limited.
Great Britain 257pp.
Lomolino, (2001), Elevation gradients of species-diversity:Historical and prospective views“.
Global Ecology & Biogeography 10: 3-13.
Longmann, K.A. and Jenik, J. (1974). Tropical forest and its environment. Longman, London.
160 pages Publisher: Longman Group, United Kingdom.
Lovett, J. C., Hansen, J. R. and Horlyck, V. (2000). Comparison with Eastern Arc Forests. In:
Burgress N.D.and G. P. Clarke (eds.) Coastal forests of Eastern Africa World
Conservation Union. Issue, 115-125. Publication Services Unit. Cambridge.

79
Magurran, A.E. (1988). Ecological diversity and its measurements. Princeton University Press.
London.
Mahaney, W.C. (1987). Behaviour of the African Buffalo on Mount Kenya. African Journal of
Ecology, 25: 199–202.
May, Robert M. (1986). The search for patterns in the balance of nature: advances and
retreats. Ecology 67:1115-1126.
McCain C.M. & Grytnes, J.-A. (2010). Elevational gradients in species richness. In:
Encyclopedia of Life Sciences - Ecology. John Wiley & Sons, Ltd.
Mazingira News. (2008). A joint Publication of the Ministry of Environment and Mineral
Resources & Ministry of Forestry and Wildlife Issue No. 004.
McCain C.M. & Grytnes, J.-A. (2010). Elevational gradients in species richness. In:
Encyclopedia of Life Sciences - Ecology. Jonsson, R. (ed). John Wiley & Sons, Limited,
10 pp.
Mittermeier, R. A., N. Myers, Gill, P. C. and Mittermeier, C. G., (2000). Hotspots: Earth's
Richest and Most Endangered Terrestrrial Ecoregions. Mexico City CEMEX. Mexico
City: CEMEX.
Mountain Agenda and Paul Haupt, (1998). Mountains of the World: water towers for the twenty-
first century. : A contribution to global freshwater management. Lead Authors; Liniger,
H.P., Weingatner, R. and Grosjean, M. Institute of Geography. Bern: Uniersity of Bern.
Mountain Agenda. (1997). Mountains of the World: Challenges of the 21st century. A
contribution to chapter 21 Agenda 21. Institute of Geography. Bern: Uniersity of Bern.
Moreau, R. (1944). Mt. Kenya: A Contribution to the Biology and Bibliography. Journal of East
Africa National History Society, 18(1 and 2): 61-92.

80
Mulkey, S.S., A.P. Smith, & T.P. Young. 1984. Predation by elephants of Senecio keniodendron
in the alpine zone of Mount Kenya. Biotropica 16: 246-248. 10.
Munishi, P.K.T. and Shear, T.H. (2004). Carbon storage in Afromontane rain forests of the
Eastern Arc montains of Tanzania; Their net contribution to atmospheric carbon. Journal
of Tropical Forest Science, 16 (1):78-93.
Mwangi, M.H. (2008). Bryodiversity of Mount Marsabit forest and Bryophyte mist trapping
assessment. M.Sc. thesis, University of Nairobi, Department of Plant Taxonomy and
Economic Botany. Nairobi, Kenya.
Myers, N. (1988). Threatened biotas: “Hot spots” in tropical forests. The Environmentalist.
Volume 8. (3) pp.188-208.
Newmark, W. D. (2002). Conserving Biodiversity in East African Forests: a Study of the Eastern
Arc Mountains. Springer Verlag, Ecological Studies. Vol. 155.
Norman H. Nie, C. Hadlai (Tex) Hull and Dale H. Bent. (2007). Statistical Package for Social
Sciences (SPSS) 16.0. Wiley Publishing, Inc.
Ohsawa, M. (1990). An interpretation of latitudinal patterns of forest limits in south and East
Asian mountains. Journal of Ecology 78: 326–339.
Osborne, P.E., Foody, G.M. and Suarez-Seoane, S., (2007). Non-stationarity and local
approaches to modelling the distributions of wildlife. Journal of Wildlife Management,
66: 912–918
O’Shea, B.J. (1999) Check-list of sub-Saharan Africa (version 3 11/99 tropical Bryology
Research Reports 1:1-133
Pharo, E.J. and Beattie, A.J. (1997). Bryophyte and lichen diversity: a comparative study.
81
Australian Journal of Ecology van den Bergh,Maurits B. Institute for Biodiversity and
Ecosystem Dynamics (IBED),University of Amsterdam, The Netherlands.
Pharo, E.J. and Beattie, A. J. (2002). The association between substrate variability and
bryophyte and lichen diversity in eastern Australian forests. Bryologist 105: 11– 26.
Pocs T. (1994). Bioclimatic studies in the ULUGURU mountains - Acta Botanica Academiae
Scientiarum Hungaricae 20: 115-135.
Pócs, T. (1980). The epiphytic biomass and its effect on the water balance of two rain forest
types in the Uluguru Mountains (Tanzania, East Africa). Acta Botanica Hungarica, 26:
143-167.
Pocs T. (1974). The Significance of Lower Plants in Conservation of Mt. Kilimanjaro – The
IUCN Tropical Forest Programme; Conservatorium of Mt. Kilimanjaro.
Price, M.F, Moss,L.A.G and Williams, P.W. (1997). Tourism and amenity migration. In
Mersseli B.and Ives J.D (Ed.s), Mountains of the world. A global priority Pathernon,
Carnforth and New York. pp.249-280.
Putz, F.E. and Chan, H.T. (1986). Tree growth, dynamics, and productivity in a mature
mangrove forest in Malaysia. Forest Ecology and Managment 17: 211-230.
Rahbek, C. (1995). The elevational gradients of species richness: a uniform pattern? Ecography.
26: 456–466.
Rehder H., Beck E., Kokwaro J.O. and Scheibe R. (1981). Vegetation analysis of the Upper
Teleki Valley (Mt. Kenya) and and adjacent areas. Journal East Africa National History
Society and National Museum.
Rodgers, W. A. and K. M. Homewood. (1982). Biological values and conservation prospects for the
forest primate population of the Udzungwa Mountains, Tanzania. Biological Conservation

82
24:285–304.
Schmidt, P. R. (1991). The vegetation of the Aberdare National park, Kenya. Wagner. Innsbruck
(Hochgebigsforschung), 7:1-250
Senbeta, F., Schmitt, C., Denich, M., Demissew, S., Vlek, P.L.G., Preisinger, H., Woldemariam,
T. and Teketay, D.(2005). The diversity and distribution of lianas in the Afromontane
rainforests of Ethiopia. Diversity and distribution, 11: 443-452.
Skottsberg, C. (1927). Artemisia, Scaevola, Santalum, and Vaccinium of Hawai'i. Bernice P.
Bishop. Museum 43: 39–64.
Smith, A.P. and Young, T.P. (1987). Paper II, Annual Review of Ecology and
Systematics, 18:137-158.
Speck, H. (1986). Soils of the Mount Kenya Area, their formation, ecological, andagricultural
significance. Winiger, M. (Ed.) Mt. Kenya Area. Contributions to Ecology and Socio-
Economy. African Studies Series.
Tourist guide Map of Kenya (2010). Macmillan Kenya Publishers.
Trapnell, C.G. & Brunt, M.A. (1987). Kenya Vegetation Map Sheet., D.O.S. (L.R.) 3006.
Troll, C. (1968). Tropical mountain vegetation. Proc. 9th Pac.Sci. Cong. 20:37-45
UNCED. Conference -United Nations Conference on Environment and Development. Rio
de Janeiro, 3-14 June (1992). Publishers Sullivan, S.
UNESCO, World heritage committee (1997). Northampton, MA: Edward Elgar Publishing.
UNESCO, World heritage committee (1992). Rowman and Littlefeld Publishers, Oxford 2003,
197- 210
Van Reenen, G.B.A. & Gradstein, S.R. (1984). An investigation of bryophyte distribution and
83
ecology along an altitudinal gradient en the Andes of Colombia. Journal Hattori
Botanical Laboratory, 64:1-4
Wardle P. (1965). A comparison of alpine timber lines in New Zealand and North America. New
Zealand Journal of Botany. pages 113-135.
Watanabe, T., Ives, J. D. and Hammond, J. E. (1994). Rapid growth of a glacial lake in Khumbu
Himal., Nepal: Prospects for a catastrophic flood. Mountain Research and Development,
issue: 4, volume: 14: 329 - 340
Water Users Association (WUA) report: USAID. (2006). Tropical Forestry and Biodiversity
(FAA) Analyses: Lessons Learned and Best Practices from Recent USAID Experience.
White, F. (1983). The vegetation of Africa: a descriptive memoir to accompany the UNESCO /
AETFAT / UNSO vegetation map of Africa. Natural Resources Research Report XX,
Paris: UNESCO.356pp.
Whittaker, R.J., K.J. Willis & R. Field, (2001). Scale and species richness : towards a general,
hierarchical theory of species diversity. Journal of Biogeography 28: 453-470.
Williams, R. S. and Ferringo, J. G. (Eds.) (1991). Satellite image atlas of glaciers of the world:
Middle East and Africa. USGS Professional Paper. U.S. Geological Survey 1386-G
Satellite Image Atlas of Glaciers of the World -- Middle East and Africa 1991Version 1.0
Young, T.P. and. Peacock M. M. (1992). Giant senecios and alpine vegetation of
Mount Kenya. Journal of Ecology, 80: 141–148.
Zamierowski, E.E. (1975). Leaching losses of minerals from leaves of trees in montane forest in
Kenya. Journal of Ecology, 63: 679-687.
Zar, J.H. (1984). Biostatistical Analysis. Prentice-Hall, Inc., New Jersey.

84
APPENDICES
APPENDIX I TRACHEOPHYTE DISTRIBUTION ON NMT, MT. KENYA
ALTITUDE 2400 2600 2800 3000 3200 3400 3600 3800 4000 4200 4400 4600 4800
1.Sinnarundinaria alpine 0.06 0.08 0.09 0.07 0.07 0.06 - - - - - - -
2.Dracaena afromontana 0.01 0.02 0.03 0.01 - - - - - - - - -
3.Rubus steudneri 0.06 0.07 0.05 0.03 - - - - - - - - -
4.Stephania abyssinica 0.08 0.07 0.05 0.01 - - - - - - - - -
5.Drognetia iners 0.01 0.02 0.02 0.01 - - - - - - - - -
6.Plantago palmate 0.01 0.01 0.01 0.01 - - - - - - - - -
7.Cyphostemma bambuseti 0.01 0.01 0.01 0.01 - - - - - - - - -
8.Cyperusrotundus 0.04 - - - - - - - - - - - -
9 .Cyperusnigricans - 0.03 - - - - - - - - - - -

85
10. Digitariascalarum 0.06 - 0.03 - - - - - - - - - -
11.Rhus natalensis - 0.01 - - - - - - - - - - -
12.Commelina latifolia 0.08 - 0.03 - - - - - - - - - -
13.Carduuskeniensisvaraberdaricus - - - 0.04 0.06 0.05 0.10 0.06 - - - - -
14. Carduusmillefolius 0.04 - - - - - - - - - - - -
15. Carduusnyasanus 0.06 - - - - - - - - - - - -
16.Conyza floribunda 0.07 0.07 0.06 0.03 0.04 0.02 - - - - - - -
17.Conyza newii 0.09 0.08 0.06 0.05 - - - - - - - - -
18.Cotula abyssinica 0.03 0.03 0.04 0.03 0.02 0.02 - - - - - - -
19. Anagallisserpens ssp. Meyeri-
johannis 0.03 0.05 0.05 0.04 0.04 0.04 - - - - - - -
20.Erica arborea 0.01 0.02 0.03 0.03 0.04 0.04 0.06 0.01 - - - - -
21.Senecio syringrifolius 0.01 0.04 0.04 0.04 0.05 0.04 0.03 - - - - - -

86
22.Senecio keniensis 0.02 0.04 0.05 0.02 - - - - - - - - -
23.Urtica masaica 0.04 0.06 0.06 0.07 0.07 0.06 0.04 - - - - - -
24.Hypoetes forskahlii - 0.05 0.06 0.01 - - - - - - - - -
25.Peperomia abyssinica - - - 0.01 0.05 0.03 - - - - - - -
26.Hibiscus vitifolius - - - 0.03 - - - - - - - - -
27.Leptotrichilia volkensii - 0.04 0.06 0.04 0.04 0.03 - - - - - - -
28.Dichrocephala
chrysanthemifolia - - - - - - - 0.17 0.30 0.44 0.23 - -
29.Alchemilla johnstonii - - - 0.08 0.13 0.08 - - - - - - -
30.Alchemilla argyrophylla - - - 0.05 0.13 0.07 - - - - - - -
31.Alchemilla argyrophylla - - - 0.06 0.12 0.08 - - - - - - -
32.Senecio battiscombei - - - - - 0.06 - - - - - - -
33.Senecio keniodendron - - - - - - - 0.11 - - - - -

87
34. Seneciopurtschelleri - - - - - - - - - - 0.09 0.50 -
35. Seneciomoorei - - - 0.01 - - - - - - - - -
36. Sabucusafricana - - - 0.05 - - - - - - - - -
37. Nuxiacongesta - - - 0.04 - - - - - - - - -
38. Cassopoureamolesta - - - 0.04 - - - - - - - - -
39.Lobelia thomsonii - - - - 0.04 0.06 0.04 - - - - - -
40. Lobelia minutulta - - - - - - 0.03 - - - - - -
41.Lobelia telekii - - - - - - - 0.18 0.38 0.44 0.23 - -
42.Lobelia deckenii - - - - - - - 0.02 0.18 - - - -
43. Bazzaminae-abundant - - - - 0.01 - - - - - - - -
44.Erica excels - - - - - - 0.04 - - - - - -
45.Hagenia abyssinica - - - - 0.01 - - - - - - - -
46. Peucedanumkerstenii - - - - 0.02 0.03 0.04 - - - - - -

88
47.Euphobia schemperiana - - - - 0.02 0.05 0.05 - - - - - -
48. Ekebergiacapensis - - - - - - 0.07 - - - - - -
49.Crassocephylum montuosum - - - - - 0.03 - - - - - - -
50.Dombeya terrida - - - - - 0.02 - - - - - - -
51.Kalaud densiflora - - - - - 0.03 - - - - - - -
52.Festiuca piligii - - - - - 0.05 - - - - - - -
53.Cinereria deltoidea - - - - - - 0.01 - - - - - -
54.Sambucusa Africana - - - - - - 0.05 - - - - - -
55.Bothriocline fusca - - - - - - 0.03 - - - - - -
56.Phytolacca dodecandra - - - - - - 0.06 - - - - - -
57.Erharta erecta - - - - - - 0.02 - - - - - -
58.Cynoglosum coeruleum - - - - - - 0.06 - - - - - -
59. Dichrocephala integrifolia - - - - - - 0.03 - - - - - -

89
60.Heptocarpha rupelii - - - - - - - 0.05 - - - - -
61. Senecio roseiflorus - - - - - - - 0.08 0.15 0.12 0.36 0.50 -
62.Helicrisomia sereria - - - - - - - - - - 0.09 - -
63. Carex monostachya - - - - - - 0.09 - - - - - -
64.Dombeya goetzii - - - - - - - 0.11 - - - - -
65.Typha latifolia - - - - - - - 0.13 - - - - -
66.Achyranthes aspera 0.10 0.11 0.06 0.04 - - - - - - - - -
67.Commelina latifolia 0.08 0.10 0.06 0.03 - - - - - - - - -
68.Sonhus oleraceus - - - - - - 0.12 - - - - - -
69.Erica whyteana - - 0.02 0.03 0.03 0.03 0.05 - - - - - -
70.Isolepis setacea - - - - - - - 0.07 - - - - -
71.Eleocharis marginulata - - - - - - 0.04 - - - - - -
Shannon Weiner diversity index 1.047 0.893 0.902 1.099 0.82 0.801 0.534 0.348 0.086 0.062 0.086 0.013 0

90
(H)
Evenness (EH) 0.339 0.293 0.292 0.323 0.28 0.259 0.175 0.145 0.062 0.056 0.054 0.019 0
Number of Species 24 21 22 20 19 22 21 11 4 3 5 2 0

91
APPENDIX II
Classification of Trcheophyte plants on the Naro Moru Track
In biology, modern classification can be done either by an identification key that is a printed or
computer-aided device that aids the identification of biological entities, such as plants, animals,
fossils, microorganisms and pollen grains. Identification keys are also used in many other
scientific and technical fields to identify various kinds of entities, such as diseases, soil types,
minerals, or archaeological and anthropological artifacts.
Traditionally identification keys have most commonly taken the form of single access keys.
These work by offering a fixed sequence of identification steps, each with multiple alternatives,
the choice of which determines the next step. If each step has only two alternatives, the key is
said to be dichotomous, else it is polytomous. Modern multi-access or interactive keys allow the
user to freely choose the identification steps and their order.
At each step, the user must answer a question about one or more features (characters) of the
entity to be identified. In a botanical key one may ask about the color of flowers, or the
disposition of the leaves along the stems. In this identification, the user has simply referred the
readers to refer to the classification that already exists done by Agnew and Agnew 1994 for
vascular plants while Pocs and O'Shea 1999 for bryophytes and. Pteridophytes are classified
according to Johns 1991. The only addition is in reference to hodsting bryophytes by
Tracheophytes.
All the plant species sampled and collected on the Naro Moru Track were 168, and of these, only
two species of the family Podocarpiaceae (Podocarpus latifolius (Thumb.) Mirb. and
Podocarpus falcatus Mirb.) belonged to the Gymnosperms between altitudes 2400 and 3400m,

92
85 angiosperms and 79 bryophytes that were spread along the whole length of altitudinal
gradient sampled (2400-4800m.) and . The two Podocarpus species are rich as a home for many
bryophytes particularly of the family Radulaceae. They are the only gymnosperm species
represented on this track within the releves on Mount Kenya.
The 85 vascular plants belong to 31 families and 48 genera while the bryophytes belong to 39
families and 56 genera. On the track there were also lichens that occured quite often in the genus
ussunia between 3600 and 4200m.
KEY TO THE PLANTS ON NARO MORU TRACK
1a. Vascular Plants……………………………………..….2
1b. Non vascular plants ………………………………….4
2a. Seed plants ……………………………………………3
2b. Non seed plants…………………………………………Pteridphytes
3a. Non flowering …………………………………………Gymnosperms
3b. Flowering plants……………………………………….Angiosperms
4a. Leaves bristle tipped with nerve………………………Mosses (Bryopsida/Musci)
4a. Leaves lobed without a nerve………………………….Liverworts (Hepaticopsida) and
Hornworts (Anthocerotopsida)

93
APPENDIX III
Bryophyte species on Naro Moru Track
On anlysis, the total number of species collected on Mount Kenya on Naro Moru Track were 71
while the families and Genera of both Musci and Hepatics are as shown below:
Musci
Family Species
Amblystegiaceae Sanionia uncinata
Andreaeaceae Andreaea mildbraedii
Aulacomniaceae Aulacomnium turgidum
Warnstorfia sarmentosa
Bartramiaceae Brautelia muhavurensis
Philonotis fontana
Brachytheciaceae Palamocladium leskoides
Brachythecium plumosum
Bryaceae Bryum huillense
Bryum laevigatum
Bryum pseudotriguetrum
Calymperaceae Syrrhopodon usagarum

94
Syrrhopodon usambarensis
Cryphaeaceae Cryphaea robusta
Dicranaceae Campylopus hildebrandtii
Campylopus jamesonii
Campylopus nivalis
Campylopus savannarum
Entodontaceae Entodon macropodus
Geocalycaceae Lophocolea bicuspidata
Leptoscyphus hedbergii
Grimmiaceae Racomiturm subsecundum
Grimmia longirostris
Hedwigiaceae Braunia camptoclada
Braunia secunda
Hylocomiaceae Hylocomium splendens
Hypnaceae Hypnum cupressiforme var.cupressiforme
Lembophyllaceae Cyclodictyon borbonicum
Leucodontaceae Pterogonium gracile

95
Antitrichia kilimanscharica
Meteoriaceae) Squamidium brasiliense
Aerobryidium subpiligerum
Papillaria africana
Neckeraceae Neckera spp
Leptodon smithii
Porotrichum usagarum
Porothamnium wariifoliodes
Porothamnium stipitatum
Orthotrichaceae Orthotrichella cuspidata
Orthotrichum affine var affine
Orthotrichum .arborescens
Orthotrichum rupestre
Macrocoma abyssinica
Polytrichaceae Pogonatum gracilifolium
Hedwigia stellata
Pottiaceae) Syntrichia cavallii
Leptodontium pungens

96
Pterobryaceae Calyptothecium hoehnelii
Sematophyllaceae Sematophyllum sub brachytheciiforme
Hepaticeae
Allisoniaceae Calycularia crispula
Frullaniaceae Frullania depressa
Frullania obscurifolia
Frullania schimperi
Lejeuneaceae Lejeunea flava
Cheulolejeunea cordistipula
Leucolejeunea xanthocarpa
Microlejeunea africana
Lophoziaceae Anastrophyllum auritum
Metzgeriaceae Metzgeria agnewii
Plagiochilaceae Plagiochila abyssinica
Plagiochila barteri
Plagiochila colorans

97
Plagiochila effusa
Plagiochila exigua
Plagiochila haumannii
Porellaceae Porella abyssinica var. hoehnelii
Radulaceae Radula voluta
Radula ankefinensis
Radula quadrata
Radula stipatiflora
Radula boryana

98
APPENDIX IV
All vascular plants on Naro Moru Track, Mt. Kenya
Family Species
Acanthaceae Hypoetes forskahlii
Adianthaceae Cheilanthes tecta
Adoxaceae Sambucus africana
Amaranthaceae Achyranthes aspera
Anacardiaceae Rhus natalensis
Apiaceae Peucedanum kerstenii
Apocynaceae Rauvolfia densiflora
Asparagaceae Chlorophytum viridescens
Asparagaceae Dracaena afromontana
Asparagaceae Droguetia iners
Asteraceae/Compositae Artemisia afra
Asteraceae/Compositae Bothriocline fusca
Asteraceae/Compositae Carduus keniensis
Asteraceae/Compositae Carduus millefolius

99
Asteraceae/Compositae Carduus nyassanus
Asteraceae/Compositae Carduus platyplyllus
Asteraceae/Compositae Cinereria deltoidea
Asteraceae/Compositae Conyza floribunda
Asteraceae/Compositae Conyza newii
Asteraceae/Compositae Cotula abyssinica
Asteraceae/Compositae Crassocephylum montuosum
Asteraceae/Compositae Dendrosenecio brassica
Asteraceae/Compositae Dendrosenecio keniensis
Asteraceae/Compositae Dendrosenecio keniodendron
Asteraceae/Compositae Dichrocephala chrysanthemifolia
Asteraceae/Compositae Dichrocephala integrifolia
Asteraceae/Compositae Helichrysum spp
Asteraceae/Compositae Senecio battiscombei.
Asteraceae/Compositae Senecio kiniensis
Asteraceae/Compositae Senecio keniodendron
Asteraceae/Compositae Senecio keniophytum

100
Asteraceae/Compositae Sonchus oleraceus
Boraginaceae Cynoglosum coeruleum
Brassicaceae Arabis alpina
Campanulaceae Lobelia deckenii
Campanulaceae Lobelia telekii
Campanulaceae Lobelia thomsonii
Commelinaceae Commelina latifolia
Cyperaceae Carex monostachya
Cyperaceae Cyperus nigricans
Dennstaedtiaceae Pteridium aquilium
Dicranaceae Leptotrichellia volkensii
Ericaceae Erica arborea
Ericaceae Philippia trimera
Euphobiaceae Euphobia schemperiana
Euphobiaceae Euphorbia tirucalli
Gentianaceae Swertia multicaulis
Iridaceae Gladiolus thomsonii

101
Lycopodiaceae Lycopodium clavatum
Lycopodiaceae Lycopodium saururus
Malvaceae Dombeya goetzii
Malvaceae Dombeya torrida
Malvaceae Hibiscus vitifolius
Meliaceae Ekebergia capensis
Piperaceae Peperomia abyssinica
Plantaginaceae Plantago palmata
Podocarpiaceae Podocarpus falcatus
Podocarpiaceae Podocarpus latifolius
Phytolaccaceae Phytolacca dodecandra
Poaceae Agrostis trachyphylla
Poaceae Ehrharta erecta
Poaceae Sinnarundinaria alpine/Yushania alpina
Poaceae Festuca piligii
Proteaceae Protea kilimanjaro
Pteridaceae Pteris dentata

102
Rosaceae Alchemilla argyrophylla
Rosaceae Alchemilla cyclophylla
Rosaceae Alchemilla johnstonii.
Rosaceae Hagenia abyssinica
Rosaceae Pyrus ussuriensis
Rosaceae Rubus steudneri
Rosaceae Stephania abyssinica
Ranunculaceae Ranunculus orephytes
Selaginellaceae Selaginella kraussiana.
Typhaceae Typha latifolia
Urticaceae Urtica massaica
Vitaceae Cyphostemma bambuseti
Verbenaceae Lantana camara
Xanthorrhoeaceae Kniphofia thomsonii