the disparity between invasive and echo gradients after tavr
TRANSCRIPT
SCRIPPS CLINIC
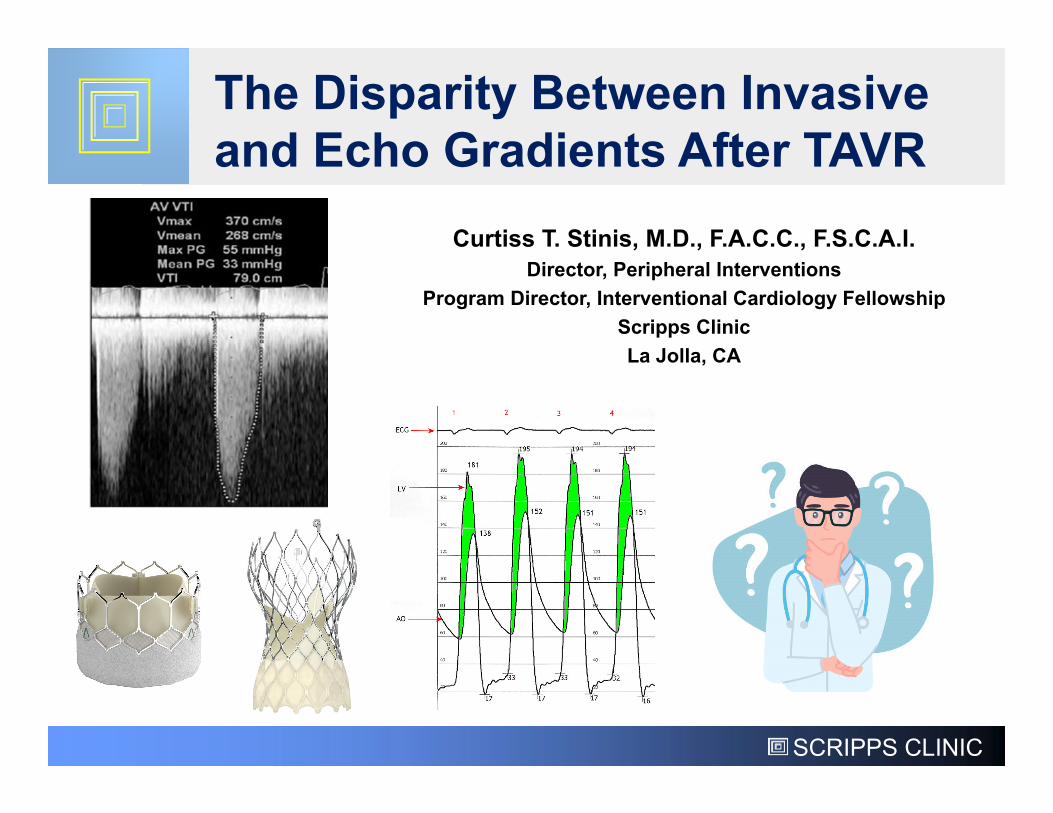
Curtiss T. Stinis, M.D., F.A.C.C., F.S.C.A.I.Director, Peripheral Interventions
Program Director, Interventional Cardiology FellowshipScripps ClinicLa Jolla, CA
The Disparity Between Invasive and Echo Gradients After TAVR
SCRIPPS CLINIC
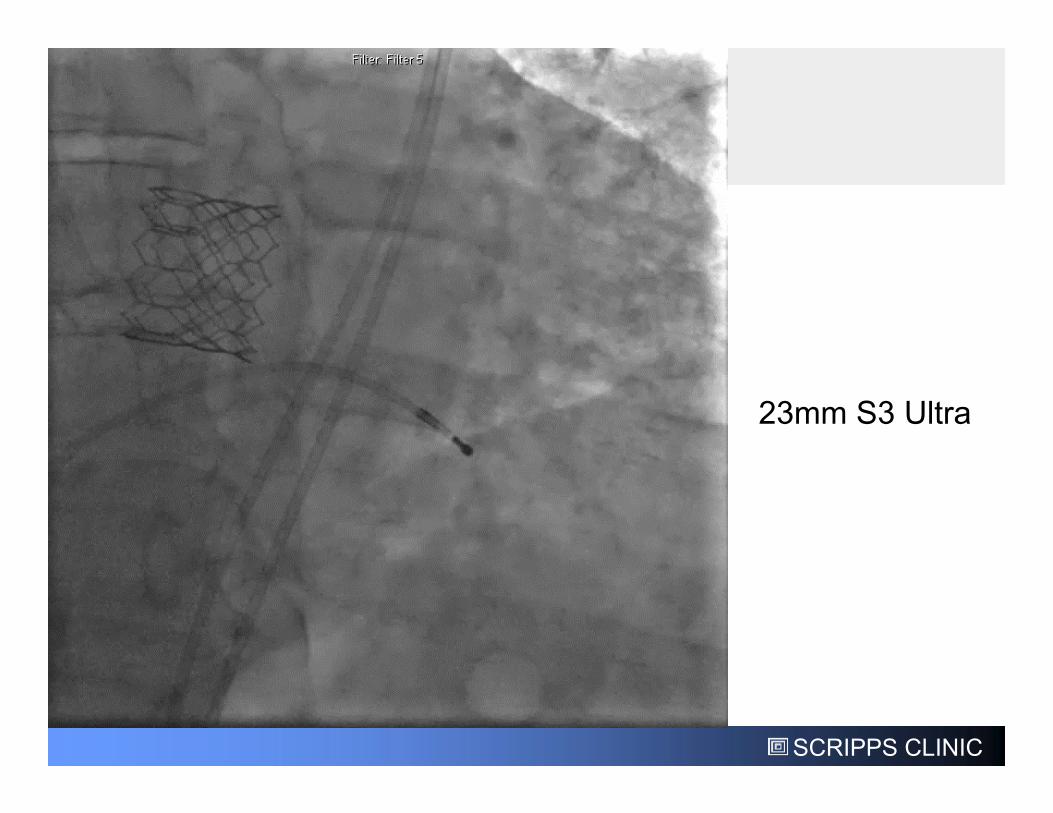
23mm S3 Ultra
SCRIPPS CLINIC
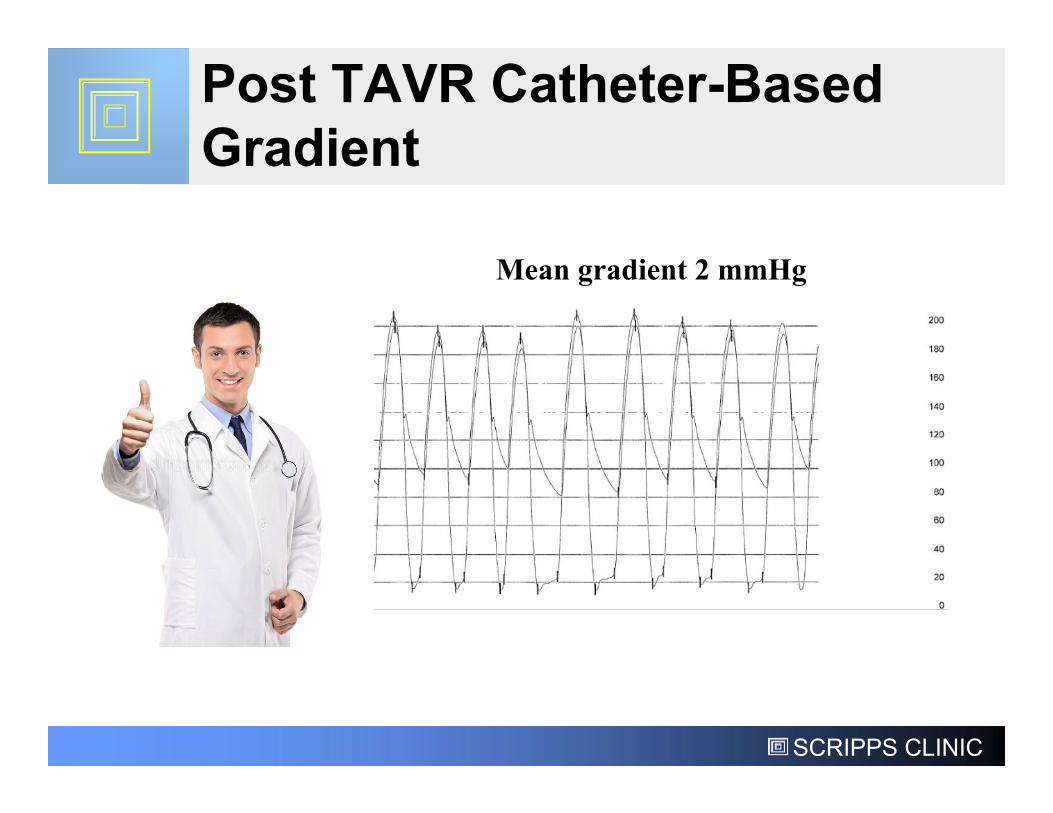
Post TAVR Catheter-Based Gradient
Mean gradient 2 mmHg
SCRIPPS CLINIC
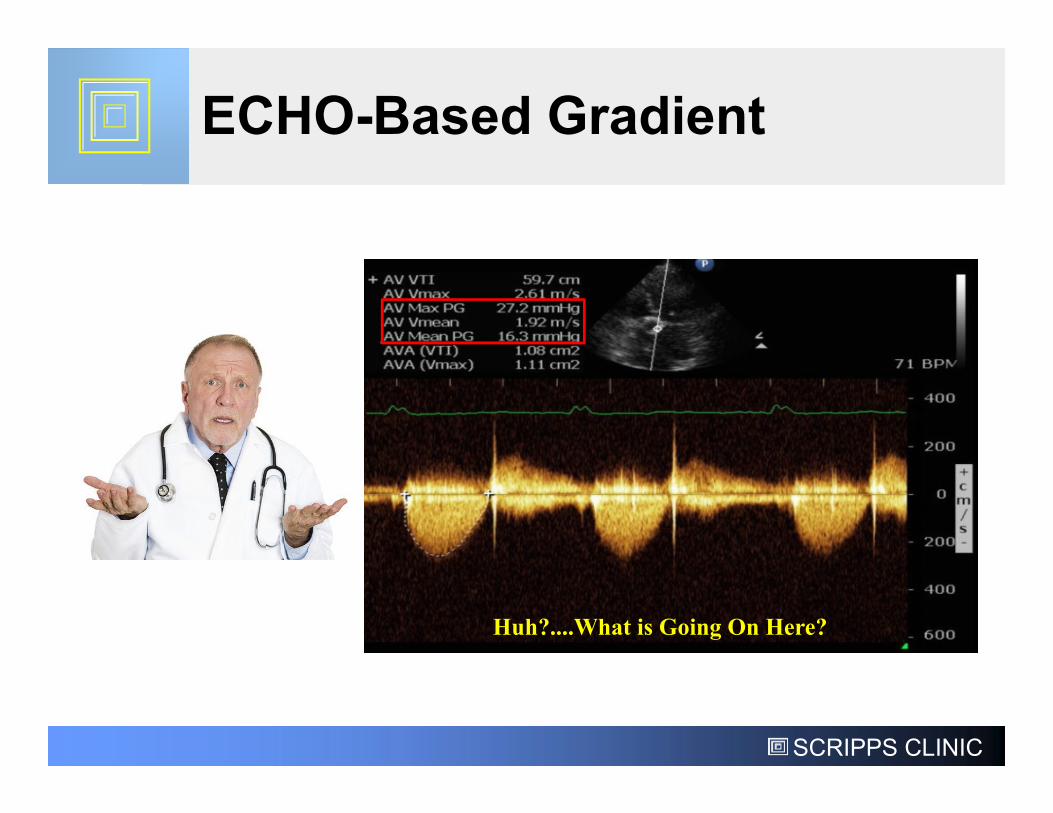
ECHO-Based Gradient
Huh?....What is Going On Here?
SCRIPPS CLINIC
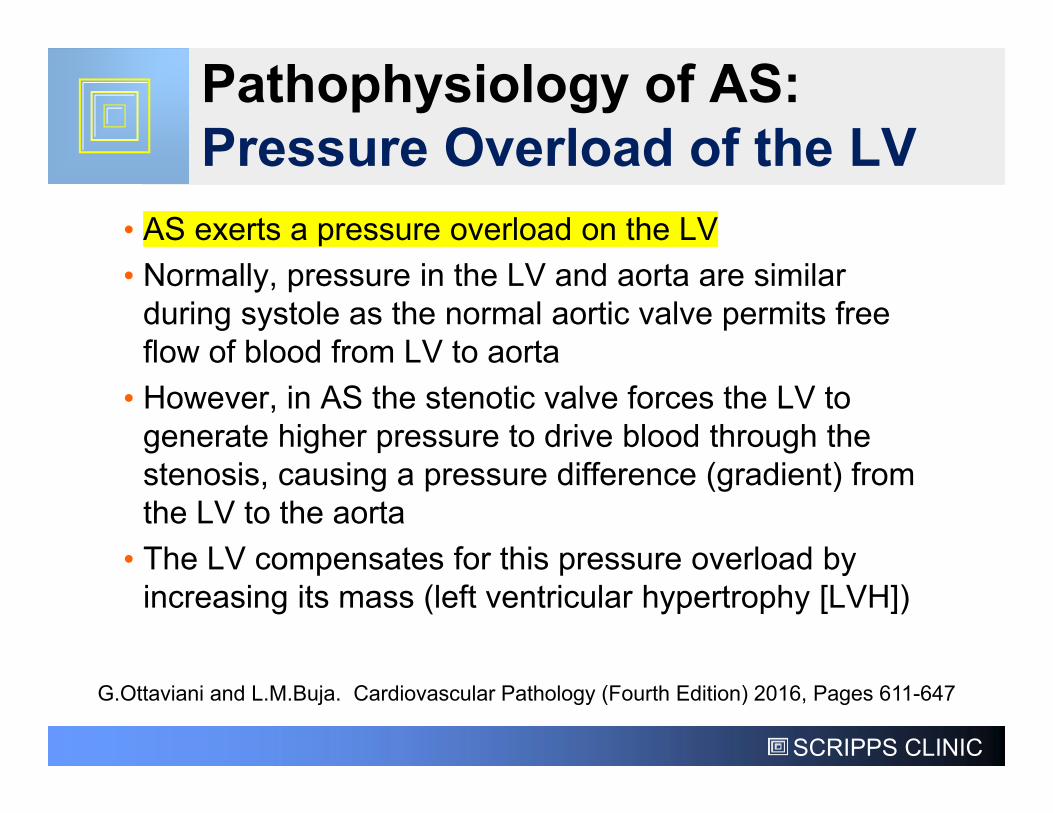
Pathophysiology of AS:Pressure Overload of the LV
• AS exerts a pressure overload on the LV• Normally, pressure in the LV and aorta are similar
during systole as the normal aortic valve permits free flow of blood from LV to aorta
• However, in AS the stenotic valve forces the LV to generate higher pressure to drive blood through the stenosis, causing a pressure difference (gradient) from the LV to the aorta
• The LV compensates for this pressure overload by increasing its mass (left ventricular hypertrophy [LVH])
G.Ottaviani and L.M.Buja. Cardiovascular Pathology (Fourth Edition) 2016, Pages 611-647
SCRIPPS CLINIC
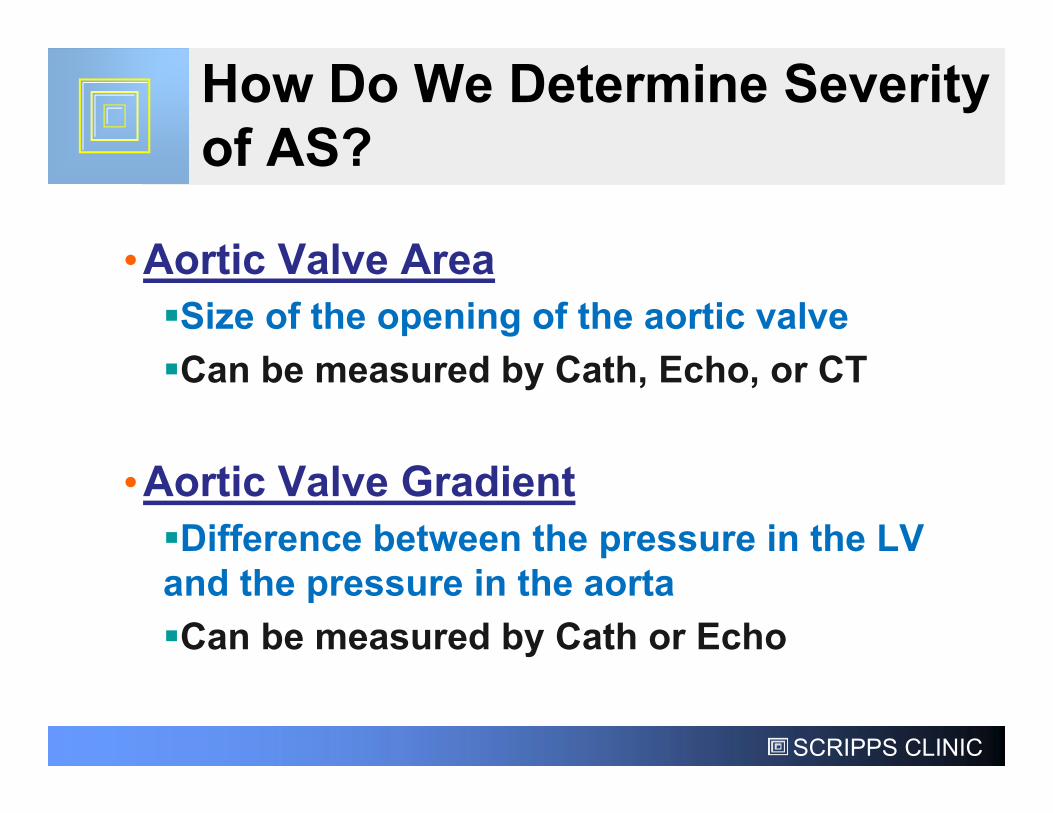
How Do We Determine Severity of AS?
•Aortic Valve AreaSize of the opening of the aortic valveCan be measured by Cath, Echo, or CT
•Aortic Valve GradientDifference between the pressure in the LV and the pressure in the aortaCan be measured by Cath or Echo
SCRIPPS CLINIC
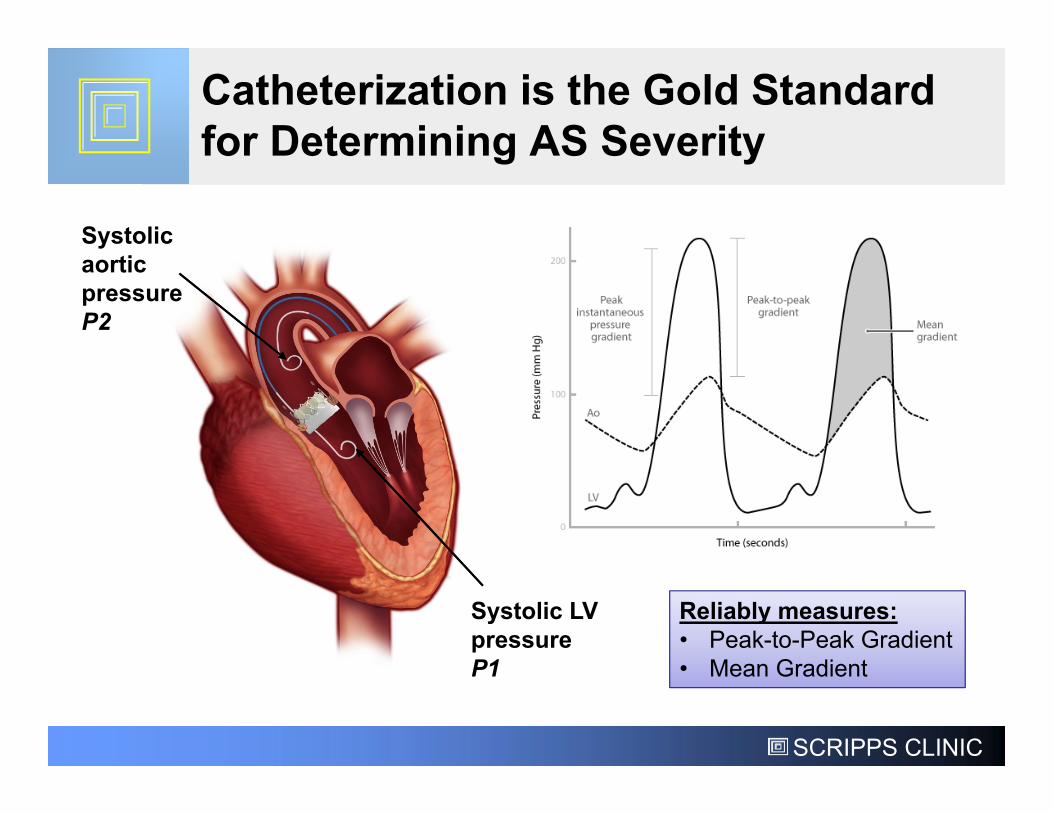
Catheterization is the Gold Standard for Determining AS Severity
Systolic aortic pressure P2
Systolic LV pressure P1
Reliably measures:• Peak-to-Peak Gradient• Mean Gradient
SCRIPPS CLINIC
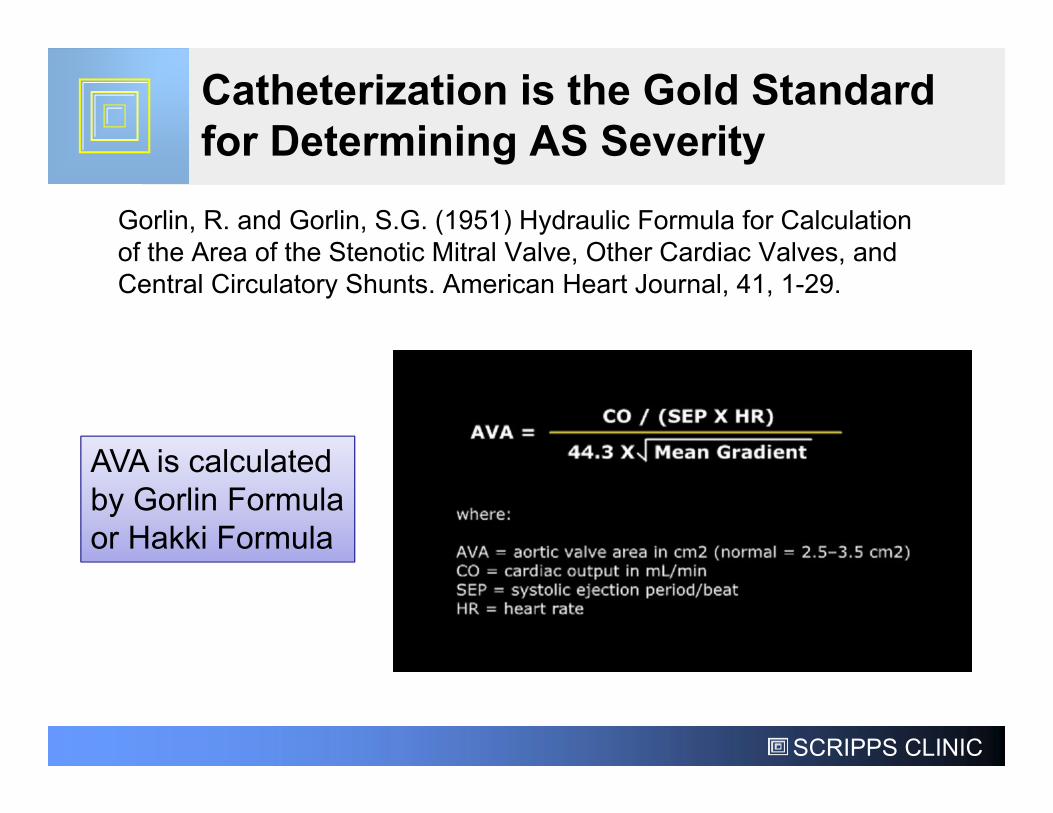
Catheterization is the Gold Standard for Determining AS Severity
Gorlin, R. and Gorlin, S.G. (1951) Hydraulic Formula for Calculation of the Area of the Stenotic Mitral Valve, Other Cardiac Valves, and Central Circulatory Shunts. American Heart Journal, 41, 1-29.
AVA is calculated by Gorlin Formula or Hakki Formula
SCRIPPS CLINIC
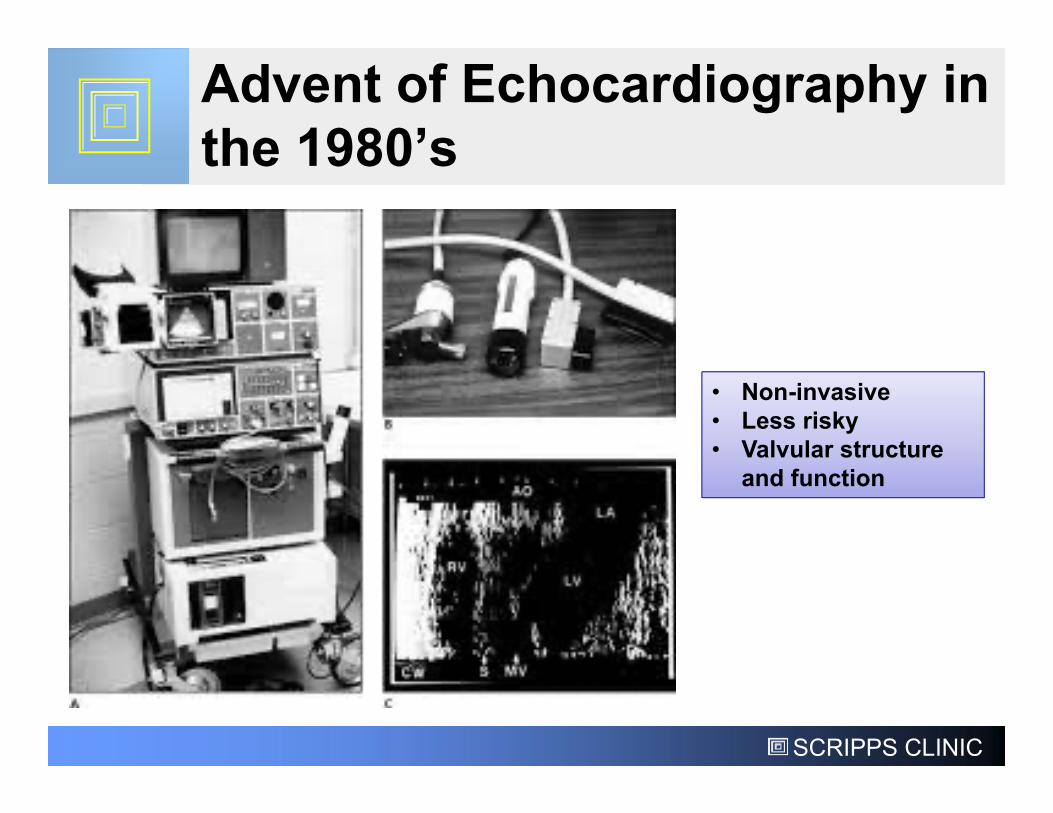
Advent of Echocardiography in the 1980’s
• Non-invasive• Less risky• Valvular structure
and function
SCRIPPS CLINIC
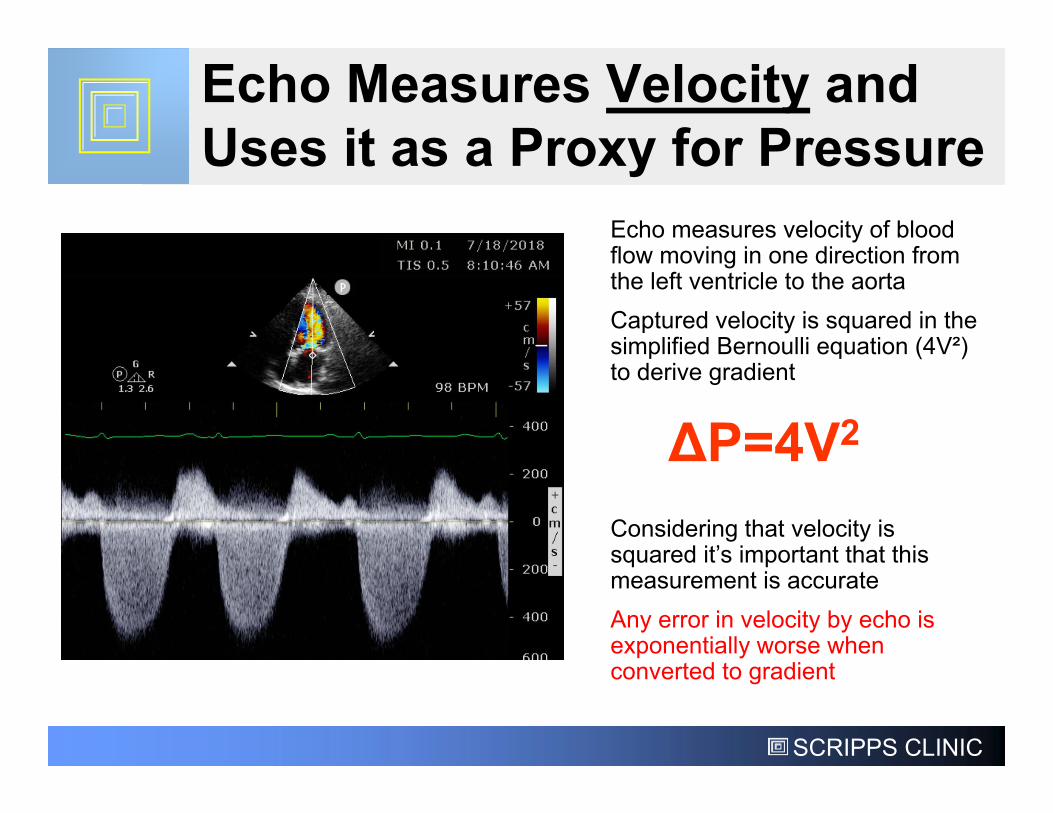
Echo Measures Velocity and Uses it as a Proxy for Pressure
ΔP=4V2
Echo measures velocity of blood flow moving in one direction from the left ventricle to the aortaCaptured velocity is squared in the simplified Bernoulli equation (4V²) to derive gradient
Considering that velocity is squared it’s important that this measurement is accurate Any error in velocity by echo is exponentially worse when converted to gradient
SCRIPPS CLINIC
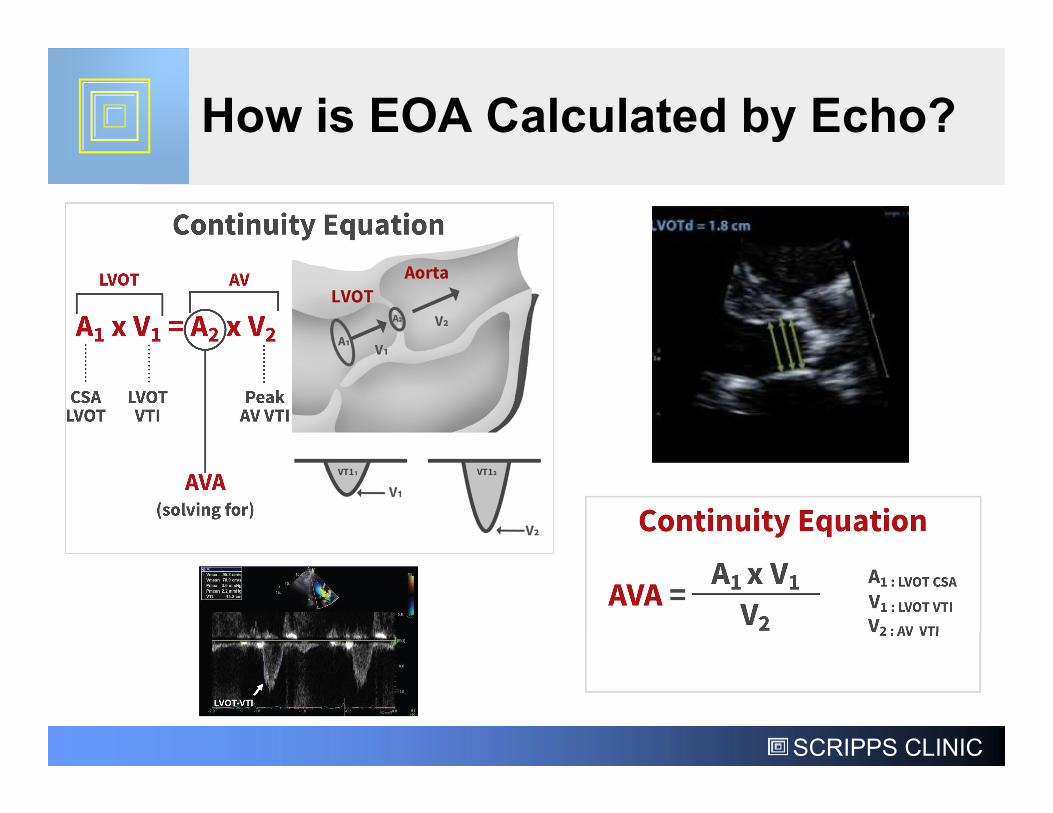
How is EOA Calculated by Echo?
SCRIPPS CLINIC
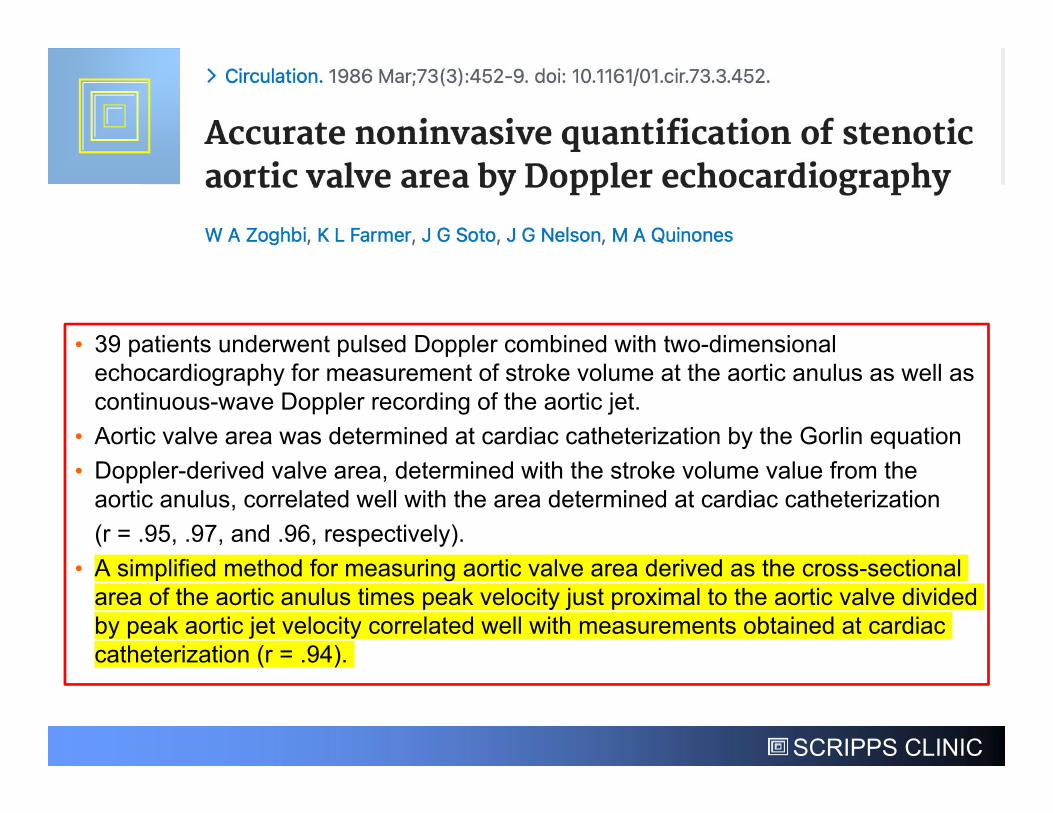
• 39 patients underwent pulsed Doppler combined with two-dimensional echocardiography for measurement of stroke volume at the aortic anulus as well as continuous-wave Doppler recording of the aortic jet.
• Aortic valve area was determined at cardiac catheterization by the Gorlin equation • Doppler-derived valve area, determined with the stroke volume value from the
aortic anulus, correlated well with the area determined at cardiac catheterization (r = .95, .97, and .96, respectively).
• A simplified method for measuring aortic valve area derived as the cross-sectional area of the aortic anulus times peak velocity just proximal to the aortic valve divided by peak aortic jet velocity correlated well with measurements obtained at cardiac catheterization (r = .94).
SCRIPPS CLINIC
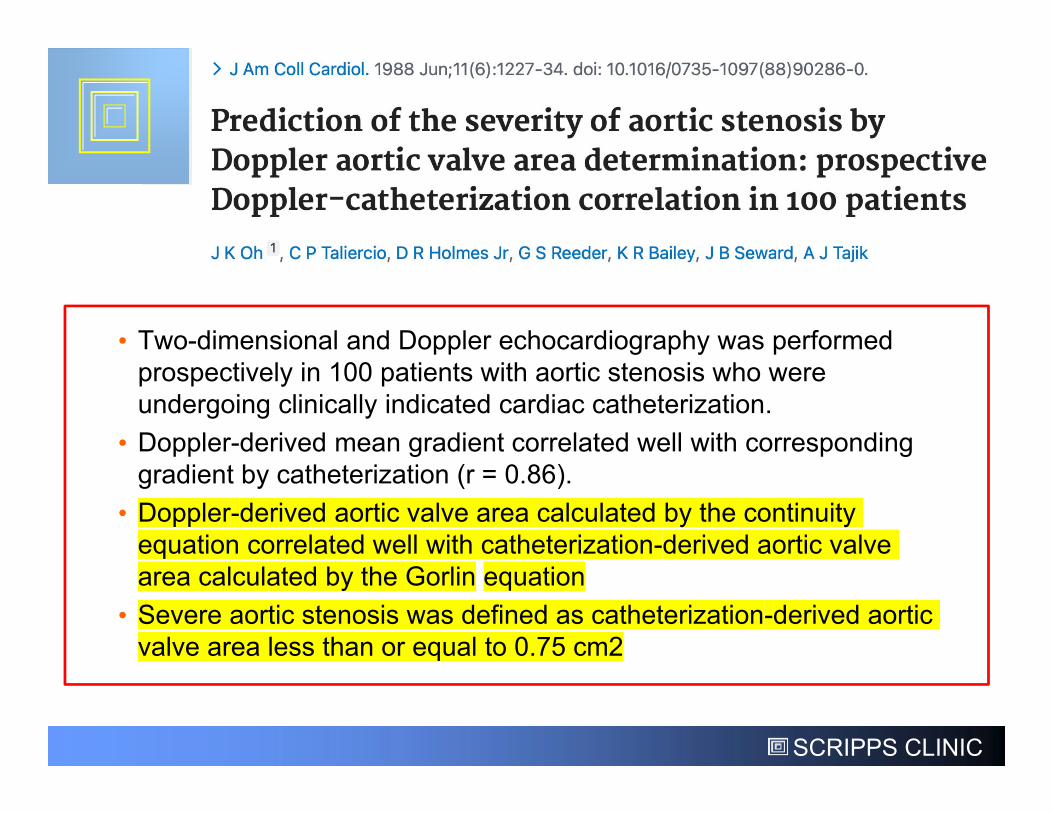
• Two-dimensional and Doppler echocardiography was performed prospectively in 100 patients with aortic stenosis who were undergoing clinically indicated cardiac catheterization.
• Doppler-derived mean gradient correlated well with corresponding gradient by catheterization (r = 0.86).
• Doppler-derived aortic valve area calculated by the continuity equation correlated well with catheterization-derived aortic valve area calculated by the Gorlin equation
• Severe aortic stenosis was defined as catheterization-derived aortic valve area less than or equal to 0.75 cm2
SCRIPPS CLINIC
AS Assessment Shifted Towards Echo
SCRIPPS CLINIC
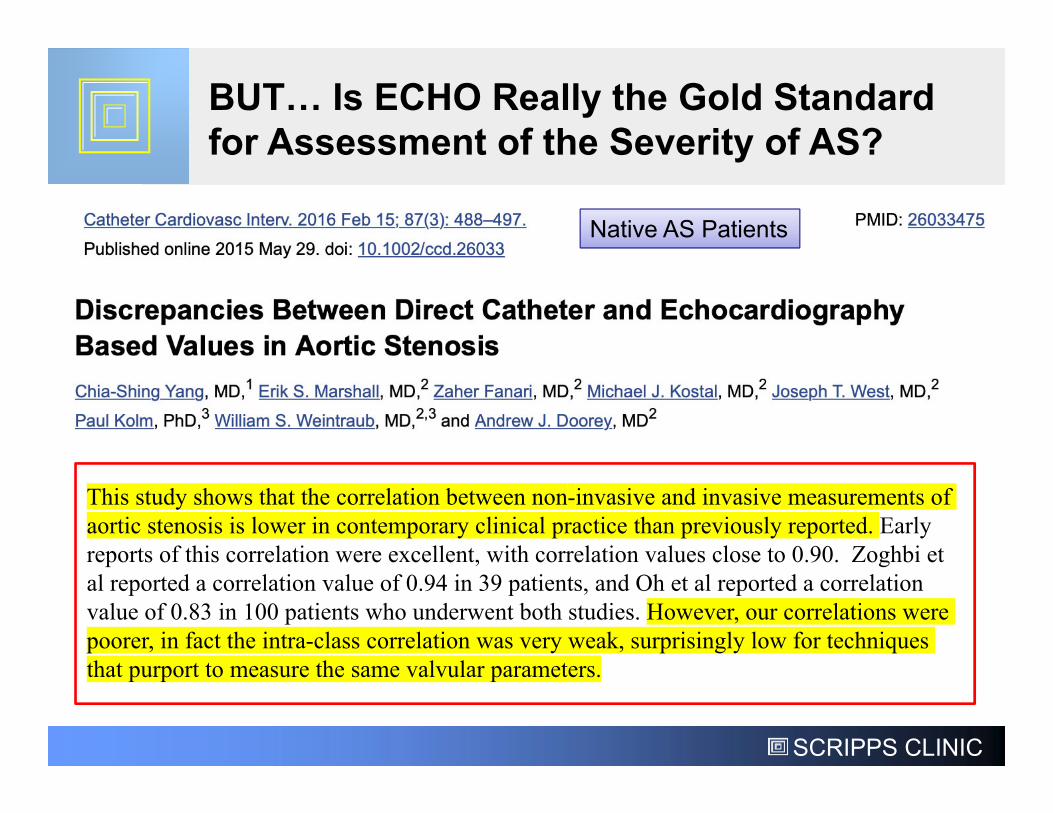
This study shows that the correlation between non-invasive and invasive measurements of aortic stenosis is lower in contemporary clinical practice than previously reported. Early reports of this correlation were excellent, with correlation values close to 0.90. Zoghbi et al reported a correlation value of 0.94 in 39 patients, and Oh et al reported a correlation value of 0.83 in 100 patients who underwent both studies. However, our correlations were poorer, in fact the intra-class correlation was very weak, surprisingly low for techniques that purport to measure the same valvular parameters.
BUT… Is ECHO Really the Gold Standard for Assessment of the Severity of AS?
Native AS Patients
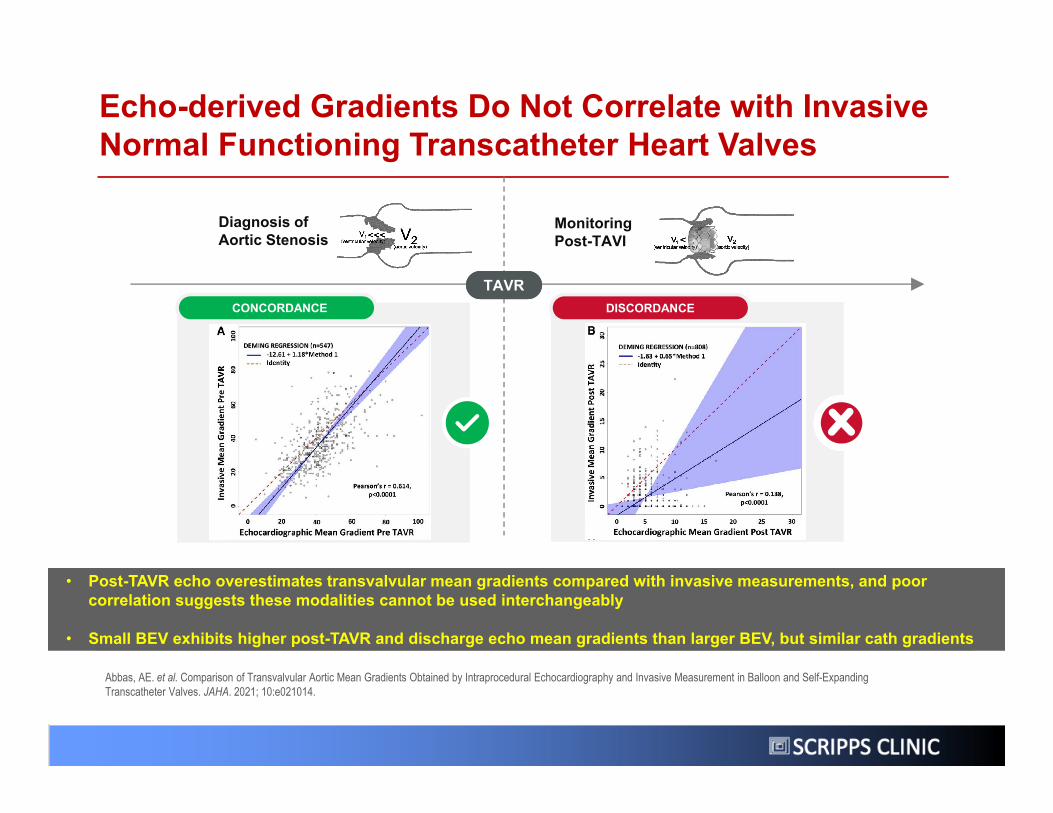
Echo-derived Gradients Do Not Correlate with Invasive Normal Functioning Transcatheter Heart Valves
Abbas, AE. et al. Comparison of Transvalvular Aortic Mean Gradients Obtained by Intraprocedural Echocardiography and Invasive Measurement in Balloon and Self-Expanding Transcatheter Valves. JAHA. 2021; 10:e021014.
Diagnosis of Aortic Stenosis
Monitoring Post-TAVI
TAVRTAVRCONCORDANCE DISCORDANCE
• Post-TAVR echo overestimates transvalvular mean gradients compared with invasive measurements, and poor correlation suggests these modalities cannot be used interchangeably
• Small BEV exhibits higher post-TAVR and discharge echo mean gradients than larger BEV, but similar cath gradients
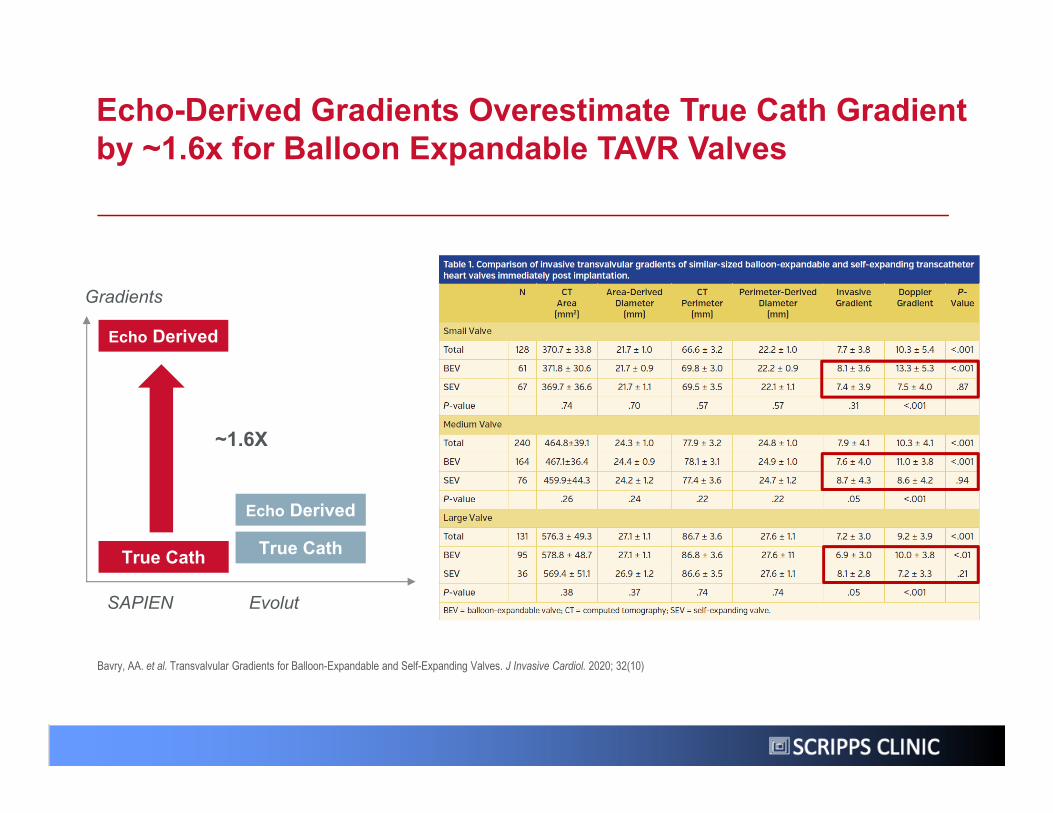
Echo-Derived Gradients Overestimate True Cath Gradient by ~1.6x for Balloon Expandable TAVR Valves
Bavry, AA. et al. Transvalvular Gradients for Balloon-Expandable and Self-Expanding Valves. J Invasive Cardiol. 2020; 32(10)
Gradients
SAPIEN Evolut
Echo Derived
~1.6X
Echo Derived
True CathTrue Cath
SCRIPPS CLINIC
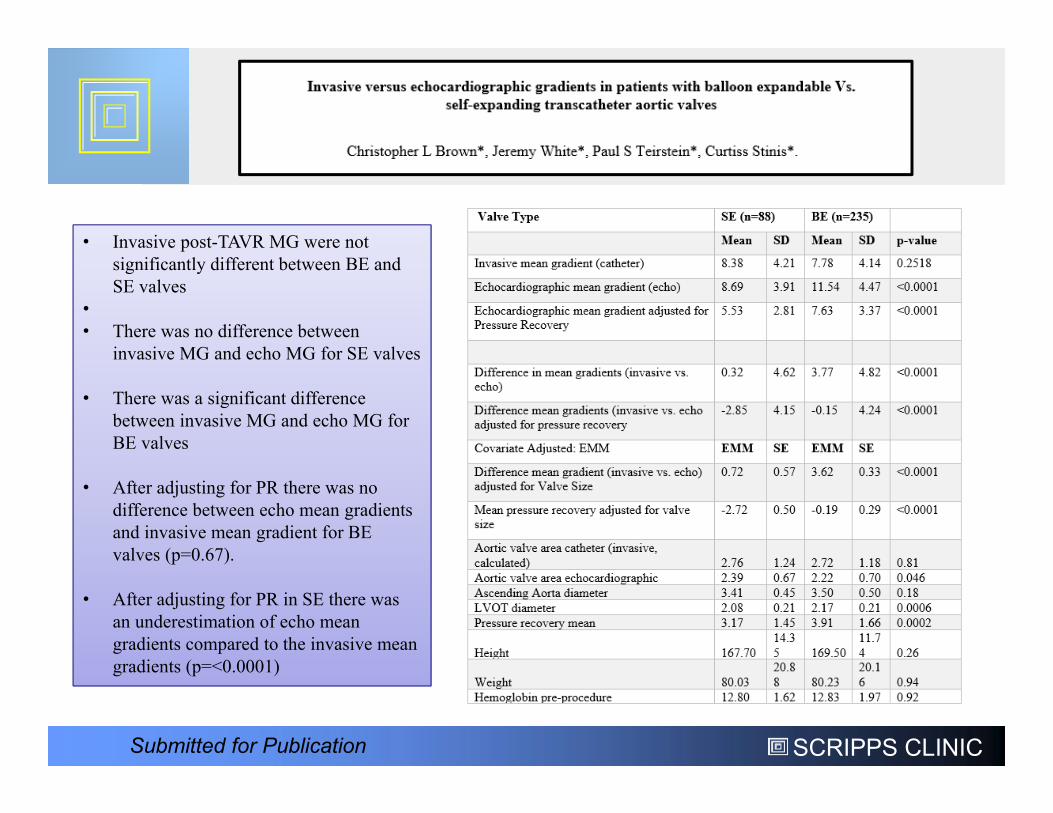
• Invasive post-TAVR MG were not significantly different between BE and SE valves
•• There was no difference between
invasive MG and echo MG for SE valves
• There was a significant difference between invasive MG and echo MG for BE valves
• After adjusting for PR there was no difference between echo mean gradients and invasive mean gradient for BE valves (p=0.67).
• After adjusting for PR in SE there was an underestimation of echo mean gradients compared to the invasive mean gradients (p=<0.0001)
Submitted for Publication

SCRIPPS CLINIC
What is Going on Here?
SCRIPPS CLINIC
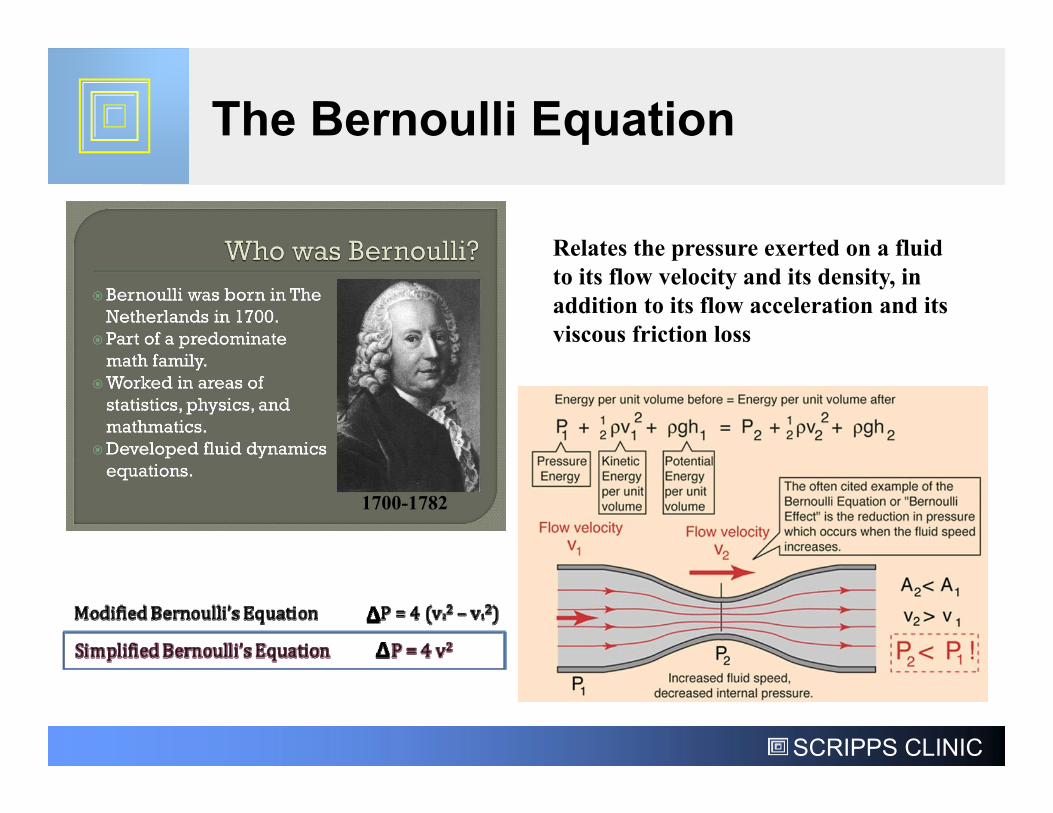
Relates the pressure exerted on a fluid to its flow velocity and its density, in addition to its flow acceleration and its viscous friction loss
The Bernoulli Equation
1700-1782
SCRIPPS CLINIC
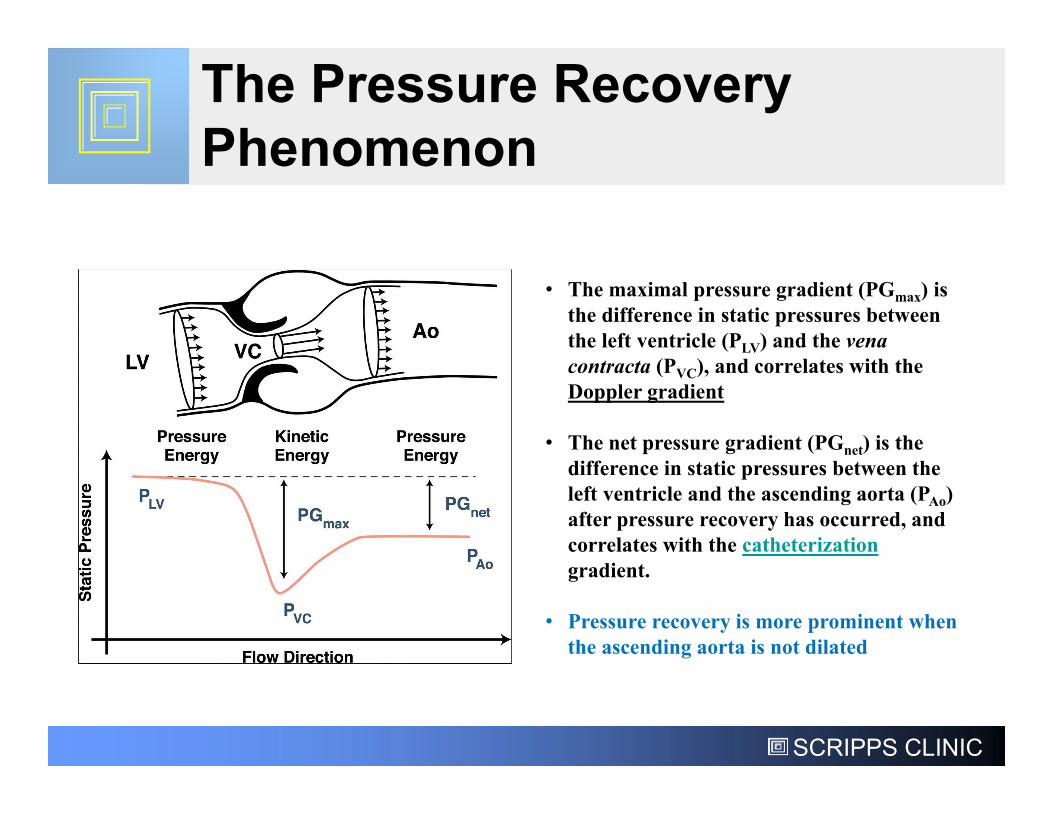
The Pressure Recovery Phenomenon
• The maximal pressure gradient (PGmax) is the difference in static pressures between the left ventricle (PLV) and the vena contracta (PVC), and correlates with the Doppler gradient
• The net pressure gradient (PGnet) is the difference in static pressures between the left ventricle and the ascending aorta (PAo) after pressure recovery has occurred, and correlates with the catheterizationgradient.
• Pressure recovery is more prominent when the ascending aorta is not dilated
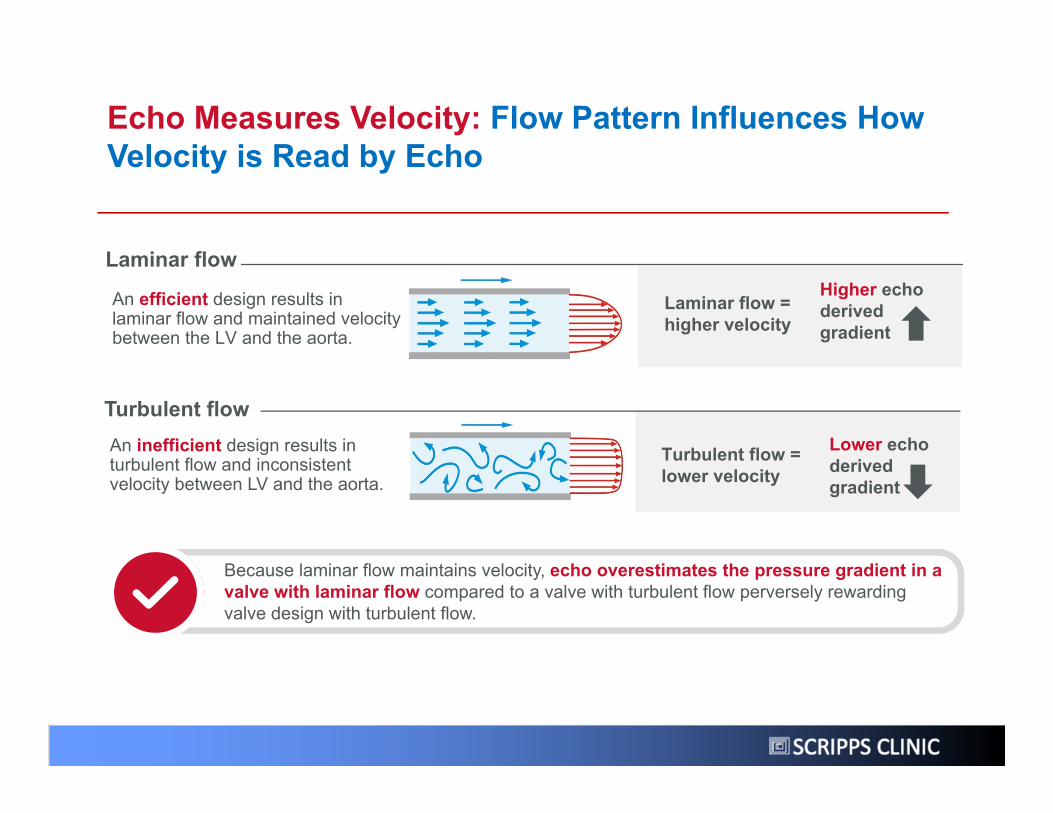
Echo Measures Velocity: Flow Pattern Influences How Velocity is Read by Echo
Because laminar flow maintains velocity, echo overestimates the pressure gradient in a valve with laminar flow compared to a valve with turbulent flow perversely rewarding valve design with turbulent flow.
An inefficient design results in turbulent flow and inconsistent velocity between LV and the aorta.
Laminar flow = higher velocity
Turbulent flow
Higher echo derived gradient
An efficient design results in laminar flow and maintained velocity between the LV and the aorta.
Turbulent flow = lower velocity
Laminar flow
Lower echo derived gradient
SCRIPPS CLINIC
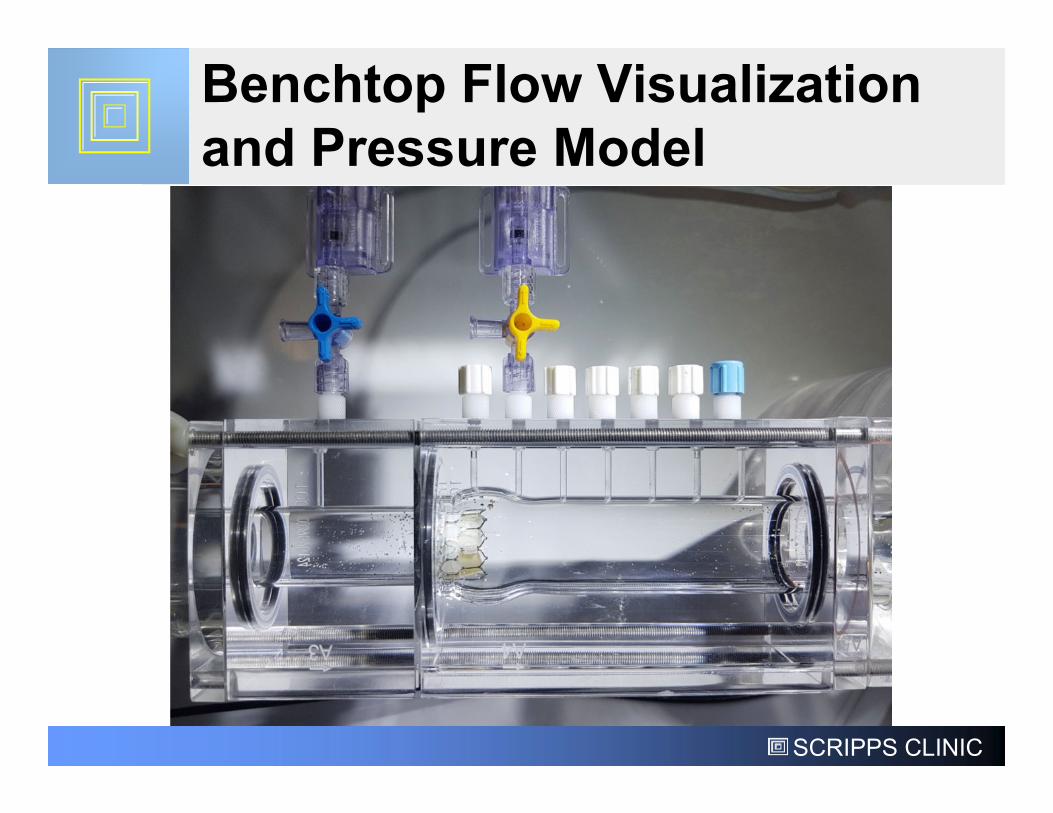
Benchtop Flow Visualization and Pressure Model
SCRIPPS CLINIC
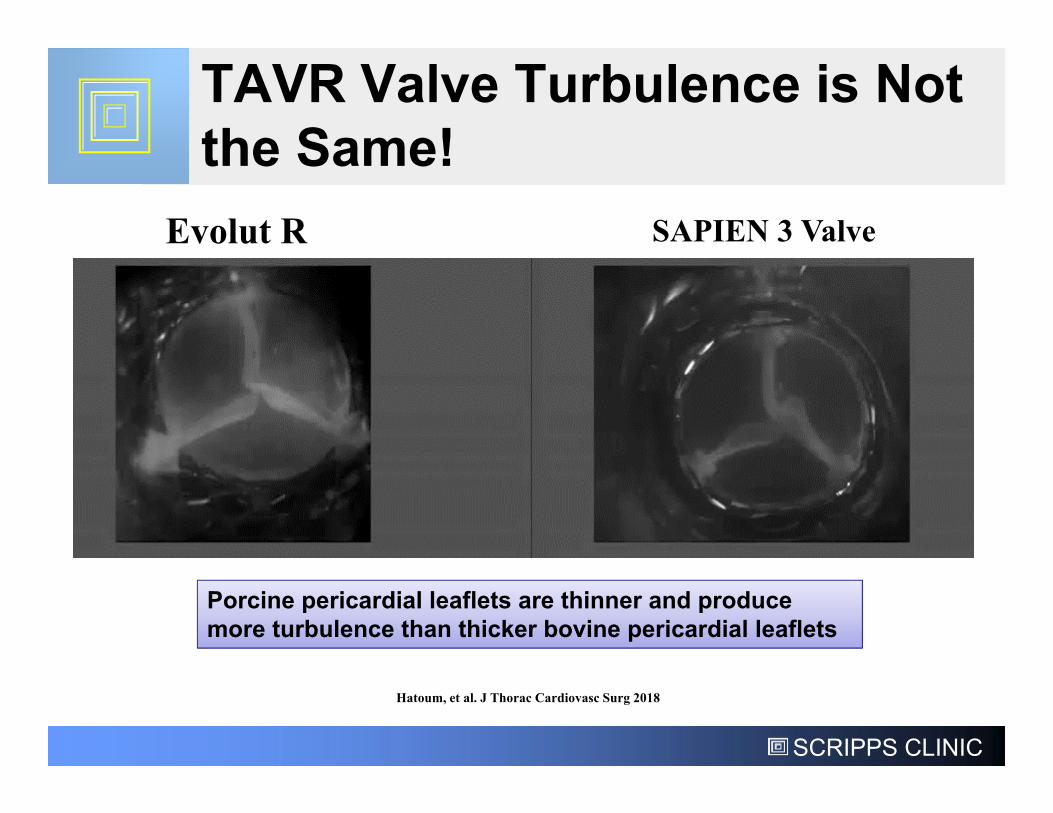
TAVR Valve Turbulence is Not the Same!
Evolut R SAPIEN 3 Valve
Hatoum, et al. J Thorac Cardiovasc Surg 2018
Porcine pericardial leaflets are thinner and produce more turbulence than thicker bovine pericardial leaflets
SCRIPPS CLINIC
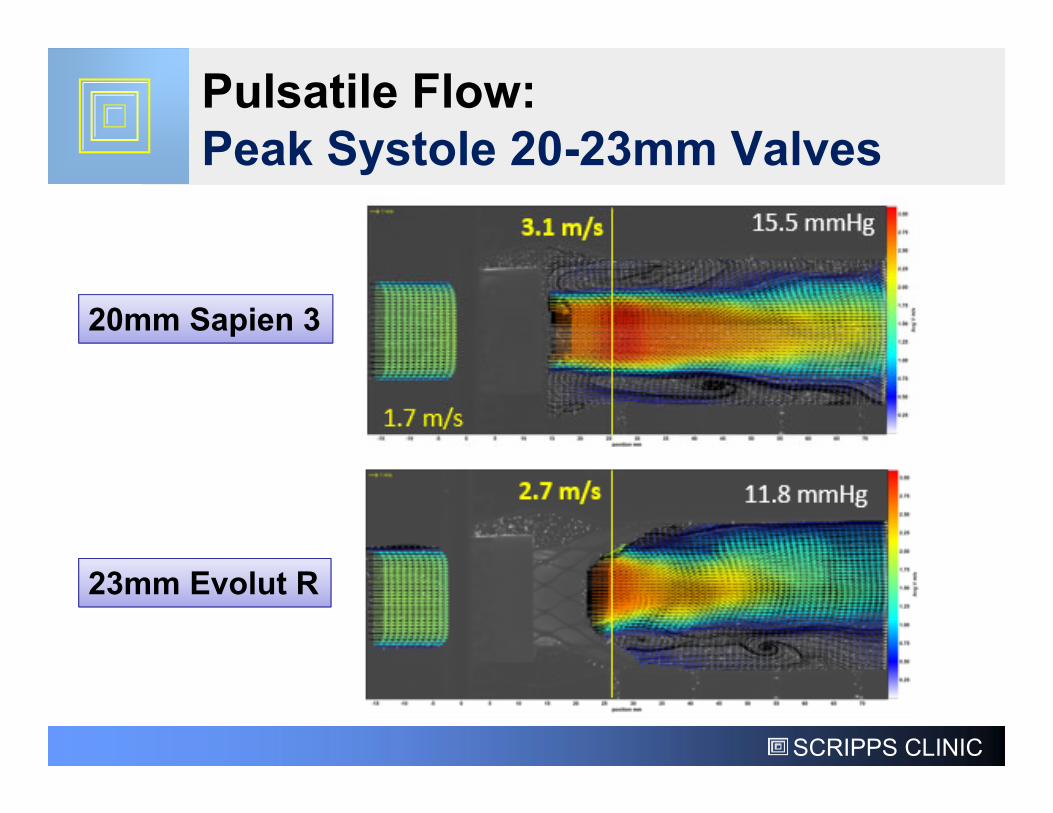
Pulsatile Flow: Peak Systole 20-23mm Valves
20mm Sapien 3
23mm Evolut R
SCRIPPS CLINIC
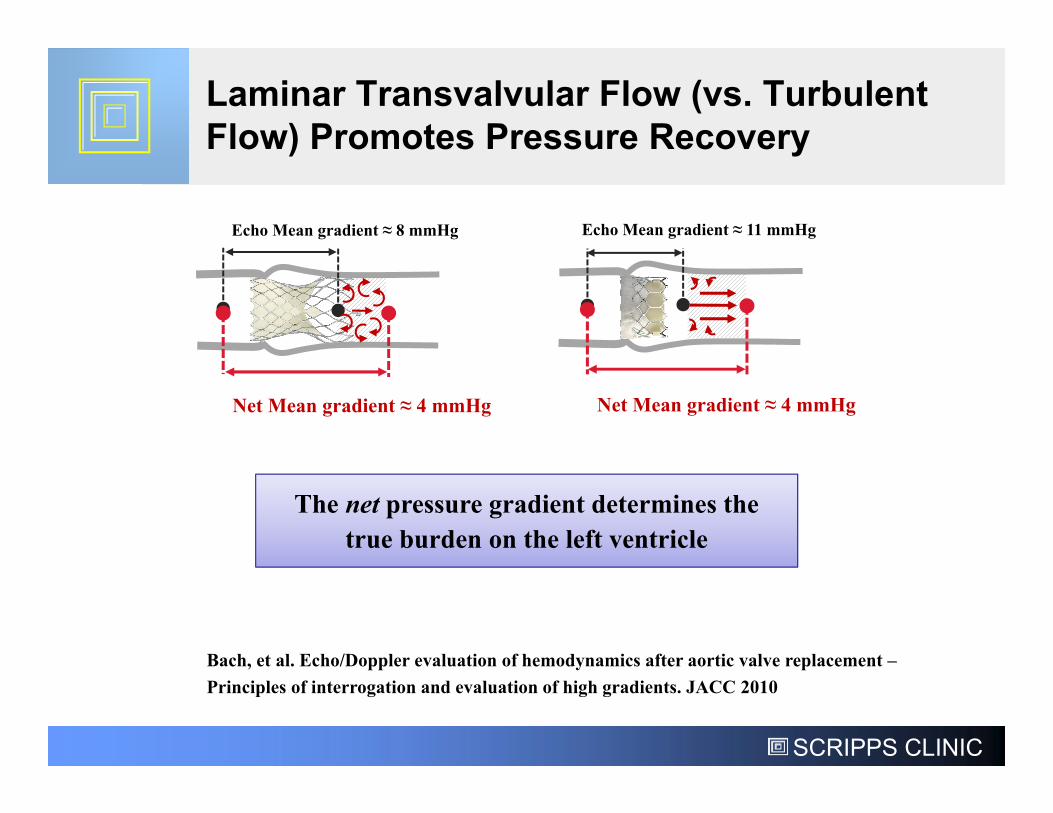
Laminar Transvalvular Flow (vs. Turbulent Flow) Promotes Pressure Recovery
Echo Mean gradient ≈ 8 mmHg Echo Mean gradient ≈ 11 mmHg
The net pressure gradient determines the true burden on the left ventricle
Bach, et al. Echo/Doppler evaluation of hemodynamics after aortic valve replacement –Principles of interrogation and evaluation of high gradients. JACC 2010
Net Mean gradient ≈ 4 mmHg Net Mean gradient ≈ 4 mmHg
SCRIPPS CLINIC
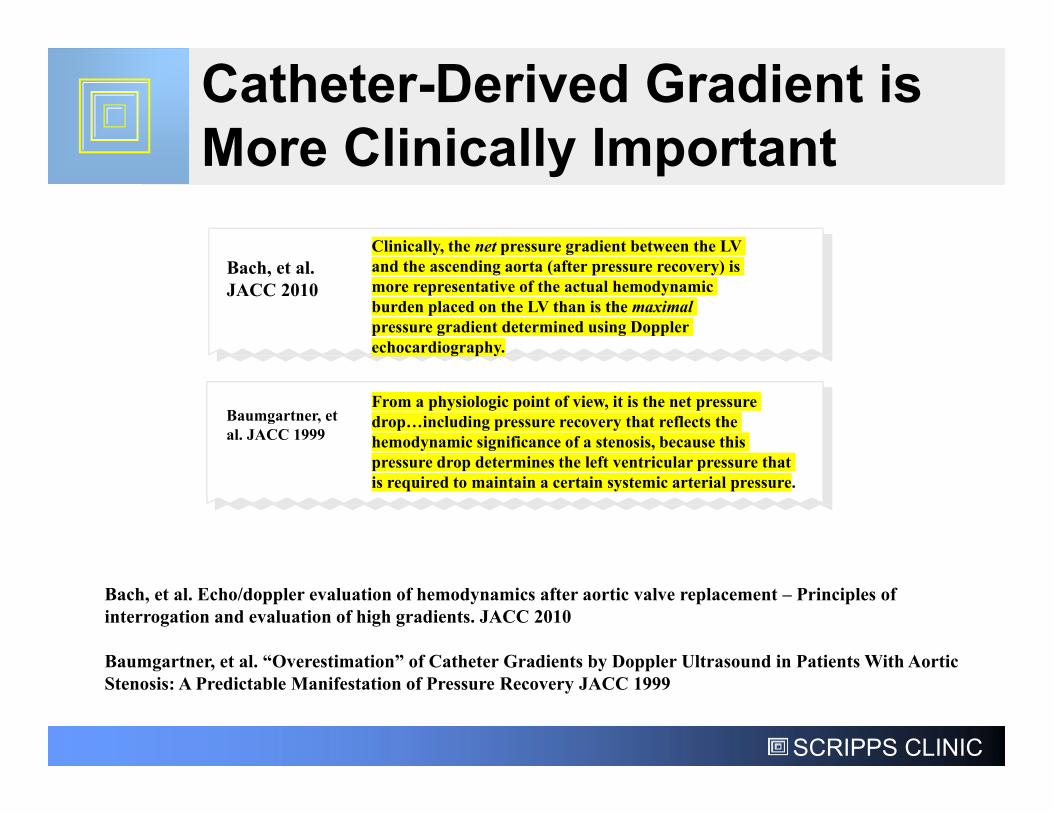
Catheter-Derived Gradient is More Clinically Important
Bach, et al. JACC 2010
Clinically, the net pressure gradient between the LV and the ascending aorta (after pressure recovery) is more representative of the actual hemodynamic burden placed on the LV than is the maximal pressure gradient determined using Doppler echocardiography.
Baumgartner, et al. JACC 1999
From a physiologic point of view, it is the net pressure drop…including pressure recovery that reflects the hemodynamic significance of a stenosis, because this pressure drop determines the left ventricular pressure that is required to maintain a certain systemic arterial pressure.
Bach, et al. Echo/doppler evaluation of hemodynamics after aortic valve replacement – Principles of interrogation and evaluation of high gradients. JACC 2010
Baumgartner, et al. “Overestimation” of Catheter Gradients by Doppler Ultrasound in Patients With Aortic Stenosis: A Predictable Manifestation of Pressure Recovery JACC 1999
SCRIPPS CLINIC
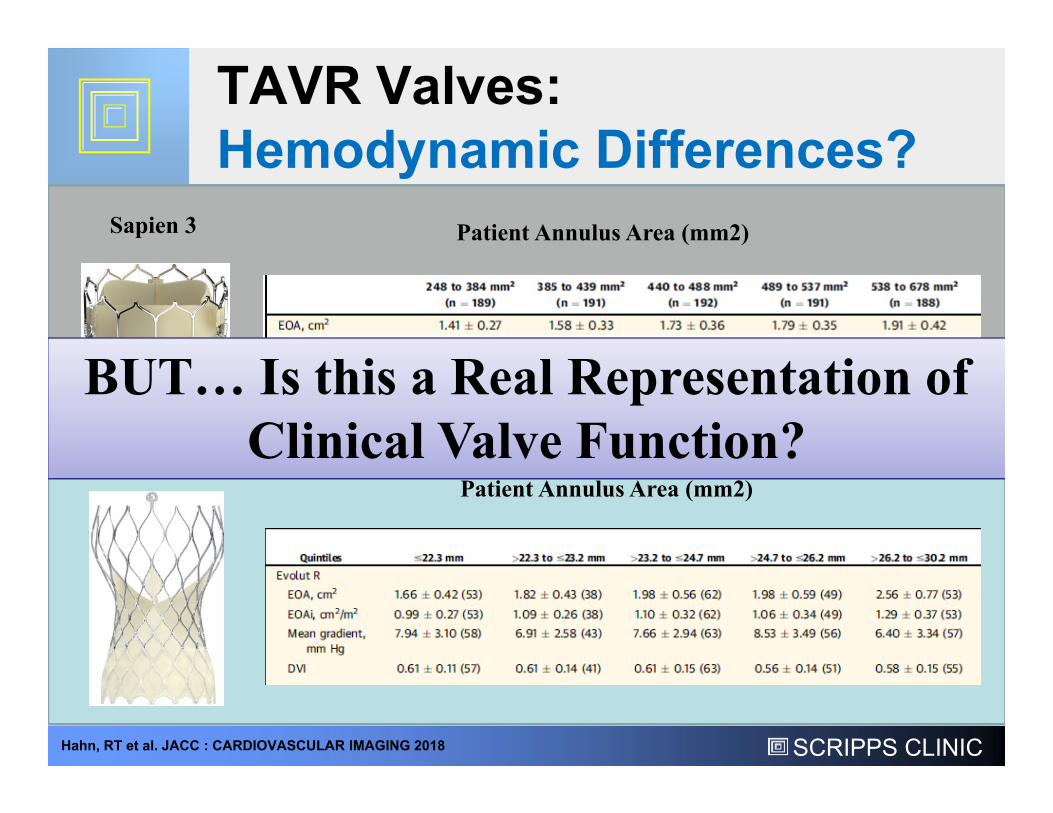
TAVR Valves:Hemodynamic Differences?
Sapien 3
Evolut R
Patient Annulus Area (mm2)
Hahn, RT et al. JACC : CARDIOVASCULAR IMAGING 2018
Patient Annulus Area (mm2)
BUT… Is this a Real Representation of Clinical Valve Function?
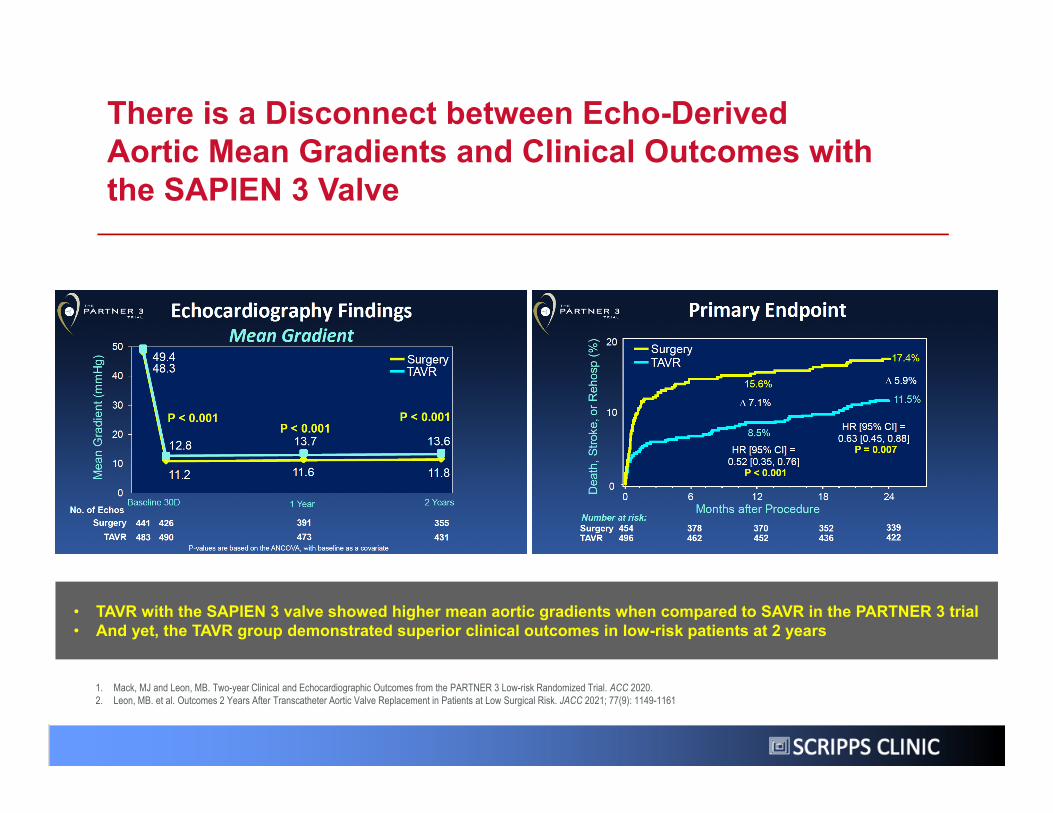
There is a Disconnect between Echo-Derived Aortic Mean Gradients and Clinical Outcomes with the SAPIEN 3 Valve
• TAVR with the SAPIEN 3 valve showed higher mean aortic gradients when compared to SAVR in the PARTNER 3 trial• And yet, the TAVR group demonstrated superior clinical outcomes in low-risk patients at 2 years
1. Mack, MJ and Leon, MB. Two-year Clinical and Echocardiographic Outcomes from the PARTNER 3 Low-risk Randomized Trial. ACC 2020.2. Leon, MB. et al. Outcomes 2 Years After Transcatheter Aortic Valve Replacement in Patients at Low Surgical Risk. JACC 2021; 77(9): 1149-1161
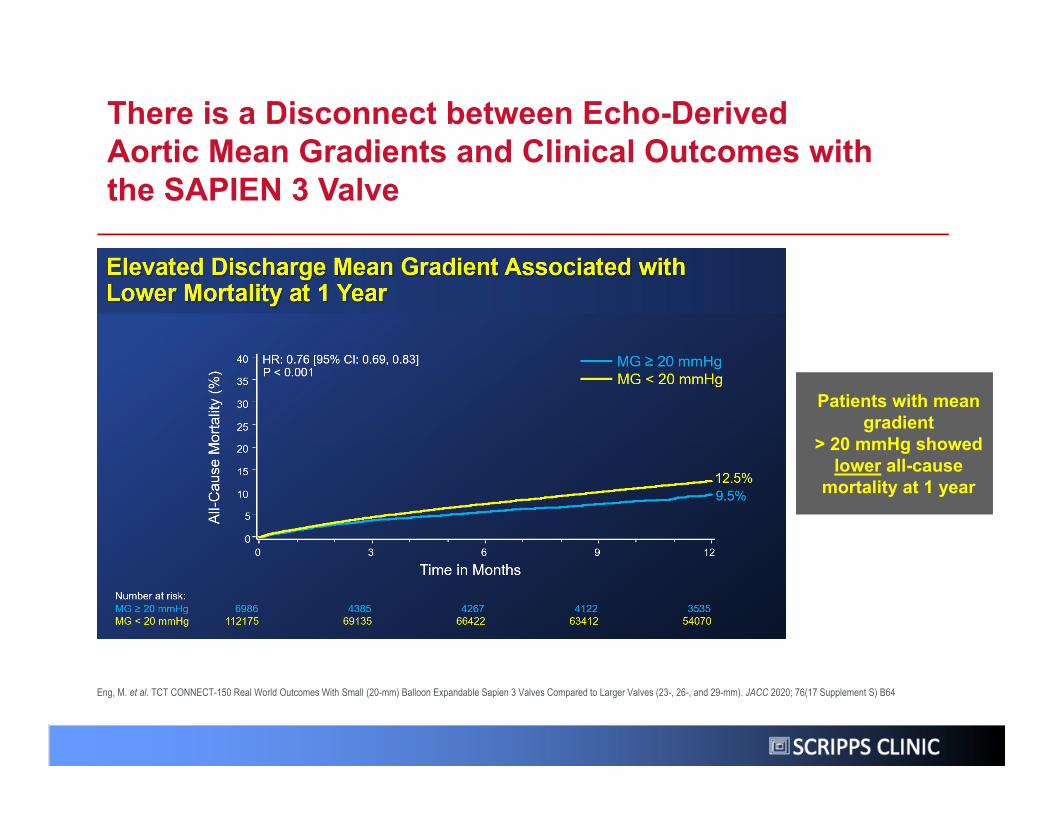
Eng, M. et al. TCT CONNECT-150 Real World Outcomes With Small (20-mm) Balloon Expandable Sapien 3 Valves Compared to Larger Valves (23-, 26-, and 29-mm). JACC 2020; 76(17 Supplement S) B64
Patients with mean gradient
> 20 mmHg showed lower all-cause
mortality at 1 year
There is a Disconnect between Echo-Derived Aortic Mean Gradients and Clinical Outcomes with the SAPIEN 3 Valve
31
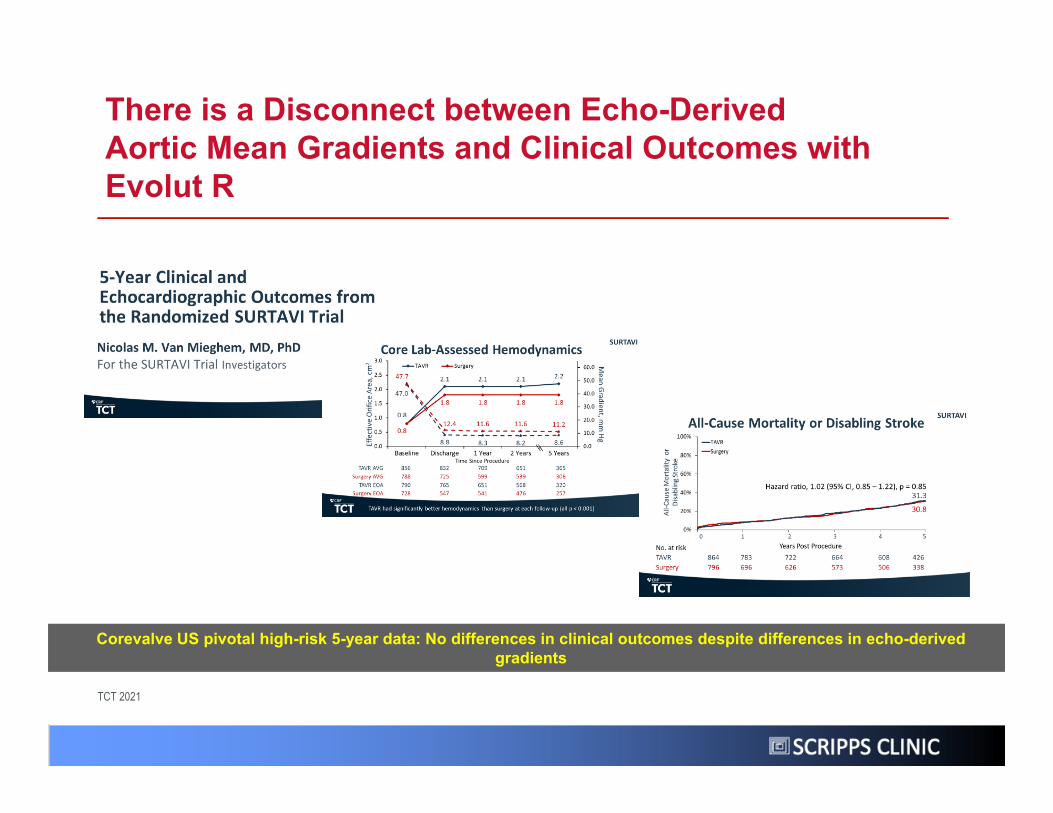
There is a Disconnect between Echo-Derived Aortic Mean Gradients and Clinical Outcomes with Evolut R
TCT 2021
Corevalve US pivotal high-risk 5-year data: No differences in clinical outcomes despite differences in echo-derived gradients
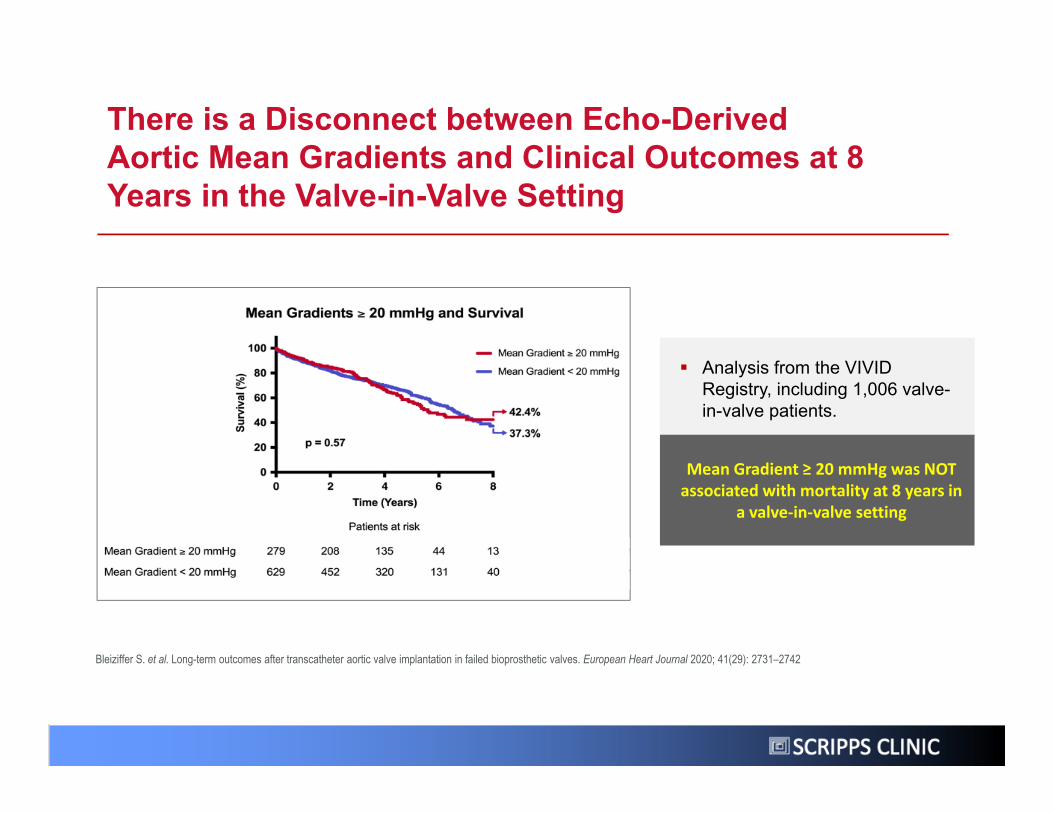
There is a Disconnect between Echo-Derived Aortic Mean Gradients and Clinical Outcomes at 8 Years in the Valve-in-Valve Setting
Bleiziffer S. et al. Long-term outcomes after transcatheter aortic valve implantation in failed bioprosthetic valves. European Heart Journal 2020; 41(29): 2731–2742
Analysis from the VIVID Registry, including 1,006 valve-in-valve patients.
Mean Gradient ≥ 20 mmHg was NOT associated with mortality at 8 years in
a valve‐in‐valve setting
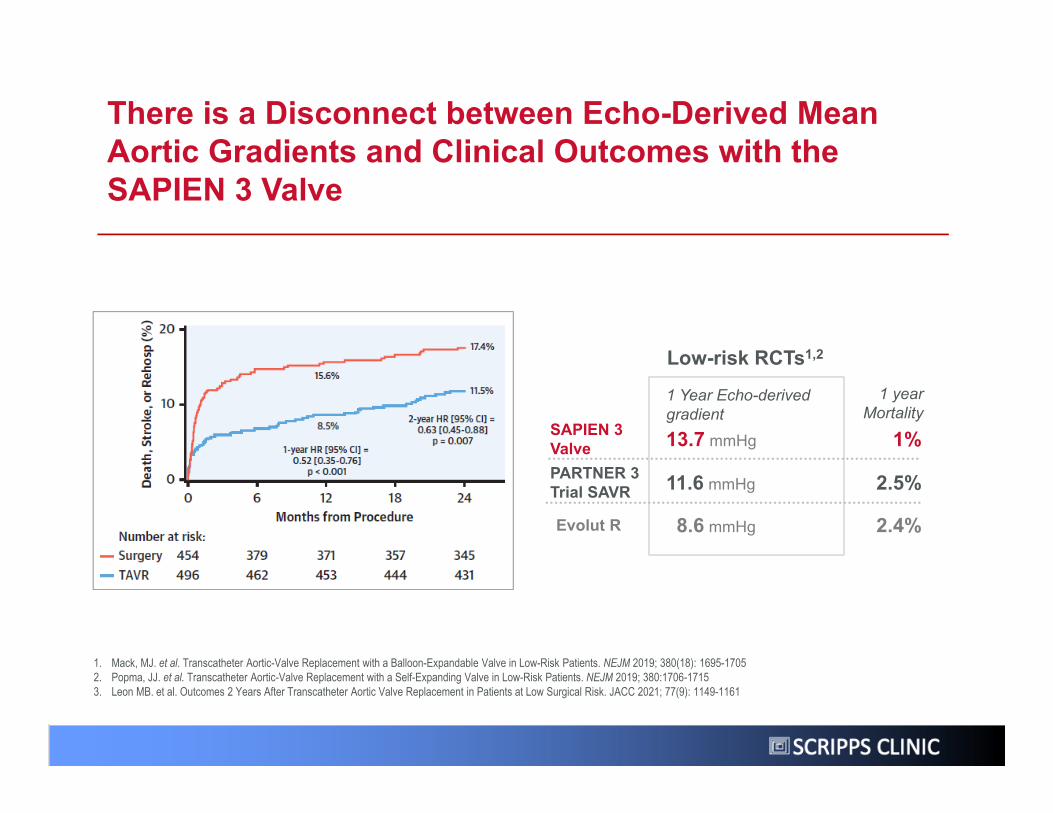
Low-risk RCTs1,2
13.7 mmHg 1%SAPIEN 3 Valve
11.6 mmHg 2.5%PARTNER 3 Trial SAVR
1 Year Echo-derived gradient
1 year Mortality
Evolut R 8.6 mmHg 2.4%
1. Mack, MJ. et al. Transcatheter Aortic-Valve Replacement with a Balloon-Expandable Valve in Low-Risk Patients. NEJM 2019; 380(18): 1695-17052. Popma, JJ. et al. Transcatheter Aortic-Valve Replacement with a Self-Expanding Valve in Low-Risk Patients. NEJM 2019; 380:1706-17153. Leon MB. et al. Outcomes 2 Years After Transcatheter Aortic Valve Replacement in Patients at Low Surgical Risk. JACC 2021; 77(9): 1149-1161
There is a Disconnect between Echo-Derived Mean Aortic Gradients and Clinical Outcomes with the SAPIEN 3 Valve
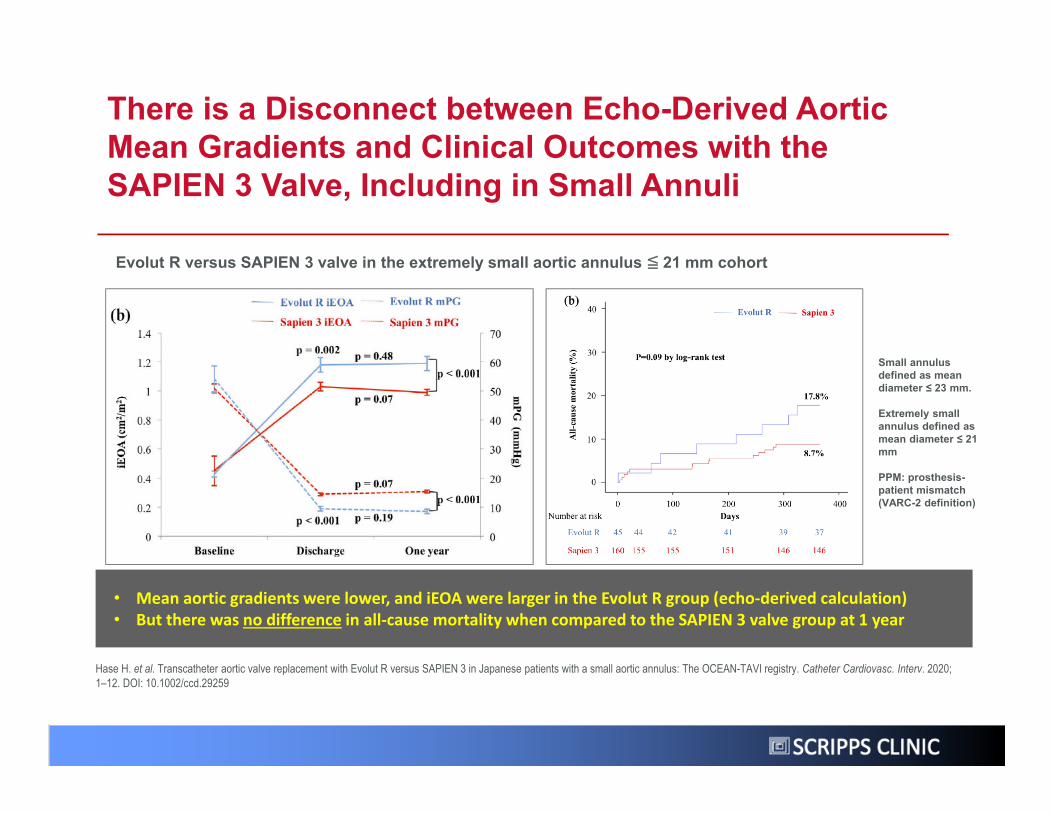
Small annulus defined as mean diameter ≤ 23 mm.
Extremely small annulus defined as mean diameter ≤ 21 mm
PPM: prosthesis-patient mismatch (VARC-2 definition)
Evolut R versus SAPIEN 3 valve in the extremely small aortic annulus ≦ 21 mm cohort
Hase H. et al. Transcatheter aortic valve replacement with Evolut R versus SAPIEN 3 in Japanese patients with a small aortic annulus: The OCEAN-TAVI registry. Catheter Cardiovasc. Interv. 2020; 1–12. DOI: 10.1002/ccd.29259
• Mean aortic gradients were lower, and iEOA were larger in the Evolut R group (echo‐derived calculation)• But there was no difference in all‐cause mortality when compared to the SAPIEN 3 valve group at 1 year
There is a Disconnect between Echo-Derived Aortic Mean Gradients and Clinical Outcomes with the SAPIEN 3 Valve, Including in Small Annuli
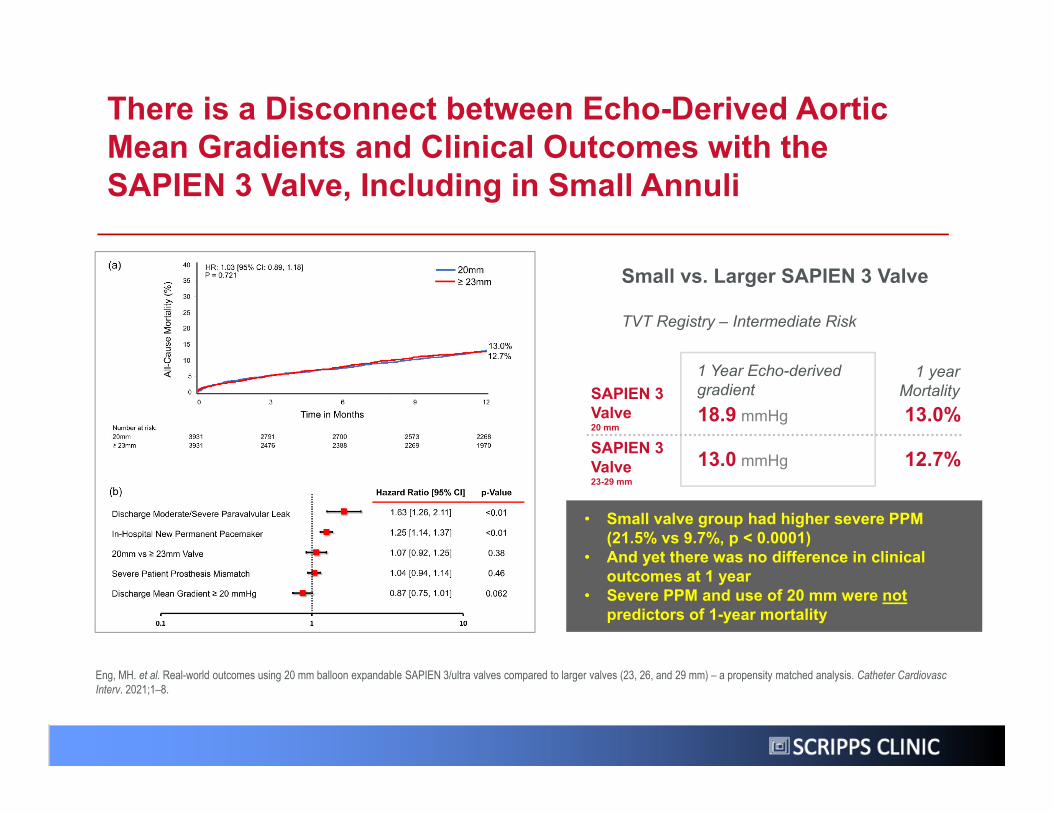
Small vs. Larger SAPIEN 3 Valve
18.9 mmHg 13.0%SAPIEN 3 Valve 20 mm
13.0 mmHg 12.7%SAPIEN 3 Valve 23-29 mm
1 Year Echo-derived gradient
TVT Registry – Intermediate Risk
1 year Mortality
Eng, MH. et al. Real-world outcomes using 20 mm balloon expandable SAPIEN 3/ultra valves compared to larger valves (23, 26, and 29 mm) – a propensity matched analysis. Catheter Cardiovasc Interv. 2021;1–8.
• Small valve group had higher severe PPM (21.5% vs 9.7%, p < 0.0001)
• And yet there was no difference in clinical outcomes at 1 year
• Severe PPM and use of 20 mm were notpredictors of 1-year mortality
There is a Disconnect between Echo-Derived Aortic Mean Gradients and Clinical Outcomes with the SAPIEN 3 Valve, Including in Small Annuli
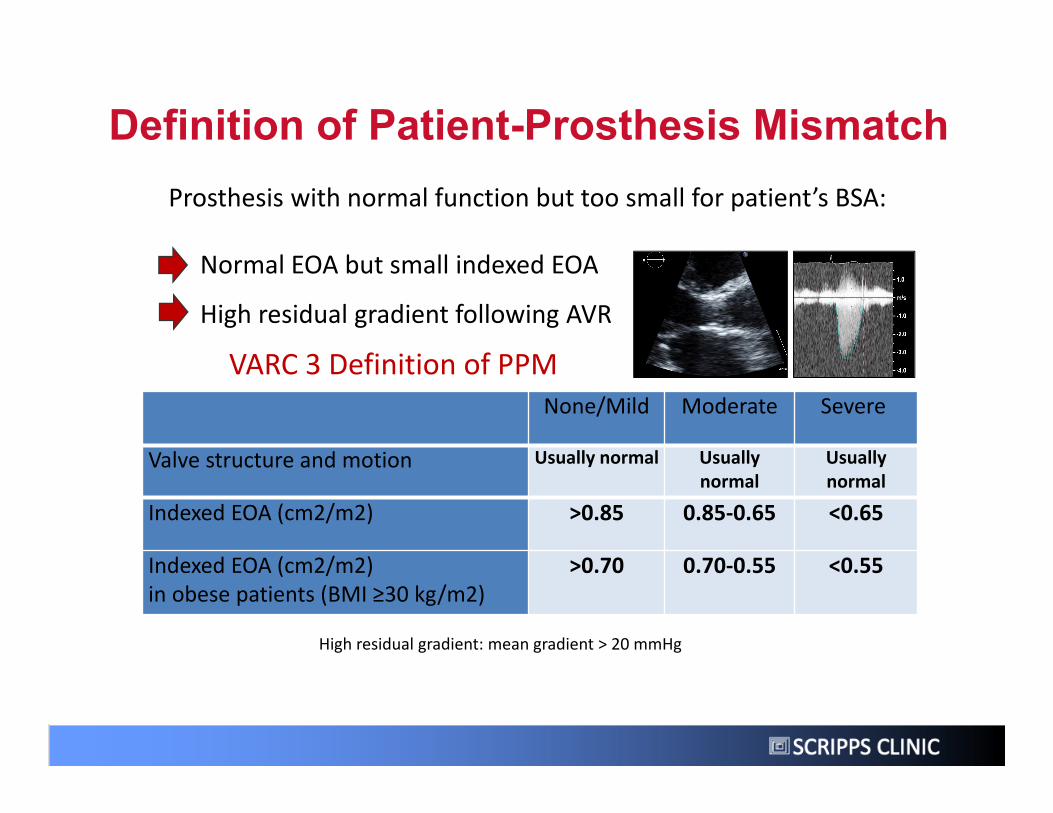
None/Mild Moderate Severe
Valve structure and motion Usually normal Usually normal
Usually normal
Indexed EOA (cm2/m2) >0.85 0.85‐0.65 <0.65
Indexed EOA (cm2/m2)in obese patients (BMI ≥30 kg/m2)
>0.70 0.70‐0.55 <0.55
VARC 3 Definition of PPM
Prosthesis with normal function but too small for patient’s BSA:
Normal EOA but small indexed EOA
High residual gradient following AVR
High residual gradient: mean gradient > 20 mmHg
Definition of Patient-Prosthesis Mismatch
37
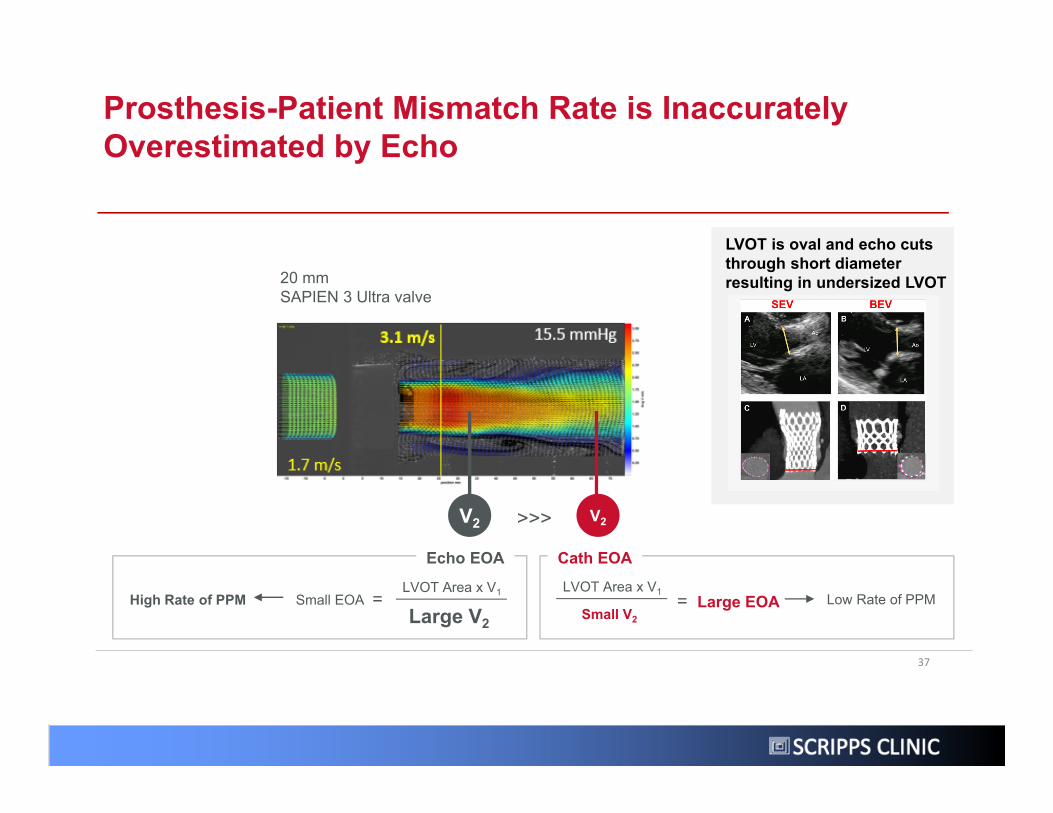
Prosthesis-Patient Mismatch Rate is Inaccurately Overestimated by Echo
Small EOALVOT Area x V1
Large V2=High Rate of PPM
20 mm SAPIEN 3 Ultra valve
Cath EOA
V2 V2>>>
Echo EOA
Low Rate of PPMLarge EOALVOT Area x V1
Small V2=
LVOT is oval and echo cuts through short diameter resulting in undersized LVOT
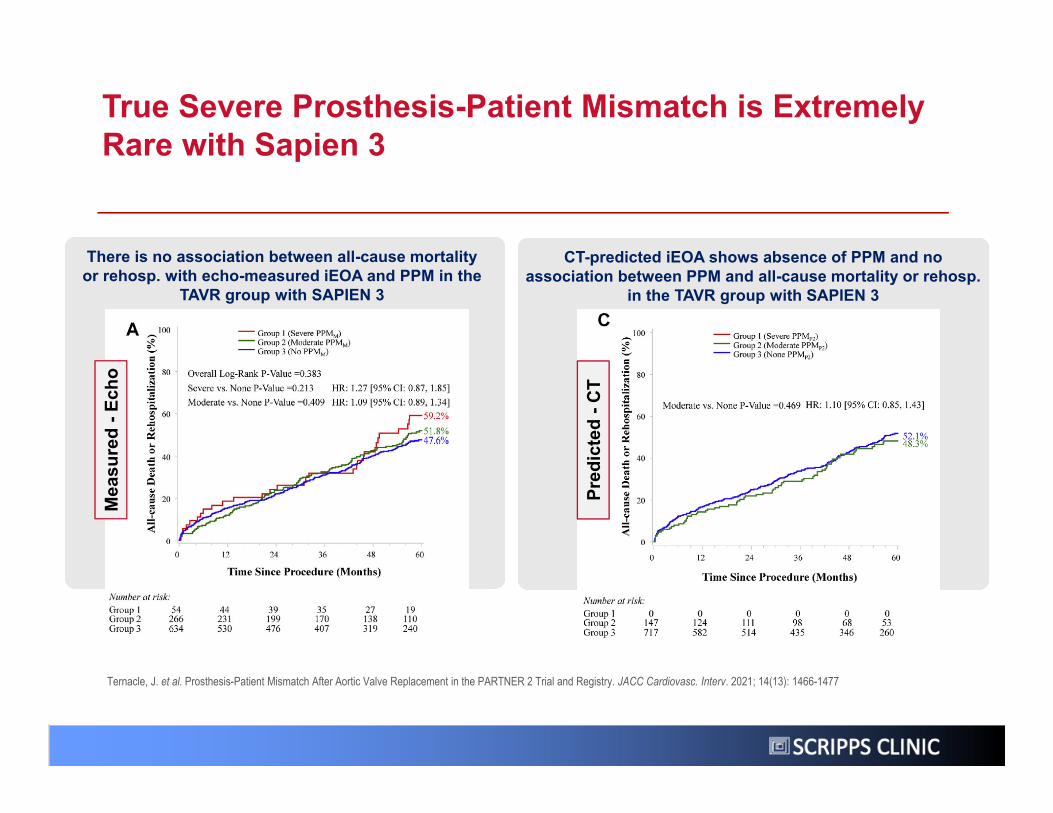
True Severe Prosthesis-Patient Mismatch is Extremely Rare with Sapien 3
Ternacle, J. et al. Prosthesis-Patient Mismatch After Aortic Valve Replacement in the PARTNER 2 Trial and Registry. JACC Cardiovasc. Interv. 2021; 14(13): 1466-1477
There is no association between all-cause mortality or rehosp. with echo-measured iEOA and PPM in the
TAVR group with SAPIEN 3
CT-predicted iEOA shows absence of PPM and no association between PPM and all-cause mortality or rehosp.
in the TAVR group with SAPIEN 3
Mea
sure
d -E
cho
Pred
icte
d -C
T
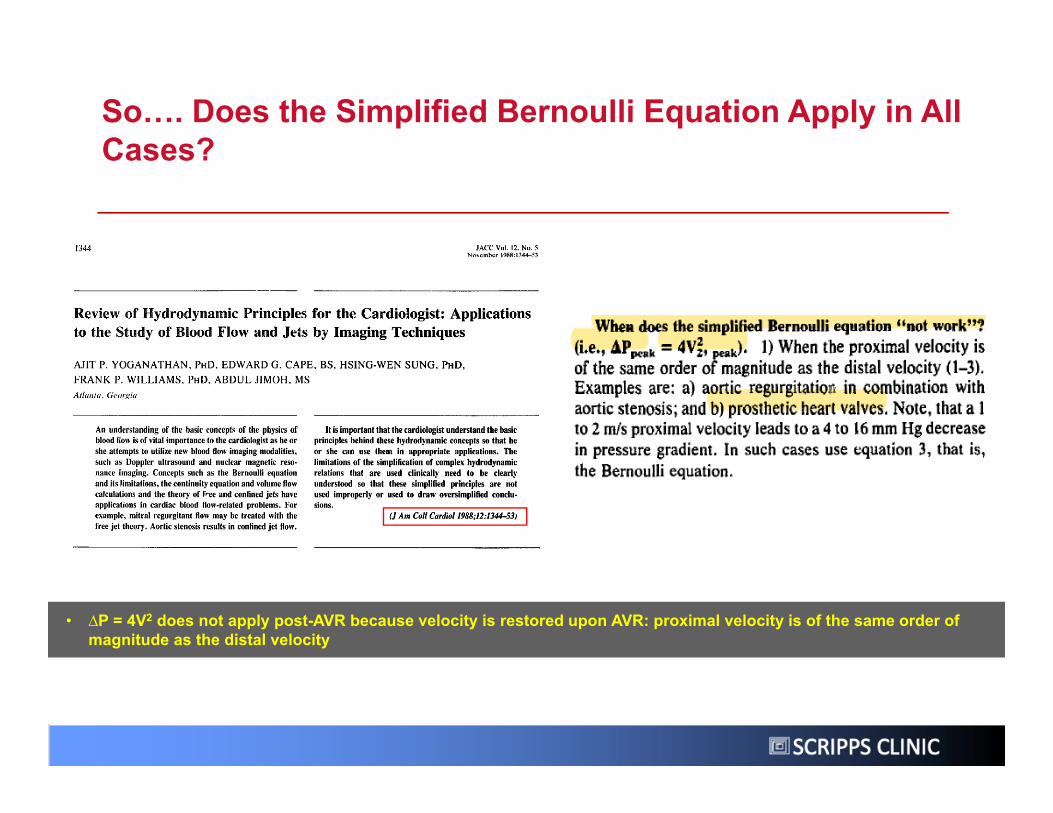
So…. Does the Simplified Bernoulli Equation Apply in All Cases?
• ∆P = 4V2 does not apply post-AVR because velocity is restored upon AVR: proximal velocity is of the same order of magnitude as the distal velocity
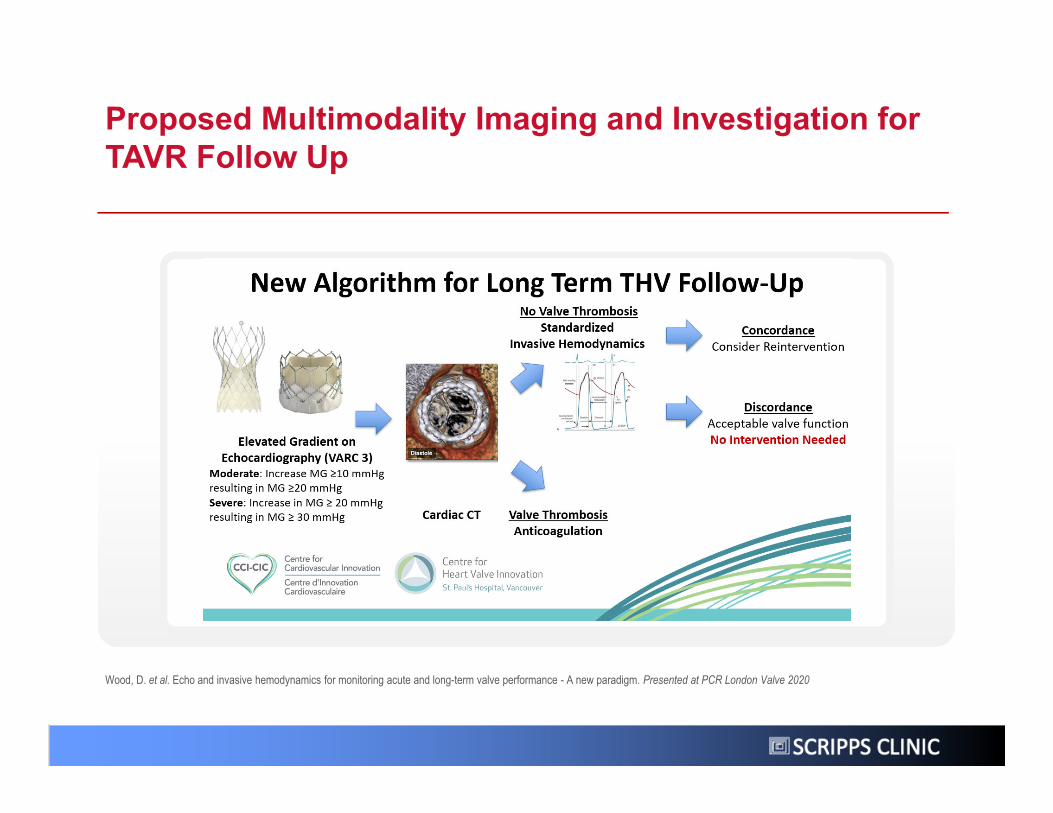
Proposed Multimodality Imaging and Investigation for TAVR Follow Up
Wood, D. et al. Echo and invasive hemodynamics for monitoring acute and long-term valve performance - A new paradigm. Presented at PCR London Valve 2020

SCRIPPS CLINIC

SCRIPPS CLINIC
THESE CLAIMS ARE ALL BASED UPON ECHO DATA WHICH IS KNOWN TO BE INACCURATE!
SCRIPPS CLINIC
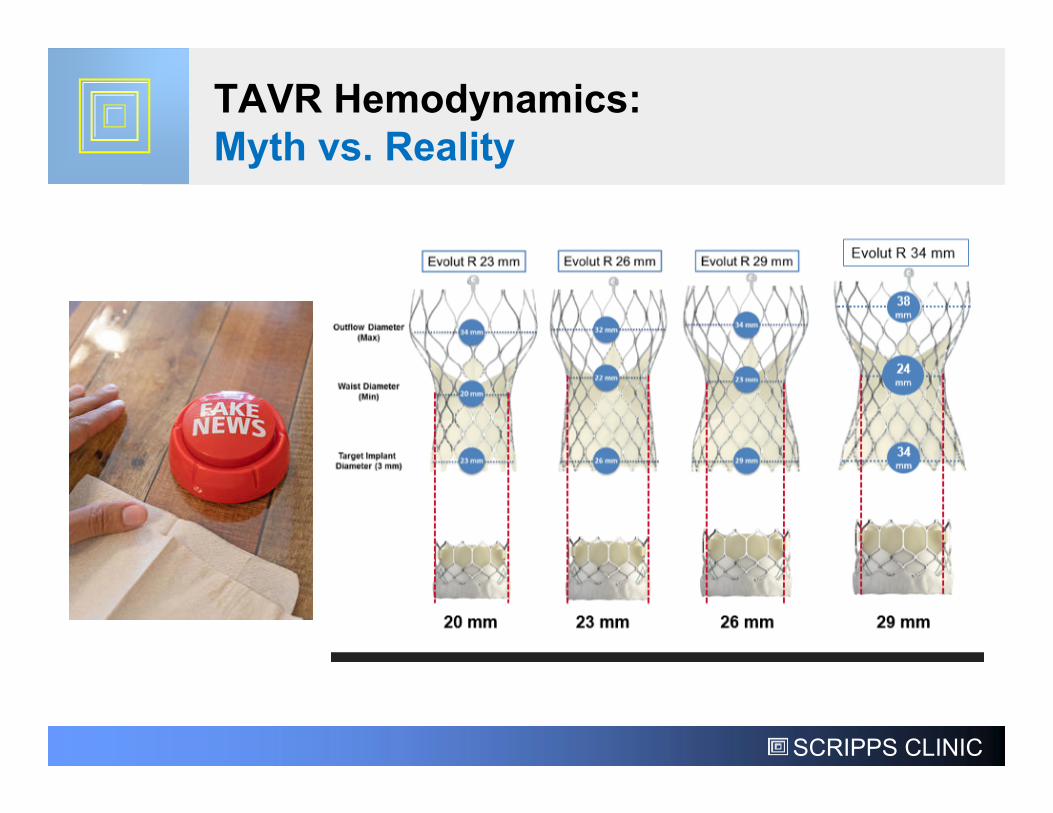
TAVR Hemodynamics:Myth vs. Reality

SCRIPPS CLINIC
Thank You!