the diskspd storage performance toolpugchallenge.org/downloads2016/681 -...
TRANSCRIPT
1 of 28
The DiskSpd Storage Performance Tool DiskSpd is a highly customizable I/O load generator tool that can be used to run storage performance
tests against files, partitions, or physical disks. DiskSpd can generate a wide variety of disk request
patterns for use in analyzing and diagnosing storage performance issues, without running a full end-to-
end workload. You can simulate SQL Server I/O activity or more complex, changing access patterns,
returning detailed XML output for use in automated results analysis.
Contents
1 Vision for the DiskSpd tool................................................................................................................... 3
1.1 Acknowledgments ...................................................................................................................... 3
2 The DiskSpd command and parameters ............................................................................................. 3
2.1 DiskSpd basic parameters ........................................................................................................... 3
2.2 DiskSpd event parameters .......................................................................................................... 7
2.3 ETW parameters for use with DiskSpd.exe................................................................................. 7
2.4 Size conventions for DiskSpd parameters .................................................................................. 8
3 Customizing DiskSpd tests ................................................................................................................... 9
3.1 Display usage information .......................................................................................................... 9
3.2 Set a test duration ...................................................................................................................... 9
3.3 Control caching ........................................................................................................................... 9
3.4 Set random or sequential access hints ..................................................................................... 10
3.5 Block Size .................................................................................................................................. 10
3.6 Test random I/O ........................................................................................................................ 10
3.7 Test sequential I/O ................................................................................................................... 10
3.8 Perform a write test .................................................................................................................. 11
3.9 Set a base target offset ............................................................................................................. 11
3.10 Set the maximum target offset ................................................................................................. 11
3.11 Limit the total number of threads ............................................................................................ 11
3.12 Access from multiple threads & thread stride ......................................................................... 12
3.13 Number of outstanding I/O requests ....................................................................................... 14
3.14 Balance queues ......................................................................................................................... 15
3.15 Alternatively, specify “think” time and I/O Bursts ................................................................... 16
3.16 Rate limits ................................................................................................................................. 16
3.17 Use completion routines instead of I/O completion ports ....................................................... 17
3.18 Set CPU affinity ......................................................................................................................... 17
3.19 Create test files automatically .................................................................................................. 17
3.20 Separate buffers for Read and Write operations ..................................................................... 18
2 of 28
3.21 Include performance counters ................................................................................................. 19
3.22 Display a progress indicator...................................................................................................... 20
3.23 Control the initial state of the random number generator ...................................................... 20
3.24 Run DiskSpd in verbose mode .................................................................................................. 21
3.25 Use named events to synchronize testing ................................................................................ 21
3.26 Use an XML file to provide DiskSpd parameters ...................................................................... 21
4 Canceling a test run (CTRL+C) ............................................................................................................ 22
5 Analyzing DiskSpd test results ........................................................................................................... 22
5.1 Latency ...................................................................................................................................... 23
5.2 IOPs statistics ............................................................................................................................ 24
6 XML results processing ...................................................................................................................... 24
7 Sample command lines ...................................................................................................................... 25
8 Future Improvements ........................................................................................................................ 27
8.1 Verification of written data ...................................................................................................... 27
8.2 Dynamic warm-up .................................................................................................................... 27
3 of 28
1 Vision for the DiskSpd tool The DiskSpd tool provides the functionality needed to generate a wide variety of disk request patterns,
helpful in diagnosis and analysis of storage-based performance issues. For example, it can be used to
simulate SQL Server I/O activity and more complex patterns of access which change over time. It enables
the user to analyze storage performance without running a full end-to-end workload.
DiskSpd presents results in both a text summary and also a detailed XML form suitable for automated
result analysis.
1.1 Acknowledgments
Previous versions of DiskSpd were developed under Jim Gray by Peter Kukol from Microsoft Research,
results from which can be found here: http://research.microsoft.com/barc/Sequential_IO/.
A binary release of DiskSpd can be obtained here: http://aka.ms/diskspd
DiskSpd is open source (MIT License) and can be found here: https://github.com/microsoft/diskspd
2 The DiskSpd command and parameters DiskSpd is a command-line utility that is invoked in the following way:
diskspd [options] target1 [ target2 [ target3 ...] ]
All available options and parameters are enumerated in the tables below, and more completely
described in Section 3. Test targets can be regular files (C:\testfile.dat), partitions (C:), or physical drives
(#1). Parameters can be specified as command line options or in an XML file.
2.1 DiskSpd basic parameters
Table 1 describes basic parameters that configure the DiskSpd tests. For example, the following
command runs a test for 15 seconds using a single thread to drive 100% random 4KiB reads at a depth of
10 overlapped (outstanding) I/Os to a regular file:
diskspd -d15 -F1 -w0 -r -b4k -o10 c:\testfile.dat
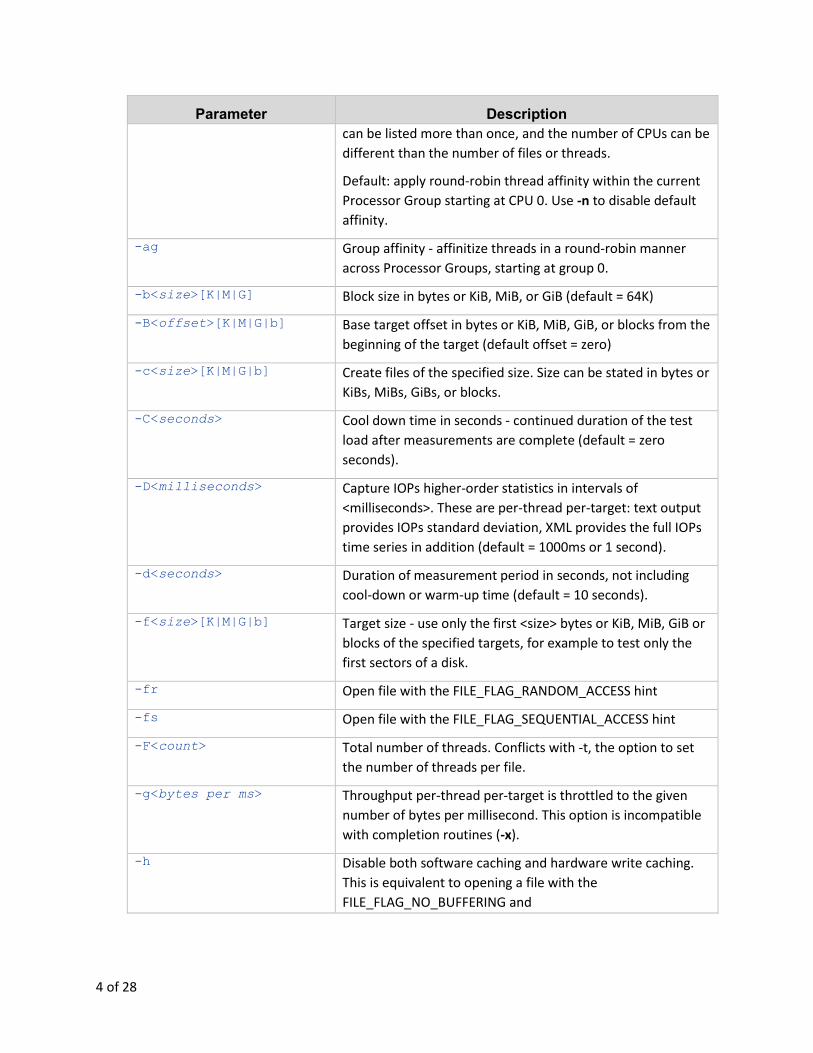
Table 1. DiskSpd parameters
Parameter Description -? Displays usage information for DiskSpd.
-a#[,#[...]] Advanced CPU affinity - affinitize threads to CPUs provided
after -a in a Round Robin manner within the current
Processor Group1 (CPU count starts with zero); the same CPU
1 For more information, see the Processor Group documentation at the following location: http://msdn.microsoft.com/en-us/library/windows/desktop/dd405503(v=vs.85).aspx
4 of 28
Parameter Description
can be listed more than once, and the number of CPUs can be
different than the number of files or threads.
Default: apply round-robin thread affinity within the current
Processor Group starting at CPU 0. Use -n to disable default
affinity.
-ag Group affinity - affinitize threads in a round-robin manner
across Processor Groups, starting at group 0.
-b<size>[K|M|G] Block size in bytes or KiB, MiB, or GiB (default = 64K)
-B<offset>[K|M|G|b] Base target offset in bytes or KiB, MiB, GiB, or blocks from the
beginning of the target (default offset = zero)
-c<size>[K|M|G|b] Create files of the specified size. Size can be stated in bytes or
KiBs, MiBs, GiBs, or blocks.
-C<seconds> Cool down time in seconds - continued duration of the test
load after measurements are complete (default = zero
seconds).
-D<milliseconds> Capture IOPs higher-order statistics in intervals of
<milliseconds>. These are per-thread per-target: text output
provides IOPs standard deviation, XML provides the full IOPs
time series in addition (default = 1000ms or 1 second).
-d<seconds> Duration of measurement period in seconds, not including
cool-down or warm-up time (default = 10 seconds).
-f<size>[K|M|G|b] Target size - use only the first <size> bytes or KiB, MiB, GiB or
blocks of the specified targets, for example to test only the
first sectors of a disk.
-fr Open file with the FILE_FLAG_RANDOM_ACCESS hint
-fs Open file with the FILE_FLAG_SEQUENTIAL_ACCESS hint
-F<count> Total number of threads. Conflicts with -t, the option to set
the number of threads per file.
-g<bytes per ms> Throughput per-thread per-target is throttled to the given
number of bytes per millisecond. This option is incompatible
with completion routines (-x).
-h Disable both software caching and hardware write caching.
This is equivalent to opening a file with the
FILE_FLAG_NO_BUFFERING and

5 of 28
Parameter Description
FILE_FLAG_WRITE_THROUGH flags (default: caching is
enabled).
Note: SATA devices will generally not honor write through
intent. Devices with persistent write caches - certain
enterprise flash drives, and most storage arrays - tend to
interpret write through as being satisfied when the write is
stable in cache, so that -S and -h will see equivalent behavior.
-i<count> Number of IOs (burst size) to issue before pausing. Must be
specified in combination with -j.
-j<milliseconds> Pause in milliseconds before issuing a burst of IOs. Must be
specified in combination with -i.
-I<priority> Set IO priority to <priority>. Available values are: 1-very low,
2-low, 3-normal (default).
-l Use large pages for IO buffers.
-L Measure latency statistics. Full per-thread per-target
distributions are available with XML result output.
-n Disable default affinity (-a).
-o<count> Number of outstanding I/O requests per target per thread. (1
= synchronous I/O, unless more than 1 thread is specified
with by using -F) (default = 2).
-p Start asynchronous (overlapped) I/O operations with the
same offset. Only applicable with 2 or more outstanding I/O
requests per thread (-o2 or greater)
-P<count> Enable printing a progress dot after the specified each
<count> [default = 65536] completed of I/O operations,
counted separately by each thread.
-r<alignment>[K|M|G|b] Random I/O aligned to the specified number of <align> bytes
or KiB, MiB, GiB, or blocks. Overrides -s.
-R[text|xml] Display test results in either text or XML format (default:
text).
-s[i]<size>[K|M|G|b] Sequential stride size, offset between subsequent I/O
operations in bytes or KiB, MiB, GiB, or blocks. Ignored if -r
specified (default access = sequential, default stride = block
size).
By default each thread tracks its own sequential offset. If the
optional interlocked (i) qualifier is used, a single interlocked

6 of 28
Parameter Description
offset is shared between all threads operating on a given
target so that the threads cooperatively issue a single
sequential pattern of access to the target.
-S Disable software caching. This is equivalent to opening a file
with the FILE_FLAG_NO_BUFFERING flag specified. This
option is included in -h (default: caching is enabled).
-t<count> Number of threads per target. Conflicts with -F, which
specifies the total number of threads.
-T<offset>[K|M|G|b] Stride size between I/O operations performed on the same
target by different threads in bytes or KiB, MiB, GiB, or blocks
(default stride size = 0; starting offset = base file offset +
(<thread number> * <offset>). Makes sense only when
number of threads per target > 1.
-v Verbose mode
-w<percentage> Percentage of write requests to issue (default = 0, 100%
read). The following are equivalent and result in a 100% read-
only workload: omitting -w, specifying -w with no percentage,
and -w0.
IMPORTANT: a write test will destroy existing data without a
warning.
-W<seconds> Warmup time - duration of the test before measurements
start (default = 5 seconds).
-x Use I/O completion routines instead of I/O completion ports
for cases specifying more than one IO per thread2 (see -o).
Unless there is a specific reason to explore differences in the
completion model, this should generally be left at default.
-X<filepath> Use an XML file for configuring the workload. Cannot be used
with other parameters. XML output <Profile> block is a
template. See the diskspd.xsd file for details.
-z[seed] Set random seed to specified integer value. With no -z,
seed=0. With plain -z, seed is based on system run time.
2 See the Synchronous and Asynchronous I/O topic here for more details: http://msdn.microsoft.com/en-us/library/windows/desktop/aa365683(v=vs.85).aspx
7 of 28
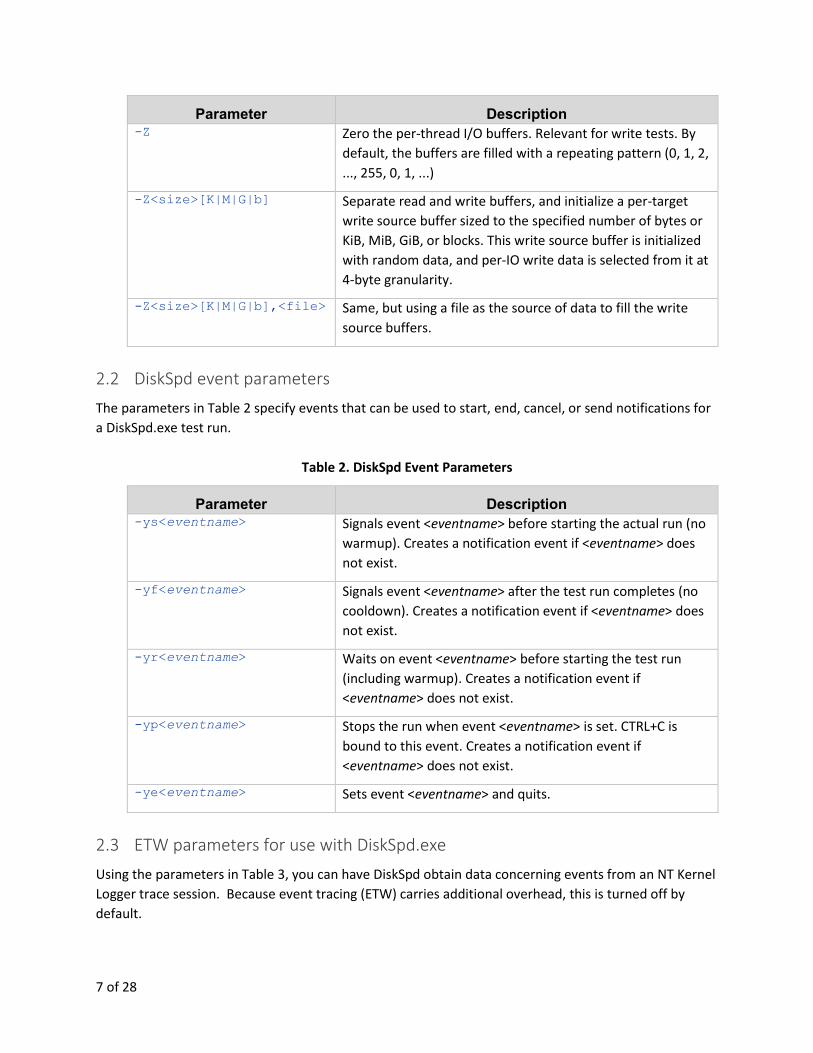
Parameter Description -Z Zero the per-thread I/O buffers. Relevant for write tests. By
default, the buffers are filled with a repeating pattern (0, 1, 2,
..., 255, 0, 1, ...)
-Z<size>[K|M|G|b] Separate read and write buffers, and initialize a per-target
write source buffer sized to the specified number of bytes or
KiB, MiB, GiB, or blocks. This write source buffer is initialized
with random data, and per-IO write data is selected from it at
4-byte granularity.
-Z<size>[K|M|G|b],<file> Same, but using a file as the source of data to fill the write
source buffers.
2.2 DiskSpd event parameters
The parameters in Table 2 specify events that can be used to start, end, cancel, or send notifications for
a DiskSpd.exe test run.
Table 2. DiskSpd Event Parameters
Parameter Description -ys<eventname> Signals event <eventname> before starting the actual run (no
warmup). Creates a notification event if <eventname> does
not exist.
-yf<eventname> Signals event <eventname> after the test run completes (no
cooldown). Creates a notification event if <eventname> does
not exist.
-yr<eventname> Waits on event <eventname> before starting the test run
(including warmup). Creates a notification event if
<eventname> does not exist.
-yp<eventname> Stops the run when event <eventname> is set. CTRL+C is
bound to this event. Creates a notification event if
<eventname> does not exist.
-ye<eventname> Sets event <eventname> and quits.
2.3 ETW parameters for use with DiskSpd.exe
Using the parameters in Table 3, you can have DiskSpd obtain data concerning events from an NT Kernel
Logger trace session. Because event tracing (ETW) carries additional overhead, this is turned off by
default.

8 of 28
Table 3. DiskSpd ETW parameters
Parameter Description -e<q|c|s> Use query perf timer (qpc), cycle count, or system timer
respectively (default = q, query perf timer (qpc))
-ep Use paged memory for the NT Kernel Logger (default = non-
paged memory).
-ePROCESS Capture process start and end events.
-eTHREAD Capture thread start and end events.
-eIMAGE_LOAD Capture image load events.
-eDISK_IO Capture physical disk I/O events.
-eMEMORY_PAGE_FAULTS Capture all page fault events.
-eMEMORY_HARD_FAULTS Capture hard fault events.
-eNETWORK Capture TCP/IP, UDP/IP send and receive events.
-eREGISTRY Capture registry call events.
2.4 Size conventions for DiskSpd parameters
Several DiskSpd options take sizes and offsets specified as bytes or as a multiple of kilobytes, megabytes,
gigabytes, or blocks: [K|M|G|b].
The conventions used for referring to multiples of bytes are a common source of confusion. In
networking and communication, these multiples are universally in powers of ten: a ‘GB’ is 109 (1 billion)
bytes. By comparison, a ‘GB’ of RAM is universally understood to be 230 (1,073,741,824) bytes. Storage
has historically been in a gray area where file sizes are spoken of in powers of two, but storage system
manufacturers refer to total capacity in powers of ten. Since storage is always accessed over at least one
(SAS, SATA) or more (PCI, Ethernet, Infiniband) communication links, this adds complexity into the
already challenging exercise of understanding end-to-end flows.
The iB notation is an international convention which unambiguously refers to power of two-based sizing
for numbers of bytes, as distinct from powers of ten which continue to use KB/MB/GB notation.
1KiB = 210 = 1,024 bytes
1MiB = 1024 KiB = 220 = 1,048576 bytes
1GiB = 1024 MiB = 230 = 1,073,741,824 bytes
This notation will be used in this document. DiskSpd itself reports power of two-based quantities
without the iB notation, though this may evolve over time.
To specify sizes to DiskSpd:
bytes: use a plain number (65536)
KiB: suffix a number with ‘K’ or ‘k’ (64k)

9 of 28
MiB: suffix a number with ‘M’ or ‘m’ (1m)
GiB: suffix a number with ‘G’ or ‘g’ (10g)
multiples of blocks: suffix a number with ‘b’ (5b) - multiplying the block size specified with -b
Fractional sizes with decimal points such as 10.5 are not allowed.
3 Customizing DiskSpd tests The following sections explain how you can use the DiskSpd parameters to customize tests so that they
more closely emulate the performance factors that your environment requires.
3.1 Display usage information
To display a short description of all available options, use the -? parameter.
3.2 Set a test duration
The default measured test duration is 10 seconds. This can be changed with the -d parameter, for
example -d50 will result in a ~50s long test. Actual measured test duration may be slightly longer than
the requested time because of additional thread synchronization and precision of operating system’s
sleep methods. The actual duration of the test is reported as part of the results.
A warmup time may also be specified, during which the specified I/O requests are being issued but no
measurements are performed. The default warmup duration is 5 seconds, and can be changed using the
-W parameter (for example, -W10 sets a 10-second warmup).
A cool-down period can be specified using the -C parameter; for example, -C5 adds a 5-second cool-
down period. The default cool-down time is 0 seconds. A use case for cool-down is to ensure that,
especially in multi-system tests, all instances of DiskSpd are active during each instance’s measurement
period. Specify a cool-down which is at least as long as the time taken to launch the DiskSpd instances
on the systems providing the test.
3.3 Control caching
To disable software (operating system) caching, use the -S parameter. Disabling the software cache
introduces additional constraints:
File access must begin at byte offsets within the file that are integer multiples of the volume's
sector size.
File access must be for numbers of bytes that are integer multiples of the volume's sector size.
For example, if the sector size is 512 bytes, an application can request reads and writes of 512,
1024, or 2048 bytes, but not of 335, 981, or 7171 bytes.
This parameter is equivalent to using FILE_FLAG_NO_BUFFERING on the Win32 CreateFile API.
The -h parameter disables both software caching and hardware write caching, and has the same
constraints that apply to disabling software caching. It is equivalent to using both
FILE_FLAG_NO_BUFFERING and FILE_FLAG_WRITE_THROUGH on the Win32 CreateFile API.

10 of 28
SATA devices will generally not honor the write through intent that -h specifies. Devices with persistent
write caches - certain enterprise flash drives, and most storage arrays - tend to interpret write through
as being satisfied when the write is stable in cache, so that -S and -h will see equivalent behavior.
3.4 Set random or sequential access hints
The -fr and -fs parameters result in, respectively, the random-access and sequential-only hints being
indicated to the operating system when opening the targets.
These hints are generally applicable only to files, and only if software caching is enabled for the test.
They are equivalent to using the following flags on the Win32 CreateFile API:
-fr : FILE_FLAG_RANDOM_ACCESS
-fs : FILE_FLAG_SEQUENTIAL_SCAN
3.5 Block Size
The block size used for IO operations is set with the -b parameter. The default value is 64KiB.
3.6 Test random I/O
The -r parameter turns on random I/O access. The file offset at which the I/O operation will be
performed is chosen randomly before each I/O operation. All offsets are aligned to the size specified
with the -r parameter.
If you use the -r parameter without specifying the size, offsets are block-aligned. The block size is set
with the -b parameter.
This parameter can't be used with the -s parameter, because -s defines the offset for the next I/O
operation, and in case of random I/O the offset of the next operation is not a constant value. If both -r
and -s are specified, -r overrides -s.
3.7 Test sequential I/O
The -s sequential I/O parameter specifies the stride from the prior I/O to the next operation. For
example, if a 64KiB stride is chosen for a 4KiB block size, the first IO will be at zero, the second at 64KiB,
and so forth.
After the whole file is read, I/O resumes at the base offset (-B) or zero, as appropriate.
If multiple threads operate on a single target, the threads will operate independently and the target will
see multiple sequential streams. This is most useful with sequential stride (-T, see Section 3.12).
If the optional interlocked (i) qualifier is used, -si, a single interlocked offset is shared between all
threads operating on a given target. This mode is most useful when a single sequential pattern is desired
and a single thread is unable to fully drive very fast storage.

11 of 28
3.8 Perform a write test
Use the -w parameter to specify the mix of IO operations, as a percentage of write requests to issue in
increments of 1%. The default is 0% write, or 100% read.
The following are equivalent and result in a 100% read-only workload: omitting -w, specifying -w with no
percentage, and -w0.
As example of a mixed load -w10 will result in a 10% write workload, with the remaining 90% being
reads. This is implemented as a random choice at the dispatch of each operation. DiskSpd does not track
the resulting mix, and instead relies on the long term behavior of the random number generator to
deliver the expected ratio.
CAUTION: a write test will destroy existing data without a warning.
3.9 Set a base target offset
To omit the beginning of a target during testing, use the -B parameter to specify a base target offset.
The default offset is zero. No I/O operations will be performed between the start of the target and the
base offset.
random operations (-r) are issued at base + <random offset>
sequential operations (-s) wrap back to the base offset when they pass the end of the target
For example, the following command runs a 10-second test on physical drive 1 with a block size of 8KiB,
and skips the first 10 blocks (80KiB):
diskspd -b8K -B10b #1
3.10 Set the maximum target offset
The maximum offset in the target to be tested can be specified with the -f parameter. If specified,
DiskSpd will not access beyond that point in the file, partition, or disk. This option is especially useful for
testing first sectors of physical drives. In combination with -B (Section 3.9) the total range of the target
to be tested can be controlled.
3.11 Limit the total number of threads
One thread can run a test against more than one target (file, physical drive, partition). The total number
of threads can be set with the -F (fixed threads) parameter. For example, the following command uses 2
threads, each accessing 5 files:
diskspd -F2 -o2 file1 file2 file3 file4 file5
In this example, -F2 causes only two threads to be created. Each thread will access all of the files, with
two outstanding operations per target (-o2). As a result, there are 5 x 2 = 10 outstanding operations per
thread and 2 x 10 = 20 total operations.
By contrast, the -t (per-target threads) parameter creates sets of threads which only access a specific
target.

12 of 28
diskspd -t2 -o2 file1 file2 file3 file4 file5
In this example, the -t2 parameter causes two threads per target to be started, for 5 x 2 = 10 total
threads with 2 outstanding operations each. Again, this would produce 2 x 10 = 20 total operations.
The -F parameter is especially useful for balancing the workload on multiprocessor (or multi-core)
systems. You can set -F to the number of processors in the system. By default, the threads are affinitized
in a Round Robin manner, which distributes processing evenly across the CPUs, enabling you to test a
more devices simultaneously before you hit a CPU bottleneck.
The -F and -t parameters are mutually exclusive. Figure 1 and Figure 2 illustrate the differences between
-t and -F.
Thread Thread Thread
Figure 1. Threads specified with the -F (-F3) fixed threads parameter
Thread Thread Thread Thread Thread Thread
Figure 2. Threads specified with the -t (-t3) per-target threads parameter
3.12 Access from multiple threads & thread stride
By default, a target is accessed by only one thread, although that thread can contain more than one
overlapped I/O operation.
With the -t or -F parameters discussed in the previous section multiple threads will access the same file.
By default, threads performing sequential operations will all start from offset 0 (zero) of the target. Use
the -T parameter to specify the offset between threads (thread stride) if necessary.
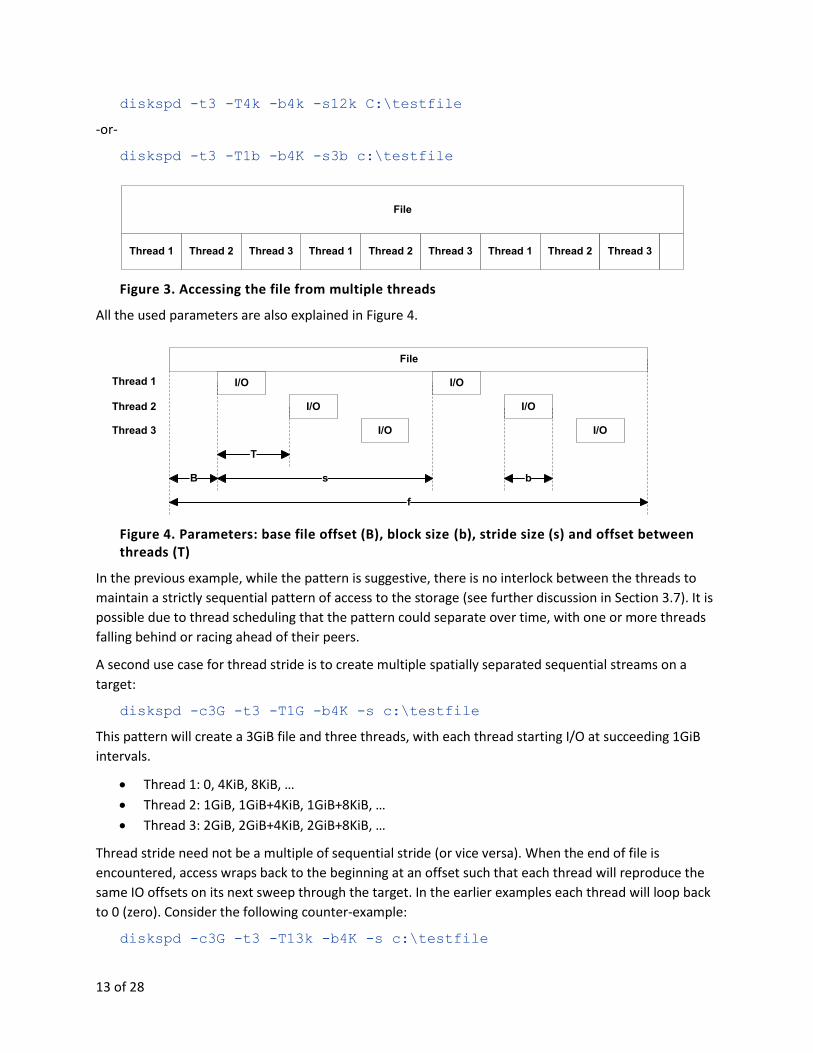
Figure 3 shows an example of access with stride creating a interleaved pattern between multiple
threads. Thread 1 accesses blocks 1, 4, and 7 of the file. Thread 2 accesses blocks 2, 5, and 8, and
thread 3 accesses blocks 3, 6, and 9.
To get such a pattern, thread stride (-T) must be equal to block size (-b) and sequential stride size (-s)
must equal number of threads (in this case 3) times the block size. This is a case where specifying strides
in units of blocks can be more concise. Either of the following commands will produce that pattern:
13 of 28
diskspd -t3 -T4k -b4k -s12k C:\testfile
-or-
diskspd -t3 -T1b -b4K -s3b c:\testfile
Thread 1 Thread 2 Thread 3Thread 1 Thread 1 Thread 2Thread 2 Thread 3 Thread 3
File
Figure 3. Accessing the file from multiple threads
All the used parameters are also explained in Figure 4.
I/O
I/O
I/O
I/O
I/O
I/O
File
B
T
s b
Thread 1
Thread 2
Thread 3
f
Figure 4. Parameters: base file offset (B), block size (b), stride size (s) and offset between threads (T)
In the previous example, while the pattern is suggestive, there is no interlock between the threads to
maintain a strictly sequential pattern of access to the storage (see further discussion in Section 3.7). It is
possible due to thread scheduling that the pattern could separate over time, with one or more threads
falling behind or racing ahead of their peers.
A second use case for thread stride is to create multiple spatially separated sequential streams on a
target:
diskspd -c3G -t3 -T1G -b4K -s c:\testfile
This pattern will create a 3GiB file and three threads, with each thread starting I/O at succeeding 1GiB
intervals.
Thread 1: 0, 4KiB, 8KiB, …
Thread 2: 1GiB, 1GiB+4KiB, 1GiB+8KiB, …
Thread 3: 2GiB, 2GiB+4KiB, 2GiB+8KiB, …
Thread stride need not be a multiple of sequential stride (or vice versa). When the end of file is
encountered, access wraps back to the beginning at an offset such that each thread will reproduce the
same IO offsets on its next sweep through the target. In the earlier examples each thread will loop back
to 0 (zero). Consider the following counter-example:
diskspd -c3G -t3 -T13k -b4K -s c:\testfile
14 of 28
In this case, the second thread will loop back to offset 1K and then produce 5K, 9K, before returning to
13K and continuing through the file again.
3.13 Number of outstanding I/O requests
The default number of outstanding I/O requests per thread per target is 2. This value can be changed
with the -o parameter; for example, -o32 specifies 32 I/O requests per thread per target. If -o1 is used
and threads are accessing only one target (-F is not used or there is only one target specified), I/O is
issued synchronously.
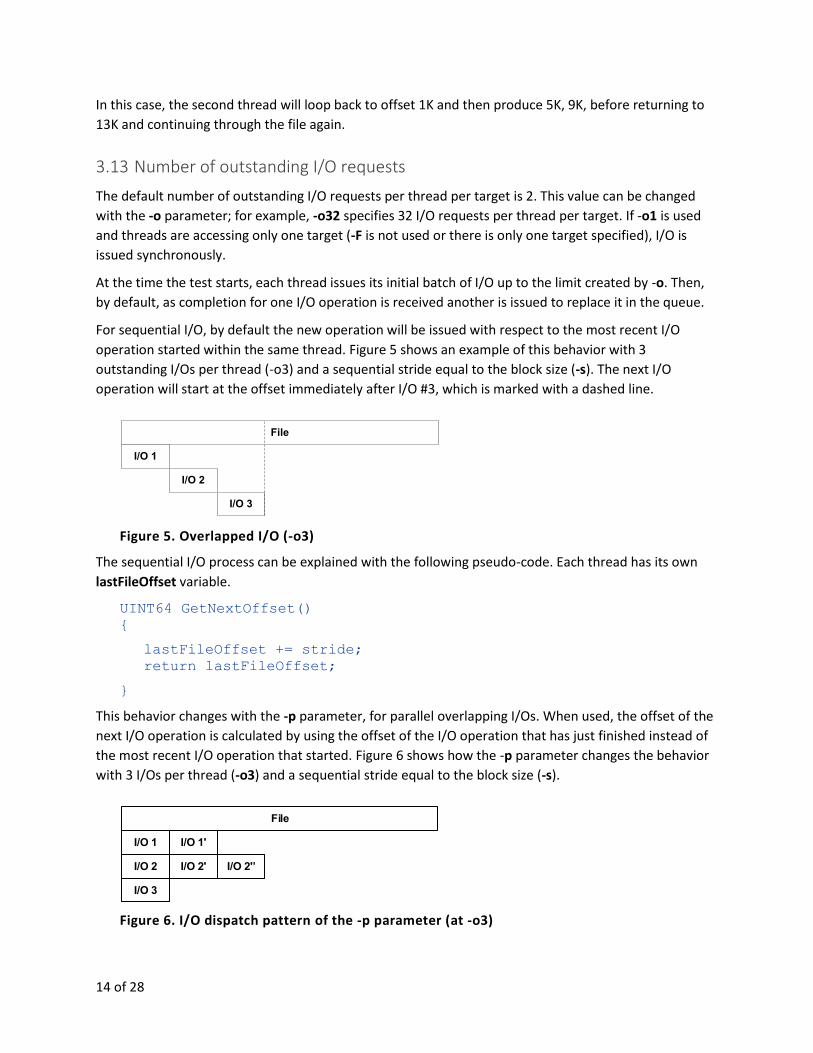
At the time the test starts, each thread issues its initial batch of I/O up to the limit created by -o. Then,
by default, as completion for one I/O operation is received another is issued to replace it in the queue.
For sequential I/O, by default the new operation will be issued with respect to the most recent I/O
operation started within the same thread. Figure 5 shows an example of this behavior with 3
outstanding I/Os per thread (-o3) and a sequential stride equal to the block size (-s). The next I/O
operation will start at the offset immediately after I/O #3, which is marked with a dashed line.
File
I/O 1
I/O 2
I/O 3
Figure 5. Overlapped I/O (-o3)
The sequential I/O process can be explained with the following pseudo-code. Each thread has its own
lastFileOffset variable.
UINT64 GetNextOffset()
{
lastFileOffset += stride;
return lastFileOffset;
}
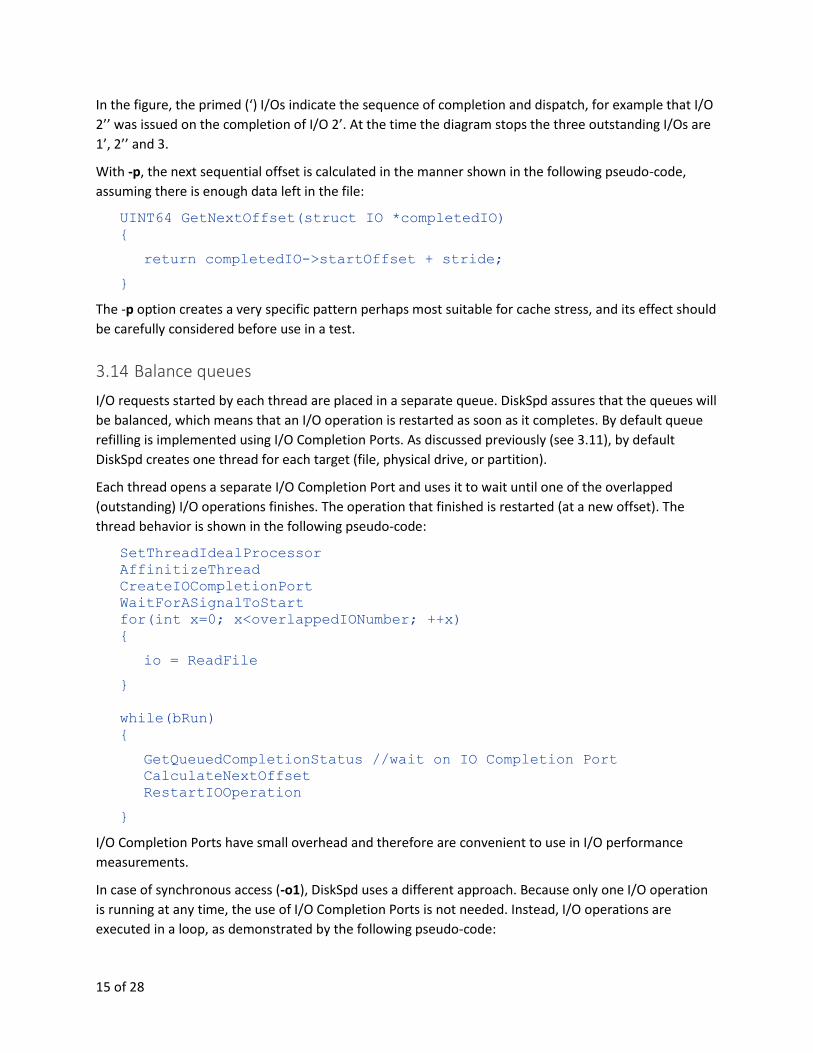
This behavior changes with the -p parameter, for parallel overlapping I/Os. When used, the offset of the
next I/O operation is calculated by using the offset of the I/O operation that has just finished instead of
the most recent I/O operation that started. Figure 6 shows how the -p parameter changes the behavior
with 3 I/Os per thread (-o3) and a sequential stride equal to the block size (-s).
File
I/O 1 I/O 1'
I/O 2
I/O 3
I/O 2' I/O 2'
Figure 6. I/O dispatch pattern of the -p parameter (at -o3)
15 of 28
In the figure, the primed (‘) I/Os indicate the sequence of completion and dispatch, for example that I/O
2’’ was issued on the completion of I/O 2’. At the time the diagram stops the three outstanding I/Os are
1’, 2’’ and 3.
With -p, the next sequential offset is calculated in the manner shown in the following pseudo-code,
assuming there is enough data left in the file:
UINT64 GetNextOffset(struct IO *completedIO)
{
return completedIO->startOffset + stride;
}
The -p option creates a very specific pattern perhaps most suitable for cache stress, and its effect should
be carefully considered before use in a test.
3.14 Balance queues
I/O requests started by each thread are placed in a separate queue. DiskSpd assures that the queues will
be balanced, which means that an I/O operation is restarted as soon as it completes. By default queue
refilling is implemented using I/O Completion Ports. As discussed previously (see 3.11), by default
DiskSpd creates one thread for each target (file, physical drive, or partition).
Each thread opens a separate I/O Completion Port and uses it to wait until one of the overlapped
(outstanding) I/O operations finishes. The operation that finished is restarted (at a new offset). The
thread behavior is shown in the following pseudo-code:
SetThreadIdealProcessor
AffinitizeThread
CreateIOCompletionPort
WaitForASignalToStart
for(int x=0; x<overlappedIONumber; ++x)
{
io = ReadFile
}
while(bRun)
{
GetQueuedCompletionStatus //wait on IO Completion Port
CalculateNextOffset
RestartIOOperation
}
I/O Completion Ports have small overhead and therefore are convenient to use in I/O performance
measurements.
In case of synchronous access (-o1), DiskSpd uses a different approach. Because only one I/O operation
is running at any time, the use of I/O Completion Ports is not needed. Instead, I/O operations are
executed in a loop, as demonstrated by the following pseudo-code:

16 of 28
SetThreadIdealProcessor
AffinitizeThread
CreateIOCompletionPort
WaitForASignalToStart
while(bRun)
{
ReadFile
CalculateNextOffset
SetFilePointer
}
In both cases, the bRun global variable is used by the main thread to inform the worker threads how
long they should work. The main thread of the I/O request generator works in the following manner:
OpenFiles
CreateThreads
StartTimer
SendStartSignal
Sleep(duration)
bRun = false
StopTimer
WaitForThreadsToCleanUp
SendResultsToResultParser
3.15 Alternatively, specify “think” time and I/O Bursts
An exception to purely balanced queue operation is a specification of I/O dispatch scheduling in terms of
per-thread per-target “think” time and I/O burst size. This can be specified with the combination of -i
and -j parameters.
-i<count> : number of I/Os to issue per burst
-j<milliseconds> : number of milliseconds to pause between bursts
Ensure that there is sufficient outstanding I/O allowed (-o) to achieve the intended bursts. Storage
latency may prevent the system from achieving the rates theoretically specified with these parameters.
3.16 Rate limits
A more advanced exception to balanced queue operation can be specified with the -g parameter, which
specifies a target number of bytes to operate on per-millisecond per-thread per-target.
The following example targets 80 bytes/millisecond * 1000 milliseconds/second = 80,000 bytes/second,
or equivalently 80,000 bytes/second / 8KiB/IO = ~9.8 IOPs.
diskspd -t1 -o1 -s8k -b8k -h -w100 -g80 c:\test1
By adding a second file, the following example doubles the total I/O target to 160,000 bytes/second, or
~19.5 IOPs.
diskspd -t1 -o1 -s8k -b8k -h -w100 -g80 c:\test1 c:\test2

17 of 28
Adding a second thread doubles the total I/O target again to 320,000 bytes/second, or ~39.1 IOPs.
diskspd -t2 -o1 -s8k -b8k -h -w100 -g80 c:\test1 c:\test2
The precision of rate limits can be affected by thread scheduling, total CPU consumption, instantaneous
storage latency and other factors. Longer total test times will generally converge on the requested rate
limits. If rate limits aren’t reached, consider providing additional outstanding I/Os (-o) to threads,
dividing work across adding additional threads (-t or -F) or, as appropriate to test goals, adding targets.
In general effective use of rate limits may require some experimentation.
3.17 Use completion routines instead of I/O completion ports
As stated earlier, DiskSpd by default uses I/O completion ports to refill outstanding operation queues.
However, Completion Routines can also be used. The -x parameter instructs DiskSpd to use I/O
completion routines instead of I/O completion ports.
When using completion routines the next I/O dispatched from the completion routine as opposed to
returning to a single master loop, as with I/O completion ports.
3.18 Set CPU affinity
Thread migration can produce inconsistent results during performance testing. For that reason, DiskSpd
by default affinitizes all of its threads to CPU cores in a Round Robin manner starting at logical CPU 0.
The thread’s ideal processor is set to the CPU that it has been affinitized to. This default affinity can be
turned off by the -n parameter.
Advanced CPU affinity can be turned on by the -a parameter, followed by the CPU numbers separated
by commas (for example, -a1,2,0,3,1). Threads will be affinitized to the specified CPUs in a Round Robin
manner. The number of CPUs can differ from the number of threads. The CPU’s ID can be stated more
than once. The thread’s ideal processor is set to the CPU that it has been affinitized to.
3.19 Create test files automatically
Use the -c parameter to indicate that the target files to be used in testing should be (re)created with the
specified size. There is no default size.
For example, the following command creates two 100 MiB files, c:\test1 and d:\test2, and runs a 20-
second read test on both files:
diskspd -c100M -d20 c:\test1 d:\test2
When creating files, DiskSpd ensures that the valid data length as tracked by the filesystem is the same
as the size of the file prior to starting test operations. If possible an optimized fast path is taken using
the Win32 SetFileValidData API; however, if the test is run in a security context which does not have
access to the SeManageVolumePrivilege that API requires, the file must be written through once prior to

18 of 28
test operations, which may take significant time for large files. See the Win32 SetFileValidData API
reference3 for more information. Administrative contexts generally have access to this privilege.
DiskSpd will display a warning if the slow path is taken.
WARNING: Could not set privileges for setting valid file size; will use a slower method of preparing
the file
IMPORTANT: the optimized fast path for extending valid data length may expose previously written but
logically deleted content from the storage subsystem. Ensure that if this path is used, either:
test files are not accessible by unauthorized users
the storage subsystem provides protection for previously deleted data
3.20 Separate buffers for Read and Write operations
Each thread allocates a separate buffer for read I/O operations. The reason for having one buffer per
thread instead of having one buffer for all of the threads is to speed up processing in Non-Uniform
Memory Access (NUMA) systems. Threads should use memory from the node on which they are running
because that is faster than accessing memory from a different node. Separate buffers should also
increase the chances of cache locality.
3.20.1 Specifying write entropy
By default, the same buffer is used as the source for write I/O operations and is initialized with a
repeating byte pattern of 0x00, 0x01, 0x02, … 0xFF, 0x00, 0x01, 0x02 and so forth. The -Z parameter
instead causes these buffers to be zeroed at the start of the test.
In many modern storage systems, data is compressed and/or de-duplicated in-line or near-line to the
I/O path. The extent to which data can be compressed or de-duplicated can have strong effects on
storage performance. Therefore, some control on the entropy (randomness) of data is useful to both
test whether a storage system is performing such actions, in comparing performance with highly
compressible and incompressible data, or in choosing a data pattern which may be appropriate for a
given workload simulation, such as a some sample database content.
The -Z<size>[K|M|G|b] form instead causes dedicated per-target write source buffers of the specified
size to be allocated. Write content is selected from these buffers at random on a 4 byte alignment. This
allows for many distinct block-sized patterns to be chosen from a small source buffer. For instance, an
8KiB write source buffer used for a 4KiB block test provides (8KiB - 4KiB)/4 = 1024 potentially unique
blocks.
By default, write source buffers will be filled with random data. With the -Z<size>[K|M|G|b],<file>
form, a sample file can be provided whose initial contents (from byte zero) is used initialize the write
source buffers. If the file is smaller than the desired buffer size, its content is repeated into the buffer
3 SetFileValidData: http://msdn.microsoft.com/en-us/library/windows/desktop/aa365544(v=vs.85).aspx
19 of 28
until they are filled. Each write source buffer filled with random data will be distinct, but each filled from
a sample file will have the same content.
3.20.2 Support for large pages
In certain cases, it may be useful to use large-page support for I/O buffers. This is specified using the -l
parameter, which requires the user to have access to the SeLockMemoryPrivilege.
By default, DiskSpd allocates buffers as follows:
VirtualAlloc( …, MEM_COMMIT, PAGE_READWRITE)
The -l parameter instead does this:
VirtualAlloc( …, MEM_COMMIT | MEM_RESERVE | MEM_LARGE_PAGES,
PAGE_EXECUTE_READWRITE)
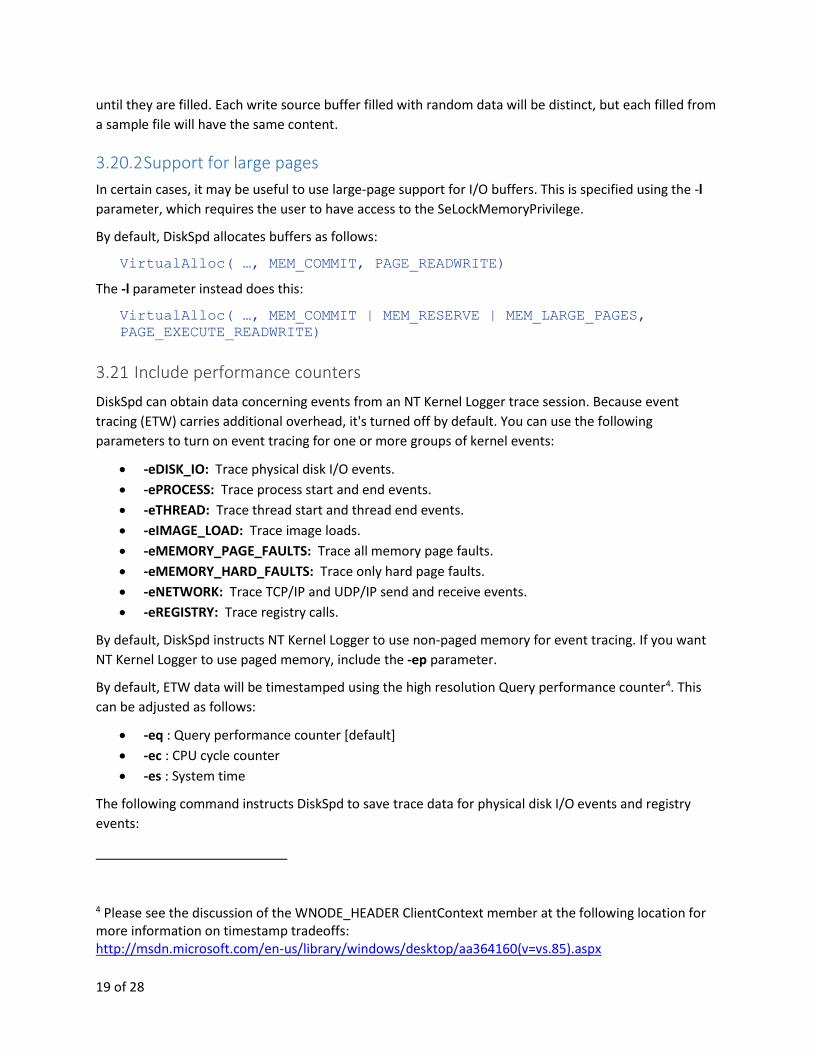
3.21 Include performance counters
DiskSpd can obtain data concerning events from an NT Kernel Logger trace session. Because event
tracing (ETW) carries additional overhead, it's turned off by default. You can use the following
parameters to turn on event tracing for one or more groups of kernel events:
-eDISK_IO: Trace physical disk I/O events.
-ePROCESS: Trace process start and end events.
-eTHREAD: Trace thread start and thread end events.
-eIMAGE_LOAD: Trace image loads.
-eMEMORY_PAGE_FAULTS: Trace all memory page faults.
-eMEMORY_HARD_FAULTS: Trace only hard page faults.
-eNETWORK: Trace TCP/IP and UDP/IP send and receive events.
-eREGISTRY: Trace registry calls.
By default, DiskSpd instructs NT Kernel Logger to use non-paged memory for event tracing. If you want
NT Kernel Logger to use paged memory, include the -ep parameter.
By default, ETW data will be timestamped using the high resolution Query performance counter4. This
can be adjusted as follows:
-eq : Query performance counter [default]
-ec : CPU cycle counter
-es : System time
The following command instructs DiskSpd to save trace data for physical disk I/O events and registry
events:
4 Please see the discussion of the WNODE_HEADER ClientContext member at the following location for more information on timestamp tradeoffs: http://msdn.microsoft.com/en-us/library/windows/desktop/aa364160(v=vs.85).aspx
20 of 28
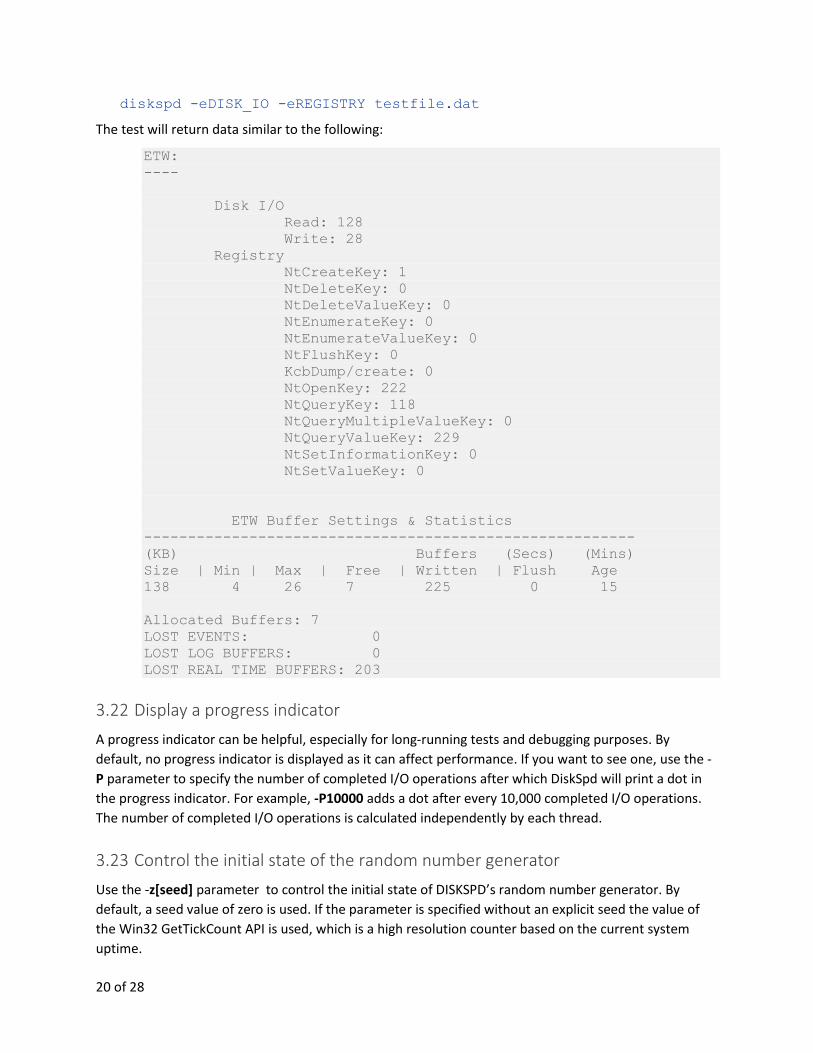
diskspd -eDISK_IO -eREGISTRY testfile.dat
The test will return data similar to the following:
ETW:
----
Disk I/O
Read: 128
Write: 28
Registry
NtCreateKey: 1
NtDeleteKey: 0
NtDeleteValueKey: 0
NtEnumerateKey: 0
NtEnumerateValueKey: 0
NtFlushKey: 0
KcbDump/create: 0
NtOpenKey: 222
NtQueryKey: 118
NtQueryMultipleValueKey: 0
NtQueryValueKey: 229
NtSetInformationKey: 0
NtSetValueKey: 0
ETW Buffer Settings & Statistics
--------------------------------------------------------
(KB) Buffers (Secs) (Mins)
Size | Min | Max | Free | Written | Flush Age
138 4 26 7 225 0 15
Allocated Buffers: 7
LOST EVENTS: 0
LOST LOG BUFFERS: 0
LOST REAL TIME BUFFERS: 203
3.22 Display a progress indicator
A progress indicator can be helpful, especially for long-running tests and debugging purposes. By
default, no progress indicator is displayed as it can affect performance. If you want to see one, use the -
P parameter to specify the number of completed I/O operations after which DiskSpd will print a dot in
the progress indicator. For example, -P10000 adds a dot after every 10,000 completed I/O operations.
The number of completed I/O operations is calculated independently by each thread.
3.23 Control the initial state of the random number generator
Use the -z[seed] parameter to control the initial state of DISKSPD’s random number generator. By
default, a seed value of zero is used. If the parameter is specified without an explicit seed the value of
the Win32 GetTickCount API is used, which is a high resolution counter based on the current system
uptime.
21 of 28
Note that the total behavior of a multi-threaded test also depends on thread scheduling effects, so the
random number generator is not a complete control on test behavior.
3.24 Run DiskSpd in verbose mode
Use the -v parameter to run DiskSpd in verbose mode. In verbose mode, DiskSpd returns the following
information about its actions:
When a worker thread is created
When start and end signals are sent to worker threads
The offset of the next I/O operation (along with the worker thread number and I/O number)
Start and stop time for each NT Kernel Logger session
3.25 Use named events to synchronize testing
DiskSpd can synchronize on named events that the user provides. If any event that is specified using
these parameters (-ys, -yf, -yr, or -yp) does not exist, DiskSpd creates a notification event.
If the -yr parameter is specified (for example, -yrMyStartEvent), DiskSpd initializes itself but
does not start the test (not even the warmup phase) until the specified event is set.
Similarly, you can specify a custom stop event with the -yp parameter (for example, -
ypMyStopEvent). By default, a test run ends when the specified test time elapses or the user
presses Ctrl+C to cancel the test. With the -yr parameter, the test run ends, and results are
displayed, when the stop event occurs. Moreover, if the stop event is provided, Ctrl+C becomes
associated with the stop event, enabling you to stop all DiskSpd instances waiting on the same
object at the same time by pressing CTRL+C in one of them.
The events can be set by any external tool or by running DiskSpd with the parameter -ye (for
example, -yeMyStartEvent). You can specify multiple instances of the -ye parameter if needed.
There are also two more events that, if provided by the user, send a notification when the actual
test begins and ends. An event provided with -ys (for example, -ysMyTestStartedEvent) is
signaled right before the measurements start; an event provided with -yf (for example, -
yfMyTestFinishedEvent) sends a notification right after measurements are completed.
3.26 Use an XML file to provide DiskSpd parameters
Parameters controlling a test can be passed to DiskSpd as part of the command line or in an XML file.
Using command line parameters (e.g. -w, -b8k, etc.) is easy for simple, homogenous tests. The
limitation, though, is that parameters passed on the command line apply to all targets and threads; for
instance, using a different block size for different targets is not possible when the command line
parameters are used. Specifying the configuration of a test in an XML file does not have this limitation.
Each target is treated separately and thus can be accessed using different block sizes, offsets, strides,
flags, and so forth.

22 of 28
XML run profiles are provided by the -X<path> option, where <path> is a path to an XML file compliant
with the diskspd.xsd schema. The -X parameter is not compatible with any other parameter and thus
has to be used alone (e.g. diskspd -Xprofile.xml). The diskspd.xsd file is distributed with the diskspd.exe
file.
3.26.1 Creating an XML profile file
The XML result output (see -Rxml, Section 5) contains a subsection describing the test, which can be
used to repeat a given test or as a base for more complex test descriptions. This is the
“<Profile>…</Profile>” section. Copy this section to a file, modify as needed and provide to the -X<path>
parameter.
3.26.2 Specify multiple time spans in the XML profile
On top of the per-target set of parameters, using an XML-based test configuration allows for specifying
multiple time spans. Each time span, “<Timespan>..</Timespan” is treated as a separate test with its
own duration, set of targets, and so forth. This can be useful when a workload that changes over time is
needed.
4 Canceling a test run (CTRL+C) You can cancel a DiskSpd run at time by pressing CTRL+C. DiskSpd exits gracefully and displays all of the
data it collected before the cancellation, as long as the warm-up period has completed.
5 Analyzing DiskSpd test results On completion, DiskSpd will provide a description of the test and a set of results. By default this will be
human-readable text summary, which can also be explicitly specified as -Rtext. An XML summary can be
requested with -Rxml. The XML summary also contains full configuration of the test in an XML format,
which can be used to convert command line parameters to their XML equivalents and subsequently
passed to the -X parameter.
DiskSpd provides per-thread per-target statistics on data read and written by each thread in terms of
total bytes, bandwidth and IOPs, in addition to any requested NT Kernel Logger events.
DiskSpd also provides a per-processor CPU utilization summary. It is currently limited to only providing
CPU usage with respect to the Processor Group its main thread is created on. In order to collect CPU
utilization on multiple Processor Group systems, please use alternate mechanisms. This may be
addressed via a future update.
Powershell code for processing batches of XML results into tabular form is provided in the Examples
(Section 6).
There are two more advanced sets of statistics which DiskSpd can optionally collect:
latency, specified with the -L parameter
IOPs statistics, specified with the -D parameter
23 of 28
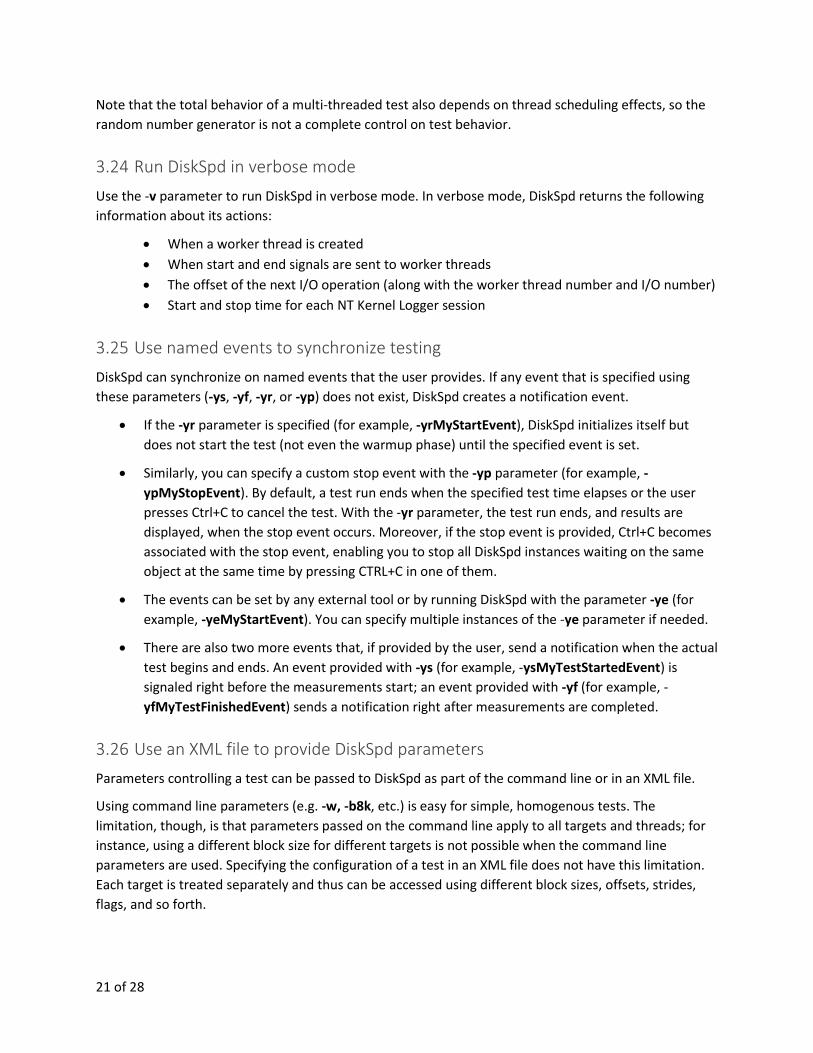
5.1 Latency
Latency is gathered in per-thread per-target histograms at high precision. In text output, this results in
per-thread per-target per-operation-type average latency along with a summary table of per percentile
latencies as in the following text output example:
%-ile | Read (ms) | Write (ms) | Total (ms)
----------------------------------------------
min | 0.086 | 0.199 | 0.086
25th | 0.351 | 0.371 | 0.362
50th | 5.214 | 0.978 | 1.128
75th | 7.454 | 1.434 | 7.014
90th | 8.412 | 7.671 | 8.092
95th | 8.513 | 8.393 | 8.455
99th | 17.406 | 9.024 | 16.098
3-nines | 34.938 | 25.804 | 34.360
4-nines | 38.058 | 35.514 | 38.058
5-nines | 38.058 | 35.514 | 38.058
6-nines | 38.058 | 35.514 | 38.058
7-nines | 38.058 | 35.514 | 38.058
8-nines | 38.058 | 35.514 | 38.058
max | 38.058 | 35.514 | 38.058
NOTE: The ‘nines’ refer to the number of nines: 3-nines is the 99.9th percentile, and so forth.
When designing tests to characterize the high percentiles it is important to consider the number of
operations which each represent. The data which produced this sample consisted of 6049 I/Os of which
a nearly equal number were reads (2994) and writes (3055). In the case of the 99.9th percentile for
writes, only 3055 * (1 - 0.999) = ~3 write operations are between its 25.804ms and the maximum
35.514ms. As a result, the 99.99th (4-nines) percentile and onward are the same as the maximum since
there is not enough data to differentiate them.
As a result, storage performance and test length need to be considered together in order to acquire
enough data to accurately state the higher-nines percentiles.
Latency is gathered internally at a per-thread per-target, and this full resolution is available in the XML
output form (-Rxml).
Given the per-thread per-target resolution, the memory overhead of these histograms can become
significant with higher thread and target counts. The interplay of -t and -F is important to consider. In
the following examples, both describe 16 threads:
-t1 <target1> … <target16>
-F16 <target1> … <target16>
However, the second results in 16 times as many histograms being tracked. This memory overhead can
in extreme circumstances affect results.

24 of 28
5.2 IOPs statistics
The higher-order IOPs statistics are based on capturing I/O counts per interval, by default 1 second. A
different interval can be specified in units of milliseconds: -D<milliseconds>
Similar to the way in which latency statistics are gathered, DiskSpd captures this data per-thread per-
target. These carry relatively low cost and should not add substantial overhead except in cases of very
long runtimes. In those cases, a proportionally longer sampling interval may be appropriate.
In text output, this adds the standard deviation of the IOPs per-thread per-target per-operation-type
over the entire measured test. This provides some insight into how significant performance variation
was interval-to-interval during the test. However, this statistic should be used with care since it cannot
describe the outliers or their frequency.
In XML output (-Rxml), the full per-thread per-target per-operation-type vectors are included in the
results. In addition to allowing the standard deviation to be put in context, in many cases these may
eliminate the need for external measurements of IO rates in generating visualizations.
6 XML results processing Processing XML with Windows PowerShell is relatively straightforward.
An XML document can be imported in one line:
$x = [xml](Get-Content filename.xml)
The resulting System.Xml.XmlDocument object exposes the element structure of the XML as a set of
nested properties and values. Normal Powershell capabilities such as implicit nested enumeration work
as expected, making extraction of results across threads and targets concise.
Please explore the XML document alongside the parsed XML in Powershell, and automation should
follow quickly.
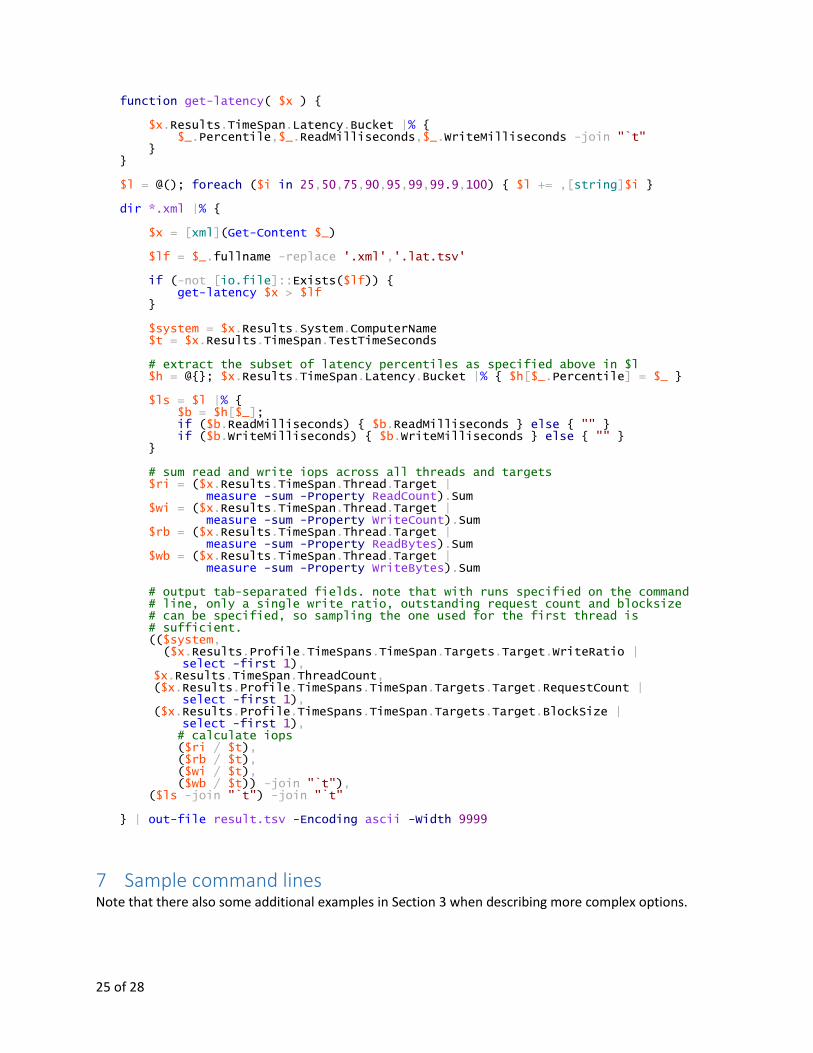
The following code is an example of processing a collection of XML results into a tabular form suitable
for direct import into a spreadsheet for analysis. The column schema can be summarized as:
Computer which produced the result
WriteRatio (-w)
Threads (as a result -t or -F)
Outstanding (as a result of -o)
Block (as a result of -b)
Read IOPs
Read Bandwidth
Write IOPs
Write Bandwidth
25th, 50th, 75th, 90th, 99th, 99.9th and maximum read & write IO latency (assuming -L)
In addition, it produces a second file per result with the full latency distribution in tabular form, with
percentile, read latency, and write latency columns.
25 of 28
function get-latency( $x ) { $x.Results.TimeSpan.Latency.Bucket |% { $_.Percentile,$_.ReadMilliseconds,$_.WriteMilliseconds -join "`t" } } $l = @(); foreach ($i in 25,50,75,90,95,99,99.9,100) { $l += ,[string]$i } dir *.xml |% { $x = [xml](Get-Content $_) $lf = $_.fullname -replace '.xml','.lat.tsv' if (-not [io.file]::Exists($lf)) { get-latency $x > $lf } $system = $x.Results.System.ComputerName $t = $x.Results.TimeSpan.TestTimeSeconds # extract the subset of latency percentiles as specified above in $l $h = @{}; $x.Results.TimeSpan.Latency.Bucket |% { $h[$_.Percentile] = $_ } $ls = $l |% { $b = $h[$_]; if ($b.ReadMilliseconds) { $b.ReadMilliseconds } else { "" } if ($b.WriteMilliseconds) { $b.WriteMilliseconds } else { "" } } # sum read and write iops across all threads and targets $ri = ($x.Results.TimeSpan.Thread.Target | measure -sum -Property ReadCount).Sum $wi = ($x.Results.TimeSpan.Thread.Target | measure -sum -Property WriteCount).Sum $rb = ($x.Results.TimeSpan.Thread.Target | measure -sum -Property ReadBytes).Sum $wb = ($x.Results.TimeSpan.Thread.Target | measure -sum -Property WriteBytes).Sum # output tab-separated fields. note that with runs specified on the command # line, only a single write ratio, outstanding request count and blocksize # can be specified, so sampling the one used for the first thread is # sufficient. (($system,
($x.Results.Profile.TimeSpans.TimeSpan.Targets.Target.WriteRatio | select -first 1), $x.Results.TimeSpan.ThreadCount, ($x.Results.Profile.TimeSpans.TimeSpan.Targets.Target.RequestCount | select -first 1), ($x.Results.Profile.TimeSpans.TimeSpan.Targets.Target.BlockSize | select -first 1),
# calculate iops ($ri / $t), ($rb / $t), ($wi / $t), ($wb / $t)) -join "`t"), ($ls -join "`t") -join "`t" } | out-file result.tsv -Encoding ascii -Width 9999
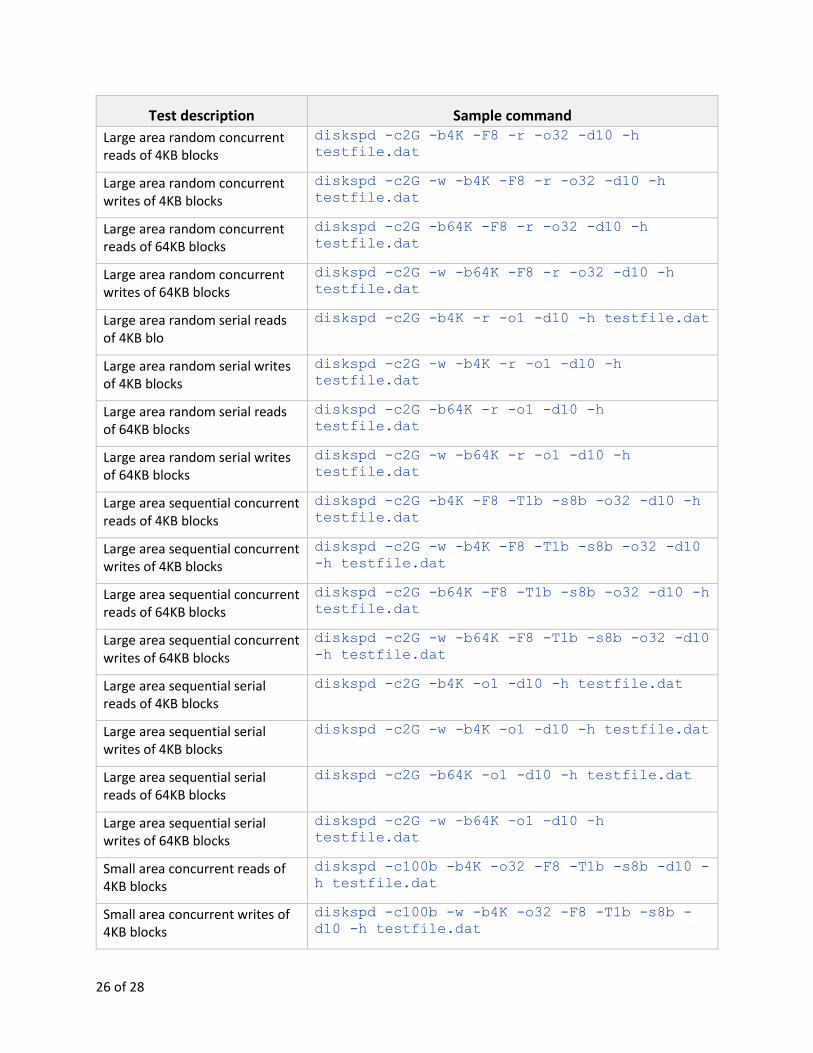
7 Sample command lines Note that there also some additional examples in Section 3 when describing more complex options.
26 of 28
Test description Sample command
Large area random concurrent reads of 4KB blocks
diskspd -c2G -b4K -F8 -r -o32 -d10 -h
testfile.dat
Large area random concurrent writes of 4KB blocks
diskspd -c2G -w -b4K -F8 -r -o32 -d10 -h
testfile.dat
Large area random concurrent reads of 64KB blocks
diskspd -c2G -b64K -F8 -r -o32 -d10 -h
testfile.dat
Large area random concurrent writes of 64KB blocks
diskspd -c2G -w -b64K -F8 -r -o32 -d10 -h
testfile.dat
Large area random serial reads of 4KB blo
diskspd -c2G -b4K -r -o1 -d10 -h testfile.dat
Large area random serial writes of 4KB blocks
diskspd -c2G -w -b4K -r -o1 -d10 -h
testfile.dat
Large area random serial reads of 64KB blocks
diskspd -c2G -b64K -r -o1 -d10 -h
testfile.dat
Large area random serial writes of 64KB blocks
diskspd -c2G -w -b64K -r -o1 -d10 -h
testfile.dat
Large area sequential concurrent reads of 4KB blocks
diskspd -c2G -b4K -F8 -T1b -s8b -o32 -d10 -h
testfile.dat
Large area sequential concurrent writes of 4KB blocks
diskspd -c2G -w -b4K -F8 -T1b -s8b -o32 -d10
-h testfile.dat
Large area sequential concurrent reads of 64KB blocks
diskspd -c2G -b64K -F8 -T1b -s8b -o32 -d10 -h
testfile.dat
Large area sequential concurrent writes of 64KB blocks
diskspd -c2G -w -b64K -F8 -T1b -s8b -o32 -d10
-h testfile.dat
Large area sequential serial reads of 4KB blocks
diskspd -c2G -b4K -o1 -d10 -h testfile.dat
Large area sequential serial writes of 4KB blocks
diskspd -c2G -w -b4K -o1 -d10 -h testfile.dat
Large area sequential serial reads of 64KB blocks
diskspd -c2G -b64K -o1 -d10 -h testfile.dat
Large area sequential serial writes of 64KB blocks
diskspd -c2G -w -b64K -o1 -d10 -h
testfile.dat
Small area concurrent reads of 4KB blocks
diskspd -c100b -b4K -o32 -F8 -T1b -s8b -d10 -
h testfile.dat
Small area concurrent writes of 4KB blocks
diskspd -c100b -w -b4K -o32 -F8 -T1b -s8b -
d10 -h testfile.dat
27 of 28
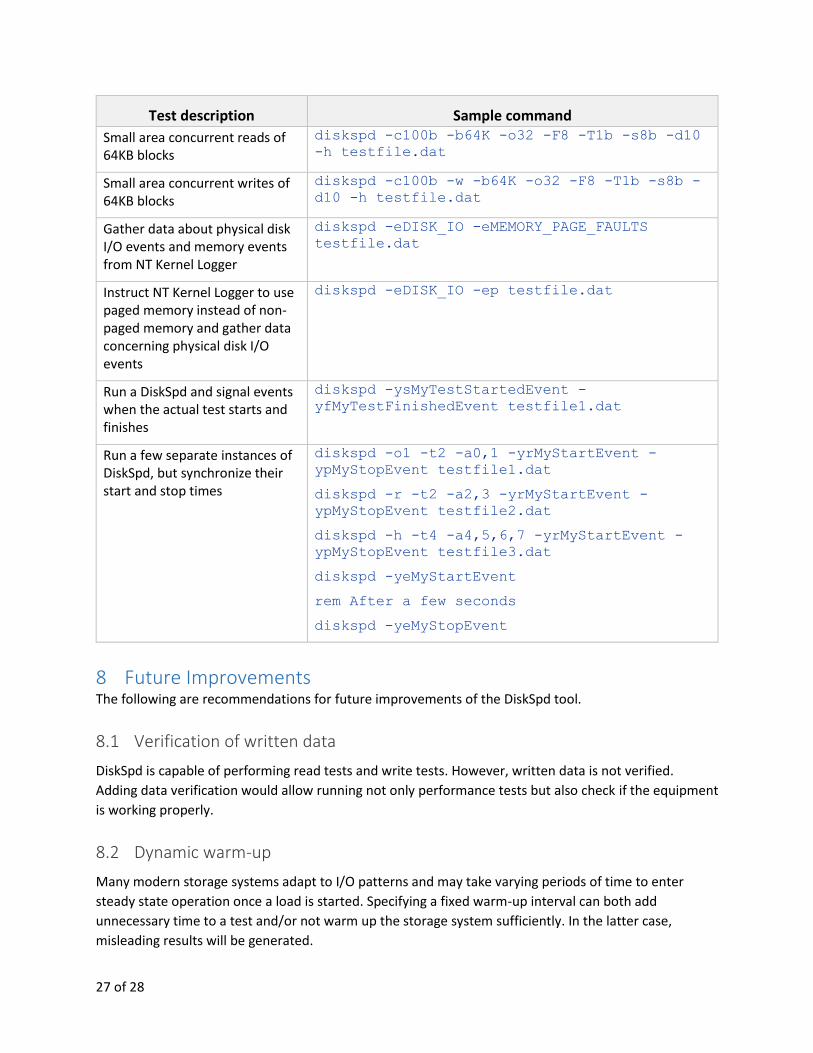
Test description Sample command
Small area concurrent reads of 64KB blocks
diskspd -c100b -b64K -o32 -F8 -T1b -s8b -d10
-h testfile.dat
Small area concurrent writes of 64KB blocks
diskspd -c100b -w -b64K -o32 -F8 -T1b -s8b -
d10 -h testfile.dat
Gather data about physical disk I/O events and memory events from NT Kernel Logger
diskspd -eDISK_IO -eMEMORY_PAGE_FAULTS
testfile.dat
Instruct NT Kernel Logger to use paged memory instead of non-paged memory and gather data concerning physical disk I/O events
diskspd -eDISK_IO -ep testfile.dat
Run a DiskSpd and signal events when the actual test starts and finishes
diskspd -ysMyTestStartedEvent -
yfMyTestFinishedEvent testfile1.dat
Run a few separate instances of DiskSpd, but synchronize their start and stop times
diskspd -o1 -t2 -a0,1 -yrMyStartEvent -
ypMyStopEvent testfile1.dat
diskspd -r -t2 -a2,3 -yrMyStartEvent -
ypMyStopEvent testfile2.dat
diskspd -h -t4 -a4,5,6,7 -yrMyStartEvent -
ypMyStopEvent testfile3.dat
diskspd -yeMyStartEvent
rem After a few seconds
diskspd -yeMyStopEvent
8 Future Improvements The following are recommendations for future improvements of the DiskSpd tool.
8.1 Verification of written data
DiskSpd is capable of performing read tests and write tests. However, written data is not verified.
Adding data verification would allow running not only performance tests but also check if the equipment
is working properly.
8.2 Dynamic warm-up
Many modern storage systems adapt to I/O patterns and may take varying periods of time to enter
steady state operation once a load is started. Specifying a fixed warm-up interval can both add
unnecessary time to a test and/or not warm up the storage system sufficiently. In the latter case,
misleading results will be generated.

28 of 28
A mechanism which monitored warm-up performance and only entered the measurement phase once
performance had stabilized within some acceptable band would be useful.