the digital marketing landscape in the vietnamese market
TRANSCRIPT

The digital marketing landscape in the Vietnamese market
Ha Phung
Bachelor’s Thesis
Degree Programme for
Multilingual Management
Assistants
2019

Abstract 14.10.2019
Author(s) Ha Phung
Degree programme Multilingual Management Assistants Report/thesis title The digital marketing landscape in the Vietnamese market
Number of pages and appendix pages 47
The purpose of this thesis is to provide understanding of Vietnamese consumer’s online behaviour. This is done through an examination of Vietnamese consumers’ online behaviour regarding digital and social media, as well as factors influencing such behaviour. The framework focuses on digital marketing concepts and consumer behaviour. Additionally, a closer look at the Vietnamese market was also studied, as it is the main target for this research. Quantitative research, which included a survey, was the research method used in this study. The secondary data from the Q&Me market research organization is used for empirical research, due to the need for a large-scale investigation. A survey among 620 Vietnamese online users was made, in order to ascertain consumers’ perspectives towards online platforms. The findings of this research lead to positive outcomes, as local Vietnamese consumers consider messaging apps and social media to be essential aspects of their daily activity. This research gives valuable insight into what is beneficial for marketers, as they consider applying business strategies to the Vietnamese market through online channels. Keywords Digital marketing, social media marketing, consumer behaviour, Internet generation, market research

Table of contents
1 Introduction ................................................................................................................... 1
1.1 Background ........................................................................................................... 2
1.2 Objective and Limitation ........................................................................................ 2
1.3 Key concepts ........................................................................................................ 3
1.4 Structure of the thesis ........................................................................................... 3
2 Digital marketing ........................................................................................................... 5
2.1 Owned, earned and paid media ............................................................................ 6
2.2 Marketing communication channels ...................................................................... 7
2.2.1 Content marketing ...................................................................................... 8
2.2.2 E-mail marketing ...................................................................................... 10
2.2.3 Social media marketing ............................................................................ 12
2.2.4 Search engine marketing ......................................................................... 15
3 Consumer perspective ................................................................................................ 17
3.1 Motivation on social media .................................................................................. 18
3.2 The Net generation ............................................................................................. 20
3.3 Vietnamese digital market ................................................................................... 22
4 Conducting research ................................................................................................... 25
4.1 Research data ..................................................................................................... 25
4.2 Research method ................................................................................................ 25
4.2.1 Quantitative method ................................................................................. 25
4.2.2 Data collection ......................................................................................... 26
4.2.3 Questionnaire ........................................................................................... 26
4.3 Q&Me market research ....................................................................................... 26
5 Empirical results .......................................................................................................... 28
5.1 Demographic of respondent ................................................................................ 28
5.2 Media usage ....................................................................................................... 30
5.3 Messaging popularity .......................................................................................... 31
5.4 Social media popularity ....................................................................................... 34
6 Conclusions ................................................................................................................ 45
6.1 Key findings ........................................................................................................ 45
6.2 Discussion .......................................................................................................... 47
References ...................................................................................................................... 48

1
1 Introduction
Few years ago, there was a published video about a two-years-old baby entering an
iPhone passcode correctly without any hesitation, surfing Internet proficiency with his little
fingers multitasking from zooming to double press. The video yielded a huge amount of
attention and went viral that lead to millions of views. At that time, it was hard to imagine
how a person can earn money from doing a vlog, making video reviews, lip-syncing or
even posting a photo on social media. (Ngan Giang 2017.)
By 2017, people are trying to build up their personal brand through Internet, YouTube,
social media sites and live stream channels, with performance can be measured based on
the amount of like, share and comment (Ngan Giang, 2017). In other words, the concept
of having income and profit from being online is completely conceivable. It’s been
recorded that the number of Internet users has reached 4 billion globally, that around 3
billion of them using social media every month, and 9 out of 10 Internet access are from
mobile users (Kemp 30 January 2018).
It’s been twenty years since the Internet has arrived in Vietnam. Although the history is not
too long, it’s enough for a young generation to be born and influenced by a digital,
touchscreen, wireless network, and social media environment. They witness a significant
transformation, from dial-up Internet, arrival of iPod, Facebook, YouTube, smartphone,
tablet to Face ID technology, Internet 4G, cryptocurrency and artificial intelligence. They
have a modern conception, and they prefer expedience, up-to-date information from every
mouse click and finger stroke. They have friends everywhere, and sometimes their online
network is even stronger than their real-life relationships. From 1997 when the Internet
arrived in Vietnam to now, information technology has changed the way young people
perceive the world, as well as how the world names people. After the period of twenty
years appearing and helping Vietnam connect to the world, the Internet now has become
an essential tool for generations to solve problems, no longer a new horizon to explore.
(Ngan Giang 2017.)
It seems that “the world is flat” becomes an ostensible notion, when it’s no longer to be
considered as a symbol of the new age. The Internet makes information almost
universally, globally, simultaneously and entirely available. And the Internet generation in
Vietnam, whether in one way or another, with self-awareness or self-flow, has been and
will become part of the world.

2
1.1 Background
The world has seen the dramatic transition of digitalization in recent years. We are all
familiar with the old concept of Traditional Marketing which has been in use by companies
for years, including the method of using print advertisements, billboards, flyers, TV,
newspapers, radio, etc. With the lightning speed of technological evolution as
development of the Internet and smart devices, digital marketing becomes more and more
crucial in today’s business cycle.
The importance of digitalization is undeniable. There are billions of social media and
devices users, from the company’s point of view, it means there are numerous amounts of
potential lead and data to exploit. And it is important to understand this resource and
user’s behaviour, in order to efficiently utilize and apply suitable adjustment.
The topic is chosen based on the author’s interest in digital marketing and the willingness
to discover this area on the scale of her original country: Vietnam. During the author’s
internship in Vietnam at an advertising agency, the author had opportunity to expand her
understanding and insight about this particular field, as well as have a real look at
Vietnamese consumer’s social behaviour, and how digital makes impact on their
consumption habit so that brands and companies are able to apply business strategies
based on these findings. The purpose of the research is to provide an overview of the
Vietnamese digital market, which is beneficial for companies getting an in-depth findings
from the local market and thus adjust the right business strategy.
1.2 Objective and Limitation
The objective of the research is to find out how Vietnamese consumers behave online
through digital platforms with the impact of digitalization and what are their motivations on
such behaviours, which will be resulted by a quantitative survey. Hence, the research
questions are proposed as follows: 1. In what way are Vietnamese people using digital media? 2. What factors influence Vietnamese consumers to use social media?
Because digital is a vast field and all elements are unable to be covered under one study,
there are some aspects limited from the research as e-commerce, influencer marketing,
etc. This research only focuses on the consumer’s digital media usage, messaging app
and social media perspectives.

3
1.3 Key concepts
The framework covers the concept of digital marketing, consumer behaviour, and
description of the Vietnamese digital market. Coursebooks and online research data are
used as the main sources for the concepts.
Digital marketing: definition and explanation of owned, earned and paid media, and
various digital communication channels: content marketing, search engine marketing,
email marketing, and social marketing
Consumer behaviour: present the consumer’s motivation on social media, description of
online community characteristic and the net-generation
Vietnamese digital landscape: briefly describe the digital trend and consumer’s trend in
the Vietnamese market
1.4 Structure of the thesis
The thesis will be structured into five parts. The first part includes introduction of thesis
topic, presenting the idea generation and interest in the chosen field. Followed by the
three main research questions that provide readers a broader overview of the topic
objectives. The limitation and key concepts of the study are also presented.
The second part is literature review of the digital marketing and consumer behaviour. The
concept of digital marketing will be explained, as well as analysis from consumer’s
perspectives regarding the scope of digital. A brief examination of the Vietnamese digital
market is also covered in this part.
The research methodology is discussed in the third part with introduction of the chosen
approach for the research, which is quantitative research. Data collection and analysis are
also described here. After that, the result collected from empirical research will be
presented and illustrated in the fourth part. Finally, the research ends with a conclusion on
key findings and discussion of the study.

4
•Present thesis background•Objectives, limitation, key concepts Introduction
•Literture review on digital marketing concept and consumer behaviour
•Introduce current situation in Vietnamese digital market
Theoritical frawork
•Research method explaination•Defines data collection and data analysis method
Research methology
•Demonstrates collected data•Analysis collected dataFinding result
•Key finding summarized•Further suggestionDiscussion
Figure 1. Thesis structure

5
2 Digital marketing
The digital and social evolution has been predicted from the 1960s as the public has
familiarized with the Civil Right and youth revolution but more than just the cultural
movement, the transition lead to the shift in society, technology, media, information, and
economy. The rise of technology impacted the whole physical world into a digitalize era,
as all markets have been transmitted from “analogue” to “digital”. The Internet influences
all human activities and how people communicate with each other. (Jackson & Ahuja
2016.)
Thanks to the development of technology and Internet, a new form of marketing has been
created base on how people change their perception of communication, interaction and
receiving information.
According to Chaffey and Ellis-Chadwick (2012, 10), Digital Marketing is explained as:
“Achieving marketing objectives through applying digital technologies.” These
technologies cover the range from computer, mobile, tablet and various digital platforms,
and it is the act of Internet marketing investment rather than technology embrace. Digital
marketing is the association of controlling various online media communication channels
such as: website, blogs, e-mail and social media, with different types of communication
tool like search engine marketing, online PR, online partnership, display advertising, e-
mail marketing and social media marketing that aim to maintain long-term customer
relationship. Yet, it is essential to combine the technique with “traditional media” including
visual and audio transmitted platform as print, TV and direct mail to maximize the
marketing performance. (Chaffey & Ellis-Chadwick 2012, 10.)
Digital Marketing is also defined as a marketing activity using digital platforms and
electronic media to promote the products or services, with the goal is to reach the public
via digital media. Rather than just a distributed channel, digital is believed to be a new
concept of marketing approaches and consumer’s behaviour learning. (Financial Times
Lexicon 2019.)
In the study of Rehmani and Khan (2011, 101), there is no more barrier in marketing due
to the expansion of digital media. Information now can be accessed and delivered by the
technique of social media marketing, email marketing and mobile marketing, which
platforms are widely in use by millions of people. With the impact of Internet,
communication has changed to a modern form that makes it more advantageous for
advertisers to approach their target customers. (Rehmani & Khan 2011, 101.)

6
The features of digital marketing actualize advertiser’s fantasy, by extending a wide range
of market reach as well as accurately segmenting the market that is measurable and cost-
saving. It solves the problem regarding geographical and time which can be very
expensive for traditional marketing method. Therefore, global expansion is no longer an
impossible goal when Internet allows 24/7 access and universal communication, play a
role as an infinite digital marketing tool. (Ryan & Jones 2009, 19.)
2.1 Owned, earned and paid media
The buying environment and customer journey included various media channels, that play
a key role in developing an effective digital strategy and required a more complicated
comprehension. There are three typical types of media channels narrowed down in order
to maximize customer engagement. (Chaffey & Ellis-Chadwick 2012, 11.)
Paid media: Also known as advertising, is the form of media which marketers pay for
publishers of sites or ad networks to have their advertisement displayed. Its majority
spend comes from traditional media like print, TV and direct mail. (Chaffey & Ellis-
Chadwick 2012, 11.)
Earned media: The media is generated through online PR and word-of-mouth. Marketers
associate with influencers to spread the brand message through viral and social media
channels to raise public awareness, with online comments and sharing for audience
reached. (Chaffey & Ellis-Chadwick 2012, 11.)
Owned media: The form of media owned by the companies included official websites,
blogs, e-mail lists, social media channels, print advertisements, department stores, etc.
The marketers have their own presence and promote products and services through multi-
channels. (Chaffey & Ellis-Chadwick 2012, 11.)

7
Figure 2. The intersection of the three key online media types (Chaffey & Ellis-Chadwick
2012, 11.)
Campbell (2013) mentioned the emphasis on combining two or more types of media. The
biggest issue that small businesses are facing is the lack of traffic and scale. No follower
on social media channels to share the brand content or trouble in making the content
stand out requires the need for earned and paid media. (Campbell 2013.)
2.2 Marketing communication channels
The world is familiar with the popularity of TV, print ad and radio ad. These used to be the
main channel to reach audiences. But the new marketing communication technique has
arrived through the first introduction of “the web concept”, and quickly become key
element for creating marketing campaigns. Nowadays, marketers can apply new
techniques from content marketing, e-mail marketing, social media marketing and search
engine marketing for communication channels. The concept of content marketing is to
lengthen brands, companies, products on online presence like blogs or social networks.
E-mail marketing spreads the message by mailing to customers, whether they provide e-
mail address directly or it comes from a rented or co-branded list. Social media marketing
helps building and engaging customers by compelling brand content and interaction. A
search engine marketing (SEM) is ideal when a company is aiming for a higher position of
the company or its service rank in search engine listing. It also includes display
advertising: Pay-per-click (PPC), which companies pay for their ads to be displayed on
search engine page (Google, Bing). The primary task is to make a wise and cost-saving

8
selection on which technique is the most efficient to gain public attraction. Thus, a proper
distinction on each type of communication needs to be taken. (Chaffey & Ellis-Chadwick
2012, 484-485.)
The answer to the question: “Which communication strategy works best?” is variety due to
customer prejudices (Taylor 2018). For instance, HubSpot concludes that search engine
optimizing (SEO) is the top choice for marketing channel (Taylor 2018). In contrast, from
the data of Chief Marketer regarding the same question, e-mail marketing receives the
most vote to be the best strategy (Taylor 2018). And clearly, the same surveys have been
conducted and state that social media and content marketing are the most useful
channels. It is understandable to explain the reason behind this fluctuation is due to
customer biases. Customers of different marketing service providers have different
expertise and tendencies, which clarifies the variety of choices. Despite contradictions, e-
mail marketing, search engine marketing, social marketing and content marketing always
reach the highest rate. (Taylor 2018.)
Figure 3. Most popular digital marketing strategy (Extole 2014, 7.)
2.2.1 Content marketing
When the evolution of the web come around, organizations and human make effort to find
themselves being online and being connected to another. Whether being present online is
due to the need for socialization or business-related, it is claimed that communication is
the leading factor for such act. The significant feature about Internet is the neutral
environment it brings to human life. Internet offers an unlimited valuable resource,
provides a wide range of services and communication tools, which make it so unique and
perhaps the most powerful technology invention.

9
Content marketing has become the main term for overtime. It refers to the method that
companies produce content on their online presence. Marketo (2012, 4) defines content
marketing as: “The creation and sharing of relevant content for the purpose of solving a
problem and reinforcing brand messaging through thought leadership.” While Chris (2014)
emphasizes the value of content marketing as the core of all digital marketing campaigns.
He determines content is all material that can be published online through digital format
and content marketing is the method used to support many business goals from growing
traffic, attracting new prospects, driving sales and enlarging brand awareness (Chris
2014).
According to CopyBlogger’s assumption (2013), although content marketing is widely in
use in business nowadays, not many of it applied effectively. Content needs to be created
and shared freely that can make an impact on prospects, engage them and make them
become loyal customers. Additionally, when producing content, marketers should consider
making it relevant and related to the products, in order to educate people and gain their
acknowledgment and credibility. (CopyBlogger 2013.)
Content marketing is more than just paper or website. The wide range of form includes:
- Articles
- Books/eBooks
- Brochures/manuals
- Case Studies
- Information Guides
- Microsites/Web Pages
- Online Courses
- Podcasts/Videocasts
- Presentations
- Product Data Sheets
- Reference Guides
- Resource Libraries
- RSS/XML Feeds
- Videos
- Visual Content
- Webinars/Webcasts
- White Papers
- Widgets
- Workbooks
Content Marketing Institute and MarketingProfs (2017) conducted a survey of 1,102 B2B
marketers in North America to have a deeper look at the content marketing industry.
Figure 4 represents the distribution of marketing tactics used in respondent’s
organizations. The most popular choice of content channels includes: Social media (83%),
Blogs (80%), Email Newsletters (77%) and Direct events. The lesser priority channels but
still widely in use are eBook, document, video, infographic and webinar (around 60%).
(Content Marketing Institute & MarketingProfs 2017.)

10
Figure 4. 2017 B2B Content Marketing Trends – North America (Content Marketing
Institute & MarketingProfs 2017, 28.)
2.2.2 E-mail marketing
According to Kaur and Singh (2017, 256), email marketing is a common strategy for
businesses to engage customers by approaching them via electronic mail. Email is an
essential tool not only for product advertising but also for building connection between
target customers and advertisers. Email communication can be adopted for commercial
purposes through product advertisement, business invitation, discount or newsletter, etc.
(Kaur & Singh 2017, 256.)
Email is the most popular tool to reach the prospect. As customers agree to provide their
contact to business for further information, that might because they want to be informed of
product release, service detail or followed with sale event. These contacts will be stored in
an opt-in house list and provide a prospect database for strategic approach. An effective
email marketing strategy is a proper approach method involved combination of structured
frequency and content design, which can be divided into many types of communication
forms. (Chaffey & Ellis-Chadwick 2012, 529.)
Conversion email refers to the followed-up-email that customers receive after they
subscribe and give contact to a webpage. This is usually because they find the offers from
website are interesting and want to explore more. Depends on what conversion the
advertiser aims to gain; a customized email content will be sent out to influence

11
customers. It can be for driving sales, traffic increase or brand promotion. (Chaffey & Ellis-
Chadwick 2012, 529.)
Email newsletter is the form of email releases weekly, monthly or quarterly to different
target customers. Newsletter is sent out when the buyer wants to update the prospect on
new product or promotion. (Chaffey & Ellis-Chadwick 2012, 529.)
House-list campaign is the type of email carries out frequently with purpose to persuade
customers trying the service, motivate them to keep purchasing or encourage inactive
users (Chaffey & Ellis-Chadwick 2012, 529).
Event triggered email is less common as customers only receive it one or two times a year
when buyers inform about new product release or there is an exclusive offer (Chaffey &
Ellis-Chadwick 2012, 529).
Email sequence as known as autoresponder is timed emails that are sent based on pre-
set interval or action (Chaffey & Ellis-Chadwick 2012, 529).
Figure 5. Email types benchmark (Eloqua 2011, in Cheung 2011.)
Email marketing has been assumed to be essential for building customer relationship. The
principle was simplified, by sharing the idea that email marketing only supports various
objectives such as communication, originating and delivering value for audiences. It is
more than just a tool for promoting and selling products, email marketing has been
presented since the early stage and still widely used nowadays, by making the most of
interaction and engagement. (Mirzaei, Jaryani, Aghaei, Salehi & Saeidinia 2012.)

12
Figure 6. 2017 Email Marketing trend (White 2017.)
2.2.3 Social media marketing
Social media is defined as “a group of Internet-based Web applications that build on the
ideological and technological foundation of Web 2.0, and that allow the creation and
exchange of User Generated Content” (Kaplan & Haenlein 2010, 61). This explanation
emphasizes the development of social media platforms by addressing interactive as the
foundation for social media formation.
Social media marketing is an important segment of digital marketing, it refers to product or
service promotion operated through social media networks or websites that incudes
activities of content, photo, video sharing and paid media advertising. With the increasing
of people using online networks, social media marketing has become a primary method
for business branding. (Kaur & Singh 2017, 256.)
It is considered as the best tool for brand promotion and assisting consumer buying
process. Social media marketing supports to reach business objectives from improving
business awareness, market represent, encourage aspiration to customer engagement by

13
spreading targeted messages through various social media channels. (Tuten & Solomon
2013, 18.)
Figure 7. Social media characteristics (Extole 2014, 12.)
Sharing Chaffrey and Ellis-Chadwick’ viewpoint (2012, 535), social media marketing is
one of the most crucial tools for marketers to communicate with their audiences. It’s
described as a variety of communication tools and channels which aim to encourage
audience interaction via company online presence and social presence. Due to the
massive amount of online presence tools, Kaplan and Haenlein (2010) divided social
media into six categories for clarification.
Collaborative projects include websites that content can be added, edited or modified by
many users (e.g., Wikipedia) - and social bookmarking – the term has been popularized
by Delicious refers to the online sharable web links collection, with “tagging” as the main
function that helps to organize bookmarked item into categories (Kaplan & Haenlein
2010).
Blogs are websites owned by individuals or organizations present many topics with
content updated constantly and interaction through comments. Example of relevant
services available including WordPress. (Kaplan & Haenlein 2010.)
Content communities are websites that stored media content such as photos (e.g.,
Instagram), videos (e.g., YouTube, Vimeo), and music (e.g., Soundcloud). It’s a content
database where users can upload and share their own content while interact through
messaging and commenting. (Kaplan & Haenlein 2010.)

14
Social networking sites are platforms allows users to create an online profile that
includes personal photo and any information for online identity. Users can interact with
each other and share content through social networks. The most popular sites are
Facebook, Twitter and LinkedIn. (Kaplan & Haenlein 2010.)
Virtual game worlds are game platforms that allow users to customize their avatars for
self-represent. Users interact and connect to each other in three-dimensional virtual and
must behave correspond to certain rules (e.g., World of Warcraft). (Kaplan & Haenlein
2010.)
Virtual social worlds are similar to Virtual game worlds, the only difference is users have
more capability of interaction (e.g., Second Life) (Kaplan & Haenlein 2010).
Figure 8. Social media marketing radar (Herrera 2018.)
Social media is a complex conception. Tuten and Solomon (2013, 3) think it defines the
way how digital user behaves on social life includes various “culture of participation”.
These participations reflect the need for communication, information sharing, expressing
one perspective toward particular issue and interacting with people sharing the same

15
background. This can be clarified through a brief of online daily activities. (Tuten &
Solomon 2013, 3.)
• Update a status about what just happened in the day or personal perspective toward particular idea.
• Write cooking recipes or product reviews on personal blog. • Organize a club offline meeting for gathering. • Send online messages and video calls with friends. • Tag a friend in social media content or share it with them. • Selfie or make customized video and share it. • Create a post with photos, videos and review for a trip you just have recently. • Connect with people by adding them to your social media friend list. • Play online social games for entertainment.
Facebook is the most popular social media platform (Kemp 30 January 2018). In 2004,
Facebook’s founder and also current CEO Mark Zuckerberg launched the first version of
Facebook with the idea to connect students in Harvard University. The networking site
then becomes popular with other schools and eventually turn into a big success of global
expansion. By the end of 2012 it’s is recorded there are surpassed 1 billion users be
active monthly on Facebook, and in 2018 the number reaches 2.27 billion users, making
Facebook the king of social network (Statista 2018). Facebook obviously has become the
most crucial channel for marketing. It’s an online community where individuals and
organizations interact efficiency by available data and provided information.
Instagram ranks the third popular social media platform after YouTube (We Are Social
2018). Instagram is a popular social platform and application work as a photo library that
shares content among users. Members can interact with each other by leaving comments,
like, repost and text private messages. Because photo is the main content, people find it a
simple and efficient tool for sharing daily lives and journeys through photography.
Instagram is a popular channel for celebrities and influencers not only because its efficient
interaction with fans and supporters, but also its easy function of daily activities updated
widely. Besides the social purpose, Instagram has been adapted for marketing effort, as it
has been growing in scale with a huge amount of consumer presence. (Scholl 2015, 8.)
2.2.4 Search engine marketing
Search engine marketing known as SEM, is a marketing tactic that aims to maximize the
brand visibility on search engine pages like Google, Bing, Yahoo. Ultimately audience
tends to use search engines to seek for products, or when the brand is well-known,
search engine is a shortcut to navigate the brand official site, saving the time to type a full
URL address. There are two key SEM techniques that need to be distinguished and
require to be integrated into marketing activities: Search engine optimization (SEO) and
paid-search marketing (PPC). SEM is a vital segment in digital marketing as it generates

16
more visits by making the brand achieve the highest ranking in search listing and
encouraging audiences to click through the site link. (Chaffey & Ellis-Chadwick 2012,
490.)
Search engine optimization (SEO) is a component of SEM, it’s an approach method used
to generate higher position for a brand and its products in organic listing page based on
specific keywords and terms inserted by users of search engines (Chaffey & Ellis-
Chadwick 2012, 491). To achieve efficient SEO, marketers need to ensure the official
website is search engine friendly and user-friendly with appealing contents (Chris 2014).
Paid-search marketing (PPC) is the paid techniques that marketers are charged whenever
their advertisements have been clicked through by search engine users. The
advertisement appearing with a text description and link to the brand official site is usually
marked as “sponsored link” or “Ads” (Figure 9). PPC is not only for search engine display
network. Ads can be in many formats as graphical ads or video ads, and available through
various third-party display networks (Chaffey & Ellis-Chadwick 2012, 491). There are
many options for payment that marketers can choose and it depends on the setting
metrics, it can be click-based (CPC) or impression-based (CPM) (Chris 2014).
Figure 9. Organic and paid listing on Google (Chris 2014.)

17
3 Consumer perspective
Basic needs are the same for human beings. However, individuals have different needs
that need to be satisfied that cause different motives. Although fulfilling a need is the core
of marketing, and needs cannot be created but identified. As they exist subconsciously,
customers can barely aware of them. That’s when advertisers do their job to help
determine such needs. (Sahney 2012, 4-5; Schiffman & Wisenblit 2015, 84.)
When a need is recognized, humans start to have a mental impulse to satisfy it by taking
certain actions and that leads to the state of a goal. As a result of that, the inner feeling
that drives to act so as the need can be fulfilled is referred to “motivation”. The whole
process of identifying needs, setting goals and taking actions to achieve satisfaction
consists of individual’s perception, emotion, desire and behaviour. (Sahney 2012, 6.)
Figure 10. The motivation process (Schiffman & Wisenblit 2015, 84.)
Humans have physiological needs that are required for the survival. They include food,
water, air, shelter for body protection and sex. Psychological needs are the need for
personal development involved by external factors and impact from culture, family,
society. (Schiffman & Wisenblit 2015, 84.)
In fact, all human needs are not equally essential. This has been presented by Abraham
Maslow by his “Theory of Human Motivation” formulated a hierarchy of needs, clarify that
some are more primary than others. The lowest level of need deals with well-being
achievement and gradually built up to a higher level of influence and ultimately self-

18
development needs (BusinessBalls). After fulfilling one fundamental need, individuals will
shift their focus on the following needs that are less vital (Phillips 2015; Schiffman &
Wisenblit 2015, 90).
Figure 11. Maslow's Hierarchy of Needs (Burton 2012.)
The bottom four stages of the hierarchy are referred to “deficiency needs”, because
lacking them doesn’t cause any effect on human sensation but deprivation. On the
contrary, the last level of Maslow’s hierarchy is called “growth need” because it is formed
based on individual’s perception of her/his potentials and motivation to fulfil it for self-
development. Deficiency needs are reached that obtain the next level of self-actualization,
but not everyone shares the same degree of awareness and capability for this stage.
(Burton 2012.)
3.1 Motivation on social media
The reason for social media popularity is also explained in Maslow’s hierarchy. The most
crucial motivation for social media usage is to fulfil human social needs. Social need lies
in the center of Maslow’s pyramid and is also the foundation to leverage two above needs.
It represents human desires to belong, to be loved and to be accepted by others. Social

19
networks make everyone feel special and satisfied as they found a circle they belong to.
(King 11 September 2017.)
Many studies have been carried out to investigate consumer’s motives toward social
media. The study of Stafford, Stafford & Schkade (2004) discovered the major motives for
consumers engaging with Internet are: information seeking, entertainment, and social
connection. Shao (2009) also supports the finding and contributes his research by adding
community development, self-fulfilment, and self-expression as the motive components.
These are the most common motives that are linked to social media user’s activities.
Based on the motives and online activities, social media consumers are categorized into
three groups: consumers, participants and producers. Consumers are users who spend
time on social media to read and consume content for information and entertainment.
While participants enjoy social interaction by commenting on other’s content, producers
create and publish their own for self-expression. These activities are interrelated as users
occur to find themselves engaged in two or all activities at once. (Shao, 2009.)
Figure 12. Overview of social media activities (Heinonen 2011.)
From the survey conducted by GlobalWebIndex in 2017 (Figure 13), the top reasons for
people using social media are to engage with their friends and keep up-to-date with
current news. On the other hand, sharing photos, videos and expressing opinions are in
the bottom list as they are not primary reasons for social media users. The statistic shows
that digital trend is shifting to more passive activities, as people tend to use social media
for viewing contents rather than posting them. (Valentine 11 January 2018.)

20
Figure 13. Reasons for social media usage (GlobalWebIndex 2017.)
According to the infographic presented the result from the survey, most of the motivations
can be referred to “others-focus”. It’s obvious that people are interested in maintaining
their social life through social media, some of them want to stay in their friend’s circle
while others aim to get more social connections. Additionally, people enjoy using social
media because they can express themselves freely. Sharing personal ideas, photos and
videos is an effective way to engage with others, and only social media remain its “social”
nature when that sharing is perceived. Another reason for user participation comes from
the need of fulfilment, resulted in 37% of users enjoy entertaining content on social media,
while 29% of them are using it for product research. Regardless of purposes, social media
is an innovative “social” experience that fulfils human needs and self-value. (Martin 2017.)
3.2 The Net generation
It’s not exaggerated to say that the Internet has become young generation’s second
ozone shield when all communications, interactions and self-expression are defined by
this space. In contrast, Internet also affects all aspects of life, plays a major role in
characteristic formation of the young generation. Along with that, the emergence of
smartphones has turned social networking into a golden age for young people. Internet in
the 2000s has become a personal branding tool for every guy and girl.

21
The biggest difference in the Internet generation is the way of thinking. If their parents are
sceptical and cautious, the Internet generation. on the contrary, is easy to accept, free in
thought, liberal and hungry to explore the outside world. This generation likes to share
their voices and crave to be heard. They have an intense desire to express themselves,
hesitate to raise their own opinion, even if it goes against others the opinions and
separating with the mass thinking. (Ngan Giang, 2017.)
The Net Generation is distinguished by their behaviour and attitude that can be clarified in
8 different norms (Tapscott 2009, 34-36):
Freedom: Net gender value freedom. They’re not overwhelmed by the rapid growth of
distribution channels of brands or technology but take it as an advantage to meet their
demands. It is more important for them to be on their own path without any restrictions
regarding work-life or self-expression. (Tapscott 2009, 34-36.)
Customization: This generation desires to have their product and everything they touch
to be customized and personalized, even with job descriptions (Tapscott 2009, 34-36).
Scrutiny: Unlike the old generation who has been amazed at the power of Internet, Net
Gender learns to be sceptical towards the massive information online – data, news,
knowledge and facts (Tapscott 2009, 34-36).
Integrity: Integrity has become the primary value for young people to select organizations
and institutions to associate with. They expect companies, universities and governments
to be trustworthy, reliable and take account of their concerns. (Tapscott 2009, 34-36.)
Collaboration: Youngsters find it’s more natural and reliable for staying connected online,
whether it is about buying a new product, playing games or simply communicate. Group
chat, file sharing, and topic discussions are among the activities that they associate with
other users. (Tapscott 2009, 34-36.)
Entertainment: Net Gender believes fun cannot be separated from their work life, as a
result of the booming era of game industry, more than 80% of children play games
regularly, admit that they prefer to keep themselves entertained during workload or study
(Tapscott 2009, 34-36).
Speed: Within the fast pace of technological transformation, communication more than
ever can be accessed in real-time and worldwide. That creates the need for fastening

22
process and desire to instantly get response from the others. It’s clear that Net-genders
would value the flow of information to be the fastest taken. (Tapscott 2009, 34-36.)
Innovation: Being on-trend and constantly updated have become top needs for young
people nowadays, they change their mobile phone and other technology devices to newer
and preferably latest version not because the current one is bad, but because the latest
model gives them social recognition and “cool” label among friends (Tapscott 2009, 34-
36).
3.3 Vietnamese digital market
According to the 2018 Digital report in Vietnam (Digital in Asia 2018), from the total
population of 96 million, 64 million are Internet users. 55 million are actively present on
social media, which accounts for 57% of the total population. More than 60 million
Vietnamese are using mobile for Internet service, covering 64% of the total population.
Figure 14. Digital in Vietnam 2018 (We are Social & Hootsuite 2018, in Digital in Asia
2018.)

23
Figure 15. Internet use in Vietnam 2018 (We are Social & Hootsuite 2018, in Digital in
Asia 2018.)
In 2017, overcoming Thailand and Turkey, Vietnam ranked 7th place globally regarding
the amount of Facebook users (The PIE Blog March 2018; Digital in Asia 2018). The
reasons for the increasing Internet users are the cheap handset cost, an affordable price
for 3g and 4g mobile network, and universal Wi-Fi connection (The PIE Blog March 2018;
Digital in Asia 2018). Access to Internet has never been so easy and quick like now.
Another reason is that news reading habit has become one of the main activities in
Vietnamese daily life. They are habitual readers from both online and offline. Most
Vietnamese people enjoy reading news from social media sites like Facebook, Google+,
LinkedIn and Zing Me. People from 18 to 29 is the main age group that prefers to read
their news via Internet and social media sites, where Google and Facebook are the top 2
popular websites for that purpose. (The PIE Blog March 2018.)
Mobile Internet becomes a revolution as consumers consider it the second favorite tool for
news search after television. Spending time on mobile phone also become Vietnamese
favorite activities, along with family gathering and going out with friends (Digital in Asia
2018.)
Mobile messaging applications are the most popular online services in Vietnam, followed
by social media networks and shopping apps. The local platform messaging app Zalo has
been the leader in the market, overcoming international competitors with the result of 80%
install rate of the smartphone users, while Facebook Messenger having 73%. The other
global players WeChat and WhatsApp are not so popular, having only 5% and 4% market
share. (Chadha 2016.)

24
Zalo is a messaging service application operated by VNG corporation, it is the first local
messaging app in Vietnam launched in 2012. While Viber is known for its strength in free
call and instant message, Line is famous for the entertainment factor, and KakaoTalk is
strong at the social aspect. Zalo has combined all three main aspects and creates the
best communication service for Vietnamese users. Besides the basic chatting function,
Zalo has an interest-based group chat where users can find their own community,
Vietnamese customized sticker feature, and nearby searching function where users can
reach for new friends. (Do 2013.)

25
4 Conducting research
This chapter presents the research data and research method of this study, as well as an
introduction to Q&Me organization where the data for empirical results was collected.
4.1 Research data
In this thesis, secondary data was used for both theoretical review and empirical research.
Secondary data means a data, which already exists and is gathered by others for various
purpose (Saunders, Lewis & Thornhill 2009, 256).
Secondary data is recommended to be used at the beginning of the research, as it
provides a better understanding and interpretation to the research problems (Ghauri &
Grønhaug 2010, 90). It can be collected from different sources like books, journal articles,
blogs, and online research, etc.
The secondary data is used for providing background information and statistics in the field
of digital marketing. Moreover, it is also chosen for answering the research problems in
understanding the current situation for the Vietnamese digital market, Vietnamese people
digital media’s behaviour and factors influence Vietnamese consumer’s behaviour on
social media.
4.2 Research method
The quantitative method, data collection and questionnaire will be discussed in this
section.
4.2.1 Quantitative method
The quantitative method was chosen to be the method for this research, as there’s a need
for a collection of data supposed to be investigated and clarified statistically. The research
goal was to understand Vietnamese people’s perception of digital media and social media.
Thus, a large-scale study was needed. The concept of quantitative method is to
understand particular social phenomenon and the reason for hypothesis (Minichiello,
Aroni, Timewell & Alexander 1995).
Quantitative method focuses on evidence, which is figure, number and rate instead of
actual knowledge or learning. The researcher obtains results from this method under
statistical form and inspects it with statistical techniques. (White 2003, 24.)

26
Survey is the most approachable technique in quantitative strategy, which can be
implemented by designing a form of questionnaire. A questionnaire is a list of designed
questions, aims to gather data from the answers, each question consists of several
options that respondents can select. (White 2003, 49-50.)
4.2.2 Data collection
The research aims to investigate Vietnam’s population to identify consumer’s insights and
attitudes towards digital media. Therefore, a large-scale study is required for the research.
Data is collected from an existing quantitative survey conducted by Q&Me, which is a
market research company in Vietnam. The survey was made to understand the latest
trends and usage of digital media and social media in Vietnam.
4.2.3 Questionnaire
The survey was conducted in Vietnam in September 2018, with 620 respondents, from 18
to 39 years old and nationwide (Q&Me 2018). The reason for using this survey is its
relevance to the study objective. It also meets with the need for big-scale population
study.
The survey was conducted in multiple-choice questionnaire, which was divided into 2
parts. The first part covers background variables, such as demographic information
including respondent’s age, gender, where they are from and household income. The
second part consists of compulsory multiple questions. The questionnaire consists of
questions of digital media usage, messaging service usage and social media usage.
4.3 Q&Me market research
Q&Me is the Vietnam organization specializes in market research service in both online
and offline, provides data on consumer’s trend and insight. Their services cover both
quantitative and qualitative surveys and interviews, which assure fraud-free and real-time
data access with a full analysis report. Q&Me is partnering with clients in Food and
Beverage, Manufacturing, Finance, Retail Store, Technology and Advertising agencies.
(Q&Me 2016.)
Q&Me’s database includes over 300,000 dedicated members with average aged between
16 and 39 from urban areas, who are eager to answer survey questions. When a survey is
conducted, the selected members will get notified through an email and app notification to

27
answer them. The company’s quality assurance process make sure research performance
meets the requirement of accuracy and validity by (Q&Me 2016):
• Conduct questionnaire based on the exact profile • Remove users with a contradicted and irrelevant answer • All answers and users are checked by experienced researchers
Q&Me is the preferred partner of SSI in Vietnam, their quality score by SSI (Q&Me 2016):
• Fact Consistency Score: 97% • Thought Consistency Score: 91% • Straight-Liner/ Flat Liner Score: 89% • Speeders Score: 97%

28
5 Empirical results
This chapter presents and analyzes the results of the collected data. The research is
divided into four parts: demographic, media usage, messaging usage and social media
usage.
5.1 Demographic of respondent
There were 620 respondents participated in the survey through Q&Me’s application. The
amount of respondents was well-representative of the sampling population needed for the
valid outcomes. In demographic section, respondents were asked to provide information
regarding gender, age, city where they are living and monthly income.
Figure 16. Gender distribution of survey respondents (Q&Me 2018.)
Figure 17. Age distribution of survey respondents (Q&Me 2018.)
Figures 16 and 17 show the gender and age distribution from respondents. There was an
equal amount of males and females participate in the questionnaire. The respondents did
not need to provide their specific age but only the age group that they belong to. In
general, there were not many differences in each age group distribution, with 34%
50%50%
Male Female
34%
34%
32%
18 - 24 25 - 32 33 - 39

29
respondents from the age of 18 to 24, 34% from 25 to 32 and 32% from 33 to 39. It means
that the results analyzed in this chapter represent the overall voices of both males and
females, from young generation to middle age.
Figure 18. City distribution of survey respondents (Q&Me 2018.)
Ho Chi Minh city and Hanoi are the main locations as there are 63% of respondents claim
they are from these two places while 37% of people stay in various places across the
country (Figure 18).
Figure 19. Monthly income distribution of survey respondents (Q&Me 2018.)
When asking about monthly income, 30% of respondents reported their income is higher
than 20.000.000 VND. The majority have income range between 10.000.000 VND and
20.000.000 VND that results in 36% of respondents, while the rest 34% earn lower
10.000.000 VND a month (Figure 19).
32%
31%
37%
Ho Chi Minh city Hanoi Others
30%
36%
34%
Above 20.000.000 VND
10.000.000 VND - 20.000.000 VND
Below 10.000.000 VND

30
5.2 Media usage
Regarding the question of various media channels usage, respondents were asked for
how long they used mentioned channels on a daily basis. The options were both digital
and traditional including Internet on mobile, Internet on PC or tablet, television,
newspaper, magazine and radio.
Figure 20. Average time spend on different media channels (hours) (Q&Me 2018.)
The result from Figure 20 shows information about time spent on media channels. Internet
was the most favorite platform that respondents spent time on, as they spent an average
of 2.8 hours on Internet by mobile and 2.4 hours from PC or tablet access. The next one
was TV with 1.5 hours being still popular. Newspaper, magazine and radio were the least
favored channels with only 0.2 hours of consumption.
Figure 21. Time spent on the most popular media channels in detail (Q&Me 2018.)
2,8
2,4
1,5
0,2 0,2 0,2
0
0,5
1
1,5
2
2,5
3
Internet(Mobile)
Internet(PC/Tablet)
TV Newspaper Magazine Radio
Hour
s
2%
6%
14%
19%
15% 14%
30%
11% 11% 12%
17%
10% 10%
29%
16%
21%
17%20%
11%
5%
10%
0%
5%
10%
15%
20%
25%
30%
35%
0 1 - 30 min 31 - 60 min 1 - 2 hours 2 - 3 hours 3 - 4 hours More than 4hours
Internet (Mobile) Internet (PC/ Tablet) TV

31
Figure 21 illustrates more detail on how respondents spent time on Internet and TV, which
are the most used channels. As mentioned earlier Internet indicated a huge amount of
access and most of the users spent more than 4 hours on this platform, accounting for
30% of respondents. For PC users, there was a comparable distribution for those who use
Internet from 1 minute to less than 4 hours (11%), while 17% of respondents used Internet
from 1 to 2 hours. Mobile Internet users went online more than PC users since more of
them use Internet from 30 minutes to less than 4 hours. In addition, while there were 2%
of respondents rarely used Internet on PC, the amount of those who didn’t use Internet on
mobile phone was 11%.
It is a bit different in the TV sector where most of the respondents were watching TV from
1 minute to 2 hours, with the highest rate of 21% respondents said they were watching TV
for no longer than 30 minutes. Only 5% of people spent 3 to 4 hours watching TV while
double of them enjoy TV for more than 4 hours. Compared to non-Internet users, there
were more non-TV watchers.
Based on the results, Internet attracts more users and more traffic while TV is popular
only for a short time.
5.3 Messaging popularity
Figure 22. Used messaging services (Q&Me 2018.)
Respondents answered the question regarding which messaging service app they are
using. Based on Figure 22 Facebook seemed to be dominant with 96% of respondents
who are using this platform, followed by the Vietnamese local service Zalo with 90% of
users. Viber and Skype share a similar rate of popularity of which 28% of asked people
said they are using these services. 11% of survey participants use other apps that are
least popular (LINE, Yahoo! Messenger, WeChat, WhatsApp, Kakao Talk).
96%
90%
28%
27%
11%
Facebook Messenger Zalo Viber Skype Others

32
Figure 23. Most used messaging app (Q&Me 2018.)
Figure 23 demonstrates the popularity of the apps from the point of view of the time spent.
56% of respondents said they spent most time on Facebook Messenger than other apps.
Zalo was the second with 40 % and Skype and Viber were the least used messaging
apps.
Figure 24. Most popular messaging service distribution by age group (Q&Me 2018.)
Figure 24 describes the distribution of the four most popular messaging services:
Facebook Messenger, Zalo, Viber and Skype. Nearly all Vietnamese people from
youngster to middle-age used Facebook Messenger. Zalo was more popular among
adults and middle-age and less in youth. The same trend applies to Viber and Skype as
these services attracted more people from the older groups than the young generation,
resulting in 14% in Viber and 16% in Skype usage.
56%
40%
2% 1%
Facebook Messenger Zalo Skype Viber
98%
83%
14% 16%
92% 91%
33% 34%
98% 95%
36% 32%
0%
20%
40%
60%
80%
100%
120%
FacebookMessenger
Zalo Viber Skype
18 - 24 25 - 32 33 - 39

33
The results emphasize the fact that young people are more interested in international
messaging service brands and they prefer only Facebook as their main tool for
communication, whereas the older generation use both international and local brands.
Figure 25. Most popular messaging service distribution by gender (Q&Me 2018.)
According to Figure 25, there is no big gap between gender distribution on messaging
usage. A slight amount of male prefers using Facebook Messenger than Zalo, while
female enjoys both platforms as communication channels.
Figure 26. Most popular messaging service distribution by city (Q&Me 2018.)
People from Ho Chi Minh city and Hanoi have the same interest rate for Facebook
Messenger. Zalo app was more favored in Ho Chi Minh city than in Hanoi with a small gap
of 3% of respondents. Results indicate that there were more Viber and Skype users in the
Ho Chi Minh city vs. the Hanoi.
98%89%
27% 27%
94% 91%
28% 27%
0%
20%
40%
60%
80%
100%
120%
FacebookMessenger
Zalo Viber Skype
Male Female
96% 92%
43% 38%
95%89%
24% 29%
0%
20%
40%
60%
80%
100%
120%
FacebookMessenger
Zalo Viber Skype
Ho Chi Minh city Hanoi
34
5.4 Social media popularity
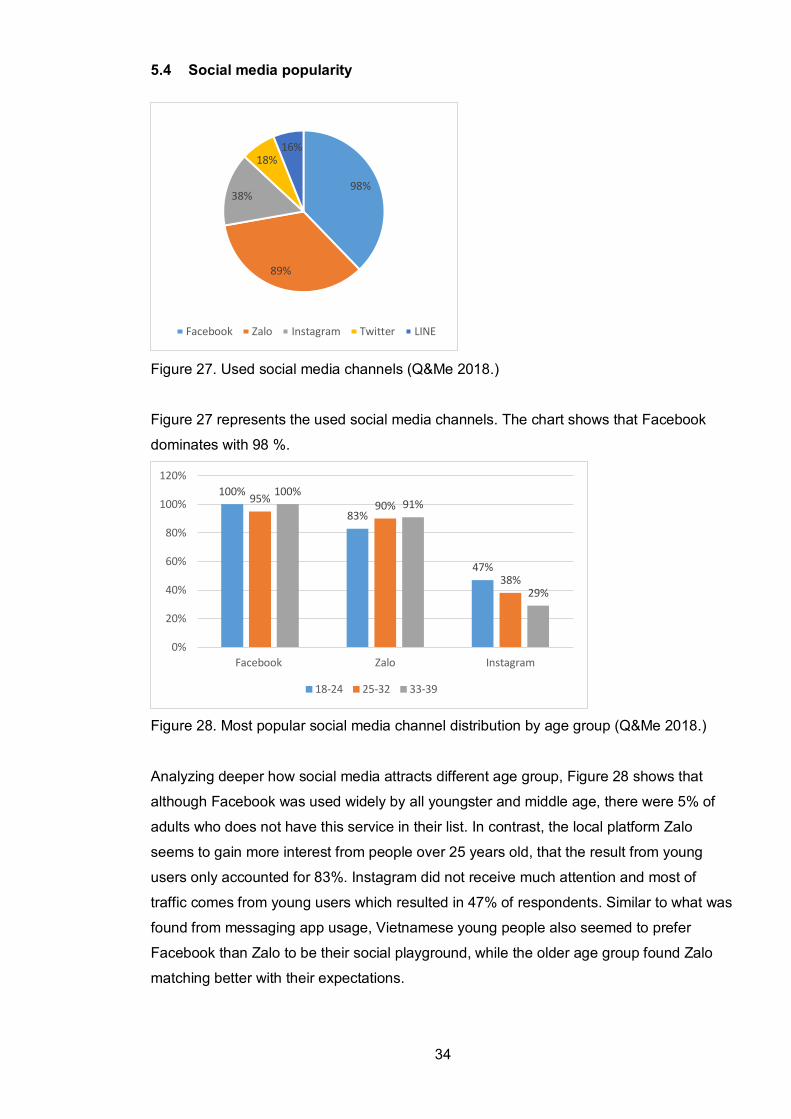
Figure 27. Used social media channels (Q&Me 2018.)
Figure 27 represents the used social media channels. The chart shows that Facebook
dominates with 98 %.
Figure 28. Most popular social media channel distribution by age group (Q&Me 2018.)
Analyzing deeper how social media attracts different age group, Figure 28 shows that
although Facebook was used widely by all youngster and middle age, there were 5% of
adults who does not have this service in their list. In contrast, the local platform Zalo
seems to gain more interest from people over 25 years old, that the result from young
users only accounted for 83%. Instagram did not receive much attention and most of
traffic comes from young users which resulted in 47% of respondents. Similar to what was
found from messaging app usage, Vietnamese young people also seemed to prefer
Facebook than Zalo to be their social playground, while the older age group found Zalo
matching better with their expectations.
98%
89%
38%
18%16%
Facebook Zalo Instagram Twitter LINE
100%
83%
47%
95% 90%
38%
100%91%
29%
0%
20%
40%
60%
80%
100%
120%
Facebook Zalo Instagram
18-24 25-32 33-39

35
Figure 29. Most popular social media channel distribution by gender (Q&Me 2018.)
Based on gender perspective, both males and females share seemed to share the same
interest toward these 3 platforms, although there were a small gap of 5% male
respondents who are not Instagram users.
Figure 30. Most popular social media channel distribution by city (Q&Me 2018.)
All Facebook, Zalo and Instagram were used widely in Ho Chi Minh and Hanoi. While
Facebook and Instagram had the same usage rate in both cities, Instagram was more
popular in Ho Chi Minh than Hanoi, which resulted in 45% and 39% of respondents
respectively.
99%88%
35%
97%90%
40%
0%
20%
40%
60%
80%
100%
120%
Facebook Zalo Instagram
Male Female
98%90%
45%
97%89%
39%
0%
20%
40%
60%
80%
100%
120%
Facebook Zalo Instagram
Ho Chi Minh city Hanoi

36
Figure 31. Social media channel that respondents use the most (Q&Me 2018.)
Figure 31 shows the percentage regarding most used platforms. Over two-third of survey
participants said that they prioritize Facebook than others. 20% of respondents chose
Zalo as their main social network and 2% had another option than these two.
Figure 32. Facebook and Zalo comparison by time spent (Q&Me 2018.)
Regarding the Facebook users, the majority spent 30 minute to 2 hours socializing on the
platform that corresponds 25% of the respondents. 10% of the respondents used
Facebook less than 30 minutes. 8% of people used Facebook for more than 5 hours and
the least people find themselves on Facebook for 4 to 5 hours.
More people enjoyed using Zalo in a shorter time than Facebook. The largest number of
respondents spent a maximum 30 minutes on Zalo. The second largest group use this
79%
20%
2%
Facebook Zalo Others
10%
24% 25%
19%
9%6%
8%
31%28%
20%
9%
5%2%
6%
0%
5%
10%
15%
20%
25%
30%
35%
Less than30 minutes
31 - 60 min 1 - 2 hours 2 - 3 hours 3 - 4 hours 4 - 5 hours Mor than 5hours
Facebook Zalo

37
app from 30 to 2 hours. 9% of respondents spent 2 to 3 hours and only 2% use Zalo for 5
hours.
Most people used Facebook and Zalo 30 minutes to 2 hours averagely. Zalo was popular
for short-time users compared to Facebook.
Figure 33. Reason to use social media (Q&Me 2018.)
To discover the reason for social media popularity, respondents were asked which factors
influence their decision on using these platforms. Figure 33 represents the result that were
the main reasons for people to use social media.
The number one reason to use social media is the need for communication, as 95% of
respondents said they find online networks as a great tool for staying connect friends and
family. 53% of respondents use these platforms to read news and update trend which is
the second biggest motive. Shopping, and finding personal interest and career-related
information are the next popular reasons to use social media. The following ranking
includes sharing respondent’s daily lives, finding a friend, expressing personal view,
following celebrity, and receiving information from favorite brands. The last four reasons
are about selling goods, attending promotion, extending business network and finding
friends from abroad.
15%15%
17%19%20%
22%23%
27%32%
34%40%41%
44%53%
95%
0% 10% 20% 30% 40% 50% 60% 70% 80% 90% 100%
Find new friends from abroadExtend my business networkAttent campaign/ promotion
Sell goodsReceive event information
Receive information from companies/ brandsFollow celebrities
Share my knowledge/ opinionFind new friends
Share my daily livesCareer/ business related updated
Interest/ hobbies updateShopping
News/ trend updateCommunicate with friends and family

38
Figure 34. Reason to use Facebook Messenger (Q&Me 2018.)
Figure 34 analyzes more specific reasons behind Facebook usage from respondents.
Facebook is obviously a great tool for communication as 89% of respondents use it for
this purpose. 55% of respondents read news and update trends on this platform make it
the second most voted reason. The rank continues with 49% of respondents said they like
to update topics regarding interest and hobbies, while 43% like to shop on this platform.
The final reasons for using Facebook are for receiving career updates and sharing
personal lives with 37% and 35% of votes.
Figure 35. Reason to use Zalo (Q&Me 2018.)
89%
55%49%
43%
37%
35%
Communicate with friends and family News/ trend update
Interested/ hobbies update Shopping
Receive career/ business related update Share my daily lives
91%
25%
21%
21%
21%
19%
Communicate with friends and family News/ trend update
Interested/ hobbies update Share my daily lives
Receive career/ business related update Find new friends

39
Similar with Facebook, top reasons for people using Zalo is for communication (91%) and
keep up to date with news (25%), following by the need of personal interest update (21%),
personal lives sharing (21%), career update (21%) and find new friends (19%)
Figure 36. Reason to use Instagram (Q&Me 2018.)
Unlike Facebook or Zalo, respondents used Instagram mainly for catching up with the
current trends and news. Participants also enjoyed using Instagram for communication,
interest update and following celebrities, with just three percent difference between the
three. Nearly 23% of respondents preferred to share their daily activities, and 18% go
shopping through this platform.
Figure 37. Post activity on social medias (Q&Me 2018.)
Figure 37 describes how often users posted content on the three social media channels. It
can be seen that the majority of the users didn’t post anything or only once per week.
People tend to post more on Facebook than on Zalo and Instagram, as the rate of the
regular posts is highest on this platform (41%).
50%
47%
45%
43%
23%
18%
News/ trend update Communicate with friends and family
Interested/ hobbies update Follow celebrities
Share my daily lives Shopping
41%
31%25%
59%
69%75%
0%
10%
20%
30%
40%
50%
60%
70%
80%
Facebook Zalo Instagram
Post more than once/ week Don't post more than once/ week

40
Figure 38. Content of post on Facebook (Q&Me 2018.)
Figure 38 illustrates what content users post on Facebook. Facebook seemed to be the
perfect platform for sharing and exchanging photos as it was the most-posted content.
56% of survey respondents said they post pictures with friends on Facebook, 50% share
photos from where they have traveled and 48% share photos of them with family. Selfie
photo was at the 4th ranks with 42%, and 39% of people rather share their opinion than
photos on this platform.
Figure 39. Content post on Zalo (Q&Me 2018.)
Photos were also the main content that people post on Zalo. A bit different from
Facebook, the largest share of photos on Zalo were selfies, which accounted for 46% of
56%
50%
48%
42%
39%
Photo with friends Photo of visited places Photo with family
Selfie photo Personal opinion
46%
44%
41%
40%
37%
Selfie photo Photo with friends Photo of visited places
Photo with family Personal opinion

41
participants. The next contents that people posted the most including photos with friends
(44%), photos of visited places (41%), photos with family (40%), and personal opinions
(37%).
Figure 40. Content post on Instagram (Q&Me 2018.)
Figure 40 shows the proportion of content sharing on Instagram. Since Instagram is
designed to work as a photo library that shares content among users, photos are
obviously the main subject on this platform. The most posted were traveling photos with
54% of respondents reported. Second place was selfie photos with only 2% indifference,
followed by photos taken with friends which account for 43% of respondents. The least
posted were food photos and family photos resulted in 37% and 33% of respondents
respectively.
Figure 41. Content posted distribution on social media by age group (Q&Me 2018.)
54%
52%43%
37%
33%
Photo of visited places Selfie photo Photo with friends
Photo with food Photo with family
45%42%
48%
31%34%
37%
52%55%
48% 46%
39%33%
52%46%
39%
51%
35%
27%
0%
10%
20%
30%
40%
50%
60%
Photo withfriends
Photo ofvisited places
Selfie photo Photo withfamily
Personalopinion
Photo ofFood
18-24 25-32 33-39
42
Figure 41 illustrates more details about content distribution based on different age groups.
Young people like to take photos of themselves and post them online as it is the most
shared content among this age group (48% of respondents). They also value friendship
since 45% of them report that they like to post photos with their friends. Sharing photos
from visited places was in third place with a result of 42% of respondents. Food photo and
personal opinion were their next priorities, and family photo was the least posted from
people of this age group.
On the contrary to the young generation, people from 25 to 32 seemed to prefer traveling
as traveling photos were posted the most in this group. Photos with friends were ranked in
second place which reported by 52% of adults. There is a slight gap in proportion between
selfie photos and family photos, while 48% of them said they enjoy sharing selfie photos,
less than 2% of them prefer to post a photo with their family members. People from this
group have the least interest in express personal opinions and food photos.
Middle-age people are normally friend and family-oriented. For this reason, photos with
friends and beloved family were their favorite content to share in public, reported by over
half of respondents from this age group. Traveling photo was their next interest, which
accounted for 46% of respondents. Selfie photo was chosen by 39% of votes, followed by
the content of personal opinion and food photo, respectively 35% and 27% of
respondents.
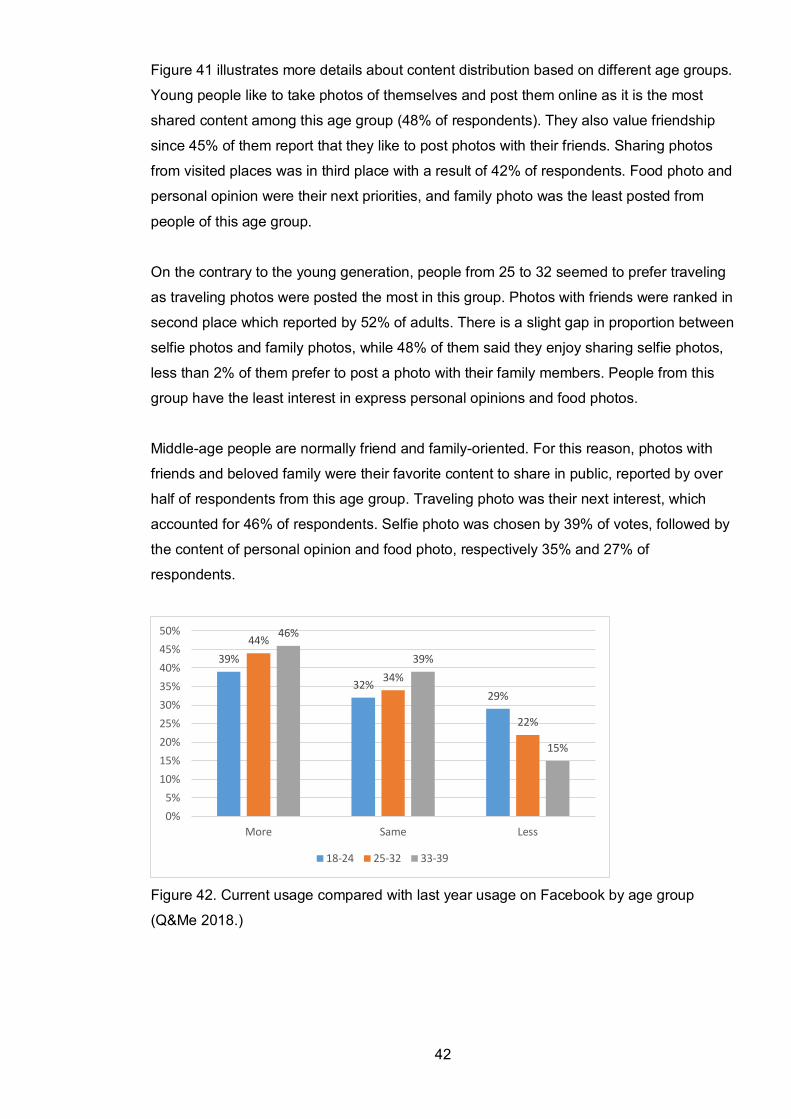
Figure 42. Current usage compared with last year usage on Facebook by age group
(Q&Me 2018.)
39%
32%29%
44%
34%
22%
46%
39%
15%
0%5%
10%15%20%25%30%35%40%45%50%
More Same Less
18-24 25-32 33-39

43
Survey participants were asked to compare their current social media usage with the last
year. Figure 42 presents the result of Facebook usage from three different age groups.
The majority of respondents said they have been using Facebook more than last year,
there are 46% of people from the middle-age group spent more time on Facebook, which
is also the highest proportion of the increasing level of usage. Nearly 40% of participants
from this group stayed at the same level of using this platform, and 15% reported they
have reduced the amount spent on the channel.
Adult was the second largest group that extended the volume of using Facebook, as a
result in 44% of respondents. While there were 34% of users from twenty-five to thirty-two
years old who remained on the same level and 22 % decided to not use Facebook as
much as before.
Although nearly 40% of youngsters spent more time on Facebook, slightly less than one-
third of them still have the same amount of usage for this platform (32%). And they also
gain the most rate for dropping out from this channel (29%).
Figure 43. Current usage compared with last year usage on Zalo by age group (Q&Me
2018.)
For people from 25-32, most of them used Zalo more than last year (45%), the amount of
those remain the same degree of usage is nearly 40% of total respondents, whereas 16%
of them cutting off their time on this platform.
On the other hand, the majority of youngsters keep the same level of usage, performed by
45% of young respondents. Around 30% of them used more Zalo than before and one-
third of the young generation decrease the amount of using this platform.
29%
45%
25%
45%
39%
16%
46% 44%
10%
0%5%
10%15%20%25%30%35%40%45%50%
More Same Less
18-24 25-32 33-39

44
Figure 44. Current usage compared with last year usage on Instagram by age group
(Q&Me 2018.)
Figure 44 shows information about the difference in level of usage on Instagram.
Instagram receives the same traffic as it had last year, with the result of sharing the similar
trend by three age groups. While people from the age of 33 to 39 was the biggest share
(64%) for remaining the same level of usage, the amount of young people and adults for
this trend is almost similar with only 2% of the difference.
The youth and mature groups share also the same number of spending more time and
less time on Instagram, respectively 33% and 28% of respondents.
33%
41%
27%33%
39%
28%
17%
64%
19%
0%
10%
20%
30%
40%
50%
60%
70%
More Same Less
18-24 25-32 33-39

45
6 Conclusions
In this chapter, key findings will be summarized as the answers for the research
questions. It’s then followed by the discussion with self-reflection and recommendation for
future studies.
6.1 Key findings
Vietnam is on the rise of becoming one of the fastest-growing economies in the world,
with significant transformation in digital and technology development. More than ever
almost two-third of the total population acquired themselves with the presence of Internet,
of which smartphone become the most popular device to access online.
With the advantage of having a low cost of generating Internet network, the increasing
amount of Internet access creates a huge influence on user online performance. Since
almost everything can be done and found online, more and more people have changed
their habits from switching offline activity to online-based, from reading news, shopping,
expanding the personal network and finding jobs.
Traditional phone text messaging is completely replaced by online messaging, as online
texting application has become the most used service for mobile users. Not only adapt
with the international market by utilizing global applications, but Vietnam as a nation also
acknowledges its demand and its potential by producing its own messaging service which
has become the most used application for texting in the domestic market. For a really
long-time mobile users were dependent on foreign apps. Now, after the launch of the first
mobile messaging app Zalo, there is a new era for self-produced in technology expansion.
Vietnamese people enjoy being online and willing to spend more time on Internet than
other media sites, they spend at least four hours a day using Internet either by mobile
phone or laptop, that emphasizes how important Internet is as part of people lives. It can
be seen that traditional media channels such as TV, newspapers, magazines and radio
are disrupted by the popularity of the Internet. Magazine and radio are the least popular of
the five main devices. In the future, we can probably expect to see more people accessing
Internet with smartphone as their preferred choice.
Especially the messaging apps have become popular among Vietnamese. Together with
the widespread of Facebook Messenger, Zalo found its own place in the local market and
shows the potential to compete with Facebook. local platform Zalo successfully has its
own place to be able to compete with the global giant Facebook in the domestic market.

46
Zalo beats other foreign apps such as Viber and Skype and become one of the most used
messaging services in Vietnam.
While youngsters prefer to use Facebook’s platform as the main tool for communication,
people from the age of twenty-five to thirty-nine, in contrast, enjoy using local messaging
service Zalo for chatting. Zalo is also more popular for people living in Ho Chi Minh city
than in the capital region. Overall, Ho Chi Minh city has a larger amount of messaging
users compare with the rest.
Zalo also ranks 2nd place for being the most used social media channel, below the giant
Facebook and above Instagram. Almost everyone from all age groups uses Facebook for
social networking, Vietnamese youngsters and middle age commit 100% to this platform.
Similar to the texting app, youngsters in Vietnam tend to be more attracted by global
platforms as the majority of them use Facebook and Instagram, while the older generation
considers Zalo as their favorite platform for social media.
Although there is a slight gap between both gender, social media is popular for both males
and females. A bit more amount of female like using Zalo and Instagram compared with
male, but males have more interest to be on Facebook than the other.
Not only having more users in texting app, but Ho Chi Minh city is also recorded to be the
top city that drives the highest traffic of social media. Most Vietnamese spend thirty
minutes to two hours on Facebook, but for Zalo, they limit usage time for using it for half
an hour to one hour.
Compared with the last year’s usage, Vietnamese people are now spending more time on
Facebook. Although there is an increasing amount of usage in Zalo, the proportion of
people remain the same rate is still big. Instagram, on the other hand, receives the same
level of traffic with what it did last year.
Factors driven for social media usage can be explained based on the demand for
personal connectivity, which has been the most chosen reason for Vietnamese using
social media. They need a tool to stay connected with friends and family that is free and
easy to access. In addition, reading is known as an important part of people’s daily lives,
they need a channel to serve the needs of reading news and being updated with
everything around. Other reasons for social media usage include shopping, updating
interest and career, sharing personal lives, finding new friends, sharing opinions, following
celebrities, getting notification from brands and companies, receiving event information,

47
selling goods, attending promotion, extending business network and finding friends from
abroad.
Vietnamese people use Facebook, Zalo and Instagram for the purpose of staying
connected, reading news and update hobbies. These are the main reason why the
majority go online. Most of the users post content less than once per week. Only a few
users express personal opinions on these platforms, whereas the rest just simply enjoy
publishing and sharing photos. Selfie photos are posted mostly from young people, while
adult prefers to share photos from their travel experience, and middle-age value moments
with family.
6.2 Discussion
I have chosen this topic of research due to my personal interest towards digital marketing
and my own home country market. With the findings collected from secondary data of the
survey and the research of relevant concepts, I have gained a better understanding of the
Vietnamese digital market and the potential of this growing economy.
The fact of choosing this topic and Vietnam as the subject give me the motivation to work
on and invest more time to study. Additionally, deciding to use secondary data as a survey
for quantitative research provided me better access to the survey results of a large
population.
Although the result is well-presentative for analyzing user behaviour, it is only applicable
for a short-term period as we can never know how different it is for the Vietnamese digital
market in the next ten years, or even just in one year, there would be a lot of changes.

48
References
Burton, N. 2012. Our hierarchy of needs. URL:
http://www.psychologytoday.com/blog/hide-and-seek/201205/our-hierarchy-needs.
Accessed: 27 November 2018.
BusinessBalls 2014. Abraham Maslow original hierarchy of needs concept 1954.
BusinessBalls.com. URL: https://www.businessballs.com/self-awareness/maslows-
hierarchy-of-needs/. Accessed: 27 November 2018.
Campbell, A. 2013. What is “owned, earned and paid media?”. Small Business Trends.
URL: https://smallbiztrends.com/2013/08/what-is-owned-earned-paid-media.html.
Accessed: 15 November 2018.
Chadha, R. 2016. Vietnam online: Digital usage and behavior, 2015-2020. Emarketer Inc.
Chaffey, D. & Ellis-Chadwick, F. 2012. Digital marketing: strategy, implementation and
practice. 5th ed. Pearson Education. Harlow.
Cheung, E. 14 August 2011. [Chart] Expected versus unexpected email marketing.
Modern Marketing Blog. URL: https://blogs.oracle.com/marketingcloud/unexpected-email-
marketing. Accessed 17 November 2018.
Chris, A. 2014. AdWords vs SEO - which is best for your marketing. Reliablesoft.net. URL:
https://www.reliablesoft.net/adwords-vs-seo-which-is-best-for-your-marketing/. Accessed:
22 November 2018.
Content Marketing Institute & MarketingProfs 2017. B2B content marketing: 2017
benchmarks, budgets, and trends-North America. URL:
https://contentmarketinginstitute.com/wp-
content/uploads/2016/09/2017_B2B_Research_FINAL.pdf. Accessed: 16 November
2018.
Copyblogger 2013. Content marketing: How content marketing builds your business. URL:
https://www.copyblogger.com/content-marketing/. Accessed: 25 November 2018.

49
Digital in Asia 2018. Vietnam: Digital trends & consumer landscape overview. URL:
https://digitalinasia.com/2018/06/18/vietnam-digital-trends-consumer-landscape/.
Accessed: 8 September 2019.
Do, M. A. 2013. Zalo: Vietnam’s flagship mobile messaging app has arrived. Tech in Asia.
URL: https://www.techinasia.com/zalo-vietnams-flagship-mobile-messaging-app-arrived.
Accessed: 18 September 2019.
Extole 2014. Workhorses and dark horses: digital tactics for customer acquisition. URL:
https://www.extole.com/wp-content/uploads/2015/03/Gigaom-and-Extole-Research.pdf.
Accessed: 17 November 2018.
Financial Times Lexicon. Definition of digital marketing. URL:
http://markets.ft.com/research/Lexicon/Term?term=digital-marketing. Accessed: 13
November 2018.
Ghauri, P. & Grønhaug, K. 2010. Research methods in business studies. 4th
ed. Pearson Education. Harlow.
Heinonen, K. 2011. Consumer activity in social media: Managerial approaches to
consumers' social media behavior. Journal of consumer behavior, 10, 6, pp. 356-364.
Herrera, B. 2018. What is unsuitable with social media. URL:
http://icescale43.curacaoconnected.com/post/what-is-unsuitable-with-social-media/.
Accessed: 20 November 2018.
Jackson, G. & Ahuja, V. 2016. Dawn of the digital age and the evolution of the marketing
mix. Journal of direct, data and digital marketing practice, 17, 3, pp. 170-186.
Kaplan, A. M. & Haenlein, M. 2010. Users of the world, unite! the challenges and
opportunities of social media. Business Horizons. Elsevier Inc.
Kaur, R & Singh, G. 2017. Internet marketing: The new era of innovation in E-commerce.
International Journal of Scientific Research in Computer Science, Engineering and
Information Technology, 2, 1, pp. 253-258.

50
Kemp, S. 30 January 2018. Digital in 2018: World’s internet users pass the 4 billion mark.
We Are Social. URL: https://wearesocial.com/blog/2018/01/global-digital-report-2018.
Accessed: 21 November 2018.
King, C. 11 September 2017. Pick me! Understanding social media motivation. HubSpot
Blog. URL: https://blog.hubspot.com/customers/understanding-social-media-motivation.
Accessed: 28 November 2018.
White, C. S. 5 January 2017. The biggest email marketing trends in 2017 will be... Litmus
Blog. URL: https://litmus.com/blog/the-biggest-email-marketing-trends-in-2017-will-be.
Accessed: 17 November 2018.
Marketo 2012. Creating content that sells: Content marketing for demand generation.
URL: https://89510cb3019f5ed1fb74-
ef823fe4b8b6e268d850836eac05f779.ssl.cf1.rackcdn.com/creatingContent.pdf.
Accessed: 16 November 2018.
Martin, C. 2017. Top 10 motivations for using social media. URL:
http://www.millennialevangelical.com/top-10-motivations-using-social-media/. Accessed:
29 November 2018.
Minichiello, V., Aroni, R., Timewell, E. & Alexander, L. 1995. In-depth interviewing:
principles, techniques and analysis. 2nd ed. Longman Cheshire, Melbourne.
Mirzaei, H., Jaryani, E., Aghaei, M., Salehi, M. & Saeidinia, M. 2012. Differences of
“Traditional Marketing” in opposition to “Electronic Marketing”. 2012 International
Conference on Economics, Business and Marketing Management, 29, pp. 231-234.
Ngan Giang. 2017. 20 years of internet in Vietnam - there is a generation growing up with
internet. Zing.vn. URL: https://news.zing.vn/zingnews-post796791.html. Accessed: 15
November 2018.
Phillips, H. 2015. Understanding customer behavior: Needs and motivation. WP Business
Tips. URL: https://wpbusinesstips.com/2015/04/understanding-customer-behavior-needs-
and-motivation/. Accessed: 27 November 2018.

51
Q&Me 2018. Vietnam social network popularity 2018. Asia Plus Inc. URL:
https://www.slideshare.net/asiaplus_inc/vietnam-social-network-popularity-2018.
Accessed: 22 September 2019.
Q&Me 2016. Vietnam market research for your business. Asia Plus Inc. URL:
https://qandme.net/en/research/quality-control.html. Accessed: 22 September 2019.
Rehmani, M. & Khan, M. I. 2011. The impact of E-media on customer purchase
intention. International journal of advanced computer science and applications, 2, pp. 100-
103.
Ryan, D. & Jones, C. 2009. Understanding digital marketing. Kogan Page Limited.
Sahney, S. 2012. Consumer needs and motivation emotions and mood consumer
involvement. Indian Institute of Technology. Kharagpur. URL:
https://nptel.ac.in/content/storage2/nptel_data3/html/mhrd/ict/text/110105054/lec14.pdf.
Accessed: 25 November 2018.
Saunders, M., Lewis, P. & Thornhill, A. 2009. Research methods for business students.
5th ed. Prentice Hall. Harlow.
Schiffman, L. G. & Wisenblit, J. 2015. Consumer behavior. 11th ed. Pearson cop. Boston.
Scholl, H. 2015. Instant profits guide to Instagram success. Hillary Scholl. Italy.
Shao, G. 2009. Understanding the appeal of user-generated media: A uses and
gratification perspective. Internet research. 19, 1, pp. 7-25.
Stafford, T. F., Stafford, M. R. 7 Schkade, L. L. 2004. Determining uses and gratifications
for the Internet. Decision Sciences, 35, 2, pp. 259-288.
Statista 2018. Facebook: Number of monthly active users worldwide 2008-2018. URL:
https://www.statista.com/statistics/264810/number-of-monthly-active-facebook-users-
worldwide/. Accessed: 21 November 2018.
Tapscott, D. 2009. Grown up digital: How the Net generation is changing your world.
McGraw-Hill. New York.

52
Taylor, M. 2018. 5 best B2B lead generation strategies (that’ll work in 2017). Venture
Harbour. URL: https://www.ventureharbour.com/b2b-lead-generation-strategies/.
Accessed: 16 November 2018.
The PIE Blog 2018. How the Vietnamese use the Internet, including social media. URL:
https://blog.thepienews.com/2018/03/how-the-vietnamese-use-the-internet-including-
social-media/. Accessed: 8 September 2019.
Tuten, T. L. & Solomon, M. R. 2013. Social media marketing. International ed. Pearson
Education. Upper Saddle River.
Valentine, O. 11 January 2018. Top 10 reasons for using social media. GlobalWebIndex
Blog. URL: https://blog.globalwebindex.com/chart-of-the-day/social-media/. Accessed: 28
November 2018.
White, B. 2003. Dissertation skills for business and management students. New ed.
Continuum Publishing Corporation.