the dietary guidelines for americans 2015-2020 · the dietary guidelines for americans 2015-2020....
TRANSCRIPT

NDEP Webinar Series
The Dietary Guidelines for Americans 2015-2020What Are They, How Have They Changed, and How Can You Use Them in Practice?
Welcome
Betsy Rodríguez, RN, MSN, CDE Deputy DirectorNational Diabetes Education ProgramDivision of Diabetes TranslationCenters for Disease Control and Prevention
Introduction• Managing a chronic disease like diabetes requires multiple
decisions each day on a range of complex processes. • There are no vacations, no time-outs.• What can I eat? This is the most common question from
people with diabetes.• Nutrition plays an important role in controlling or preventing
diabetes.
Learning Objectives
• Explain the purpose of the Dietary Guidelines for Americans (DGA), how they have changed, and how they should be used in diabetes education.
• Describe the impact that changes to the dietary guidelines can have on the broader public health nutrition world.
• Name the tools to apply the recommendations in public health.
• Identify aspects of culture that can facilitate the use of the dietary guidelines
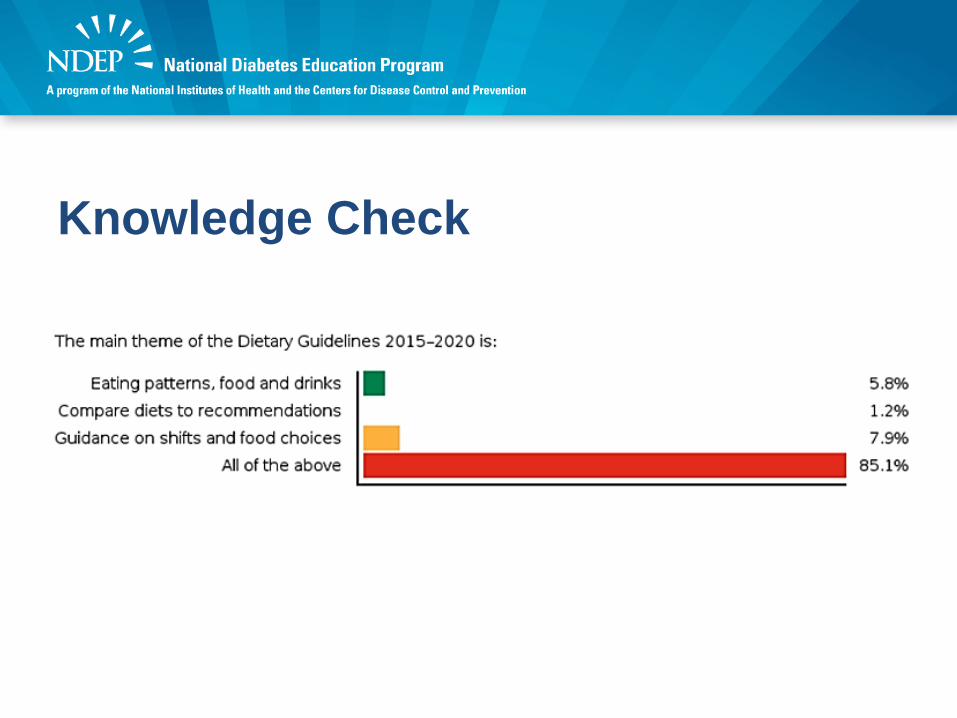
Knowledge Check• The main theme of the Dietary Guidelines
2015–2020 is:A. Importance of eating patterns as a whole;
combination of foods and drinks that people consume over time.
B. It’s comparison of how Americans are eating now against recommendations, providing data by age groups and sex.
C. Information about shifts (healthy substitutions in food choices) for achieving healthy eating patterns.
D. All of the above
Knowledge Check
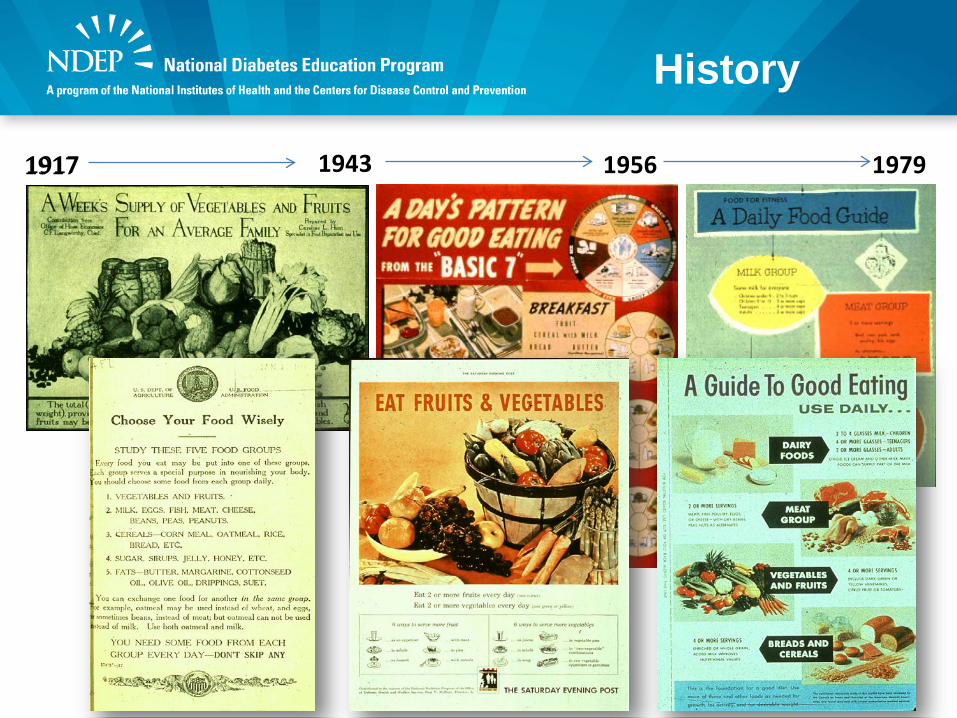
History
1917 1943 11917 956 1979
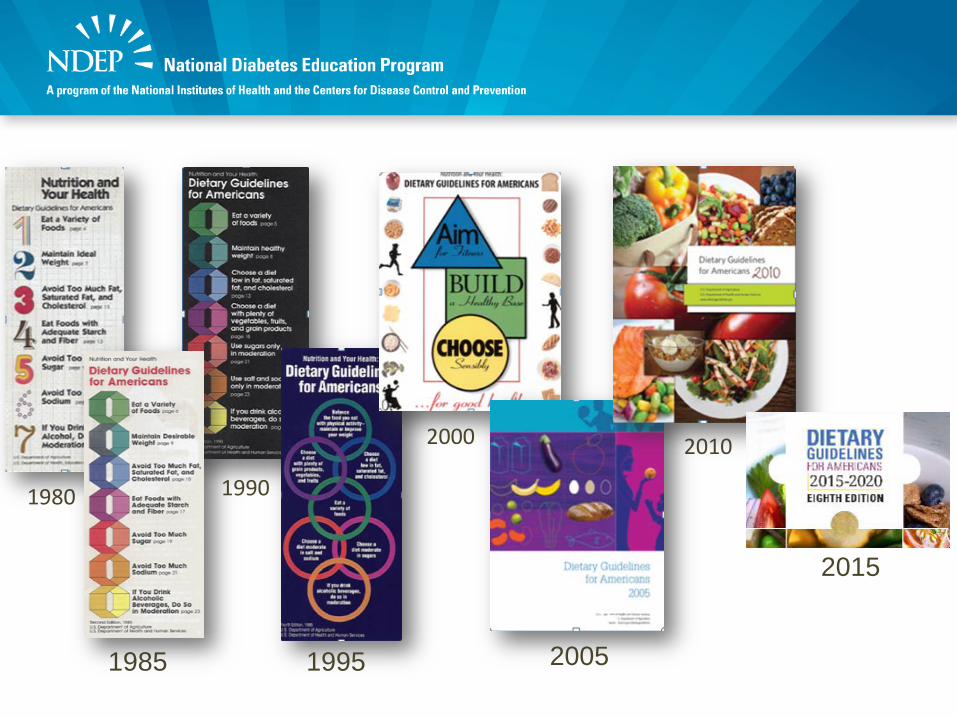
1980
1985
1990
1995
2000
2005
2010
2015
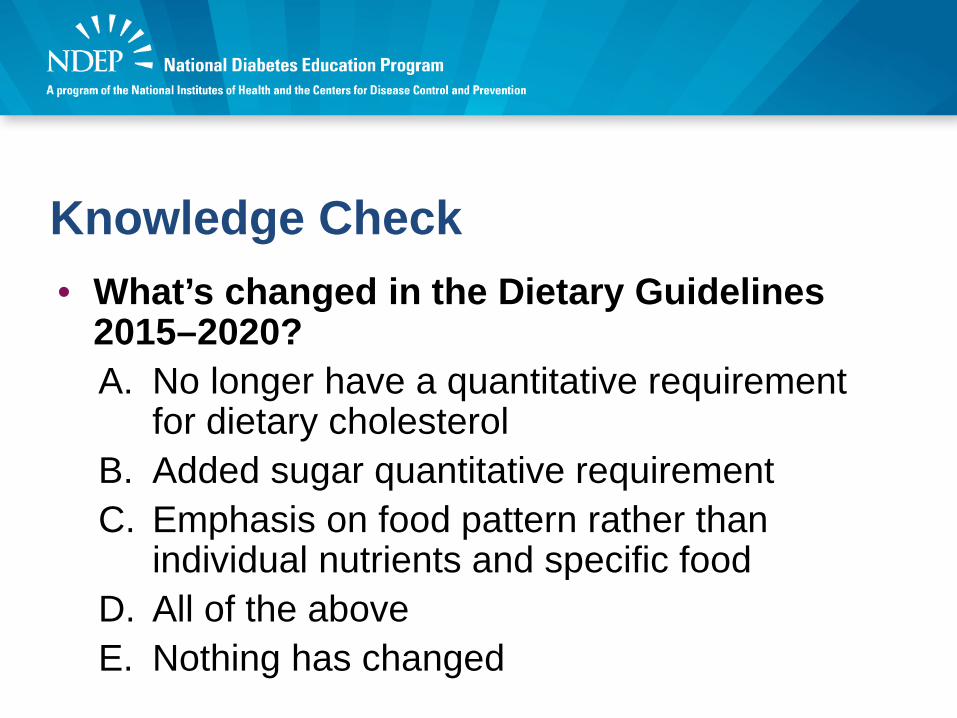
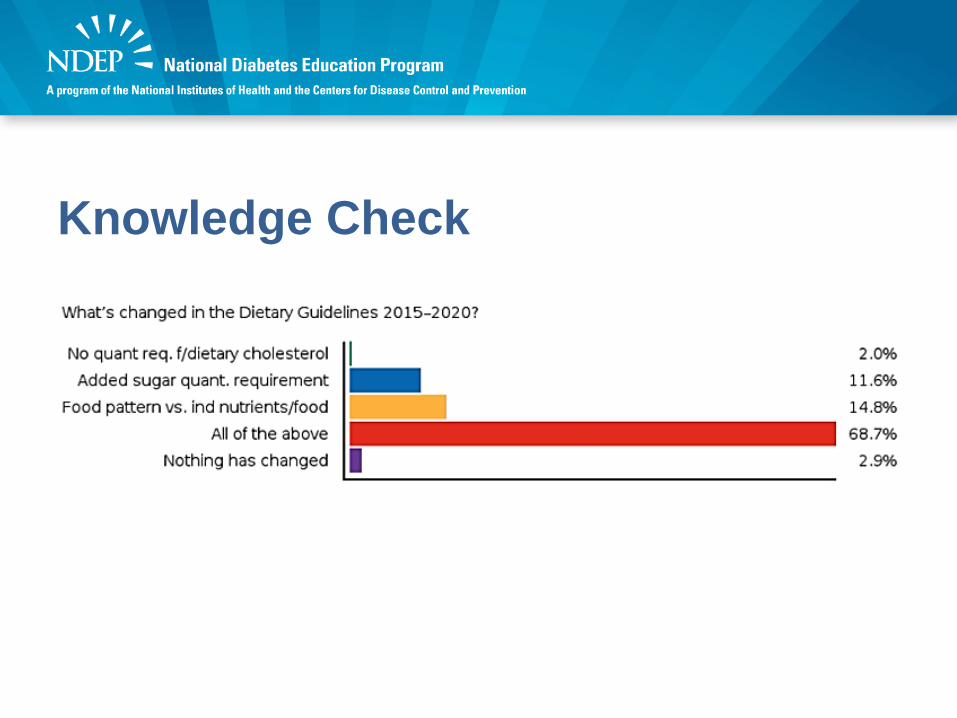
Knowledge Check• What’s changed in the Dietary Guidelines
2015–2020?A. No longer have a quantitative requirement
for dietary cholesterolB. Added sugar quantitative requirementC. Emphasis on food pattern rather than
individual nutrients and specific foodD. All of the aboveE. Nothing has changed
Knowledge Check
Today’s Presenters
Jennifer Seymour, PhDSenior Policy AdvisorDivision of Nutrition, Physical Activity, and ObesityCenters for Disease Control and Prevention
Lorena Drago, MS, RD, CDN, CDE FounderHispanic Foodways

Jennifer Seymour, PhD
DIETARY GUIDELINES FOR AMERICANS 2015-2020
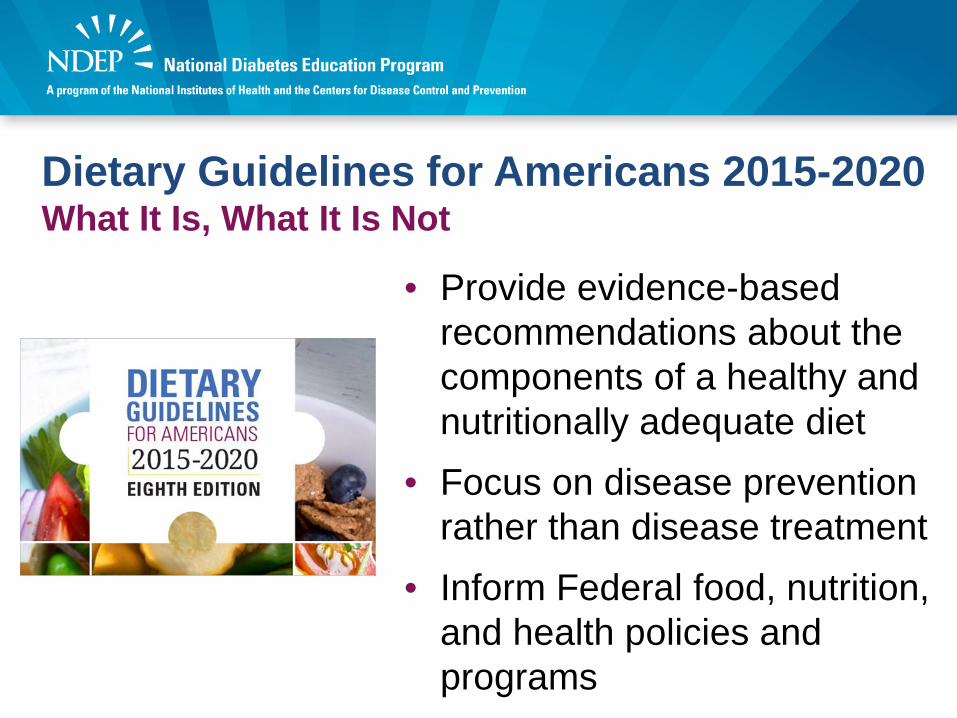
Dietary Guidelines for Americans 2015-2020 What It Is, What It Is Not
• Provide evidence-based recommendations about the components of a healthy and nutritionally adequate diet
• Focus on disease prevention rather than disease treatment
• Inform Federal food, nutrition, and health policies and programs
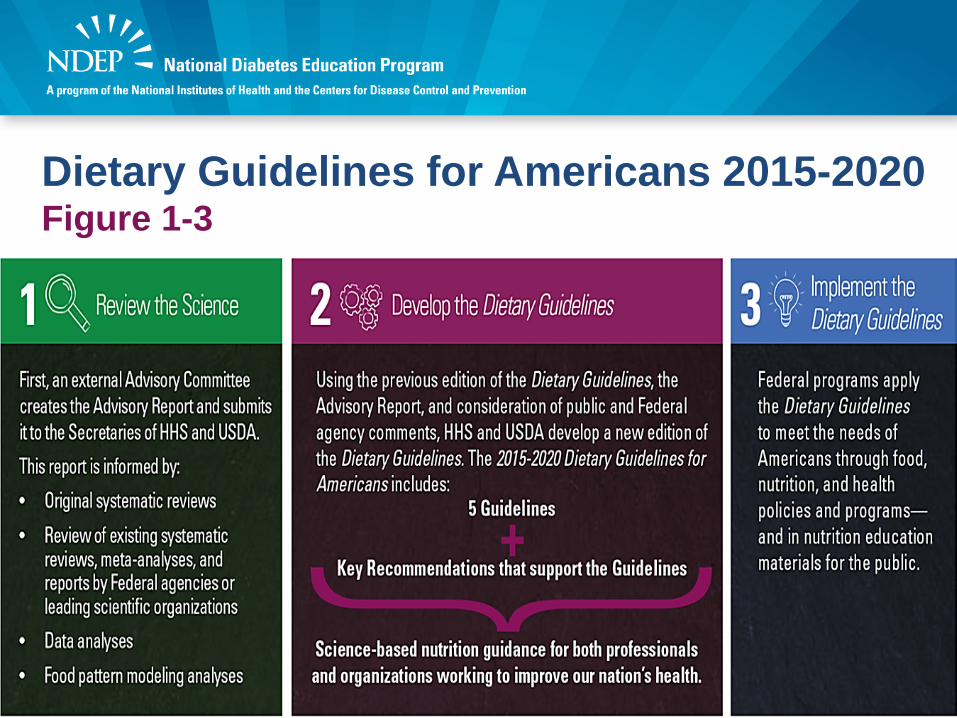
Dietary Guidelines for Americans 2015-2020 Figure 1-3
Dietary Guidelines for Americans 2015-2020 Contents• Executive Summary
• Introduction
• Chapter 1: Key Elements of Healthy Eating Patterns
• Chapter 2: Shifts Needed to Align With Healthy Eating Patterns
• Chapter 3: Everyone Has a Role in Supporting Healthy Eating Patterns
• Appendixes
Dietary Guidelines for Americans 2015-2020 The Guidelines
1. Follow a healthy eating pattern across the lifespan. All food and beverage choices matter. Choose a healthy eating pattern at an appropriate calorie level to help achieve and maintain a healthy body weight, support nutrient adequacy, and reduce the risk of chronic disease.
2. Focus on variety, nutrient density, and amount. To meet nutrient needs within calorie limits, choose a variety of nutrient-dense foods across and within all food groups in recommended amounts.
3. Limit calories from added sugars and saturated fats and reduce sodium intake. Consume an eating pattern low in added sugars, saturated fats, and sodium. Cut back on foods and beverages higher in these components to amounts that fit within healthy eating patterns.
4. Shift to healthier food and beverage choices. Choose nutrient-dense foods and beverages across and within all food groups in place of less healthy choices. Consider cultural and personal preferences to make these shifts easier to accomplish and maintain.
5. Support healthy eating patterns for all. Everyone has a role in helping to create and support healthy eating patterns in multiple settings nationwide, from home to school to work to communities.
Dietary Guidelines for Americans 2015-2020 The Guidelines (cont.)
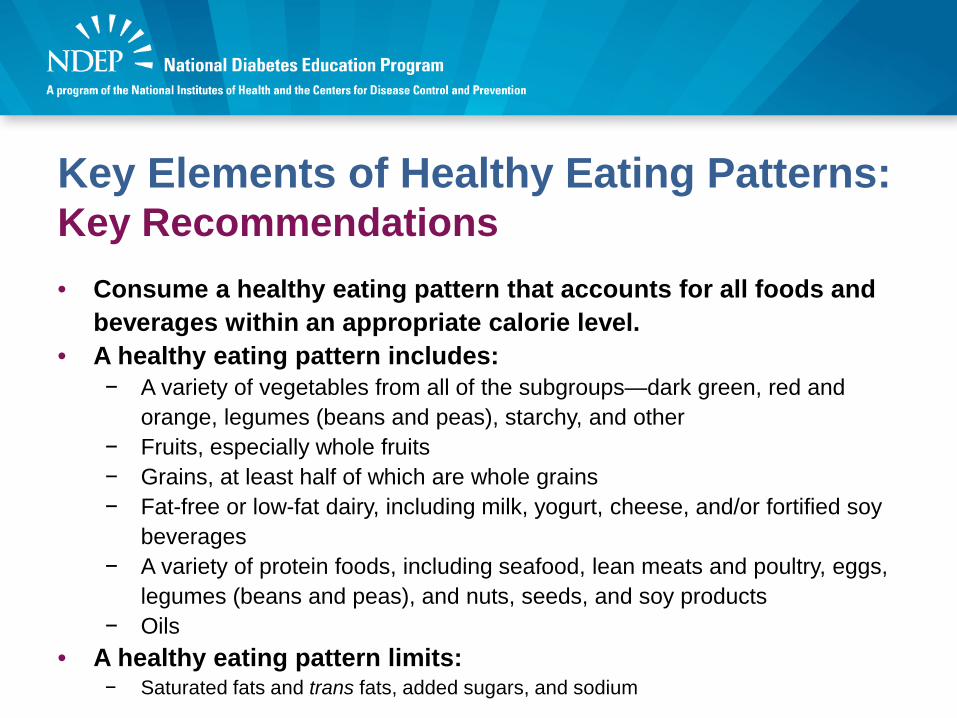
Key Elements of Healthy Eating Patterns:Key Recommendations• Consume a healthy eating pattern that accounts for all foods and
beverages within an appropriate calorie level.• A healthy eating pattern includes:
− A variety of vegetables from all of the subgroups—dark green, red and orange, legumes (beans and peas), starchy, and other
− Fruits, especially whole fruits− Grains, at least half of which are whole grains− Fat-free or low-fat dairy, including milk, yogurt, cheese, and/or fortified soy
beverages− A variety of protein foods, including seafood, lean meats and poultry, eggs,
legumes (beans and peas), and nuts, seeds, and soy products− Oils
• A healthy eating pattern limits:− Saturated fats and trans fats, added sugars, and sodium
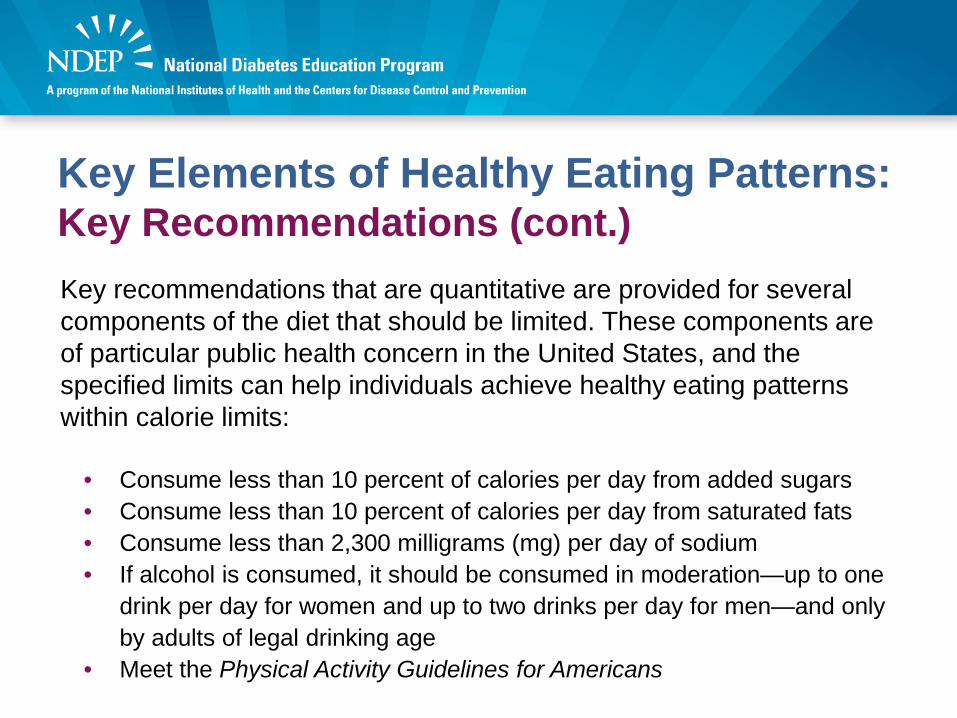
Key Elements of Healthy Eating Patterns:Key Recommendations (cont.)Key recommendations that are quantitative are provided for several components of the diet that should be limited. These components are of particular public health concern in the United States, and the specified limits can help individuals achieve healthy eating patterns within calorie limits:
• Consume less than 10 percent of calories per day from added sugars• Consume less than 10 percent of calories per day from saturated fats• Consume less than 2,300 milligrams (mg) per day of sodium• If alcohol is consumed, it should be consumed in moderation—up to one
drink per day for women and up to two drinks per day for men—and only by adults of legal drinking age
• Meet the Physical Activity Guidelines for Americans
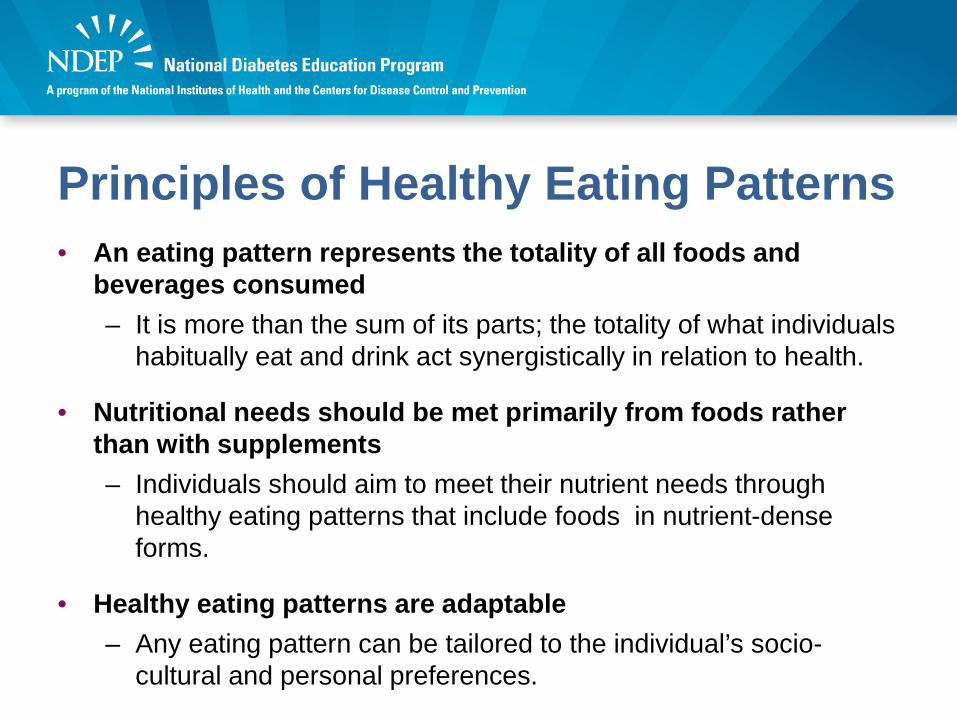
Principles of Healthy Eating Patterns• An eating pattern represents the totality of all foods and
beverages consumed– It is more than the sum of its parts; the totality of what individuals
habitually eat and drink act synergistically in relation to health.
• Nutritional needs should be met primarily from foods rather than with supplements– Individuals should aim to meet their nutrient needs through
healthy eating patterns that include foods in nutrient-dense forms.
• Healthy eating patterns are adaptable – Any eating pattern can be tailored to the individual’s socio-
cultural and personal preferences.
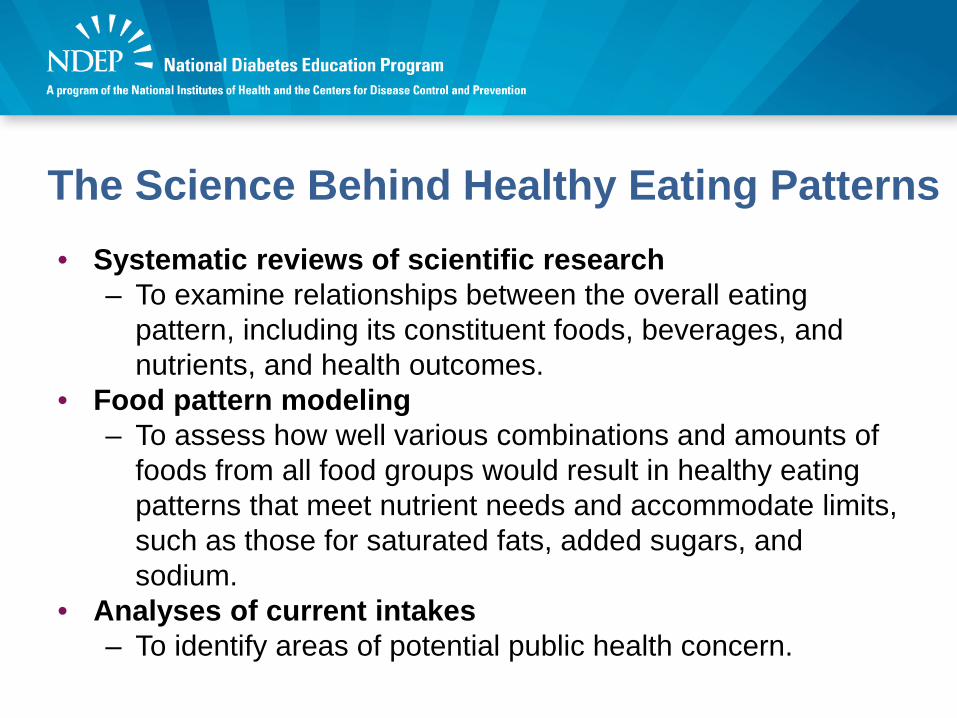
The Science Behind Healthy Eating Patterns• Systematic reviews of scientific research
– To examine relationships between the overall eating pattern, including its constituent foods, beverages, and nutrients, and health outcomes.
• Food pattern modeling – To assess how well various combinations and amounts of
foods from all food groups would result in healthy eating patterns that meet nutrient needs and accommodate limits, such as those for saturated fats, added sugars, and sodium.
• Analyses of current intakes – To identify areas of potential public health concern.
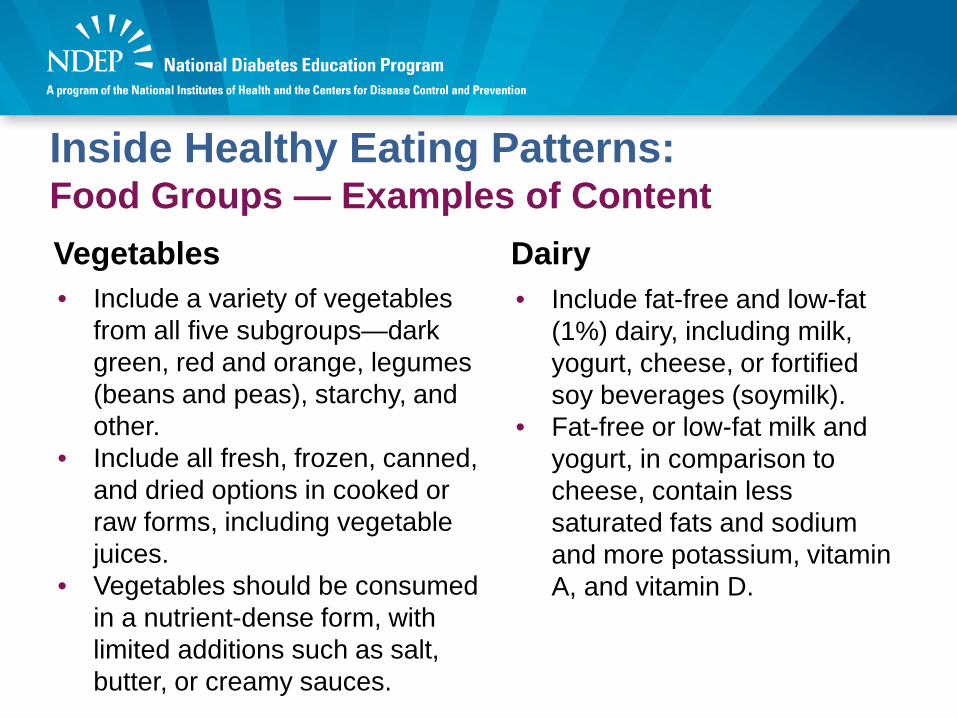
Inside Healthy Eating Patterns:Food Groups — Examples of Content Vegetables• Include a variety of vegetables
from all five subgroups—dark green, red and orange, legumes (beans and peas), starchy, and other.
• Include all fresh, frozen, canned, and dried options in cooked or raw forms, including vegetable juices.
• Vegetables should be consumed in a nutrient-dense form, with limited additions such as salt, butter, or creamy sauces.
Dairy• Include fat-free and low-fat
(1%) dairy, including milk, yogurt, cheese, or fortified soy beverages (soymilk).
• Fat-free or low-fat milk and yogurt, in comparison to cheese, contain less saturated fats and sodium and more potassium, vitamin A, and vitamin D.
Inside Healthy Eating Patterns:Other Components
“In addition to the food groups, it is important to consider other food components when making food and beverage choices.”
• Added sugars• Saturated fats• Trans fats• Cholesterol• Sodium• Alcohol• Caffeine
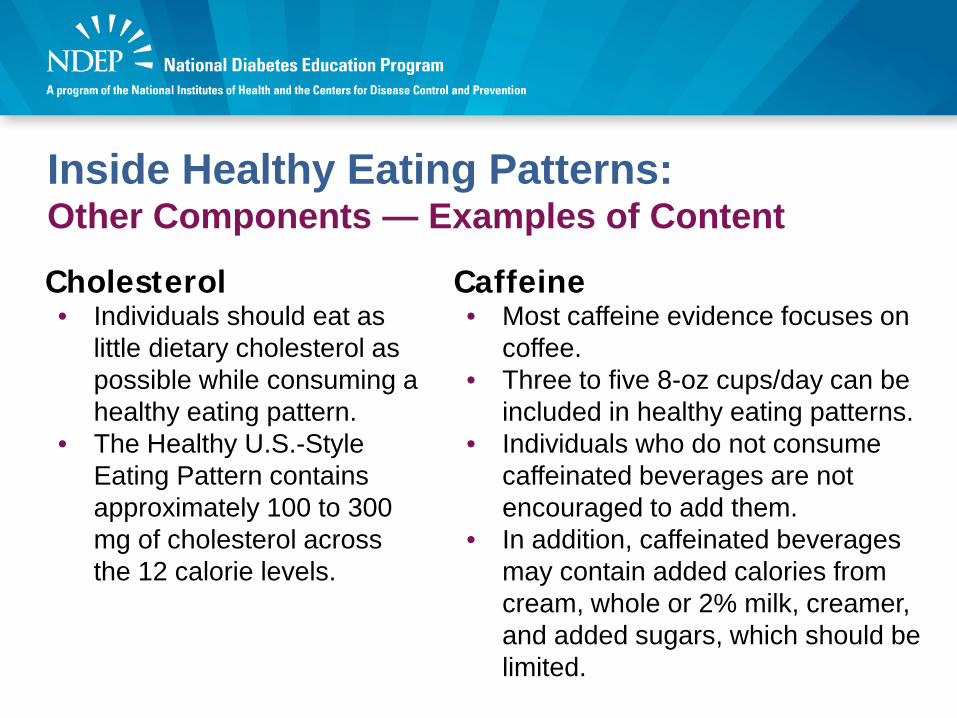
Inside Healthy Eating Patterns:Other Components — Examples of Content
Cholesterol• Individuals should eat as
little dietary cholesterol as possible while consuming a healthy eating pattern.
• The Healthy U.S.-Style Eating Pattern contains approximately 100 to 300 mg of cholesterol across the 12 calorie levels.
Caffeine• Most caffeine evidence focuses on
coffee.• Three to five 8-oz cups/day can be
included in healthy eating patterns.• Individuals who do not consume
caffeinated beverages are not encouraged to add them.
• In addition, caffeinated beverages may contain added calories from cream, whole or 2% milk, creamer, and added sugars, which should be limited.
Healthy Eating Patterns:Detailed Information
Call-out boxes provide details on many topics:• Healthy physical activity patterns• Importance of calorie balance• About legumes (beans and peas)• How to make half of grains whole grains• About seafood• About meats and poultry• Dietary fats—the basics• Dietary Approaches to Stop Hypertension (DASH)• Caffeine
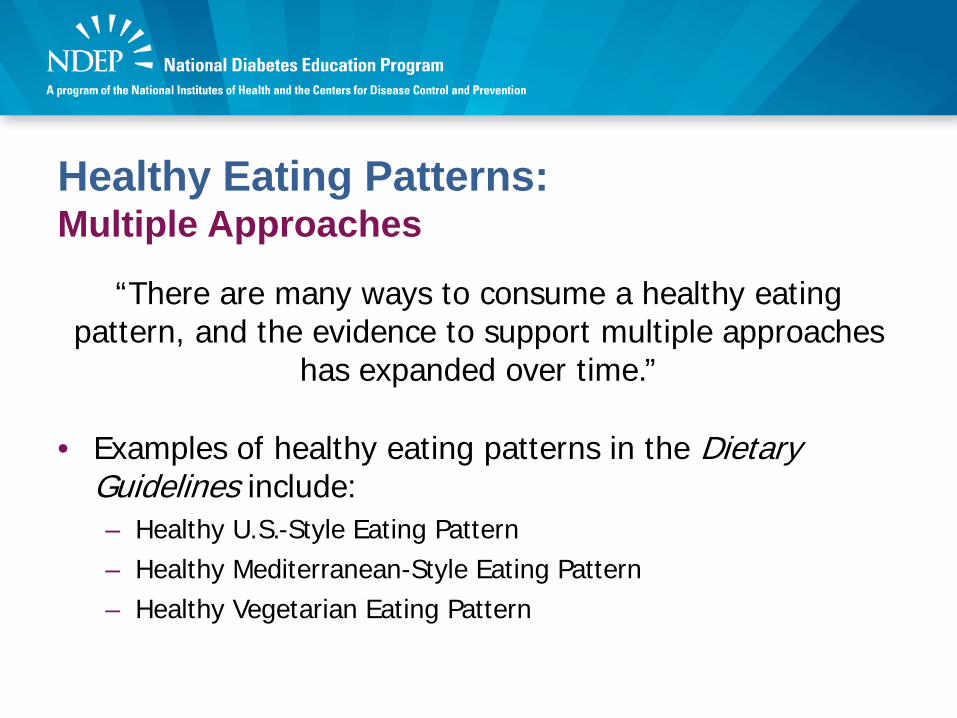
Healthy Eating Patterns:Multiple Approaches
“There are many ways to consume a healthy eating pattern, and the evidence to support multiple approaches
has expanded over time.”
• Examples of healthy eating patterns in the Dietary Guidelines include:– Healthy U.S.-Style Eating Pattern – Healthy Mediterranean-Style Eating Pattern – Healthy Vegetarian Eating Pattern
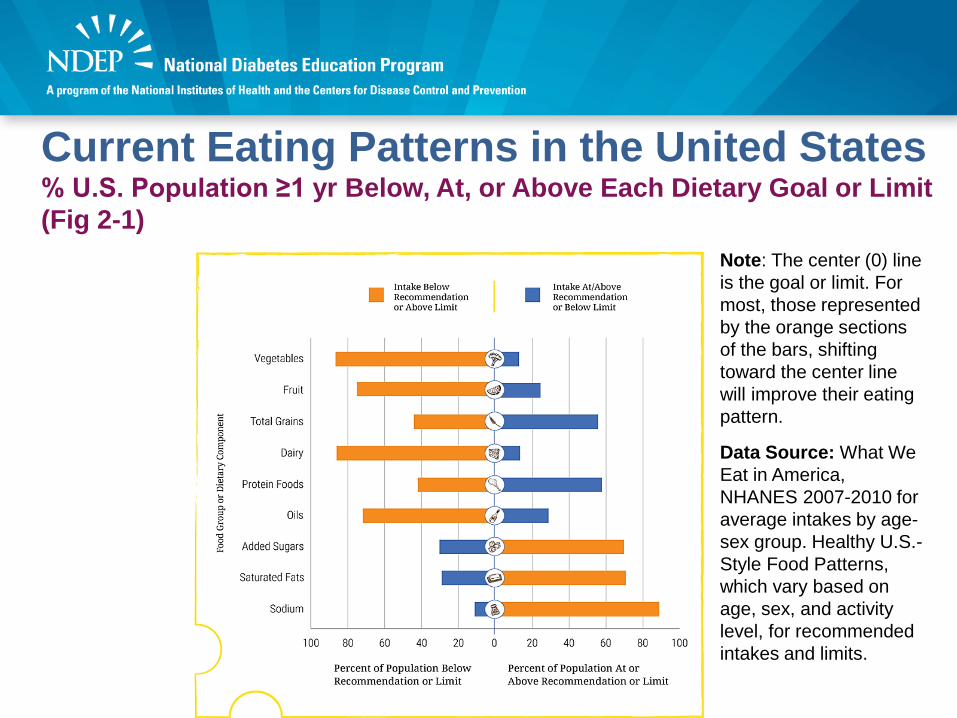
Current Eating Patterns in the United States% U.S. Population ≥1 yr Below, At, or Above Each Dietary Goal or Limit (Fig 2-1)
Note: The center (0) line is the goal or limit. For most, those represented by the orange sections of the bars, shifting toward the center line will improve their eating pattern.
Data Source: What We Eat in America, NHANES 2007-2010 for average intakes by age-sex group. Healthy U.S.-Style Food Patterns, which vary based on age, sex, and activity level, for recommended intakes and limits.

Whole and Refined Grains: Intakes and RecommendationsAverage Intakes Compared to Ranges of Recommendations and Limits (Figure 2-5)
Note: Recommended daily intake of whole grains is to be at least half of total grain consumption, and the limit for refined grains is to be no more than half of total grain consumption. The blue vertical bars on this graph represent one half of the total grain recommendations for each age-sex group, and therefore indicate recommendations for the minimum amounts to consume of whole grains or maximum amounts of refined grains. To meet recommendations, whole grain intake should be within or above the blue bars and refined grain intake within or below the bars.
Data Sources: What We Eat in America, NHANES 2007-2010 for average intakes by age-sex group. Healthy U.S.-Style Food Patterns, which vary based on age, sex, and activity level, for recommended intake ranges.
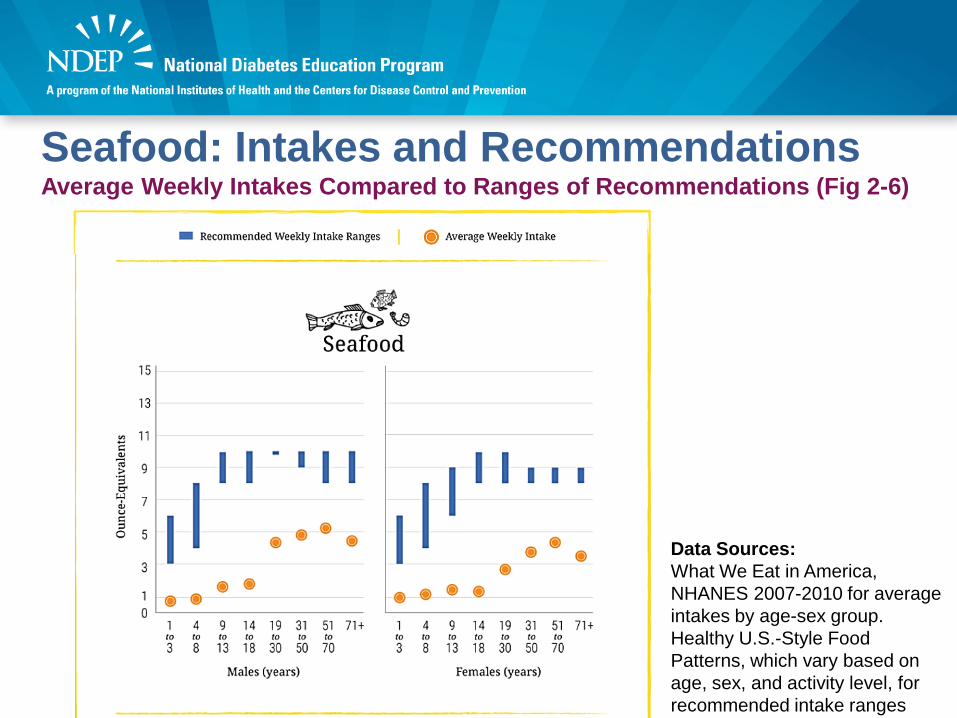
Seafood: Intakes and RecommendationsAverage Weekly Intakes Compared to Ranges of Recommendations (Fig 2-6)
Data Sources: What We Eat in America, NHANES 2007-2010 for average intakes by age-sex group. Healthy U.S.-Style Food Patterns, which vary based on age, sex, and activity level, for recommended intake ranges
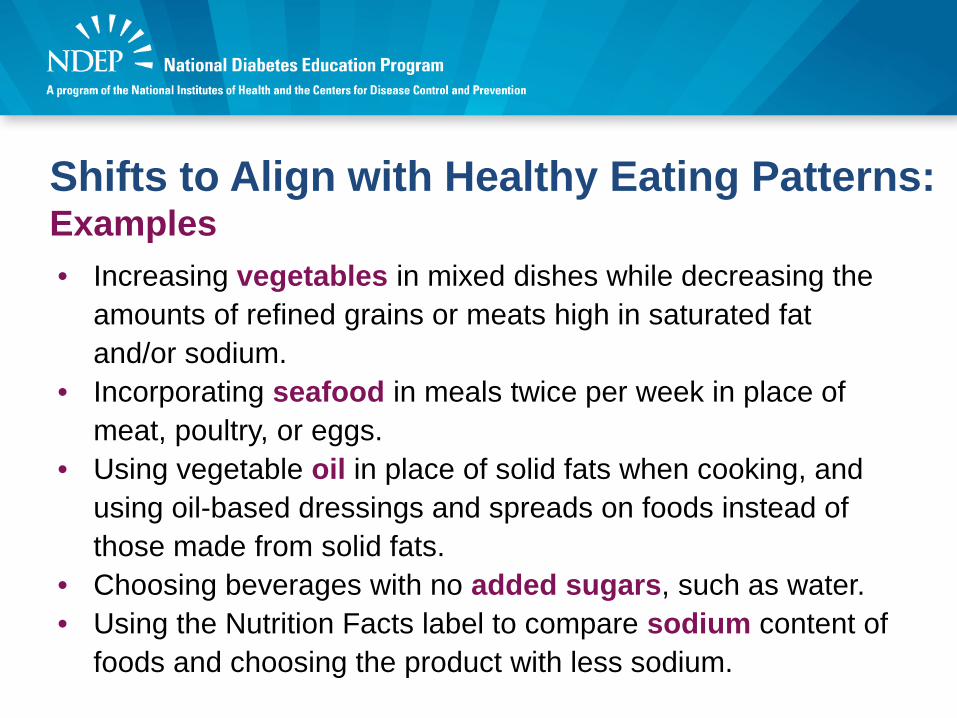
Shifts to Align with Healthy Eating Patterns:Examples• Increasing vegetables in mixed dishes while decreasing the
amounts of refined grains or meats high in saturated fat and/or sodium.
• Incorporating seafood in meals twice per week in place of meat, poultry, or eggs.
• Using vegetable oil in place of solid fats when cooking, and using oil-based dressings and spreads on foods instead of those made from solid fats.
• Choosing beverages with no added sugars, such as water.• Using the Nutrition Facts label to compare sodium content of
foods and choosing the product with less sodium.
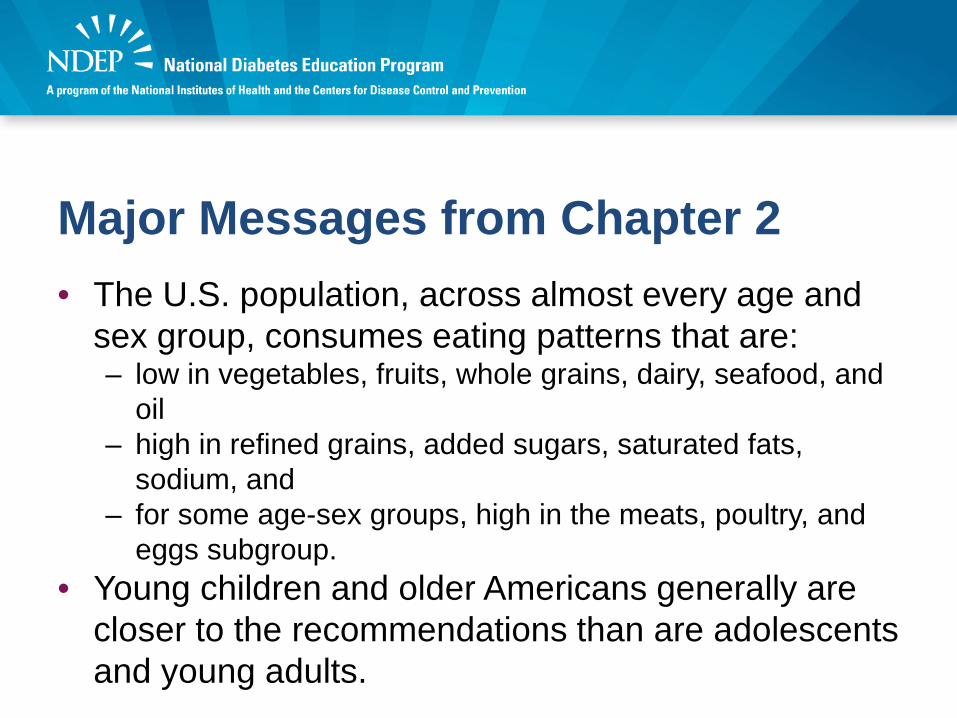
Major Messages from Chapter 2• The U.S. population, across almost every age and
sex group, consumes eating patterns that are: – low in vegetables, fruits, whole grains, dairy, seafood, and
oil – high in refined grains, added sugars, saturated fats,
sodium, and – for some age-sex groups, high in the meats, poultry, and
eggs subgroup. • Young children and older Americans generally are
closer to the recommendations than are adolescents and young adults.
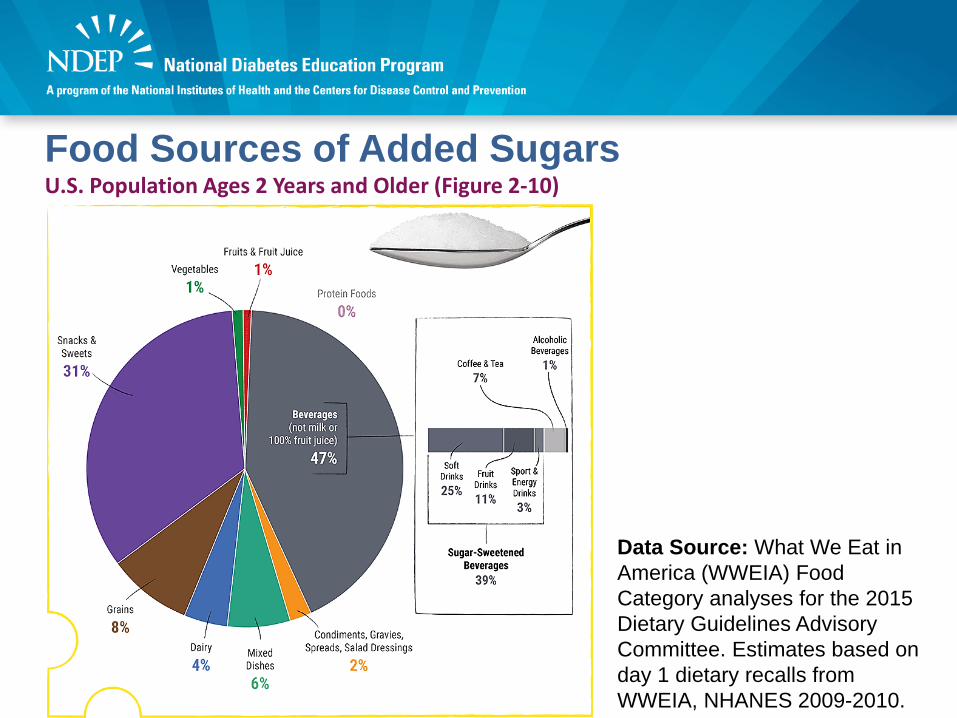
Food Sources of Added SugarsU.S. Population Ages 2 Years and Older (Figure 2-10)
Data Source: What We Eat in America (WWEIA) Food Category analyses for the 2015 Dietary Guidelines Advisory Committee. Estimates based on day 1 dietary recalls from WWEIA, NHANES 2009-2010.
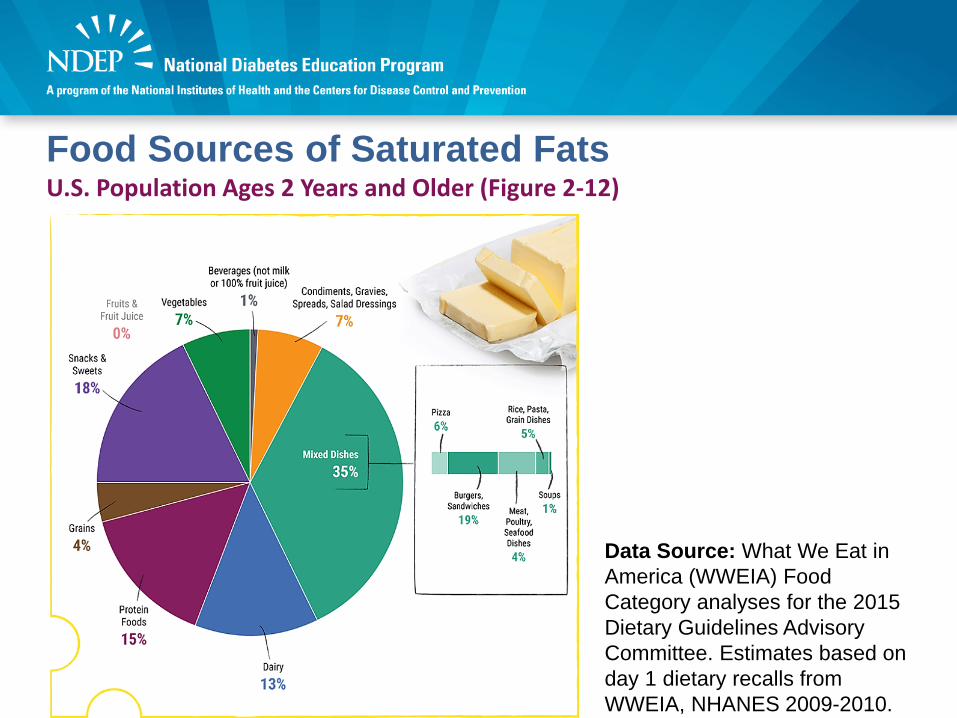
Food Sources of Saturated FatsU.S. Population Ages 2 Years and Older (Figure 2-12)
Data Source: What We Eat in America (WWEIA) Food Category analyses for the 2015 Dietary Guidelines Advisory Committee. Estimates based on day 1 dietary recalls from WWEIA, NHANES 2009-2010.

Food Sources of SodiumFood Category Sources of Sodium in U.S. Population ≥2 Years (Figure 2-14)
Data Source: What We Eat in America (WWEIA) Food Category analyses for the 2015 Dietary Guidelines Advisory Committee. Estimates based on day 1 dietary recalls from WWEIA, NHANES 2009-2010.

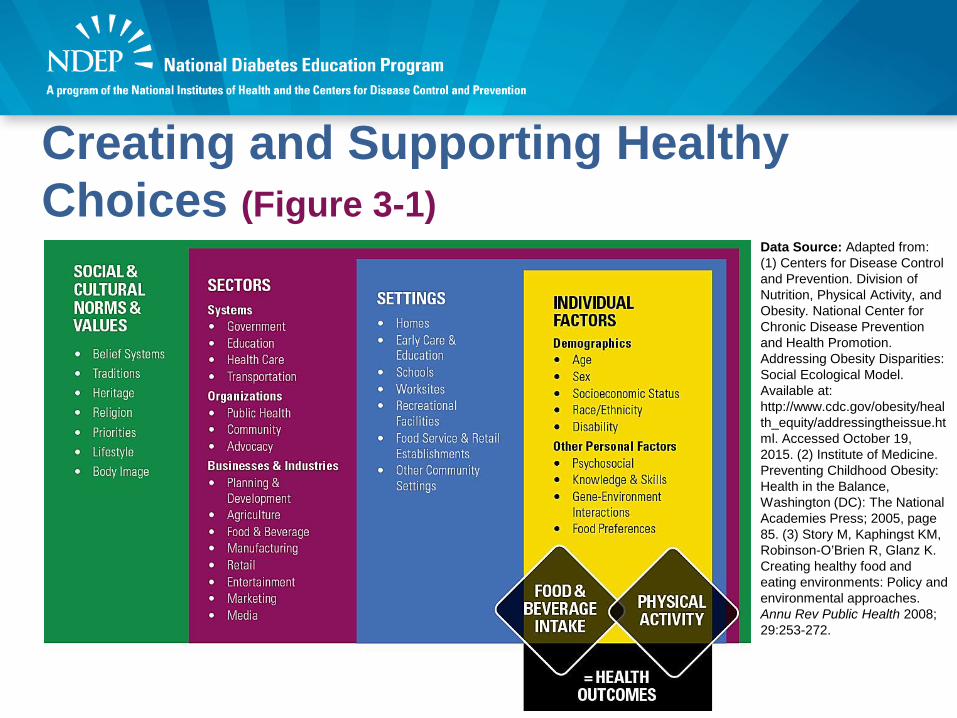
Creating and Supporting Healthy Choices (Figure 3-1)
Data Source: Adapted from: (1) Centers for Disease Control and Prevention. Division of Nutrition, Physical Activity, and Obesity. National Center for Chronic Disease Prevention and Health Promotion. Addressing Obesity Disparities: Social Ecological Model. Available at: http://www.cdc.gov/obesity/health_equity/addressingtheissue.html. Accessed October 19, 2015. (2) Institute of Medicine. Preventing Childhood Obesity: Health in the Balance, Washington (DC): The National Academies Press; 2005, page 85. (3) Story M, Kaphingst KM, Robinson-O’Brien R, Glanz K. Creating healthy food and eating environments: Policy and environmental approaches. Annu Rev Public Health 2008; 29:253-272.

Strategies To Align Settings With the Dietary Guidelines for Americans 2015-2020 (Figure 3-3)
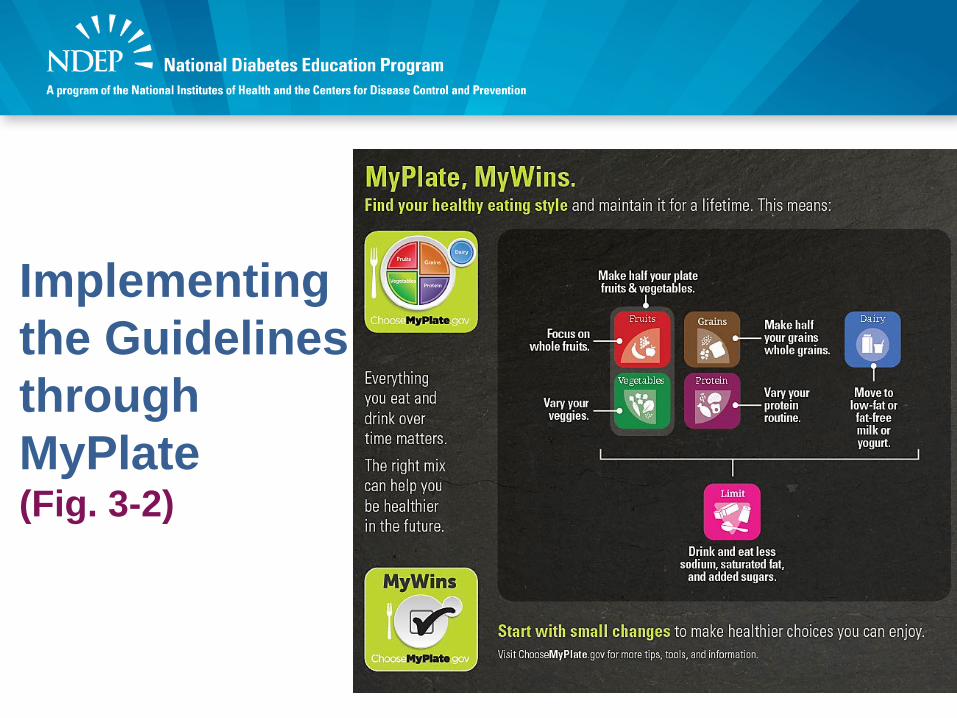
Implementing the Guidelines through MyPlate(Fig. 3-2)
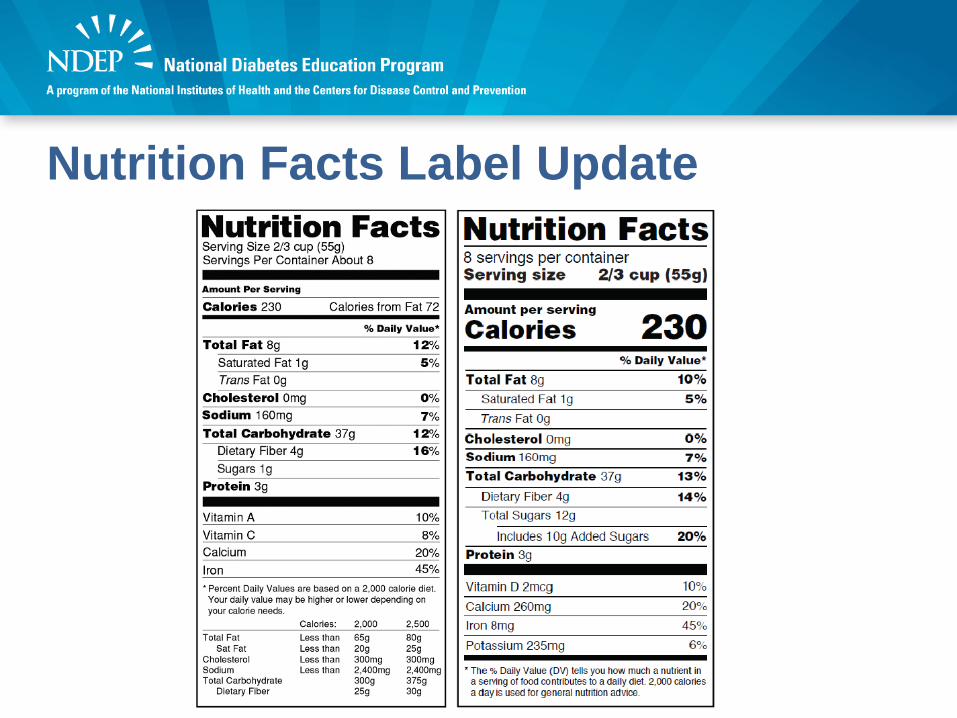
Nutrition Facts Label Update

DietaryGuidelines.gov
Additional Resources:Health.gov
ChooseMyPlate.gov

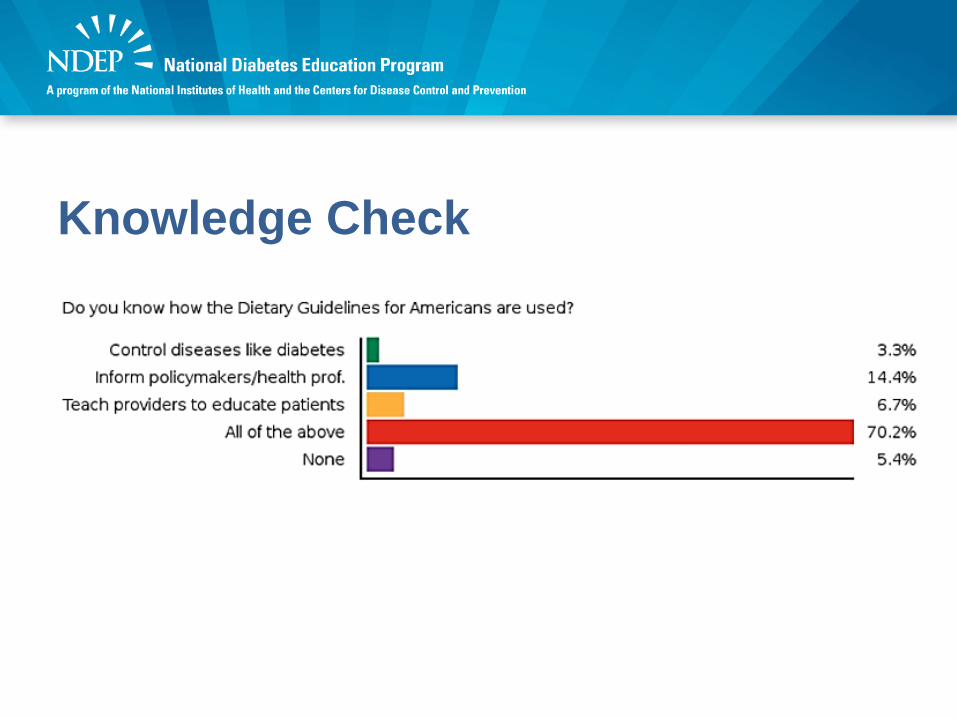
Knowledge Check• Do you know how the Dietary Guidelines for
Americans are used? A. To learn how to control diseases like diabetesB. To inform policy makers and health
professionals, not the general publicC. To teach health providers how to educate
their patientsD. All of the aboveE. None
Knowledge Check
Lorena Drago, MS, RD, CDN, CDE
ADA’S NUTRITION RECOMMENDATIONS AND PRACTICAL APPLICATIONS
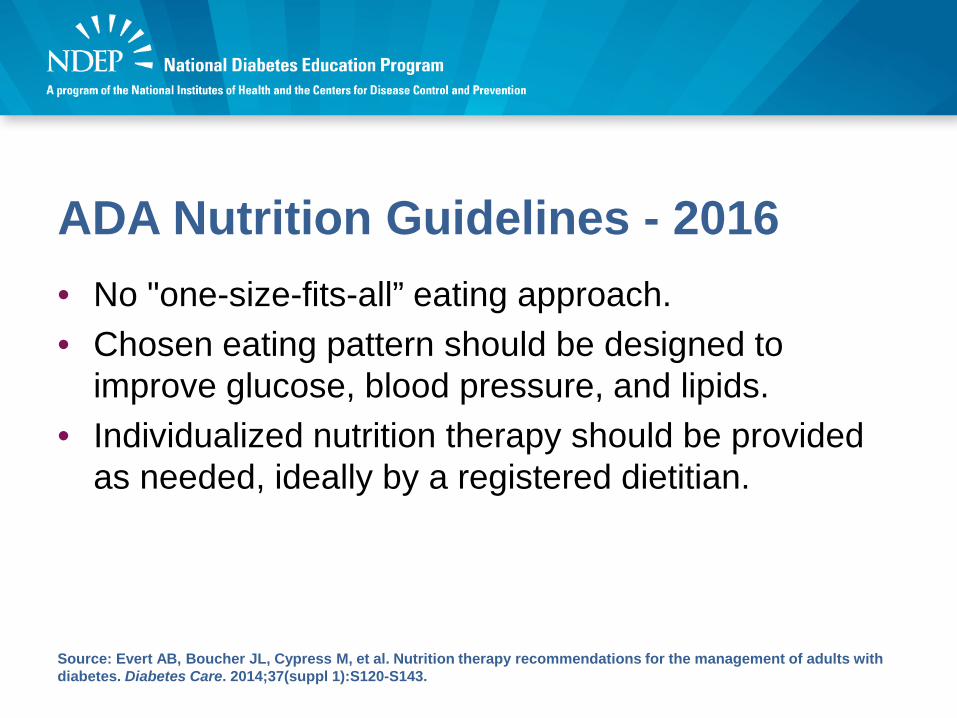
ADA Nutrition Guidelines - 2016 • No "one-size-fits-all” eating approach. • Chosen eating pattern should be designed to
improve glucose, blood pressure, and lipids.• Individualized nutrition therapy should be provided
as needed, ideally by a registered dietitian.
Source: Evert AB, Boucher JL, Cypress M, et al. Nutrition therapy recommendations for the management of adults with diabetes. Diabetes Care. 2014;37(suppl 1):S120-S143.
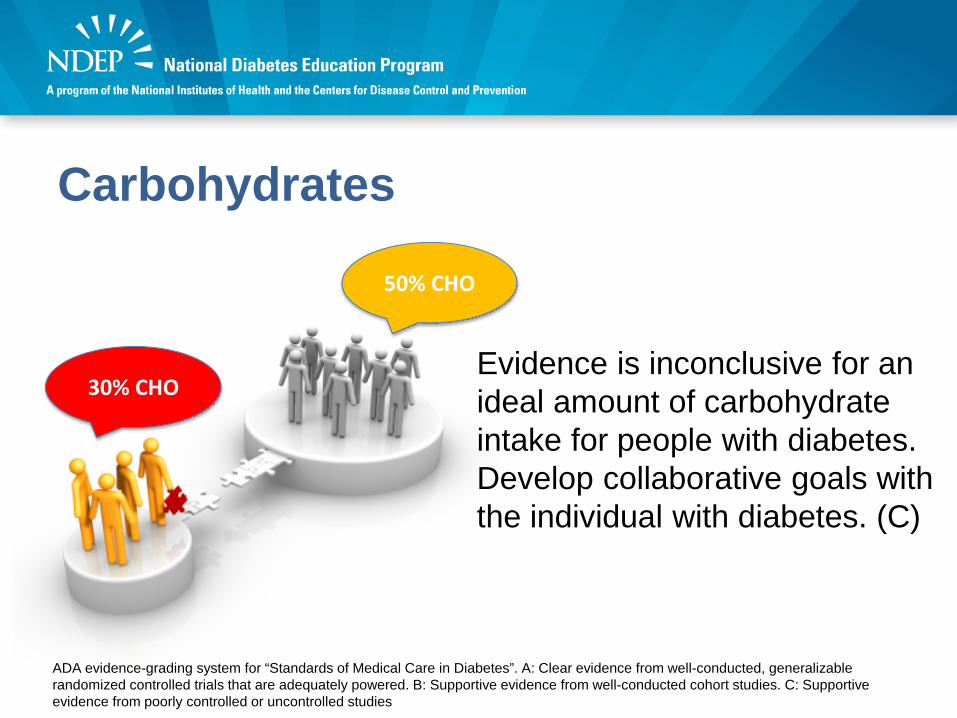
Carbohydrates
30% CHO
50% CHO
Evidence is inconclusive for an ideal amount of carbohydrate intake for people with diabetes. Develop collaborative goals with the individual with diabetes. (C)
ADA evidence-grading system for “Standards of Medical Care in Diabetes”. A: Clear evidence from well-conducted, generalizable randomized controlled trials that are adequately powered. B: Supportive evidence from well-conducted cohort studies. C: Supportive evidence from poorly controlled or uncontrolled studies
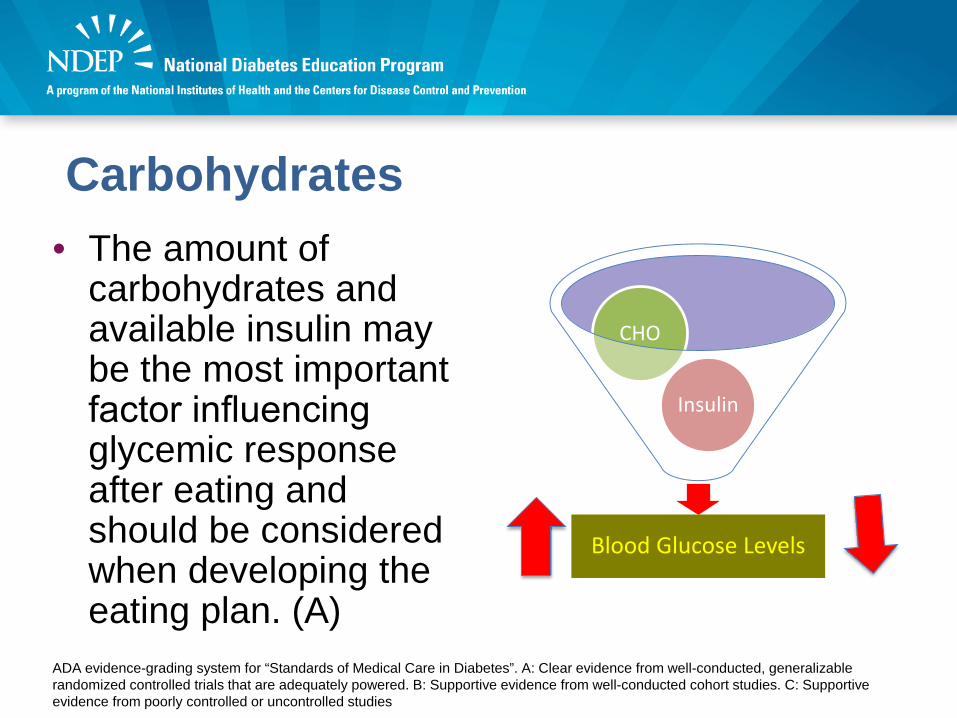
Carbohydrates• The amount of
carbohydrates and available insulin may be the most important factor influencing glycemic response after eating and should be considered when developing the eating plan. (A)
Blood Glucose Levels
Insulin
CHO
ADA evidence-grading system for “Standards of Medical Care in Diabetes”. A: Clear evidence from well-conducted, generalizable randomized controlled trials that are adequately powered. B: Supportive evidence from well-conducted cohort studies. C: Supportive evidence from poorly controlled or uncontrolled studies

Carbohydrates• Monitoring carbohydrate
intake, whether by carbohydrate counting or experience-based estimation remains a key strategy in achieving glycemic control. (B)
ADA evidence-grading system for “Standards of Medical Care in Diabetes”. A: Clear evidence from well-conducted, generalizable randomized controlled trials that are adequately powered. B: Supportive evidence from well-conducted cohort studies. C: Supportive evidence from poorly controlled or uncontrolled studies
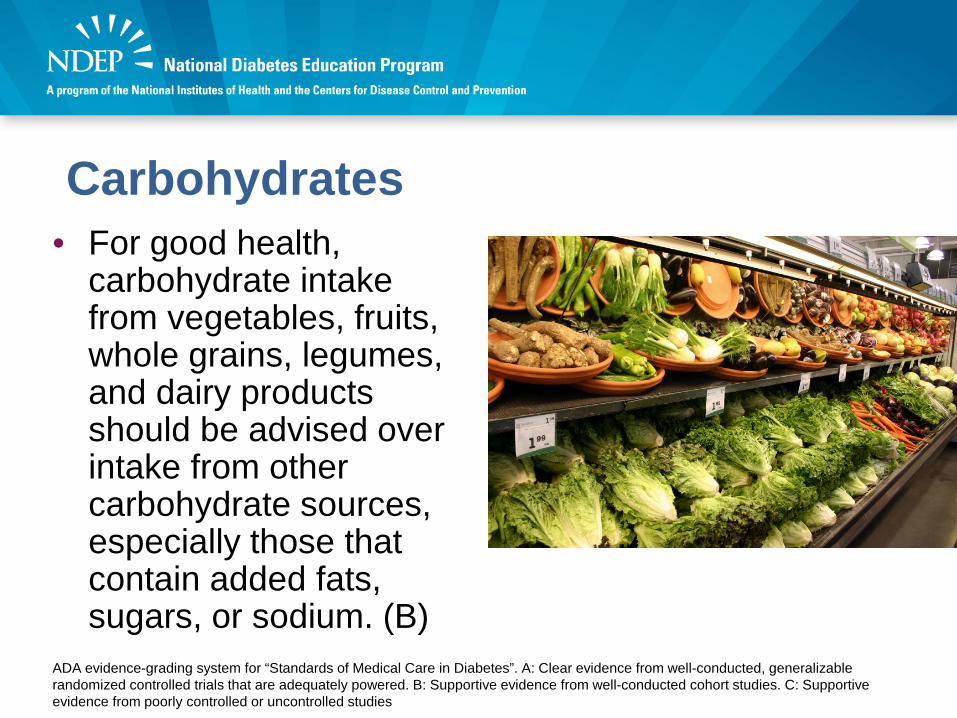
Carbohydrates• For good health,
carbohydrate intake from vegetables, fruits, whole grains, legumes, and dairy products should be advised over intake from other carbohydrate sources, especially those that contain added fats, sugars, or sodium. (B)
ADA evidence-grading system for “Standards of Medical Care in Diabetes”. A: Clear evidence from well-conducted, generalizable randomized controlled trials that are adequately powered. B: Supportive evidence from well-conducted cohort studies. C: Supportive evidence from poorly controlled or uncontrolled studies

Sucrose• While substituting
sucrose-containing foods for isocaloric amounts of other carbohydrates may have similar blood glucose effects, consumption should be minimized to avoid displacing nutrient-dense food choices. (A)
ADA evidence-grading system for “Standards of Medical Care in Diabetes”. A: Clear evidence from well-conducted, generalizable randomized controlled trials that are adequately powered. B: Supportive evidence from well-conducted cohort studies. C: Supportive evidence from poorly controlled or uncontrolled studies.
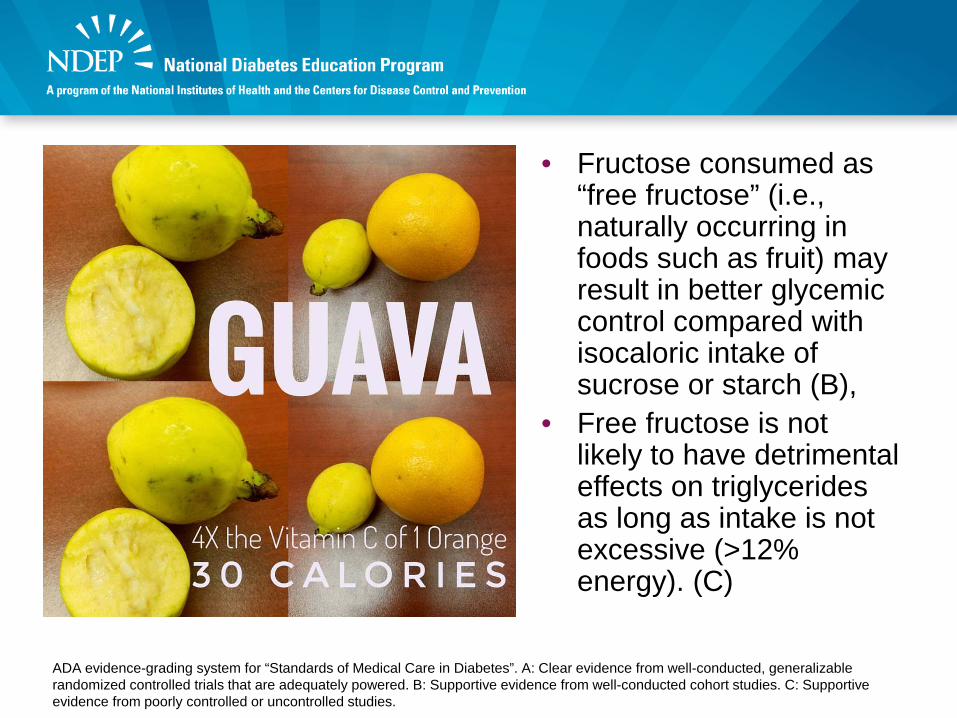
Sucrose • Fructose consumed as “free fructose” (i.e., naturally occurring in foods such as fruit) may result in better glycemic control compared with isocaloric intake of sucrose or starch (B),
• Free fructose is not likely to have detrimental effects on triglycerides as long as intake is not excessive (>12% energy). (C)
ADA evidence-grading system for “Standards of Medical Care in Diabetes”. A: Clear evidence from well-conducted, generalizable randomized controlled trials that are adequately powered. B: Supportive evidence from well-conducted cohort studies. C: Supportive evidence from poorly controlled or uncontrolled studies.
Sucrose• People with diabetes
should limit or avoid intake of sugar sweetened beverages (from any caloric sweetener including high fructose corn syrup and sucrose) to reduce risk for weight gain and worsening of cardiometabolic risk profile. (B)
ADA evidence-grading system for “Standards of Medical Care in Diabetes”. A: Clear evidence from well-conducted, generalizable randomized controlled trials that are adequately powered. B: Supportive evidence from well-conducted cohort studies. C: Supportive evidence from poorly controlled or uncontrolled studies.
Fats• Evidence is inconclusive for an
ideal amount of total fat intake for people with diabetes; therefore, goals should be individualized (C); fat quality appears to be far more important than quantity. (B)
• The amount of dietary saturated fat, cholesterol, and trans fat recommended for people with diabetes is the same as that recommended for the general population. (C)
ADA evidence-grading system for “Standards of Medical Care in Diabetes”. B: Supportive evidence from well-conducted cohort studies. C: Supportive evidence from poorly controlled or uncontrolled studies.
Sodium• The recommendation
for the general population to reduce sodium to less than 2,300 mg/day is also appropriate for people with diabetes. (B)
ADA evidence-grading system for “Standards of Medical Care in Diabetes”. B: Supportive evidence from well-conducted cohort studies.

Eating Patterns• Mediterranean Style
– Includes abundant plant food (fruits, vegetables, breads, cereals, beans, nuts and seeds); minimally processed, seasonally fresh, and locally grown foods; fresh fruits, occasional desserts, olive oil; dairy products (mainly cheese and yogurt) consumed in low to moderate amounts; fewer than 4 eggs/week; small amounts of occasional red meat; and small/moderate amount of wine generally with meals.
• Vegetarian and Vegan – Diets devoid of all flesh foods and animal-derived products and
vegetarian diets (diets devoid of all flesh foods but including egg [ovo] and/or dairy [lacto] products). High intakes of fruits, vegetables, whole grains, nuts, soy products, fiber, and phytochemicals.
• Low Fat – Emphasizes vegetables, fruits, starches (e.g. pasta, whole grains, starchy
vegetables), lean protein, and low-fat dairy products. Total fat intake 30 percent of total energy intake and saturated fat intake, 10 percent.
• Low Carbohydrate (CHO) – Focuses on eating foods higher in protein (meat, poultry, fish, shellfish,
eggs, cheese, nuts and seeds), fats (oils, butter, olives, avocado),and vegetables low in carbohydrate (salad greens, cucumbers, broccoli).
– The amount of CHO allowed varies with most plans allowing fruit (e.g., berries) and higher CHO vegetables; sugar-containing foods and grain products such as pasta, rice, and bread are generally avoided.
– No consistent definition of “low” CHO. Definitions have ranged from very low-CHO diet (21–70g/day) to moderately low-CHO diet (30 to 40% of calories from CHO).
• Dietary Approaches to Stop Hypertension (DASH)– Emphasizes fruits, vegetables, and low-fat dairy products. Includes
whole grains, poultry, fish, and nuts. Reduced in saturated fat, red meat, sweets, and sugar-containing beverages. Most effective DASH reduced in sodium.
Eating Patterns (cont.)
Using the Guidelines in PracticeTranslating Information into Practice
Use Risk CommunicationExplain what is “at risk”
How high is the risk (Compare high to normal)Show patient his/her risk factor
Provide treatment strategiesInclude testimonials (Group-specific)
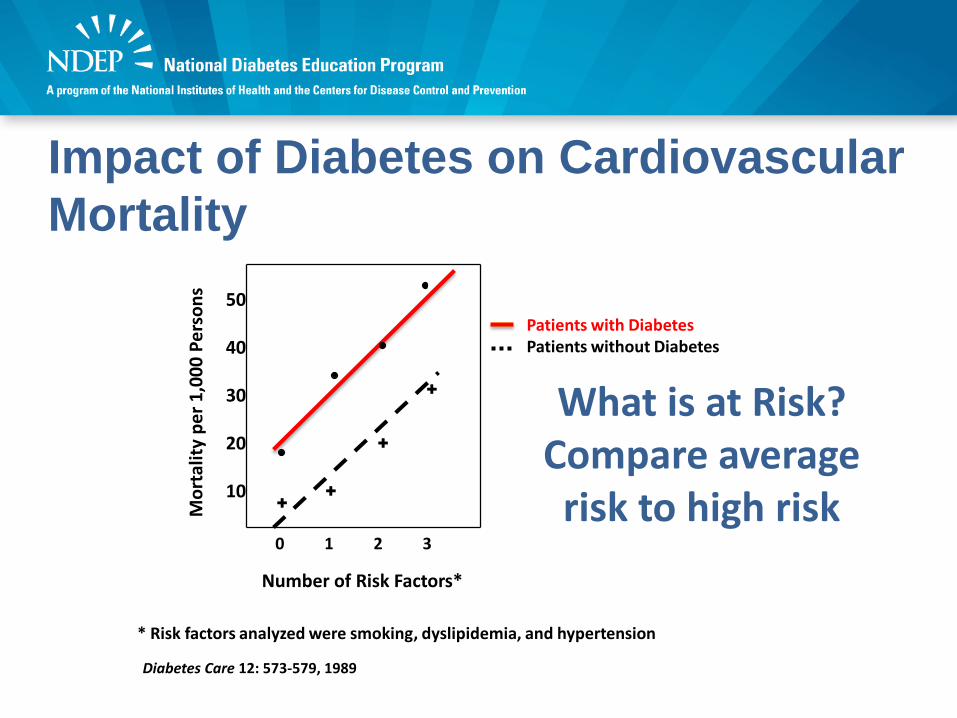
Impact of Diabetes on Cardiovascular Mortality
Number of Risk Factors*
50
40
30
20
10
0 1 2 3
Mor
talit
y pe
r 1,0
00 P
erso
ns
++
+
+
Patients with DiabetesPatients without Diabetes
What is at Risk? Compare average risk to high risk
Diabetes Care 12: 573-579, 1989
* Risk factors analyzed were smoking, dyslipidemia, and hypertension
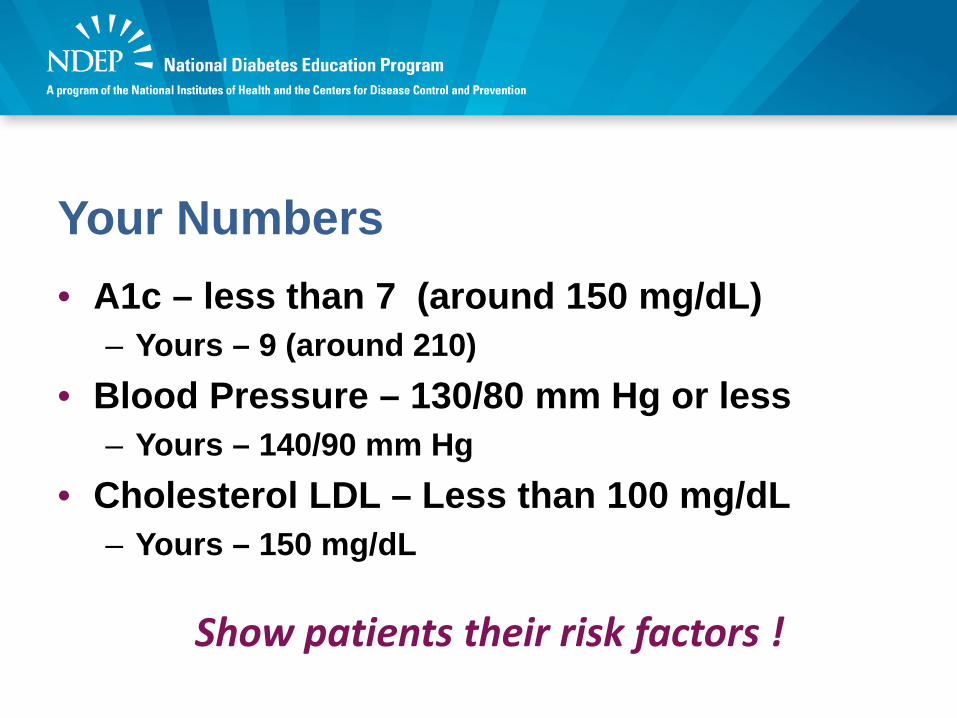
Your Numbers• A1c – less than 7 (around 150 mg/dL)
– Yours – 9 (around 210)• Blood Pressure – 130/80 mm Hg or less
– Yours – 140/90 mm Hg• Cholesterol LDL – Less than 100 mg/dL
– Yours – 150 mg/dL
Show patients their risk factors !
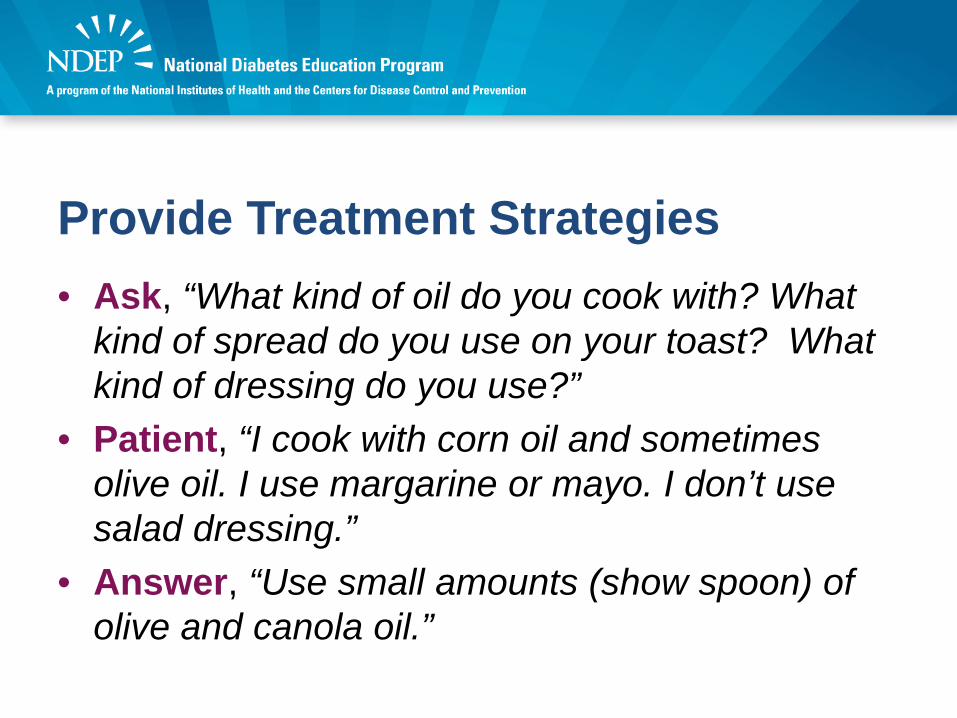
Provide Treatment Strategies• Ask, “What kind of oil do you cook with? What
kind of spread do you use on your toast? What kind of dressing do you use?”
• Patient, “I cook with corn oil and sometimes olive oil. I use margarine or mayo. I don’t use salad dressing.”
• Answer, “Use small amounts (show spoon) of olive and canola oil.”
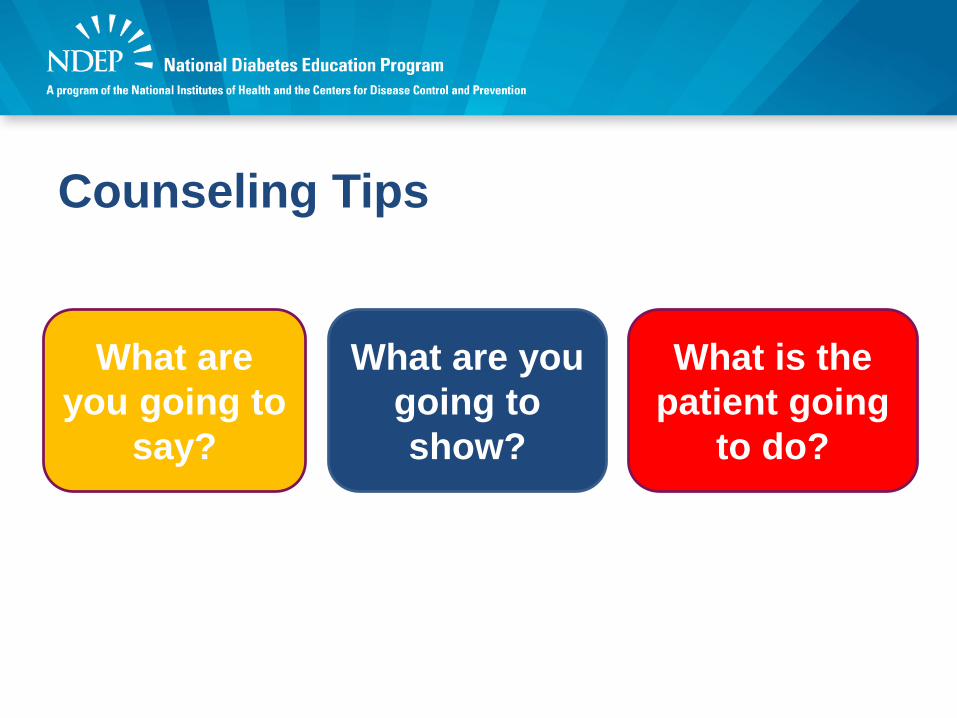
Counseling Tips
What are you going to
say?
What are you going to show?
What is the patient going
to do?
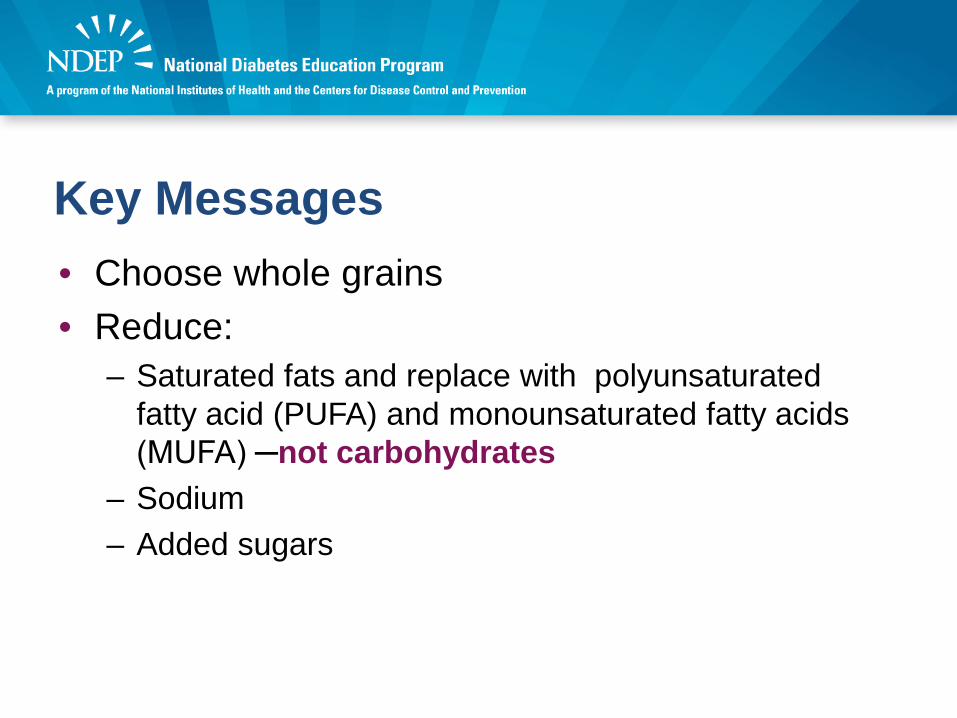
Key Messages• Choose whole grains• Reduce:
– Saturated fats and replace with polyunsaturated fatty acid (PUFA) and monounsaturated fatty acids (MUFA) ─not carbohydrates
– Sodium– Added sugars
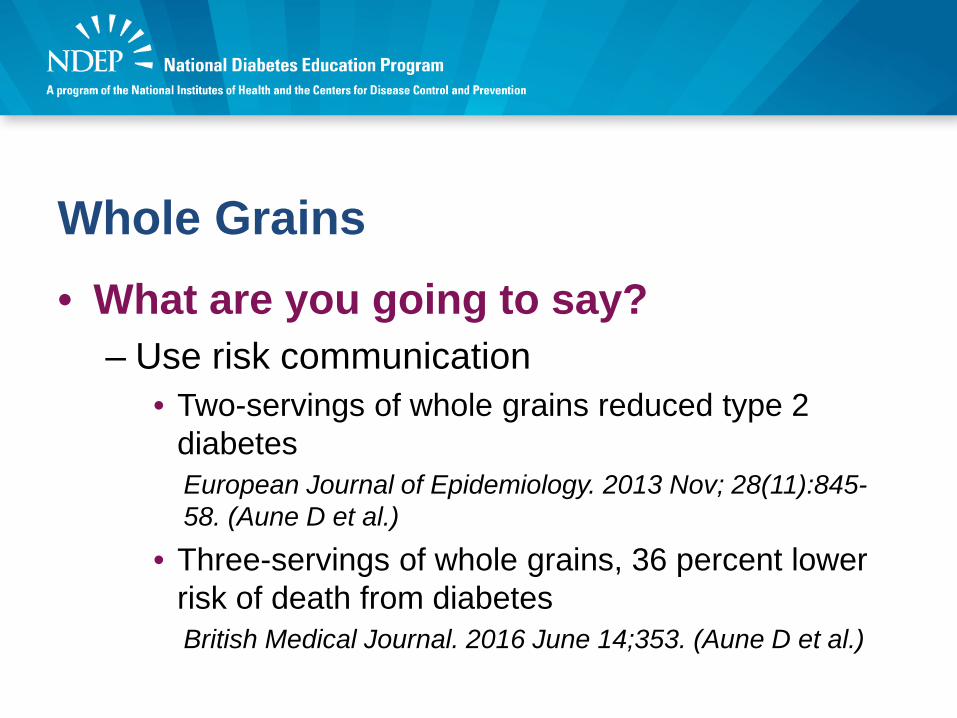
Whole Grains• What are you going to say?
– Use risk communication• Two-servings of whole grains reduced type 2
diabetesEuropean Journal of Epidemiology. 2013 Nov; 28(11):845-58. (Aune D et al.)
• Three-servings of whole grains, 36 percent lower risk of death from diabetesBritish Medical Journal. 2016 June 14;353. (Aune D et al.)
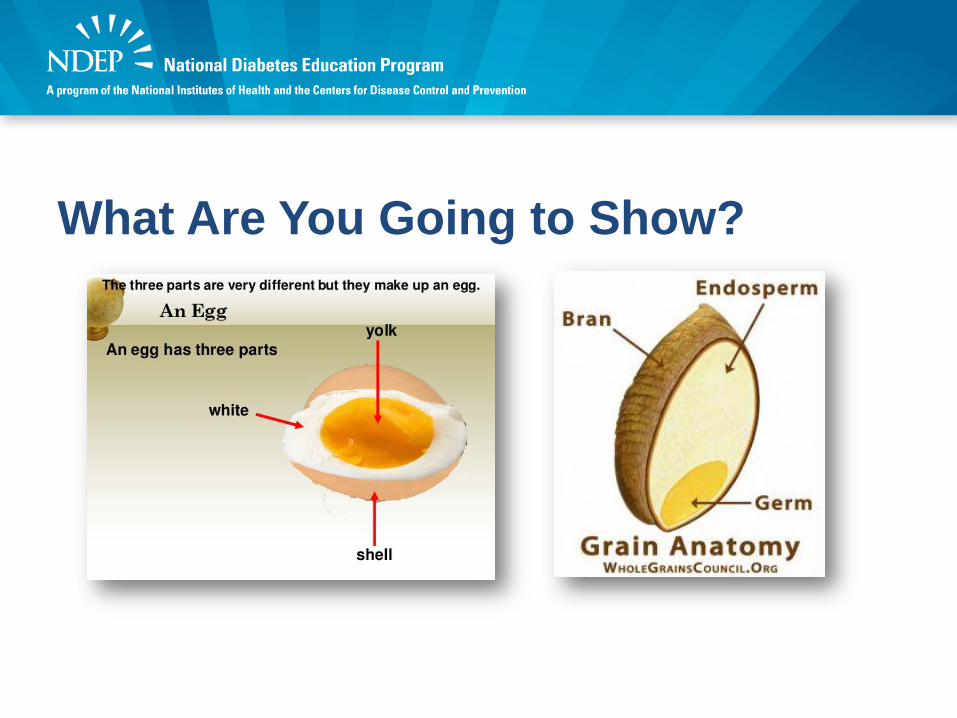
What are you going to show?What Are You Going to Show?
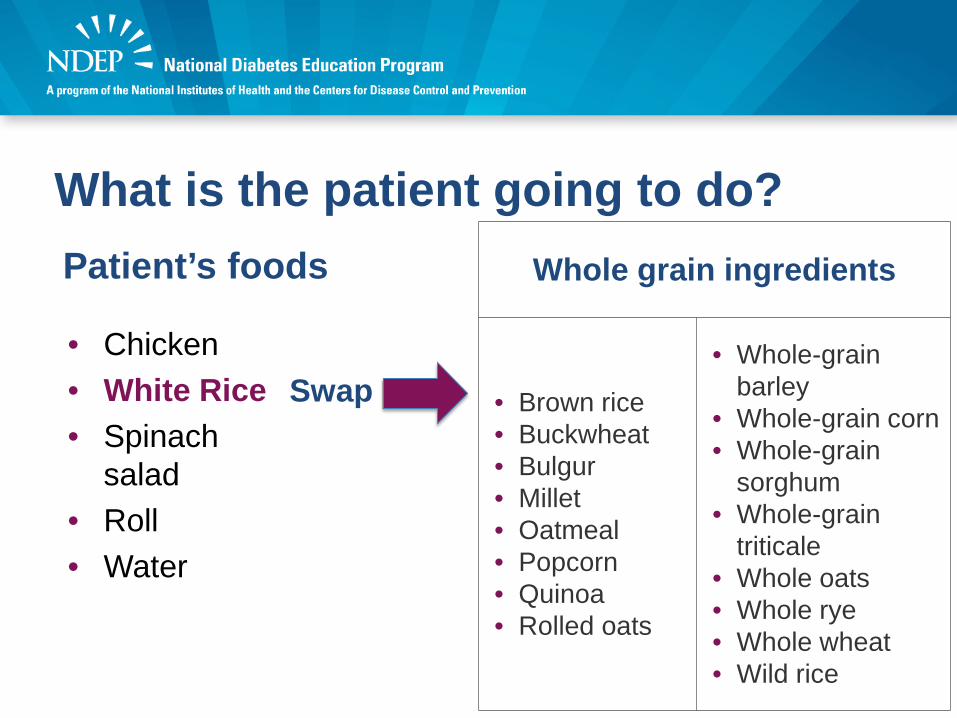
What is the patient going to do? Patient’s foods
• Chicken• White Rice• Spinach
salad• Roll• Water
Swap
Whole grain ingredients
• Brown rice• Buckwheat• Bulgur• Millet• Oatmeal• Popcorn• Quinoa• Rolled oats
• Whole-grain barley
• Whole-grain corn• Whole-grain
sorghum• Whole-grain
triticale• Whole oats• Whole rye• Whole wheat• Wild rice
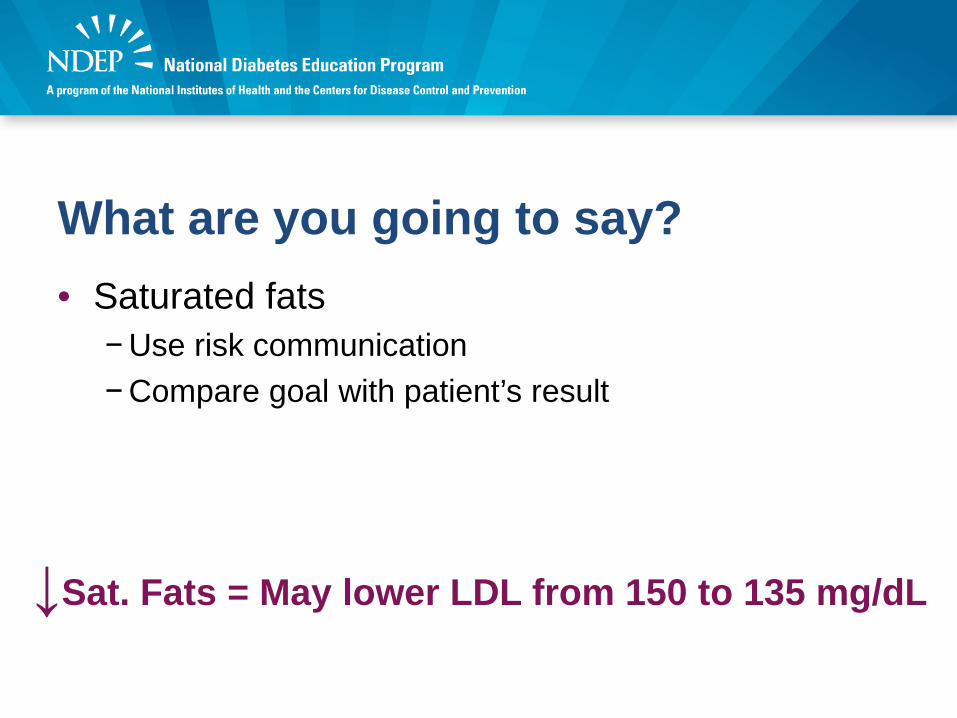
What are you going to say?• Saturated fats
− Use risk communication− Compare goal with patient’s result
↓Sat. Fats = May lower LDL from 150 to 135 mg/dL
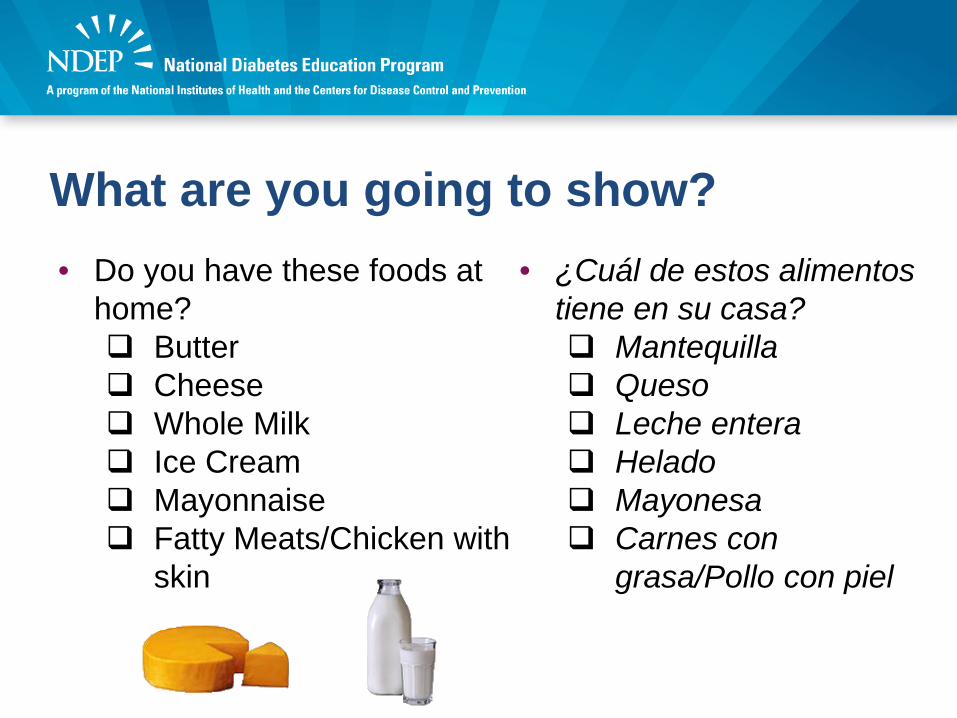
What are you going to show?• Do you have these foods at
home? Butter Cheese Whole Milk Ice Cream Mayonnaise Fatty Meats/Chicken with
skin
• ¿Cuál de estos alimentos tiene en su casa? Mantequilla Queso Leche entera Helado Mayonesa Carnes con
grasa/Pollo con piel
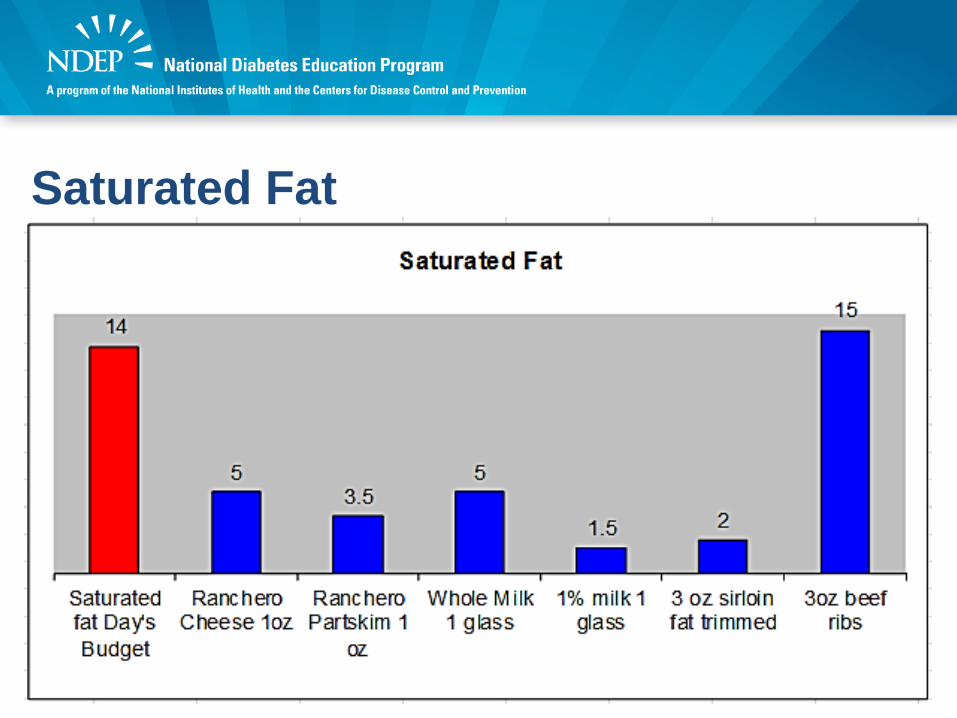
Saturated Fat
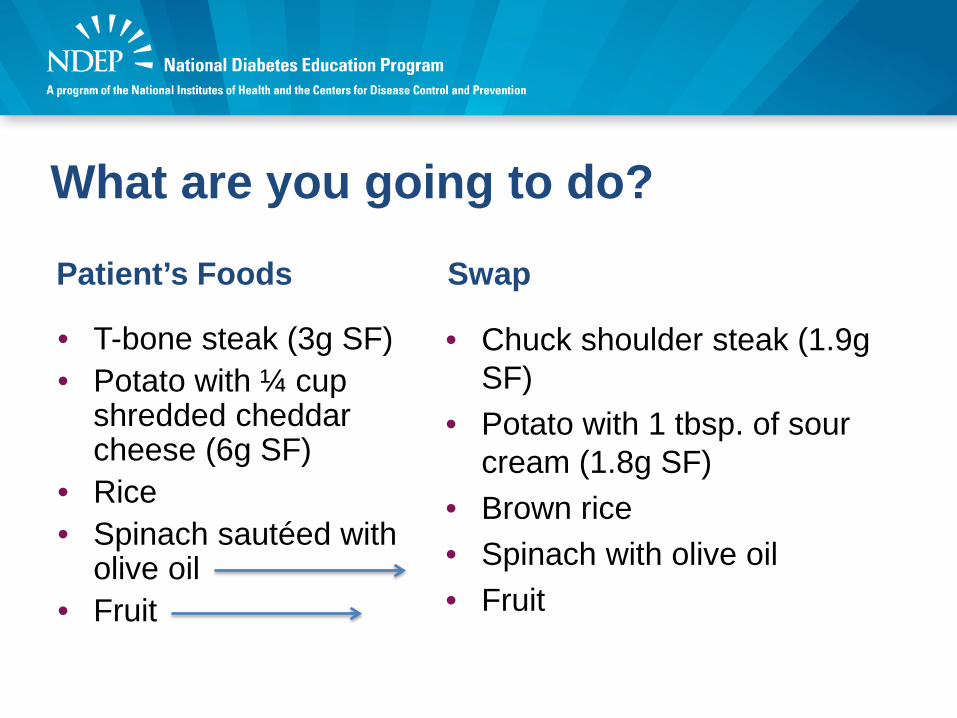
What are you going to do?
Patient’s Foods
• T-bone steak (3g SF)• Potato with ¼ cup
shredded cheddar cheese (6g SF)
• Rice• Spinach sautéed with
olive oil• Fruit
Swap
• Chuck shoulder steak (1.9g SF)
• Potato with 1 tbsp. of sour cream (1.8g SF)
• Brown rice• Spinach with olive oil• Fruit
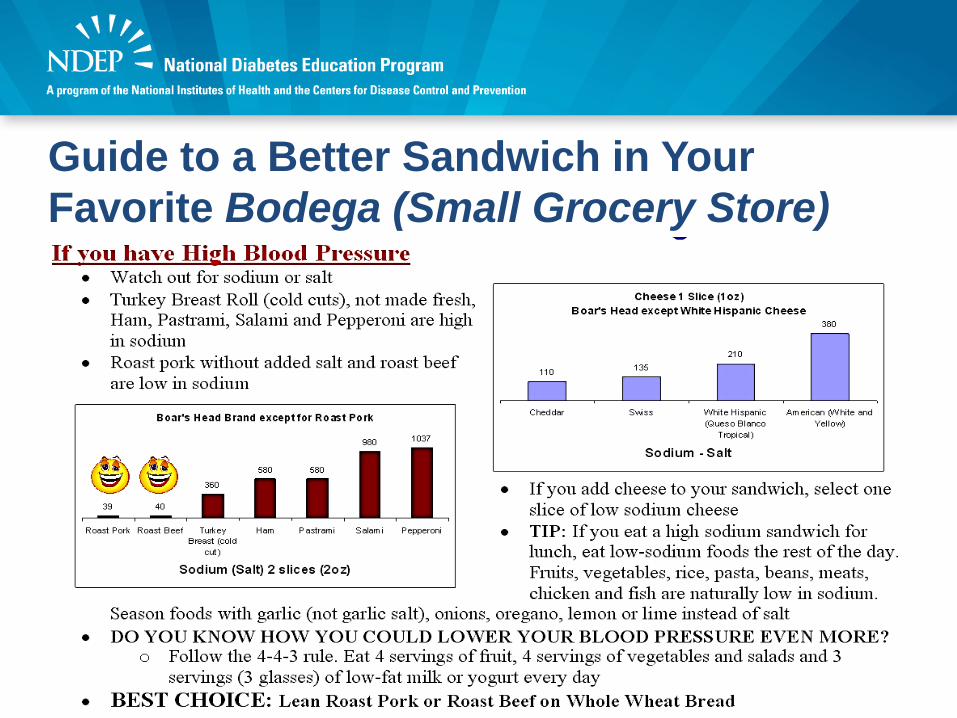
Guide to a Better Sandwich in Your Favorite Bodega (Small Grocery Store)

How Do You Know Your Patients Know? • Teach back
Methods for ensuring that patients understand what you have told them
Ask patients to explain or demonstrate
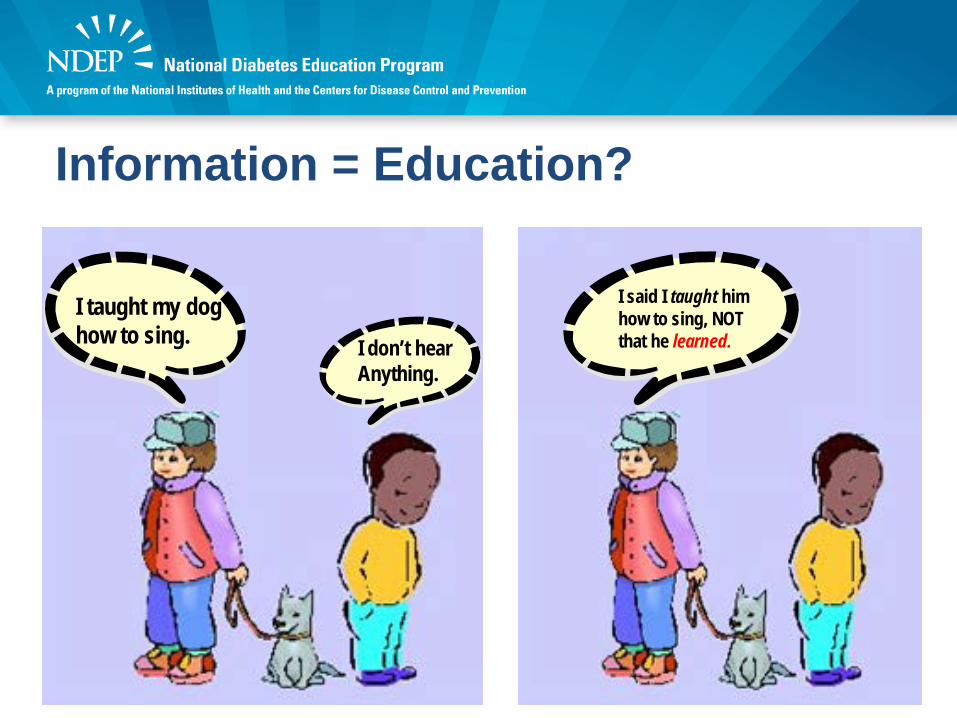
Information = Education?
I said I taught him how to sing, NOT that he learned.I don’t hear
Anything.
I taught my dog how to sing.
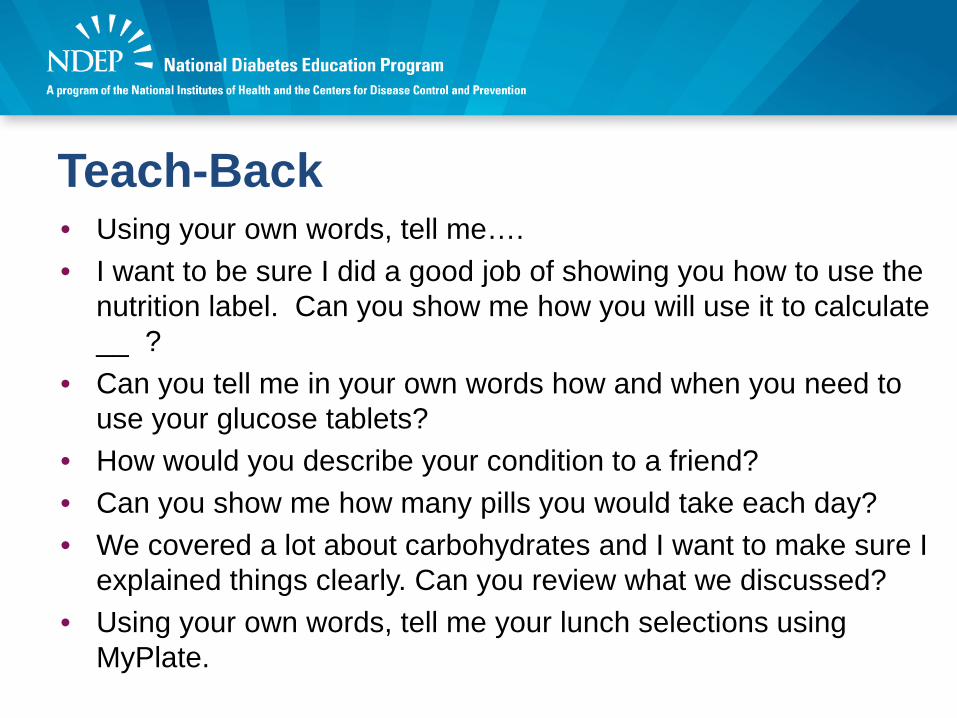
Teach-Back• Using your own words, tell me….• I want to be sure I did a good job of showing you how to use the
nutrition label. Can you show me how you will use it to calculate __ ?
• Can you tell me in your own words how and when you need to use your glucose tablets?
• How would you describe your condition to a friend? • Can you show me how many pills you would take each day? • We covered a lot about carbohydrates and I want to make sure I
explained things clearly. Can you review what we discussed?• Using your own words, tell me your lunch selections using
MyPlate.
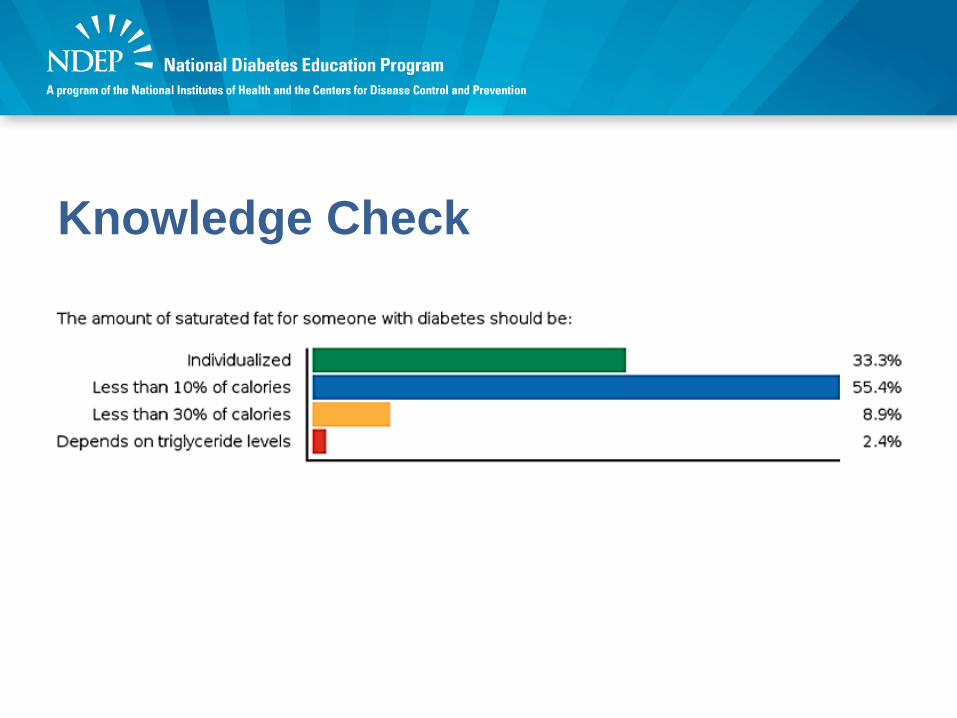
Knowledge Check• The amount of saturated fat for someone
with diabetes should be: Individualized Less than 10% of calories Less than 30% of calories Depends on triglyceride levels
Knowledge Check
Summary and ApplicationPotential for the guidelines to inform policy and practice is critical.• Less than optimal dietary patterns contributing
directly to poor health and high chronic disease risk: − Low in vegetables, fruit, whole grains, and low-fat dairy− High in refined grains, saturated fat, added sugars, and
sodium• Critical health disparities• Food insecurity• Important role for people with diabetes: Access and
education to improve control of diabetes and to contribute to the delay and prevention of type 2 diabetes

Q&A
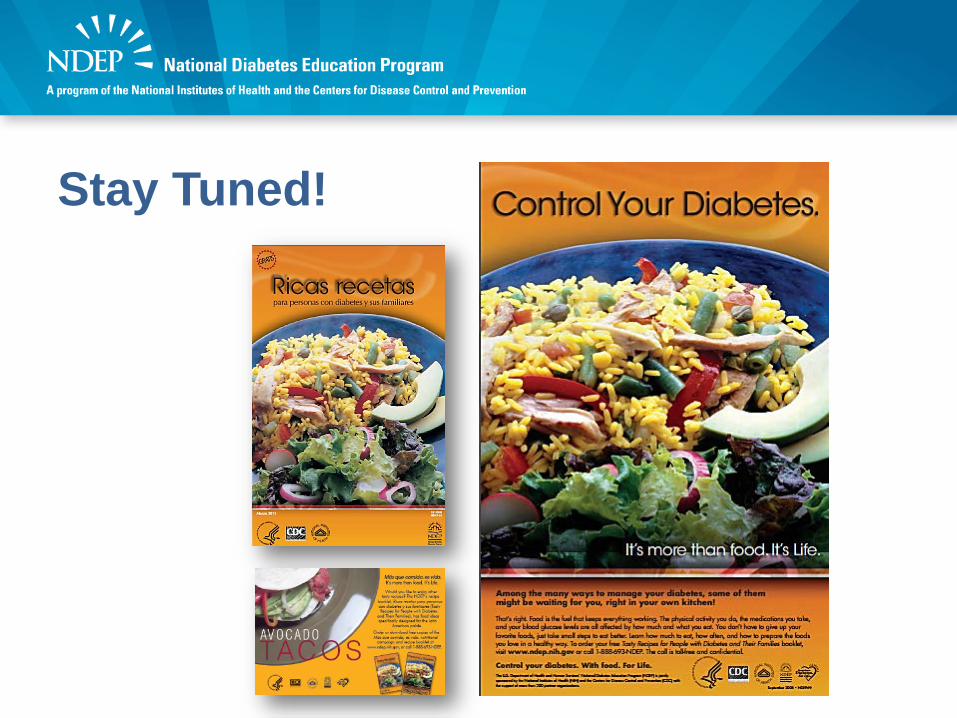
Stay Tuned!


Thank you!
Continuing Education• This program has been approved for CNE,
CEU, CECH and CPH credit.• To receive credit:
– Complete the activity– Complete the Evaluation at www.cdc.gov/TCEOnline– Pass the posttest with 60% at www.cdc.gov/TCEOnline
• No fees are charged for CDC’s CE activities.• For more information, please see the TCEO
instructions handout.
Disclosure Statement• In compliance with continuing education requirements, all presenters
must disclose any financial or other associations with the manufacturers of commercial products, suppliers of commercial services, or commercial supporters as well as any use of unlabeled product(s) or product(s) under investigational use.
• CDC, our planners, content experts, and their spouses/partners wish to disclose they have no financial interests or other relationships with the manufacturers of commercial products, suppliers of commercial services, or commercial supporters. Planners have reviewed content to ensure there is no bias.
• Content will not include any discussion of the unlabeled use of a product or a product under investigational use.
• CDC did not accept commercial support for this continuing education activity.
• No fees are charged for CDC’s CE activities.
The information, views, and opinions contained on this presentation do not necessarily reflect the views and opinions of the Centers for Disease Control and Prevention, the National Diabetes Education Program or its
partners.