the determinant factors of profitability on sharia …
TRANSCRIPT
THE DETERMINANT FACTORS OF
PROFITABILITY ON SHARIA RURAL
BANKS IN INDONESIA
By
Devita Rahma Aryati
014201500150
A Skripsi presented to the
Faculty of Business President University
in partial fulfillment of the requirements for
Bachelor Degree in Management
January 2019

i

ii

iii

iv
PLAGIARISM DOCUMENT

v

vi
ACKNOWLEDGMENT
First of all, the researcher would like to deliver the highest gratitude to God
for His guidance and blessings so that this study can be done. Researcher also
would like to give the best appreciation and is thankful towards everyone who
always supports and helped me during the completion of this research.
1. Researcher’s adviser, Mr. Purwanto, ST., M.M. for his continuous
support, constructive feedbacks, and thorough guidance during the
research process.
2. Researcher’s beloved family: Mama (Supriyati), Ayah (Ajo Rianto),
brother (Hilmy Imtiyaz) and little sister (Rana Arista Mahardika) for their
caring, prays, and encouragement in every single step that researcher
takes.
3. Researcher’s dearest friends: Deviani Halim, Regina Angeline,
Maylananda and Raisa for the warm embrace and irreplaceable support
from classes’ era until we, together reach skirpsi moment.
4. Researcher’s beloved classmates and PUSU family, for the moral support
and togetherness along the college journey.
5. Researcher’s respectable lecturers and teachers, for their guidance,
knowledge shared, and continuous support and feedback.
To those who I cannot mention one by one, and who indirectly contribute in
this research, your help and kindness do matter for the researcher. Thank you
very much.
Cikarang, January 8, 2018
Devita Rahma Aryati

vii
CONSENT FOR
INTELLECTUAL PROPERTY RIGHT
Title of Skripsi: The Determinants Factors of Profitability on Sharia Rural Banks
in Indonesia
1. The Author hereby assigns to President University the copyright to the
Contribution named above whereby the President University shall have the
exclusive right to publish the Contribution and translations of it wholly or in
part throughout the world during the full term of copyright including
renewals and extensions and all subsidiary rights
2. The Author retains the right to re-publish the preprint version of the
Contribution without charge and subject only to notifying the University of
the intent to do so and to ensuring that the publication by the University is
properly credited and that the relevant copyright notice is repeated verbatim.
3. The Author retains moral and all proprietary rights other than copyright,
such as patent and trademark rights to any process or procedure described in
the Contribution.
4. The Author guarantees that the Contribution is original, has not been
published previously, is not under consideration for publication elsewhere
and that any necessary permission to quote or reproduce illustrations from
another source has been obtained (a copy of any such permission should be
sent with this form).
5. The Author guarantees that the Contribution contains no violation of any
existing copyright or other third-party right or material of an obscene,
indecent, libelous or otherwise unlawful nature and will indemnify the
University against all claims arising from any breach of this warranty.
6. The Author declares that any named person as co-author of the Contribution
is aware of this agreement and has also agreed to the above warranties.

viii

ix
TABLE OF CONTENTS
PANEL OF EXAMINERS .............................................................................. i
DECLARATION OF ORIGINALITY ......................................................... ii
PLAGIARISM DOCUMENT ....................................................................... iv
ACKNOWLEDGMENT ............................................................................... vi
CONSENT FOR INTELLECTUAL PROPERTY RIGHT ...................... vii
TABLE OF CONTENTS .............................................................................. ixi
LIST OF TABLES ....................................................................................... xiii
LIST OF FIGURES ..................................................................................... xiii
LIST OF ACRONYMS .............................................................................. xivi
ABSTRACT .................................................................................................. xiv
CHAPTER I INTRODUCTION .................................................................. xv
1.1 Background of the Study ............................................................................. 1
1.2 Problem Identification ................................................................................. 5
1.3 Statement of Problems ................................................................................ 6
1.4 Research Objectives .................................................................................... 6
1.5 Significance of the Study ............................................................................ 7
1.6 Scope and Limitations of the Study ............................................................ 8
1.7 Thesis Organization .................................................................................... 8
CHAPTER II LITERATURE REVIEW .................................................... 10
2.1 Sharia Bank ............................................................................................... 10
2.1.1 Sharia Rural Bank ......................................................................... 11
2.2 Macroeconomics ....................................................................................... 11
2.2.1 Gross Domestic Product ................................................................ 12
2.2.2 Inflation ......................................................................................... 13
2.3 Financial Performance .............................................................................. 14
2.3.1 Capital Adequacy Ratio ................................................................ 14
2.3.2 Financing to Deposit Ratio............................................................ 16
2.3.3 Non Performing Financing ............................................................ 17

x
2.3.4 Operational Efficiency Ratio......................................................... 17
2.4 Profitability ............................................................................................... 18
2.5 Previous Research ..................................................................................... 20
2.6 Research Gap ............................................................................................ 26
2.7 Theoretical Framework ............................................................................. 27
2.8 Hypothesis ................................................................................................. 28
CHAPTER III METHODOLOGY ............................................................. 29
3.1 Research Method ....................................................................................... 29
3.2 Research Framework ................................................................................. 29
3.3 Sampling Design ....................................................................................... 30
3.3.1 Size of Population ......................................................................... 30
3.3.2 Size of Sample............................................................................... 30
3.4 Research Instrument .................................................................................. 31
3.5 Data Collection Method ............................................................................ 32
3.6 Operational Definitions ............................................................................. 33
3.7 Data Analysis Method ............................................................................... 35
3.7.1 Descriptive Statistics Analysis ...................................................... 35
3.7.2 Classical Assumption Test ............................................................ 36
3.8 Multiple Regression Analysis ................................................................... 38
3.9 Hypothesis Testing .................................................................................... 39
3.9.1 Partial Test (t-Test) ....................................................................... 40
3.9.2 Simultaneously Test (f-Test) ......................................................... 42
3.9.3 Coefficient Determination (Adjusted R2) ..................................... 43
CHAPTER IV ................................................................................................ 45
ANALYSIS OF DATA AND INTERPRETATION OF RESULTS ......... 45
4.1 Company Profile ....................................................................................... 45
4.2 Descriptive Statistics Analysis .................................................................. 46
4.3 Data Analysis ............................................................................................ 48
4.3.1 Classical Assumption Test ............................................................ 48
4.3.2 Multiple Regression Analysis ....................................................... 53
4.4 Hypothesis Testing .................................................................................... 55
xi
4.4.1 Partial Test (t-Test) ....................................................................... 55
4.4.2 Simultaneously Test (f-Test) ......................................................... 57
4.4.3 Coefficient of Determination ........................................................ 58
4.5 Interpretation of Results ............................................................................ 58
CHAPTER V CONCLUSIONS AND RECOMMENDATIONS ............. 64
5.1 Conclusions ............................................................................................... 64
5.2 Recommendations ..................................................................................... 66
REFERENCES .............................................................................................. 67
APPENDICES ............................................................................................... 74
Appendix 1. Raw Data for Sharia Rural Banks Performance Determinants .. 74

xii
LIST OF TABLES
Table 1.1 Financial Ratios of Sharia Rural Bank .............................................. 4
Table 2.1 Previous Researches ........................................................................ 20
Table 3.1 Sample Proportion .......................................................................... 31
Table 3.2 Operational Definitions ................................................................... 33
Table 4.1 Descriptive Statistics Result............................................................ 47
Table 4.2 Durbin-Watson Test Result ............................................................. 52
Table 4.3 Multicollinearity Test Result .......................................................... 52
Table 4.4 Multiple Regression Analysis Result .............................................. 53
Table 4.5 F-Test Result ................................................................................... 57
Table 4.6 Coefficient Determination of Result ............................................... 58

xiii
LIST OF FIGURES
Figure 1.1 Market Shares of Islamic Banks in Indonesia ................................. 2
Figure 1.2 Top 10 Countries in Islamic Banking Assets .................................. 3
Figure 2.1 Theoretical Framework .................................................................. 27
Figure 3.1 Research Framework ..................................................................... 29
Figure 4.1 Histogram ...................................................................................... 49
Figure 4.2 Normal P-P Plot ............................................................................. 50
Figure 4.3 Scatterplot ...................................................................................... 51

xiv
LIST OF ACRONYMS
BPRS : Bank Perkreditan Rakyat Syariah (Sharia rural bank)
BUS : Bank Umum Syariah (Sharia commercial bank)
UUS : Unit Usaha Syariah (Sharia business unit)
IFSB : Islamic Financial Service Board
GDP : Gross Domestic Product
INF : Inflation
CAR : Capital Adequacy Ratio
FDR : Financing to Deposit Ratio
NPF : Non-Performance Financing
CAR : Capital Adequacy Ratio
OER : Operational Efficiency Ratio
BPS : Badan Pusat Statistik (Central Statistics Agency)
OJK : Otoritas Jasa Keuangan (Financial Service Authority)
CPI : Consumer Price Index
PBI : Peraturan Bank Indonesia (Bank Indonesia Regulation)
DPK : Dana Pihak Ketiga (Third Party Fund)
PPAP : Penyisihan Penghapusan Aktiva Produktif (Provision for Loan
Losses)

xv
ABSTRACT
This research aimed to empirically examine the determinants of profitability
of Sharia rural banks in Indonesia with quarterly period of time from 2014Q1
to 2018Q3. This research uses cross-sectional data of quarterly financial report
and macroeconomic variables in Indonesia. The study is processed and
analyzed quantitatively by using multiple regression. This research is using 8
Sharia rural banks in Indonesia with the total of 152 data used. The research
reveals that inflation and NPF have no significant influence towards
profitability of Sharia rural banks in Indonesia. While, the other four variables,
GDP, CAR, FDR and OER are significantly influence the profitability of
Sharia rural banks in Indonesia as much as 31.6%. In terms of variables, GDP,
CAR and FDR are positively significant influence the profitability, while OER
has negatively significant influence the profitability of Sharia rural banks in
Indonesia.
Keywords: GDP, Inflation, CAR, FDR, NPF, OER, Profitability, Sharia Rural
Bank

1
CHAPTER I
INTRODUCTION
1.1 Background of the Study
Banking is considered as the important and influential sectors for the economy
of the country. In Indonesia, it started in 1983 when Bank Indonesia gave
freedom to banks by set up interest rates. Indonesian banks in carrying out
their functions are based on economic democracy and use the precautionary
principle. Bank is determined as the business entity which collecting funds in
the form of deposits and channel them in the form of credit and / or other
forms with the aim to develop the living standard of the community (Otoritas
Jasa Keuangan, 2018).
In the year of 1990s, The Indonesian Ulema Council (MUI) established a
working team with aim to form Islamic Banks in Indonesia. As the result of it,
PT. Bank Muamalat Indonesia was established as the first Islamic bank in
Indonesia on November 1, 1991 accordance to its establishment certificate and
officially operated with an initial capital IDR 106,126,382,000 on May 1,
1992 (Laucereno, 2018). When the economic and monetary crisis occurred in
1997-1998, financial institutions such as banks experienced a difficult period
due to high interest rates due to high inflation. During the economic crisis
Islamic banks were not affected and still showed relatively better performance
because Islamic banks did not refer to interest rates but profit sharing.
Accordance to Bambang Brodjonegoro, former of Finance Minister of
Indonesia, there are several studies that say that Islamic banks have a stronger
resistance to dealing with crises than conventional banks because Islamic
banks tend to play “safe”. In every transaction in Islamic finance must be
based on underlying assets, unlike the conventional banks that tend to be
speculative (detikfinance, 2015).

2
Islamic finance in Indonesia has developed more than two decades since the
operation of Bank Muamalat Indonesia, as the first Islamic bank in Indonesia.
Even in global markets, Indonesia is among the top ten countries that have the
largest Islamic financial index in the world. Accordance to the study by
Rahman (2015) which The Test of Crisis Resilience to Islamic Banking in
Indonesia with the Index Banking Crisis (IBC) for the period of 2006 to 2012
shows that Islamic finance system could give contributions toward the
monetary condition of the country, which Islamic banks in Indonesia does not
significantly influenced by the global crisis happened in 2006 to 2012.
Figure 1.1 Market Shares of Islamic Banks in Indonesia Source: Snapshot Perbankan Syariah Indonesia per June 2018
However, the growth of Islamic finance has not been able to keep up with
conventional financial growth. This can be seen from the Islamic financial
market share which is still 5.70% per June 2018 with 0.14% is from Sharia
rural bank which is the lowest compared to Sharia commercial banks and
Sharia business unit (Otoritas Jasa Keuangan, 2018).
Sharia Rural Bank; 0,14% Sharia
Business Unit;
1,78% Sharia
Commercial Bank,
3.77%

3
Figure 1.2 Top 10 Countries in Islamic Banking Assets Source: Thomson Reuters Islamic Finance Development Report, 2017
Moreover, by looking at the assets, Indonesia has the lowest Islamic banking
assets compared to the top 10 countries in Islamic banking asset with only
USD 26,220 Million. It is quite contrast to the fact that Indonesia has the most
Muslim population in the world, which has more than 87% of the population
or 222 million are Muslim (Muslim Pro, 2018).
Islamic bank is carrying out its business activities which align with Sharia
principles. According with its type, it divided into three types of bank which
are Sharia commercial bank, Sharia business unit and Sharia rural banks. In
Indonesia as per July 2018, there are 13 Sharia commercial banks, 21 Sharia
business units and 168 Sharia rural banks are operating. Meanwhile, Sharia
rural banks have always decreases ROA in almost every year yet increasing its
NPF at in almost every year (Otoritas Jasa Keuangan, 2017).
4
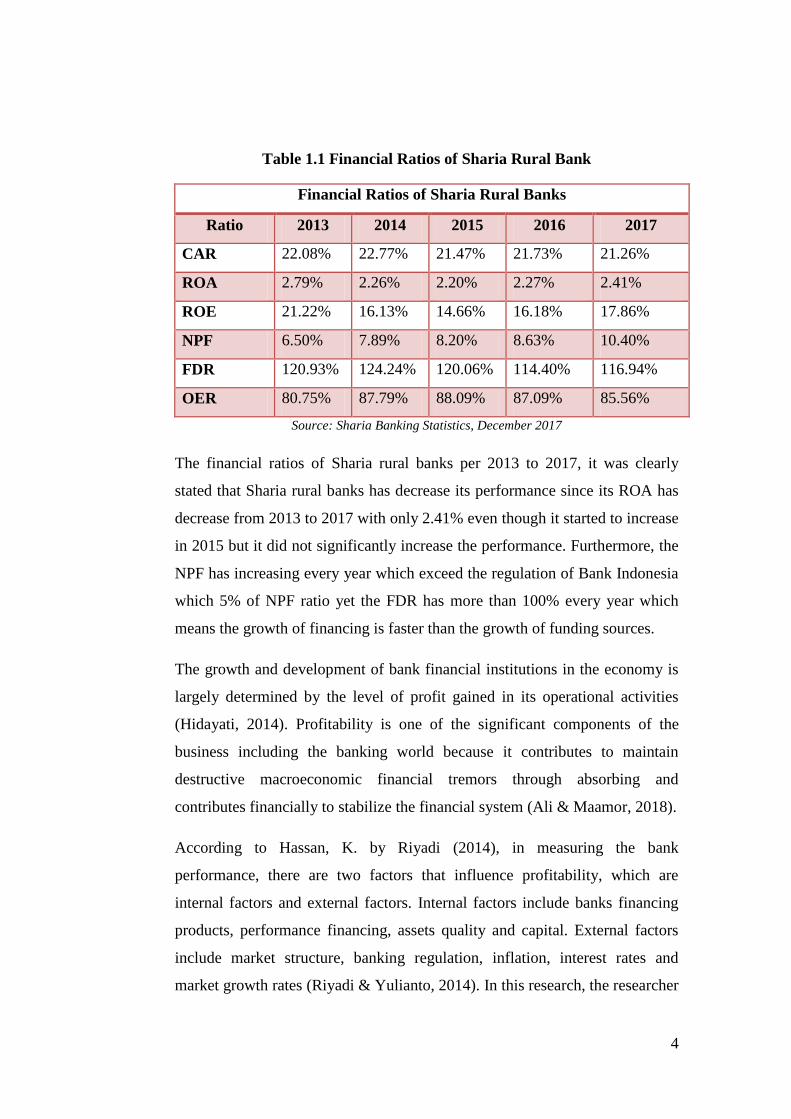
Table 1.1 Financial Ratios of Sharia Rural Bank
Financial Ratios of Sharia Rural Banks
Ratio 2013 2014 2015 2016 2017
CAR 22.08% 22.77% 21.47% 21.73% 21.26%
ROA 2.79% 2.26% 2.20% 2.27% 2.41%
ROE 21.22% 16.13% 14.66% 16.18% 17.86%
NPF 6.50% 7.89% 8.20% 8.63% 10.40%
FDR 120.93% 124.24% 120.06% 114.40% 116.94%
OER 80.75% 87.79% 88.09% 87.09% 85.56%
Source: Sharia Banking Statistics, December 2017
The financial ratios of Sharia rural banks per 2013 to 2017, it was clearly
stated that Sharia rural banks has decrease its performance since its ROA has
decrease from 2013 to 2017 with only 2.41% even though it started to increase
in 2015 but it did not significantly increase the performance. Furthermore, the
NPF has increasing every year which exceed the regulation of Bank Indonesia
which 5% of NPF ratio yet the FDR has more than 100% every year which
means the growth of financing is faster than the growth of funding sources.
The growth and development of bank financial institutions in the economy is
largely determined by the level of profit gained in its operational activities
(Hidayati, 2014). Profitability is one of the significant components of the
business including the banking world because it contributes to maintain
destructive macroeconomic financial tremors through absorbing and
contributes financially to stabilize the financial system (Ali & Maamor, 2018).
According to Hassan, K. by Riyadi (2014), in measuring the bank
performance, there are two factors that influence profitability, which are
internal factors and external factors. Internal factors include banks financing
products, performance financing, assets quality and capital. External factors
include market structure, banking regulation, inflation, interest rates and
market growth rates (Riyadi & Yulianto, 2014). In this research, the researcher

5
use both external factors and internal factors to analyze its influence toward
the profitability of Sharia rural bank in Indonesia.
The researcher uses 2 (two) external factors which are Gross Domestic
Product and inflation. While for internal factors, the researcher uses CAR,
FDR, NPF and OER. Those factors are the measures that are used to analyze
whether these external factors and internal factors have any impact over the
profitability which will be examined by ROA of Sharia rural banks in
Indonesia.
1.2 Problem Identification
The Islamic financial industry globally shows quite rapid development. Based
on data from the IFSB Financial Stability Report 2016, the assets of the world
Islamic financial industry have grown from around USD150 billion in the
1990s to around USD 2 trillion at the end of 2015 and are predicted to reach
USD 6.5 trillion in 2020. In Indonesia, the existence of Islamic banks has 20
years old and has given its own color to Indonesian financial industry. On the
other hand, despite the development of Islamic banks the fact shows Islamic
financial market share still moves in the range of 5% (Otoritas Jasa
Keuangan, 2017).
According to Islamic Banking Statistics by Financial Service Authority (OJK),
Sharia rural banks has the lowest market share compared with Sharia
commercial banks and Sharia business units which only 2,53% of the total
Islamic banking market share. Moreover, the financial ratio of Sharia rural
banks in Indonesia did not show the good condition for the past 5 years started
from 2013 to 2017, to be specified for the ROA as a common measurement of
bank’s financial performance which mostly shows the decreasing every year.

6
1.3 Statement of Problems
Accordance with the previous explanation, this study will emphasize on the
variables that affect profitability of Sharia rural banks in Indonesia. The
researcher has modified research questions which will be analyzed in this
research, as follows:
1. Is there any significant partial influences of:
a. GDP towards profitability of Sharia rural banks in Indonesia?
b. Inflation towards profitability of Sharia rural banks in Indonesia?
c. CAR towards profitability of Sharia rural banks in Indonesia?
d. FDR towards profitability of Sharia rural banks in Indonesia?
e. NPF towards profitability of Sharia rural banks in Indonesia?
f. OER towards profitability of Sharia rural banks in Indonesia?
2. Is there any simultaneous significance influence of GDP, inflation, CAR,
FDR, NPF and OER towards profitability of Sharia rural banks in
Indonesia?
3. Which variable that has the most significant influence towards
profitability of Sharia rural banks in Indonesia?
1.4 Research Objectives
As it has been explained in problem identification, the objectives of this
research by concentrate to Sharia rural banks in Indonesia, as follows:
1. To find out whether there is significant partial influence of:
a. GDP towards profitability of Sharia rural banks in Indonesia.
b. Inflation towards profitability of Sharia rural banks in Indonesia.
c. CAR towards profitability of Sharia rural banks in Indonesia.
d. FDR towards profitability of Sharia rural banks in Indonesia.
e. NPF towards profitability of Sharia rural banks in Indonesia.
f. OER towards profitability of Sharia rural banks in Indonesia.
2. To find out whether there any simultaneous significant influence of
External factors (GDP and inflation) and Internal Factors (CAR, FDR,

7
NPF, OER) towards profitability and its impact to Sharia rural bank in
Indonesia.
3. To find out the variable that has the most significant influence towards
profitability of Sharia rural banks in Indonesia.
1.5 Significance of the Study
Banking holds crucial role in the country since it influences the economics
conditions which affects to every aspect in the country. Indonesia which has
the most Muslim population in the world also conducts the business based on
Sharia principal. On the other hand, the growth of banks with Sharia principal
is way left behind than the conventional one. Therefore through this study, the
researcher aims to support and develop insight of how influential external and
internal variables in relation to banks profitability. This purpose is addressed
for:
1. Sharia banking industry
The results of the study are expected to give input for Sharia banking
Industry to be specified for Sharia rural bank in Indonesia in order to
increase the profitability of the bank that could help the bank to develop.
2. Academic community
This research expected to complement existing Sharia rural bank
profitability evaluation and to deepen knowledge of students and
academicians regarding Sharia rural banks.
3. The next researcher
The results of the study are expected to give reference and knowledge
regarding profitability of Sharia rural banks influenced by external factors
and internal factors of the economic for further analyst.
8
4. The researcher
This research is arranged to expand as well as to obtain comprehensive
knowledges of the application of several factors in measuring banks
profitability and being a prerequisite to accomplish Bachelor Degree in
Business in President University.
1.6 Scope and Limitations of the Study
1. Scope
This research is aim to determine the influence of GDP, inflation, CAR,
FDR, NPF and OER towards banks profitability which represented by
ROA. The study is intended for Sharia rural banking sector in Indonesia,
which are listed in Bank Indonesia and OJK during observation period
consisted of 168 Sharia rural banks in Indonesia as per September 2018.
2. Limitation
This research have only focused on Sharia rural banks in Indonesia which
have total assets >100 Billion IDR. In addition, the data limitation of this
research from 2014Q1 – 2018Q3 by using quarterly basis from the
financial report of every Sharia rural banks which list in Bank Indonesia
and OJK.
1.7 Thesis Organization
In order to obtain a systematic arrangement and discussion, this research is
arranged in the following systematics which divided into 5 different parts such
as:
CHAPTER I INTRODUCTION
In this section, it contains the background of the study, the formulated
problem, purpose of research, usefulness of research, limitation of research
and systematics writing.

9
CHAPTER II LITERATURE REVIEW
Chapter II contains theoretical foundations on matters relating to research and
research models. As well as some previous research that will support this
research in developing hypotheses.
CHAPTER III METHODOLOGY
This section contains the variables research and definitions operational
variables, population and samples, types and sources of data, data collection
methods, and analytical methods.
CHAPTER IV ANALYSIS OF DATA AND INTERPRETATION OF
RESULT
Chapter IV contains the results of data processing and analysis of the results
processing of such data. The researcher will collect and arrange the data in
Microsoft Excel to be run in IBM SPSS Statistics 22. The data will be
processed by SPSS 22 by using descriptive analysis, classical assumption test,
multiple regression analysis and hypothesis testing. In addition, the relevant
theories and literature must be included to support the research.
CHAPTER V CONCLUSIONS AND RECOMMENDATIONS
This section contains the summary of analysis result in accordance to the
research objectives. Also, the researcher will provide the recommendation for
the related parties.

10
CHAPTER II
LITERATURE REVIEW
2.1 Sharia Bank
Economic development activities cannot be separated from the banking sector,
because banks have an important role in the growth of economic stability
within every country. Bank one of the financial institutions, have functions as
a financial intermediary of two parties, namely those who are over-funded and
those who lack funds (Otoritas Jasa Keuangan, 2017). Based on basic
principle in conducting its business activities, banking industry divided into
two types; which are conventional bank and Sharia bank. Both conventional
and Sharia banks are having the same function which as a financial
intermediary between who are over-funded and who lack of funds but have
different principle in processing the fund. In this study, we focus on Sharia
rural banks that are exist in Indonesia.
Banks are entities which collecting funds in the form of financing or in other
words carry out the financial intermediary function. As stipulated in Law No.
10 of 1998, banks have the function of collecting and channeling public funds,
as well as banking objectives to support national development. In the banking
system in Indonesia there are two types of banking operational system, which
are conventional banks and Islamic banks (Sharia banks).
In accordance to Sharia Banking Law No. 21 of 2008, Sharia bank is bank that
runs business according with the Sharia principles, or the principle of Islamic
law that is regulated in the fatwa of the Indonesian Ulema Council (MUI) such
as the justice and equality principles ('adl wa tawazun), benefits (maslahah),
universalism (alamiyah), and does not contain gharar, maysir, riba (usury),
zalim (cruel) and obscene (objects). In conducting its businesses, Sharia
banking should follow the Sharia Principles, economic democracy also
prudential principles. Sharia banking has objective to support the
11
implementation of national development with aims to improve justice,
togetherness and equality of people's welfare.
Based on its activities Sharia banks are differentiated into BUS, UUS, and
BPRS. BUS has the same institutional form with conventional commercial
banks, while Sharia rural banks have the same institutional form with
conventional rural banks. The legal entity of Sharia commercial banks and
Sharia rural Banks can be in the form of a limited liability company, regional
company, or cooperative. Meanwhile, Sharia business unit is not a separate
legal entity, but is a unit or part of a conventional commercial bank.
2.1.1 Sharia Rural Bank
Sharia rural bank is carrying out their business activities based on Sharia
policies which in its activities are not providing the services in payment
traffic. The legal form could be as limited liability company, cooperative or
regional company (Article 2 PBI No. 6/17 / PBI / 2004). Accordance with the
Law No. 21 of 2008 stated that sharia rural bank is a bank with Sharia system
which its activities do not provide services in traffic payment.
Sharia rural banks’ business activities essentially are similar to the activities of
the Sharia commercial banks, namely in the form of fund raising, distribution
of funds, and activities in the service sector. What distinguishes it is that
Sharia rural banks is not permitted to provide services in payment traffic, for
example participating in clearing activities, collection, and curbing demand
deposits.
2.2 Macroeconomics
Macroeconomics is the economy as a whole which has involve to the overall
economic performance of the nation such as production growth, unemploye
number, price increase by the inflationary, deficits of government, exports and
imports level (OpenStax College, 2014). Additionally, according to
(Andolfatto, 2008), there are 9 (nine) indicators of macroeconomic such as
GDP, output and employment, unemployment, uncertainty and expectations,

12
consumption and saving, capital and investment, money and inflation, fiscal
policy, and growth and development. This study focuses on two
macroeconomics indicators to be analyzed which GDP and Inflation.
2.2.1 Gross Domestic Product
Gross Domestic Product is one of the important indicators to determine the
economic growth in a country in a given period, both at current prices and at
constant prices (Badan Pusat Statistik, 2016). Basically, GDP is the amount of
added value generated by all business units in a particular country in a certain
period. The value of goods used should be equal to the total value of the final
goods and services provided from the production. GDP is considered as one of
the most significant macroeconomic variables to represent profitability (Ali &
Maamor, 2018).
To determine GDP, it can be generated by summing up all domestic and
foreign effective demand for national goods. Things that considered as
domestic demands are government, household, and firm expenditure (public
expenditure, consumption, and investment) while exports are when foreign
customers buy national good. Additionally, the GDP sum could be decrease
since imports also attracts the domestic demand (Kira, 2013).
According to (Garin, et al., 2018) GDP can be calculated by using expenditure
approach which based on expenditures incurred in given period with the
formula as follows:
(Eq. 1)
With:
C = sum of consumption
I = Investment
G = Government Expenditure
X = Net Export or export
IM = Imports
GDPt = Ct + It + Gt + (Xt − IMt)

13
2.2.2 Inflation
Inflation is one of the serious matters in the economics of a country or even
globally. Accordance to the study by Amadeo in 2012, inflation is when the
price’s condition of most goods and services continue increasing and it may
cause the decreasing of the standard of living cost as the effect of spending a
lot of money to get the same amount of goods and/or services we bought
previous time (Islam et al., 2017). The impact of inflation is not only on
corporate’s pricing but also has influence on bank customers and financial
resources significantly (Ali & Maamor, 2018).
Inflation happens because of several causes which are where number of
demand increases faster than number of supply thus it affects to the cost of
goods and services. The imbalance of number of supply and number of
demand are lead to the inflation and causes of deficits of government, interest
rate expansion by banks and the increase of foreign demand (Semuel &
Nurina, 2015).
According to Bank Indonesia, Consumer Price Index is the indicator that is
common to be used to measure the inflation. Changes in CPI over the time
will indicate the movements in price of goods package and services consumed.
In the CPI basket, to determine the goods and services are carried out on the
basis of the cost of living survey carried out by the BPS. Then, BPS will
monitor the growth of price and services in a monthly basis within several
cities, in traditional also modern markets for several types of goods or services
within every city (Bank Indonesia, 2018).
In accordance to (Tennant, 2009), the change in CPI from preceding year is
considered as inflation. It can be formulated with:
Inflationyear 2 = CPI2 – CPI1 X 100%
CPI1
(Eq.2)

14
2.3 Financial Performance
Financial performance is the barometer of the operation of the company.
Financial performance can be used as the measurement of financial health of
the company (Matar & Eneizan, 2018). To assess the financial performance, it
can be done by analyzing the financial statement of the company to determine
its stability, viability and profitability (Sultan, 2014). This study focuses on 5
(five) information which provided in financial statement such as ROA, CAR,
FDR, NPF and OER.
2.3.1 Capital Adequacy Ratio
Capital is a very important factor for the development and progress of the
bank while maintaining public trust. Every fund comes, has potential to
generate profits also has the potential to cause risk. Therefore capital must also
be used to maintain the possibility of risk of loss of assets and investments in
assets, especially those originating from third party funds or the public. When
banks do their operations, capital is one of important factors for the
development of the business and overcome the risk of loss.
CAR is the capital to risk-weighted assets ratio. This ratio shows how far all
risk-bearing assets come from being financed from the own capital fund of
banks. It also to incur source of funds from outside the bank such as public
funds, loans, etc. (Rahim, 2014). Accordance to Rahim, CAR is the ratio to
measure the bank’s capital adequacy of in order to support risk-bearing assets.
Ideally by Edy Setiady as Head of Sharia banking department of OJK, Sharia
rural banks should have CAR for more than 14%. If the CAR is low, the
maximum FDR of banks should be in 99% while if the CAR is 20%, is not
consider as a problem if FDR number is more than 100% (Agustiyani, 2014).
In accordance with Bank Indonesia, capital adequacy ratio is showing how far
all risk-bearing bank assets (credit, participation, and bill securities in other
banks) are also financed from capital funds of bank. Additionally, it has aim to

15
obtain source of funds from outside the bank, such as funds from public, loans
(debt), etc. In other words, capital adequacy ratio is the banks’ ratio to
measure its performance in order to support the assets that contain or produce
risks, for example the loans given.
Capital adequacy ratio can be defined as an important parameter for judging
the strength and soundness of the bank (Fatima, 2014). Based on Circular
Letter from Bank Indonesia with the issuance of the regulation of Bank
Indonesia No. 8/18/PBI/2006 dated 5 October 2006 concerning obligation to
provide minimum capital of rural credit banks (Official Gazette of the
Republic of Indonesia No. 75 of 2006, Supplement to the Official Gazette of
the Republic of Indonesia No. 4644) hereinafter referred to as PBI, it is
necessary to stipulate implementing provisions concerning the minimum
capital requirement for rural credit banks.
Which according to Article 2 (two) of regulation of Bank Indonesia, rural banks
required to provide capital minimum of 8% (eight percent) from Risk Weighted
Assets (ATMR). By having minimum 8% of CAR it will lead to: (a) Maintain
public’s trust in bank, (b) Protecting third party funds of the bank concerned, (c)
To fulfill standardize of BIS (Bank for International Settlement) (Rahim,
2014).
To calculate the CAR in accordance with Basel II is using core capital and
supplementary capital and both should be added together then divided by risk
weighted assets (RWA) (El-Ansary & Hafez, 2015) which is used in
regulation of Indonesian Financial Ministry Number 140/PMK.010/2009
about Coaching and Supervision Indonesian Export Financing Agency related
with capital adequacy ratio, formulated with:
CAR =
Capital x 100%
Risk-Weighted
Assets
(Eq. 3)

16
Based on the regulation of Indonesian Financial Ministry, the capital used for
calculating the capital adequacy ratio divided into 3 tiers which consists of
core capital as 1st tier, supplementary capital as 2
nd tier and additional
supplementary capital as 3rd
tier.
2.3.2 Financing to Deposit Ratio
In accordance with Bank Indonesia, FDR is the ratio between financing
provided with total third party funds. Financing to deposit ratio is a ratio used
to determine the bank’s liquidity in repaying funds withdrawals made by
depositors by relying on financing provided as a source of liquidity, which is
by dividing the amount of financing provided by banks to third party funds
(DPK) (Wahyu, 2016). The higher the FDR, the higher the funds channeled to
DPK. By channeling third party funds, the bank's income is large which
examined by the increasing of ROA, so FDR is positively influencing the
ROA.
According to the study of Mohammed in (Amelia, 2015), FDR is released for
financing Islamic banks to determine the third party funds. FDR is also can be
used to measure the liquidity of the banks (Wahyu, 2016). In addition, to
determine the bank performance in term of financing, the bank can use FDR
as a tool (Nahar & Prawoto, 2017).
Based on Regulation of Bank Indonesia Number 6/23/DPNP/2004, the amount
of FDR to achieve the profit target, the bank should maintain its FDR in
between 85% to 100% (Sriyana, 2015). In other words, FDR shows the
capability of bank in paying bank the third party funds. In accordance to
(Firmansyah, 2014) in which also used by Bank Indonesia, the ratio between
total financing and total third party funds can be determined as FDR of the
bank.
FDR = Total Financing
x 100%
Total third party fund
(Eq. 4)
17
2.3.3 Non Performing Financing
Financing as main activity of Sharia banks because it is the main source of
income for Sharia banks come from this activity. Non-Performing Financing
is one of the risks since the greater the amount of funding compared to the
third party fund in a bank bring consequences of the greater the risk must be
borne by the banks (Solihatun, 2014). In other words, NPF used as the
measurement level of financing problems in Islamic banks (Amelia, 2015).
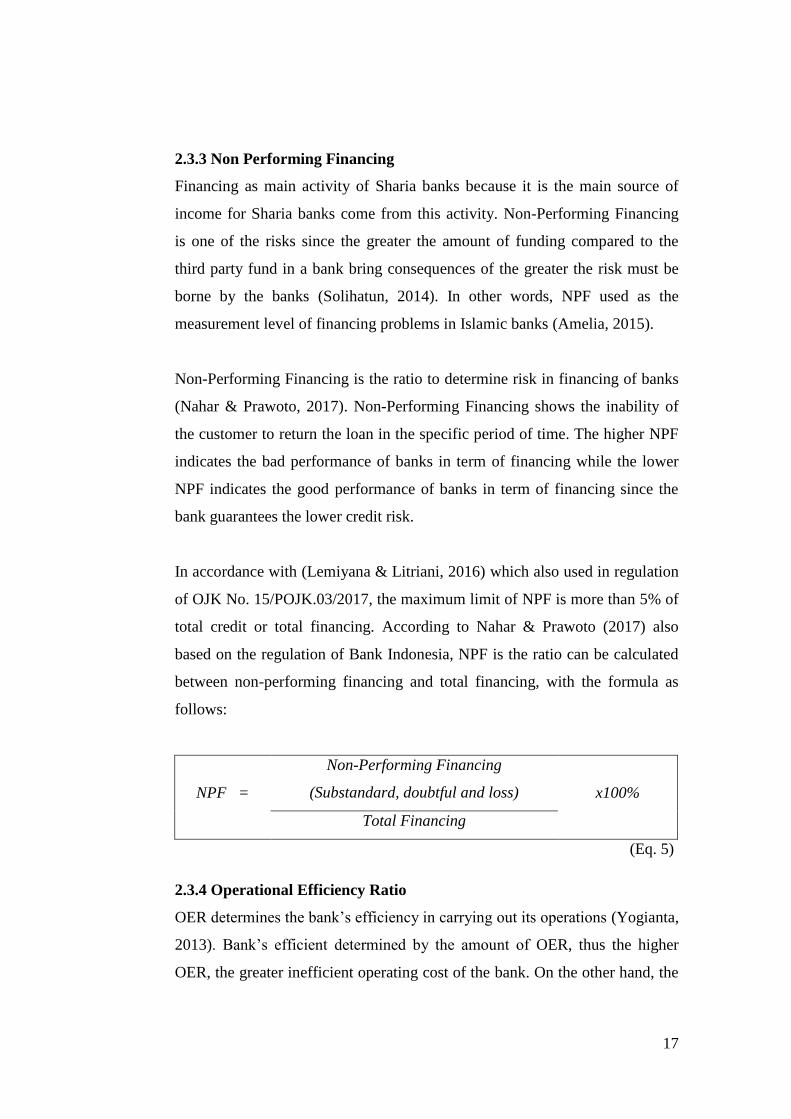
Non-Performing Financing is the ratio to determine risk in financing of banks
(Nahar & Prawoto, 2017). Non-Performing Financing shows the inability of
the customer to return the loan in the specific period of time. The higher NPF
indicates the bad performance of banks in term of financing while the lower
NPF indicates the good performance of banks in term of financing since the
bank guarantees the lower credit risk.
In accordance with (Lemiyana & Litriani, 2016) which also used in regulation
of OJK No. 15/POJK.03/2017, the maximum limit of NPF is more than 5% of
total credit or total financing. According to Nahar & Prawoto (2017) also
based on the regulation of Bank Indonesia, NPF is the ratio can be calculated
between non-performing financing and total financing, with the formula as
follows:
NPF =
Non-Performing Financing
(Substandard, doubtful and loss) x100%
Total Financing
(Eq. 5)
2.3.4 Operational Efficiency Ratio
OER determines the bank’s efficiency in carrying out its operations (Yogianta,
2013). Bank’s efficient determined by the amount of OER, thus the higher
OER, the greater inefficient operating cost of the bank. On the other hand, the
18
lower OER ratio determines the better financial performance of banks
(Amelia, 2015).
Operational efficiency ratio is a comparison between operational costs and
operating income to measure the efficiency level and bank’s ability to conduct
their operations (Hakim & Sugianto, 2018). In accordance with the regulation
of Bank Indonesia No. 15/12/PBI/2013, OER best standard is in 92%
(Christaria & Kurnia, 2016).
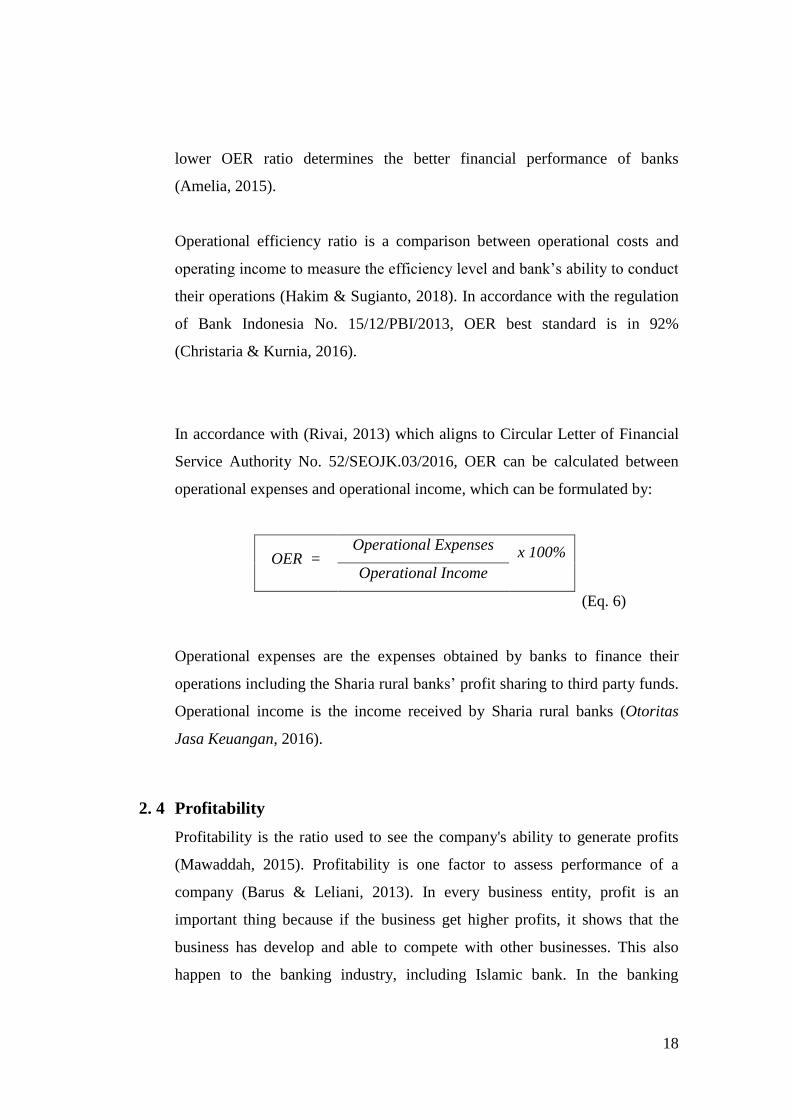
In accordance with (Rivai, 2013) which aligns to Circular Letter of Financial
Service Authority No. 52/SEOJK.03/2016, OER can be calculated between
operational expenses and operational income, which can be formulated by:
OER = Operational Expenses
x 100%
Operational Income
(Eq. 6)
Operational expenses are the expenses obtained by banks to finance their
operations including the Sharia rural banks’ profit sharing to third party funds.
Operational income is the income received by Sharia rural banks (Otoritas
Jasa Keuangan, 2016).
2. 4 Profitability
Profitability is the ratio used to see the company's ability to generate profits
(Mawaddah, 2015). Profitability is one factor to assess performance of a
company (Barus & Leliani, 2013). In every business entity, profit is an
important thing because if the business get higher profits, it shows that the
business has develop and able to compete with other businesses. This also
happen to the banking industry, including Islamic bank. In the banking

19
industry, to indicate the performance of the bank’s profitability can be
determined by calculating the return on assets and return on equity which the
ratio that indicates the ability of the entire existing assets and both are used to
generate the bank’s profit (Hosen & Rahmawati, 2016).
Profitability is defined as a condition produces financial gain or profit through
exchange of potential risks (Ali & Maamor, 2018). Profitability is considered
as a significant component in the banking industry since the profitability
contributes to sustain destructive macroeconomics financial tremors and it
contributes financially to stabilize the financial system of the country. The
level of profitability of the bank is influenced by several factors both internal
and external. Some of these factors are bank characteristics, macro indicators,
taxation, financial structure, asset quality, capital and liquidity (Anto &
Wibowo, 2012).
According to Bank Indonesia, to measures the profitability of banks in
Indonesia based on 2 (two) indicators which are return on assets and
operational efficiency ratio (Mawaddah, 2015). The greater the bank’s return
on assets, the greater the profit level achieved by the bank. It concludes that
the bank has better the position in terms of asset use. The return on assets was
developed by DuPont which used by many firms to evaluate how effectively
assets of the firms are used. In accordance with DuPont analysis, it combined
effect of profit margins and assets turnover (Groppelli & Nikbakht, 2000).
Profitability as one of the references in measuring the magnitude is so
important to know whether the company has run its business efficiently. The
efficiency of a new business can be known after comparing the profit obtained
with the capital or assets that generate the profit.

20
2.5 Previous Research
Table 2.1 Previous Researches
No Researcher/Year/Title Variables Research Design
1 Paulin and Wiryono
(2015)
Determinants of
Islamic Bank’s
Profitability in
Indonesia for 2009-
2013
Independent:
a. NPF
b. OER
c. NIM
d. FDR
e. PPAP Compliance
f. NPA
g. EA
h. LIQD
Dependent: ROA
a. Population: 11 Islamic
commercial banks in
Indonesia
b. Sample: 8 Islamic banks in
Indonesia
c. Data analysis: multiple linear
regression
d. Result: NPF, FDR, NPA, EA,
and LIQD does not partially
influence ROA, the rest of
variables are vice versa.
2 Ali, Maamor, Yaacob,
and Gill (2018)
Impact of
Macroeconomic
Variables on Islamic
Banks Profitability
Independent:
a. GDP
b. Interest Rate
c. Inflation
d. Exchange Rate
e. Oil Prices
f. Competition
g. Money Supply
Dependent:
Profitability
a. Population: Islamic Banks of
Brunei Darussalam
b. Sample: DEPD, AMBD and
IMF annual reports
c. Data analysis: Panel data
analysis
d. Result: GDP growth rate,
inflation, exchange rate, oil
prices and money supply have
positive significant impact on
profitability. While, oil
prices, GDP and inflation
were the most significant and
exchange rate and money
supply were the least
significant determinants of
profitability.
3 Nahar and Prawoto
(2017)
Bank’s Profitability in
Indonesia: Case study
of Islamic Banks
Independent:
a. Inflation
b. GDP
c. CAR
d. FDR
a. Population: Islamic Banks in
Indonesia
b. Sample: 3 Islamic
commercial banks
c. Data analysis: Panel data
d. Result: All the independent

21
period 2008-2012 e. NPF
f. OER
Dependent: ROA
variables are significantly
influence the dependent
variables. In terms of the
significance, inflation, GDP
and NPF are positively
significant, CAR, FDR and
OER, vice versa.
4 Aslam, Inamullah
and Ismail (2016)
Determinants Affecting
the Profitability of
Islamic Banks:
Evidence from
Pakistan
Independent:
a. Size
b. Deposits
c. Financing
d. GDP
e. Inflation
f. Market share
Dependent:
a. ROA
b. ROE
a. Population: Islamic banks in
Pakistan
b. Sample: 5 full-fledged
Islamic banks and 17 Islamic
banking branches of
conventional banks
c. Data analysis: panel data
d. Result: the determinants of
both ROA and ROE are not
same. But the factors used in
this article have the same
impact over ROA and ROE.
Size, deposits, financing,
market shares, GDP and
Inflation are insignificantly
affect ROA and ROE. Size,
financing and market share
positively impact ROA and
ROE whereas Deposits, GDP
and Inflation negatively
impact over ROA and ROE.
5 Ashraful and
Chowdhury (2015)
Which is more
important in terms of
Profitability of Islamic
Banks: Bank Specific
factors or
Macroeconomic
factors? An Empirical
Study on Malaysian
Independent:
a. Asset quality ratio
b. CAR
c. Overheard ratio
d. Liquidity Risk
e. GDP growth rate
f. Inflation
g. Money Supply
h. Savings on GNI
a. Population: Islamic banks in
Malaysia
b. Sample: 11 Islamic banks in
Malaysia
c. Data analysis: The pooled
ordinary least square
d. Result: Overhead costs and
GNI are negatively influence
the bank’s profitability, while
equity financing and inflation
are positively influence the

22
Islamic Banks
Dependent:
Profitability
bank’s performance. On the
other hand, the Credit risks
and Liquidity risks factors are
insignificant towards bank’s
profitability.
6 Amzal (2016)
The Impact of
Macroeconomic
Variables on Indonesia
Islamic Banks
Profitability
Independent:
a. GDP
b. Inflation rate
c. BI rate
d. NPF
Dependent:
Profitability
a. Population: Islamic banks in
Indonesia
b. Sample: Indonesian banking
sectors during the period
2016Q1 – 2014Q4
c. Data analysis: Time series
d. Result: All independent
variables are significantly
influence the profitability.
7 Asadullah (2017)
Banks Determinants of
Profitability of Islamic
Banks of Pakistan – A
case Study on
Pakistan’s Islamic
Banking Sector
Independent:
a. GDP
b. Size
c. Inflation
d. Liquidity
e. Exchange rate
Dependent:
Profitability
a. Population: Islamic banks in
Pakistan
b. Sample: Five Islamic banks
over a period of ten years, i.e.
2006-2015 in Pakistan
c. Data analysis: Panel
regression
d. Result: Liquidity has positive
whereas size has negative
effect on bank’s profitability.
On the other hand, there are
three variables have no
influence toward profitability.
8 Amelia (2015)
Financial Ratio and Its
Influence to
Profitability in Islamic
Banks
Independent:
a. CAR
b. NPF
c. FDR
d. OER
Dependent: ROA
a. Population: Islamic banks in
Indonesia
b. Sample: 2 Islamic banks
2005-2012 quarterly
c. Data analysis: Multiple
regression analysis
d. Result: CAR, NPF, and FDR
partially no significant effect
to ROA, while OER partially
significant effect to ROA.

23
9 Sutrisno (2016)
Risk, Efficiency and
Performance of Islamic
Banking: Empirical
Study on Islamic Bank
in Indonesia
Independent:
a. FDR
b. RR
c. CAR
d. NPF
e. OEOI (OER)
Dependent:
a. ROA
b. NPM
a. Population: Islamic bank in
Indonesia
b. Sample: 8 Islamic banks in
Indonesia using quarterly data
c. Data analysis: Multiple
regression analysis
d. Result: It found that FDR,
CAR. OEOI and size are
significantly influence the
performance the performance
of Islamic banks while the
other two variables, RR and
NPF insignificant in affecting
the performance of the banks.
10 Ullah (2016)
Influencing Factors of
Profitability on the
Banking Industry: A
case study of GCC
countries.
Independent:
a. Total Assets
b. EA
c. NLA
d. Growth
e. Inflation
Dependent:
a. ROA
b. ROE
a. Population: Islamic banks in
GCC region
b. Sample: 26 Islamic Banks
and 46 conventional banks
c. Data analysis: least square
d. Result: All internal factors
significantly influence the
bank’s profitability. On the
other hand, external factors
insignificantly influence the
profitability.
11 Chokri and Anis
(2018)
Measuring the
Financial Performance
of Islamic Banks in
Selected Countries
Independent:
a. CTA
b. PTA
c. ASITA
d. ALCC
e. FGTA
f. Inflation rate
g. Growth rate
Dependent: ROA
a. Population: Islamic banks
b. Sample: 10 Islamic banks in
10 selected countries over the
period of 2012 - 2014
c. Data analysis: multiple
regression
d. Result: It found that CTA,
PTA, ALCC and growth rate
are positively influence the
bank’s performance contrary
to ASITA, FGTA and
inflation rate which influence
negatively the bank’s
performance. On the other
24
hand, growth rate and
inflation are not significantly
influence the bank’s
performance.
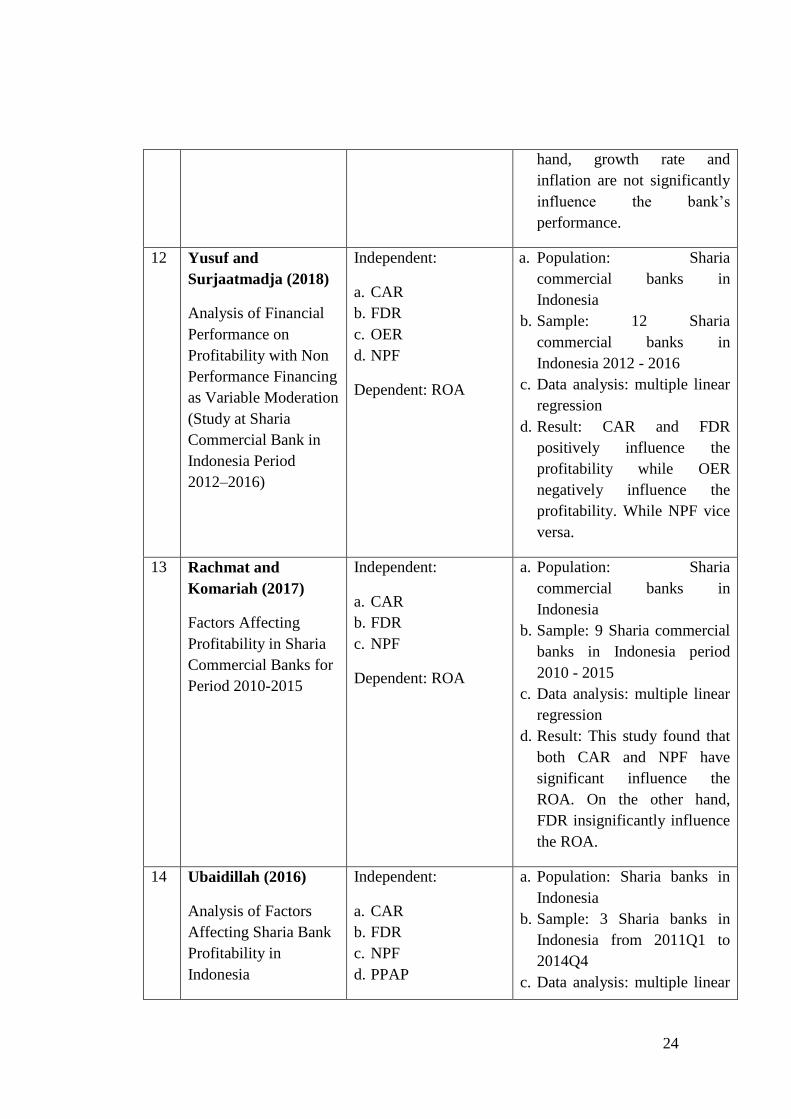
12 Yusuf and
Surjaatmadja (2018)
Analysis of Financial
Performance on
Profitability with Non
Performance Financing
as Variable Moderation
(Study at Sharia
Commercial Bank in
Indonesia Period
2012–2016)
Independent:
a. CAR
b. FDR
c. OER
d. NPF
Dependent: ROA
a. Population: Sharia
commercial banks in
Indonesia
b. Sample: 12 Sharia
commercial banks in
Indonesia 2012 - 2016
c. Data analysis: multiple linear
regression
d. Result: CAR and FDR
positively influence the
profitability while OER
negatively influence the
profitability. While NPF vice
versa.
13 Rachmat and
Komariah (2017)
Factors Affecting
Profitability in Sharia
Commercial Banks for
Period 2010-2015
Independent:
a. CAR
b. FDR
c. NPF
Dependent: ROA
a. Population: Sharia
commercial banks in
Indonesia
b. Sample: 9 Sharia commercial
banks in Indonesia period
2010 - 2015
c. Data analysis: multiple linear
regression
d. Result: This study found that
both CAR and NPF have
significant influence the
ROA. On the other hand,
FDR insignificantly influence
the ROA.
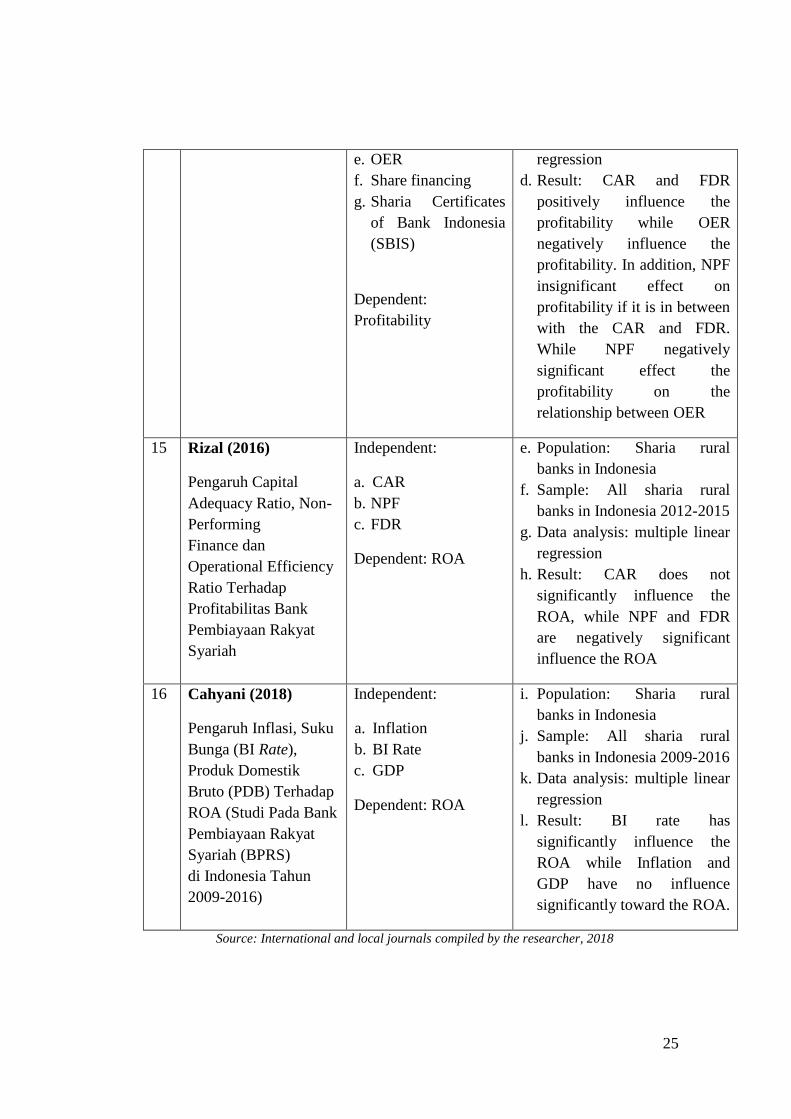
14 Ubaidillah (2016)
Analysis of Factors
Affecting Sharia Bank
Profitability in
Indonesia
Independent:
a. CAR
b. FDR
c. NPF
d. PPAP
a. Population: Sharia banks in
Indonesia
b. Sample: 3 Sharia banks in
Indonesia from 2011Q1 to
2014Q4
c. Data analysis: multiple linear
25
e. OER
f. Share financing
g. Sharia Certificates
of Bank Indonesia
(SBIS)
Dependent:
Profitability
regression
d. Result: CAR and FDR
positively influence the
profitability while OER
negatively influence the
profitability. In addition, NPF
insignificant effect on
profitability if it is in between
with the CAR and FDR.
While NPF negatively
significant effect the
profitability on the
relationship between OER
15 Rizal (2016)
Pengaruh Capital
Adequacy Ratio, Non-
Performing
Finance dan
Operational Efficiency
Ratio Terhadap
Profitabilitas Bank
Pembiayaan Rakyat
Syariah
Independent:
a. CAR
b. NPF
c. FDR
Dependent: ROA
e. Population: Sharia rural
banks in Indonesia
f. Sample: All sharia rural
banks in Indonesia 2012-2015
g. Data analysis: multiple linear
regression
h. Result: CAR does not
significantly influence the
ROA, while NPF and FDR
are negatively significant
influence the ROA
16 Cahyani (2018)
Pengaruh Inflasi, Suku
Bunga (BI Rate),
Produk Domestik
Bruto (PDB) Terhadap
ROA (Studi Pada Bank
Pembiayaan Rakyat
Syariah (BPRS)
di Indonesia Tahun
2009-2016)
Independent:
a. Inflation
b. BI Rate
c. GDP
Dependent: ROA
i. Population: Sharia rural
banks in Indonesia
j. Sample: All sharia rural
banks in Indonesia 2009-2016
k. Data analysis: multiple linear
regression
l. Result: BI rate has
significantly influence the
ROA while Inflation and
GDP have no influence
significantly toward the ROA.
Source: International and local journals compiled by the researcher, 2018
26
2.6 Research Gap
This research consists of research gap in accordance with the previous
research which has been conducted before. The gap has found based on
several aspects, which are the variables used, sample period, sample size and
result. This research consists of GDP, inflation, CAR, FDR, NPF, and OER.
While, Asadullah (2017) measured the profitability by using GDP, size,
inflation, liquidity and exchange rate. Amelia (2015) was studied the financial
performance to analyze the profitability. However, this study has presented
both macroeconomics factors and financial performance to measure the
profitability. It has different concern with Ashraful & Chowdhury (2015)
which focused on risk management such as credit risk, liquidity risk also
efficiency ratio and equity financing as its internal factors to observe the
profitability and Paulin & Wiryono (2015) with observes the ROA of Islamic
banks using the internal factors such as NPF, OER, NIM, FDR, PPAP
Compliance, NPA, EA, and LIQD.
The result was discovered which each previous research has various
differentiations such as the research held by Amelia (2015) shows CAR, NPF
and FDR partially has no significant effect towards ROA. In addition, this
research is containing the period of 2014Q1 to 2018Q3 which has the latest
period. This in contrast with Asadulah (2017), that was used the yearly data
from 2006 to 2015. Furthermore, most of the studies examined only for Sharia
commercial bank to represent Sharia banks profitability. That being said, the
researcher is motivated to run the study with more comprehensive by using
Sharia rural bank as its concern.

27
2.7 Theoretical Framework
To represent the beliefs on how certain variables are related to each other
along with the explanation of why the research believes that variables used are
associated with each other (Sekaran & Bougie, 2011). In this research, the
theoretical framework is described by Figure 2.1.
Figure 2.1 Theoretical Framework Source: Adjusted by Researcher, 2018
In this study, based on its relationship, the variables are segregated into two
types which are dependent variables and independent variables. Dependent
variable uses ROA to represent the profitability. While, independent variables
represented by GDP (X1), inflation (X2), CAR (X3), FDR (X4), NPF (X5), and
OER (X6). The researcher is aim to see any partial influence from each
independent variables toward dependent variables which expressed by H1 to
H6. Correspondingly, the simultaneous influence from all independent
variables which have been expressed by H7 in the Figure 2.1.
GDP
Inflation
CAR
FDR
NPF
OER
Profitability
H1 H2
H3
H4
H5 H6
H7

28
2.8 Hypothesis
In accordance with the literature review and research framework, the
researcher constructed the following hypothesis:
H1: There is significant influence of GDP towards profitability of Sharia
rural banks in Indonesia.
H2: There is significant influence of inflation towards profitability of
Sharia rural banks in Indonesia.
H3: There is significant influence of CAR towards profitability of Sharia
rural banks in Indonesia.
H4: There is significant influence of FDR towards profitability of Sharia
rural banks in Indonesia.
H5: There is significant influence of NPF towards profitability of Sharia
rural banks in Indonesia.
H6: There is significant influence of OER towards profitability of Sharia
rural banks in Indonesia.
H7: There is significant simultaneous influence of GDP, inflation, CAR,
FDR, NPF, and OER towards profitability of Sharia rural banks in
Indonesia.

29
CHAPTER III
METHODOLOGY
3.1 Research Method
Research method or those methods that are used in conducting the research to
achieve its objectives is different with research methodology. Research
methodology can be determined as the way to systematically solve the
research problem (Kothari, 2004). By having the research method, it will help
the researcher to have a clear understanding regarding the topic since it builds
the awareness of the topic (Neuman, 2014).
3.2 Research Framework
Figure 3.1 Theoretical Framework Source: Adjusted by Researcher, 2018
Understand problem and specify
research objective
Find and gather the theory
By using
Microsoft Excel
2010 and IBM
SPSS Statistics 22
Accessed from Bank
Indonesia, Financial
Service Authority
and Central
Statistics Agency
Develop theoretical framework
Define the methodology
Collect the data needed
Input and process the data
Data analysis and interpretation of results
Conclusions and recommendation

30
3.3 Sampling Design
In conducting the research, a sample design is a certain plan in order to obtain
a sample from given population. The researcher has to set up a sample design
that must be reliable and appropriate with the study (Kothari, 2004). In
accordance to (Sekaran & Bougie, 2011), the process of selecting number of
subjects from population as the representatives of the research is sampling.
This study uses non-probability sampling to collect the data from the
population. By having the right sample, it can be used to conclude a whole
population of the study.
3.3.1 Size of Population
Population can be determined as the whole individuals or objects within group
which interested to be analyzed by the researcher (Sekaran & Bougie, 2011).
It is not feasible to analyze the population because of its size. Thus, in this
study, we select some of population to achieve the research purpose. The
population of this study consists of Sharia rural banks in Indonesia which in
Indonesia based on Sharia Banking Statistics as per September 2018 by OJK,
there are 168 Sharia rural banks listed in Indonesia.
3.3.2 Size of Sample
In accordance to Sekaran & Bougie (2011), sampling design is divided into
two types, which are probability and non-probability sampling. The study is
using non-probability sampling with focus in purposive sampling with criteria
as follow:
1. Sharia rural banks in Indonesia which has listed and published in Bank
Indonesia and OJK
2. Sharia rural banks in Indonesia with minimum assets of IDR 100
Billion
3. Have provided its financial report in quarterly for the period of
2014Q1 to 2018Q3.
31
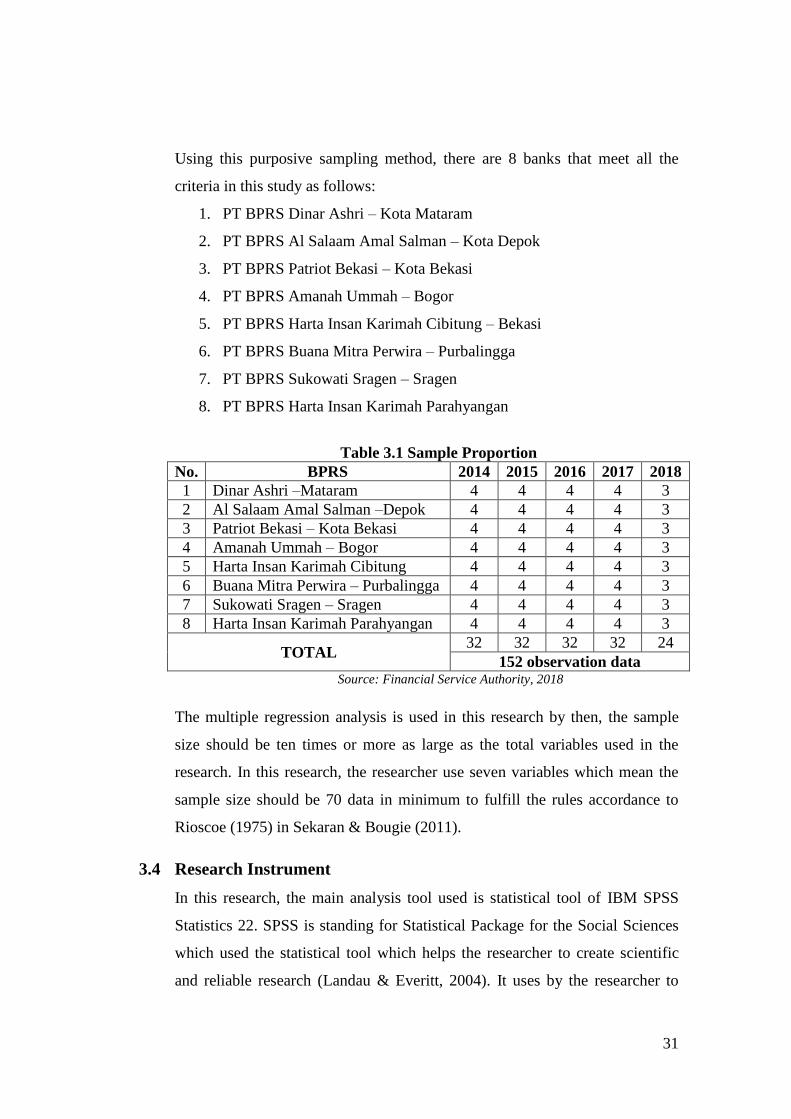
Using this purposive sampling method, there are 8 banks that meet all the
criteria in this study as follows:
1. PT BPRS Dinar Ashri – Kota Mataram
2. PT BPRS Al Salaam Amal Salman – Kota Depok
3. PT BPRS Patriot Bekasi – Kota Bekasi
4. PT BPRS Amanah Ummah – Bogor
5. PT BPRS Harta Insan Karimah Cibitung – Bekasi
6. PT BPRS Buana Mitra Perwira – Purbalingga
7. PT BPRS Sukowati Sragen – Sragen
8. PT BPRS Harta Insan Karimah Parahyangan
Table 3.1 Sample Proportion
No. BPRS 2014 2015 2016 2017 2018
1 Dinar Ashri –Mataram 4 4 4 4 3
2 Al Salaam Amal Salman –Depok 4 4 4 4 3
3 Patriot Bekasi – Kota Bekasi 4 4 4 4 3
4 Amanah Ummah – Bogor 4 4 4 4 3
5 Harta Insan Karimah Cibitung 4 4 4 4 3
6 Buana Mitra Perwira – Purbalingga 4 4 4 4 3
7 Sukowati Sragen – Sragen 4 4 4 4 3
8 Harta Insan Karimah Parahyangan 4 4 4 4 3
TOTAL 32 32 32 32 24
152 observation data Source: Financial Service Authority, 2018
The multiple regression analysis is used in this research by then, the sample
size should be ten times or more as large as the total variables used in the
research. In this research, the researcher use seven variables which mean the
sample size should be 70 data in minimum to fulfill the rules accordance to
Rioscoe (1975) in Sekaran & Bougie (2011).
3.4 Research Instrument
In this research, the main analysis tool used is statistical tool of IBM SPSS
Statistics 22. SPSS is standing for Statistical Package for the Social Sciences
which used the statistical tool which helps the researcher to create scientific
and reliable research (Landau & Everitt, 2004). It uses by the researcher to

32
processing the raw data in statistic way with aim to get the result that will be
interpreted, such as normality, descriptive, heteroscedasticity, autocorrelation,
multicollinearity and multiple regression.
SPSS is statistics software which helps to provide advanced data analysis,
regression and forecasting tools (Landau & Everitt, 2004). Additionally, the
researcher also use the Microsoft Excel 2010 in transforming the raw data
obtained from financial reports of Sharia rural banks in Indonesia quarterly
and BPS data portal, to categorize the data and to create charts and tables. The
other relevant instrument used in this research is Microsoft Word 2010 to
compose the research.
3.5 Data Collection Method
In conducting a study, data holds an important role in proving the hypothesis
has been set and achieve objectives of the research. Every study must have
known what data needs to be provided and how to collect, identify and process
the data. This study is using secondary data which means the collection of data
which collected by someone else earlier which has no relation to the research
study but collected these data for any other purposes at the different time in
the past (Johnston, 2014).
The data collection method in this research is financial report, which in
quarterly report of Sharia rural bank in Indonesia which has the total assets
minimum of IDR 100 Billion based on the Infobank Sharia Awards in 2018.
For microeconomics, the data collected from financial report of each banks
where have been provided in website of Bank Indonesia and OJK. While
macroeconomics collected from central agency on statistics which both data
macroeconomics and microeconomics taken quarterly from 2014Q1 to
2018Q3.

33
3.6 Operational Definitions
In this study, there are 6 (six) independent variables, which are GDP, inflation,
CAR, FDR, NPF, and OER. While, ROA to represent the profitability is the
dependent variable in this research. Meanwhile, the conceptual definitions and
measurements are follows:
Table 3.2 Operational Definitions
Research
Variable
Operational
Definition Equation Scale
Dependent Variable
Profitability Profitability is the ratio
which developed by
DuPont in order to
evaluate how effectively
assets are used by the
firms (Groppelli &
Nikbakht, 2000).
ROA =
Net Income x 100 Total Asset
Ratio
Independent Variables
Gross
Domestic
Product
GDP is the amount of
added value generated by
all business units in a
particular country in a
certain period (OpenStax
College, 2014)
GDPt = Ct + It + Gt + (Xt − IMt)
Ratio
Inflation Inflation is when the
price’s condition of most
goods and services
continue increasing and it
may cause the decreasing
of the standard of living
cost as the effect of
spending a lot of money
Inflationyear2 = CPI2 – CPI1 x 100
CPI1 Ratio

34
to get the same amount
of goods and/or services
we bought previous time
(OpenStax College,
2014)
Capital
Adequacy
Ratio
CAR is the ratio that
helps to measure the
capital adequacy of a
bank to support risk-
bearing assets (Rahim,
2014).
CAR =
Capital x 100% Risk-
Weighted
Assets
Ratio
Financing
Deposit
Ratio
FDR is the ratio that
helps to measure the
bank’s liquidity in
repaying funds
withdrawals made by
depositors by relying on
financing provided as a
liquidity source, which
by dividing the amount
of financing provided by
banks to third party funds
(Wahyu, 2016).
FDR =
Total
Financing
x 100% Total Third
Party Fund Ratio
Non-
Performing
Financing
NPF is show the inability
of the customer to return
the loan in the specific
period of time (Nahar &
Prawoto, 2017).
NPF =
NPF
(Substandard,
doubtful
and loss)
x 100% Total
Financing
Ratio

35
Operational
Efficiency
Ratio
OER is a comparison
between operational costs
and operating income to
measure the level of
efficiency and bank’s
ability in conducting
their operations (Hakim
& Sugianto, 2018).
OER =
Operational
Expenses x 100%
Operational
Income
Ratio
Source: Adjusted by Researcher, 2018 according to Ali & Maamor (2018), Islam, et al.
(2017), Rahim (2014), Wahyu (2016), Nahar & Prawoto (2017), Hakim & Sugianto (2018),
3.7 Data Analysis Method
3.7.1 Descriptive Statistics Analysis
According to (Sugiyono, 2010), descriptive analysis is analysis used to
analyze data by describing the collected data as they are without intending to
make conclusions that apply to the general or generalizations. Descriptive
analysis analyzes data by giving a description or characteristic of data seen
from the mean, standard deviation, maximum, and minimum (Weiss, 2012).
The mean is used to estimate the magnitude of the population average
estimated from the sample which can be formulated as follows (Schwert,
2010):
(Eq. 7)
Where:
N = perceptions quantity in the present test
The maximum and minimum are used to see the current sample of maximum
and minimum values (Schwert, 2010).

36
Standard deviation is used to determine how the data is spread in the sample
or data around average which can be formulated as follows (Schwert, 2010):
(Eq. 8)
Where:
N = number of observations in the current sample
y mean of the series
Descriptive statistics need to be done to see the overall picture of the samples
collected and fulfill the requirements as samples.
3.7.2 Classical Assumption Test
In accordance to William (2015), it is important to conduct the classical
assumption test since it utilizes the multiple regressions or indeed any
statistical technique. There are several test used for classical assumption test
which explained as follows:
1. Normality Test
The first step to do the multivariate analysis is doing the normality test. This
test has objective to test the regressions model and the residual confounding
variable has a normal distribution or not (Sugiyono, 2010). The t and F tests
are assuming that the residual value follows a normal distribution. In
accordance with (Ghozali, 2016), in order to detect the residuals are normally
distributed or not, it can be analyzed by using graph. The graphical analysis
can be seen from histogram graph and probability-probability plot (p-p plot).
The basics to decide the normality test can be done by graphical analysis. If
the dots in P-P plot graph are spreading around the diagonal line or following
the direction of the line, it concluded that the regression model has met the
assumption of normality, or normality distribution. In addition, if the curve of
histogram is concentrated in the middle and declined in both left and right side

37
or the curve shaped like a bell shape, it can be conclude that the data has
normally distributed (Totton & White, 2011).
2. Heteroscedasticity Test
Heteroscedasticity determined as the variance of the error term for probability
(Williams, 2015). Heteroscedasticity happens if the variance error is not
constant which means the dispersion is not the same in all observations. On
the other hand, when the variance error is constant which means the dispersion
also remains the same in all observation is called as Homoscedasticity (Gau &
Stadtherr, 2002). A good regression model will show there is no issue for
heteroscedasticity in which only show homoscedasticity, means the regression
model is acceptable (Santoso, 2010).
Heteroscedasticity can be found by graph techniques in which seeing the
scatter plot. In the scatter plot, it shows the pattern of dots formed between
dependent variable (ZPRED) and the residuals (SRESID). It is a good way to
find out the homoscedasticity or an error along the regression line.
Accordance to Santoso (2012), the basic criteria for heteroscedasticity can be
seen through scatter plot as follows:
1) Heteroscedasticity can be found if there are certain patterns or dots
forms a regular pattern (wavy, widened, and/or narrowed).
2) Homoscedasticity can be found if there are no certain patterns which
the dots are spreading above and below the zero and Y axis.
3. Autocorrelation Test
Autocorrelation aims to clarify correlations in data collection among time
series data in the same cross sectional unit on the same variable (Meko, 2013).
Violation of this requirement exists when there is correlation error between
observations. Autocorrelation refers to the correlations of the time series with
its own past and future values and among members of a series of number
which compiled in time (Meko, 2013).
38
The Durbin-Watson statistic is measuring the autocorrelation in the residuals
(Schwert, 2010). The classical linear regression model assumes the research is
independent from each other has no positive or even negative autocorrelation
(Winarno, 2011). If the correlation exists, there might be an existing problem
of autocorrelation. Autocorrelation problem is happened when sequential
observations are related to each other in over time. Durbin-Watson value
should be -2 to 2 in the multiple regressions. Thus, if the Durbin-Watson value
is in the range of -2 to 2, it concludes there is no autocorrelation founded in
the research, vice versa.
4. Multicollinearity Test
The multicollinearity test has objective to test the regression model if the
correlation exists between independent variables (Ghozali, 2016).
Multicollinearity usually occurs if there is a large number of independent
variables are incorporated in the regression model. A good regression model
which required to be analyzed is the absence of multicollinearity.
In accordance to Gujarati (2004), there is no multicollinearity which not all
explanatory variables could be constructed as the right linear combination of
the remaining explanatory variables. To find out there is no multicollinearity
found in the research, it has criteria of Variance Inflation Factor (VIF) value
less than 10 or it defined as VIF = 1/T.
3.8 Multiple Regression Analysis
Multiple regression is financial econometric tools to describe and evaluate the
relationship among a continuous outcome variable and one or multiple
independent variables in one equation (Salam, 2008). This research is using
multiple regression analysis since it has six independent variables. The
dependent variable is the profitability (Y) while the GDP (X1), inflation (X2),
CAR (X3), FDR (X4), NPF (X5), and OER (X6). The influence of independent

39
Y = 0 + 1X1 + 2X2 + 3X3 + 4X4 + 5X5 + 6X6 +
variables to dependent variable can be formulated in linear regression equation
as follows:
(Eq. 9)
Where:
Y = Return on Assets
β0 = intercept/constant (value of Y when X1-X7 = 0)
β1− β7 = partial regression coefficients for X1 – X6
X1 = GDP
X2 = Inflation
X3 = CAR
X4 = FDR
X5 = NPF
X6 = OER
= error
The value of partial regression coefficient (X1 – X6) holds an important role as
the basic analysis in this research since it measures the marginal contribution
of independent variable to dependent variable, by holding all other variables
are remain the same (Schwert, 2010). If the partial regression coefficient value
is positive, it concludes there is a direct positive effect between independent
variables and dependent variables. An increment of independent variable will
contribute to the increasing the dependent variable value. On the other hand, if
the partial regression coefficient is negative, it shows the negative effect
which in the increasing of independent variable lead to decreasing value of
dependent variable.
3.9 Hypothesis Testing
In this research, the hypotheses testing aim to analyze how the dependent
variable influenced by independent variables used. There are two types of
hypotheses, namely as null hypothesis (βn 0) which represents by Ho and

40
alternative hypothesis (βn ≠ 0) which represents by Ha. The null hypothesis
determines that there is no significant influence of the independent variable
towards the dependent variable. Vice versa, alternative hypothesis explains
that the independent variable is significantly influence the dependent variable.
3.9.1 Partial Test (t-Test)
The t-test has aim to analyze the partial influence between each of
independent variables (coefficient) towards the dependent variable (Sarwono,
2006). In accordance to Gujarati (2004), the multiple regression formulated as
follows:
(Eq. 10)
Where:
Βi model’s parameter / the intercept and slope coefficients
β^ estimator of βi
Se = standard error
This study uses the significance level of 5% or 0.05 significance value which
has been stated by Santoso (2010). Thus, the basic decision to accept or reject
the null hypothesis can be taken as:
a. Probability of t-statistics > 0.05, Ho is accepted and Ha is rejected,
which means that the independent variable has no significant influence
towards the dependent variable.
b. Probability of t-statistics < 0.05, Ho is rejected and Ha is accepted
which means that the independent variables have significant influence
towards the dependent variable.

41
The t-test will help the researcher to determine the partial influence between
an independent variable toward the dependent variable. The hypotheses of t-
test are:
1. H01 : β1 = 0 or if probability t-statistics > α then there is no significant
partial influence of GDP towards profitability of Sharia rural banks in
Indonesia.
Ha1 : β1 ≠ 0 or if probability t-statistics > α then there is a significant
partial influence of GDP towards profitability of Sharia rural banks in
Indonesia.
2. H02 : β2 = 0 or if probability t-statistics > α then there is no significant
partial influence of inflation towards profitability of Sharia rural banks
in Indonesia.
Ha2 : β2 ≠ 0 or if probability t-statistics > α then there is a significant
partial influence of inflation towards profitability of Sharia rural banks
in Indonesia.
3. H03 : β3 = 0 or if probability t-statistics > α then there is no significant
partial influence of CAR towards profitability of Sharia rural banks in
Indonesia.
Ha3 : β3 ≠ 0 or if probability t-statistics > α then there is a significant
partial influence of CAR towards profitability of Sharia rural banks in
Indonesia.
4. H04 : β4 = 0 or if probability t-statistics > α then there is no significant
partial influence of FDR towards profitability of Sharia rural banks in
Indonesia.
Ha4 : β4 ≠ 0 or if probability t-statistics > α then there is a significant
partial influence of FDR towards profitability of Sharia rural banks in
Indonesia.
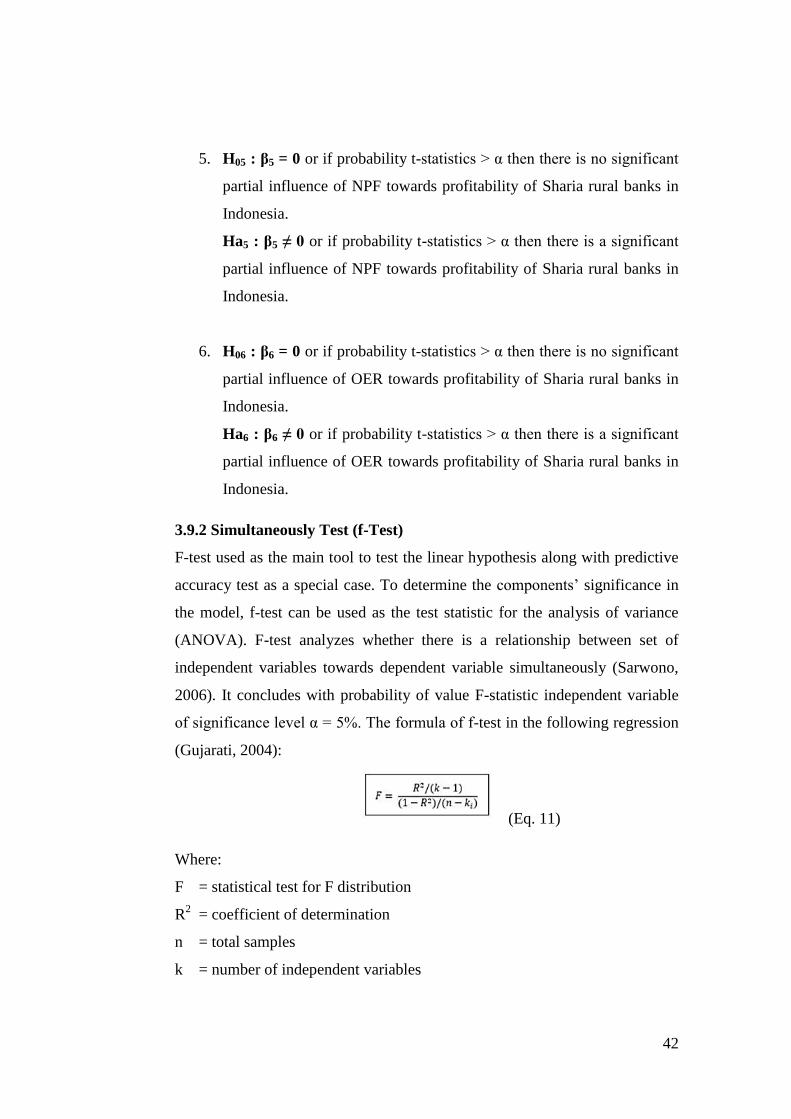
42
5. H05 : β5 = 0 or if probability t-statistics > α then there is no significant
partial influence of NPF towards profitability of Sharia rural banks in
Indonesia.
Ha5 : β5 ≠ 0 or if probability t-statistics > α then there is a significant
partial influence of NPF towards profitability of Sharia rural banks in
Indonesia.
6. H06 : β6 = 0 or if probability t-statistics > α then there is no significant
partial influence of OER towards profitability of Sharia rural banks in
Indonesia.
Ha6 : β6 ≠ 0 or if probability t-statistics > α then there is a significant
partial influence of OER towards profitability of Sharia rural banks in
Indonesia.
3.9.2 Simultaneously Test (f-Test)
F-test used as the main tool to test the linear hypothesis along with predictive
accuracy test as a special case. To determine the components’ significance in
the model, f-test can be used as the test statistic for the analysis of variance
(ANOVA). F-test analyzes whether there is a relationship between set of
independent variables towards dependent variable simultaneously (Sarwono,
2006). It concludes with probability of value F-statistic independent variable
of significance level α 5%. The formula of f-test in the following regression
(Gujarati, 2004):
(Eq. 11)
Where:
F = statistical test for F distribution
R2 = coefficient of determination
n = total samples
k = number of independent variables

43
This research is using 5% level of significance ot 0.05 significance value. As it
has been stated by Santoso (2010), the basic decisions for F-test are:
a. Probability of f-statistics > 0.05, Ho is accepted and Ha is rejected,
which means that all independent variables are not simultaneously
significant towards the dependent variable.
b. Probability of f-statistics < 0.05, Ho is rejected and Ha is accepted
which means that all independent variables are simultaneously
significant towards the dependent variable.
The F-test will help researcher to determine the simultaneous influence of a
set of independent variables towards dependent variable. The hypothesis of F-
test is:
1. H07 : β1 β2 β3 β4 β5 β6 = 0 or if probability f-statistics > α
then there is no significant simultaneous influence of GDP, inflation,
CAR, FDR, NPF and OER towards profitability of Sharia rural banks
in Indonesia.
Ha7 : at least there is one βi ≠ 0 or if probability f-statistics < α then
there is significant simultaneous influence of GDP, inflation, CAR,
FDR, NPF and OER towards profitability of Sharia rural banks in
Indonesia.
3.9.3 Coefficient Determination (Adjusted R2)
Coefficient determination measures how much the percentage of variation of
independent variables which examined the dependent variables variation
(Winarno, 2011). Coefficient determination can be analyzed through R2 to
evaluate the lease squares performance. To have a better measurement it is
best to use adjusted R2 than non-adjusted because it will do the increasing
when the absolute t-value of the added value is more than one, while the non-
adjusted R2 which has non-decreasing function when there is additionally
independent variable (Gujarati, 2004). This study is implementing adjusted R2
in order to find out how strong the dependent variable is influenced by the

44
independent variable (Ghozali, 2016). To calculate the adjusted R2, it uses the
formula as follows (Gujarati, 2004):
(Eq. 12)
Where:
n = total samples
k = number of independent variables
The value of adjusted R2 can range from 0 to 1 (0 < adjusted R
2 < 1).
a. If adjusted R2 is close to 0, it indicates that independent variables (X)
have weak capability to explain dependent variable (Y).
b. If adjusted R2 is close to 1, it indicates that independent variables (X)
have strong capability to explain dependent variable (Y).
The closer the value of coefficient determination value to 1, the more
independent variables is able to influence the dependent variable, by then if
the closer the value of coefficient determination to 1, more information to
predict the variance f the dependent variable will be provided by the
independent variable (Baltagi, 2008).

45
CHAPTER IV
ANALYSIS OF DATA AND INTERPRETATION OF RESULTS
4.1 Company Profile
1. BPRS Dinar Ashri
BPRS Dinar Ashri is one of Sharia rural bank in Indonesia which
established in West Nusa Tenggara to be specified in Mataram, Lombok
Utara. The bank is focusing on two products which are deposits and
financing. BPRS Dinar Ashri has assets for more than IDR 250 Billion.
2. BPRS Al Salaam Amal Salman
PT BPR Amal Salman, known as BPR Al Salaam, was established on
October 9, 1991 at the initiative of the alumni of the Bandung Institute of
Technology (ITB) who were active in the Salman Mosque. The company
established in 1991 with an initial capital of IDR 69,800,000 and 40
shareholders.
3. BPRS Patriot Bekasi
PT BPRS Patriot Bekasi was established on November 30, 2005 based on
PERDA No. 13 of 2005. With an operational permit based on BI
Governor Decree No. 8/62 / KEP. BGI / 2006 On August 31, 2006 and
changed from PD to PT under PERDA No. 5 of 2009. Then, on June 1,
2013, changed the name and logo based on the decision of the GMS and
Decree of the Ministry of Law and Human Rights No. AHU-
60797.AH.01.02 of 2013.
4. BPRS Amanah Ummah
Sharia rural bank Amanah Ummah or BPR Syari'ah Amanah Ummah is
one of Sharia rural bank that grows in Indonesia, especially West Bogor

46
region which operates based on the principles of Sharia which aims to
grow society economy on the basis of Sharia as set forth in Law No. 10 of
1998. In early February 1991 a team was formed to prepare a proposal for
the establishment of the Sharia bank, in July 1991 and got permission
from the Ministry of Finance of the Republic of Indonesia on December
16, 1992.
5. BPRS Buana Mitra Perwira
The establishment of BPRS Buana Mitra Officers began with the idea of
the regent of Purbalingga in the period 2000-2005 Mr. Drs. Triyono Budi
Sasongko about the establishment of Sharia rural bank in Purbalingga to
increase local revenue and support regional autonomy. PT BPRS Buana
Mitra Perwira was inaugurated on June 4, 2004 located at Jalan Jenderal
Soedirman No. 45 Purbalingga and began operations on June 10, 2004.
6. BPRS Sukowati Sragen
The name and form of the legal entity Limited Liability Bank (PT. BPRS)
Sukowati Sragen was formally established as of November 2, 2009, after
obtaining approval from the Ministry of Law and Human Rights and
Bank Indonesia. Previously, the Sragen regency government proposed it
with the issuance of the Regent's Decree No: 518.133 / 67/02/2007
concerning the establishment of the founding team of the Sragen regency
Sharia rural bank on 24 May 2007.
4.2 Descriptive Statistics Analysis
According to (Sugiyono, 2010), descriptive analysis is analysis used to
analyze data by describing collected data as they are without intending to
make conclusions that apply to the general or generalizations. It helps the
researcher to understand and describe the features of a specific set of data by
examining the mean, median, maximum, minimum and standard deviation for
every variable within the research. In this study, there are 152 units of

47
observation for every variable with 8 banks on quarterly basis with the total of
19 quarters started from (2014Q1 – 2018Q3).
Table 4.1 Descriptive Statistics Result
Mean Std. Deviation N
Y 3.6217 2.15651 152
X1 .0509 .00380 152
X2 1.0342 .94496 152
X3 20.8944 14.22135 152
X4 91.7039 38.12872 152
X5 4.5932 3.40273 152
X6 .7561 .48930 152
Source: IBM SPSS Statistics 22
According to the result above, the information of the variables can be
described as follows:
1. Variable Y, profitability which represented by ROA is categorized as
dependent variable. It has a mean value of 3.6217 with standard deviation
of 2.15651. It indicates the data is mostly spread around 2.15651 ±
3.6217. The standard deviation has smaller number than mean shows that
the mean can be used as a representatives of the entire data of variable Y.
2. Variable X1, GDP as independent variable has a mean value of 0.0509
with 0.00380 of standard deviation which determined the data is mostly
spread around 0.00380 ± 0.0509. The standard deviation has smaller
number than mean shows that the mean can be used as a representatives
of the entire data of variable X1.
3. Variable X2, Inflation which categorized as independent variable. It has a
mean value of 1.0342 with standard deviation of 0.94496 which indicates
the data is mostly spread around 0.94496 ± 1.0342. The mean can be used
as the representatives of the entire inflation data since its standard
deviation is lower.

48
4. Variable X3, CAR as independent variable has a 20.8944 of mean value
and 14.22135 of standard deviation value. It could determine that the data
is mostly spread around 14.22135 ± 20.8944. The standard deviation has
smaller number than mean shows that the mean can be used as a
representatives of the entire data of variable X3.
5. Variable X4, FDR which categorized as independent variable. It has a
mean value of 91.7039 with standard deviation of 38.12872 which
indicates the data is mostly spread around 38.12872 ± 91.7039. The
standard deviation helps to determine that the mean used as a
representatives of entire FDR data since it has smaller number than the
mean.
6. Variable X5, NPF as independent variable with 4.5932 of mean value and
3.40273 of standard deviation. It means that the data is mostly spread
around 3.40273 ± 4.5932. Since the standard deviation has smaller
number than mean, thus, the mean can be used as a representatives of the
entire data of variable X5.
7. Variable X6, OER which categorized as independent variable. It has a
mean value of 0.7561 with standard deviation of 0.48930 which indicates
the data is mostly spread around 0.48930 ± 0.7561. The standard
deviation has smaller number than mean shows that the mean can be used
as a representatives of the entire data of OER.
4.3 Data Analysis
4.3.1 Classical Assumption Test
This research use 1 (one) dependent variable and 6 (six) independent variables
which obtained directly from quarterly financial report of Sharia rural banks
listed in Bank Indonesia and Financial Service Authority also from Central

49
Bureau of Statistics for macroeconomic data during period of 2014Q1 to
2018Q3.
1. Normality Test
Normality test generally used to help the researcher to find out whether the
variable used in the research is normally distributed or not (Sugiyono, 2010).
In this research, the researcher use graphic to determine the normality
distribution in the data used.
Figure 4.1 Histogram
Source: IBM SPSS Statistics 22

50
Figure 4.2 Normal P-P Plot Source: IBM SPSS Statistics 22
Accordance to Figure 4.1 and Figure 4.2, it shows both histogram and p-p
plot fulfill the normality test. Histogram shows the normal distribution pattern
also p-p plot graph shows the data spreads around the diagonal line also it
follows the diagonal line’s direction.
2. Heteroscedasticity Test
Heteroscedasticity test is aim to test the residuals disproportion variance
between variables in regression model (Widarjono, 2009). The regression
model is accepted if it homoscedasticity among variables which there is no
heteroscedasticity happen. This research is using graphic analysis to test
heteroscedasticity by looking at scatterplot.

51
Figure 4.3 Scatterplot
Source: IBM SPSS Statistics 22
By looking at the graphic of scatterplot in Figure 4.3, it shows the dots are
spreading randomly, which spreads above or below 0 (zero) value in Y axis
which can be determined as the data is accepted to be used since there is no
heteroscedasticity.
3. Autocorrelation Test
Autocorrelation aims to clarify correlations in data collection among time
series data in the same cross sectional unit on the same variable (Meko, 2013).
Autocorrelation test can be tested by conduction Durbin-Watson statistical test
(Santoso, 2010). Criteria for Durbin Watson as follows:
a. Durbin Watson is less than -2; means there is positive
autocorrelation problem.
b. Durbin Watson is greater than +2; means there is a negative
autocorrelation problem.
c. Durbin Watson is between -2 and +2; means there is no
autocorrelation problem.

52
Table 4.2 Durbin-Watson Test Result
Model Summaryb
Model R R Square
Adjusted R
Square
Std. Error of the
Estimate Durbin-Watson
1 .586a .343 .316 1.78361 1.745
a. Predictors: (Constant), X6, X2, X5, X4, X1, X3
b. Dependent Variable: Y
Source: IBM SPSS Statistics 22
Based on Table 4.2, the result of Durbin-Watson test is more than -2 but less
than +2. It can be concluded that the test shows there is no tendency of the
existence of autocorrelation in this regression model.
4. Multicollinearity Test
The multicollinearity test has objective to test the regression model if there is
correlation between the independent variables (Ghozali, 2016). In this
research, there are 6 independent variables which are GDP, inflation, CAR,
FDR, NPF, and OER. A good regression model which required to be analyzed
is the absence of multicollinearity. To know whether there is multicollinearity
or not in this regression model, it can be determined by looking at the
Variance Inflation Factor (VIF) value.
Table 4.3 Multicollinearity Test Result
Coefficientsa
Model
Collinearity Statistics
Tolerance VIF
1 (Constant)
X1 .634 1.577
X2 .949 1.054
X3 .626 1.598
X4 .758 1.320
X5 .744 1.344
X6 .445 2.245
a. Dependent Variable: Y
Source: IBM SPSS Statistics 22
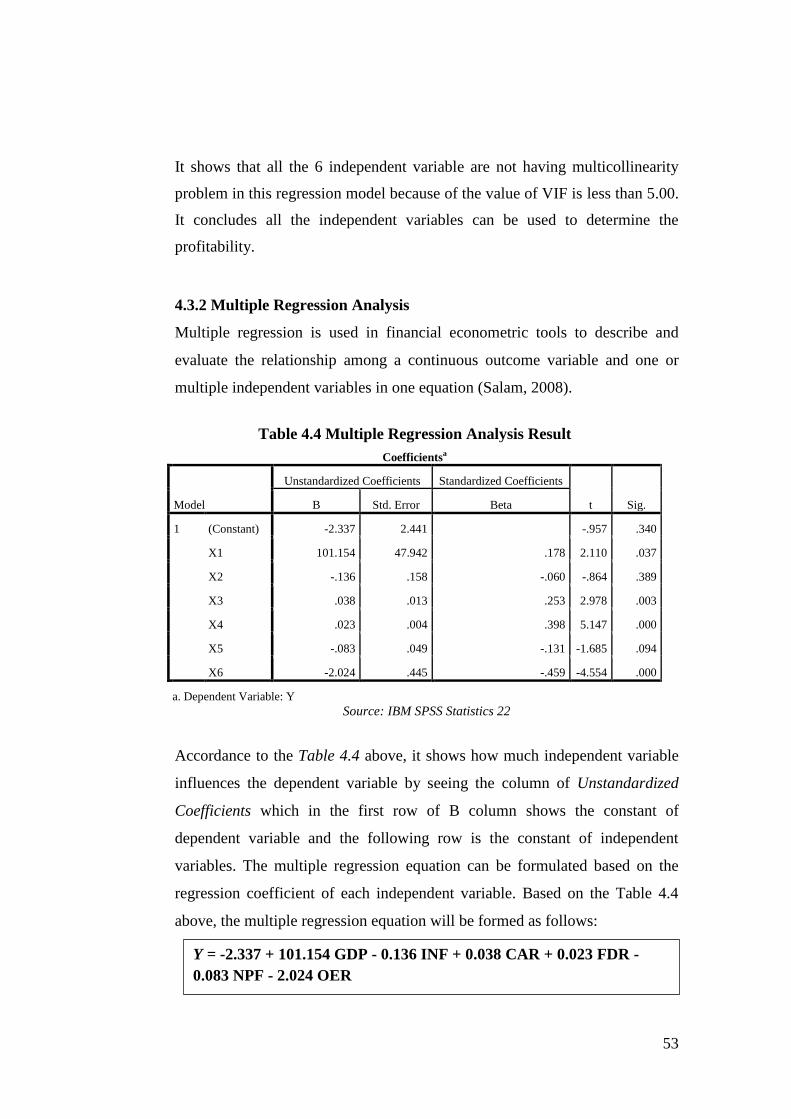
53
It shows that all the 6 independent variable are not having multicollinearity
problem in this regression model because of the value of VIF is less than 5.00.
It concludes all the independent variables can be used to determine the
profitability.
4.3.2 Multiple Regression Analysis
Multiple regression is used in financial econometric tools to describe and
evaluate the relationship among a continuous outcome variable and one or
multiple independent variables in one equation (Salam, 2008).
Table 4.4 Multiple Regression Analysis Result
Coefficientsa
Model
Unstandardized Coefficients Standardized Coefficients
t Sig. B Std. Error Beta
1 (Constant) -2.337 2.441 -.957 .340
X1 101.154 47.942 .178 2.110 .037
X2 -.136 .158 -.060 -.864 .389
X3 .038 .013 .253 2.978 .003
X4 .023 .004 .398 5.147 .000
X5 -.083 .049 -.131 -1.685 .094
X6 -2.024 .445 -.459 -4.554 .000
a. Dependent Variable: Y
Source: IBM SPSS Statistics 22
Accordance to the Table 4.4 above, it shows how much independent variable
influences the dependent variable by seeing the column of Unstandardized
Coefficients which in the first row of B column shows the constant of
dependent variable and the following row is the constant of independent
variables. The multiple regression equation can be formulated based on the
regression coefficient of each independent variable. Based on the Table 4.4
above, the multiple regression equation will be formed as follows:
Y = -2.337 + 101.154 GDP - 0.136 INF + 0.038 CAR + 0.023 FDR -
0.083 NPF - 2.024 OER

54
According to the equation above, it can be described as follows:
1. Constanta with the value of -2.337
It shows that if the independent variables GDP, inflation, CAR, FDR,
NPF and OER are having the value of zero, then the profitability value
will have the value of -2.337.
2. Regression coefficient of GDP = 101.154
Multiple regression model shows that exchange rate has positive
influence towards profitability by 101.154. It means that if the GDP
increase by 1% and the other variables are constant, the profitability will
increase by 101.154%.
3. Regression coefficient of Inflation = -0.136
The coefficient of inflation is -0.136. The negative sign means inflation
has negative influence towards profitability. It explains that every
increase of 1% in the inflation will make the profitability increase by -
0.136% by using assumption that other variables remain constant.
4. Regression coefficient of CAR = 0.038
It defines that CAR is positively influence the profitability by 0.038. In
other word, if the other variables are constant and there is an increase of
1% on CAR, it makes the profitability increase by 0.038%.
5. Regression coefficient of FDR = 0.023
It shows that the FDR has positive influence of 0.023 towards the
profitability. The result explains that every increase of 1% in the FDR
will make the profitability surge by 0.023%, with assumption that the
other variables remain constant.

55
6. Regression coefficient of NPF = -0.083
It defines that NPF has negative influence towards the profitability by
0.083. In other word, if the other variables are constant and there is an
increase of 1% on NPF, it makes the profitability decrease by 0.083%.
7. Regression coefficient of OER = -2.024
The coefficient of OER is -2.024. The negative sign means OER has
negative influence towards profitability. It explains that every increase of
1% in the OER will make the profitability decrease by -2.024% by using
assumption that other variables remain constant.
The result of multiple regression shows that there are two independent
variables; inflation and NPF which have no significant influence to the
dependent variable. Therefore, the equation of multiple regression used in this
study is as follows:
4.4 Hypothesis Testing
4.4.1 Partial Test (t-Test)
The t-test has aim to analyze the partial influence of every independent
variable (coefficient) towards the dependent variable (Sarwono, 2006). By
conducting the t-test, the researcher can compare the probability value from t-
statistics for every independent variable with the significance value of α 5%
or 0.05. Therefore, it could be conclude if the probability of t-statistics is
lower than 0.05 means the independent variable is partially has significant
influence to dependent variable, vice versa. Based on the Table 4.4 of multiple
regression analysis result, it can be concluded as follows.
Y = -2.337 + 101.154 GDP + 0.038 CAR + 0.023 FDR - 2.024 OER

56
1. GDP as X1
GDP has t value of 2.110 with the significant value of 0.037 which is
below than 0.05. It can be concluded that GDP significantly influences
the profitability of Sharia rural banks in Indonesia which means HA1 is
accepted and H01 is rejected. This result helps to identify that the
increasing of GDP will be followed by profitability.
2. Inflation as X2
Inflation has t value of -0.864 with 0.389 of significant value which
greater than 0.05. It concludes that inflation has no significant influence
toward profitability of Sharia rural banks in Indonesia. Thus, HA2 is
rejected and H01 is accepted.
3. CAR as X3
CAR has t value of 2.978 with the significant value of 0.003 which below
than 0.05. It shows CAR has partial significant effect to profitability of
Sharia rural banks in Indonesia. This means HA3 is accepted and H03 is
rejected. It concludes that the increasing of CAR will be followed by
profitability.
4. FDR as X4
FDR has t value of 5.147 with the significant value of 0.000 which below
than 0.05. It means FDR is partially significant influence the profitability
of Sharia rural banks in Indonesia means HA4 is accepted and H04 is
rejected. By then, when FDR is increasing, so does profitability.
5. NPF as X5
NPF has t value of -1.685 with 0.094 of significant value which greater
than 0.05. It concludes that NPF has no significant influence toward
profitability of Sharia rural banks in Indonesia which means HA5 is
rejected and H05 is accepted.

57
6. OER as X6
OER has t value of -4.554 with the significant value of 0.000 which
below than 0.05. It defines that OER significantly influence the
profitability of Sharia rural banks in Indonesia. This leads to HA6 is
accepted and H06 is rejected. It has negative t-value, means the decreasing
of OER leads to the increasing of profitability.
4.4.2 Simultaneously Test (f-Test)
F-test has aim to analyze if there is a relationship between set of independent
variables towards dependent variable simultaneously (Sarwono, 2006). It
concludes with probability of value F-statistic independent variable of
significance level α 5% or 0.05. Therefore, it could be conclude if the
probability of f-statistics is lower than 0.05 means set of independent variables
used in the research are simultaneous significant influence the dependent
variable, vice versa.
Table 4.5 F-Test Result
ANOVAa
Model Sum of Squares df Mean Square F Sig.
1 Regression 240.948 6 40.158 12.623 .000b
Residual 461.284 145 3.181
Total 702.232 151
a. Dependent Variable: Y
b. Predictors: (Constant), X6, X2, X5, X4, X1, X3
Source: IBM SPSS Statistics 22
It shows the value of F is 12.623 with the significant value is 0.000; means it
less than 0.05. By then, it concluded that set of independent variables used in
this research (GDP, inflation, CAR, FDR, NPF and OER) are simultaneous
significant influence the profitability of Sharia rural banks in Indonesia as the
dependent variable in this research. Therefore, Ha is accepted and Ho is
rejected.

58
4.4.3 Coefficient of Determination
Coefficient determination (R2) used to measure how much the percentage of
variation of independent variables which examine the variation of dependent
variables variation (Winarno, 2011). Coefficient determination can be
analyzed through Adjusted R2 since this research uses more than two
independent variables. The result of coefficient of determination is shown
below on Table 4.6.
Table 4.6 Coefficient Determination of Result
Model Summaryb
Model R R Square Adjusted R Square
Std. Error of the
Estimate
Durbin-
Watson
1 .586a .343 .316 1.78361 1.745
a. Predictors: (Constant), X6, X2, X5, X4, X1, X3
b. Dependent Variable: Y
Source: IBM SPSS Statistics 22
Based on the Table 4.6 above, it shows that the adjusted R square is 0.316. It
concluded that all the independent variables, which are GDP, inflation, CAR,
FDR, NPF and OER 31.6% influences simultaneously towards profitability of
Sharia rural banks in Indonesia. The rest of 68.4% is influenced by other
variables which are not examined in this study.
4.5 Interpretation of Results
1. Influence of GDP towards Profitability
The first hypothesis states that “There is significant influence of GDP towards
profitability of Sharia rural banks in Indonesia.” The result shows the
significant value of 0.037, the hypothesis is accepted. GDP has positive
influence towards the profitability, which is indicated by coefficient regression
of 101.154. It means that an increase in GDP leads to increasing in
profitability. GDP is one of the important indicators to determine the
economic growth in a country in a given period, both at current prices and at
constant prices. Amzal (2016) cited that GDP can be considered as the

59
influencer of numerous factors relating to the supply and demand for loans
and deposits which will have either positive or negative influence towards the
level of bank’s profitability.
The theory and this research result align with the previous research conducted
Ali, Maamoor, Yaacob and Gill (2018) found that GDP is positively
influencing the profitability of Islamic banks. The study explained that GDP is
the macroeconomic indicators that commonly used to measure the total
economic activity within the economy among other macroeconomics variable.
In addition, the previous research by Amzal (2016) also said that GDP has
positive significant influence to the profitability.
2. Influence of Inflation towards Profitability
The second hypothesis states that “There is significant influence of inflation
towards profitability of Sharia rural banks in Indonesia.” It shows 0.389 of
significant value means hypothesis is rejected. Inflation might cause the
increasing of price while if the company has the expectation of general
inflation to be higher in the future, the business activities could increase the
prices without suffering a drop in demand for their output. Thus, it will be no
decrease in business activities and has nothing to bank’s performance (Ullah,
2016).
The result is consistent with the theory also the previous research of Chokri &
Anis (2018) and Aslam et al., (2016) whose bot researches show that inflation
statistically has no influence towards banks profitability. It also supported by
(Asadullah, 2017) which believes that the true effects of macroeconomic will
show its function when the economy system of country is develop, mature
also establish.

60
3. Influence of CAR towards Profitability
The third hypothesis states that “There is significant influence of CAR towards
profitability of Sharia rural banks in Indonesia.” It shows significant value of
0.003, this hypothesis is accepted. CAR is positively influence the
profitability, which is indicated by coefficient regression of 0.038. It means
that an increase in CAR leads to increasing in profitability. The theory by
Kuncoro and Suhardjono in Amelia (2014), the capital adequacy ratio is the
amount of equity capital which required to covering the risk of financial loss
that might exist from cultivation of assets are risky. It leads to the greater of
the CAR, the profit of banks will increase, vice versa. This ratio shows how
far all risk-bearing assets come from being financed from the own capital
funds of bank. Additionally, it is to incur source of funds from outside the
bank such as public funds, loans, etc. (Rahim, 2014).
The result is in line with the theory and the previous research by Amelia
(2014) and (Medyawati & Yunanto, 2018) who concluded that CAR
positively influences the profitability of Sharia banks. In addition (Ashraful &
Chowdhury, 2015) also stated that CAR has significant influence towards
profitability. The results are supported with theory which states the higher the
CAR, the stronger the bank's ability to bear the risk of any risky credit or
productive assets. On the other words, the higher the capital adequacy to bear
the risk of bad credit, so that the bank's performance is better, and can increase
public confidence in the bank concerned which leads to increased profitability
(Ubaidillah, 2016).
4. Influence of FDR towards Profitability
The first hypothesis states that “There is significant FDR of inflation towards
profitability of Sharia rural banks in Indonesia.” According to Table 4.4 that
shows significant value of 0.000, this hypothesis is accepted. FDR has positive
influence towards the profitability, which is indicated by coefficient regression
of 0.023. It means that an increase in FDR leads to increasing in profitability.

61
In accordance with the study of Mohammed in (Amelia, 2015), FDR is
released for financing Islamic banks to determine DPK. The higher the FDR,
the higher the funds channeled to DPK. Therefore, by channeling DPK, the
bank's income is large then ROA will increase.
The result from previous research by Yusuf and Surjaatmadja (2018) align
with the result of this research also with the theory. In accordance to the study
of Wardana and Widyarati (2015), the higher FDR will lead to the higher of
bank’s profits. FDR value is the ratio to indicate the bank’s effectiveness in
distributing the financing. Hence, if the FDR value shows the percentage is
too high, it will determine the riskier condition bank’s liquidity, vice versa.
Thus, it is affecting to the profits earned by the bank (Yusuf & Surjaatmadja,
2018). In addition, the research by (Sutrisno, 2016) also stated that FDR has
positive significant influence towards profitability.
5. Influence of NPF towards Profitability
The first hypothesis states that “There is significant NPF of inflation towards
profitability of Sharia rural banks in Indonesia.” According to Table 4.4
which shows significant value of 0.094, this hypothesis is rejected. Cited from
Solihatun (2014), NPF is one of the risks since the greater the amount of
funding compared to the third party fund in a bank bring consequences of the
greater the risk must be borne by the banks. On the other hand, there is PPAP
value which considered could cover the financing problem of the bank.
The result of the previous study by Amelia (2015), Paulin & Wiryono (2015)
and Sutrisno (2016) are align with the result of this study which declared that
NPF has no significance influence toward bank’s profitability. It supported
with the theory stated which the banks’ profit can still be increase by the high
of NPF since the bank is able to obtain the profit not only from the finance
portfolio since PPAP could cover financing problem.

62
6. Influence of OER towards Profitability
The first hypothesis states that “There is significant OER of inflation towards
profitability of Sharia rural banks in Indonesia.” According to Table 4.4
which shows significant value of 0.000, this hypothesis is accepted. OER has
negative influence towards the profitability, which is indicated by coefficient
regression of -2.024. It means that an increase in OER leads to decreasing in
profitability. OER is the measurement of bank’s operational efficiency. By
achieving the efficiency of the bank, the bank must have the lowest level of
OER by then will lead to the higher of profit earned by the bank (Nahar &
prawoto, 2017).
The result is consistent with the research by Paulin and Wiryono (2015). Their
studies found that OER has negatively influence the bank’s profitability. In
addition, the research of Sutrisno (2016) shows OER has negative significant
influence toward profitability. In accordance with Yusuf and Surjaatmadja
(2018), the smaller OER leads to the better bank’s performance. Therefore, if
OER is in high level, it indicates the bank’s capability to manage the
operational expense is lower by then the profit of banks would be decline
(Nahar & Prawoto, 2017).
7. Influence of GDP, inflation, CAR, FDR, NPF and OER towards
Profitability of Sharia rural banks in Indonesia
The hypothesis state that “There is significant simultaneous influence of GDP,
inflation, CAR, FDR, NFP, and OER of Sharia rural banks in Indonesia.” is
accepted. This was proven by the probability value of f-statistic which is
0.000000 < 0.05. All independent variables are simultaneously influence the
dependent variables. GDP, inflation, CAR, FDR, NFP, and OER are able to
explain the variation of profitability by 31.6% while the rest of 68.4% is
influence by other factors which are not examined in this research.
63
The result of adjusted r square shows the independent variables in this
research are having weak capability to determine the dependent variable. The
previous research by Rachmat and Komariah (2017) with the same dependent
variable but focused on CAR, NPF and FDR as independent variables has
0.220 of adjusted r square value. Additionally, Ubaidillah (2016) has adjusted
r square value of 11.60% with profitability as dependent value and CAR,
FDR, NPF, PPAP, OER, share financing, and SBIS as independent variables.
Furthermore, the research conducted by Aslam, Imanullah and Ismail (2016)
with profitability as the dependent variable and has GDP and inflation as the
independent variables shows the adjusted r square value 0.328.
8. The Most Significant Influence Factors towards profitability of Sharia
rural banks in Indonesia
To find out which variable has the most significant influence toward the
profitability of Sharia rural banks in Indonesia can be assessed by looking at
the result of the regression from Table 4.4 the higher of coefficient indicates it
has higher significance toward the dependent variable.
Based on the result which has been ranked, GDP is the most influential factor
with coefficient of 101.154. It followed by followed by CAR with 0.038, FDR
with 0.023 and OER with -2.024. That said GDP influences profitability the
most explained partially by signaling theory. As it has been explained, GDP is
one of the important indicators to determine the economic growth in a country
in a given period, both at current prices and at constant prices.

64
CHAPTER V
CONCLUSIONS AND RECOMMENDATIONS
5.1 Conclusions
The aims of this research are to determine the influence that external and
internal variables have towards the profitability of Sharia rural banks in
Indonesia with the period of 2014Q1 to 2018Q3. By using purposive sampling
method and 6 independent variables, the data observations are formed at 152
units. This research is using IBM SPSS Statistics 22 series to analyze the data
in descriptive statistics analysis, classical assumption test, multiple linear
regression and hypothesis testing.
From the analysis, it can be concluded:
1. From T-test result, significant influence partially for each independent
variable towards dependent variable can be concluded as follows:
a. GDP has positive significant influence towards profitability of Sharia
rural banks in Indonesia. The research found that the average of
selected rural banks in this study has higher returns on assets when
GDP is increasing. Therefore, it can be concluded that the increasing
of GDP leads to the increasing of profitability.
b. Inflation has no significant influence partially towards profitability
of Sharia rural banks in Indonesia.
c. CAR has positive significant influence towards profitability of
Sharia rural banks in Indonesia. The result shows selected Sharia
rural banks in this study averagely has higher profitability if the CAR
increases. It defines that the increasing of CAR leads to the
increasing of profitability.
65
d. FDR has positive significant influence towards profitability of Sharia
rural banks in Indonesia. This study examined the average of
selected rural banks in this study has higher returns on assets when
the FDR of the bank is increasing. Thus, it can be concluded that the
increasing of FDR drags profitability of Sharia rural banks higher.
e. NPF has no significant influence partially towards profitability of
Sharia rural banks in Indonesia.
f. OER is negatively significant influence profitability of Sharia rural
banks in Indonesia. It shows the average of selected rural banks in
this study has higher returns on assets when the OER of the bank is
decreasing. Therefore, it determines the increasing of OER drags
profitability of Sharia rural banks lower.
2. Simultaneously, GDP, inflation, CAR, FDR, NPF and OER are having
significantly influence towards profitability which represents by ROA.
The variation of determinant factors altogether can explain as much as
31.6% of the variation of profitability of Sharia rural banks in Indonesia.
The remaining 68.4% influence factors are caused by the other variables
not examined inside this study.
3. After the independent variables being sorted based on its level of
significant to dependent variable, GDP influences the dependent variable
the most with the highest coefficient, followed by CAR, then FDR, lastly
by OER. That said, GDP influences profitability the most explained
partially by signaling theory.

66
5.2 Recommendations
According the analysis of the study, the researcher would like to suggest
several points related to the respective parties, which are elaborated as
follows:
1. To the respective Sharia rural banks in Indonesia are suggested to fully
concern and to improve the performance of the banks in concern of its
external variable such as GDP their internal variables such as CAR, NPF
and OER, for them to have a higher probability which represents by return
on asset as the aforementioned variables are simultaneously explaining the
variation of profitability.
2. To the future researcher, to extend this research, the researcher suggested
to: 1) add more variety of Sharia rural banks as the unit analysis, 2) add
more independent variables especially the macroeconomics variables also
non-financial factors in order to find out other 68.4% which have not
examined in this study, such as net interest margin, PPAP compliance,
exchange rate, oil prices, money supply, bank size and deposits, and 3)
adjust the length of research horizon. Thus, the researcher expects to the
future researchers to get bigger picture in determining Sharia rural banks
profitability in Indonesia.

67
REFERENCES
Books
Andolfatto, D. (2008). Macroeconomic Theory & Policy 2nd Edition. Canada:
Simon Fraser University.
Garin, J., Lester, R., & Sims, E. (2018). Intermediate Macroeconomics. Indiana:
University of Notre Dame.
Ghozali, I. (2016). Aplikasi Analisis Multivariate dengan Program IBM SPSS 23.
Semarang: BPFE Universitas Diponegoro.
Gujarati, D. N. (2004). Basic Econometrics. 4th Edition. New York: The
McGraw-Hill Companies.
Groppelli, A. A., & Nikbakht, E. (2000). Finance, 4th ed. In Finance, 4th ed. (pp.
444-445). New York: Barron's Educational Series, Inc. .
Kothari, C. R. (2004). Research Methodology. New Delhi: New Age International
(P) Ltd.
Landau, S., & Everitt, B. (2004). A Handbook of Statistical Analyses using SPSS.
United States: Chapman & Hall/CRC Press LLC.
Neuman, W. (2014). Social Research Methods: Qualitative and Quantitative
Approaches. UK: Pearson.
OpenStax College. (2014). Principles of Macroeconomics. Houston: OpenStax
College.
Rivai, V. (2013). Credit Management Handbook - Manajemen Perkreditan cara
Cara Mudah. Jakarta: Rajagrafindo Persada.
Santoso, S. (2010). Statistik Multivariat. Jakarta: PT. Elex Media Komputindo.
Sarwono, J. (2006). Metode Penelitian Kuantitatif dan Kualitatif. Yogyakarta:
Graha Ilmu.
Schwert, G. W. (2010). Eviews7 User's Guide II. USA: Quantitative Micro
Software.
Sekaran, U., & Bougie, R. (2011). Research Methods for Business. Great Britain:
Wiley.

68
Sugiyono. (2010). Metode Penelitian Kuantitatid Kualitatif dan R&D. Bandung:
Alfabeta.
Tennant, J. (2009). Principles of Macroeconomics Study Guide 4th Edition. South
Melbourne: Cengage Learning Australia.
Totton, N., & White, P. (2011). The Ubiquitous Mythical Normal Distribution.
England: University of the West of England.
Weiss, N. (2012). Introductory Statistics. USA: Wiley.
Widarjono, A. (2009). Ekonometrika Pengantar dan Aplikasinya Edisi Ketiga.
Yogyakarta: Ekonisia.
Winarno, W. W. (2011). Analisis Ekonometrika dan Statistika dengan Eviews
Edisi Ketiga. Yogyakarta: Unit Penerbit dan Percetakan (UPP STIM
YKPN).
Journals / Articles / Reports / Working Papers / Theses
Agustiyani. (2014, March 6). April, OJK Keluarkan Peraturan Kesehatan Bank
Syariah . Retrieved November 11, 2018, from Berita Satu:
http://www.beritasatu.com/
Ali, Q., & Maamor, S. (2018). Impact of Macroeconomic Variables on Islamic
Banks Profitability. Journal of Accounting and Applied Business
Research, Vol. 1, No. 2, 1-16.
Amelia, E. (2015). Financial Ratio and Its Influence to Profitability in Islamic
Banks. Al-Iqtishad: Vol. VII No.2 , 230-240.
Amzal, C. (2016). The Impact of Macroeconomic Variables on Indonesia Islamic
Banks Profitability. Jurnal Ekonomi dan Bisnis Islam, 71-86.
Anto, & Wibowo, M. G. (2012). Faktor-Faktor Penentu Tingkat Profitabilitas
Bank Umum Syariah di Indonesia. La Riba Jurnal Ekonomi Islam, Vol VI
(2), 147-160.
Asadullah. (2017). Banks determinants of Profitability of Islamic Banks of
Pakistan - A case Study on pakistan's Islamic Banking Sector.
International Conference on Advances in Business, Management and Law
(pp. 61-73). Dubai: Creative Commons Attribution.

69
Ashraful, M., & Chowdhury, F. (2015). Which is more important in terms of
Profitability of Islamic Banks: Bank Specific factors or Macroeconomic
factors? An Empirical Study on Malaysian Islamic Banks. European
Journal of Islamic Finance, 1-8.
Aslam, M. K., Inamullah, & Ismail, M. (2016 ). Determinants Affecting the
Profitability of Islamic Banks: Evidence from Pakistan . International
Journal of Operations and Logistics Management , 115-127 .
Badan Pusat Statistik. (2016). Produk Domestik Bruto. Jakarta: Badan Pusat
Statistik.
Baltagi, B. H. (2008). Forecasting with Panel Data. Journal of Forecasting, 153-
173.
Bank Indonesia. (2018, July 31). Inflasi. Retrieved November 1, 2018, from Bank
Indonesia : https://www.bi.go.id
Barus, A. C., & Leliani. (2013). Analisis Faktor-Faktor yang Mempengaruhi
Profitabilitas pada Perusahaan Manufaktur yang Terdaftar di Bursa Efek
Indonesia. Jurnal Wira Ekonomi Mikroskil Volume 3, Nomor 02, Oktober,
111-121.
Chokri, T., & Anis, E. A. (2018). Measuring the Financial Performance of Islamic
Banks in Selected Countries. Journal of Business & Financial Affairs, 1-5.
Christaria, F., & Kurnia, R. (2016). The Impact of Financial Ratios, Operational
Efficiency and Non-Performing Loan Towards Commercial Bank
Profitability. Accounting and Finance Review, 43-50.
detikfinance. (2015, April 14). Menkeu Bambang: Bank Syariah Lebih Tahan
Menghadapi Krisis. Retrieved October 3, 2018, from Detik Finance:
https://finance.detik.com/moneter/d-2886801/menkeu-bambang-bank-
syariah-lebih-tahan-menghadapi-krisis
El-Ansary, O. A., & Hafez, H. (2015). Deteminants of Capital Adequacy Ratio:
An Empirical Study on Egyptian Banks. Corporate Ownership & Control,
806-816.
Fatima, N. (2014). Capital Adequacy: A Financial Soundness Indicator for Banks.
Global Journal of Finance and Management, 771-776.
Firmansyah, I. (2014). Determinant of Non-Performing Loan: The Case of Islamic
Bank in Indonesia. Monetary, Economics and Banking, 251-268.

70
Gau, C.-Y., & Stadtherr, M. A. (2002). Deterministic global optimization for
error‐ in‐ variables parameter estimation. AIChE, 1192-1197.
Hakim, L., & Sugianto. (2018). Determinant Profitability and Implications on the
Value of the Company: Empirical Study on Banking Industry in IDX.
International Journal of Economics and Financial, 205-216.
Hidayati, A. N. (2014). Pengaruh Inflasi, BI Rate dan Kurs terhadap Profitabilitas
Bank Syariah di Indonesia. AN-NISBAH, Vol. 01, No. 01,, 73 - 97.
Hosen, M. N., & Rahmawati, R. (2016). Efficiency and Profitability on
Indonesian Islamic Banking Industry. Al-Iqtishad: Jurnal Ilmu Ekonomi
Syariah (Journal of Islamic Economics) Volume 8 (1), 33 - 48.
Islam, R., Ghani, A. B., Mahyudin, E., & Manickam, N. (2017). Determinants of
Factors that Affecting Inflation in Malaysia. International Journal of
Economics and Financial Issues, 355-364.
Johnston, M. P. (2014). Secondary Data Analysis: A Method of which the Time
Has Come. Qualitative and Quantitative Methods in Libraries, 619-626.
Karimah, S. (2016). Kajian Efisiensi Bank Umum Syariah di Indonesia dan
Faktor-Faktor yang Mempengaruhinya. Bogor: Institut Pertanian Bogor.
Khan, W. A., & Sattar, A. (2014). Impact of Interest Rate Changes on the
Profitability of four Major Commercial Banks in Pakistan. International
Journal of Accounting and Financial Reporting Vol.4 No.1, 142-154.
Kira, A. R. (2013). The Factors Affecting Gross Domestic Product (GDP) in
Developing Countries: The Case of Tanzania. European Journal of
Business and Management, 148-158.
Laucereno, S. F. (2018, March 2). Sejarah Berdirinya Bank Syariah di Indonesia.
Retrieved October 3, 2018, from Detik Finance:
https://finance.detik.com/moneter/d-3894544/sejarah-berdirinya-bank-
syariah-di-indonesia
Lemiyana, & Litriani, E. (2016). Pengaruh NPF, FDR, BOPO terhadap Return on
Asset (ROA) pada Bank Umum Syariah. I-Economic, 31-49.
Lestari, E. P., & Mulazid, A. S. (2018). Islamic Bank Efficieny: A Comparative
Study Between Indonesia and Pakistan. International Conference on
Islamic Finance, Economics and Business Volume 2018 (pp. 33-55).
Jakarta: KnE Social Sciences.

71
Matar, A., & Eneizan, B. M. (2018). Determinants of Financial Performance in
the Industrial Firms: Evidence from Jordan. Agricultural Extension,
Economics & Sociology, 1-10.
Mawaddah, N. (2015). Faktor-Faktor yang Mempengaruhi Profitabilitas Bank
Syariah. Etikonomi Vol 14 (2), 241-256.
Medyawati, H., & Yunanto, M. (2018). The Effects of FDR, BOPO and Profit
Sharing on the Profitability of Islamic Banks in Indonesia. International
Journal of Economics, Commerce and Management, 811-825.
Meko, D. M. (2013). Applied Time Series Analysis. Retrieved 2018, from GEOS
585A: https://www.ltrr.arizona.edu/
Muslim Pro. (2018, September 25). Top 10 Populasi Umat Muslim Terbesar di
Dunia. Retrieved October 4, 2018, from Muslim Pro - Bantuan:
https://support.muslimpro.com/hc/id/articles/115002006087-Top-10-
Populasi-Umat-Muslim-Terbesar-di-Dunia
Nahar, F. H., & Prawoto, N. (2017). Bank's Profitability in Indonesia: case Study
of Islamic Banks Period 2008-2012. Jurnal Ekonomi & Studi
Pembangunan, 164-172.
Otoritas Jasa Keuangan. (2016). Surat Edaran Otoritas Jasa Keuangan Nomor
52/SEOJK.03/2016. Jakarta: Otoritas Jasa Keuangan.
Otoritas Jasa Keuangan. (2017). Roadmap Pengembangan keuangan Syariah
Indonesia 2017 - 2019. Jakarta: Otoritas Jasa Keuangan.
Otoritas Jasa Keuangan. (2017). Statistik Perbankan Syariah. Jakarta: Otoritas
Jasa Keuangan.
Otoritas Jasa Keuangan. (2018). Booklet Perbankan Indonesia 2018. Jakarta:
Otoritas Jasa Keuangan.
Otoritas Jasa Keuangan. (2018). Snapshot Perbankan Syariah Indonesia Juni
2018. Jakarta: Otoritas Jasa Keuangan.
Otoritas Jasa Keuangan. (2018). Statistik Perbankan Syariah Juli 2018. 2018:
Otoritas Jasa Keuangan.
Paulin, O., & Wiryono, S. K. (2015). Determinants of Islamic Bank's Profitability
in Indonesia for 2009 - 2013. Journal of Business and Management, 175-
185.

72
Rachmat, A. B., & Komariah, E. (2017). Faktor-Faktor Yang Mempengaruhi
Profitabilitas Pada Bank Umum Syariah Periode 2010-2015. Insan
Akuntan, 17-34.
Rahim, B. N. (2014). Pengaruh Rasio Kecukupan Modal (Capital Adequacy
Ratio) yang Memperhitungkan Risiko Kredit dan Risiko Pasar terhadap
Profitabilitas, Fungsi Intermediasi dan Risiko Perbankan. Jurnal Sosial
Ekonomi Pembangunan Vol 12, 245-262.
Rahman, M. E. (2015). Uji Ketahanan Krisis Terhadap perbankan Syariah di
Indonesia dengan Ukuran IBC (Index Banking Crisis) Tahun Periode 2006
- 2012. JEBIS Vol. 1, No. 1, 79.
Riyadi, S., & Yulianto, A. (2014). Pengaruh Pembiayaan Bagi Hasil, Pembiayaan
Jual Beli, Financing to Deposit Ratio (FDR) dan Non Performing
Financing (NPF) terhadap Profitabilitas Bank Umum Syariah di Indonesia.
Accounting Analysis Journal, Vol. 3 No. 4, 466-474.
Semuel, H., & Nurina, S. (2015). Analysis of the Effect of Inflation, Interest
Rates, and Exchange Rates on Gross Domestic Product (GDP) in
Indonesia. Proceedings of the International Conference on Global
Business, Economics, Finance and (pp. 1-13). Bangkok: Global Business
Research .
Solihatun. (2014). Analisis Non-Performing Financing (NPF) Bank Umum
Syariah di Indonesia Tahun 2007-2012. Jurnal Ekonomi Pembanguna, 58-
68.
Sriyana, J. (2015). Islamic banks' profitability amid the competitive financing in
Indonesia. International Journal of Applied Business and Economic
Research, 1695-1710.
Sultan, D. A. (2014). Financial Statements Analysis - Measurement of
Performance and Profitability: Applied Study of Baghdad Soft-Drink
Industry. Finance and Accounting, 49-56.
Sutrisno. (2016). Risk, Efficiency, and Performance of Islamic Banking:
Empirical Study on Islamic Bank in Indonesia. Asian Journal of Economic
Modelling, 47-56.
Ubaidillah. (2016). Analisis Faktor-Faktor yang Mempengaruhi Profitabilitas
Bank Syariah di Indonesia. Jurnal Ekonomi Islam, 151-188.

73
Ullah, N. (2016). Influencing Factors of Profitability on the Banking Industry: A
case study of GCC countries. International Centre for Education in
Islamic Finance , 1-22.
Wahyu, D. R. (2016). Financing to Deposit Ratio (FDR) sebagai Salah Satu
Penilaian Kesehatan Bank Umum Syariah (Study Kasus Pada Bank BJB
Syariah Cabang Serang). Jurnal Ekonomi Keuangan dan Bisnis Islam, 19-
36.
Williams, R. (2015). Heteroskedasticity. Indiana: University of Notre Dame.
Yogianta, C. W. (2013). Analisis Pengaruh CAR, NIM, LDR, NPL, dan BOPO
terhadap Profitabilitas Studi pada Bank Umum yang Go Public di Bursa
Efek Indonesia Periode Tahun 2002-2010. Jurnal Bisnis STRATEGI, 94-
111.
Yusuf, M., & Surjaatmadja, S. (2018). Analysis of Financial Performance on
Profitability with Non Performance Financing as Variable Moderation
(Study at Sharia Commercial Bank in Indonesia Period 2012–2016).
International Journal of Economics and Financial Issues, 126-132.

74
APPENDICES
Appendix 1. Raw Data for Sharia Rural Banks
Performance Determinants
BPRS Year ROA GDP INF CAR FDR NPF OER
Dinar Ashri - Kota Mataram 2014Q1 3.00 0.051 1.41 31 58 4.47 0.68
Dinar Ashri - Kota Mataram 2014Q2 3.00 0.050 0.57 30 94 3.9 0.62
Dinar Ashri - Kota Mataram 2014Q3 4.21 0.049 1.67 32 86 3.79 0.59
Dinar Ashri - Kota Mataram 2014Q4 3.00 0.050 4.43 30 65 3.83 0.54
Dinar Ashri - Kota Mataram 2015Q1 3.30 0.047 -0.43 29 82.18 3.47 0.55
Dinar Ashri - Kota Mataram 2015Q2 3.32 0.047 1.4 28 101 3.41 0.55
Dinar Ashri - Kota Mataram 2015Q3 3.31 0.047 1.27 27 93.22 3.62 0.54
Dinar Ashri - Kota Mataram 2015Q4 3.67 0.050 1.09 27 87.15 3.6 0.51
Dinar Ashri - Kota Mataram 2016Q1 3.00 0.049 0.61 27 87 4.45 0.57
Dinar Ashri - Kota Mataram 2016Q2 3.00 0.052 0.45 27 93 4.75 0.58
Dinar Ashri - Kota Mataram 2016Q3 3.00 0.050 0.89 27 93 4.19 0.58
Dinar Ashri - Kota Mataram 2016Q4 3.26 0.049 1.03 27 89.55 3.87 0.53
Dinar Ashri - Kota Mataram 2017Q1 2.49 0.050 1.18 27 86 5.35 0.64
Dinar Ashri - Kota Mataram 2017Q2 2.79 0.050 1.17 21 88.8 4.66 0.57
Dinar Ashri - Kota Mataram 2017Q3 3.39 0.051 0.28 14 92.48 3.21 0.52
Dinar Ashri - Kota Mataram 2017Q4 4.06 0.052 0.92 14 88.98 2.72 0.47
Dinar Ashri - Kota Mataram 2018Q1 5.00 0.051 0.9 14 92 2.38 0.46
Dinar Ashri - Kota Mataram 2018Q2 5.00 0.053 0.05 13 95 1.89 0.42
Dinar Ashri - Kota Mataram 2018Q3 5.00 0.052 0.76 14 85 2.39 0.41
Al Salaam Amal Salman – Kota Depok 2014Q1 2.87 0.051 1.41 13.74 88.61 5.83 0.77
Al Salaam Amal Salman – Kota Depok 2014Q2 2.18 0.050 0.57 13.49 87.78 6.01 0.81
Al Salaam Amal Salman – Kota Depok 2014Q3 2.16 0.049 1.67 13.89 81.35 5.01 0.84
Al Salaam Amal Salman – Kota Depok 2014Q4 2.23 0.050 4.43 14.57 78.7 4.58 0.86
Al Salaam Amal Salman – Kota Depok 2015Q1 2.02 0.047 -0.43 16.33 76.11 4.7 0.79
Al Salaam Amal Salman – Kota Depok 2015Q2 1.63 0.047 1.4 13.59 78.33 5.11 0.86
Al Salaam Amal Salman – Kota Depok 2015Q3 1.06 0.047 1.27 13.5 80.94 4.58 0.87
Al Salaam Amal Salman – Kota Depok 2015Q4 1.81 0.050 1.09 13.39 78.69 4.35 0.87
Al Salaam Amal Salman – Kota Depok 2016Q1 1.92 0.049 0.61 17.98 77.56 5.91 0.77
Al Salaam Amal Salman – Kota Depok 2016Q2 2.14 0.052 0.45 16.31 78.12 6.11 0.83
Al Salaam Amal Salman – Kota Depok 2016Q3 2.30 0.050 0.89 16.19 77.15 6.43 0.83
Al Salaam Amal Salman – Kota Depok 2016Q4 2.04 0.049 1.03 15.33 76.78 4.63 0.85
Al Salaam Amal Salman – Kota Depok 2017Q1 2.38 0.050 1.18 16.94 74.09 4.25 0.79
Al Salaam Amal Salman – Kota Depok 2017Q2 2.45 0.050 1.17 15.02 78.19 4.26 0.82
Al Salaam Amal Salman – Kota Depok 2017Q3 2.66 0.051 0.28 15.07 78.02 4.55 0.81

75
Al Salaam Amal Salman – Kota Depok 2017Q4 2.00 0.052 0.92 15 76 4.71 0.83
Al Salaam Amal Salman – Kota Depok 2018Q1 2.00 0.053 0.9 16 74 5.48 0.85
Al Salaam Amal Salman – Kota Depok 2018Q2 2.00 0.052 0.05 15 73 3.97 0.86
Al Salaam Amal Salman – Kota Depok 2018Q3 2.00 0.060 0.76 14 74 3.20 0.84
Patriot Bekasi – Kota Bekasi 2014Q1 3.00 0.051 1.41 75 2 20.95 0.73
Patriot Bekasi – Kota Bekasi 2014Q2 2.94 0.050 0.57 74.92 2.69 20.34 0.70
Patriot Bekasi – Kota Bekasi 2014Q3 3.18 0.049 1.67 71.16 2.58 22.02 0.68
Patriot Bekasi – Kota Bekasi 2014Q4 4.68 0.050 4.43 73.94 216.42 9.89 0.74
Patriot Bekasi – Kota Bekasi 2015Q1 0.05 0.07 -0.43 1.66 12.55 0.74 3.08
Patriot Bekasi – Kota Bekasi 2015Q2 0.05 0.07 1.4 70.63 11.21 0.71 4.04
Patriot Bekasi – Kota Bekasi 2015Q3 0.05 0.07 1.27 86.73 12.33 0.63 3.8
Patriot Bekasi – Kota Bekasi 2015Q4 0.05 0.05 1.09 77.99 7.49 0.68 3.59
Patriot Bekasi – Kota Bekasi 2016Q1 1.00 0.049 0.61 61 75 9.51 0.77
Patriot Bekasi – Kota Bekasi 2016Q2 3.20 0.052 0.45 45.8 10.88 6.26 0.72
Patriot Bekasi – Kota Bekasi 2016Q3 3.00 0.050 0.89 35 51 5.53 0.70
Patriot Bekasi – Kota Bekasi 2016Q4 2.73 0.049 1.03 36.9 76.82 4.68 0.71
Patriot Bekasi – Kota Bekasi 2017Q1 1.28 0.050 1.18 35.98 64.9 3.62 0.82
Patriot Bekasi – Kota Bekasi 2017Q2 2.58 0.050 1.17 32.32 89.63 3.58 0.73
Patriot Bekasi – Kota Bekasi 2017Q3 2.63 0.051 0.28 35.05 96.05 3.54 0.72
Patriot Bekasi – Kota Bekasi 2017Q4 2.61 0.052 0.92 23.47 98.09 1.96 0.71
Patriot Bekasi – Kota Bekasi 2018Q1 2.00 0.053 0.9 23 100 2.63 0.74
Patriot Bekasi – Kota Bekasi 2018Q2 3.00 0.052 0.05 17 97 2.58 0.73
Patriot Bekasi – Kota Bekasi 2018Q3 3.00 0.060 0.76 14 108 2.41 0.66
Amanah Ummah – Bogor 2014Q1 3.56 0.051 1.41 11.77 75.78 1.33 0.64
Amanah Ummah – Bogor 2014Q2 4.57 0.050 0.57 12.58 87.43 1.42 0.64
Amanah Ummah – Bogor 2014Q3 4.09 0.049 1.67 14.68 76.18 1.29 0.70
Amanah Ummah – Bogor 2014Q4 4.01 0.050 4.43 15.33 78.82 0.87 0.71
Amanah Ummah – Bogor 2015Q1 3.66 0.047 -0.43 14.8 80.59 2.07 0.63
Amanah Ummah – Bogor 2015Q2 3.46 0.047 1.4 14.52 82.3 2.66 0.67
Amanah Ummah – Bogor 2015Q3 3.54 0.047 1.27 15.98 72.87 3.46 0.71
Amanah Ummah – Bogor 2015Q4 4.00 0.050 1.09 15 83 1.7 0.71
Amanah Ummah – Bogor 2016Q1 3.61 0.049 0.61 14.42 79.65 1.39 0.70
Amanah Ummah – Bogor 2016Q2 3.64 0.052 0.45 14.53 85.81 1.73 0.70
Amanah Ummah – Bogor 2016Q3 3.59 0.050 0.89 14.75 75.82 1.67 0.72
Amanah Ummah – Bogor 2016Q4 3.58 0.049 1.03 15.89 78.35 1.72 0.71
Amanah Ummah – Bogor 2017Q1 3.66 0.050 1.18 14.8 80.59 2.07 0.67
Amanah Ummah – Bogor 2017Q2 3.46 0.050 1.17 14.52 82.3 2.66 0.69
Amanah Ummah – Bogor 2017Q3 3.54 0.051 0.28 15.98 72.87 3.46 0.70
Amanah Ummah – Bogor 2017Q4 3.40 0.052 0.92 16.01 77 3.31 0.70
Amanah Ummah – Bogor 2018Q1 3.00 0.053 0.9 15 73 3.42 0.65
Amanah Ummah – Bogor 2018Q2 4.00 0.052 0.05 14 76 3.68 0.65

76
Amanah Ummah – Bogor 2018Q3 4.00 0.060 0.76 15 68 3.82 0.66
Harta Insan Karimah Cibitung 2014Q1 7.75 0.051 1.41 21.77 268.17 2.4 0.57
Harta Insan Karimah Cibitung 2014Q2 8.29 0.050 0.57 23.92 246.27 3.23 0.55
Harta Insan Karimah Cibitung 2014Q3 7.66 0.049 1.67 24.53 206.34 3.75 0.57
Harta Insan Karimah Cibitung 2014Q4 7.16 0.050 4.43 22.54 165.75 7.16 0.60
Harta Insan Karimah Cibitung 2015Q1 7.27 0.047 -0.43 30.22 194.3 2.39 0.56
Harta Insan Karimah Cibitung 2015Q2 7.04 0.047 1.4 25.24 207 2.6 0.52
Harta Insan Karimah Cibitung 2015Q3 7.89 0.047 1.27 28.04 207 2.81 0.51
Harta Insan Karimah Cibitung 2015Q4 4.00 0.050 1.09 24.24 209 2.05 0.52
Harta Insan Karimah Cibitung 2016Q1 18.46 0.049 0.61 31.75 116 3.66 0.54
Harta Insan Karimah Cibitung 2016Q2 3.00 0.052 0.45 24 90 3.73 0.50
Harta Insan Karimah Cibitung 2016Q3 8.49 0.050 0.89 26 90 2.25 0.50
Harta Insan Karimah Cibitung 2016Q4 4.73 0.049 1.03 29.33 93 2.07 0.45
Harta Insan Karimah Cibitung 2017Q1 7.71 0.050 1.18 18.61 95.32 2.3 0.53
Harta Insan Karimah Cibitung 2017Q2 7.90 0.050 1.17 18.02 99.58 2.29 0.52
Harta Insan Karimah Cibitung 2017Q3 7.74 0.051 0.28 18.47 97.55 2.73 0.50
Harta Insan Karimah Cibitung 2017Q4 7.76 0.052 0.92 18.38 98.82 2 0.49
Harta Insan Karimah Cibitung 2018Q1 8.00 0.053 0.9 20 101 1.95 0.48
Harta Insan Karimah Cibitung 2018Q2 7.00 0.052 0.05 17 105 2.08 0.53
Harta Insan Karimah Cibitung 2018Q3 8.00 0.060 0.76 17 103 2.02 0.52
Buana Mitra Perwira Purbalingga 2014Q1 0.42 0.051 1.41 13.06 83.65 5.29 0.86
Buana Mitra Perwira Purbalingga 2014Q2 1.16 0.050 0.57 14.52 89.23 4.91 0.82
Buana Mitra Perwira Purbalingga 2014Q3 1.44 0.049 1.67 11.24 104.04 4.22 0.83
Buana Mitra Perwira Purbalingga 2014Q4 2.62 0.050 4.43 15 80.39 2.72 0.77
Buana Mitra Perwira Purbalingga 2015Q1 7.37 0.047 -0.43 14 90.73 3.97 0.78
Buana Mitra Perwira Purbalingga 2015Q2 2.99 0.047 1.4 15 90.93 6.13 0.82
Buana Mitra Perwira Purbalingga 2015Q3 3.28 0.047 1.27 15 83.89 7.42 0.81
Buana Mitra Perwira Purbalingga 2015Q4 2.48 0.050 1.09 16 70.74 5.73 0.79
Buana Mitra Perwira Purbalingga 2016Q1 3.27 0.049 0.61 15.18 70.44 7.46 0.75
Buana Mitra Perwira Purbalingga 2016Q2 4.00 0.052 0.45 15 82 7.35 0.74
Buana Mitra Perwira Purbalingga 2016Q3 3.15 0.050 0.89 15.65 80.41 5.33 0.85
Buana Mitra Perwira Purbalingga 2016Q4 2.47 0.049 1.03 15.65 70.77 3.44 0.82
Buana Mitra Perwira Purbalingga 2017Q1 2.92 0.050 1.18 17.39 78.18 5.99 0.79
Buana Mitra Perwira Purbalingga 2017Q2 3.29 0.050 1.17 15.1 78.3 6.58 0.82
Buana Mitra Perwira Purbalingga 2017Q3 2.70 0.051 0.28 18.97 75.87 7.69 0.93
Buana Mitra Perwira Purbalingga 2017Q4 2.63 0.052 0.92 15.58 70.84 5.39 0.73
Buana Mitra Perwira Purbalingga 2018Q1 3.00 0.053 0.9 20 79 10 0.72
Buana Mitra Perwira Purbalingga 2018Q2 4.00 0.052 0.05 15 102 10.1 0.73
Buana Mitra Perwira Purbalingga 2018Q3 5.00 0.060 0.76 15 83 9.88 0.75
Sukowati Sragen 2014Q1 4.11 0.051 1.41 12.55 118.45 6.73 0.68
Sukowati Sragen 2014Q2 4.00 0.050 0.57 12.37 110.14 7.22 0.69

77
Sukowati Sragen 2014Q3 3.85 0.049 1.67 12.32 105.28 12.35 0.68
Sukowati Sragen 2014Q4 4.00 0.050 4.43 13 110 10.14 0.70
Sukowati Sragen 2015Q1 3.87 0.047 -0.43 16.46 105.1 12.65 0.72
Sukowati Sragen 2015Q2 3.85 0.047 1.4 16.76 119.36 14.16 0.70
Sukowati Sragen 2015Q3 4.05 0.047 1.27 17.15 112.62 8.97 0.73
Sukowati Sragen 2015Q4 4.00 0.050 1.09 16 109 5.02 0.70
Sukowati Sragen 2016Q1 3.92 0.049 0.61 16.03 93.11 4.63 0.70
Sukowati Sragen 2016Q2 4.00 0.052 0.45 15 106 6.54 0.65
Sukowati Sragen 2016Q3 3.84 0.050 0.89 16.13 100.6 7.81 0.66
Sukowati Sragen 2016Q4 3.00 0.049 1.03 14 106 5.12 0.67
Sukowati Sragen 2017Q1 3.55 0.050 1.18 12.66 105.56 4.7 0.69
Sukowati Sragen 2017Q2 3.61 0.050 1.17 11.51 94.53 5.76 0.64
Sukowati Sragen 2017Q3 3.39 0.051 0.28 12.65 87.9 6.21 0.64
Sukowati Sragen 2017Q4 3.29 0.052 0.92 11.61 95.51 5.65 0.68
Sukowati Sragen 2018Q1 3.00 0.053 0.9 11 102 6.22 0.68
Sukowati Sragen 2018Q2 3.00 0.052 0.05 11 105 7.35 0.66
Sukowati Sragen 2018Q3 3.00 0.060 0.76 13 94 8.29 0.66
Harta Insan Karimah Parahyangan 2014Q1 1.38 0.051 1.41 21.91 103.29 1.94 0.63
Harta Insan Karimah Parahyangan 2014Q2 2.49 0.050 0.57 16.38 102.09 2.27 0.68
Harta Insan Karimah Parahyangan 2014Q3 3.64 0.049 1.67 16.28 102.44 2.29 0.67
Harta Insan Karimah Parahyangan 2014Q4 4.20 0.050 4.43 12.17 102.07 2.05 0.68
Harta Insan Karimah Parahyangan 2015Q1 0.98 0.047 -0.43 11.38 101.65 5.23 0.68
Harta Insan Karimah Parahyangan 2015Q2 1.84 0.047 1.4 11.85 100.71 2.65 0.70
Harta Insan Karimah Parahyangan 2015Q3 2.68 0.047 1.27 12.26 100.78 2.63 0.70
Harta Insan Karimah Parahyangan 2015Q4 3.46 0.050 1.09 12.44 97.89 2.29 0.68
Harta Insan Karimah Parahyangan 2016Q1 0.73 0.049 0.61 12.7 100.19 2.44 0.74
Harta Insan Karimah Parahyangan 2016Q2 1.64 0.052 0.45 12.56 96.55 2.1 0.68
Harta Insan Karimah Parahyangan 2016Q3 2.73 0.050 0.89 13.39 96.03 2.33 0.67
Harta Insan Karimah Parahyangan 2016Q4 3.63 0.049 1.03 14.07 92.34 2.14 0.66
Harta Insan Karimah Parahyangan 2017Q1 1.03 0.050 1.18 14.21 94.99 2.44 0.65
Harta Insan Karimah Parahyangan 2017Q2 4.43 0.050 1.17 14.12 95.39 2.37 0.64
Harta Insan Karimah Parahyangan 2017Q3 4.62 0.051 0.28 14.43 92.09 3.07 0.62
Harta Insan Karimah Parahyangan 2017Q4 4.60 0.052 0.92 14.75 85.05 2.76 0.62
Harta Insan Karimah Parahyangan 2018Q1 5.00 0.053 0.9 14 88 2.92 0.58
Harta Insan Karimah Parahyangan 2018Q2 5.00 0.052 0.05 14 93 2.99 0.61
Harta Insan Karimah Parahyangan 2018Q3 5.00 0.060 0.76 15 91 3.05 0.62