the detection of financial statement fraud using the
TRANSCRIPT

International Journal of Research in Social Sciences Vol. 10 Issue 12, December 2020
ISSN: 2249-2496 Impact Factor: 7.081
Journal Homepage: http://www.ijmra.us, Email: [email protected] Double-Blind Peer Reviewed Refereed Open Access International Journal - Included in the International Serial Directories Indexed &
Listed at: Ulrich's Periodicals Directory ©, U.S.A., Open J-Gate as well as in Cabell’s Directories of Publishing Opportunities, U.S.A
34 International Journal of Research in Social Sciences
http://www.ijmra.us, Email: [email protected]
The Detection of Financial Statement Fraud
Using the Beneish Ratio Index on “Go Public Companies"
Alfian Maase
ABSTRACT
Fraud is an act which is carried out deliberately and it is carried out for the personal
or other peoples’ purposes, where the action causes losses to certain parties or institutions.
Fraud in financial statement on the one hand can provide benefits for the businessmen
because they can overstate their resultsand financial condition so that their financial
statements look good at the public view. The existence of fraud has serious consequences,
and brings many losses. The consequence is that the fraud detection becomes an important
issue.
This research aimed to: (1) Knowing the percentage of manufacturing companies
listed on the Indonesia Stock Exchange in 2017-2018 classified as Manipulators; (2)
Knowing the percentage of manufacturing companies listed on the Indonesia Stock
Exchange 2017-2018 classified as Non-Manipulators; (3) Knowing the percentage of
manufacturing companies listed on the Indonesia Stock Exchange in 2017-2018 classified
as Grey Companies. The object of this research was all the manufacturing companies listed
on the Indonesia Stock Exchange which published their audited financial statements in
2018, which were 132 (one hundred and thirty two) companies in total.
The sampling technique used was non-probability method-purposive judgment
sampling, where the sample was determined based on the certain criteria determined by the
writer and limited in terms of generalization. The research sample was 67 (sixty seven)
companies. The method of the data collection used softcopy download on the Indonesia
Stock Exchange website www.idx.co.id. The data analysis technique used was quantitative
descriptive analysis using the Beneish Ratio Index. The variables in this study were Days
Sales in Receivables Index (DSRI), Gross Margin Index (GMI), Asset Quality Index
(AQI), Sales Growth Index (SGI), and Total Accruals to Total Assets Index (TATA).
The test results could be concluded that 3 companies or 4.48% of the companies
sample were classified as Manipulators who had to be the given administrative sanctions
(fines) thus they would not make the same mistake in the next period, and 44 companies or
65.67% of the companies sample were classified as Non-Manipulators. This showed that
these companies had a commitment not to harm other parties by not committing fraud or
manipulation of their financial reports, and 20 companies or 29.85% of companies sample
were classified Gray Companies, in which these companies sample were not included in
the Manipulators, and Non-Manipulators category.
Keywords : Manipulators, Non-Manipulators, Beneish Ratio Index

ISSN: 2249-2496Impact Factor: 7.081
35 International Journal of Research in Social Sciences
http://www.ijmra.us, Email: [email protected]
INTRODUCTION
Background
The publication of financial statement is generally intended to provide information
about the company's financial position, performance and cash flow. Financial statement is
useful for most report users in order to make the economic decisions and show the
management accountability for the use of resources entrusted to them (IAI,
2014).Therefore, the businessmen must be able to provide a right and relevant information
and be free from the fraud which will greatly mislead the users of financial statement in the
decision-making process.
Fraud is an act which is carried out deliberately and it is carried out for the personal
or other peoples’ purposes, where the action causes losses to certain parties or institutions.
This fraud is an act that is outside the corridors of generally accepted accounting
principles. Fraud includes the illegal acts which are intentionally carried out, and hidden,
then obtaining the benefits by converting the cash or other valuables. These actions are
done both internally and externally, on purpose, and in secret.
Related to the financial statement, fraud is defined as an intentional act that causes
a material misstatement in financial statement (Generally Accepted Auditing Standard -
GAAS, 2012). The misstatement contained in fraud financial statement is an intentional
misstatement to deceive the users of it. The Sources of this misstatement include
manipulation or falsification of accounting records, misstatement or intentional omission
from financial statements, and misapplication of accounting principles. Fraud in financial
statement on the one hand can provide benefits for the businessmen because they can
overstate their results and financial condition so that their financial statements look good at
the public view. Conversely, the increase of financial statement fraud is also very
detrimental to the publics who rely heavily on their decision making based on it.
The Financial statement fraud scandals at the corporate level have occurred
everywhere. In the United States, capital market players and society in general were
shocked by accounting fraud scandals involving large companies such as Enron
Corporation, WorldCom, Xerox, Tyco, Qwest, and others. Enron Corporation made a fraud
by boosting the profits and hiding more than $ 1 billion debt by using off-the-books
partnerships, manipulating the electricity and energy markets in Texas and California. The
scandal caused a market capitalization loss of $ 70 billion which devastated a large number
of investors, employees and retirees.

ISSN: 2249-2496Impact Factor: 7.081
36 International Journal of Research in Social Sciences
http://www.ijmra.us, Email: [email protected]
In Indonesia, the accounting fraud also occurs in many companies, both private and
government companies. On December 6 2012, it was announced that Indonesia's score in
the Corruption Perception Index (CPI) was 32 and was ranked 118th
out of 176 countries
measured for the level of corruption (Transparency International, 2012). This thing can be
seen from many cases related to the corruption issues and fraudulent practices such as the
liquidation of several banks, the submission of BUMN and private management to the
court, banking crime cases, tax manipulation, and others.
In 2001, there was a fraud scandal committed by PT. Kimia Farma Tbk. PT.Kimia
Farma is a pharmaceutical industry company whose shares have been traded on the stock
exchange so that it has become a public company. Based on the indications by the Ministry
of BUMN and Bapepam's examination, it was found that there was a misstatement in the
financial statement which resulted in an overstatement of net income on 31stDecember
2001 by Rp 32.7 billion, which was 2.3% of sales and 24.7%. of net income. This
misstatement occurred by overestimating the sales and inventory in 3 business units, and it
was done by inflating the inventory price that had been authorized by the production
director to determine the inventory value in the distribution unit of PT.Kimia Farma on 31st
December 2001. In addition, the management of PT.Kimia Farma also made double
records of sales in 2 business units which were carried out in units that were not sampled
by the external auditors.
The occurrence of undetectable fraud can give the disadvantage and defect effects
for the financial statement process. The existence of fraud has serious consequences and
brings many losses. The consequence is that the fraud detection becomes an important
issue. The ability to identify the fraud quickly becomes a necessity. However, the detection
of financial statement fraud does not always get a bright spot because of the various
motivations that underlie it and there are many methods to assess the existence of the
fraud. According to Cressey's theory (quoted by James A. Hall and Tommie Singleton,
2007), there are three conditions that are always present in fraud, they are pressure,
opportunity, and rationalization. These three conditions are risk factors for fraud in various
situations.
Messod D. Beneish in his article "The Detection of Earnings Manipulation"
(Financial Analysts Journal, Sept-Oct 1999) conducted a study on the quantitative
difference between public companies that manipulated financial statement and companies
that did not. Beneish used financial statement data from all companies listed in the
COMPUSTAT database 1989-1992. Beneish indicates that the possibility of manipulation

ISSN: 2249-2496Impact Factor: 7.081
37 International Journal of Research in Social Sciences
http://www.ijmra.us, Email: [email protected]
is characterized by a tremendous increase in receivables, worsening gross margins,
decreasing assets, growing sales, and increasing accruals. Beneish used the variable Days
Sales in Receivables Index (DSRI), Gross Margin Index (GMI), Asset Quality Index
(AQI), Sales Growth Index (SGI), Depreciation Index (DEPI), Sales General And
Administrative Expenses Index (SGAI), Leverage Index (LVGI), and Total Accruals to
Total Assets Index (TATA), as predictors to detect the manipulation. By using these
variables, Beneish was able to identify that 76% of the sample companies manipulated
their financial statement. Beneish states that the variables DSRI, GMI, AQI, SGI, and
TATA are significant variables in detecting the possibility of manipulation and are able to
distinguish between Manipulator Companies and Non-Manipulator Companies.
Similar research was also conducted by Joseph T. Wells (2001), published in his
article entitled "Irrational Ratios". Wells used the Beneish Ratio Index to reveal the cases
of financial statement fraud committed by the carpet cleaning company in the United
States "ZZZ Best Carpet Cleaning Service”, which occurred in the mid-1980s. From the
results of his research, it was evident that Barry Minkow's company deceived investors and
auditors in a financial statement fraud scheme that reached $ 100 million.
Beneish (1999) suggests the use of accounting variables considered to signal future
prospects as a technique for detecting the manipulation. This technique is based on the idea
of the importance of company information that can capture the nature of the company's
operations or activities economically and has a detection capability which makes sense
economically(Yavida, 2001). Based on the description above, the title of the proposed
research is "The Detection of Financial Statement Fraud Using the Beneish Ratio Index on
Go Public Companies"
Problem Formulations
Based on the background of the problems stated above, the problem formulations in
this study were as follows :
1. How many companies on the IDX which were classified as Manipulators?
2. How many companies on the IDX which were classified as Non-Manipulators?
3. How many companies on the IDX which were classified as Gray Companies?
Problem Limitation
This research was only limited to the manufacturing companies listed on the
Indonesia Stock Exchange in 2017 and 2018.

ISSN: 2249-2496Impact Factor: 7.081
38 International Journal of Research in Social Sciences
http://www.ijmra.us, Email: [email protected]
Research purposes
Based on the problem formulation above, it could be seen that the objectives of this
study were as follows:
1. Knowing the companies on the IDX which were classified as Manipulators
2. Knowing the companies on the IDX which were classified as Non-Manipulators
3. Knowing the companies on the IDX which were classified as Gray Companies
Research Benefits
The benefits of this research were detailed as follows :
1. Theoretical Benefits
The results of this study were expected to be a consideration for the parties conducting
a research about “The Detection of Financial Statement Fraud Using the Beneish Ratio
Index on Go Public Companies".
2. Practical Benefits :
a. For the writer :
It was expected to be able to implement the accounting knowledge that had
been obtained and studied during the lecturing process and to develop the
researcher's insights, especially in detecting the financial statement fraud of
the manufacturing companies.
b. For the Company
The results of this study could be a warning, thus the management did not
commit a fraud in their financial statement presentation.
c. For Investors and Creditors
The results of this study were expected to contribute ideas in making
economic decisions and provide information about which companies listed
on the Indonesia Stock Exchange (BEI) were classified as Manipulators,
which companies were classified as Non-Manipulators, and which was the
Gray Companies.
d. Financial Service Authority
It could be used as a reference in conducting a supervision of companies
listed on the Indonesia Stock Exchange (IDX).
Previous Research
Yavida Norim and Indra Wijaya Kusuma (2001) research entitled “The Use of
Accounting Variables to Detect Earnings Management”. This study aimed to detect the
manipulations carried out by the management or called earnings management using

ISSN: 2249-2496Impact Factor: 7.081
39 International Journal of Research in Social Sciences
http://www.ijmra.us, Email: [email protected]
accounting variables which were considered to have signals of future prospects, they were
the Days Sales in Receivables Index (DSRI), Gross Margin Index (GMI), Asset Quality
Index ( AQI), Sales Growth Index (SGI).
Elang Widya Prakoso (2009) with the title "Ratio Index Analysis to Detect
Fraud/Deviation Financial Statement (Case Study of companies listed on the Indonesia
Stock Exchange in December 2007)". The purpose of this study was to determine which
companies listed on the IDX in December 2007 classified as Manipulators and which
companies classified as Non Manipulators.
Putri Fabelli (2011) entitled "Analysis of 'Indexes' (Beneish Ratio Index) to Detect
Fraud in the Financial Statement of Manufacturing Companies listed on the IDX in
December 2008". The purpose of this study was to determine the percentage of
manufacturing companies listed on the Indonesia Stock Exchange in December 2008
which were classified as Manipulators and which were classified as Non Manipulators.
THEORETICAL BASIS
Definition of Fraud
Taking something belonging to another person illegally can be done by forcibly
taking the property of another person using a weapon so that the item is given, or by
cunning (deceptive). In the Oxford English Dictionary, fraud (fraud) is a criminal act of
cheating by using the false representations to gain an unfair advantage or forcibly take the
rights or interests of others.
Financial statement
The financial condition and the operation results of the company reflected in the
company's financial statement are essentially the final results of the company's accounting
activities. According to Irham Fahmi (2012: 22), "The financial statement is information
describing the condition of a company, which in turn becomes information describing the
performance of a company".
Financial Statement Fraud
Rezaee (2005) quoted by Ratna Wardhani (2012) defines fraud in financial
statements, “Financial statement fraud is a deliberate attempt by corporations to deceive or
mislead users of published financial statements, especially investors and creditors, by
preparing and disseminating materially misstated financial statements”.

ISSN: 2249-2496Impact Factor: 7.081
40 International Journal of Research in Social Sciences
http://www.ijmra.us, Email: [email protected]
RESEARCH METHOD
Type of Data
The type of research used in this research was descriptive quantitative research.
Descriptive research is a research conducted to determine the value of the independent
variable, either one or more (independent) variables without making comparisons, or
connecting with other variables (Sugiyono, 2012).
Descriptive research aims to describe the nature of something that is taking place at
the time the research is conducted and examine the causes of a particular symptom, based
on the data obtained. This study used quantitative data, which was the data in the form of
numbers because it referred to the calculations such as financial statements in 2017 and
2018.
Source of Data
The source of data used in this study was secondary data by taking the financial
statement data of manufacturing companies listed on the Indonesia Stock Exchange in
2018.
Method of Data Collection
The data used in this study were in the form of financial statement of
manufacturing companies listed on the Indonesia Stock Exchange (IDX) in 2018. The data
was obtained from downloading the softcopy of the issuer's financial statement on the
Indonesia Stock Exchange (BEI) website www.idx.co.id.
Data Analysis Method
This study used the Ratio Index analysis method to the company's financial
statement data which became the sample. The ratio index calculation was intended to
determine the category of a company classified as Manipulators or Non-Manipulators.
Companies were categorized as Manipulators or Non-Manipulators if they obtained the
ratio index value according to the parameter index of the Beneish Model.
Population and Sample
1. Population
The population in this study was all manufacturing companies listed on the
Indonesia Stock Exchange (IDX) publishing their audited financial statement in 2018.
Manufacturing companies (processing industry) on the Indonesia Stock Exchange (IDX)
included 54 basic industrial and chemical companies sector, 41 various industry companies
sector, and 37 consumer goods industry companies sector. The population was 132

ISSN: 2249-2496Impact Factor: 7.081
41 International Journal of Research in Social Sciences
http://www.ijmra.us, Email: [email protected]
companies obtained from downloading softcopy of financial statements of issuers on the
Indonesia Stock Exchange (BEI) website.
2. Sample
The determination of the sample in this study was carried out by means of non-
probability purposive judgment sampling, where the sample was determined based on
certain criteria determined by the writer and had limitations in terms of generalization.
Some of the criteria in determining the sample were as follows:
a. The manufacturing company issued a consolidated financial statement
(audited) on December 31, 2018.
b. The manufacturing company announced a profit on December 31, 2018.
c. The manufacturing company experienced an increase in sales from 2017 to
2018. According to Beneish (1999), the possibility of manipulation can be
indicated by an increase in sales.
d. The manufacturing company experienced an increase in profits from 2017
to 2018. Beneish (1999) indicates that an increase in earnings also indicates
the possibility of manipulation.
Operational Definition of Research Variables
The research variable is the object of research or what is the point of attention of a
study. The variable used in this study was a single variable, which was the detection of
financial statement fraud using the Beneish Ratio Index. According to Beneish (1999)
there are 5 (five) significant variables to predict the existence of manipulation in financial
statement, these variables are:
1. Days Sales in Receivables Index (DSRI)
DSRI is the ratio of the sale day number in the receivable account at the first year
of manipulation (year t) to the previous year measurement (year t-1).
𝑫𝑺𝑹𝑰 = 𝑨𝒄𝒄𝒐𝒖𝒏𝒕𝒔 𝑹𝒆𝒄𝒆𝒊𝒗𝒂𝒃𝒍𝒆𝒕 ∶ 𝑺𝒂𝒍𝒆𝒔𝒕
𝑨𝒄𝒄𝒐𝒖𝒏𝒕𝒔 𝑹𝒆𝒄𝒆𝒊𝒗𝒂𝒃𝒍𝒆𝒕−𝟏 ∶ 𝑺𝒂𝒍𝒆𝒔𝒕−𝟏
2. Gross Margin Index(GMI)
GMI is the gross ratio margin in the previous year (year t-1) to the gross margin in
the first year of manipulation (year t).
𝑮𝑴𝑰 =
𝑺𝒂𝒍𝒆𝒔𝒕−𝟏∶ 𝑪𝒐𝒔𝒕 𝑶𝒇 𝑺𝒂𝒍𝒆𝒔𝒕−𝟏
𝑺𝒂𝒍𝒆𝒔𝒕−𝟏𝑺𝒂𝒍𝒆𝒔𝒕∶ 𝑪𝒐𝒔𝒕 𝑶𝒇 𝑺𝒂𝒍𝒆𝒔𝒕
𝑺𝒂𝒍𝒆𝒔𝒕
ISSN: 2249-2496Impact Factor: 7.081
42 International Journal of Research in Social Sciences
http://www.ijmra.us, Email: [email protected]
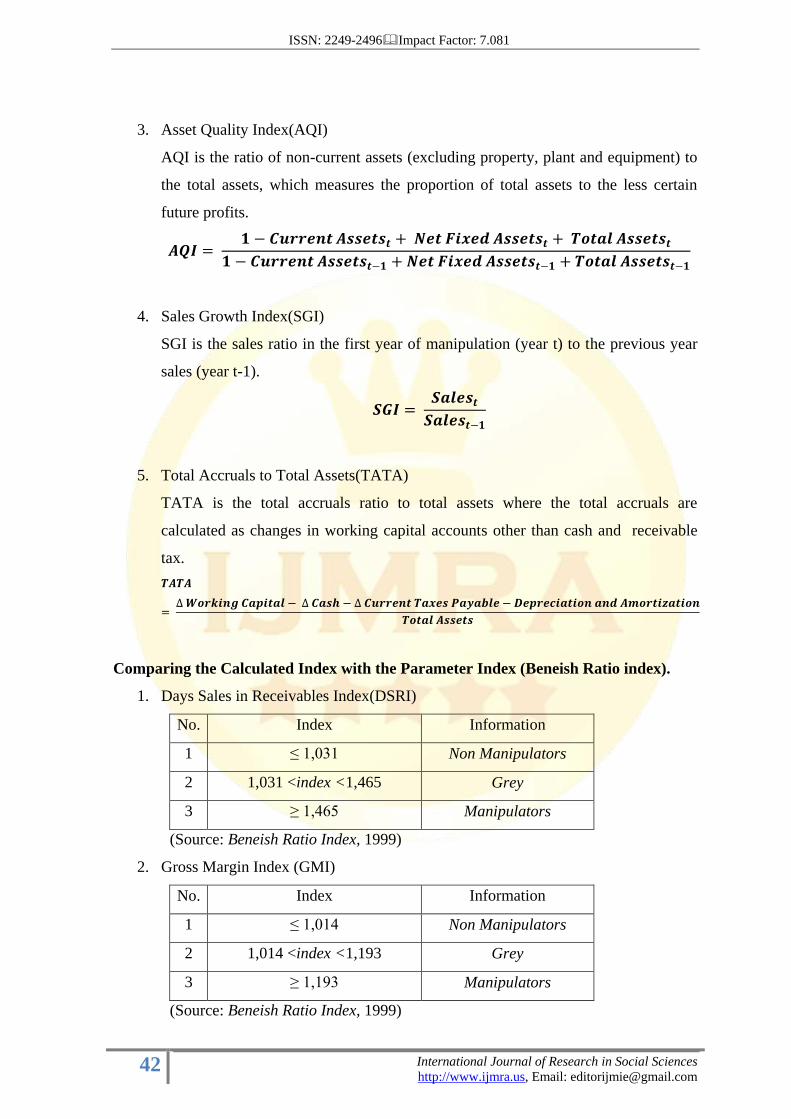
3. Asset Quality Index(AQI)
AQI is the ratio of non-current assets (excluding property, plant and equipment) to
the total assets, which measures the proportion of total assets to the less certain
future profits.
𝑨𝑸𝑰 = 𝟏 − 𝑪𝒖𝒓𝒓𝒆𝒏𝒕 𝑨𝒔𝒔𝒆𝒕𝒔𝒕 + 𝑵𝒆𝒕 𝑭𝒊𝒙𝒆𝒅 𝑨𝒔𝒔𝒆𝒕𝒔𝒕 + 𝑻𝒐𝒕𝒂𝒍 𝑨𝒔𝒔𝒆𝒕𝒔𝒕
𝟏 − 𝑪𝒖𝒓𝒓𝒆𝒏𝒕 𝑨𝒔𝒔𝒆𝒕𝒔𝒕−𝟏 + 𝑵𝒆𝒕 𝑭𝒊𝒙𝒆𝒅 𝑨𝒔𝒔𝒆𝒕𝒔𝒕−𝟏 + 𝑻𝒐𝒕𝒂𝒍 𝑨𝒔𝒔𝒆𝒕𝒔𝒕−𝟏
4. Sales Growth Index(SGI)
SGI is the sales ratio in the first year of manipulation (year t) to the previous year
sales (year t-1).
𝑺𝑮𝑰 = 𝑺𝒂𝒍𝒆𝒔𝒕𝑺𝒂𝒍𝒆𝒔𝒕−𝟏
5. Total Accruals to Total Assets(TATA)
TATA is the total accruals ratio to total assets where the total accruals are
calculated as changes in working capital accounts other than cash and receivable
tax.
𝑻𝑨𝑻𝑨
= ∆ 𝑾𝒐𝒓𝒌𝒊𝒏𝒈 𝑪𝒂𝒑𝒊𝒕𝒂𝒍 − ∆ 𝑪𝒂𝒔𝒉 − ∆ 𝑪𝒖𝒓𝒓𝒆𝒏𝒕 𝑻𝒂𝒙𝒆𝒔 𝑷𝒂𝒚𝒂𝒃𝒍𝒆 − 𝑫𝒆𝒑𝒓𝒆𝒄𝒊𝒂𝒕𝒊𝒐𝒏 𝒂𝒏𝒅 𝑨𝒎𝒐𝒓𝒕𝒊𝒛𝒂𝒕𝒊𝒐𝒏
𝑻𝒐𝒕𝒂𝒍 𝑨𝒔𝒔𝒆𝒕𝒔
Comparing the Calculated Index with the Parameter Index (Beneish Ratio index).
1. Days Sales in Receivables Index(DSRI)
No. Index Information
1 ≤ 1,031 Non Manipulators
2 1,031 <index <1,465 Grey
3 ≥ 1,465 Manipulators
(Source: Beneish Ratio Index, 1999)
2. Gross Margin Index (GMI)
No. Index Information
1 ≤ 1,014 Non Manipulators
2 1,014 <index <1,193 Grey
3 ≥ 1,193 Manipulators
(Source: Beneish Ratio Index, 1999)

ISSN: 2249-2496Impact Factor: 7.081
43 International Journal of Research in Social Sciences
http://www.ijmra.us, Email: [email protected]
3. Asset Quality Index(AQI)
No. Index Information
1 ≤ 1,039 Non Manipulators
2 1,039 <index <1,254 Grey
3 ≥ 1,254 Manipulators
(Source: Beneish Ratio Index, 1999)
4. Sales Growth Index(SGI)
No. Index Information
1 ≤ 1,134 Non Manipulators
2 1,134 <index <1,607 Grey
3 ≥ 1,607 Manipulators
(Source: Beneish Ratio Index, 1999)
5. Total Accruals to Total Assets (TATA)
No. Index Information
1 ≤ 0,018 Non Manipulators
2 0,018 <index <0,031 Grey
3 ≥ 0,031 Manipulators
(Source: Beneish Ratio Index, 1999)
Determining the Companies Classified as Manipulators or Non-Manipulators
According to the Classification Criteria.
1. Companies having ≥ 3 (three) calculated indexes in accordance with the parameter
index stating Manipulators were classified as Manipulators Companies.
2. Companies having ≥ 3 (three) calculated indexes in accordance with the parameter
index which stated Non-Manipulators were classified as Non-Manipulators
Companies.
3. Companies having ≥ 3 (three) calculated indexes that corresponded to the
parameter index which stated gray, and the calculated index that did not fulfill the 2
(two) criteria for the classification of Manipulators and Non-Manipulators were
classified as Gray Companies.

ISSN: 2249-2496Impact Factor: 7.081
44 International Journal of Research in Social Sciences
http://www.ijmra.us, Email: [email protected]
Calculating the Percentage Numbers of Companies Classified as Manipulators or
Non Manipulators.
a. Manipulator Companies
𝑴𝒂𝒏𝒊𝒑𝒖𝒍𝒂𝒕𝒐𝒓 = 𝑵𝒖𝒎𝒃𝒆𝒓 𝒐𝒇 𝑴𝒂𝒏𝒊𝒑𝒖𝒍𝒂𝒕𝒐𝒓 𝑪𝒐𝒎𝒑𝒂𝒏𝒊𝒆𝒔
𝑻𝒐𝒕𝒂𝒍 𝑺𝒂𝒎𝒑𝒍𝒆𝒔 𝒙 𝟏𝟎𝟎%
b. Non-Manipulator Companies
𝑵𝒐𝒏 𝑴𝒂𝒏𝒊𝒑𝒖𝒍𝒂𝒕𝒐𝒓
= 𝑵𝒖𝒎𝒃𝒆𝒓 𝒐𝒇 𝑵𝒐𝒏 −𝑴𝒂𝒏𝒊𝒑𝒖𝒍𝒂𝒕𝒐𝒓 𝑪𝒐𝒎𝒑𝒂𝒏𝒊𝒆𝒔
𝑻𝒐𝒕𝒂𝒍 𝑺𝒂𝒎𝒑𝒍𝒆𝒔 𝒙 𝟏𝟎𝟎%
c. Grey Companies
𝑮𝒓𝒆𝒚 = 𝑵𝒖𝒎𝒃𝒆𝒓 𝒐𝒇 𝑮𝒓𝒆𝒚 𝑪𝒐𝒎𝒑𝒂𝒏𝒊𝒆𝒔
𝑻𝒐𝒕𝒂𝒍 𝑺𝒂𝒎𝒑𝒍𝒆𝒔 𝒙 𝒙 𝟏𝟎𝟎%
RESEARCH RESULT and DISCUSSION
The Indonesian Capital Market was established in Jakarta on December 14 1912.
The Indonesian Stock Exchange (IDX) was founded long before the independence of
Indonesia by the Dutch Indies government, organized by Vereniging voor de
effectenhandel, which at that time was still called the Jakarta Stock Exchange (BEJ)
(Fahmi, 2012).
Description of Research Data
The data used in this study were secondary data obtained from the official website
of the Indonesia Stock Exchange (www.idx.co.id) and the literatures supporting this
research. The criteria for companies which were become as the population were all the
companies included in the category of manufacturing companies (processing industry) in
2018, which were 132 companies. Based on the characteristics of the sample selection
above, there were 67 companies that would be used as the research samples. The following
table presented the results of sample selection using a non-probability method - purposive
judgment sampling.
Research result
This study aimed to determine which companies classified as Manipulators, and
which companies classified as Non-Manipulators. The objects studied were all
manufacturing companies listed on the Indonesia Stock Exchange (IDX) in 2018 with

ISSN: 2249-2496Impact Factor: 7.081
45 International Journal of Research in Social Sciences
http://www.ijmra.us, Email: [email protected]
some of the criteria mentioned previously, thus the final sample obtained was 67
companies.
Based on the financial statement data from the 67 sample companies, then the
calculation of the ratio index (index count) for each company was carried out. The
calculation results of the ratio index were then adjusted to the parameter index according to
the Beneish Model. This calculation was intended to determine the category of a company,
whether the company was classified as a Manipulator Company or a Non-Manipulator
Company.
The results of the companies classification classified to 67 companies were
presented in the following table:
Group of Manipulator Companies
No ISSUER DSRI GMI AQI SGI TATA CATEGORY
1 JPRS M M N G M Manipulators
2 LMSH G N M M M Manipulators
3 SPMA M M M N N Manipulators
(Source: Data Processed Results in 2019)
Group of Non-Manipulator Companies
No ISSUER DSRI GMI AQI SGI TATA CATEGORY
1 SMCB N N N G N Non Manipulators
2 SMGR N G N G N Non Manipulators
3 ARNA N G N N N Non Manipulators
4 ALKA M N N N M Non Manipulators
5 MYRX N N M M N Non Manipulators
6 PICO N G N N M Non Manipulators
7 BUDI N N N G M Non Manipulators
8 ETWA G N G N N Non Manipulators
9 SRSN G N N N M Non Manipulators
10 TPIA N M N G N Non Manipulators
11 UNIC N N N G N Non Manipulators
12 BRNA N N N G N Non Manipulators
13 ALDO N N N N G Non Manipulators

ISSN: 2249-2496Impact Factor: 7.081
46 International Journal of Research in Social Sciences
http://www.ijmra.us, Email: [email protected]
14 INKP N M G N N Non Manipulators
15 TKIM N N N N N Non Manipulators
16 IMAS N G N G N Non Manipulators
17 INDS N N N G M Non Manipulators
18 SMSM N N N G N Non Manipulators
19 ADMG G N N G N Non Manipulators
20 ERTX M N N N M Non Manipulators
21 ESTI N N N G M Non Manipulators
22 RICY G N M N N Non Manipulators
23 IKBI N N N G M Non Manipulators
24 KBLM G N N G N Non Manipulators
25 SCCO N N N G N Non Manipulators
26 VOKS N N M G N Non Manipulators
27 CEKA N N N M N Non Manipulators
28 DLTA N N N G N Non Manipulators
29 ICBP G G N N N Non Manipulators
30 INDF N G N G N Non Manipulators
31 MLBI G N M N N Non Manipulators
32 SKLT G N N N N Non Manipulators
33 RMBA G N N N N Non Manipulators
34 DVLA N N G N M Non Manipulators
35 INAF G N N G N Non Manipulators
36 KAEF N N N N M Non Manipulators
37 KLBF G N N N N Non Manipulators
38 PYFA G N M N N Non Manipulators
39 TSPC N N G N N Non Manipulators
40 MBTO N N N G M Non Manipulators
41 TCID N G N N M Non Manipulators
42 UNVR G N N G N Non Manipulators
43 KDSI G N N N M Non Manipulators
44 LMPI N G N G N Non Manipulators
(Source: Data Processed Results in 2019)

ISSN: 2249-2496Impact Factor: 7.081
47 International Journal of Research in Social Sciences
http://www.ijmra.us, Email: [email protected]
Group of Grey Companies
No ISSUER DSRI GMI AQI SGI TATA CATEGORY
1 INTP G G G G N Grey
2 AMFG G G G N N Grey
3 TOTO G G M G N Grey
4 INAI G G N G N Grey
5 LION G G G G M Grey
6 TBMS N G M G N Grey
7 TRST N G M G G Grey
8 CPIN G G M G M Grey
9 MAIN G G N G M Grey
10 ASII G G N G N Grey
11 INDS G N N G M Grey
12 NIPS N N G G G Grey
13 PRAS M G N G N Grey
14 PBRX G N M G N Grey
15 POLY N G N G M Grey
16 JECC N N G G G Grey
17 AISA G G N M N Grey
18 ROTI G G M G N Grey
19 HMSP N N G G M Grey
20 MRAT G N N G M Grey
(Source : Data Processed Results in 2019)
DISCUSSION RESULT
Discussion of Manipulators Company
According to the analysis, there were 3 (three) companies or 4.48% of the total
sample companies which committed fraud (fraud) in their financial statement presentation.
Companies that committed fraud against their financial statement could harm the parties
using the financial statements, because the financial statements were not presented in
accordance with the existing facts. Fraud was usually carried out by exaggerating the assets

ISSN: 2249-2496Impact Factor: 7.081
48 International Journal of Research in Social Sciences
http://www.ijmra.us, Email: [email protected]
and profits to attract the attention of investors and creditors to invest or provide credit
loans to the company.
Discussion of Non-Manipulators Company
According to the results of the analysis, 44 (forty four) companies or 65.67% of the
total sample companies did not commit fraud against their financial statement presentation.
This thing showed that these companies had a commitment not to harm other parties, by
not committing fraud or manipulation of their financial statement.
Discussion of Grey Company
According to the analysis, there were 20 (twenty) companies or 29.85% of the total
sample companies which were not included in the manipulators and non-manipulators
category. To be categorized as a company that did not manipulate the financial statement,
the ratio index of the company exceeded the predetermined threshold value, while to be
categorized as a company manipulating the financial statement, the company's ratio index
did not exceed the threshold value.
CONCLUSION and RECOMMENDATION
CONCLUSIONS
Based on the analysis and the discussion above, the conclusions were as follow :
1. Manipulator Companies
The ratio index analysis showed that 3 (three) companies or 4.48% of the sample
companies were classified as the manipulators. The companies belonging to the
Manipulator Companies category had the indications of committing fraud
(cheating) on their financial statement presentation.
2. Non-Manipulator Companies
The ratio index analysis showed that 44 (forty four) companies or 65.67% of the
sample companies were classified as Non Manipulators. The companies which
were classified as Non Manipulator Companies had the indications of not
committing fraud (cheating) on their financial statement presentation.
3. Grey Companies
The companies that were not classified as Manipulators and Non Manipulators
companies were included in the Gray Company. The companies in this group were
20 companies or 29.85% of the companies’ sample.
ISSN: 2249-2496Impact Factor: 7.081
49 International Journal of Research in Social Sciences
http://www.ijmra.us, Email: [email protected]
RECOMMENDATIONS
The writer has several suggestions that can help further research, including the
following :
1. The future research is expected to be able to choose a longer observation year
period, and expand the research sample, so that it is not just limited to one sector,
with the aim that the obtained results will be more accurate, thus it can describe the
phenomenon of financial statement fraud.
2. In further research, other accounting variables can be added, such as the Sales
General and Administrative Expenses Index (SGAI), Leverage Index (LVGI), and
Depreciation Index (DEPI), which may complement and improve for the better
results.
3. For companies, it is expected that they will not commit fraud (fraud) in their
financial statement presentation, because it can harm the users of the financial
statement. For Investors, potential investors, shareholders and creditors, as well as
the capital market analysis in making decisions to buy shares, it is expected to be
able to properly analyze financial statement or look for additional information
outside the financial statement.

ISSN: 2249-2496Impact Factor: 7.081
50 International Journal of Research in Social Sciences
http://www.ijmra.us, Email: [email protected]
REFERENCES
Amrizal, Ak, MM, CFE. 2012. Pencegahan Dan Pendeteksian Kecurangan Oleh
Internal Auditor. (http://www.bpk.go.id/, diakses tanggal 07 Oktober 2019).
Beneish, Messod D. 1999.The detection of Earnings Manipulation. Financial Analysts
JournalSept-Oct 1999.
David Parsaoran. 2012.Skandal Manipulasi Laporan Keuangan PT. Kimia Farma Tbk.
(http://davidparsaoran’s.blogspot.com/ diakses tanggal 07 Oktober 2018). Elang Widya Prakoso. 2015. Analisa Indeks Rasio Untuk Mendeteksi Fraud (Penyimpangan/
Kecurangan) Laporan Keuangan (Studi Kasus pada perusahaan yang listing di Bursa Efek
Indonesia per Desember 2007).Skripsi.Universitas IslamIndonesia.
Harrison, Walter T, dkk. 2010. Akuntansi Keuangan, Edisi ke-8. Terjemahan Gina Gania. Jakarta: Penerbit
Erlangga.
Ikatan Akuntansi Indonesia. 2007. Standar Akuntansi Keuangan. Jakarta: Salemba
Empat.
Irham Fahmi. 2012. Analisis Kinerja Keuangan. Bandung: Alfabeta. Jumingan. 2008.
Analisis Laporan Keuangan. Jakarta: PT Bumi Aksara. Listiana Norbarani. 2014. Pendeteksian Kecurangan Laporan Keuangan Dengan Analisis Fraud
Triangle Yang Diadopsi Dalam SAS No.99.Skripsi.Ekonomika dan Bisnis UniversitasDiponegoro.
Ratna Wardhani. 2012. Faktor-faktor Penyebab dan Konsekuensi dari Kecurangan Pelaporan
Keuangan (Fraud): Suatu Tinjauan Teoritis.(http://www.bpk.go.id/, diakses tanggal 07 Oktober
2018).
Yavida Norim dan Indra Wijaya.20013. Penggunaan Variabel Akuntansi Untuk
Mendeteksi Earnings Management.Jurnal Akuntansi dan Manajemen STIE
YKPN Yogyakarta.Vol.12 No. 02 Agustus 2013 hal.13-26.
http://www.idx.go.id/emiten/ (diakses tanggal 07 Oktober 2019) http://www.sahamok.com/daftar-
perusahaan-manufaktur-2018 / (diakses tanggal 07 Oktober 2019)