the design of assistive location-based technologies for people
TRANSCRIPT
The Design of Assistive Location-based Technologies for People with Ambulatory Disabilities: A Formative Study
Kotaro Hara, Christine Chan, Jon E. Froehlich Makeability Lab | Human-Computer Interaction Lab (HCIL)
Computer Science Department, University of Maryland, College Park {kotaro, jonf}@cs.umd.edu; [email protected]
ABSTRACT In this paper, we investigate how people with mobility impairments assess and evaluate accessibility in the built environment and the role of current and emerging location-based technologies therein. We conducted a three-part formative study with 20 mobility impaired participants: a semi-structured interview (Part 1), a participatory design activity (Part 2), and a design probe activity (Part 3). Part 2 and 3 actively engaged our participants in exploring and designing the future of what we call assistive location-based technologies (ALTs)—location-based technologies that specifically incorporate accessibility features to support navigating, searching, and exploring the physical world. Our Part 1 findings highlight how existing mapping tools provide accessibility benefits—even though often not explicitly designed for such uses. Findings in Part 2 and 3 help identify and uncover useful features of future ALTs. In particular, we synthesize 10 key features and 6 key data qualities. We conclude with ALT design recommendations. Author Keywords Accessibility; assistive technology; mobility impairment; location-based technology ACM Classification Keywords K.4.2 Social Issues: Assistive technologies for persons with disabilities
INTRODUCTION Accessibility barriers in the built environment pose significant problems for people with ambulatory disabilities [7,8,15,17,24,27,29,33,37]. Knowing where and what barriers exist can help affected travelers mitigate, prevent, or better prepare for such problems [7,27,30,35]. Previous research has identified common strategies people with mobility impairments use to evaluate the accessibility of routes and destinations a priori (e.g., seeking trip advice from caregivers [30,35]); however, this work either occurred before the modern era of location-based technologies like GPS-enabled smartphones or did not focus on the potential role of technology.
In this paper, we investigate current methods and tools—both technological and non-technological—that people with mobility impairments use to evaluate the accessibility of the built environment (e.g., streets, businesses) and plan/execute travel. Through participatory design, we actively engage our participants in brainstorming and designing the future of what we call assistive location-based technologies (ALTs)—location-based technologies that specifically incorporate accessibility features to help people with impairments explore, search, and navigate the physical world. As exploratory work, our research questions include: What modern technologies do people with mobility impairments use to evaluate the accessibility of the built environment? What role does technology have in making decisions about travel—both a priori (e.g., when planning) and in situ (e.g., when moving about)? How could future technologies be designed to further improve the way they navigate the physical world?
To address these questions, we conducted a three-part study with 20 mobility-impaired participants: a semi-structured interview (Part 1), a participatory design session (Part 2), and a design probe activity (Part 3). The semi-structured interview was designed to investigate current methods and tools that people use to plan trips and assess the accessibility of the built environment. In Part 2, we designed and developed three ALT usage scenarios, which were used to help guide the participants in ideating and sketching new ALT designs: interactive exploration of neighborhood accessibility, accessibility-aware location search, and accessibility-aware navigation. In Part 3, we presented 12 researcher-prepared paper mockups of ALTs and elicited feedback.
Findings from Part 1 reinforce and extend previous research in how people with mobility impairments assess accessibility [7,30,35]. We found that, while planning trips
Permission to make digital or hard copies of all or part of this work for personal or classroom use is granted without fee provided that copies are not made or distributed for profit or commercial advantage and that copies bear this notice and the full citation on the first page. Copyrights for components of this work owned by others than the author(s) must be honored. Abstracting with credit is permitted. To copy otherwise, or republish, to post on servers or to redistribute to lists, requires prior specific permission and/or a fee. Request permissions from [email protected]. CHI'16, May 07 - 12, 2016, San Jose, CA, USA Copyright is held by the owner/author(s). Publication rights licensed to ACM. ACM 978-1-4503-3362-7/16/05...$15.00 DOI: http://dx.doi.org/10.1145/2858036.2858315
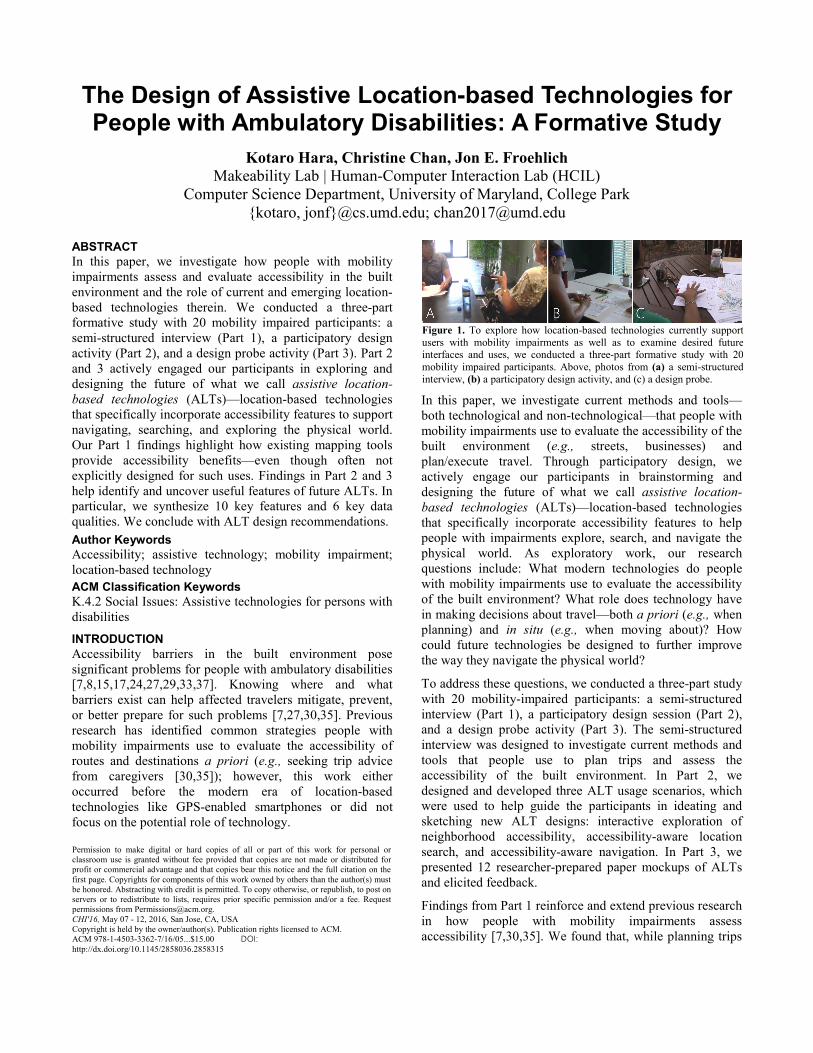
Figure 1. To explore how location-based technologies currently support users with mobility impairments as well as to examine desired future interfaces and uses, we conducted a three-part formative study with 20 mobility impaired participants. Above, photos from (a) a semi-structured interview, (b) a participatory design activity, and (c) a design probe.

remains a challenge, modern location-based technologies support people with mobility impairments—even if not designed specifically for that purpose. For example, participants found satellite and Google Street View imagery helpful to gauge the accessibility of their travel routes and destinations. Part 2 elicited ten key design features (e.g., top-down maps of streets depicting accessibility information) for ALTs and five important data qualities for accessibility information (e.g., credibility, frequently updated data). During our design probe in Part 3, participants reacted positively to our mockup, especially glanceable visualizations of indoor/outdoor accessibility and accessibility-aware routing interfaces, and provided design suggestions. Another data quality emerged in Part 3.
The contributions of this paper include: (i) an examination of methods and modern tools that are used to assess the accessibility of the built environment; (ii) an analysis of ALT mockups designed by mobility impaired people; (iii) the first examination of the significance of data quality on ALTs; (iv) findings from mobility impaired people’s reactions to 12 envisioned ALT interfaces. By enumerating key features and data qualities of ALTs, our findings should inform the design of future location-based tools—both general tools such as Google Maps or Yelp as well as specialized tools such as WheelMap [50] or AXSMap [51]) aimed at the accessibility community. BACKGROUND AND RELATED WORK We provide background on built environment accessibility as well as prior work on accessibility evaluation methods.
Accessibility Regulations and Guidelines In the U.S., the Americans with Disability Act (ADA) of 1990 [45] and its revised regulations—the 2010 ADA Standards for Accessible Design [46]—mandate that new constructions and alterations of the built environment are to be accessible for everyone. For example, sidewalks are to have sufficient passing width for wheelchair users (60in / 1.5m) and include curb ramps at intersections. Despite federal regulations, however, many city infrastructures remain inaccessible (e.g., sidewalks and trails [42], business interiors [43]). New York City, for example, is currently in litigation for failing to make sidewalks accessible [15]. Though these accessible designs are intended to support people with a range of sensory and physical impairments (e.g., vision, mobility), our study focuses on those with ambulatory disabilities who use manual wheelchairs, electric wheelchairs/scooters, and other manual assistive technologies such as canes (three categories from [44]).
Emerging location-based technologies (see [31] for a survey) could help mitigate the problems for mobility impaired people via smart trip planning. Recent reports by the U.S. Department of Transportation [40,41] and a report from the GeoAccess team [36] called for research and development in areas such as accessibility-aware navigation solutions and accessibility-aware location search. While the focus of our study is on U.S. participants, accessible
infrastructure is a global problem [12,39] and our results should have implications for other counties as well.
Accessibility Barriers to Travel Part 1 of our study investigates barriers faced by people with ambulatory disabilities and their coping strategies. There exists an extensive literature in public health and urban planning [7,8,27,29,33,37] that focuses on characterizing what makes the built environment (in)accessible. For example, Meyers et al. identified a list of accessibility barriers to navigation (e.g., narrow aisles) through 28 daily telephone interviews with 28 wheelchair users [29]. Our work is complementary. We extend this literature by focusing specifically on the current and envisioned role of ALTs to help persons with mobility impairments navigate the physical world.
Methods and Tools to Evaluate Accessibility While the above work has helped uncover specific accessibility problems in the built environment, other literature has explored strategies to overcome these problems, which include both technological and non-technological solutions. Prior work identified common “low-tech” strategies like seeking advice from others (e.g., care givers, access consultants) [30,35] or relying on heuristics developed through personal experience [7].
On the technology side, Nuernberger studied then-current technological methods and explored desired technical solutions for finding and assessing accessible routes with 20 mobility impaired people [30]. While this research strongly aligns with our own, Nuernberger focused specifically on navigation tools with less focus on other location-based technologies (e.g., location search), which our study addresses. Moreover, Nuernberger’s work was conducted in 2005. Given the recent advent of widely available digital maps and GPS-equipped smartphones, it is appropriate to reinvestigate how people use technologies to support their trip planning, and extend the research by exploring designs of a wider variety of ALTs.
More recently, in our own prior work [20], we conducted interviews as part of a larger study with 3 electric wheelchair users about their personal experience with sidewalk/street accessibility. Our preliminary findings included one interviewee describing that he occasionally uses Google Street View to assess the accessibility of outdoor environments before travel. Given the small sample size, our current objective is to validate these early findings and explore other methods and tools people use to evaluate the accessibility of the physical world.
Our goal in Part 2 and 3 is to explore possible future designs of ALTs; the scenarios and design probes were developed, in part, based on emerging accessibility-aware technologies such as Handimap [52] and AXSMap [51]. One common type of ALT for people with mobility impairments are accessibility-aware navigation tools, which utilize known information about (in)accessible sidewalks

and recommend accessible routes [5,10,22,28,35,48]. Matthews et al. conducted pioneering work in creating an accessibility-aware navigation tool with a commercially available GIS toolchain [27]. As a research prototype, the tool covered small areas in Northamptonshire, U.K, and included location data of accessibility barriers collected by the researchers via a field survey. While much research has focused on building systems, limited attention has been paid to how people would use and perceive such tools. Our study addresses this gap; we explore desired features through design activities and elicit feedback from potential users using paper mockups of ALTs.
Another type of emerging ALT is accessibility-aware location search. Widely used tools like Yelp [53] and TripAdvisor [54] sometimes provide binary information of wheelchair accessible vs. inaccessible for places in their databases. In addition, although not widely adopted [13], new, still-developing tools like Wheelmap [50], AXSMap [51] and MoTag [16] provide more fine grained metadata describing what makes a place (in)accessible and thereby provide more options for location search. Again, however, no prior work has investigated how mobility impaired people perceive such tools.
In summary, the lack of a recent study on mobility-impaired people’s trip planning strategies as well as the increasing interests and availability of ALTs motivate this work. We present the investigation of modern accessibility evaluation practices of people with mobility impairments and elicit desired design features of ALTs using participatory design.
METHOD We conducted a three-part study with mobility-impaired participants: (i) a semi-structured interview to inquire about current methods and tools that our participants use to support trip planning (Part 1; Figure 1a); (ii) a participatory design to elicit design and feature requirements of ALTs as well as their context of use (Part 2; Figure 1b); and (iii) a design probe activity to discuss designs and features of ALT paper prototypes designed by the researchers (Part 3; Figure 1c). Study sessions were audio and video recorded and transcribed by the members of the research team.
We recruited 20 participants (14 female) on a rolling basis through local accessibility organizations, word-of-mouth, and email listservs. Participants were on average 43.7 year old (SD=18.0; range=19-77; Table 1) and from the Washington, D.C. area. To investigate potential differences in perspective and experience based on mobility level, we specifically recruited a range of participants [44]: 8 used electric wheelchairs/scooters, 7 used manual wheelchairs, and 10 used other manual assistive technologies (e.g., cane, walker). The total number (25) exceeds 20 as some participants used more than one assistive device—see Table 1. All participants had experience with using laptop/desktop computers and 13 had smartphones. Prior to the study session, participants were asked to fill out an online background survey. Due to a cognitive impairment, which
prevented full participation, P16 is excluded from our analysis. Participants were compensated $15/hour for their time and travel. Part 1: Semi-structured Interview Part 1 of our study was aimed at uncovering: (i) what accessibility challenges people with mobility impairments face in the built environment and the significance of these challenges; (ii) the tools and methods they use to assess accessibility; and (iii) how the problems impact their decision and ability to travel. The interviewer initiated inquiries with a fixed set of questions. As new topics emerged in accordance with participant’s background, mobility level, and experience, participants were asked to elaborate on emerging topics.
Part 2: Participatory Design We used participatory design with end-user sketching [38] to better understand what types of interactive designs, features, and uses people with mobility impairments desire for future ALTs. To help guide the design activity, we used scenario-based design [9,34] with three scenarios; each scenario described a situation where ALTs could be helpful for evaluating the accessibility of the built environment. Our scenarios are based on GIS literature [4,14,31] that taxonomize location-based applications into three main areas: geographical exploration, search, and navigation. The scenarios were then adapted to an accessibility context. Before conducting the study, we refined our scenarios iteratively within our research team and later with a research partner who uses an electric wheelchair (Age=47; Male; SCI level C5). The three scenarios are:
Scenario 1: Citywide Accessibility Exploration. You are planning to rent a room in an unfamiliar city that you will move to in a few months. Imagine that there is a website that provides accessibility information about the city. What should that website look like?
Sex Age Phone Technology Disability P1 F 48 Cane Cerebral Palsy P2 M 37 MW, EW Cerebral Palsy P3 M 48 SP MW Spinal Cord Injury (C5/6) P4 F 22 SP Scooter FSH Muscular Dystrophy P5 M 56 SP MW Spinal Cord Injury (L1/T12) P6 F 77 Cane Muscular weakening disease P7 F 42 SP Cane, Scooter Juvenile Rheumatoid Arthritis P8 F 72 Walker Damaged patella tendon P9 F 38 SP EW Muscular Dystrophy P10 F 72 Walker, EW Parkinson's disease P11 F 24 SP Scooter Spinal Muscular Atrophy (Type 3) P12 F 26 Walker, EW Cerebral Palsy P13 F 24 SP Cane, walker Diplegic Cerebral Palsy P14 F 56 SP EW Multiple Sclerosis P15 M 52 SP Walker Cerebral Palsy, Knee injury P16 F 37 MW Cerebral Palsy P17 F 31 SP Walker, MW Spinal Cord Injury (T-6) P18 M 63 SP MW Spinal Cord Injury (T-11) P19 F 19 SP Cane, crutches Hip replacement P20 M 29 SP MW Spinal Cord injury (L-1)
Table 1. Participant demographics. Here, we use: MW=Manual wheelchair, EW=Electric wheelchair, and SP to indicate participants who have smartphones. P16 was excluded due to a cognitive impairment that prevented her from fully participating.

Scenario 2: Accessibility-Aware Location Search. Your friends are visiting you, and you want to take them to an Italian restaurant in Washington, D.C (your hometown). You would like to find a popular restaurant. You also want to make sure the business and its surrounding areas are accessible for you. What should the application look like?
Scenario 3: Accessibility-Aware Navigation. You came to an unfamiliar city for your holiday. You remember there is a natural science museum that you want to visit. You open a navigation tool on your computer to find accessible routes from your hotel to the museum. What should the application look like?
To help our participants ideate and sketch design ideas, we prepared four paper templates, which they could use at their discretion: (i) a blank smartphone, (ii) a map on a smartphone (iii) a blank web browser, and (iv) a map on a web browser (with/without pins)—see Figure 2. While our templates are based on widely available technologies and familiar map interfaces, we did not restrict our participants from brainstorming ideas that use other user interfaces (e.g., augmented-reality devices like Google Glass, smartwatches). Participants were asked to “think aloud” while sketching. Five participants were not comfortable sketching by themselves due to weak upper body strength. In these cases, the participants described their ideas and the interviewer sketched on their behalf.
Part 3: Design Probe For Part 3 of our study, we designed 12 low-fidelity, paper-based prototype mockups of ALTs ranging from heat map visualization’s of a city’s accessibility to indoor navigation interfaces that provide accessible routes (Figure 3). Prior work suggests that using lower-fidelity interface representations in user studies elicits more honest feedback [25,32] and that the presentation of multiple, alternative design solutions reduces inflated praise and gives rise to stronger criticism, when appropriate [38].
Our mockups were used as design probes to elicit reactions, prompt critical feedback, and ground discussions. Similar to our scenarios in Part 2, probes were iterated upon within our research group and with our mobility impaired research partner before beginning our study. Some probes utilized fictitious ‘Accessibility Scores,’ which were inspired by walkscore.com. Walk Score provides a number between 0-100 that represents the walkability of a given address; the score is based on proximity to destinations such as restaurants, libraries, and parks as well as population density and road metrics such as block length and
intersection density [55]. While similar, Accessibility Scores extend Walk Scores with notions of accessibility (e.g., the presence of sidewalks and curb ramps, road grade, frequency of elevation changes, and sidewalk width). Some features of our probes, such as how accessibility scores are computed, are left intentionally vague to help provoke discussion. Below, we describe our 12 probes categorized into six groups. For readability, we refer to the specific probes in parentheses without the Figure prefix.
1. Accessibility Score Visualizations. We developed four top-down, map-based visualizations of accessibility scores to provide ‘at-a-glance’ information on a city’s accessibility. Two probes used heat map representations with different granularities: neighborhood-level (3A) vs. sidewalk-level (3B). The two other probes used dots to represent specific accessibility barriers, both categorized (3C) and non-categorized (3D).
2. Citywide Accessibility Score Comparison. While the above visualizations are useful for exploring the general accessibility of a city or neighborhood, they do not easily support comparing the accessibility of different cities. This probe quantifies the accessibility of entire cities with a single accessibility score along with brief, textual rationale. Multiple cities can be entered/compared (as in 3E).
3. Accessibility-Aware Location Search. In this probe, we developed a point-of-interest search website similar to yelp.com but augmented with accessibility information. Users can search for a business or other point-of-interest with a keyword and location. Each search result is accompanied by a 5-level accessibility score, which can be used for sorting and filtering (3F).
4. Finding Accessible Bus Stops. We developed one probe targeted at public transportation—in this case, finding accessible bus stops (3G). Users can enter a location and see proximal bus stops, which are color-coded based on accessibility (green for accessible, red for inaccessible).
5. Visualizing Building Accessibility. We developed three design probes for investigating the accessibility of buildings. The first design uses a top-down map visualization to indicate the accessibility of public buildings in a selected area (3H). Selecting a building zooms into its floor plans and highlights accessible and inaccessible features such as elevators and stairs (our second probe, 3I). The third design focuses on accessible routing interfaces for indoor environments (3J).
6. Outdoor Accessible Routing. Finally, our last category contains two probes related to accessibility-aware pedestrian routing algorithms and interfaces. Similar to Apple or Google Maps, both probes allow the user to enter a start and end location and view suggested routes. In our designs, however, the shortest path is visualized as well as the shortest accessible path. The probe in Figure 3k shows one alternative accessible path while Figure 3l shows multiple alternatives.
Figure 2. The four templates for sketching: (a) a blank mobile, (b) a map on a mobile, (c) a blank web browser, and (d) a map on a web browser.
A B C D

DATA AND ANALYSIS Each session lasted an average of 77.9 minutes (SD=16.3; range=53-119). Sessions were audio/video recorded and transcribed by the research team. We used iterative coding [6,23] to examine the transcripts, including the responses to semi-structured interview questions, verbal descriptions of participants’ sketched prototypes, and feedback on our design probes. Our unit of analysis was a participant’s response to the interviewer’s question.
We iteratively refined the codes to ensure the code set was comprehensive and reliable. First, a member of the research team open coded the interview transcripts of the first three participants (P1-3), who used different types of assistive technologies. Similar and recurring ideas were grouped to create the initial codebook. Using this codebook, two researchers independently coded the same interview transcripts (P1-3). We used Cohen’s kappa (κ) [11] to assess inter-coder agreement. The mean agreement was κ=0.40 (SD=0.14; range=0.04-0.6). Landis and Koch suggested that scores of κ < 0.6 are at most moderate agreement [26]. In our case, 13 of 14 codes for Part 1 through 3 were < 0.6. The two researchers then met, resolved all disagreements, and updated the codebook accordingly. A second set of transcripts (P4-6) were selected and the coding process was repeated. This time there was much higher agreement: average κ=0.88 (SD=0.07; range=0.69-1.0). Again, disagreements were resolved through consensus and the codebook was updated
a final time. One researcher coded the remaining transcripts using the final codebook (Table 2).
FINDINGS Part 1: Semi-Structured Interview We discuss what and how accessibility barriers and facilitators affect mobility impaired people’s lives and describe methods and tools they use to cope with problems. We use the phrase ‘accessibility facilitators’ to describe built environment or inter-personal features (e.g., curb ramps, a helpful restaurant employee) that allow people to overcome the barriers [29,33].
Accessibility Barriers and Facilitators Participants were asked about mobility challenges and anxieties for trips. All participants except for P15, who had strong mobility, mentioned at least one type of barrier. Overall, 17 barriers and facilitators emerged, which we
Figure 3. We demonstrated the twelve paper prototypes of ALTs to participants in Part 3 of the study. (a-d) street-level accessibility visualizations, (e) citywide accessibility score comparison, (f) accessibility-aware location search, (g) bus stop accessibility visualization, (h-j) building accessibility, and (k-l) outdoor wayfinding. The high resolution version of the prototypes are available as supplementary material.
Part 1. Semi-structured Interview Accessibility barriers and enablers Feelings about accessibility enablers and barriers Methods or tools for overcoming accessibility problems Impact of accessibility enablers and barriers Methods or tools to assist with trip planning Methods or tools to assist with evaluating accessibility
Part 2. Participatory Design and Part 3. Design Probe Accessibility barriers and enablers Context of use Design of user interface Accessibility data quality
Table 2. The final codebook. Though originally separate, Part 2 and Part 3 eventually shared the same codebook after iterations.

categorized into outdoor, indoor, and other in Table 3 .The most prominent accessibility attribute for each category included: leveled ground (e.g., steps, curbs) for outdoor, elevator for indoor, and accessible transportation for other (e.g., paratransit, accessible buses). Note that leveled ground is different from a street or sidewalk’s gradient (i.e., steepness), which is its own distinct attribute.
The perceived severity of the identified accessibility barriers seemed to differ depending on the participant’s mobility. For example, while six participants described distance as a barrier to navigation, five of these used manual assistive technology. For example, one cane user said: “I can do grassy [surfaces]. But I need short distances and I need no stairs.” (P19)., All manual wheelchair users mentioned the presence of sidewalks and unobstructed paths to be important facilitators of their movement. A participant who uses a manual wheelchair said: “[At] some locations, […] sidewalks [are] narrow and for some reason have light poles right in the middle of a sidewalk, so I can’t get through at all.” (P3).
Impact of Accessibility Barriers When asked about accessibility barriers and their impact, fifteen participants mentioned that barriers affected their travel decisions—both where to travel and whether to travel at all. For example, P17, who uses a manual wheelchair, said: “I’ll forgo going there if I can’t confirm there is some sort of sidewalk for me to travel along.” In addition, nine participants discussed how accessibility affected their mode of travel: “in New York City, the subway stations are not accessible […] so that was out of the question for us” (P7). Seven reported that their decisions on where to stay/live depend on accessibility. For example: “there’s been a couple of hotels we’ve gone to where the actual door to the hotel wasn’t accessible, so we’ve had to pick another hotel” (P20). Finally, three participants mentioned how accessibility barriers socially excluded or separated them from others. P9 said: “I wanted to go to a party and my
friends are there and I can’t go because I get there and [I find the place to be inaccessible].”
Methods to Overcome Accessibility Barriers Strategies to overcome the aforementioned accessibility problems organically emerged in the interview. Five strategies included: help from others, physical strength, detour, walk/roll onto the street, and setting expectations. Thirteen participants said they could rely on others: “occasionally if it's not accessible, my husband can help me up steps” (P7). Ten participants mentioned that they use physical strength to overcome barriers. Among these ten, seven used manual assistive technologies. P8 said: “my husband ran my walker down to the bottom and then I walked down holding on [railing].” Seven noted they took detours when they encountered barriers. P17 said: “the bus stop was on grassy hill. So I didn’t get off there. I had to go up a few stops and of course it was past the actual shopping plaza.” Six mentioned they walk/roll on the street when sidewalks are not passable: “they are digging up the sidewalks. And they force us to use either the sidewalk on the other side, or you're forced to be on the street.” (P1).
Methods for Accessibility Evaluation Participants were asked how they plan their trips to unfamiliar locations and assess accessibility. “Low-tech” solutions included: talking to others, relying on heuristics, and performing an on-site accessibility audit. Participants used technologies to assess accessibility as well, including: websites and online forums, online imagery, and existing location-based technologies. We expand on each below.
Talking to Others: The most common method of assessing accessibility was talking to others (N=17). Our participants spoke with coworkers, friends and family members, employees who worked at their destinations, and accessibility consultants who knew about the accessibility of the facilities. P17 said: “If a friend has been there, I’ll ask ‘do you remember if there was a little step’ or ‘do you remember what the access was [like].’”
Heuristics: Our participants (N=11) relied on their experience and educated guesses to gauge the accessibility of places prior to or in lieu of travel. For example, P7 described: “those towns that are historic, I just tend to stay away from them completely.”
On-site Accessibility Audit: When necessary, the participants (N=7) checked routes and neighborhood accessibility on-site. P12 said: “If it’s an important trip but I don’t want to use [paratransit], what I will do is a dry run the day before: get lost and find my own landmarks and do it the next day where I will usually get lost again but not as badly.”
Websites and Online Forums: Fifteen participants noted they acquire accessibility information of the built environment from websites of hotels, restaurants, and other business facilities. Online forums were used to assess the areawise accessibility of neighborhoods and cities.
Barriers and Facilitators EW/S (N=8) MW (N=6) MAT (N=10) All (N=19) Ou
tdoo
r
Leveled Ground 7 (88%) 5 (83%) 8 (80%) 15 (79%) Surface Type 6 (75%) 5 (83%) 7 (70%) 14 (74%) Curb Ramp 7 (88%) 5 (83%) 6 (60%) 14 (74%) Gradient 3 (38%) 5 (83%) 5 (53%) 11 (58%) Narrow/Obstructed Path 5 (63%) 6 (100%) 4 (40%) 11 (58%) Presence of Sidewalk 3 (38%) 6 (100%) 3 (30%) 9 (47%) Distance 0 (0%) 1 (17%) 5 (50%) 5 (26%)
Indo
or Elevator 4 (50%) 5 (83%) 8 (80%) 13 (68%)
Entrance 6 (75%) 4 (67%) 4 (40%) 11 (58%) Restroom 4 (50%) 4 (67%) 4 (40%) 8 (42%) Accommodation 2 (25%) 3 (50%) 2 (20%) 5 (26%)
Othe
r
Accessible Transportation 7 (88%) 5 (83%) 6 (60%) 14 (74%) Parking 3 (38%) 3 (50%) 6 (60%) 9 (47%) Stairs 2 (25%) 2 (33%) 5 (50%) 9 (47%) People’s Attitude 3 (38%) 2 (33%) 3 (30%) 6 (32%) Crowded Area 1 (13%) 2 (33%) 2 (20%) 4 (21%) Weather 1 (13%) 2 (33%) 1 (10%) 4 (21%)
Table 3. The accessibility barriers and facilitators mentioned by the participants. Cells are shaded by response rate (darker shade=more frequent). EW/S=Electric wheelchair and scooter users, MW=Manual wheelchair users, MAT=Manual assistive technology users.

“I’m trying to find out if [places are] accessible, then I will usually use their website or Google. But if I’m trying to go to an entire area like Adams Morgan or checking out an entire area, I’ll use forums. […] people can be like “oh this area and this street is cute but doesn’t have the cobblestones.” (p4)
Online Imagery of the Built Environment: Eleven participants reported the use of online imagery of the built environment like Google Street View, satellite imagery, and building façade pictures found online. P20 said: “I use Street View of Google. What that does is it gives me an idea. If there’s any steps outside of the facility or outside of the place, I’m able to tell right away from Google Street View, or satellite or anything like that.”
Existing Location-based Technologies: Six participants reported that they use accessibility features of existing location-based technologies. P17 said: “I used Yelp to find my restaurants, and I always go to the [indicator describing] wheelchair access. It’s great that that’s there, yes or no [for wheelchair access].” As for emerging ALTs, while 2 participants knew about AXSMap, they did not use the application due to coverage area and data sparseness.
Combining Strategies. Finally, participants used not just a single method, but combined two or more strategies to crosscheck accessibility. For example, when asked about his preferred method, P20 said: “I guess it would be a combination, there isn’t an actual preference. Because then there’s a flaw in each one. Street View is not always updated, and the perception of the person I’m talking to that’s unfamiliar with my situation, they don’t know exactly what I mean.”
Part 1 Summary. Our findings highlight common accessibility barriers and facilitators in the built environment, the impact of those barriers, and methods to mitigate or avoid accessibility problems, which reaffirm and extend prior work (e.g., [29,30,33,35]). We also uncovered how modern technology is used to assess accessibility (e.g., online imagery).
Part 2: Participatory Design Participants were asked to sketch ideas and describe the design of future ALTs. We grouped recurring, emergent features of ALTs into 10 categories. We also describe five emergent data qualities [49] important to ALTs.
Common Solutions Overall, participants sketched and described ten different features for envisioned future ALTs. For the first scenario (citywide accessibility exploration), the top four most frequent features included: Street-level Accessibility Visualization (N=12), Detailed Description (9), Routing (6), and Transportation (6). For the second scenario (accessibility-aware location search), participants wanted Detailed Description (13), Point-of-Interest Accessibility Rating (7), Remote Accessibility Inspection (7) and Floor Plan. Finally, for the third and final scenario (accessibility-aware navigation), participants wanted Routing (14), Transportation (8), Street-level Accessibility Visualization
(7), and Remote Accessibility Inspection (4). We describe all ten emergent features below.
Features Street-level Accessibility Visualization: Fourteen participants sketched or described top-down map tools that visualize accessibility barriers and facilitators in streets/sidewalks. These map-based visualizations were highly desired because, as our participants noted, they allow users to quickly explore the accessibility of a large area. P7’s sketch in Figure 4a, for example, shows the presence of curb ramps as blue pins in a mobile map interface. Color was often used to either represent types of accessibility attributes or the severity of an accessibility barrier. Point-of-Interest Accessibility Rating: While the previous feature provides a way to browse street-level accessibility, eight participants wanted accessibility ratings of individual buildings (e.g., Figure 4d). Our participants thought that these ratings should be either generated automatically with previously acquired accessibility metadata or provided by end-users (i.e., crowdsourcing), which is the technique employed by sites like AXSmap [51]. In describing a Yelp-like tool, P3 said: “that would be the crowdsourcing information with rankings from an individuals, 5 stars for accessibility, 2 stars for food.” As data gathering
Detailed Description: A large majority of our participants (N=17) sketched or described interfaces that provided detailed information about the accessibility of a place. Details were important not only because of the wide-range of needs amongst a diverse mobility-impaired population but also because, even for a single user, needs may change over time or situationally. In describing a location search tool, P17 said: “if you click on this one up here you could have a box that comes up with accessible information and maybe this says 'no' and why: 'one step in front of entrance.’ That lets someone decide 'well actually I could do that' or 'I’m going with a group, they can help me up that step' or 'I’m going by myself and I can’t do this' […]”
Floor Plan: Four participants mentioned that visualizations of a buildings floor plans annotated with information relevant to indoor accessibility would be useful (e.g., stairs, elevators, narrow areas of traversal). In describing the sketch in Figure 4c, for example, P20 said that floor plans help reveal the general accessibility of a facility (a restaurant in this case). His tool visualizes the placement of tables and shows whether it is possible to reach a bathroom.
Visual Accessibility Inspection: Eight participants said that ALTs should provide visual methods to let users remotely inspect the accessibility of streets/sidewalks (e.g., presence of curb ramps), building façades (e.g., presence of stairs), and building interior (e.g., maneuvering spaces) (Figure 4b). Desired inspection methods included pictures, videos, and interactive virtual reality of a room. With visual information, a user can inspect and confirm that the location is indeed accessible by themselves. P18 said:
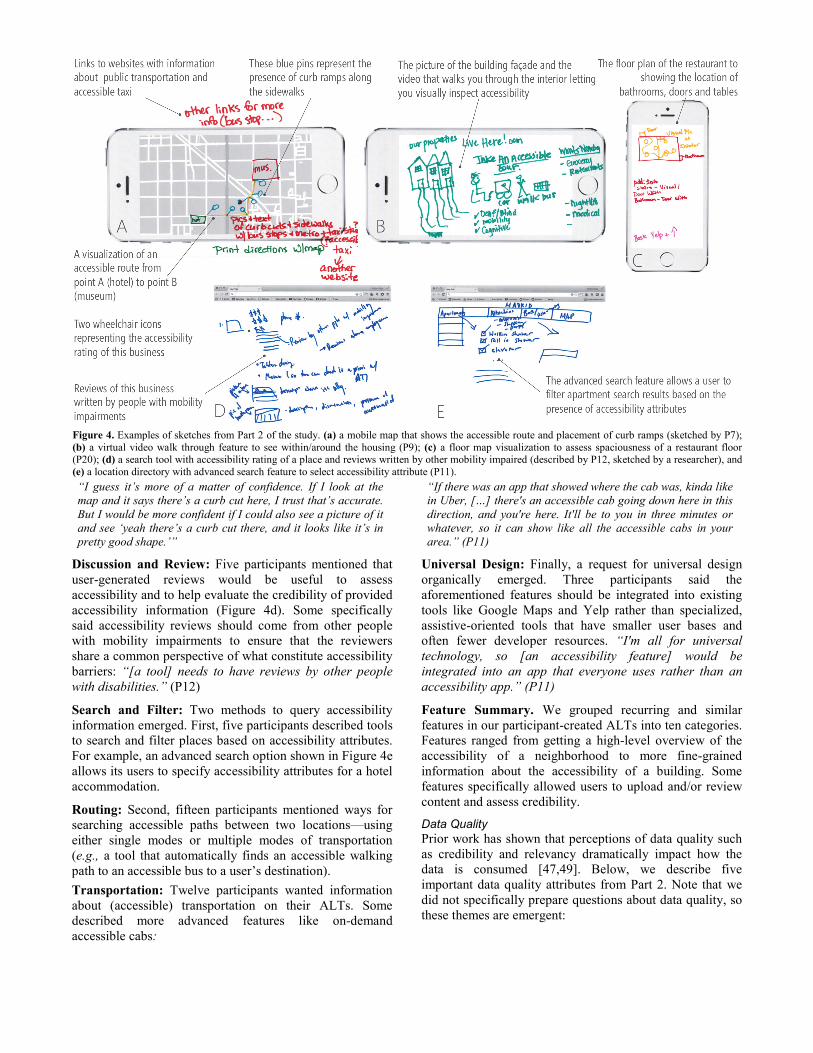
“I guess it’s more of a matter of confidence. If I look at the map and it says there’s a curb cut here, I trust that’s accurate. But I would be more confident if I could also see a picture of it and see ‘yeah there’s a curb cut there, and it looks like it’s in pretty good shape.’”
Discussion and Review: Five participants mentioned that user-generated reviews would be useful to assess accessibility and to help evaluate the credibility of provided accessibility information (Figure 4d). Some specifically said accessibility reviews should come from other people with mobility impairments to ensure that the reviewers share a common perspective of what constitute accessibility barriers: “[a tool] needs to have reviews by other people with disabilities.” (P12)
Search and Filter: Two methods to query accessibility information emerged. First, five participants described tools to search and filter places based on accessibility attributes. For example, an advanced search option shown in Figure 4e allows its users to specify accessibility attributes for a hotel accommodation.
Routing: Second, fifteen participants mentioned ways for searching accessible paths between two locations—using either single modes or multiple modes of transportation (e.g., a tool that automatically finds an accessible walking path to an accessible bus to a user’s destination). Transportation: Twelve participants wanted information about (accessible) transportation on their ALTs. Some described more advanced features like on-demand accessible cabs:
“If there was an app that showed where the cab was, kinda like in Uber, […] there's an accessible cab going down here in this direction, and you're here. It'll be to you in three minutes or whatever, so it can show like all the accessible cabs in your area.” (P11)
Universal Design: Finally, a request for universal design organically emerged. Three participants said the aforementioned features should be integrated into existing tools like Google Maps and Yelp rather than specialized, assistive-oriented tools that have smaller user bases and often fewer developer resources. “I'm all for universal technology, so [an accessibility feature] would be integrated into an app that everyone uses rather than an accessibility app.” (P11)
Feature Summary. We grouped recurring and similar features in our participant-created ALTs into ten categories. Features ranged from getting a high-level overview of the accessibility of a neighborhood to more fine-grained information about the accessibility of a building. Some features specifically allowed users to upload and/or review content and assess credibility.
Data Quality Prior work has shown that perceptions of data quality such as credibility and relevancy dramatically impact how the data is consumed [47,49]. Below, we describe five important data quality attributes from Part 2. Note that we did not specifically prepare questions about data quality, so these themes are emergent:
Figure 4. Examples of sketches from Part 2 of the study. (a) a mobile map that shows the accessible route and placement of curb ramps (sketched by P7); (b) a virtual video walk through feature to see within/around the housing (P9); (c) a floor map visualization to assess spaciousness of a restaurant floor (P20); (d) a search tool with accessibility rating of a place and reviews written by other mobility impaired (described by P12, sketched by a researcher), and (e) a location directory with advanced search feature to select accessibility attribute (P11).

Granularity: Fourteen participants mentioned that the interface should present detailed accessibility information rather than just binary indicators. In designing her location-search tool, P7 said that ALTs should present: “inside each room, dimensions, bathrooms and kitchen, specifics with heights of counters and turnaround space, having a floor plan, heights of light switches and whether or not there’s carpet or hardwood—the type of floor.”
Relevance: Eight participants noted that not all accessibility information is relevant to their specific impairment, suggesting the need for drill-down interfaces that present well-categorized high-level accessibility information with detailed information available through interaction. In describing a location search tool, P4 said: “for me, I just need a ramp and an elevator. But like I said, other people need other things, so they would have to probably come up with a list of all the different things that would be classified as accessible to different people.”
Credibility: Six participants mentioned that the data needs to be trustable: “[...] can we even trust the website? I would have to know the person who reviewed it as accessible has either a similar disability to my own or understands the concerns of a person who my particular issues.” (P12)
Recency of Information: Six participants mentioned that up-to-date data is crucial, especially for accessibility barriers that change daily (e.g., construction) or even hourly (e.g., pedestrian traffic). P3 noted: “Currency of information is always a key. […] Google Street View makes everything look accessible but does not include the construction that recently started.”
Coverage: Two participants described the issue of scarce data in emerging ALTs like AXSMap: “AXS map? […] it doesn't get much traction, because […] they don't cover enough area, so it's like one neighborhood in NYC and it's like who's going to really look at that?” (P11)
Part 2 Summary. Through participatory design activities, we identified ten desired features and five essential data qualities for ALTs. The top three most desired features were providing detailed descriptions, accessibility-aware routing, and top-down map-based views of street-level accessibility. Data quality attributes often related to features (e.g., high granularity of data corresponds to the detailed description feature).
Part 3: Design Probe In the last part of our study, we used 12 probes (Figure 3) to explore designs and functionalities of future ALTs. We specifically conducted this part of the study after the participatory design to not bias the participants’ ideation process while sketching in Part 2. Many features and probe designs ended up overlapping with participants’ own ideas. Thus we focus on describing overall reactions to our probes here as well as specific feedback that differs from Part 2.
Overall Reactions 1. Accessibility Score Visualizations (3A-D): Eighteen participants reacted positively to the concept of visualizing street-level accessibility on a map. Of these four probes, participants were less supportive towards the neighborhood-level heat map probe (3A) because of low location precision and, instead, preferred the sidewalk-level heat map probe (3B). Participants preferred the categorized dot probe over the uncategorized one due to a higher level of information granularity.
2. Citywide Accessibility Score Comparison (3E): Only six participants reacted positively towards the citywide accessibility score comparison. Participants expressed doubt about the utility of the application because they felt that a city, as a unit of accessibility evaluation, is too broad and coarse to provide any meaningful insights. “I think the problem with it is, at least at the level you’re displaying it here, is that it’s too high level. It’s not granular enough. Take for example New York, I might be interested in Manhattan, but not Brooklyn or Queens. But if you got this overall score that doesn’t really tell me much.” (P18)
3. Accessibility-Aware Location Search (3F): Thirteen participants reacted positively towards the design of the location search tool. Participants suggested improving the design by allowing users to examine the rationale for the 5-level accessibility score (e.g., presence of handicap parking). Other suggestions included provision of pictures of the building façade and accessibility reviews by others.
4. Finding Accessible Bus Stops Visualization (3G): A majority of participants (N=15) favored the idea of visualizing bus stop accessibility. Design suggestions included providing rationale for why bus stops are (in)accessible, presenting general transit information, and offering similar information for different types of public transportation (e.g., trains, subways).
5. Visualizing Building Accessibility (3H-J): Seventeen participants reacted positively to the idea of color coding the accessibility of buildings on a map and/or showing floor plan accessibility visualizations. For the floor plan visualization (3I), two participants suggested denoting what the areas are used for to improve understandability. In contrast, only 8 participants (42%) thought that the indoor routing tool (3J) would be useful. Most participants felt that more effective alternative methods are readily available (e.g., talking to others, looking at mall directories).
6. Outdoor Accessible Routing (3K-L): Seventeen participants reacted positively towards accessibility-aware routing interfaces. Twelve preferred the interface with multiple routes (3L), while three preferred the simpler interface (3K). One participant suggested including audible turn-by-turn navigation, because moving her upper body to interact with her mobile tool was hard.
Part 3 Summary. More than half of participants reacted positively towards all probes except for the citywide

accessibility score comparison and indoor routing probes. In discussing mockups of Accessibility Score Visualizations, an additional data quality, location precision, emerged; which refers to geographical fidelity of accessibility data (e.g., at sidewalk level or block level).
DISCUSSION We reflect on the implications of our findings, describe study limitations, and offer suggestions for future work.
ALTs Design Considerations and Recommendations This paper reaffirms the unmet needs of previously proposed/designed ALTs (e.g., accessibility-aware POI search [16,36]) as well as presents desired assistive features that have not been described before (e.g., visual accessibility inspection). Following the design practice described in [34], we formulate design recommendations based on findings from our three ALT scenarios:
Citywide Accessibility Exploration: Location precision and categorical granularity of accessibility barriers were valued in the design probe activities. We suggest providing two types of visualizations similar to Figure3b and c. Information about accessible routes to nearby locations (e.g., cafes) is also recommended. Given a point on a map, provide a range of nearby amenities together with the detailed information about accessible routes to those destinations (e.g., distance of the shortest accessible route).
Accessibility-Aware Location Search: For each location search result, provide an overall accessibility rating of the place. This will allow mobility impaired users to quickly browse through the list of results and find a few that are accessible and have high reputations. Providing rationale for the accessibility ratings is also strongly desired, including a list describing what barriers or facilitators make each location accessible or not.
Accessibility-Aware Navigation: Future ALTs that support routing should provide multimodal accessibility-aware navigation. The interfaces should provide routes with accessible transportation (e.g., accessible taxis, buses) and accessible walking/rolling directions. To further improve the interface, provide geographical visualizations of neighborhood accessibility along the route. This will allow users to reason about why the routes are recommended.
Similar to prior research in data quality of online reviews for health care providers [47] and businesses [3], our findings support the need for ensuring and maintaining high data quality. The recommended designs above should allow users to verify accessibility information by incorporating features described in Part 2 (e.g., Visual Inspection).
Future Work One key challenge in designing and deploying ALTs is finding and maintaining up-to-date information about the accessibility of the built environment. Though prior work has explored semi-automated methods to remotely collect outdoor accessibility information at scale [1,18–21], these
methods rely on potentially out-of-date information, offer no way for users to update or comment, and do not yet work for indoor environments. Potential avenues of future research in this area include exploring potentially rich and scalable but untapped sources of accessibility information such as daily-updated satellite imagery (e.g., Planet Labs [56]) or even surveillance video streams (e.g., Placemeter [57], dashboard cameras on government vehicles [58]).
Our study elicited design features of future ALTs. How best to combine these for different scenarios is an open question. For example, P3 wanted accessibility-aware navigation tool on Google Glass so the application could help him navigate on-the-go. While feature requirements for the technology may be similar (i.e., routing, transit information), more investigation is needed.
Accessibility Data in Sharing Economy Should ALTs provide accessibility information of private properties? Although mentioned by only one participant, emergent sharing economies such as Airbnb raise important questions for ALTs. In the U.S., for example, there are no regulations that mandate residential housing to be accessible. Thus, it is not clear if Airbnb accommodation owners need to comply with ADA [2]. P7 raises some important points about this complex issue: “… most of the places in Airbnb are not accessible to rent out. But now there's is… [an advanced feature to search with] wheelchair accessibility of a home or something, but it's all dependent on the person who’s renting the home and what their understanding of what accessible is.”
Limitations We performed a qualitative study of 20 mobility impaired participants located in the eastern US. Future work should consider a larger, more diverse sample and compare perspectives. Our study focused solely on mobility-impaired users, future work should include people with other physical or sensory impairments. Finally, though useful in structuring the participatory design activity, our use of templates in Part 2 may have affected our results.
CONCLUSION This paper provides the first work investigating modern and desired methods and technologies for evaluating built environment accessibility. We conducted a three-part study with 20 mobility impaired participants. Part 1 reinforced and extended findings in the literature regarding perspectives of accessibility barriers/facilitators. Through participatory design activities in Part 2 and 3, we uncovered 10 key features of desired ALTs and six key data qualities, which have implications for the design of future ALTs.
ACKNOWLEDGEMENTS We thank Richard Eldridge for his help in designing the study as well as Anthony Li, Niles Rogoff, and Bridget Cheng for some data analysis. This work was supported by an NSF grant (IIS-1302338), a Google Faculty Research Award, and an IBM Ph.D. Fellowship.

REFERENCES 1. Dragan Ahmetovic, Roberto Manduchi, James M.
Coughlan, and Sergio Mascetti. 2015. Zebra Crossing Spotter: Automatic Population of Spatial Databases for Increased Safety of Blind Travelers. The 17th International ACM SIGACCESS Conference on Computers and Accessibility (ASSETS 2015).
2. Airbnb. ADA and FHA Compliance. https://www.airbnb.com/help/article/898/ada-and-fha-compliance
3. Saeideh Bakhshi, Partha Kanuparthy, and David A Shamma. 2015. Understanding Online Reviews: Funny, Cool or Useful? Proceedings of the 18th ACM Conference on Computer Supported Cooperative Work & Social Computing, ACM, 1270–1276. http://doi.org/10.1145/2675133.2675275
4. Michael Batty, Andrew Hudson-Smith, Richard Milton, and Andrew Crooks. 2010. Map mashups, Web 2.0 and the GIS revolution. Annals of GIS 16, 1: 1–13. http://doi.org/10.1080/19475681003700831
5. Linda Beale, Kenneth Field, David Briggs, Phil Picton, and Hugh Matthews. 2006. Mapping for Wheelchair Users: Route Navigation in Urban Spaces. Cartographic Journal, The 43, 1: 68–81. http://doi.org/10.1179/000870406X93517
6. Virginia Braun and Victoria Clarke. 2006. Using thematic analysis in psychology. Qualitative Research in Psychology 3, 2: 77–101. http://doi.org/10.1191/1478088706qp063oa
7. Rosemary D.F. Bromley, David L. Matthews, and Colin J. Thomas. 2007. City centre accessibility for wheelchair users: The consumer perspective and the planning implications. Cities 24, 3: 229–241. http://doi.org/10.1016/j.cities.2007.01.009
8. Bradley J Cardinal and Marc D Spaziani. 2003. ADA Compliance and the Accessibility of Physical Activity Facilities in Western Oregon. American Journal of Health Promotion 17, 3: 197–201. http://doi.org/10.4278/0890-1171-17.3.197
9. George Chin Jr., Mary Beth Rosson, and John M Carroll. 1997. Participatory Analysis: Shared Development of Requirements from Scenarios. Proceedings of the ACM SIGCHI Conference on Human Factors in Computing Systems, ACM, 162–169. http://doi.org/10.1145/258549.258654
10. Richard L Church and James R Marston. 2003. Measuring Accessibility for People with a Disability. Geographical Analysis 35, 1: 83–96.
11. Jacob Cohen. 1960. A Coefficient of Agreement for Nominal Scales. Educational and Psychological Measurement 20 , 1 : 37–46. http://epm.sagepub.com/content/20/1/37.short
12. European Commission. 2014. Economic Impact and Travel Patterns of Accessible Tourism in Europe.
13. Chaohai Ding, Mike Wald, and Gary Wills. 2014. A Survey of Open Accessibility Data. Proceedings of the 11th Web for All Conference, ACM, 37:1–37:4. http://doi.org/10.1145/2596695.2596708
14. Sarah Elwood. 2011. Geographic Information Science: Visualization, visual methods, and the geoweb. Progress in Human Geography 35, 3: 401–408. http://doi.org/10.1177/0309132510374250
15. Matt Flegenheimer. 2014. Suit Seeks to Make Sidewalks More Accessible for Disabled New Yorkers (Viewed Nov 2014). New York Times. http://www.nytimes.com/2014/07/31/nyregion/group-sues-new-york-city-for-upgrades-to-sidewalks.html
16. DionHoe-Lian Goh, LouisianaLiman Sepoetro, Ma Qi, et al. 2007. Mobile Tagging and Accessibility Information Sharing Using a Geospatial Digital Library. In Asian Digital Libraries. Looking Back 10 Years and Forging New Frontiers SE - 38. Springer Berlin Heidelberg, 287–296. http://doi.org/10.1007/978-3-540-77094-7_38
17. David B Gray, Mary Gould, and Jerome E Bickenbach. 2003. Environmental barriers and disability. Journal of architectural and planning research 20, 1: 29–37.
18. Richard Guy and Khai Truong. 2012. CrossingGuard: exploring information content in navigation aids for visually impaired pedestrians. Proceedings of the SIGCHI Conference on Human Factors in Computing Systems (CHI ’12), ACM, 405–414. http://doi.org/10.1145/2207676.2207733
19. Kotaro Hara, Shiri Azenkot, Megan Campbell, et al. 2013. Improving Public Transit Accessibility for Blind Riders by Crowdsourcing Bus Stop Landmark Locations with Google Street View. Proceedings of the 15th International ACM SIGACCESS Conference on Computers and Accessibility Technology, 16:1–16:8.
20. Kotaro Hara, Victoria Le, and Jon Froehlich. 2013. Combining Crowdsourcing and Google Street View to Identify Street-level Accessibility Problems. Proceedings of the SIGCHI Conference on Human Factors in Computing Systems, ACM, 631–640.
21. Kotaro Hara, Jin Sun, David W Jacobs, and Jon E Froehlich. 2014. Tohme: Detecting Curb Ramps in Google Street View Using Crowdsourcing, Computer Vision, and Machine Learning. Proceedings of the 27th annual ACM symposium on User interface software and technology.
22. Harald Holone, Gunnar Misund, and Hakon Holmstedt. 2007. Users Are Doing It For Themselves: Pedestrian Navigation With User Generated Content. The 2007 International Conference on Next Generation Mobile Applications, Services and Technologies (NGMAST 2007): 91–99. http://doi.org/10.1109/NGMAST.2007.4343406
23. Daniel J Hruschka, Deborah Schwartz, Daphne Cobb St.John, Erin Picone-Decaro, Richard A Jenkins, and James W Carey. 2004. Reliability in Coding Open-Ended Data: Lessons Learned from HIV Behavioral Research. Field Methods 16 , 3 : 307–331. http://doi.org/10.1177/1525822X04266540
24. Rob Imrie and Marion Kumar. 1998. Focusing on Disability and Access in the Built Environment. Disability & Society 13, 3: 357–374. http://doi.org/10.1080/09687599826687
25. J A Landay and B A Myers. 2001. Sketching interfaces: toward more human interface design. Computer 34, 3: 56–64. http://doi.org/10.1109/2.910894
26. J Richard Landis and Gary G Koch. 1977. The Measurement of Observer Agreement for Categorical Data. Biometrics 33, 1: 159–174. http://doi.org/10.2307/2529310
27. Hugh Matthews, Linda Beale, Phil Picton, and David Briggs. 2003. Modelling Access with GIS in Urban Systems (MAGUS): capturing the experiences of wheelchair users. Area 35, 1: 34–45. http://doi.org/10.1111/1475-4762.00108
28. C Menkens, J Sussmann, M Al-Ali, et al. 2011. EasyWheel - A Mobile Social Navigation and Support System for Wheelchair Users. Eighth International Conference on Information Technology: New Generations (ITNG), 2011, 859–866. http://doi.org/10.1109/ITNG.2011.149
29. Allan R Meyers, Jennifer J Anderson, Donald R Miller, Kathy Shipp, and Helen Hoenig. 2002. Barriers, facilitators, and access for wheelchair users: substantive and methodologic lessons from a pilot study of environmental effects. Social Science & Medicine 55, 8. http://doi.org/10.1016/S0277-9536(01)00269-6
30. Andrea Nuernberger. 2008. Presenting Accessibility to Mobility-Impaired Travelers (Ph.D. Thesis).
31. Jonathan Raper, Georg Gartner, Hassan Karimi, and Chris Rizos. 2007. Applications of Location-based Services: A Selected Review. J. Locat. Based Serv. 1, 2: 89–111. http://doi.org/10.1080/17489720701862184
32. Marc Rettig. 1994. Prototyping for Tiny Fingers. Commun. ACM 37, 4: 21–27. http://doi.org/10.1145/175276.175288
33. James H Rimmer, Barth Riley, Edward Wang, Amy Rauworth, and Janine Jurkowski. 2004. Physical activity participation among persons with disabilities: Barriers and facilitators. American Journal of Preventive Medicine 26, 5: 419–425. http://doi.org/10.1016/j.amepre.2004.02.002
34. Mary Beth Rosson and John M Carroll. 2009. Scenario-Based Design. Human-computer interaction. Boca Raton
35. Adam D Sobek and Harvey J Miller. 2006. U-Access: a web-based system for routing pedestrians of differing abilities. Journal of Geographical Systems 8, 3: 269–287.
36. The GeoAccess Challenge Team. 2011. Data-Enabled Travel: How Geo-Data Can Support Inclusive Transportation, Tourism, and Navigation through Communities.
37. Neela Thapar, Grace Warner, Mari-Lynn Drainoni, et al. 2004. A pilot study of functional access to public buildings and facilities for persons with impairments. Disability and Rehabilitation 26, 5: 280–289. http://doi.org/10.1080/09638280310001649543
38. Maryam Tohidi, William Buxton, Ronald Baecker, and Abigail Sellen. 2006. User Sketches: A Quick, Inexpensive, and Effective Way to Elicit More Reflective User Feedback. Proceedings of the 4th Nordic Conference on Human-computer Interaction: Changing Roles, ACM,
105–114. http://doi.org/10.1145/1182475.1182487 39. Japan Ministry of Land Infrastructure Transport and
Tourism. 2014. The Guidelines for Installing Services to Support Pedestrian Mobility. http://www.mlit.go.jp/common/001042305.pdf
40. Federal Highway Administration U.S. Department of Transportation. 2011. Technological Innovations in Transportation for People with Disabilities.
41. Federal Highway Administration U.S. Department of Transportation. 2015. Request For Information DTFH6115RI00008.
42. United States Access Board. 2011. Proposed Accessibility Guidelines for Pedestrian Facilities in the Public Right-of-Way. http://www.access-board.gov/attachments/article/743/nprm.pdf
43. Civil Rights Division United States Department of Justice. ADA Guide for Small Businesses.
44. Civil Rights Division United States Department of Justice. Wheelchairs, Mobility Aids, and Other Power-Driven Mobility Devices.
45. Civil Rights Division United States Department of Justice. 1990. Americans with Disabilities Act of 1990, Pub. L. No. 101-336, 104 Stat. 328.
46. United States Department of Justice. 2010. 2010 ADA Standards for Accessible Design.
47. John Vines, Peter C Wright, David Silver, Maggie Winchcombe, and Patrick Olivier. 2015. Authenticity, Relatability and Collaborative Approaches to Sharing Knowledge About Assistive Living Technology. Proceedings of the 18th ACM Conference on Computer Supported Cooperative Work & Social Computing, ACM, 82–94. http://doi.org/10.1145/2675133.2675222
48. Thorsten Völkel and Gerhard Weber. 2008. RouteCheckr: Personalized Multicriteria Routing for Mobility Impaired Pedestrians. Proceedings of the 10th International ACM SIGACCESS Conference on Computers and Accessibility, ACM, 185–192. http://doi.org/10.1145/1414471.1414506
49. Richard Y Wang and Diane M Strong. 1996. Beyond Accuracy: What Data Quality Means to Data Consumers. Journal of Management Information Systems 12, 4: 5–33. http://doi.org/10.2307/40398176
50. Wheelmap (Viewed Sept 2015). http://wheelmap.org/en/ 51. AXSMAP (Viewed Sept 2015). http://www.axsmap.com/ 52. Handimap http://www.handimap.org/ (Viewed 2014). 53. Yelp (Viewed Sept 2015). http://www.yelp.com/ 54. TripAdvisor (Viewed Sept 2015).
http://www.tripadvisor.com/ 55. Walk Score.
https://www.walkscore.com/methodology.shtml 56. Planet Labs. https://www.planet.com/ 57. Placemeter. https://www.placemeter.com/ 58. 2011. San Francisco Municipal Transportation – Case
Study. http://www.lytx.com/our-markets/fleet/case-study-san-francisco-municipal-transportation-agency