the demographic impact of the subprime mortgage meltdown impact of the subprime... · the...
TRANSCRIPT

The Demographic Impact of the Subprime Mortgage Meltdown By Maurice Jourdain-Earl

Page i The Demographic Impact of the Subprime Mortgage Meltdown
Purpose ....................................................................................................1
About HmdA data ...............................................................................1
Limitations Of HmdA data ..................................................................2
Subprime Rate Loans And The Current Mortgage Foreclosure Crisis ...................................................................................3
Methodology ............................................................................................6
Summary Of Findings .............................................................................7
Highlights Of 2004-2006 Subprime Rate Lending By Race And Ethnicity ...........................................................................................8
Distribution Analysis Of 2006 Subprime Rate Loans .........................12
Subprime Rate Loans By Loan Purpose ...........................................14
Subprime Rate Loans By Borrower Income ......................................16
Gender distribution Of Subprime Rate Loans ..................................19
Subprime Rate Loans By Census Tract Income ...............................22
Subprime Rate Loans By Race And Census Tract Percent minority ................................................................................24
Conclusion .............................................................................................26
About The Author ..............................................................................27
About ComplianceTech .....................................................................27
About Lending Patterns™ ..................................................................27
Table of Contents

Page ii The Demographic Impact of the Subprime Mortgage Meltdown
Table 1: Loan Type and Percent of Foreclosures started ..........................4
Table 2: 2006 “Loans” with a HmdA Spread by Race .............................12
Table 3: Percent of Loans by Race and Percent of Loans with a Spread by Race ....................................................................................13
Table 4: Loan Purpose by HmdA Spread ................................................14
Table 5: 2006 Loans with a Spread by Borrower Income ........................16
Table 6: Gender and 2006 Loans with a Spread .....................................19
Table 7: 2006 Subprime Rate Loans by CENSUS Tract Income.............22
Table 8: Tract Percent minority and Loans with a Spread .......................24
Index of Tables

Page iii The Demographic Impact of the Subprime Mortgage Meltdown
Figure 1: 2004-2006 Percent of Subprime Rate Loans by Race ...............8
Figure 2: 2004-2006 Average Spread on Subprime Rate Loans by Race .....................................................................................................9
Figure 3: 2004-2006 Count of Subprime Rate Loans by Race ...............10
Figure 4: 2004-2006 Percent of Subprime Rate Loans by Tract Percent minority .............................................................................11
Figure 5: 2006 Frequency and magnitude of Loans with a HmdA Spread by Race ...........................................................................12
Figure 6: 2006 Subprime Rate loans by Loan Purpose ..........................15
Figure 7: Loans with Spread by Borrower Income ..................................16
Figure 8: 2006 Subprime Rate Loans by Race and Income ...................17
Figure 9: Percent distribution of Subprime Rate Loans by Race and Income ....................................................................................17
Figure 10: Percent of Subprime Rate Loans by Race and Gender .........20
Figure 11: Subprime Rate Loans by Race and Gender ...........................21
Figure 12: 2006 Subprime Rate Loans by Census Tract Income ............23
Figure 13: 2006 Count of Subprime Rate Loans by Race and Tract Percent minority .............................................................................25
Figure 14: 2006 Percent of Subprime Rate Loans by Race and Census Tract Percent minority ................................................................25
Index of Figures

Page 1 of 27 The Demographic Impact of the Subprime Mortgage Meltdown
The purpose of this study is to develop an understanding of the potential impact of the current mortgage crisis on minorities and to dispel erroneous assumptions about subprime lending that could make emerging housing policies less effective. A common assumption is that subprime rate lending1 is more prevalent with minorities and low-income borrowers. The problem with portraying subprime rate lending and the foreclosure crisis, as a minority and low-income issue is its effects on how solutions will be approached. If, it is believed that subprime rate loans were predominately made to marginal segments of society (Black, Hispanic or low-income) housing policymakers may approach solutions with bias assumptions about minorities and minority qualifications (low education, bad credit, and low-paying jobs, etc.). Thus, there may a tendency to write-off the subprime lending debacle as a type of affirmative action gone bad.
This study will show that subprime rate lending occurred more with non-Hispanic Whites and upper income borrowers. Therefore, the current housing crisis is a broader problem than just with minority and low-income borrowers. This is accomplished by using 2006 Home mortgage disclosure Act data (HmdA)2 to analyze the demographic distribution of subprime rate loans in order to understand the impact of the “Subprime mortgage meltdown” on different income, racial and ethnic groups. It is hoped that this information will be used strategically by congress, lenders, servicers, federal and state bank regulators, state attorney generals, state and local housing organizations, home loan counseling groups, researchers, community organizations and other interested parties to improve the formulation of housing policy, fair lending enforcement, consumer protection initiatives, and the implementation of loss mitigation activities to help keep families in their homes.
The premise of this report is that beliefs about the demographic distribution of subprime rate loans influence ideas about the housing crisis. Therefore the focus of this study is to analyze the demographic distribution of subprime rate loans as a means to influence housing policy. In addition, the study seeks to use the distribution of subprime rate loans as an indicator of the expected future pattern of mortgage default and foreclosure activity. With these goals in mind, this study is an analysis of the distribution and cost of higher-priced 2006 loans by ethnicity, race, gender and income, as well as
1 In this study subprime rate loans are limited to transactions with a HmdA reportable spread that are “conventional, 1st lien, 1-4 family unit, owner occupied, home purchase and refinance loans. Government, home improvement, and multifamily loans are excluded.
2 http://www.ffiec.gov/HMDA/pdf/regulationc2004.pdf, pg.1
geographically by census tract percent minority.
A lot is at stake. The impact of the subprime market and subprime foreclosures matter because homeownership is by far the most important wealth-building tool in this country. For millions of families, it ultimately makes the difference between merely surviving between paychecks, or building savings for a better future. Nearly 60 percent of the total wealth held by middle-class families resides in their home equity—the value of their home minus the amount they owe on it. For African-American and Hispanic families, the share is much higher, topping 88 percent for both groups.3
About HmdA data
Congress enacted HmdA in 1975 to: “provide the public with information to judge whether lenders are serving their communities; to enhance enforcement of laws prohibiting discrimination in lending; and to provide private investors and public agencies with information to guide investments in housing.”4 HmdA requires mortgage lenders located in metropolitan areas to collect data on their mortgage application transactions, report the data annually to the government, and make the data publicly available.
HmdA requires reporting of the geographic location of originated and purchased home loans. HmdA data also includes information about denied home loan applications and the race, sex and income of the applicant or borrower. Subsequent to the 1990 amendment to HmdA that required race and sex information to be reported, some lenders were accused and sued for discrimination, alleging that minorities were disproportionately denied access to home mortgage credit compared to non-Hispanic Whites.
Since the 2004 reporting year, HmdA requires lenders to report loan price information in the form of a “rate spread.” Lenders must report the spread between the annual percentage rate (APR)5 on a loan and the rate on a Treasury security of comparable maturity. Lenders are only required
3 Testimony of Josh Nassar, Center for Responsible Lending Before the U.S. House Committee on Oversight and Government Reform, pg. 2 “Foreclosure, Predatory mortgage and Payday Lending in America’s Cities”, march 21, 2007
4 http://www.ffiec.gov/HMDA/pdf/regulationc2004.pdf, pg.1
5 The APR represents the cost of credit to the consumer. It captures not just the contract-based interest rate on a loan, but also the points and fees a consumer pays and other finance charges such as premiums for private mortgage insurance. Lenders must calculate and disclose the APR to consumers under a separate law, the Truth in Lending Act.
Purpose

Page 2 of 27 The Demographic Impact of the Subprime Mortgage Meltdown
to report spreads on loans above designated thresholds. Therefore, rate spreads are not reported for lower cost loans.
The threshold set by the Board in Regulation C for first-lien loans is three percentage points above the Treasury security of comparable maturity. For second-lien loans, which tend to have higher prices, the threshold is five percentage points above the Treasury security of comparable maturity. The Board chose these thresholds in the belief that they would exclude the vast majority of prime-rate loans and include the vast majority of subprime rate loans. From year-to-year, however, the proportion of subprime-rate loans that have prices reported might vary because of changes in the interest rate environment.6
The growth of the higher-priced mortgage market has raised concerns that consumers lack the information needed to negotiate the best terms and therefore might be vulnerable to unfair or deceptive practices. In addition, the wider range of prices in this market has raised concerns that price differences might reflect unlawful discrimination rather than legitimate risk- and cost-related factors. Lastly, the growth of the higher-priced mortgage market is believed to be contributing greatly to an increase in mortgage defaults and foreclosures.
In short, the requirement to report the HmdA spread is designed to distinguish subprime rate loans from prime rate loans. Subprime lenders in contrast to prime lenders, attract applicants who either have impaired credit or perceive themselves to have bad credit. Theoretically, subprime lenders charge higher interest rates to compensate for the additional credit risk. However, subprime borrowers may often be exposed to non-risk related discretionary charges. In recent years, an increased use of risk-based pricing has blurred the line between prime and subprime lenders. The HmdA rate spread information was created to illuminate the distinction and bring more clarity to prime and subprime rate lending. The HmdA rate spread is focused on higher cost loans as opposed to lenders who may be classified as high-cost lenders. This enables users of HmdA data to identify higher cost subprime rate loans, whether prime or subprime lenders originate them.
6 Frequently Asked Questions About The New HmdA data, Federal Reserve Board, April 3, 2006
Limitations Of HmdA data
HmdA data are the most complete dataset used to analyze home mortgage lending in America by race, ethnicity and gender. The most significant limitation of HMDA data is borrower credit qualification information is not available. Credit criteria, such as credit score, loan-to-value, debt-to income ratios, and housing payment ratios used by lenders to underwrite and price home mortgage loans, is not available.
HmdA data also do not include information on loan terms and features needed to ascertain how loans are structured. For example, HmdA data do not include whether loans have features such as prepayment penalties, interest-only, negative amortization, or balloon payments. HmdA data also do not include whether loans are fixed rate or adjustable rate mortgages (ARms). It is suspected that many ARm loans originated in recent years have discounted initial teaser rates that will reset in two or three years. Finally, HmdA data do not reveal how loans are sourced by lenders, i.e. by retail loan officers who work as employees of a lender or by independent mortgage brokers. Loans with many of the aforementioned features and attributes are known to be major contributors to the current increase in mortgage defaults and foreclosures.
These HmdA data limitations limit the ability to know important details about loan transactions. For example, how loans are underwritten and priced, whether Yield Spread Premiums (YSP) or overages7 contribute to the origination of higher-priced loans, or whether higher-priced loans are based on borrowers’ legitimate credit criteria or whether the overcharges were purely discretionary. Given these HmdA data limitations, this study has a single focus – to report on the demographic disparities in the 2006 distribution of higher priced subprime rate loans.
7 YSP or overages are extra compensation paid by a lender to loan officers or brokers for delivering an interest rate on a loan higher than the risk-based price.
Purpose

Page 3 of 27 The Demographic Impact of the Subprime Mortgage Meltdown
The subprime market is intended to provide home loans to people with impaired or limited credit histories. However, there is evidence that many families who receive subprime mortgages could qualify for prime loans, but are instead “steered” into accepting higher-cost subprime loans. The belief that some subprime loan recipients’ could qualify for prime rate loans suggests that some borrowers are overcharged for mortgage credit, above what their risk-based price may warrant. If this is true, the overcharges drain money from homeowners and communities.
To what degree prime eligible borrowers misplaced into subprime has contributed to the foreclosure crisis is unknown. Also unknown is the extent of illegal steering occurring on a prohibited basis, i.e. whether borrowers are steered to higher cost subprime rate loans on a prohibited basis, such as race or ethnicity.8 The subprime misplacement question, steering issues as well as fraud concerns highlights the need for effective regulatory enforcement by the lending regulatory community.9
The Federal Reserve and other federal bank regulators have been criticized by lawmakers for lax regulation of the mortgage market. On July 18, 2007 the New York Times reported that “Representative Barney Frank, chairman of the House Financial Services Committee, threatened to strip the Federal Reserve of its authority to write rules against mortgage abuses if the central bank did not act quickly.” The article further reported that Christopher dodd, who leads the Senate Banking Committee, said that “a chronology of regulatory neglect allowed the problems in the subprime market to go unchecked.”
many factors contributed to the growth of subprime lending, such as increases in capital made possible by securitization,
8 mike Hudson and E. Scott Reckard, more Homeowners with Good Credit Getting Stuck in Higher-Rate Loans, L.A. Times, p. A-1 (October 24, 2005). For most types of subprime loans, African-Americans and Latino borrowers are more likely to be given a higher-cost loan even after controlling for legitimate risk factors. debbie Gruenstein Bocian, Keith S. Ernst and Wei Li, Unfair Lending: The Effect of Race and Ethnicity on the Price of Subprime mortgages, Center for Responsible Lending, (may 31, 2006) at http://www.responsiblelending.org/issues/mortgage/reports/page.jsp?itemId=2937 1010;
9 The terms “bank regulator” or “lending regulator” is used interchangeably to refer to the enforcement arms of: the Board of Governors of the Federal Reserve (FRS or Fed) regulating lending affiliate of bank holding companies and state chartered member banks; the Federal deposit Insurance Corporation (FdIC) regulating state-chartered non-member banks; the Office of the Comptroller of the Currency (OCC) regulating national banks; the Office of Thrift Supervision (OTS) overseeing federal savings and loans and federal savings banks; the National Credit Union Administration (NCUA) regulating federally charted credit unions and department of Housing and Urban development (HUd).
an increase in risk-based pricing facilitated by technological advances, and the deregulation of the banking industry.”10 Banking deregulation enabled lenders to offer more varied loan products, which were attractive to more varied consumers, and further gave incentives for more lenders to enter the market. Numerous laws opened the door for the development of the subprime market. Following is a synopsis of various laws and party Administrations that contributed to the growth of the subprime mortgage market:
depository Institutions deregulation and monetary Control Act (“dIdmCA”). dIdmCA, 1980 (Carter Administration)
• Helped the Savings and Loan (“S&L”) industry stay competitive with non-federally chartered banks where consumers received higher rates of return.
• Enabled the S&Ls to recoup the higher interest rates they were paying by allowing them to preempt state usury laws for loans to consumers secured by first liens on their homes.
Alternative mortgage Transaction Parity Act, 1982 (Reagan Administration)
• Extended federal mortgage-lending regulations to most residential loans, including the permitted use of variable interest and balloon payments. At the time this law helped to standardize a wide variety of variable rate mortgages. Nevertheless, it left room for lenders to create variable rate loans that would be more risky in a Subprime context.
Tax Reform Act of 1986 (“TRA”) (Reagan Administration)
• Increased the demand for mortgage debt because it prohibited the deduction of interest on consumer loans, yet allowed interest deductions on mortgages for a primary residence as well as one additional home. This fueled the growth in home equity lending, a major component of the subprime lending industry.
Financial Institutions Reform Act of 1989 (“FIRREA”) (Bush, George H.W.)
• Addressed the costly S&L failures of the 1980’s and created incentives for S&Ls to operate as thinly capitalized mortgage brokers relying on the secondary market for loans.
Gramm-Leach-Bliley Act, 1999 (Clinton)
• Permitted financial service providers to merge with insurers.
10 Howell, Benjamin, Exploiting Race and Space: Concentrated Subprime Lending as Housing discrimination, California Law Review, January, 2006.
Subprime Rate Loans And The Current Mortgage Foreclosure Crisis

Page 4 of 27 The Demographic Impact of the Subprime Mortgage Meltdown
“Some 80 percent of outstanding U.S. mortgages are prime, while 14 percent are subprime and 6 percent fall into the near-prime category. These numbers, however, mask the explosive growth of nonprime/subprime mortgages. The subprime market sector grew from $150 billion in 2000 to $650 billion in 2007, or roughly 25 percent of the overall mortgage market. Subprime and near-prime loans increased dramatically, from 9 percent of newly originated securitized mortgages in 2001 to 40 percent in 2006.”11
The relationship between subprime rate loans and defaults and foreclosures is undeniable. Numerous surveys and reports point to a strong relationship between subprime rate loans and the foreclosure crisis. The delinquency Survey of the mortgage Bankers Association, and two recent reports, one entitled “Analysis of Subprime mortgage Servicing Performance” (data Report 1 and 2) by The State Foreclosure Prevention Working Group (State Working Group)12 and another entitled “OCC mortgage metrics Report – Analysis and disclosure of National Bank mortgage Loan data” by the Office of the Comptroller of the Currency all point to subprime rate loans as a major reason for the foreclosure crisis.
11 The Rise and Fall of Subprime mortgages by danielle dimartino and John V. duca ,Vol. 2, No. 11, November 2007, Economic Letter—Insights from the Federal Reserve Bank of dallas
12 The State Foreclosure Prevention Working Group, formed in the summer of 2007, consists of the Attorneys General of 11 states (Arizona, California, Colorado, Iowa, Illinois, massachusetts, michigan, New York, North Carolina, Ohio, and Texas), two state bank regulators (New York and North Carolina), and the Conference of State Bank Supervisors.
On June 5, 2008, the mortgage Bankers Association of America released its latest delinquency Survey. The survey reported that “the seasonally adjusted total delinquency rate is the highest reported in the mBA survey since 1979” and that “the rate of foreclosure starts and the percent of loans in the process of foreclosure are at the highest levels ever.”13 According to the mBA’s National delinquency Survey, “the delinquency rate for mortgage loans on one-to-four-unit residential properties stood at 6.35 percent of all loans outstanding at the end of the first quarter of 2008 on a seasonally adjusted (SA) basis, up 53 basis points from the fourth quarter of 2007 and up 151 basis points from one year ago. The survey also reported that “the percentage of loans in the foreclosure process was 2.47 percent of all loans outstanding at the end of the first quarter, an increase of 43 basis points from the fourth quarter of 2007 and 119 basis points from one year ago.”14 Finally, and of most significance to this study, the survey included a table that shows prime and subprime rate loans as a percent of loans outstanding relative to the percent of foreclosures started:
13 delinquencies and Foreclosures Increase in Latest mBA National delinquency Survey, mortgage Bankers Association of America, pg. 1,June 5, 2008
14 Ibid
Subprime Rate Loans And The Current Mortgage Foreclosure Crisis
TABLE 1: LOAN TYPE AND PERCENT OF FORECLOSURES STARTED

Page 5 of 27 The Demographic Impact of the Subprime Mortgage Meltdown
Table 1 shows that “while subprime ARms represent 6 percent of the loans outstanding, they represent 39 percent of the foreclosures” started. Subprime fixed rate loans also represent 6 percent of the loans outstanding and 11 percent of foreclosures started. Together, subprime loans represent 12 percent of loans outstanding, but 50 percent of foreclosures started.
Several studies during the years have shown subprime loans have been disproportionately used by minorities. For example, a study by the department of Housing and Urban development (HUd) of the 1998 Home mortgage disclosure Act (HmdA) data of almost one million mortgages reported nationwide, concluded that there was a disproportionate concentration of subprime lending in minority and low-income neighborhoods.15
more recently, an article in the Washington Post on June 30, 2008, entitled “Subprime mortgages and Race: A Bit of Good News may Be Illusory” by Shankar Vedantam refers to subprime rate loans “as the original domino that set off America’s current economic crisis. But the loans – typically made to people with poor credit – have long been hailed for one reason: They were thought to be a powerful way to increase homeownership rates among minorities, and to provide a mechanism to undo the “redlining” policies of past decades, in which some banks refused to extend loans in predominantly minority neighborhoods, even to applicants with good credit.”
The article also references research conducted by George Washington University sociologist Gregory d. Squires, “who, has been looking at rates of subprime loans issued in about 350 U.S. metropolitan areas”. Squires’ preliminary findings show that subprime loans were indeed more likely to be issued to people with poor credit and those with limited incomes. In the article, Squires’ is credited with saying “we see these loans heavily concentrated in poor neighborhoods and targeted to minority neighborhoods,” “There is some evidence that these neighborhoods were actually targeted – that lenders have gone after people whom they think are
15 U.S. department of Housing and Urban development, UNEQUAL BURDEN:INCOME & RACIAL DISPARITIES IN SUBPRIME LENDING IN AmERICA
less sophisticated borrowers, including single women and the elderly.”
In addition, the 2007 Annual minority Lending Report by ComplianceTech also reported that loans to Blacks and Hispanics were disproportionately subprime. This concentration of subprime activity leaves these homeowners with significant costs of subprime loans. The Center for Responsible Lending (CRL) recently published numerous research reports that show African Americans and Latinos receive a disproportionate share of subprime loans, even when they have similar credit scores to non-Hispanic White borrowers. In december 2007, CRL issued a report showing how subprime home loans are resulting in a devastating epidemic of foreclosures.16
despite overwhelming evidence that support the above findings, this report reveals that the majority of subprime rate loans originated in 2006 were granted to non-Hispanic Whites and upper income borrowers. The same pattern occurred in 2005. In 2004, more subprime rate loans were originated for non-Hispanic Whites, but middle-income borrowers had the highest share. These findings are contrary to the way subprime rate lending is commonly portrayed. Popular media myths and erroneous assumptions about subprime rate loans are continuously presented as if subprime rate lending was predominately in the domain of minorities and low-income borrowers.
16 Testimony of Josh Nassar, Center for Responsible Lending Before the U.S. House Committee on Oversight and Government Reform, pg. 2 “Foreclosure, Predatory mortgage and Payday Lending in America’s Cities”, march 21, 2007
Subprime Rate Loans And The Current Mortgage Foreclosure Crisis

Page 6 of 27 The Demographic Impact of the Subprime Mortgage Meltdown
LendingPatterns™, an online HmdA analysis tool developed by ComplianceTech, was used extensively to mine the HmdA data to analyze the lending patterns of all HmdA reporting lenders in the United States by race, income, gender and geography. The online system produces reports by the entire United States, metropolitan Statistical Areas (mSA), states, counties, census tracts and for the 2006 HmdA data, by Congressional districts of the 110th Congress. Using LendingPatterns™ conventional, 1st lien, 1 to 4 family, owner-occupied, home purchase and refinance loans with a HMDA reported spread were isolated.
The study describes the overall distribution of the frequency and magnitude of subprime rate loans for the years 2004 to 2006. Looking back at prior years, the study provides a recent historical perspective on the distribution of subprime rate loans. The remainder of the study focuses only on loans originated in 2006. The 2006 loans are analyzed by race and ethnicity, income of borrowers, gender, census tract income, and census tract percent minority.
Race and ethnicity is limited to White, Black, Hispanic, Asian, Native American and Hawaiian. multi-race, unknown and Not Available (NA) race categories are excluded. Income of borrowers and census tracts are characterized by the Community Reinvestment Act (CRA)17 classifications of low, moderate, middle and upper income. These income classifications are calculated using borrower and census tract income relative to the median income of metropolitan Statistical Areas (mSA).
Gender distribution is based on whether the primary applicant’s gender is male or female or, male or female without a co-applicant. It is not known whether borrowers without co-applicants are in fact single. HmdA data only show that no co-applicant was on the loan application. Same gender, unknown and NA are included in the gender analysis.
17 The Community Reinvestment Act is intended to encourage depository institutions to help meet the credit needs of the communities in which they operate, including low- and moderate-income neighborhoods, consistent with safe and sound banking operations. It was enacted by the Congress in 1977 (12 U.S.C. 2901) and is implemented by Regulations 12 CFR parts 25, 228, 345 and 563e
The loan amount categories are conforming and jumbo. Conforming loans are those that conform to the loan purchase limits of Fannie mae and Freddie mac (less than or equal to $417,000 in 2006). Jumbo loans are those with a loan amount exceeding $417,000. Although jumbo loans demand a higher price, they are not analyzed separately because the focus of this study is on the 1st lien loans that exceed the three percentage point threshold for HmdA spread reporting.
Finally, the census tract percent minority analysis uses 2000 Census data to stratify census tracts by their percent of minority inhabitants. All subprime rate loans are distributed cross census tracts in 10 percent increments, i.e. a range from 0% to 100% minority.
Methodology

Page 7 of 27 The Demographic Impact of the Subprime Mortgage Meltdown
• The overall rate of subprime rate lending in 2006 was 27.42% with an average spread of 5.18%.
• During the period of 2004-2006, Whites had more subprime rate loans than all minorities combined. However, in each year, the White percent of subprime rate loans was lower than all minorities, except Asians. Whites and Asians had average spreads less than the overall average at 5.09% and 4.95%, respectively.
• Whites had 70.82% of the 2006 loans and 56.23% of the subprime rate loans with a spread. Asians share of overall loans at 4.48% was higher than their 2.85% share of subprime rate loans. By contrast, Blacks and Hispanics, and Native Americans and Hawaiians, albeit at much lower volumes, had a higher share of subprime rate loans than their share of loans overall. For example, Blacks and Hispanics had 9.97% and 13.92% of the overall pool of loans, but had 19.18% and 20.76% of the subprime rate loans, respectively. The Native American share of overall loans was 0.32% and 0.40% of subprime rate loans. Finally, the Hawaiian share of overall loans was 0.51% and 0.58% of the subprime rate loans.
• In 2006, the White and Asian percent of subprime rate loans was below the national average at 21.78% and 17.43% respectively. Conversely, Blacks, Hispanics, Native Americans, and Hawaiians all had subprime rate loans above the national average at 52.76%, 40.91%, 33.98%, and 31.46%, respectively.
• From 2004 to 2006, compared to all other racial groups, Blacks had the highest jump in subprime rate lending. during this period the Black incidence of subprime rate loans increased by 71% from 30.84% in 2004, to 50.96% in 2005, and to 52.76% in 2006. Similarly, from 2004 to 2006 the average cost of this high cost lending to Blacks increased by 29%. The Black average spread was 4.28% in 2004, 4.97% in 2005, and 5.50% in 2006.
• Of the 1,917,809 subprime rate loans in 2006, upper-income borrowers had the highest share at 39.37%, followed by 27.55% for middle-income borrowers and 20.99% for moderate-income borrowers. Contrary to popular belief, low-income borrowers had only 149,173, or 7.57%, of 2006 subprime rate loans.
• Upper-income borrowers from all racial groups had the largest number of subprime rate loans, followed by middle, moderate and low-income borrowers.
• Middle-income borrowers from all racial groups had the second highest use of subprime rate loans, followed by moderate-income borrowers.
• The 2006 gender distribution shows a pattern where males and females without co-applicants had the highest use of subprime rate loans in 2006 at 32.60% and 32.21%, respectively. Combined, these presumably single borrowers accounted for 64.81% of the 2006 subprime rate loans.
• Middle-income census tracts had the largest number and share of subprime rate loans at 1,049,232, or 53.2%. moderate and upper-income census tracts were almost even at 21.87% and 21.40%, respectively. Low-income census tracts had the second highest proportion of subprime rate loans (47.51%), the highest average spread (5.43%), but the smallest share of all select 2006 subprime rate loans at 3.15%.
• Non-Hispanic White subprime rate loans were concentrated in predominately White areas. Of the 1,108,679 non-Hispanic White subprime rate loans originated in 2006, 868,806 or 78.36% were located in census tracts less than 30 percent minority. The largest block of non-Hispanic White subprime rate loans (473,397 or 42.70%) were located in census tracts less than 10% minority.
• Black subprime borrowers were located both in predominately White census tracts as well as highly concentrated in predominately minority census tracts. In fact, the Black volume of subprime rate loans in census tracts less than 30% minority totaled 97,693, slightly more than the 91,906 subprime rate loans in census tracts 90-100% minority. Interestingly, the Black low (20,307) and high (39,092) was in census tracts <10% minority and 10 to 20% minority. The next highest Black subprime rate loan count was 38,294 in census tracts 20 to 30% minority.
• The largest block of Hispanic subprime rate loans were in census tracts 90 to 100% minority (62,284). Hispanics also had large subprime rate loan volumes in census tracts 80 to 90% minority, 20 to 30% minority, and 70 to 80% minority. In fact, Hispanics had more than 37,000 subprime rate loans in all 10% census tract segments, except <10%, where they had 20,794 subprime rate loans.
Summary Of Findings

Page 8 of 27 The Demographic Impact of the Subprime Mortgage Meltdown
during the period of 2004-2006, Black Americans, compared to other racial groups, experienced the largest percentage build-up of subprime rate loans. (Figure 1)
The vast build-up of higher cost subprime rate loans with Blacks is likely to translate into a disproportionately larger percent of loans that will experience mortgage defaults and foreclosures. In 2004, the first year HMDA pricing information was reported by lenders, more than 30 percent of the Black conventional first lien 1 to 4 family home purchase and refinance loans were comprised of higher-cost subprime rate loans. This was followed by a frequency greater than 50% in 2005 and 2006. during the same period, Blacks also had the highest average spread on subprime rate loans. (Figure 2)
Highlights Of 2004-2006 Subprime Rate Lending By Race And Ethnicity
FIGURE 1: 2004-2006 PERCENT OF SUBPRIME RATE LOANS BY RACE

Page 9 of 27 The Demographic Impact of the Subprime Mortgage Meltdown
The trend with Hispanics, Native Americans and Hawaiians, while similar to Blacks, was not as high. Each of the above groups however, had a higher frequency and higher average spread on subprime rate loans than Whites or Asians. In fact, Asians had the lowest frequency and magnitude of loans with a HmdA reported spread. Thus, percentage-wise, Hispanics, Native Americans and Hawaiians are also more likely to experience a higher proportion of mortgage defaults and foreclosures.
With respect to the number of subprime rate loans during the three-year period, there is a large difference by race. In each year, Whites had more subprime rate loans than all minority groups combined. (Figure 3) Among minorities, Hispanics had the largest volume of subprime rate loans, followed by Blacks, with much smaller numbers for Asians, Native Americans and Hawaiians.
Highlights Of 2004-2006 Subprime Rate Lending By Race And Ethnicity
FIGURE 2: 2004-2006 AVERAGE SPREAD ON SUBPRIME RATE LOANS BY RACE

Page 10 of 27 The Demographic Impact of the Subprime Mortgage Meltdown
White homeowners are not going to be insulated from the subprime mortgage meltdown. The massive numbers of White subprime rate loans indicate that it is highly probable that Whites will also experience an increase in mortgage defaults and foreclosures. Percentage-wise, however, the incidence of foreclosures in Black and Hispanic neighborhoods is predicted to be more concentrated than in White communities. Blacks and Hispanics had a significant number of higher-cost subprime loans and they had a much higher proportion of such loans. Thus, the high concentration of subprime rate loans in Black and Hispanic communities is likely to translate into a higher number and percent of mortgage defaults and foreclosures.
Foreclosures in the subprime market have eroded and are projected to continue to erode some of the gains in homeownership rates for minority households. For example, CRL estimates “that the 2005 vintage of subprime loans will lead to 98,025 foreclosures by Black homeowners relative to only 50,925 new Black homeowners, or a net reduction in 47,101 Black homeowners.”18 Similarly, CRL estimates “a net decline in homeownership among Hispanic families of
18 Center for Responsible Lending, “Subprime Lending: A Net drain on Homeownership,” CRL Issue Paper No. 14, march 27, 2007, available at http://www.responsiblelending.org/page.jsp?itemId=3203203 1.
37,693.”19 These findings are evidence that recent gains in Black and Hispanic homeownership rates are likely to be lost.
CRL studies show that “foreclosures can have a significant impact in a community where the foreclosed property is located. This is particularly true when the factors that led to one foreclosure drive a concentration of foreclosures in the same neighborhood, for example in a spatial concentration of subprime lending. A concentration of home foreclosures in a neighborhood hurts property values in several ways. A glut of foreclosed homes for sale depresses home market values for the other owners. Neighboring businesses often experience a direct monetary loss from reduced sales and neighborhood landlords experience a loss or reduction in rental income. moreover, house price declines can also affect economic activity through their effect on household wealth. Econometric work has established that household wealth, along with income, helps to determine the level of aggregate consumption. Higher levels of wealth lead to higher consumption, all things being equal. Since declines in home prices reduce wealth, they reduce consumption and thus output and employment.”20
19 Ibid
Highlights Of 2004-2006 Subprime Rate Lending By Race And Ethnicity
FIGURE 3: 2004-2006 COUNT OF SUBPRIME RATE LOANS BY RACE

Page 11 of 27 The Demographic Impact of the Subprime Mortgage Meltdown
In conclusion, the pattern and trend of subprime rate lending during 2004-2006 indicate that Whites are likely to have a higher volume of loans that might experience mortgage defaults and foreclosures, but Blacks and Hispanics are more likely to be disproportionately impacted, and these events are more likely to be heavily concentrated in high minority neighborhoods. (Figure 4) The HmdA data show a consistent pattern where the percent of subprime rate loans increase as census tracts become increasingly more minority.
20 The Subprime Lending Crisis, The Economic Impact on Wealth, Property Values and Tax Revenues, and How We Got Here, Report and Recommendations by the majority Staff of the Joint Economic Committee, Senator Charles E. Schumer, Chairman, Rep. Carolyn B. maloney, Vice Chair, October, 2007, pg. 13-14, http://jec.senate.gov/documents/Reports/10.25.07OctoberSubprimeReport.pdf
Highlights Of 2004-2006 Subprime Rate Lending By Race And Ethnicity
FIGURE 4: 2004-2006 PERCENT OF SUBPRIME RATE LOANS BY TRACT PERCENT MINORITY

Page 12 of 27 The Demographic Impact of the Subprime Mortgage Meltdown
In 2006, the HmdA data reported 7,191,015 conventional, 1st lien, 1 to 4 family, owner occupied, home purchase and refinance loans where the race of the borrower was known. Of these, a HmdA spread was reported on 1,971,809 or 27.42%. The overall average spread on the loans was 5.18% or 218 basis points above the 3 percent 1st lien threshold for reporting. The frequency and magnitude of higher cost subprime rate loans varied widely by race as shown in Table 2 and graphically in Figure 5 below:
Distribution Analysis Of 2006 Subprime Rate Loans
FIGURE 5: 2006 FREQUENCY AND MAGNITUDE OF LOANS WITH A HMDA SPREAD BY RACE
TABLE 2: 2006 “LOANS” WITH A HMDA SPREAD BY RACE

Page 13 of 27 The Demographic Impact of the Subprime Mortgage Meltdown
The White frequency (percent) of subprime rate loans was 21.78% with a magnitude (average spread) of 5.09%. Using the White frequency and magnitude of subprime rate loans as a benchmark, Blacks had the highest difference among all
minorities with a 52.76% frequency and an average spread of 5.50%. Blacks, therefore, received higher cost subprime rate loans 2.42 times the frequency in which Whites received such loans. The difference between the White and Black average spread was 41 basis points.
Hispanics had the second highest disparity in the frequency and magnitude of subprime rate loans compared to Whites. Hispanics had a subprime rate loan frequency of 40.91% or 1.88 times the 21.78% frequency for Whites. The Hispanic average spread was 5.18% or 9 basis points higher than Whites.
Asians were the only minority group whose frequency and magnitude of receiving higher cost subprime rate loans was less than Whites. Asians received higher cost loans 17.43% of the time or 20% less often than Whites. Asians had an average spread of 4.95% or 14 basis points lower than the White average spread. Native Americans and Hawaiians received higher cost loans 33.82% and 31.46% of the time, with an average spread of 5.21% and 5.18%, respectively.
despite the racial disparities in the frequency and magnitude of 2006 subprime rate loans, Whites had more loans overall and more subprime rate loans than all minorities combined.
This is expected since Whites comprise a large majority of the U.S. population. Whites had 70.80% of the loans and 56.23% of the loans with a spread as shown in Table 3 below:
The large number of White subprime rate loans suggests that the problem with increased defaults and foreclosures is not likely to be isolated to minority communities. many White Americans will be adversely affected as well.
Distribution Analysis Of 2006 Subprime Rate Loans
TABLE 3: PERCENT OF LOANS BY RACE AND PERCENT OF LOANS WITH A SPREAD BY RACE

Page 14 of 27 The Demographic Impact of the Subprime Mortgage Meltdown
Subprime Rate Loans By Loan Purpose
In 2006, more subprime rate loans were used to refinance an existing mortgage than to purchase a new home. Of the 1,971,809 subprime rate loans in 2006, refinance loans accounted for 55.82% and home purchase loans 44.18%. Refinance loans had a higher frequency of being higher-cost subprime rate loans at 29.85%, but a lower average spread of 5.11%. The subprime rate frequency for home purchase loans was 24.86% with a higher average spread of 5.27%. (Table 4)
Distribution Analysis Of 2006 Subprime Rate Loans
TABLE 4: LOAN PURPOSE BY HMDA SPREAD

Page 15 of 27 The Demographic Impact of the Subprime Mortgage Meltdown
By race and ethnicity, Hispanics and Asians had a higher percent of subprime rate loans for home purchase at 56.15% and 55.19%, respectively. Other racial groups had a higher percent of subprime rate lending for refinance transactions. The distribution of 2006 subprime rate loans by loan purpose is shown in Figure 6:
Distribution Analysis Of 2006 Subprime Rate Loans
FIGURE 6: 2006 SUBPRIME RATE LOANS BY LOAN PURPOSE

Page 16 of 27 The Demographic Impact of the Subprime Mortgage Meltdown
Subprime Rate Loans By Borrower Income
Overall, the number of loans and the number of loans with a HmdA spread, decrease as borrower income decreases. For example, low-income borrowers had fewer loans than moderate, middle and upper-income borrowers, but of the loans obtained by low-income borrowers, a higher percent were subprime rate loans. Surprisingly, this pattern was not
the same for average spread. moderate and middle-income borrowers had a higher average spread than low-income borrowers. Upper-income borrowers had the highest share (39.37%), but the lowest frequency and lowest average spread of subprime rate loans by borrower income. Table 5 and Figure 7:
Distribution Analysis Of 2006 Subprime Rate Loans
FIGURE 7: LOANS WITH SPREAD BY BORROWER INCOME
TABLE 5: 2006 LOANS WITH A SPREAD BY BORROWER INCOME

Page 17 of 27 The Demographic Impact of the Subprime Mortgage Meltdown
The income distribution pattern for each racial group mirrors the overall pattern; the highest number of subprime rate loans was with upper-income borrowers. As income decreases, the number of subprime rate loans decreased. (Figure 8)
Distribution Analysis Of 2006 Subprime Rate Loans
FIGURE 8: 2006 SUBPRIME RATE LOANS BY RACE AND INCOME

Page 18 of 27 The Demographic Impact of the Subprime Mortgage Meltdown
Percentage-wise, however, the pattern was most pronounced with Asians and Hawaiians, where 62.21% and 57.81% of the respective upper-income borrowers from the two racial groups obtained subprime rate loans. Almost half of upper-income Hispanics had subprime rate loans (49.59%) with differences of 10 to 15% between the other income brackets. Subprime rate loans for upper-income Whites were 37.35% with differences of 6-to-14 percent between the other income brackets.
Unlike other racial groups, Blacks received subprime rate loans fairly evenly across all income brackets. Upper-income Blacks had 30.29% of subprime rate loans while the difference between moderate, middle and upper-income was no more than 2.17%. Low- income Blacks were the only racial group with a double-digit percent of subprime rate loans (11.29%). (Figure 9)
Distribution Analysis Of 2006 Subprime Rate Loans
FIGURE 9: PERCENT DISTRIBUTION OF SUBPRIME RATE LOANS BY RACE AND INCOME

Page 19 of 27 The Demographic Impact of the Subprime Mortgage Meltdown
Gender distribution Of Subprime Rate Loans
All racial groups had a high number and percent of men and women without co-applicants that made up a significant portion of the subprime rate loan population in 2006. Rising real estate costs and home property values apparently prompted many single persons to enter the real estate market. Some entered for the sake of homeownership while others might have made speculative investments, suspecting that home prices would continue to rise. Either way, with a single income, many single borrowers might have sought more creative ways to obtain home loan financing.
The mortgage market accommodated this market segment with loan features that made it easier to qualify. Loans, such as 2/28 and 3/27 adjustable rate mortgages (ARms) started with low teaser rates for the first two or three years of the loan with a rate reset in later years. In all instances the rate resets will produce significant mortgage payment increases. Other non-traditional loan features, such as, pay option ARms, interest only and underwriting features like “no income” and “no asset” verification enabled borrowers to “buy now, but borrow trouble later. “
The gender distribution of subprime rate loans and as a pattern indicator of mortgage defaults and foreclosures might have a significant impact on policy discussions at the federal, state and local level. Single men or women without children who might have difficulty making mortgage payments is one
thing, but if a large portion of the subprime rate borrowers are single men or women head of households with children, the implications of mortgage foreclosures become much more bleak. Families with children could become homeless.
The 2006 gender distribution of subprime rate loans show a pattern whereby males without co-applicants and females without co-applicants (presumably single) had a higher frequency and higher average spread than males or females listed as primary borrowers. There is however, very little disparity between single men and single women in the percent and average spread on subprime rate loans. The frequency of subprime rate loans for males without co-applicants and females without co-applicants was almost even at 32.60% and 32.21%, respectively. The same is true for the average spread on loans made to males without co-applicants and females without co-applicants at 5.23% and 5.24%, respectively.
However, a much wider disparity exists when females were listed as the primary borrower compared to when men were listed as primary. The frequency of subprime rate loans with females as the primary borrower was 29.55% with an average spread of 5.20%. By contrast, when men were listed as the primary borrower, the percent of subprime rate loans was only 18.62% with an average spread of 5.03%. (Table 6)
Distribution Analysis Of 2006 Subprime Rate Loans
TABLE 6: GENDER AND 2006 LOANS WITH A SPREAD
Page 20 of 27 The Demographic Impact of the Subprime Mortgage Meltdown
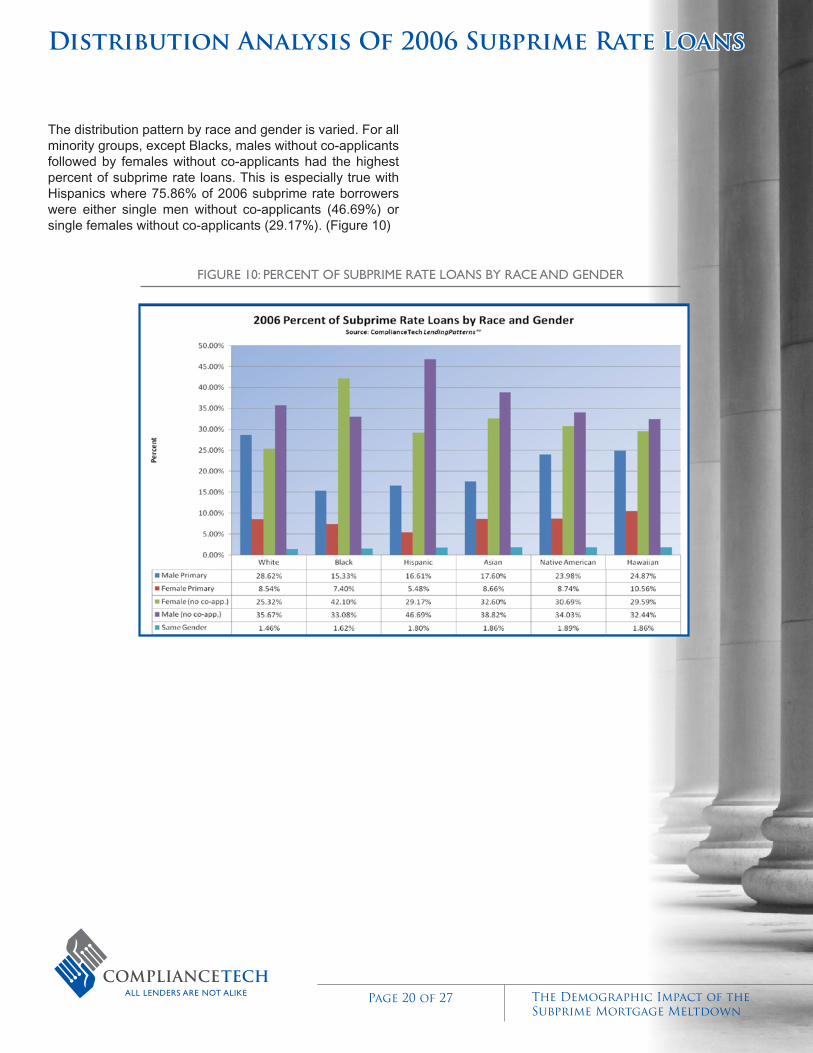
The distribution pattern by race and gender is varied. For all minority groups, except Blacks, males without co-applicants followed by females without co-applicants had the highest percent of subprime rate loans. This is especially true with Hispanics where 75.86% of 2006 subprime rate borrowers were either single men without co-applicants (46.69%) or single females without co-applicants (29.17%). (Figure 10)
Distribution Analysis Of 2006 Subprime Rate Loans
FIGURE 10: PERCENT OF SUBPRIME RATE LOANS BY RACE AND GENDER

Page 21 of 27 The Demographic Impact of the Subprime Mortgage Meltdown
A male as the primary borrower was ranked third with all minorities with respect to subprime rate loans by gender. For blacks however, the highest proportion of subprime rate loans was with females without co-applicants (42.10%) followed by males without co-applicants (33.08%) and then by male as the primary borrower (15.33%).
For Whites, the pattern of subprime rate loans was male dominated. White males without co-applicants accounted for 35.67% of the White subprime rate loans followed by White men as primary borrower at 28.62%. The number of subprime rate loans to White men (395,441) was more than half the number of subprime rate loans to all minority males without co-applicants combined. White females without co-applicants had 25.32% of the White subprime rate loans, and that proportion accounts for more than 48% of all subprime rate loans received by females without co-applicants in 2006. (Figure 11) Females as the primary borrower had the lowest percent of subprime rate loans for all racial groups ranging from a low of 5.48% for Hispanics to a high of 10.56% for Hawaiians.
Distribution Analysis Of 2006 Subprime Rate Loans
FIGURE 11: SUBPRIME RATE LOANS BY RACE AND GENDER

Page 22 of 27 The Demographic Impact of the Subprime Mortgage Meltdown
Subprime Rate Loans By Census Tract Income In 2006 there was an inverse relationship between census tract income and the percent of subprime rate loans. As census tract income increased, the frequency and magnitude of subprime rate loans by census tract income decreased. Low-income census tracts had the highest frequency and
highest magnitude of subprime rate loans at 47.51% and 5.43%, respectively. By contrast, upper-income census tracts had a frequency of 18.25% with an average spread of 5.03%. Table 7 and Figure 12 shows the overall distribution of the 2006 subprime rate loans by census tract income:
Distribution Analysis Of 2006 Subprime Rate Loans
TABLE 7: 2006 SUBPRIME RATE LOANS BY CENSUS TRACT INCOME

Page 23 of 27 The Demographic Impact of the Subprime Mortgage Meltdown
despite the inverse relationship of census tract income and spread frequency and magnitude, the volume of subprime rate loans is skewed dramatically towards middle-income census tracts. middle-income census tracts had 53.21% of the higher cost loans, more than twice the volume of subprime
rate loans in all other census tract income categories combined. moderate and upper census income tracts had an almost even percentage of higher priced loans at 21.87% and 21.40%, respectively. Low-income census tracts had the smallest number and percent of 2006 subprime rate loans.
Distribution Analysis Of 2006 Subprime Rate Loans
FIGURE 12: 2006 SUBPRIME RATE LOANS BY CENSUS TRACT INCOME
Page 24 of 27 The Demographic Impact of the Subprime Mortgage Meltdown
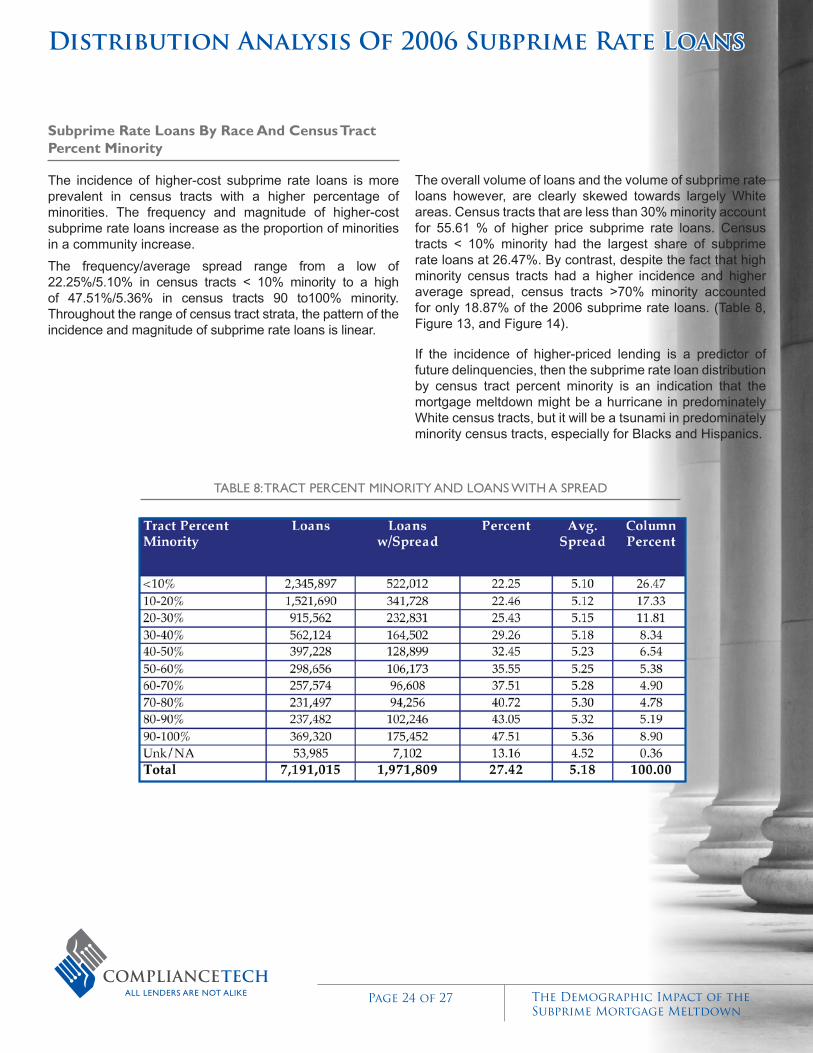
Subprime Rate Loans By Race And Census Tract Percent minority The incidence of higher-cost subprime rate loans is more prevalent in census tracts with a higher percentage of minorities. The frequency and magnitude of higher-cost subprime rate loans increase as the proportion of minorities in a community increase.
The frequency/average spread range from a low of 22.25%/5.10% in census tracts < 10% minority to a high of 47.51%/5.36% in census tracts 90 to100% minority. Throughout the range of census tract strata, the pattern of the incidence and magnitude of subprime rate loans is linear.
The overall volume of loans and the volume of subprime rate loans however, are clearly skewed towards largely White areas. Census tracts that are less than 30% minority account for 55.61 % of higher price subprime rate loans. Census tracts < 10% minority had the largest share of subprime rate loans at 26.47%. By contrast, despite the fact that high minority census tracts had a higher incidence and higher average spread, census tracts >70% minority accounted for only 18.87% of the 2006 subprime rate loans. (Table 8, Figure 13, and Figure 14).
If the incidence of higher-priced lending is a predictor of future delinquencies, then the subprime rate loan distribution by census tract percent minority is an indication that the mortgage meltdown might be a hurricane in predominately White census tracts, but it will be a tsunami in predominately minority census tracts, especially for Blacks and Hispanics.
Distribution Analysis Of 2006 Subprime Rate Loans
TABLE 8: TRACT PERCENT MINORITY AND LOANS WITH A SPREAD

Page 25 of 27 The Demographic Impact of the Subprime Mortgage Meltdown
FIGURE 14: 2006 PERCENT OF SUBPRIME RATE LOANS BY RACE AND CENSUS TRACT PERCENT MINORITY
FIGURE 13: 2006 COUNT OF SUBPRIME RATE LOANS BY RACE AND TRACT PERCENT MINORITY
Distribution Analysis Of 2006 Subprime Rate Loans

Page 26 of 27 The Demographic Impact of the Subprime Mortgage Meltdown
The demographic impact of the Subprime mortgage meltdown has been under-analyzed. A common theme expressed in newspaper articles and periodicals on the subject suggest that the foreclosure crisis is a minority and low-income borrower problem. For example, an article in the Washington Post on June 17, 2008 credits former Federal Reserve Chairman Edward Gramlich with saying “the subprime market, for all its warts, is a promising development, permitting low-income and minority borrowers to participant in credit markets”21 But he added, “a majority of loans are made with very little supervision.”22 The same theme is presented in many other articles, reports and publications.
Although it is true that disproportionate shares of minority loans are subprime, it is also true that more subprime rate loans are made to non-Hispanic Whites. To suggest that the subprime mortgage meltdown and the foreclosure crisis is a minority and low-income problem is tremendously flawed. Indeed, in 2006, non-Hispanic Whites and upper income borrowers had the highest share of (conventional, 1st lien, 1-4 family, owner-occupied, home purchase/refinance) subprime rate loans. moreover, the majority of subprime rate loans originated in 2006 were clearly skewed towards predominately-White areas (census tracts less than 30 percent minority).
The problem with portraying the foreclosure crisis as a minority and low-income problem is that it affects how solutions will be approached. If, on one hand, it is believed that subprime rate loans were predominately made to marginal segments of society (Black, Hispanic or low-income) housing policymakers may approach solutions with bias assumptions about minorities and minority qualifications (low education, bad credit, and low-paying jobs, etc.). Thus, there may a tendency to write-off the subprime lending debacle as a type of affirmative action gone bad. On the other hand, if it is believed that the foreclosure crisis affects broader and more demographically diverse segments of society then a more
21 Washington Post, June 17, 2008 “The Bubble –How homeowners missed mortgage payments set off widespread problems and woke up the Fed”, pg.A9
22 Ibid.
politically responsible approach is likely, thereby changing the tone, climate and context of how solutions are crafted.
Besides race and ethnicity, understanding the gender distribution is also relevant in formulating policy solutions to the subprime rate lending and foreclosure crisis. The 2006 HmdA data show a pattern where males and females without co-applicants had the highest use of subprime rate loans at 32.60% and 32.21%, respectively. Combined, these presumably single borrowers accounted for 64.81% of the 2006 subprime rate loans. These presumably single borrowers do not have two income sources to support the mortgage. If the single borrowers, in trouble of making their mortgage payments, are single-head of households, what about the children?
Not enough research and media attention has been devoted to other causes of the subprime crisis that may have race and gender effects. Issues of steering, weak underwriting, fraud, and discrimination have not been aggressively investigated. despite the presence of federal regulation and periodic examinations for safety and soundness, Community Reinvestment Act compliance and fair lending compliance, efforts to uncover whether subprime rate loans can be explained by legitimate business justifications will be impaired based on erroneous assumptions about the demographic distribution of subprime rate loans.
Last, if it is believed that subprime rate lending is predominately an urban minority problem, officials will fail to see that in 2006 non-Hispanic Whites had 1,108,676 subprime rate loans of which 868,806 or 78.36% were in census tracts <30% minority. The subprime lending meltdown is better described as a mainstream white suburbia problem with aspects that affect minorities and urban communities. Erroneous assumptions about the demographics of subprime rate lending will only lead to poor decisions that result in ineffective solutions.
Conclusion

Page 27 of 27 The Demographic Impact of the Subprime Mortgage Meltdown
About The Author maurice Jourdain-Earl has over 35 years of experience in the financial services business. He began his career in 1973 as a Registered Representative for IdS Financial Services and obtained licenses to offer insurance and investment services to individuals and small businesses. After 3 years he joined Continental Illinois National Bank as a Bond Investment Banking Associate where he offered municipal and Government Bonds to commercial banks and regional investment banks. In 1979 he joined PmI Securities Co. (a subsidiary of PmI mortgage Insurance Co.) as a director of Sales marketing. At PmI, he was responsible for packaging and selling private placement mortgage-backed securities to institutional investors.
From 1982 to 1985 he owned and operated a boutique Investment Brokerage Company facilitating the packaging and selling of private placement mortgage-backed securities, direct from Banks and Savings and Loan Associations to Pension Funds. After doing business with Citicorp, he joined the company as a Vice-President to help form a newly developed Treasury marketing Unit responsible for packaging and selling loans in portfolio as mortgage-backed securities. The Treasury marketing Unit later became Citimortgage’s Correspondent business.
In 1991 mr. Jourdain-Earl formed CLC Compliance Technologies, Inc. (ComplianceTech). ComplianceTech began as a due diligence portfolio analysis company analyzing the asset value of loans for secondary market disposition. After becoming an established contractor for the RTC, FdIC and private sector companies, ComplianceTech was asked by a lender to analyze their HmdA data. That project led to ComplianceTech’s development into a premier provider of lending intelligence services, specializing in strategic fair lending and emerging markets consulting.
For the last 17 years mr. Jourdain-Earl has provided thought leadership in developing consultative and technological solutions to help clients navigate the regulatory and operational complexities of strategic markets, diversity and fair lending issues. He has been actively involved in client projects to detect and minimize discrimination in underwriting, pricing and marketing mortgage, auto and consumer loans and to assess opportunities to lend to minority and low-to-
moderate income homebuyers. ComplianceTech is also the organizer of Lending Industry diversity Conference, Inc. which sponsors the Annual mortgage Lending Industry Strategic markets and diversity Conference.
mr. Jourdain-Earl is a noted speaker on lending and banking issues, particularly on HmdA and fair lending practices. He has spoken at many events, included some sponsored by the Federal Reserve Bank, The Federal Home Loan Bank, America’s Community Bankers, Practicing Law Institute, and the mortgage Bankers Association of America. A native of Chicago, Illinois, he holds a B.A. degree in Social Science from dePaul University.
About ComplianceTech Since 1991, ComplianceTech has provided specialized lending intelligence services to financial institutions nationwide. With its multi-disciplined expertise in lending, research, statistical analysis, law and economics, ComplianceTech is uniquely equipped to identify market patterns; unveil opportunities; formulate lending benchmarks; and implement best practices for all aspects of consumer lending. The company’s passion and expertise in data analysis is renowned, and press, academia, government and private organizations frequently call on ComplianceTech to share its insights and expertise in consumer lending intelligence.
About LendingPatterns™
LendingPatterns™ is a web-based data mining and exploration tool developed by ComplianceTech that analyzes millions of records for thousands of lenders to produce executive level reports on numerous aspects of mortgage lending in America. It is a powerful analytical tool and is the only fully accessible national HmdA database on the internet.
To request additional print copies of this report; or for more information about ComplianceTech or LendingPatterns; visit www.compliancetech.com, www.lendingpatterns.com, or call 1-800-499- 4632.
Conclusion