the defense industry in brazil: characteristics … · defesa e analisa características...
TRANSCRIPT
195
THE DEFENSE INDUSTRY IN BRAZIL: CHARACTERISTICS AND INVOLVEMENT OF SUPPLIER FIRMS
Flávia de Holanda Schmidt SqueffLucas Rocha Soares de Assis
Originally published by Ipea in January 2014 as number 1878a of the series Texto para Discussão.

DISCUSSION PAPER
195B r a s í l i a , J a n u a r y 2 0 1 5
Originally published by Ipea in January 2014 as number 1878a of the series Texto para Discussão.
THE DEFENSE INDUSTRY IN BRAZIL: CHARACTERISTICS AND INVOLVEMENT OF SUPPLIER FIRMS
Flávia de Holanda Schmidt Squeff1
Lucas Rocha Soares de Assis2
1. Researcher at the Directorate of Sectoral Studies and Policies, Innovation, Production and Infrastructure (Diset) of theIpea. E-mail: <[email protected]>.2. Researcher of the National Institute for Educational Studies and Research (INEP).
DISCUSSION PAPER
A publication to disseminate the findings of research
directly or indirectly conducted by the Institute for
Applied Economic Research (Ipea). Due to their
relevance, they provide information to specialists and
encourage contributions.
© Institute for Applied Economic Research – ipea 2015
Discussion paper / Institute for Applied Economic
Research.- Brasília : Rio de Janeiro : Ipea, 1990-
ISSN 1415-4765
1. Brazil. 2. Economic Aspects. 3. Social Aspects.
I. Institute for Applied Economic Research.
CDD 330.908
The authors are exclusively and entirely responsible for the
opinions expressed in this volume. These do not necessarily
reflect the views of the Institute for Applied Economic
Research or of the Secretariat of Strategic Affairs of the
Presidency of the Republic.
Reproduction of this text and the data it contains is
allowed as long as the source is cited. Reproductions for
commercial purposes are prohibited.
Federal Government of Brazil
Secretariat of Strategic Affairs of the Presidency of the Republic Minister Roberto Mangabeira Unger
A public foundation affiliated to the Secretariat of Strategic Affairs of the Presidency of the Republic, Ipea provides technical and institutional support to government actions – enabling the formulation of numerous public policies and programs for Brazilian development – and makes research and studies conducted by its staff available to society.
PresidentSergei Suarez Dillon Soares
Director of Institutional DevelopmentLuiz Cezar Loureiro de Azeredo
Director of Studies and Policies of the State,Institutions and DemocracyDaniel Ricardo de Castro Cerqueira
Director of Macroeconomic Studies and PoliciesCláudio Hamilton Matos dos Santos
Director of Regional, Urban and EnvironmentalStudies and PoliciesRogério Boueri Miranda
Director of Sectoral Studies and Policies,Innovation, Regulation and InfrastructureFernanda De Negri
Director of Social Studies and Policies, DeputyCarlos Henrique Leite Corseuil
Director of International Studies, Political and Economic RelationsRenato Coelho Baumann das Neves
Chief of StaffRuy Silva Pessoa
Chief Press and Communications OfficerJoão Cláudio Garcia Rodrigues Lima
URL: http://www.ipea.gov.brOmbudsman: http://www.ipea.gov.br/ouvidoria
DISCUSSION PAPER
A publication to disseminate the findings of research
directly or indirectly conducted by the Institute for
Applied Economic Research (Ipea). Due to their
relevance, they provide information to specialists and
encourage contributions.
© Institute for Applied Economic Research – ipea 2015
Discussion paper / Institute for Applied Economic
Research.- Brasília : Rio de Janeiro : Ipea, 1990-
ISSN 1415-4765
1. Brazil. 2. Economic Aspects. 3. Social Aspects.
I. Institute for Applied Economic Research.
CDD 330.908
The authors are exclusively and entirely responsible for the
opinions expressed in this volume. These do not necessarily
reflect the views of the Institute for Applied Economic
Research or of the Secretariat of Strategic Affairs of the
Presidency of the Republic.
Reproduction of this text and the data it contains is
allowed as long as the source is cited. Reproductions for
commercial purposes are prohibited.
JEL: H56; H57; L10.
CONTENTS
ABSTRACT
SINOPSE
1 INTRODUCTION .......................................................................................................7
2 THEORETICAL BACKGROUND...................................................................................8
3 METHODOLOGICAL ASPECTS .................................................................................20
4 RESULTS AND DISCUSSION.....................................................................................22
5 CONCLUSIONS.......................................................................................................44
REFERENCES .............................................................................................................48
APPENDIX ................................................................................................................52


ABSTRACT
Over the last decade, the defense industry has obtained relevance on Brazilian public policies. Departing from the premise that the success of this process requires not only that the Armed Forces have modern equipment and skilled military to operate them, but also that the country retains the technological expertise and acquire the conditions for constant arms improvement and introduction of innovations, this text offers information on defense procurement recently undertaken and analyzes selected characteristics of suppliers. The results indicate that the value of contracts obtained by firms was positively associated with characteristics related to the establishment of a sustainable and competitive DIB.
Keywords: defense industry; public procurement; defense procurement.
SINOPSE
Ao longo da última década, a indústria de defesa tem obtido, de modo mais consistente, relevância na pauta das políticas públicas do governo brasileiro, dentre as quais cabe destaque para a Política Nacional da Indústria de Defesa (PNID), de 2005, a Estratégia Nacional de Defesa (END), de 2008, e o Plano Brasil Maior (PBM), de 2011. A revitalização em curso não apenas possui amparo em documentos governamentais e legislação como também é um projeto que se encontra efetivamente em curso no setor produtivo, como se observa por meio dos grandes projetos recentes que têm articulado o Ministério da Defesa (MD) e as Forças Armadas e a indústria. Tendo por premissa que o êxito desse processo exige não apenas que as Forças Armadas tenham equipamentos modernos e militares hábeis em operá-los, mas também que o país detenha o conhecimento tecnológico que possibilite a produção destes equipamentos em território nacional, bem como as condições para o seu constante aperfeiçoamento e a introdução de inovações, o presente texto oferece informações sobre as contratações empreendidas entre 2001 e 2010 pelo MD e organizações subordinadas para a aquisição de bens de defesa e analisa características selecionadas das firmas fornecedoras de produtos de defesa no Brasil. Considerando ainda que o MD, ao ser o comprador principal – quase único – do setor no país, pode exigir atributos que visem ao desenvolvimento de uma indústria de características microeconômicas diferenciadas, haja vista que determina as condições de seleção para cada aquisição, as análises feitas no trabalho buscam verificar se o MD
está conseguindo, pela seleção de fornecedores, contribuir para o desenvolvimento de uma Base Industrial de Defesa (BID) adequada aos interesses nacionais, testando a hipótese de diferenciação dos atributos individuais das fornecedoras de defesa do país. Os resultados indicam que em 2010 os valores totais de contratos obtidos pelas firmas foram positivamente associados com características microeconômicas que estão relacionadas com o estabelecimento de uma BID sustentável e competitiva: atividade exportadora, esforço tecnológico, renda média do pessoal ocupado e participação de mercado no seu grupo de atuação.
Palavras-chave: indústria de defesa; compras governamentais; aquisição de materiais de defesa.

7
Discussion Paper195 (1878a)
The Defense Industry in Brazil: characteristics and involvement of supplier firms
1 INTRODUCTION
Over the last decade, the defense sector has consistently obtained relevance on the agenda of Brazilian public policies. The main guiding document of this movement is the National Defense Strategy (NDS), approved by Act N. 6.703/2008, which brought up a new conception of defense for the country. The NDS established defense industry revitalization as one of three structural axes for the Brazilian defense, along with the reorganization of the Armed Forces and its new personnel policy. Besides the NDS, the support for defense industry has been elsewhere advocated more intensely since the early 2000s, as in the National Defence Industry Policy (NDIP) - 2005, and even in government actions that go beyond the scope of the country’s Ministry of Defence (MD), as in the case of the Productive Development Policy (PDP), the industrial policy launched in 2008, which considered the defense industrial complex as one of the Strategic Areas, and Greater Brazil Plan (GBP), that succeeded PDP in 2011 (Schmidt, Moraes and Assis, 2012).
After a successful phase between the mid-1970s and early 1990s, when Brazilian Defense Industrial Base (DIB) achieved a significant share of world defense exports, in 1993 the bankruptcy of Engesa, together with the simultaneous imminence of Avibras and Embraer shutdown, represented the end of those “golden years” of the Brazilian defense industry (Moraes, 2012a). In recent years, however, the ongoing revitalization process not only has support in government documents and legislation as it is also taking place in the productive sector due to demands of MD.1 In fact, recent data indicates that in 2013, Brazil has the 12th largest defense procurement budget in the world (“Jane’s Defence Sector Budgets”, [sd]).
However, even though the revitalization process is in full swing, Brazil still lacks information on its defense industry. Apart from a few exceptions, between which is worth highlighting Araujo et al. (2010), the country does not know the size of the Brazilian defense industry. This fact is a clear obstacle to the formulation, implementation and monitoring of public policies for the sector.
Thus, Brazil is not aware of which firms remained in the industry or have emerged since the 1990s. This is especially valid for small and medium-sized firms.
1. The main ongoing projects are briefly presented in Schmidt (2013).
8
B r a s í l i a , J a n u a r y 2 0 1 5
Presumably many of these firms hold knowledge that can be strategic for the country. Therefore, the task of gathering updated information on domestic firms in the sector becomes central to the achievement of national goals, because, according to documents and speeches by Brazilian authorities, modern equipment and skilled military are not a sufficient condition for national defense: it is necessary that the country holds the technological knowledge that enables the production of such equipment inwards, as well as the conditions for their constant improvement and introduction of innovations in the sector. As mentioned in the NDS: “The restructuring of the Brazilian defense industry is intended to ensure that the equipment needs of the Armed Forces are based on technologies that are domestically mastered” (Brazil, 2008).
This text provides information about the defense procurement undertaken between 2001 and 2010 by the MD and subordinate organizations and analyzes selected characteristics of supplier firms. Considering also that the MD, as the main buyer – almost the single one – of the sector in the country, may require attributes in tenders aimed at developing an industry with desired microeconomic characteristics, once is the ministry that determines the selection conditions for each acquisition, other research questions were part of this work: is the MD selection of suppliers contributing to the development of a DIB that fits national interests? What are the drivers of the ministry to develop closer relationships with companies in the sector? To address these questions, we used a cross-section regression model that tests the hypothesis of differentiation of individual attributes of Brazilian defense suppliers.
Besides this introduction, this paper has five sections. Section 2 presents the literature review, and the Brazilian legislation in defense procurement is briefly discussed. Section 3 is devoted to methodological aspects. The results are presented and discussed in section 4, and finally, in section 5 some final considerations are presented together with suggestions for future research.
2 THEORETICAL BACKGROUND
The literature review is based on four main axes. Section 2.1 reviews earlier discussions on relationship marketing, with emphasis on some elements of the relationship between buyers and suppliers that are applicable to the case of defense. Section 2.2

9
Discussion Paper195 (1878a)
The Defense Industry in Brazil: characteristics and involvement of supplier firms
revisits authors who addressed the atypical structure of defense markets. Following is a discussion about defense procurement, and finally, in section 2.4, We summarize Brazilian normative framework about defense industry.
2.1 Relationship marketing
Relationship marketing is about establishing, maintaining and improving relationships with customers and other parties through mutual exchange and fulfillment of “promises”, so that the objectives of involved parties are met. An extensive literature devoted to understand various aspects of these relationships, particularly in what concerns the strategic importance of acquisitions to contemporary organizations.2
Campbell (1985), for example, differentiates purchasing by attributes such as product dimensions, frequency of transaction, transaction cost and product complexity, suggesting that the major product complexity increases the dependence of buyers towards suppliers, turning purchasing procedures more difficult and critical to business operations.
The strategic aspect of purchasing was suggested by Cousins and Spekman (2003), for whom merely treating purchases as an activity that spares costs for the firms can sentence them to lag behind competitors. In the traditional model of procurement function, based on the efficient management of the flow of goods and services in support of production activities of the firm, its main task was to ensure that the acquisitions occurred on time, with appropriate levels of quality and at the lowest price. The need to raise the relationship “buyer-supplier” to a higher level within the organization is not limited, however, to considering factors other than price in the acquisitions and to establishing long-term collaborative relationships. Cousins and Spekman (2003) indicate that the activity must receive, within the organization, resources and capabilities needed for changing its status, emphasizing, however, that the transition between treating purchasing as a “clerical task” and turning it a strategic area involves a slow process that usually faces many internal barriers, once a traditional model driven by price is not easy to change.
2. For a revision on the topic, see Das (2009).
10
B r a s í l i a , J a n u a r y 2 0 1 5
The impact of the relational aspect in business-to-business relationships (B2B) in new product development was investigated empirically by Parkinson (1985). The results indicate that in cases where development is undertaken with greater participation of the customer, the process has more chances to succeed.
Ganesan (1994) indicates that a long-term orientation is determined by the extent of trust between buyer and seller: customers with a long-term orientation tend to keep their suppliers, which would in turn make their accounts more attractive to the seller. This is possible once trusty and more intense relationships are established, thus enabling investments and development of appropriate technical capabilities for these clients. In contrast, short-term oriented customers tend to switch from one seller to another and often perform acquisitions based on short-term incentives, such as price.
The author warns, though, about another aspect: mutual trust and relationship intensity can lead to “lock in”. Thus, one of the determinants of customer orientation is how much he is “locked in” to the supplier. Previous research showed that the transaction specific investments (TSI) often lead to actions of substantial reciprocity and thus create exit barriers for both parties. For Ganesan (1994), the use of TSI and actions that increase trust between the parties can be a strategy to manage the temporal orientation of the relationship, emphasizing however the fact that TSI or “lock in” alone do not determine a long-term orientation, since trust must be present. The development of trust between the parties was further addressed by Gulati (1995) in a classic study of collaborative strategies: contracts do not depend only on activities of the partnership or their transaction costs, but on the trust relationships that emerge over repeated ties.3
These issues that are related to specific investments are especially important in the case of defense, since, as emphasized by Markowski and Hall (1998), a significant part of defense procurement is dedicated to products not routinely produced and goods that require specific skills and assets. For these reasons, the authors stress that defense purchases require special focus in terms of public policies.
3. Granovetter (1985) analyzes the importance and the impact of the structures of relationships in economic action of modern industrial society.
11
Discussion Paper195 (1878a)
The Defense Industry in Brazil: characteristics and involvement of supplier firms
2.2 Defense markets structure
If the relationship between buyer and suppliers in defense markets cannot be addressed without the relational aspects discussed in the previous subsection, the structural peculiarities of the sector reinforce the relevance of specific investments. A consistent literature highlights the uniqueness of military markets (e.g., Markusen, 1986). Nevertheless, B2B relations in which one or more parties have a monopoly of demand or supply are still poorly studied (Fischwick, 1993, apud Humphries and Wilding, 2004). In this subsection we discuss the main peculiarities of defense markets.
The central feature of defense markets is that the Ministries of Defence (MD)4 tend to be monopsonists (Lindberg, 1975; Markusen, 1986; Rogerson, 1994; Smith, 1990), being not only the exclusive buyer of defense equipment in internal market as well as a relevant actor for firms in foreign markets, once they regulate exports. The influence of the MD on firm’s export potential relates also to the fact that products that were not purchased by the country’s armed forces are rarely acquired by other nations.
For authors such as Smith (1990) this point provides an interesting property of defense markets: the structure of domestic industry is a potential consumer choice. The MD can use the decision on ownership to shape the endogenous structure of the sector, choosing whether or not state structures shall be involved in the industry.5 Similarly, MD can choose to be simply a customer, by buying value for money6 and allowing the market itself shape the industry. On the other hand, if MD decides to use its purchase power to shape the industry, it must then decide what type of industrial and technological structure could be achieved with the constraints imposed by budgets,
4. In the present case, the term “Ministry of Defense” is used generically to identify the governmental structures which usually account for the purchasing decisions of defense products, with no reference to any country-specific agency.
5. Markusen (1986) records two major changes in the source of supply of military equipment: production moved from small businesses to large corporations with the growing demand for technology and purchases of military equipment are no longer obtained in government arsenals, but private firms, institutionalizing the practice of hiring, especially since the 1880s. To Markowski and Hall (1998), historically, the provision of arms by public arsenals and government factories always raised suspicions of “worst examples of inefficiencies in the public sector”.
6. The concept of value for money is fairly applied in the analysis of the feasibility of public-private partnerships and refers to the socioeconomic advantages and tangible or intangible assets acquired in public procurement. The value for money means, essentially, that the State, as a buyer, ensure that the analysis prior to the conclusion of the purchase will extend beyond price to ensure the best results for society. The VFM is not just about the lowest price, but also reflects aspects such as reliability, costs over the life cycle, safety in supplies and a range of other factors.

12
B r a s í l i a , J a n u a r y 2 0 1 5
technology and international environment. Gansler (1987) states that as the sole purchaser of military equipment the government can influence changes in the industry.
For some authors, there is a monopoly of demand, but firms also have considerable power (Humphries and Wilding, 2004). According to Markusen (1986), the state does not use its market power to depresse prices: oppositely, the demand for military products appears to be highly inelastic to price, so that quality and promptness in delivery are more important in the competition for contracts. The dynamics of rivalry is still a controversial question: for a stream of researchers, as Markusen (1986), industry is highly concentrated, suggesting also that state action seems to stimulate concentration. According to her, firms compete with each other by the initial contract of large weapons. However, once hired, firms are able to exercise a “virtual monopoly”. Also stating the existence of low rivalry among firms in the industry, Smith (1990) brings other justifications, as the combination of domestic preference and economies of scale,7 noting, however, that in some cases the monopolist may even be one small firm.
Authors like Markowski and Hall (1998) and Humphries and Wilding (2004) point out, more recently, to the opposite situation: the end of the Cold War led governments to exert strong pressure for increased efficiency, in order to balance the unpopularity of defense spending with the pragmatic need to maintain defense forces. This view is shared by Azulay, Lerner and Tishler (2002), for whom the crisis in the defense market, with stiff competition among firms, is one of the many consequences of the end of the Cold War, due to the decrease of military budgets in the world.8 The post-Cold War reality calls for a strategy to reduce the total cost of acquisition of materials and equipment, and the requirement of modern methods of procurement, as shown in Laius and Xideas (1994).
2.3 Defense procurement
For many decades economists have devoted to studies related to the defense sector, under various approaches.9 Once the sustained development of the sector and the
7. Economies of scale are particularly relevant in the case of the production of large weapons.
8. A review about world military spending in the period between 1991 and 2009 is made in Silva Filho and Moraes (2012).
9. Recently, various aspects of defense economics were discussed in the Handbook of Defence Economics – Defence in a Globalized World (Hartley and Sandler, 2007).
13
Discussion Paper195 (1878a)
The Defense Industry in Brazil: characteristics and involvement of supplier firms
creation of an endogenous competitive industry depend on bulky volumes of resources, the relationship between defense and economic development was the subject of many studies. Defense procurement is one stream of defense economics, which has focused on efficiency challenges posed by this process (Markowski and Hall, 1998). The increasing interest can be justified by the size of defense budgets and the promise of peace dividends. Markowski and Hall (1998) argue that researchers recognized that defense procurement has challenges such as complexity, technology intensive nature of the systems, the long periods involved in purchases and uncertainty.
This recent interest have been characterized, according to the authors, by two features: the predominant concern with theoretical results and the tendency to focus on the experience of countries with large and well established DIB. These predominant perspectives keep two gaps. The first is related to institutional aspects, since the local environment of countries can influence the results in ways that are not easily captured by general analysis. As noted by Dertouzos and Dardia (1993), there is still a significant gap between theoretically prescribed mechanisms and what purchasing defense agencies are actually capable of doing. Secondly, as industry companies increasingly operate abroad, the experience of countries with different contexts becomes interesting for them.
In any case, the purchase of defense materials will always be contingent to national defense policies and the strategic choices of each country. Markowski and Hall (1998) argue that the use of domestic sources to supply national demands has long been encouraged in many countries under the name of “self-reliance”. Authors question even though how much self-reliance is desirable, particularly in the case of small countries, since encouraging national champions at the expense of the competition can suppress the dynamism of the domestic industry. On the other hand, they argue how far competition should be taken.
Markowski and Hall (1998) suggest that to achieve a desired level of self-reliance defense planning should not only address the requirements of the structure of the armed forces, but also determine what “defense-related industrial capabilities” really mean through questions such as: what services and manufacturing sectors are endogenously needed to equip and support elements of the force? How critical are these various
14
B r a s í l i a , J a n u a r y 2 0 1 5
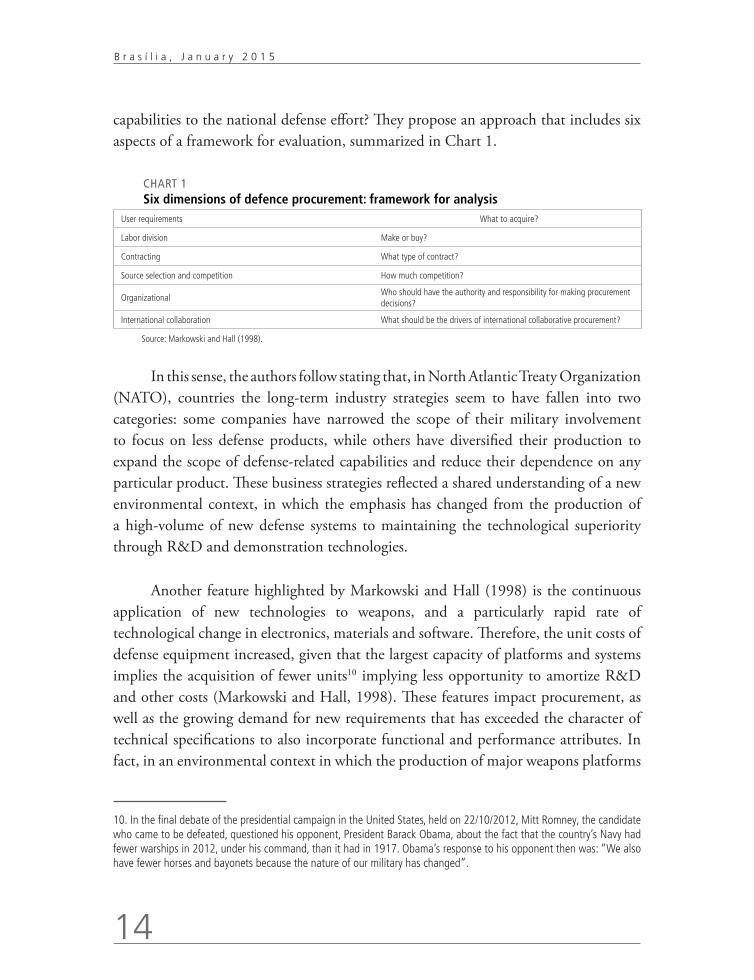
capabilities to the national defense effort? They propose an approach that includes six aspects of a framework for evaluation, summarized in Chart 1.
In this sense, the authors follow stating that, in North Atlantic Treaty Organization (NATO), countries the long-term industry strategies seem to have fallen into two categories: some companies have narrowed the scope of their military involvement to focus on less defense products, while others have diversified their production to expand the scope of defense-related capabilities and reduce their dependence on any particular product. These business strategies reflected a shared understanding of a new environmental context, in which the emphasis has changed from the production of a high-volume of new defense systems to maintaining the technological superiority through R&D and demonstration technologies.
Another feature highlighted by Markowski and Hall (1998) is the continuous application of new technologies to weapons, and a particularly rapid rate of technological change in electronics, materials and software. Therefore, the unit costs of defense equipment increased, given that the largest capacity of platforms and systems implies the acquisition of fewer units10 implying less opportunity to amortize R&D and other costs (Markowski and Hall, 1998). These features impact procurement, as well as the growing demand for new requirements that has exceeded the character of technical specifications to also incorporate functional and performance attributes. In fact, in an environmental context in which the production of major weapons platforms
10. In the final debate of the presidential campaign in the United States, held on 22/10/2012, Mitt Romney, the candidate who came to be defeated, questioned his opponent, President Barack Obama, about the fact that the country’s Navy had fewer warships in 2012, under his command, than it had in 1917. Obama’s response to his opponent then was: “We also have fewer horses and bayonets because the nature of our military has changed”.
CHART 1Six dimensions of defence procurement: framework for analysis
User requirements What to acquire?
Labor division Make or buy?
Contracting What type of contract?
Source selection and competition How much competition?
OrganizationalWho should have the authority and responsibility for making procurement decisions?
International collaboration What should be the drivers of international collaborative procurement?
Source: Markowski and Hall (1998).
15
Discussion Paper195 (1878a)
The Defense Industry in Brazil: characteristics and involvement of supplier firms
and systems is an economically viable option for only some countries, according to Markowski and Hall (1998), the emphasis of self-reliance shifts from the effective production capacity to maintaining in-country, through-life upgrade/modification and logistic support capability. Faced with a small or infrequent demand to induce industry to invest in such capacities, government should provide incentives to encourage companies to make such investments, recognizing the sunk cost that they involve.
Laios and Xideas (1994) suggest that the structure of procurement should be subordinated to the characteristics of what will be acquired. Materials and equipment of high complexity, naturally subject to higher transaction and change costs as well as low frequency of purchase, need to be bought by a flexible structure, which contains, for example, task forces with the engineers, teams and departments concerned with the project.
Humphries and Wilding (2004) use relationship marketing and transaction costs theory to determine to what extent the concepts of relational B2B can be used to understand the dynamics in a sustained monopoly as defense, since, despite its strategic importance, the environmental background seems to provide little incentive to beneficial results for both parties.
Departing from the case of acquisitions in the UK, authors emphasized some points. First, in spite of efforts to improve relations with key suppliers, the absence of a dynamic network reduced the effectiveness of attempts to find a “common ground” on which embeddedness could be established, resulting in few incentives to avoid oppositional practices. Besides, the fact that UK acquisitions in defense have been characterized by a short-term orientation due to the limited budget horizons, often with politically driven “stop and go” practices, caused uncertainty and introduced a component of bounded rationality. Humphries and Wilding (2004) argue that the long-term orientation is a prerequisite for the evolution of relationships and suggests continuity, stability, predictability, and that both sides work together to achieve the sustained competitive advantage and to build trust and commitment.
In addition to the intrinsic complexity of defense acquisitions, as evidenced by the contribution of many authors, the purchase of military systems can also be used as a tool to achieve industrial policy goals (Molas-Gallart, 1998), since the highly
16
B r a s í l i a , J a n u a r y 2 0 1 5
complex defense products require massive efforts to be developed, produced, acquired and mantained.
Molas-Gallart (1998) does, however, stresses the clear distinction between the purchasing power of military equipment among countries. For large developed countries that are at the frontier of technological development, military purchases would be intimately associated to the development and production of new systems, and procurement policy should therefore bring the best ways to finance, monitor and possibly manage these developments. Smaller countries unable to acquire the latest generation of military systems, in turn, should make a choice: should them decide to purchase foreign systems by the best economic conditions or alternatively should them use defense procurement to build a domestic industrial and technological base.
At the center of public policy debates in defense procurement is usually the trade-off between getting the necessary equipment for defense for the best value for money and obtaining benefits for the economy as a whole by spin-offs of the defense budget (Smith, 1990). In addition to these objectives, as indicated by the author, there would still be room to an intermediate objective: to build a particular industrial structure. Smith (1990) considers, however, that defense procurement is already too complex without the inclusion of economic considerations in the process, and due to this controversy, argues that the best option would be focusing strictly on military issues: the appropriate specification of the system and the feasibility of the technology development and production.
The use of defense spending as an industrial policy for the U.S., albeit not officially assumed by the country, was discussed by Markusen (1986). According to the author, in the post-war period military spending worked as an implicit industrial policy in many ways. First, defense spending worked as an economic stimulant, focused predominantly on the manufacturing sector. Second, it acted as a long-term planning strategy, both by encouraging innovation in certain product lines as for supporting the balance of payments through specialization in arms trade. Nevertheless, Markusen (1986) questions the positive effect of this instrument in the productivity of the economy as “spending on other types of output would be considerably more efficient”. Furthermore, author emphasizes that there is strong evidence that the oligopolistic
17
Discussion Paper195 (1878a)
The Defense Industry in Brazil: characteristics and involvement of supplier firms
practices of producers and cost overruns tolerated by the government lead to inefficient allocation of resources.
The apparently higher tolerance for high costs in defense by governments is considered under other perspectives by Rogerson (1994). The author admits that defense procurement is a form of regulation based on costs and thus have similar problems to those that occur in other regulated sectors, such as health care, telecommunications, utilities and transportation; Rogerson (1994) asserts, however, that just as in health, innovation is a basic input for defense, and questions whether the rules would create incentives for innovation and constant search for the best performance.
Besides monopsony, Rogerson (1994) highlights other features of the regulatory power of defense procurement, as uncertainty, economies of scale in production and the importance of R & D, which may result in a “hold up” problem: since many technologies and skills required to create and produce weapons systems are relatively specific to the war industry, firms that invest their own capital in the project, or even in related human and physical capital would not recover the investment. Several models have been adopted in the case of the USA to deal with this issue, as financing a large proportion of physical assets and specific defense research, so that firms would not have to invest their own capital.
2.4 Recent policies for defense procurement in Brazil
The theoretical background discussed in the previous section suggests that defense acquisition processes should differ significantly from the procurement of common goods and services. The distinction suggested by previous authors, however, can only be feasible if the legal framework enables such differentiation. In Brazil, the rules on government procurement are consolidated mainly by Law N. 8.666 of June 21, 1993, and its subsequent amendments. In this section, we will present some considerations about the legal acts, their recent changes and their possibilities and limitations for the strategic use of defense procurement.
Law N. 8.666/1993 establishes general rules on all tenders and contracts for all levels of government, and therefore is mandatory for Federal Government, states, municipalities and other entities controlled directly or indirectly by them. Thus, the

18
B r a s í l i a , J a n u a r y 2 0 1 5
law establishes tender procedures that are common among organizations of all kinds, sizes and backgrounds, being widely regarded as a strict framework.
Until June 2010, price was the main driver in competitions, but Provisional Measure N. 495/201011 brought some innovations and incorporated “the promotion of sustainable national development”12 as one of the main objectives of bidding. The most revolutionary innovation was the establishment a margin of preference of up to 25% of the price for “manufactured products and services that meet Brazilian technical standards.13 This change represented a new context for Brazilian public procurement, once public administration admits that acquisitions are no longer just a process for obtaining goods and services but now can also be an instrument to achieve broader public policy objectives.
Beyond the margin of preference, another innovation is the possibility of requiring the contractor to promote measures of commercial, industrial and technological compensation or even access to financing conditions, which may be required cumulatively or not by the administration. Similarly, tenders for establishment, maintenance and improvement of the systems of information and communication technology considered strategic may have tenders restricted to goods and services with technology developed in Brazil.
11. MP later converted by Law N. 12,349 of June 21, 2010.
12. Recently Decree No. 7746/2012 established criteria, practices and guidelines to promote sustainable national development in contracts undertaken by the federal government, and established the Interministerial Commission on Sustainability in Public Administration - CISAP. Although the changes introduced by Law N. 12.349/2010 had relatively a broad scope, the focus of this recent decree was more directed to the issue of environmental and social impact of the contracts of Public Administration.
13. Several countries have initiatives that give preference to national firms in public procurement. Explanatory Ministerial Memorandum N. 104/MP/MF/MEC/MCT, which forwarded the Provisional Measure N. 495/2010 to Congress, mentions: “are illustrative in this matter, the guidelines adopted in the United States, embodied in the Buy American Act, in force since 1933, which established preference to products manufactured in the country, since conbined to satisfactory quality, sufficient providing and commercial availability on a reasonable basis. In the recent period, deserve record the actions contained in the so called American Recovery and Reinvestment Act, 2009. China offers similar standard as in Law N. 68/2002, which stipulated guidelines for preference to goods and services in Chinese government procurement, except in the event of unavailability in the country. In Latin America, Colombia established through Law N. 816, 2003, a margin of 10% and 20% for national goods or services, in order to support the domestic industry through procurement. Argentina also granted, by Law N. 25.551, 2001, preferred providers of goods and services of national origin, whenever prices are equal to or lower than the foreign plus 7% on offers made by micro and small enterprises and 5% for other companies. Available in: http://www.planalto.gov.br/ccivil_03/_Ato2007-2010/2010/Exm/EMI-104-MP-MF-MEC-MCT-MPV-495-10.htm.

19
Discussion Paper195 (1878a)
The Defense Industry in Brazil: characteristics and involvement of supplier firms
Specifically in relation to the acquisition of defense products, the Law N. 8.666/1993 opens some exceptions, allowing exemption from bidding m some situations:
“Art 24 - Needless to bid:
(...)
IX - when it may compromise national security, in cases established by decree of the President, after consultation with the National Defense Council;
(...)
XXVIII - for the supply of goods and services produced or rendered in the country, involving simultaneously technological complexity and national defense, upon the advice of a committee designated by the highest authority of the agency.”
Later regulation (Decree N. 2.295/1997) established that the cases of exemption apply to the purchase military resources, the hiring of specialized technical services in the area of projects, research and scientific and technological development and acquisition of equipment and specialized technical services to the intelligence area.
In addition to the procedures discussed above, Law N. 12.598/2012 establishes special criteria for acquisitions and development of defense products. The definitions introduced by this law, such as defense product, strategic defense product,14 defense systems and strategic defense company, were a significant accomplishment.
To be considered a strategic defense company, firms need to be accredited by the Ministry of Defense, and, as defined, may have access to the Special Tax Regime for Defense Industry – RETID (in Portuguese), conditional on some previous accreditation. In addition to the benefits defined by this regime, the law allows that strategic defense companies receive special support of the Export Guarantee Fund – FGE in order to export defense products.
14. The basic distinction between defense product and strategic defense product is that the former is a defense product that due to its technological content or the difficulty of obtaining is considered of strategic importance for national defense.
20
B r a s í l i a , J a n u a r y 2 0 1 5
Despite not being an specific act for procurement, it is worthwhile mentioning, within this context, the importance of the National Defense Strategy (NDS), which brought a new conception of defense for Brazil, indicating defense industry restructuring as one of its three main axis. NDS states among its guidelines: “To qualify the national defense industry so that it conquers the necessary autonomy in indispensable technologies to defense purposes”. The strategy also asserts that “The State will help to attract the foreign clientele for the national defense industry. However, the continuity of production should be organized so as not to depend on having to attract or retain such clientele. Therefore, the State will recognize that in many production lines, that specific industry will have to operate in a ‘cost plus margin’ regime, thus, under strict regulatory regimen”.
The new conditions mean a move towards reconciling administrative acts of procurement with new public policy objectives. If once the only condition analyzed in the vast majority of tenders was price, now the Brazilian public administration admits that the most advantageous proposal may consider the disbursement of higher values under certain conditions deemed necessary for the promotion of national sustainable development and the promotion of technological development of the national defense industry.
3 METHODOLOGICAL ASPECTS
3.1 Data
There is some debate over the boundaries of the defense industrial base of Brazil, since there is no specific National Classification of Economic Activities (CNAE)15 to group suppliers of defense products in one specific sector. In this sense, this work adopts the “shopping list”16 criteria, and departed from the recent acquisitions of defense products by MD to identify suppliers of these goods, which would, ultimately, constitute the core of country’s defense industry.
15. Classificação Nacional de Atividade Econômica, the Brazilian equivalent of SIC, the Standard Industrial Classification.
16. A broader discussion of possible criteria can be found in Araujo et al. (2010).
21
Discussion Paper195 (1878a)
The Defense Industry in Brazil: characteristics and involvement of supplier firms
The identification of supplier firms was possible due to the use of a federal database called ComprasNet,17 which comprises highly detailed and disaggregated information about every acquisition process of federal government. The construction of the database was possible by the use of refinement filters in a broader base previously built for the period 2001-2010. Among the whole set of observations, we focused on procurement processes from Ministry of Defense and subordinated organizations for the entire period of analysis. Since the interest of this research is concentrated around the acquisition of typical defense goods, a new filter was applied to the base,18 and only acquisitions of some groups and classes of materials remained in the final database.19 This procedure thus excluded from the data the observations related to the supply of common goods and services. The set of suppliers of defense goods identified by the method above corresponds to 7.619 firms.
As the dataset identified the tax ID of each supplier, it was possible to associate the firms to other government’s existing databases: Rais, the the Annual Report of Social Information, an employee-level database from the Brazilian Ministry of Labour and Employment, including major information for all formal jobs and a database provided by Secex, the Secretary of Foreign Trade of the Ministry of Development, Industry and Foreign Trade that includes highly disaggregated data on import and export transactions. Besides, along with these data, we used the Census of Foreign Capitals in Brazil (2000 base-year), from Central Bank of Brazil. The combination of these different bases allowed the identification of some characteristics of this group of companies which provided defense products for Ministry of Defense between 2001 and 2010.
17. ComprasNet is a website set up by Ministry of Planning (MP) to provide complete information regarding the tender procedures promoted by the federal government. The portal also allows for electronic procurement processes. Available in: <http://www.comprasnet.gov.br/>.
18. The list of groups and classes of materials used for this filter is available upon request to the authors and are not included in the text due to space limitations. However, this list may be non-exhaustive, since some acquisitions may have been erroneously assigned by operators of the system to other groups. Notwithstanding, it can be regarded as fairly representative of the sector which is the focus of the study.
19. The definition of defense products established by Law n.1.259/2010 includes in addition of goods, “service, job or information used in the final activities of defense, with the exception of the ones of administrative use”. Despite this, we decided to use only filters to material, since the classification of services used by ComprasNet clearly does not allow proper association between the contracted service and their effective use in the agency. Similarly, some taxonomies of international defense products, such as the Stockholm International Peace Research Institute (SIPRI) distinguish the manufacturers of the so-called major conventional weapons from firms that are supplying parts or ammunition, but the application of such distinction in the treatment of the data would require a more analytical approach, at the expense of longitudinal analysis that was descriptively done here.
22
B r a s í l i a , J a n u a r y 2 0 1 5
3.2 Hypothesis
Over the past decades, the concept of self-reliance evolved from a perspective that focused on the use of domestic sources for defense equipment and goods for an approach according to which self-reliance could be assured by the existence of national firms with competitive technological skills in the area of defense. The emphasis has changed from a high-volume production of new defense systems to maintaining the technological superiority through R&D. Thus, the need for planning defense procurement expanded, so that it shall be done not only to consider the requirements of the Armed Forces, but also to build inwards the “defense-related industrial capabilities” necessary to the strategic objectives of the country.
The Ministry of Defense, as the almost sole buyer of defense products in the country, contributes to shaping the domestic industry because it determines the conditions under which acquisitions occur, as was described in the past literature on the economics of defense. Although the legal changes that may facilitate the effectiveness of this policy objective are quite recent, it is appropriate to investigate how the characteristics of the supplier companies were influential in their performance as a MD supplier.
Thus, in line with literature, as shown in section 2, the central hypothesis of this study is that MD suppliers have differential individual attributes, as expressed by firm level variables related to competitiveness.
4 RESULTS AND DISCUSSION
4.1 Defense suppliers: preliminary evidence
Between 2001 and 2010, the MD spent nearly R$ 25 billion20 in purchases of goods and services in internal market. Out of this amount, just R$ 850 million were spent, according to data from the ComprasNet, in the acquisition of typical defense goods. The data summarized in Table 1 show how this relationship evolved during the period: in 2001, the amount spent on defense equipment and materials was 2.4% of the overall
20. All monetary values treated in this text were deflated for R$ constants of December 2001 using IPCA (National Index of Price to the Ample Consumer).
23
Discussion Paper195 (1878a)
The Defense Industry in Brazil: characteristics and involvement of supplier firms
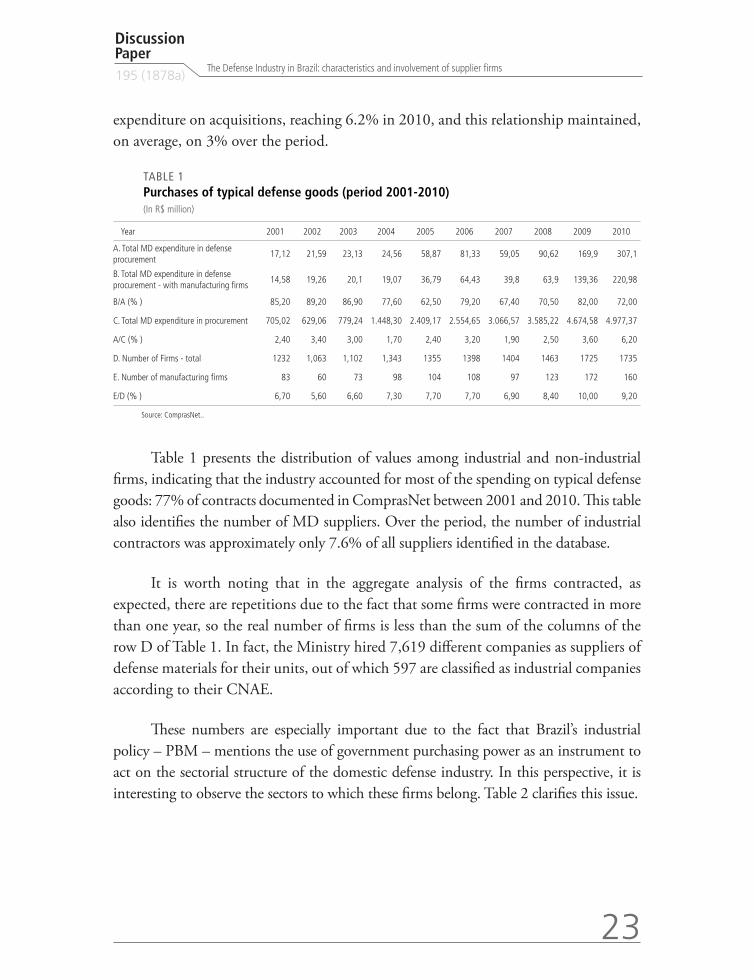
expenditure on acquisitions, reaching 6.2% in 2010, and this relationship maintained, on average, on 3% over the period.
TABLE 1Purchases of typical defense goods (period 2001-2010)(In R$ million)
Year 2001 2002 2003 2004 2005 2006 2007 2008 2009 2010
A. Total MD expenditure in defense procurement
17,12 21,59 23,13 24,56 58,87 81,33 59,05 90,62 169,9 307,1
B. Total MD expenditure in defense procurement - with manufacturing firms
14,58 19,26 20,1 19,07 36,79 64,43 39,8 63,9 139,36 220,98
B/A (% ) 85,20 89,20 86,90 77,60 62,50 79,20 67,40 70,50 82,00 72,00
C. Total MD expenditure in procurement 705,02 629,06 779,24 1.448,30 2.409,17 2.554,65 3.066,57 3.585,22 4.674,58 4.977,37
A/C (% ) 2,40 3,40 3,00 1,70 2,40 3,20 1,90 2,50 3,60 6,20
D. Number of Firms - total 1232 1,063 1,102 1,343 1355 1398 1404 1463 1725 1735
E. Number of manufacturing firms 83 60 73 98 104 108 97 123 172 160
E/D (% ) 6,70 5,60 6,60 7,30 7,70 7,70 6,90 8,40 10,00 9,20
Source: ComprasNet..
Table 1 presents the distribution of values among industrial and non-industrial firms, indicating that the industry accounted for most of the spending on typical defense goods: 77% of contracts documented in ComprasNet between 2001 and 2010. This table also identifies the number of MD suppliers. Over the period, the number of industrial contractors was approximately only 7.6% of all suppliers identified in the database.
It is worth noting that in the aggregate analysis of the firms contracted, as expected, there are repetitions due to the fact that some firms were contracted in more than one year, so the real number of firms is less than the sum of the columns of the row D of Table 1. In fact, the Ministry hired 7,619 different companies as suppliers of defense materials for their units, out of which 597 are classified as industrial companies according to their CNAE.
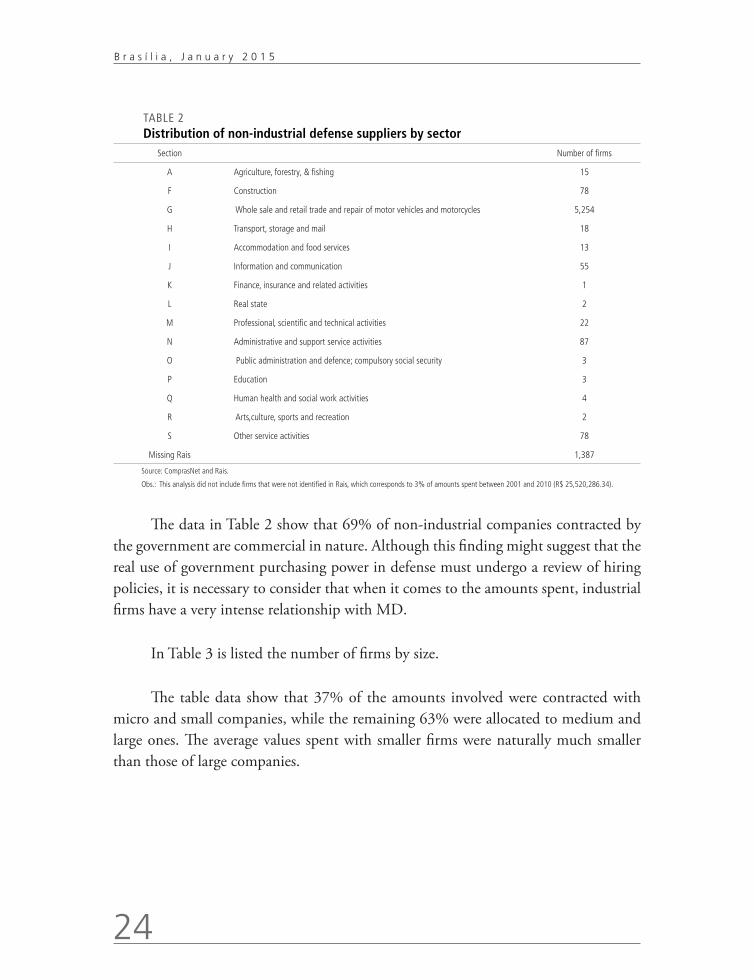
These numbers are especially important due to the fact that Brazil’s industrial policy – PBM – mentions the use of government purchasing power as an instrument to act on the sectorial structure of the domestic defense industry. In this perspective, it is interesting to observe the sectors to which these firms belong. Table 2 clarifies this issue.
24
B r a s í l i a , J a n u a r y 2 0 1 5
TABLE 2Distribution of non-industrial defense suppliers by sector
Section Number of firms
A Agriculture, forestry, & fishing 15
F Construction 78
G Whole sale and retail trade and repair of motor vehicles and motorcycles 5,254
H Transport, storage and mail 18
I Accommodation and food services 13
J Information and communication 55
K Finance, insurance and related activities 1
L Real state 2
M Professional, scientific and technical activities 22
N Administrative and support service activities 87
O Public administration and defence; compulsory social security 3
P Education 3
Q Human health and social work activities 4
R Arts,culture, sports and recreation 2
S Other service activities 78
Missing Rais 1,387
Source: ComprasNet and Rais.
Obs.: This analysis did not include firms that were not identified in Rais, which corresponds to 3% of amounts spent between 2001 and 2010 (R$ 25,520,286.34).
The data in Table 2 show that 69% of non-industrial companies contracted by the government are commercial in nature. Although this finding might suggest that the real use of government purchasing power in defense must undergo a review of hiring policies, it is necessary to consider that when it comes to the amounts spent, industrial firms have a very intense relationship with MD.
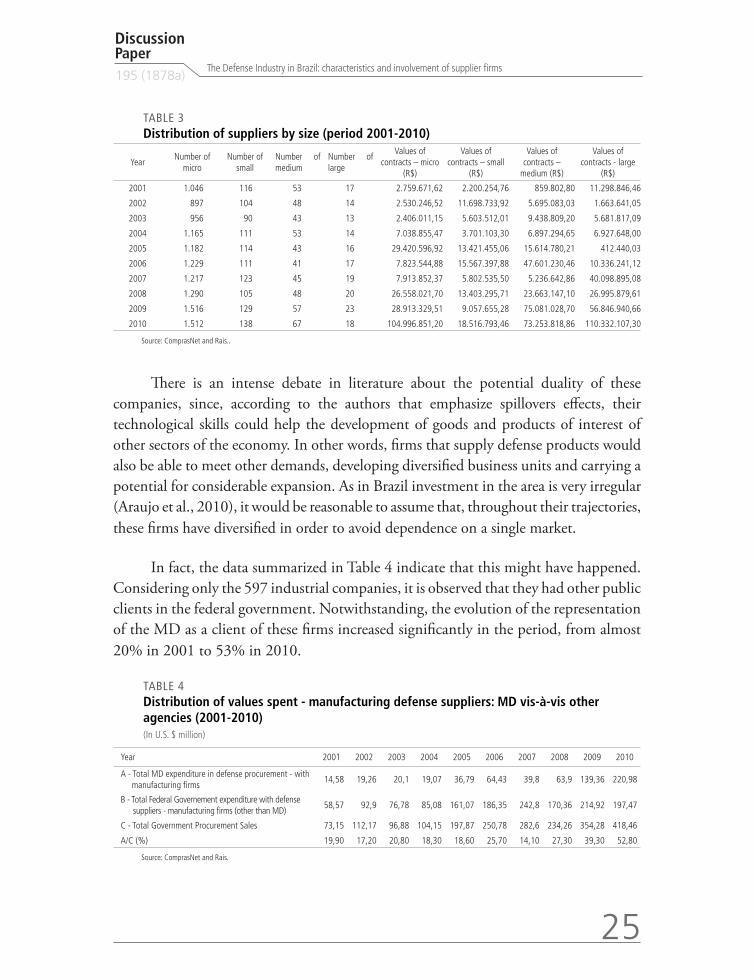
In Table 3 is listed the number of firms by size.
The table data show that 37% of the amounts involved were contracted with micro and small companies, while the remaining 63% were allocated to medium and large ones. The average values spent with smaller firms were naturally much smaller than those of large companies.
25
Discussion Paper195 (1878a)
The Defense Industry in Brazil: characteristics and involvement of supplier firms
TABLE 3Distribution of suppliers by size (period 2001-2010)
YearNumber of
microNumber of
smallNumber of medium
Number of large
Values of contracts – micro
(R$)
Values of contracts – small
(R$)
Values of contracts –
medium (R$)
Values of contracts - large
(R$)
2001 1.046 116 53 17 2.759.671,62 2.200.254,76 859.802,80 11.298.846,46
2002 897 104 48 14 2.530.246,52 11.698.733,92 5.695.083,03 1.663.641,05
2003 956 90 43 13 2.406.011,15 5.603.512,01 9.438.809,20 5.681.817,09
2004 1.165 111 53 14 7.038.855,47 3.701.103,30 6.897.294,65 6.927.648,00
2005 1.182 114 43 16 29.420.596,92 13.421.455,06 15.614.780,21 412.440,03
2006 1.229 111 41 17 7.823.544,88 15.567.397,88 47.601.230,46 10.336.241,12
2007 1.217 123 45 19 7.913.852,37 5.802.535,50 5.236.642,86 40.098.895,08
2008 1.290 105 48 20 26.558.021,70 13.403.295,71 23.663.147,10 26.995.879,61
2009 1.516 129 57 23 28.913.329,51 9.057.655,28 75.081.028,70 56.846.940,66
2010 1.512 138 67 18 104.996.851,20 18.516.793,46 73.253.818,86 110.332.107,30
Source: ComprasNet and Rais..
There is an intense debate in literature about the potential duality of these companies, since, according to the authors that emphasize spillovers effects, their technological skills could help the development of goods and products of interest of other sectors of the economy. In other words, firms that supply defense products would also be able to meet other demands, developing diversified business units and carrying a potential for considerable expansion. As in Brazil investment in the area is very irregular (Araujo et al., 2010), it would be reasonable to assume that, throughout their trajectories, these firms have diversified in order to avoid dependence on a single market.
In fact, the data summarized in Table 4 indicate that this might have happened. Considering only the 597 industrial companies, it is observed that they had other public clients in the federal government. Notwithstanding, the evolution of the representation of the MD as a client of these firms increased significantly in the period, from almost 20% in 2001 to 53% in 2010.
TABLE 4Distribution of values spent - manufacturing defense suppliers: MD vis-à-vis other agencies (2001-2010)(In U.S. $ million)
Year 2001 2002 2003 2004 2005 2006 2007 2008 2009 2010
A - Total MD expenditure in defense procurement - with manufacturing firms
14,58 19,26 20,1 19,07 36,79 64,43 39,8 63,9 139,36 220,98
B - Total Federal Governement expenditure with defense suppliers - manufacturing firms (other than MD)
58,57 92,9 76,78 85,08 161,07 186,35 242,8 170,36 214,92 197,47
C - Total Government Procurement Sales 73,15 112,17 96,88 104,15 197,87 250,78 282,6 234,26 354,28 418,46
A/C (%) 19,90 17,20 20,80 18,30 18,60 25,70 14,10 27,30 39,30 52,80
Source: ComprasNet and Rais.
26
B r a s í l i a , J a n u a r y 2 0 1 5
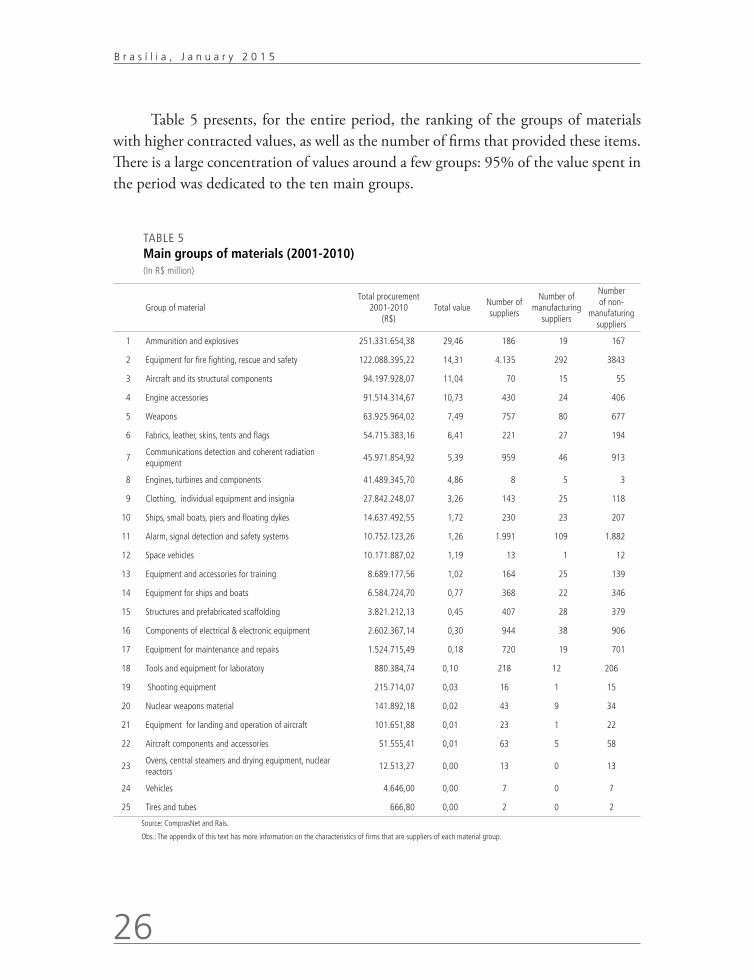
Table 5 presents, for the entire period, the ranking of the groups of materials with higher contracted values, as well as the number of firms that provided these items. There is a large concentration of values around a few groups: 95% of the value spent in the period was dedicated to the ten main groups.
TABLE 5Main groups of materials (2001-2010)(In R$ million)
Group of materialTotal procurement
2001-2010 (R$)
Total valueNumber of suppliers
Number of manufacturing
suppliers
Number of non-
manufaturing suppliers
1 Ammunition and explosives 251.331.654,38 29,46 186 19 167
2 Equipment for fire fighting, rescue and safety 122.088.395,22 14,31 4.135 292 3843
3 Aircraft and its structural components 94.197.928,07 11,04 70 15 55
4 Engine accessories 91.514.314,67 10,73 430 24 406
5 Weapons 63.925.964,02 7,49 757 80 677
6 Fabrics, leather, skins, tents and flags 54.715.383,16 6,41 221 27 194
7Communications detection and coherent radiation equipment
45.971.854,92 5,39 959 46 913
8 Engines, turbines and components 41.489.345,70 4,86 8 5 3
9 Clothing, individual equipment and insignia 27.842.248,07 3,26 143 25 118
10 Ships, small boats, piers and floating dykes 14.637.492,55 1,72 230 23 207
11 Alarm, signal detection and safety systems 10.752.123,26 1,26 1.991 109 1.882
12 Space vehicles 10.171.887,02 1,19 13 1 12
13 Equipment and accessories for training 8.689.177,56 1,02 164 25 139
14 Equipment for ships and boats 6.584.724,70 0,77 368 22 346
15 Structures and prefabricated scaffolding 3.821.212,13 0,45 407 28 379
16 Components of electrical & electronic equipment 2.602.367,14 0,30 944 38 906
17 Equipment for maintenance and repairs 1.524.715,49 0,18 720 19 701
18 Tools and equipment for laboratory 880.384,74 0,10 218 12 206
19 Shooting equipment 215.714,07 0,03 16 1 15
20 Nuclear weapons material 141.892,18 0,02 43 9 34
21 Equipment for landing and operation of aircraft 101.651,88 0,01 23 1 22
22 Aircraft components and accessories 51.555,41 0,01 63 5 58
23Ovens, central steamers and drying equipment, nuclear reactors
12.513,27 0,00 13 0 13
24 Vehicles 4.646,00 0,00 7 0 7
25 Tires and tubes 666,80 0,00 2 0 2
Source: ComprasNet and Rais.
Obs.: The appendix of this text has more information on the characteristics of firms that are suppliers of each material group.

27
Discussion Paper195 (1878a)
The Defense Industry in Brazil: characteristics and involvement of supplier firms
This concentration is further confirmed by the analysis of the regional distribution of contracted firms in the country. The association between firms tax ID and data from Rais allows the identification of the states where firms are located. Data indicates that 87% of the amounts expended by MD were destined for defense firms from three states: São Paulo (35%), Rio de Janeiro (32%) and Minas Gerais (20%). The data was aggregated for the whole period.
Such diagnosis about the groups of material and the geography of the committed values is further enhanced when observing the Figure 1. Between 2001 and 2010, only 20 companies accounted for 74% of the amount spent. If we consider the 30 largest suppliers of these items, the cumulative percentage reaches more than 80%.
FIGURE 1Distribution of amounts spent by supplier firms(R$ millions)
,000
20000000,000
40000000,000
60000000,000
80000000,000
100000000,000
120000000,000
140000000,000
160000000,000
0%
10%
20%
30%
40%
50%
60%
70%
80%
90%
100%
1 2 3 4 5 6 7 8 9 101112131415161718192021222324252627282930
Total Contracts % accumulated
0
Source: ComprasNet and Rais.
Previous studies conducted in the country, as in Araujo et al. (2010), have addressed whether domestic demand for defense firms was or not technology intensive. Adding to this discussion, we summarize here only for industrial companies, the shares of contracts, both in terms of values as well as in terms of number of firms, addressed
28
B r a s í l i a , J a n u a r y 2 0 1 5
to each category of technological intensity, following the Organization for Economic Cooperation and Development (OECD) taxonomy.21
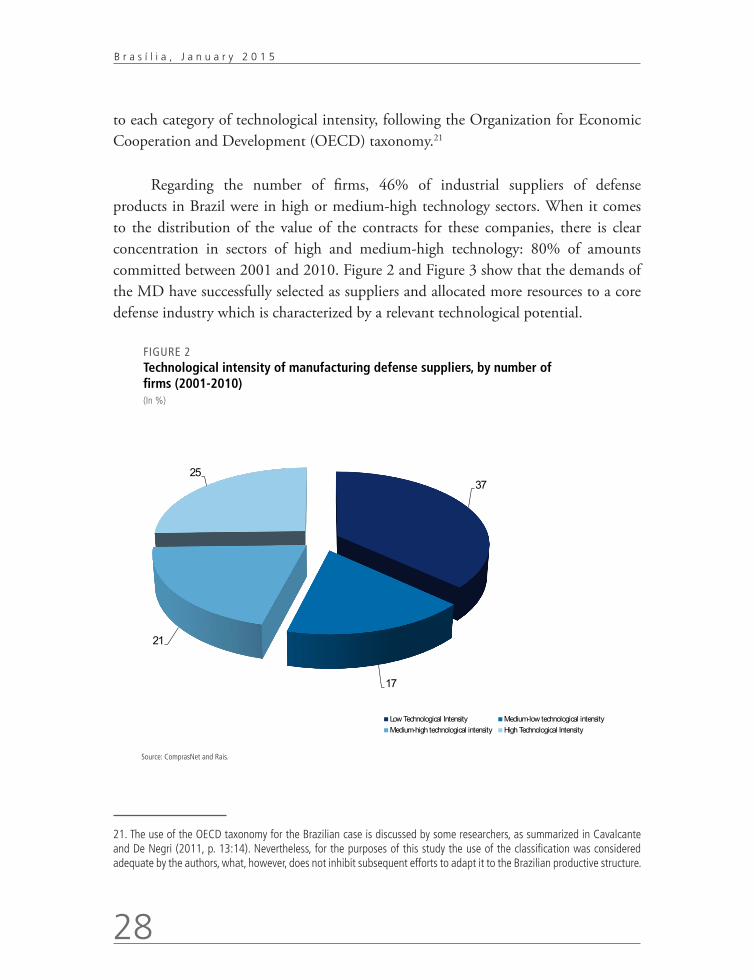
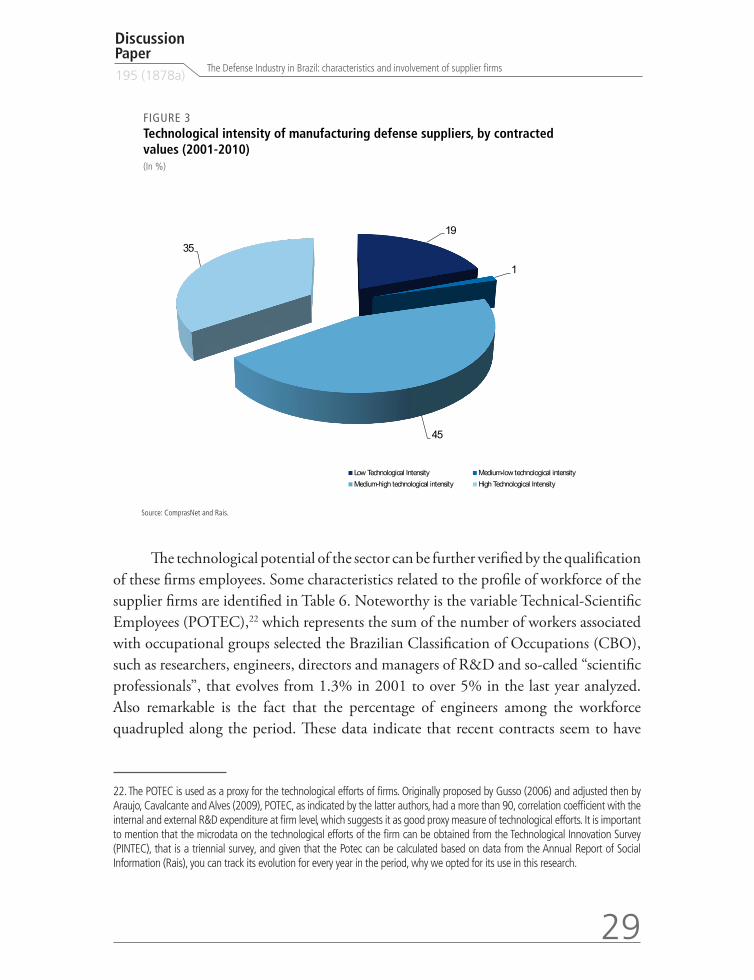
Regarding the number of firms, 46% of industrial suppliers of defense products in Brazil were in high or medium-high technology sectors. When it comes to the distribution of the value of the contracts for these companies, there is clear concentration in sectors of high and medium-high technology: 80% of amounts committed between 2001 and 2010. Figure 2 and Figure 3 show that the demands of the MD have successfully selected as suppliers and allocated more resources to a core defense industry which is characterized by a relevant technological potential.
FIGURE 2Technological intensity of manufacturing defense suppliers, by number of firms (2001-2010)(In %)
37
17
21
25
Low Technological Intensity Medium-low technological intensityMedium-high technological intensity High Technological Intensity
Source: ComprasNet and Rais.
21. The use of the OECD taxonomy for the Brazilian case is discussed by some researchers, as summarized in Cavalcante and De Negri (2011, p. 13:14). Nevertheless, for the purposes of this study the use of the classification was considered adequate by the authors, what, however, does not inhibit subsequent efforts to adapt it to the Brazilian productive structure.
29
Discussion Paper195 (1878a)
The Defense Industry in Brazil: characteristics and involvement of supplier firms
FIGURE 3Technological intensity of manufacturing defense suppliers, by contracted values (2001-2010)(In %)
19
1
45
35
Low Technological Intensity Medium-low technological intensityMedium-high technological intensity High Technological Intensity
Source: ComprasNet and Rais.
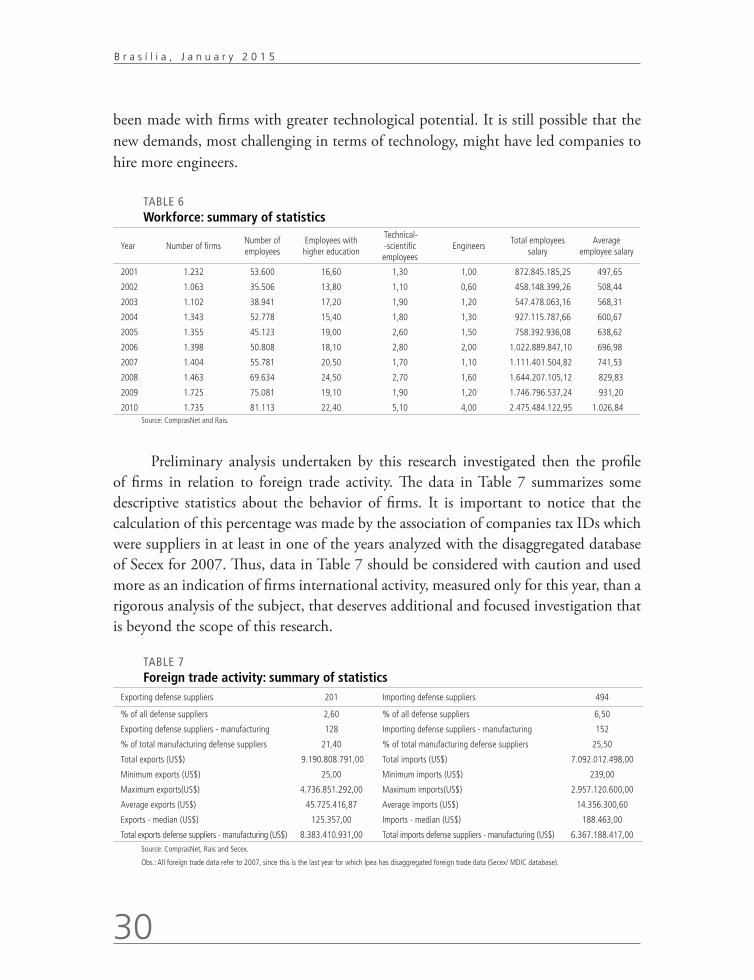
The technological potential of the sector can be further verified by the qualification of these firms employees. Some characteristics related to the profile of workforce of the supplier firms are identified in Table 6. Noteworthy is the variable Technical-Scientific Employees (POTEC),22 which represents the sum of the number of workers associated with occupational groups selected the Brazilian Classification of Occupations (CBO), such as researchers, engineers, directors and managers of R&D and so-called “scientific professionals”, that evolves from 1.3% in 2001 to over 5% in the last year analyzed. Also remarkable is the fact that the percentage of engineers among the workforce quadrupled along the period. These data indicate that recent contracts seem to have
22. The POTEC is used as a proxy for the technological efforts of firms. Originally proposed by Gusso (2006) and adjusted then by Araujo, Cavalcante and Alves (2009), POTEC, as indicated by the latter authors, had a more than 90, correlation coefficient with the internal and external R&D expenditure at firm level, which suggests it as good proxy measure of technological efforts. It is important to mention that the microdata on the technological efforts of the firm can be obtained from the Technological Innovation Survey (PINTEC), that is a triennial survey, and given that the Potec can be calculated based on data from the Annual Report of Social Information (Rais), you can track its evolution for every year in the period, why we opted for its use in this research.
30
B r a s í l i a , J a n u a r y 2 0 1 5
been made with firms with greater technological potential. It is still possible that the new demands, most challenging in terms of technology, might have led companies to hire more engineers.
TABLE 6Workforce: summary of statistics
Year Number of firmsNumber of employees
Employees with higher education
Technical- -scientific employees
EngineersTotal employees
salary Average
employee salary
2001 1.232 53.600 16,60 1,30 1,00 872.845.185,25 497,65
2002 1.063 35.506 13,80 1,10 0,60 458.148.399,26 508,44
2003 1.102 38.941 17,20 1,90 1,20 547.478.063,16 568,31
2004 1.343 52.778 15,40 1,80 1,30 927.115.787,66 600,67
2005 1.355 45.123 19,00 2,60 1,50 758.392.936,08 638,62
2006 1.398 50.808 18,10 2,80 2,00 1.022.889.847,10 696,98
2007 1.404 55.781 20,50 1,70 1,10 1.111.401.504,82 741,53
2008 1.463 69.634 24,50 2,70 1,60 1.644.207.105,12 829,83
2009 1.725 75.081 19,10 1,90 1,20 1.746.796.537,24 931,20
2010 1.735 81.113 22,40 5,10 4,00 2.475.484.122,95 1.026,84Source: ComprasNet and Rais.
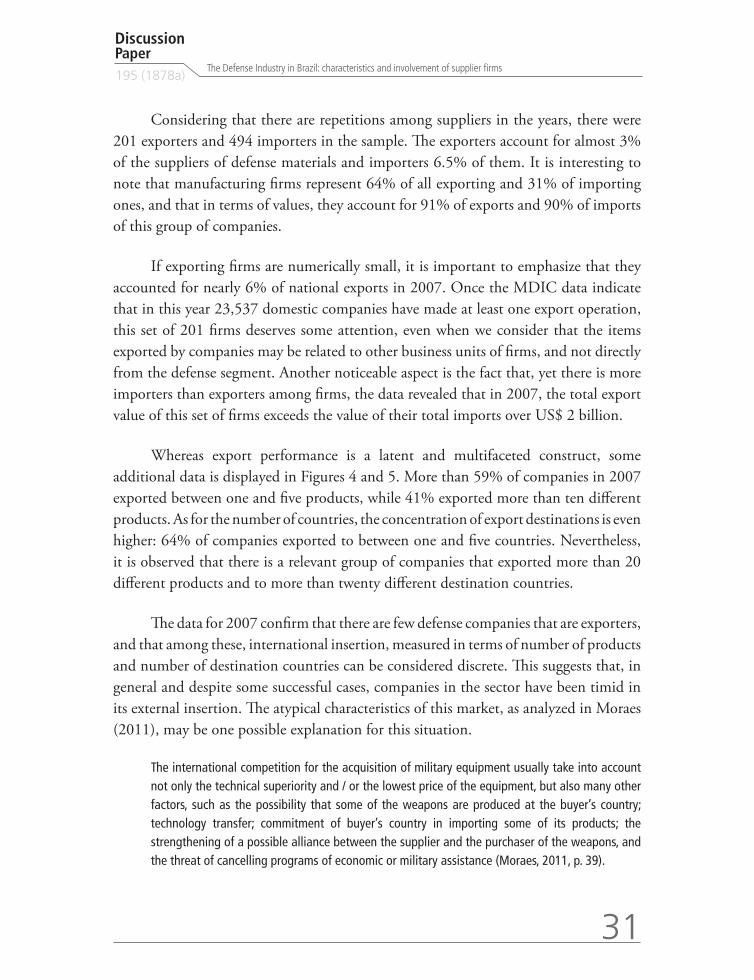
Preliminary analysis undertaken by this research investigated then the profile of firms in relation to foreign trade activity. The data in Table 7 summarizes some descriptive statistics about the behavior of firms. It is important to notice that the calculation of this percentage was made by the association of companies tax IDs which were suppliers in at least in one of the years analyzed with the disaggregated database of Secex for 2007. Thus, data in Table 7 should be considered with caution and used more as an indication of firms international activity, measured only for this year, than a rigorous analysis of the subject, that deserves additional and focused investigation that is beyond the scope of this research.
TABLE 7Foreign trade activity: summary of statistics
Exporting defense suppliers 201 Importing defense suppliers 494
% of all defense suppliers 2,60 % of all defense suppliers 6,50
Exporting defense suppliers - manufacturing 128 Importing defense suppliers - manufacturing 152
% of total manufacturing defense suppliers 21,40 % of total manufacturing defense suppliers 25,50
Total exports (US$) 9.190.808.791,00 Total imports (US$) 7.092.012.498,00
Minimum exports (US$) 25,00 Minimum imports (US$) 239,00
Maximum exports(US$) 4.736.851.292,00 Maximum imports(US$) 2.957.120.600,00
Average exports (US$) 45.725.416,87 Average imports (US$) 14.356.300,60
Exports - median (US$) 125.357,00 Imports - median (US$) 188.463,00
Total exports defense suppliers - manufacturing (US$) 8.383.410.931,00 Total imports defense suppliers - manufacturing (US$) 6.367.188.417,00
Source: ComprasNet, Rais and Secex.
Obs.: All foreign trade data refer to 2007, since this is the last year for which Ipea has disaggregated foreign trade data (Secex/ MDIC database).
31
Discussion Paper195 (1878a)
The Defense Industry in Brazil: characteristics and involvement of supplier firms
Considering that there are repetitions among suppliers in the years, there were 201 exporters and 494 importers in the sample. The exporters account for almost 3% of the suppliers of defense materials and importers 6.5% of them. It is interesting to note that manufacturing firms represent 64% of all exporting and 31% of importing ones, and that in terms of values, they account for 91% of exports and 90% of imports of this group of companies.
If exporting firms are numerically small, it is important to emphasize that they accounted for nearly 6% of national exports in 2007. Once the MDIC data indicate that in this year 23,537 domestic companies have made at least one export operation, this set of 201 firms deserves some attention, even when we consider that the items exported by companies may be related to other business units of firms, and not directly from the defense segment. Another noticeable aspect is the fact that, yet there is more importers than exporters among firms, the data revealed that in 2007, the total export value of this set of firms exceeds the value of their total imports over US$ 2 billion.
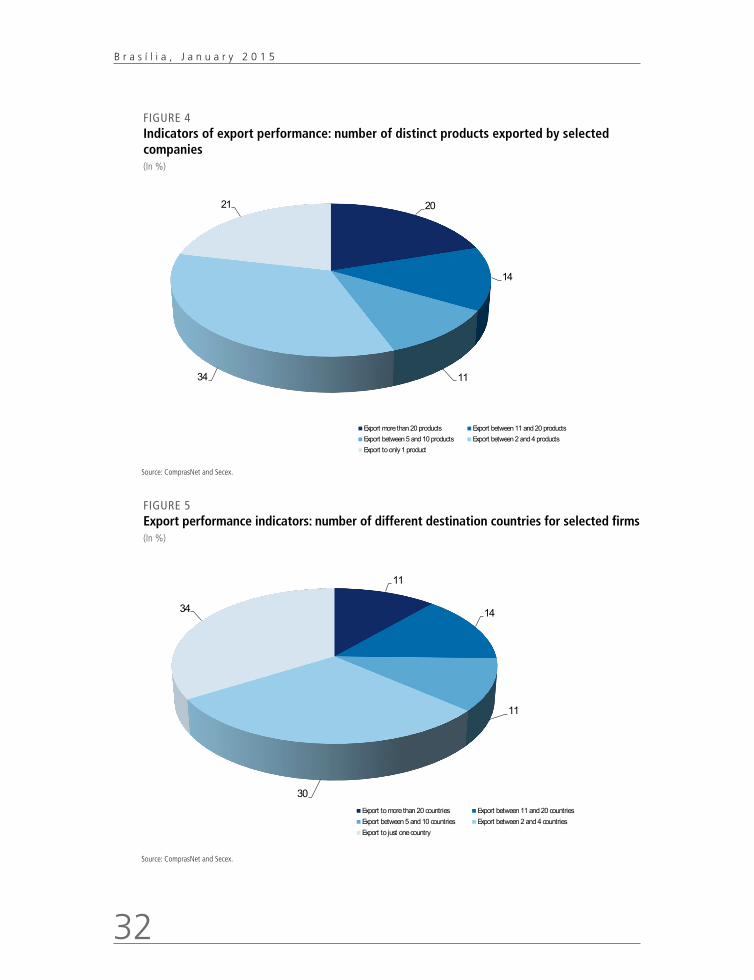
Whereas export performance is a latent and multifaceted construct, some additional data is displayed in Figures 4 and 5. More than 59% of companies in 2007 exported between one and five products, while 41% exported more than ten different products. As for the number of countries, the concentration of export destinations is even higher: 64% of companies exported to between one and five countries. Nevertheless, it is observed that there is a relevant group of companies that exported more than 20 different products and to more than twenty different destination countries.
The data for 2007 confirm that there are few defense companies that are exporters, and that among these, international insertion, measured in terms of number of products and number of destination countries can be considered discrete. This suggests that, in general and despite some successful cases, companies in the sector have been timid in its external insertion. The atypical characteristics of this market, as analyzed in Moraes (2011), may be one possible explanation for this situation.
The international competition for the acquisition of military equipment usually take into account not only the technical superiority and / or the lowest price of the equipment, but also many other factors, such as the possibility that some of the weapons are produced at the buyer’s country; technology transfer; commitment of buyer’s country in importing some of its products; the strengthening of a possible alliance between the supplier and the purchaser of the weapons, and the threat of cancelling programs of economic or military assistance (Moraes, 2011, p. 39).
32
B r a s í l i a , J a n u a r y 2 0 1 5
FIGURE 4Indicators of export performance: number of distinct products exported by selected companies (In %)
20
14
1134
21
Export more than 20 products Export between 11 and 20 productsExport between 5 and 10 products Export between 2 and 4 productsExport to only 1 product
Source: ComprasNet and Secex.
FIGURE 5Export performance indicators: number of different destination countries for selected firms (In %)
11
14
11
30
34
Export to more than 20 countries Export between 11 and 20 countriesExport between 5 and 10 countries Export between 2 and 4 countriesExport to just one country
Source: ComprasNet and Secex.
33
Discussion Paper195 (1878a)
The Defense Industry in Brazil: characteristics and involvement of supplier firms
Thus, further research on the subject of foreign trade in Brazilian defense industry is needed to produce a more accurate diagnosis.
4.2 Permanence of firms as suppliers of defense
In this section, additional descriptive statistics are analyzed in order to investigate the persistence of firms as suppliers in the period and their individual characteristics. Therefore, the suppliers were divided into four groups according to the number of years in which they have sold for the MD during the period (2001-2010):
• (0) Firm was contracted in only one year;
• (1) Between two and four years;
• (2) Between five and nine years; and
• (3) Companies that were contracted in every year in the period.
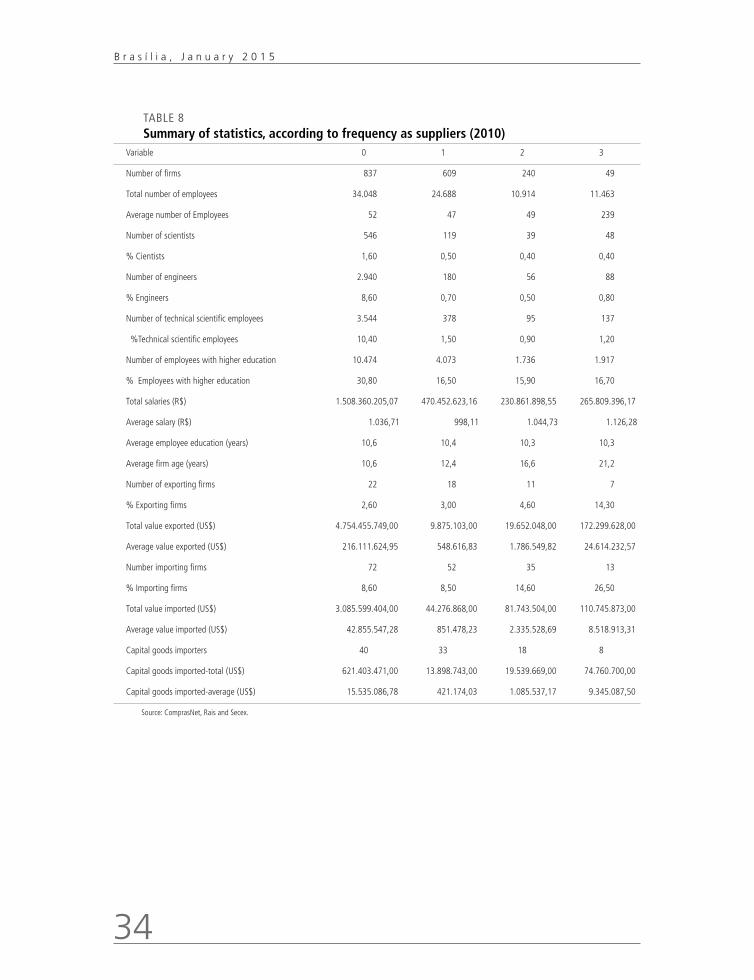
Initially, in Table 8, we present some features of interest of the 1.735 firms that were suppliers in 2010, divided into the groups listed above.
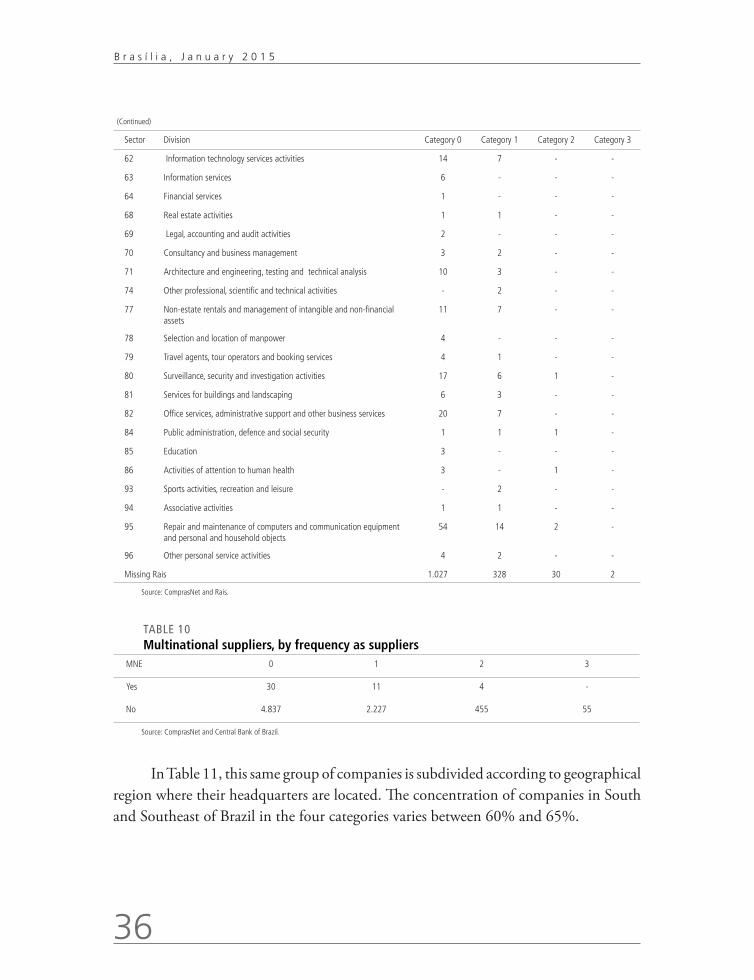
In Table 9, all 7.619 companies that were suppliers between 2001 and 2010 were assigned to their economic activity. Only 55 firms were suppliers in every year of the period, out of which only 11 are manufacturing companies. Among the 459 firms in group 2, which provided between five and nine years, the proportion of industry is even lower: 6.
Finally, Table 10 presents the share of multinational (MNE) companies between investigated firms, using data of Central Bank of Brazil. Results show that their presence in proportion to all firms is apparently not significant. It is noteworthy that, since the data are for 2000, and meanwhile several institutional changes have altered the context of national defense industry, turning Brazilian market more attractive to foreign companies, it is possible that this percentage has expanded over the period.23
23. Some related news were spread in the media in 2012 and in 2013, as in http://www.istoedinheiro.com.br/noticias/76604_DEFESA+BILIONARIA, http://www.jb.com.br/pais/noticias/2012/08/16/o-cerco-a-industria-brasileira-de-defesa-2/ and http://www.janes.com/products/janes/defence-security-report.aspx?ID=1065975437.
34
B r a s í l i a , J a n u a r y 2 0 1 5
TABLE 8Summary of statistics, according to frequency as suppliers (2010)
Variable 0 1 2 3
Number of firms 837 609 240 49
Total number of employees 34.048 24.688 10.914 11.463
Average number of Employees 52 47 49 239
Number of scientists 546 119 39 48
% Cientists 1,60 0,50 0,40 0,40
Number of engineers 2.940 180 56 88
% Engineers 8,60 0,70 0,50 0,80
Number of technical scientific employees 3.544 378 95 137
%Technical scientific employees 10,40 1,50 0,90 1,20
Number of employees with higher education 10.474 4.073 1.736 1.917
% Employees with higher education 30,80 16,50 15,90 16,70
Total salaries (R$) 1.508.360.205,07 470.452.623,16 230.861.898,55 265.809.396,17
Average salary (R$) 1.036,71 998,11 1.044,73 1.126,28
Average employee education (years) 10,6 10,4 10,3 10,3
Average firm age (years) 10,6 12,4 16,6 21,2
Number of exporting firms 22 18 11 7
% Exporting firms 2,60 3,00 4,60 14,30
Total value exported (US$) 4.754.455.749,00 9.875.103,00 19.652.048,00 172.299.628,00
Average value exported (US$) 216.111.624,95 548.616,83 1.786.549,82 24.614.232,57
Number importing firms 72 52 35 13
% Importing firms 8,60 8,50 14,60 26,50
Total value imported (US$) 3.085.599.404,00 44.276.868,00 81.743.504,00 110.745.873,00
Average value imported (US$) 42.855.547,28 851.478,23 2.335.528,69 8.518.913,31
Capital goods importers 40 33 18 8
Capital goods imported-total (US$) 621.403.471,00 13.898.743,00 19.539.669,00 74.760.700,00
Capital goods imported-average (US$) 15.535.086,78 421.174,03 1.085.537,17 9.345.087,50
Source: ComprasNet, Rais and Secex.

35
Discussion Paper195 (1878a)
The Defense Industry in Brazil: characteristics and involvement of supplier firms
TABLE 9Defense suppliers by sector, according to frequency as suppliers
Sector Division Category 0 Category 1 Category 2 Category 3
1 Agriculture, livestock and related services 12 3 - -
7 Mineral metals extraction 1 - - -
8 Non-metallic minerals extraction 1 - - -
9 Minerals extraction - support activities 1 - - -
10 Food manufacture 2 2 - -
13 Textiles manufacture 9 9 1 2
14 Articles of clothing and accessories manufacture 61 22 7 3
15 Preparation of leather and manufacture of artifacts of leather, travel goods and shoes
13 1 - -
16 Wood manufacture 3 4 2 -
18 Printing and recordings reproduction 16 2 - -
20 Chemicals manufacture 14 11 1 -
21 Pharmaceutical and chemicals manufacturing 5 2 - -
22 Rubber and plastic material manufacturing 15 3 - -
23 Production of non-metallic minerals 9 2 - -
24 Metallurgy 7 4 - -
25 Metal products, except machinery and equipment manufacturing 45 19 3 4
26 Computer equipment, electronic and optical products manufacturing 50 11 3 -
27 Machinery and electrical supplies manufacturing 22 8 1 -
28 Manufacture of machinery and equipment 28 10 - -
29 Manufacture of automotive vehicles, trailers and carts 10 6 - -
30 Manufacture of other transport equipment, except automotive vehicles 11 6 - 1
31 Manufacture of furniture 6 - - -
32 Manufacture of miscellaneous 44 23 8 1
33 Maintenance, repair and installation of machinery and equipment 28 11 3 -
41 Building construction 15 6 - -
42 Infrastructure 15 4 - -
43 Specialized services for construction 28 10 - -
45 Trade and repair of automotive vehicles and motorcycles 454 237 48 6
46 Wholesale trade, except automotive vehicles and motorcycles 608 299 87 6
47 Retail 2.097 1.125 257 30
49 Ground transportation 7 1 1 -
50 Waterway transport 2 - - -
51 Air transport 2 - - -
52 Storage and auxiliary transport activities 4 1 - -
56 Food services 8 5 - -
58 Editing and printing 8 - - -
61 Telecom 14 4 2 -
(Continues)
36
B r a s í l i a , J a n u a r y 2 0 1 5
(Continued)
Sector Division Category 0 Category 1 Category 2 Category 3
62 Information technology services activities 14 7 - -
63 Information services 6 - - -
64 Financial services 1 - - -
68 Real estate activities 1 1 - -
69 Legal, accounting and audit activities 2 - - -
70 Consultancy and business management 3 2 - -
71 Architecture and engineering, testing and technical analysis 10 3 - -
74 Other professional, scientific and technical activities - 2 - -
77 Non-estate rentals and management of intangible and non-financial assets
11 7 - -
78 Selection and location of manpower 4 - - -
79 Travel agents, tour operators and booking services 4 1 - -
80 Surveillance, security and investigation activities 17 6 1 -
81 Services for buildings and landscaping 6 3 - -
82 Office services, administrative support and other business services 20 7 - -
84 Public administration, defence and social security 1 1 1 -
85 Education 3 - - -
86 Activities of attention to human health 3 - 1 -
93 Sports activities, recreation and leisure - 2 - -
94 Associative activities 1 1 - -
95 Repair and maintenance of computers and communication equipment and personal and household objects
54 14 2 -
96 Other personal service activities 4 2 - -
Missing Rais 1.027 328 30 2
Source: ComprasNet and Rais.
TABLE 10Multinational suppliers, by frequency as suppliers
MNE 0 1 2 3
Yes 30 11 4 -
No 4.837 2.227 455 55
Source: ComprasNet and Central Bank of Brazil.
In Table 11, this same group of companies is subdivided according to geographical region where their headquarters are located. The concentration of companies in South and Southeast of Brazil in the four categories varies between 60% and 65%.
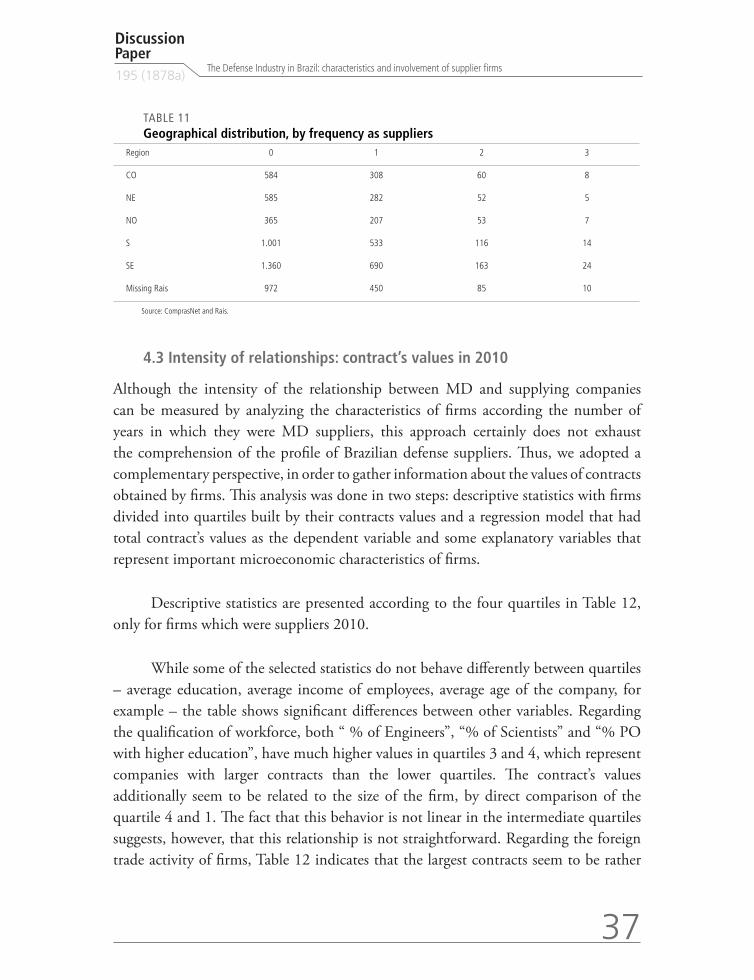
37
Discussion Paper195 (1878a)
The Defense Industry in Brazil: characteristics and involvement of supplier firms
TABLE 11Geographical distribution, by frequency as suppliers
Region 0 1 2 3
CO 584 308 60 8
NE 585 282 52 5
NO 365 207 53 7
S 1.001 533 116 14
SE 1.360 690 163 24
Missing Rais 972 450 85 10
Source: ComprasNet and Rais.
4.3 Intensity of relationships: contract’s values in 2010
Although the intensity of the relationship between MD and supplying companies can be measured by analyzing the characteristics of firms according the number of years in which they were MD suppliers, this approach certainly does not exhaust the comprehension of the profile of Brazilian defense suppliers. Thus, we adopted a complementary perspective, in order to gather information about the values of contracts obtained by firms. This analysis was done in two steps: descriptive statistics with firms divided into quartiles built by their contracts values and a regression model that had total contract’s values as the dependent variable and some explanatory variables that represent important microeconomic characteristics of firms.
Descriptive statistics are presented according to the four quartiles in Table 12, only for firms which were suppliers 2010.
While some of the selected statistics do not behave differently between quartiles – average education, average income of employees, average age of the company, for example – the table shows significant differences between other variables. Regarding the qualification of workforce, both “ % of Engineers”, “% of Scientists” and “% PO with higher education”, have much higher values in quartiles 3 and 4, which represent companies with larger contracts than the lower quartiles. The contract’s values additionally seem to be related to the size of the firm, by direct comparison of the quartile 4 and 1. The fact that this behavior is not linear in the intermediate quartiles suggests, however, that this relationship is not straightforward. Regarding the foreign trade activity of firms, Table 12 indicates that the largest contracts seem to be rather

38
B r a s í l i a , J a n u a r y 2 0 1 5
associated with more intense participation in international trade, what is clear both in the percentage of importing and exporting firms over quartiles as well as by the average values of exports and imports.
TABLE 12Summary statistics for suppliers (2010)
Variable Quartile 1 Quartile 2 Quartile 3 Quartile 4
Number of firms 234 305 444 752
Total number of employees 6.828 15.017 6.601 52.667
Average number of employees 33 59 18 84
Number of scientists 32 77 39 604
% Cientists 0,50 0,50 0,60 1,10
Number of engineers 33 6 35 3.189
% Engineers 0,50 0,00 0,50 6,10
Number of technical-scientific employees 65 83 78 3.928
% Technical-scientific employees 1,00 0,60 1,20 7,50
Number of employees with higher education 1.102 2.356 925 13.817
% Employees with higher education 16,10 15,70 14,00 26,20
Total salaries (R$) 125.644.402,88 275.325.685,70 93.298.851,39 1.981.215.182,98
Average salary (R$) 978,97 956,32 911,93 1.138,69
Average employee education (years) 10,5 10,3 10,3 10,6
Average firm age (years) 12,4 12,3 11,9 13
Number of exporting firms 1 2 8 47
% Exporting firms 0,40 0,70 1,80 6,30
Total value exported (US$) 34.092,00 752.930,00 968.921,00 4.954.526.585,00
Average value exported (US$) 34.092,00 376.465,00 121.115,13 105.415.459,26
Number importing firms 10 18 24 120
% Importing firms 4,30 5,90 5,40 16,00
Total value imported (US$) 29.697.459,00 13.612.040,00 28.381.682,00 3.250.674.468,00
Average value imported (US$) 2.969.745,90 756.224,44 1.182.570,08 27.088.953,90
Capital goods importers 5 9 11 74
Capital goods imported-total (US$) 22.238.209,00 4.973.573,00 6.572.917,00 695.817.884,00
Capital goods imported-average (US$) 4.447.641,80 552.619,22 597.537,91 9.402.944,38
Source: ComprasNet, Rais and Secex.
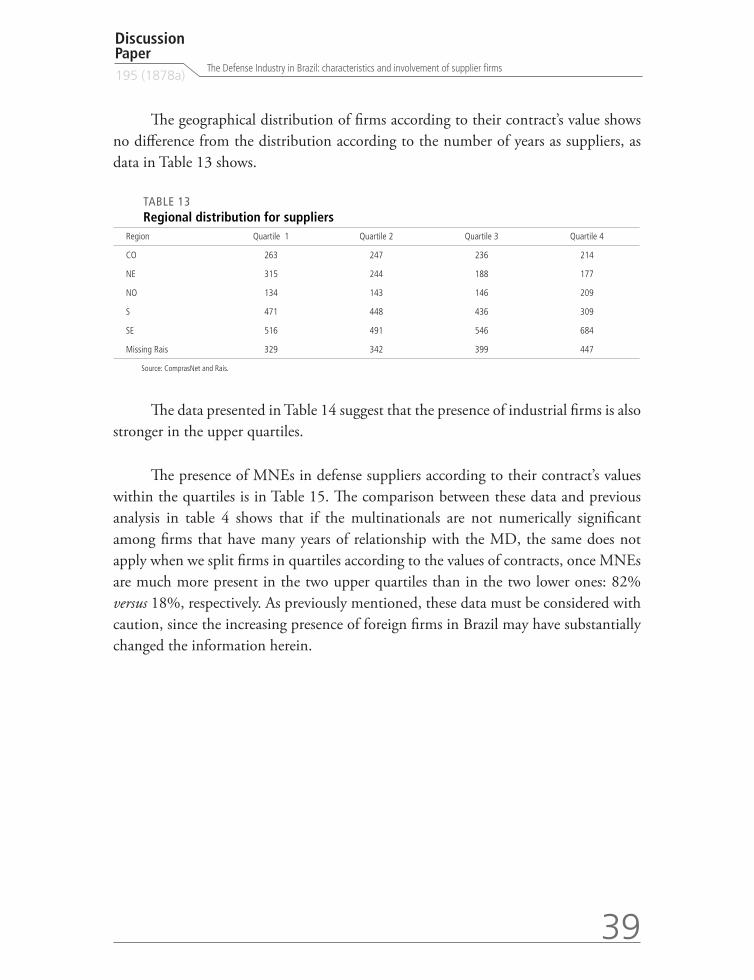
39
Discussion Paper195 (1878a)
The Defense Industry in Brazil: characteristics and involvement of supplier firms
The geographical distribution of firms according to their contract’s value shows no difference from the distribution according to the number of years as suppliers, as data in Table 13 shows.
TABLE 13Regional distribution for suppliers
Region Quartile 1 Quartile 2 Quartile 3 Quartile 4
CO 263 247 236 214
NE 315 244 188 177
NO 134 143 146 209
S 471 448 436 309
SE 516 491 546 684
Missing Rais 329 342 399 447
Source: ComprasNet and Rais.
The data presented in Table 14 suggest that the presence of industrial firms is also stronger in the upper quartiles.
The presence of MNEs in defense suppliers according to their contract’s values within the quartiles is in Table 15. The comparison between these data and previous analysis in table 4 shows that if the multinationals are not numerically significant among firms that have many years of relationship with the MD, the same does not apply when we split firms in quartiles according to the values of contracts, once MNEs are much more present in the two upper quartiles than in the two lower ones: 82% versus 18%, respectively. As previously mentioned, these data must be considered with caution, since the increasing presence of foreign firms in Brazil may have substantially changed the information herein.
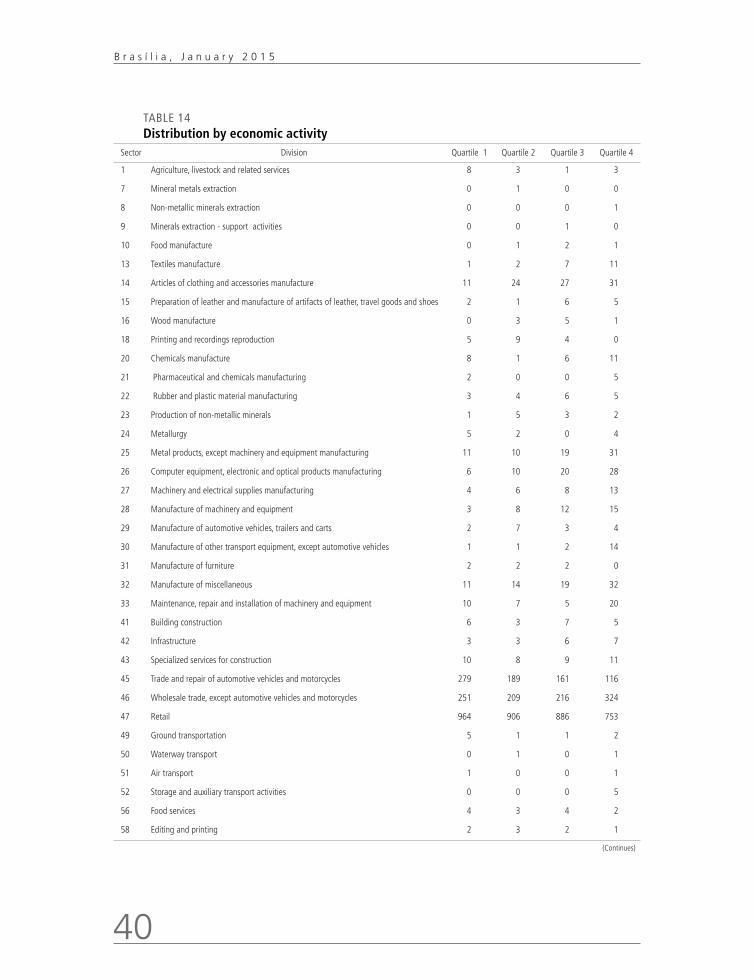
40
B r a s í l i a , J a n u a r y 2 0 1 5
TABLE 14Distribution by economic activity
Sector Division Quartile 1 Quartile 2 Quartile 3 Quartile 4
1 Agriculture, livestock and related services 8 3 1 3
7 Mineral metals extraction 0 1 0 0
8 Non-metallic minerals extraction 0 0 0 1
9 Minerals extraction - support activities 0 0 1 0
10 Food manufacture 0 1 2 1
13 Textiles manufacture 1 2 7 11
14 Articles of clothing and accessories manufacture 11 24 27 31
15 Preparation of leather and manufacture of artifacts of leather, travel goods and shoes 2 1 6 5
16 Wood manufacture 0 3 5 1
18 Printing and recordings reproduction 5 9 4 0
20 Chemicals manufacture 8 1 6 11
21 Pharmaceutical and chemicals manufacturing 2 0 0 5
22 Rubber and plastic material manufacturing 3 4 6 5
23 Production of non-metallic minerals 1 5 3 2
24 Metallurgy 5 2 0 4
25 Metal products, except machinery and equipment manufacturing 11 10 19 31
26 Computer equipment, electronic and optical products manufacturing 6 10 20 28
27 Machinery and electrical supplies manufacturing 4 6 8 13
28 Manufacture of machinery and equipment 3 8 12 15
29 Manufacture of automotive vehicles, trailers and carts 2 7 3 4
30 Manufacture of other transport equipment, except automotive vehicles 1 1 2 14
31 Manufacture of furniture 2 2 2 0
32 Manufacture of miscellaneous 11 14 19 32
33 Maintenance, repair and installation of machinery and equipment 10 7 5 20
41 Building construction 6 3 7 5
42 Infrastructure 3 3 6 7
43 Specialized services for construction 10 8 9 11
45 Trade and repair of automotive vehicles and motorcycles 279 189 161 116
46 Wholesale trade, except automotive vehicles and motorcycles 251 209 216 324
47 Retail 964 906 886 753
49 Ground transportation 5 1 1 2
50 Waterway transport 0 1 0 1
51 Air transport 1 0 0 1
52 Storage and auxiliary transport activities 0 0 0 5
56 Food services 4 3 4 2
58 Editing and printing 2 3 2 1
(Continues)
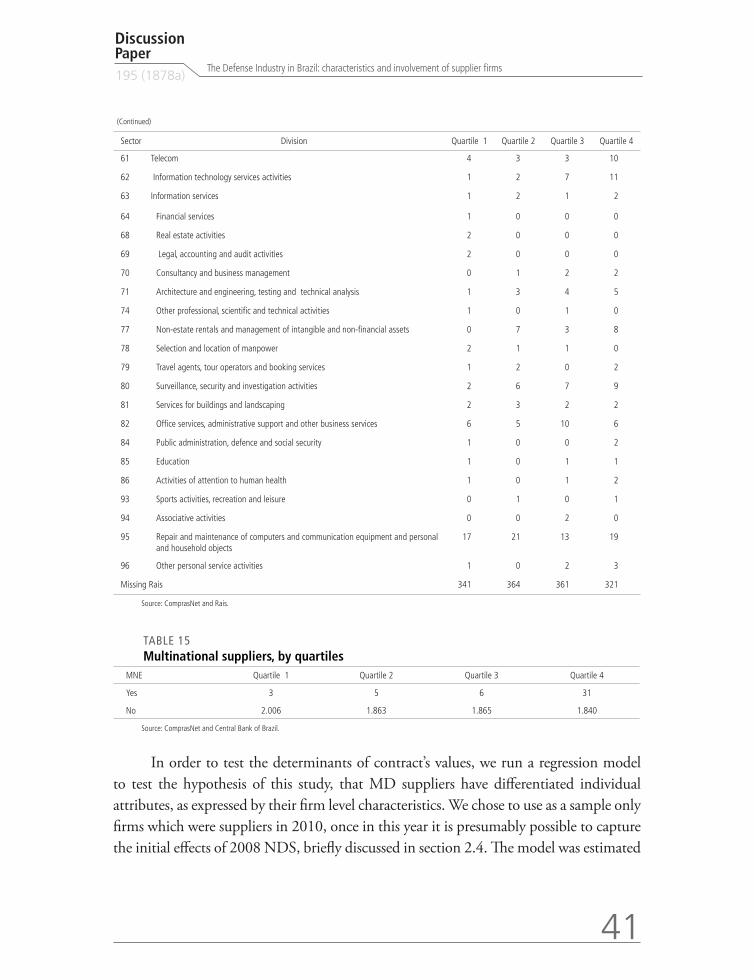
41
Discussion Paper195 (1878a)
The Defense Industry in Brazil: characteristics and involvement of supplier firms
(Continued)
Sector Division Quartile 1 Quartile 2 Quartile 3 Quartile 4
61 Telecom 4 3 3 10
62 Information technology services activities 1 2 7 11
63 Information services 1 2 1 2
64 Financial services 1 0 0 0
68 Real estate activities 2 0 0 0
69 Legal, accounting and audit activities 2 0 0 0
70 Consultancy and business management 0 1 2 2
71 Architecture and engineering, testing and technical analysis 1 3 4 5
74 Other professional, scientific and technical activities 1 0 1 0
77 Non-estate rentals and management of intangible and non-financial assets 0 7 3 8
78 Selection and location of manpower 2 1 1 0
79 Travel agents, tour operators and booking services 1 2 0 2
80 Surveillance, security and investigation activities 2 6 7 9
81 Services for buildings and landscaping 2 3 2 2
82 Office services, administrative support and other business services 6 5 10 6
84 Public administration, defence and social security 1 0 0 2
85 Education 1 0 1 1
86 Activities of attention to human health 1 0 1 2
93 Sports activities, recreation and leisure 0 1 0 1
94 Associative activities 0 0 2 0
95 Repair and maintenance of computers and communication equipment and personal and household objects
17 21 13 19
96 Other personal service activities 1 0 2 3
Missing Rais 341 364 361 321
Source: ComprasNet and Rais.
TABLE 15Multinational suppliers, by quartiles
MNE Quartile 1 Quartile 2 Quartile 3 Quartile 4
Yes 3 5 6 31
No 2.006 1.863 1.865 1.840
Source: ComprasNet and Central Bank of Brazil.
In order to test the determinants of contract’s values, we run a regression model to test the hypothesis of this study, that MD suppliers have differentiated individual attributes, as expressed by their firm level characteristics. We chose to use as a sample only firms which were suppliers in 2010, once in this year it is presumably possible to capture the initial effects of 2008 NDS, briefly discussed in section 2.4. The model was estimated
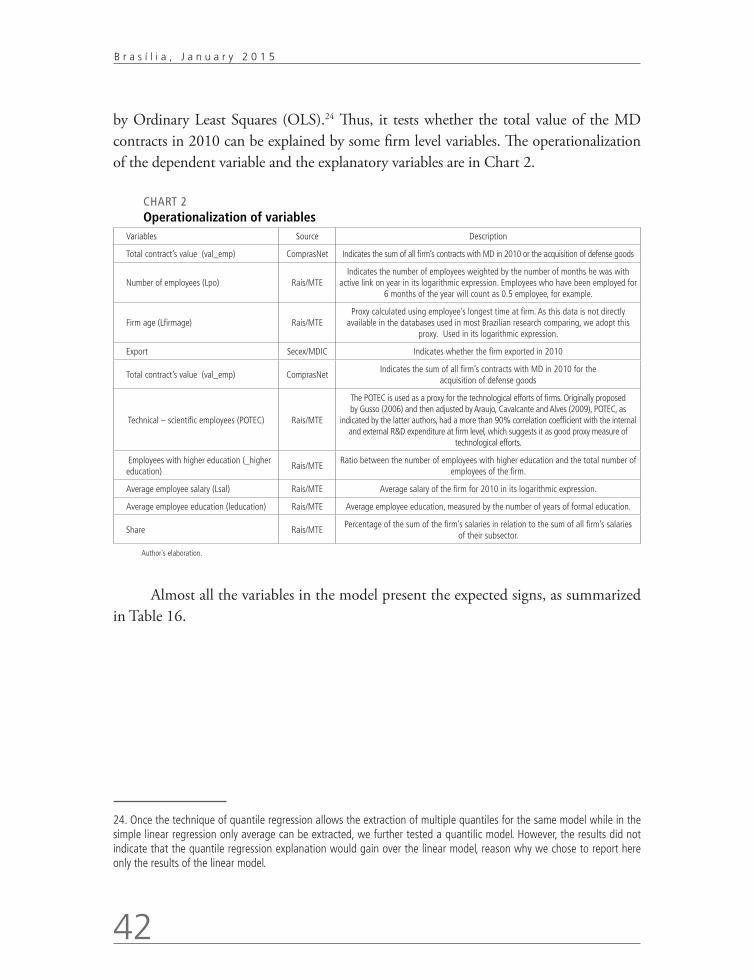
42
B r a s í l i a , J a n u a r y 2 0 1 5
by Ordinary Least Squares (OLS).24 Thus, it tests whether the total value of the MD contracts in 2010 can be explained by some firm level variables. The operationalization of the dependent variable and the explanatory variables are in Chart 2.
CHART 2Operationalization of variables
Variables Source Description
Total contract’s value (val_emp) ComprasNet Indicates the sum of all firm’s contracts with MD in 2010 or the acquisition of defense goods
Number of employees (Lpo) Rais/MTEIndicates the number of employees weighted by the number of months he was with
active link on year in its logarithmic expression. Employees who have been employed for 6 months of the year will count as 0.5 employee, for example.
Firm age (Lfirmage) Rais/MTEProxy calculated using employee’s longest time at firm. As this data is not directly
available in the databases used in most Brazilian research comparing, we adopt this proxy. Used in its logarithmic expression.
Export Secex/MDIC Indicates whether the firm exported in 2010
Total contract’s value (val_emp) ComprasNetIndicates the sum of all firm’s contracts with MD in 2010 for the
acquisition of defense goods
Technical – scientific employees (POTEC) Rais/MTE
The POTEC is used as a proxy for the technological efforts of firms. Originally proposed by Gusso (2006) and then adjusted by Araujo, Cavalcante and Alves (2009), POTEC, as
indicated by the latter authors, had a more than 90% correlation coefficient with the internal and external R&D expenditure at firm level, which suggests it as good proxy measure of
technological efforts.
Employees with higher education (_higher education)
Rais/MTERatio between the number of employees with higher education and the total number of
employees of the firm.
Average employee salary (Lsal) Rais/MTE Average salary of the firm for 2010 in its logarithmic expression.
Average employee education (leducation) Rais/MTE Average employee education, measured by the number of years of formal education.
Share Rais/MTEPercentage of the sum of the firm’s salaries in relation to the sum of all firm’s salaries
of their subsector.
Author´s elaboration.
Almost all the variables in the model present the expected signs, as summarized in Table 16.
24. Once the technique of quantile regression allows the extraction of multiple quantiles for the same model while in the simple linear regression only average can be extracted, we further tested a quantilic model. However, the results did not indicate that the quantile regression explanation would gain over the linear model, reason why we chose to report here only the results of the linear model.
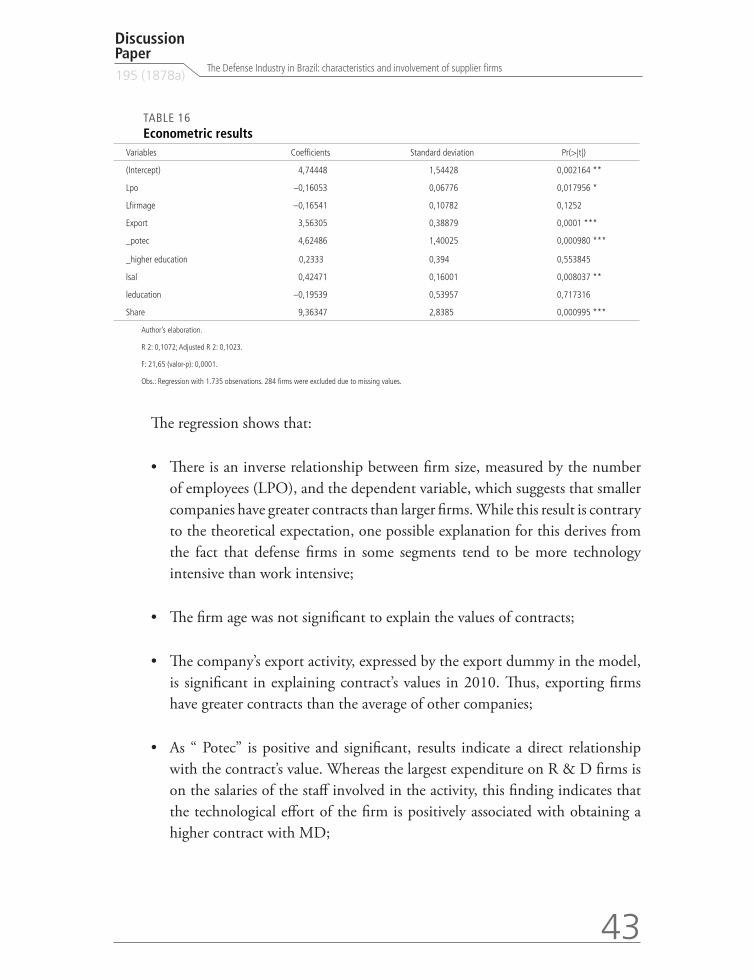
43
Discussion Paper195 (1878a)
The Defense Industry in Brazil: characteristics and involvement of supplier firms
TABLE 16Econometric results
Variables Coefficients Standard deviation Pr(>|t|)
(Intercept) 4,74448 1,54428 0,002164 **
Lpo –0,16053 0,06776 0,017956 *
Lfirmage –0,16541 0,10782 0,1252
Export 3,56305 0,38879 0,0001 ***
_potec 4,62486 1,40025 0,000980 ***
_higher education 0,2333 0,394 0,553845
lsal 0,42471 0,16001 0,008037 **
leducation –0,19539 0,53957 0,717316
Share 9,36347 2,8385 0,000995 ***
Author’s elaboration.
R 2: 0,1072; Adjusted R 2: 0,1023.
F: 21,65 (valor-p): 0,0001.
Obs.: Regression with 1.735 observations. 284 firms were excluded due to missing values.
The regression shows that:
• There is an inverse relationship between firm size, measured by the number of employees (LPO), and the dependent variable, which suggests that smaller companies have greater contracts than larger firms. While this result is contrary to the theoretical expectation, one possible explanation for this derives from the fact that defense firms in some segments tend to be more technology intensive than work intensive;
• The firm age was not significant to explain the values of contracts;
• The company’s export activity, expressed by the export dummy in the model, is significant in explaining contract’s values in 2010. Thus, exporting firms have greater contracts than the average of other companies;
• As “ Potec” is positive and significant, results indicate a direct relationship with the contract’s value. Whereas the largest expenditure on R & D firms is on the salaries of the staff involved in the activity, this finding indicates that the technological effort of the firm is positively associated with obtaining a higher contract with MD;
44
B r a s í l i a , J a n u a r y 2 0 1 5
• The percentage of employees with higher education is not significant in explaining the annual value of contracts obtained by firms with the MD;
• The average income of workers employed has a significant and direct relation with the dependent variable;
• The average study time was not significant in the model tested; and
• The market share of the company, measured by the share of sum of firm’s wages to the total wages of their subsector, is positive and significant.
5 CONCLUSIONS
In this article we have investigated firm level attributes of Brazilian defense suppliers between 2001 and 2010. We argue that MD, as the sole buyer, is able to shape industry structure. This paper seeks to provide more knowledge about Brazilian Defense Industrial Base in the moment that public policies have been articulated in order to revitalize the Brazilian defense industry.
The central hypothesis was based on the theoretical framework on the subject. Literature devoted to relationship between organizational customers and suppliers assume that these relations are strategic by nature. These relationships should be even more critical to involved parties when acquisitions require that suppliers have or develop specific assets and skills, such as in the case of defense. The distinctive characteristics of defense markets, in which MD challenging demands can act as catalysts for innovative processes in hired firms, support this assumption. The Brazilian regulatory framework, in turn, has been consistent over the past few years in affirming the national ambition for endogenous development of technologically competitive defense products.
The empirical analysis used a base of 7.619 companies that were hired in the period for supplying typical defense goods, thus identified as representative of Brazilian Defense Industrial Base according to the criteria known in the literature as “shopping list”. These companies were identified through the use of filters applied to a federal detailed and disaggregated database of Brazilian government procurement called Comprasnet.

45
Discussion Paper195 (1878a)
The Defense Industry in Brazil: characteristics and involvement of supplier firms
At first, general descriptive analysis were made. Thus, in the period 2001-2010, a small percentage of the total purchases made by the Ministry of Defense were dedicated to typical defense products: on average 3% in the period, with the peak in 2010, when 6.2% of MD national contracts was related to defense goods. Some caution is necessary with these figures, due to the fact that many purchases of defense goods are made abroad by MD, and are not well captured by the data collection method used in this article. Besides, it is possible that some goods were bought through service contracts, also not captured in this methodology. However, once this paper aims at investigating the potential contribution of the acquisitions of MD for the establishment of an endogenous and competitive DIB, this aspect is not considered a severe limitation.
Preliminary evidence also shows that while manufacturing firms are numerically a smaller fraction of MD contractors over the period, most of the amount was spent on contracts addressed to them. However, a considerable portion of defense budget was spent in contracts with commercial firms.
As expected, most of the acquisitions were assigned to medium and large companies. Despite this finding, the share of micro and small firms in defense procurement has expanded significantly between 2001 and 2010.
A significant concentration of procurement of defense products was observed, both in what concerns material groups acquired over the period as for the spatial distribution of the contractors. In the case of the material groups, the ten most purchased ones accounted for 95% of the total value of acquisitions analyzed. In the analysis of the “geography” of government procurement, it was evident that suppliers of typical defense products are concentrated in the Southeast region, which accounted for 87% of the total procurement in the period. Another investigated aspect was the technological intensity of industrial firms contracted by MD: 80% are from high or medium-high technological intensity sectors. Only a small number of companies held export (2.6%) and imports (6.5%) activities. The 201 exporters, however, accounted for a proportionately high share of total Brazilian exports in 2007 (6%). The number of exported products and destination countries, however, is low: 59% of companies export between only 1 and 5 products and 64% export to between 1 and 5 different countries.

46
B r a s í l i a , J a n u a r y 2 0 1 5
In the second stage of the empirical analysis, considering the importance reported in the literature of long-term orientation in relationships between suppliers and buyers, firms in the sample were split into four groups according to the number of years in which they were suppliers. Following, a complementary approach was adopted, focusing on the intensity of the relationships according to the contract’s values for each firm.
This second approach also used a cross-section OLS regression, for the year 2010, combining some firm level characteristics and the total value of contracts in this year. The results indicated that some characteristics related to firm competitiveness had positive and significant relationship with the dependent variable adopted. Among these, it is worth highlighting the export activity, the percentage of technical-specialized personnel in company, the average wage of workers and market share of the firm in the sector.
Thus, considering that during the decade of 2000 the issue of technological capability of the defense industry was more heavily reinserted on the agenda of Brazilian public policies, the results for 2010 indicated that the MD has been quite successful in its procurement policy. Only the behavior of “size” was different than expected, because the results suggested that smaller companies are more associated with higher annual values of contracts, in contrast with the theoretical expectation that economies of scale were important in the industry. Three variables were not significant in the 2010 model: “% of employees with higher education”, “average study time” and “firm age”.
If the use of government purchasing power has been reaffirmed consistently as an instrument of development policies of the country, it is timely to discuss the possibilities and limitations, especially in the case of defense materials, whose acquisition will not only induce related supply chains but also contribute to the endogenous development of relevant technologies to national defense. The analysis undertaken here indicates that, a priori, selected suppliers have distinctive resources and competencies.
Despite these positive indications, it is necessary to address some topics. The consolidation, maintenance and development of a defense industrial base do not depend only of procurement policies, although these are essential. The empirical results of this study are limited to broadly investigating characteristics of hired firms. We did not discuss here if the government demand addressed to firms in the industry is enough to keep them in operation or even dedicated to the defense sector. Besides, it is possible
47
Discussion Paper195 (1878a)
The Defense Industry in Brazil: characteristics and involvement of supplier firms
that there are firms with technological potential to become defense suppliers that have not been reached by MD contracts in the period, what similarly was not addressed in this paper.
The export potential of domestic firms depends on the acquisition by Brazilian’s armed forces, of the products developed and manufactured inwards, so that domestic demand is also essential for the foreign insertion of firms. Specialized forecasts emphasize that Brazil will be one of the largest defense contractors in the market in the coming years in absolute terms, but there is still no definition of what that budget will be spent in the national market and how much will be spent with foreign suppliers. Thus, the issue of demand, which is a central limitation to the development of the DIB, should remain under observation.
Indeed, the acquisition of defense goods and services overseas is still part of the Brazilian reality, though public policies express the ambition of national autonomy in the industry. The use of offsets agreements has been increasingly incorporated in foreign contracts. Under the title of “offset”, measures may include coproduction, licensed production, subcontractor production, foreign investment in the country and technology transfer. Especially in the case of technology transfer, however, the effectiveness of these measures is limited by the potential of domestic research centers and firms to absorb the technology to be transferred.
Thus, defense procurement alone will not be able to let Brazil achieve its objectives in the sector, so that it is essential that there are sufficient resources to R&D not only for the development of endogenous technologies but also to facilitate the absorption in external acquisitions. Brazil is expected to be in the 19th position in absolute terms of military spending in R&D until 2016. In relative terms, it is expected that in the next four years Brazil devotes 11.7% of its military budget for domestic or international procurement, and 0.9% in R&D. The average of the 68 countries tracked by Jane’s Defense is 18.1% and 2.4%, respectively.
An additional aspect that deserves some attention in the debate about defense industry is human capital. A competitive DIB is dependent on qualified personnel, so that the requirements for industry also demands educational and training policies.
48
B r a s í l i a , J a n u a r y 2 0 1 5
Here are some avenues for future research that could deepen the understanding of the topic addressed in this paper:
1) Investigate the potential of technology absorption of Brazilian firms in transfer processes arranged by the Ministry of Defence.
2) Conduct new empirical analysis that, departing from the same database used in this work, enables more disaggregated information about the groups of firms that are suppliers of different types of materials, segregating, for example, the supply of consumables such as ammunition and spare parts from major manufacturers of equipment such as tanks and aircraft.
3) Identify companies that have technological skills to become potential suppliers of defense industry.
4) Analyze the extent to which the movement of consolidation of companies in the sector in economic groups contributes to national objectives in relation to the defense industrial base.
REFERENCES
ARAUJO, B. C.; CAVALCANTE, L. R.; ALVES, P. Variáveis proxy para os gastos empresariais em inovação com base no pessoal ocupado técnico-científico disponível na Relação Anual de Informações Sociais (Rais). Radar: tecnologia, produção e comércio exterior, v. 5, p. 16-21, 2009.
ARAÚJO, B. C. et al. Relatório setorial. Determinantes da acumulação de conhecimento para inovação tecnológica nos setores industriais no Brasil: base industrial de defesa. Brasília: ABDI, 2010. Available in: <http://www.abdi.com.br/Estudo/Estudo_Setorial_Inovacao_Defesa.pdf>. Access in: 4 Dec. 2012.
ASLAM, R. Measuring the peace dividend: evidence from developing economies. Defence & peace economics, v. 18, n. 1, p. 39-52, Feb. 2007.
AZULAY, I.; LERNER, M.; TISHLER, A. Converting military technology through corporate entrepreneurship. Research policy, v. 31, n. 3, p. 419-435, Mar. 2002.
BCB – BANCO CENTRAL DO BRASIL. Censo de capitais estrangeiros no Brasil, 2000.
49
Discussion Paper195 (1878a)
The Defense Industry in Brazil: characteristics and involvement of supplier firms
BRASIL. Decreto no 6.703, de 18 de dezembro de 2008. Estratégia nacional de defesa, 2008. Available in: <http://www.defesa.gov.br/projetosweb/estrategia/arquivos/estrategia_defesa_nacional_portugues.pdf>.
CAMPBELL, N. C. G. An interaction approach to organizational buying behavior. Journal of business research, v. 13, n. 1, p. 35-48, Feb. 1985.
CAVALCANTE, L. R.; NEGRI, F. D. A trajetória recente dos indicadores de inovação no Brasil. Brasíla: Ipea, 2011 (Texto para Discussão, n. 1.659). Available in: <http://www.ipea.gov.br/sites/000/2/publicacoes/tds/td_1659.pdf>. Access in: 17 Jan. 2013.
COUSINS, P. D.; SPEKMAN, R. Strategic supply and the management of inter - and intra-organisational relationships. Journal of purchasing and supply management, v. 9, n. 1, p. 19-29, Jan. 2003.
DAS, K. Relationship marketing research (1994-2006): an academic literature review and classification. Marketing intelligence & planning, v. 27, n. 3, p. 326-363, 2009.
DERTOUZOS, J. N.; DARDIA, M. Defense spending, aerospace, and the California economy. Santa Monica, CA: Rand, 1993 (Monograph Reports, n. 179). Available in: <http://www.rand.org/pubs/monograph_reports/MR179.html>. Access in: 9 Nov. 2012.
DUNNE, J. P. Military spending, growth, development and conflict. Defence and peace economics, v. 23, n. 6, p. 549-557, 2012.
GANESAN, S. Determinants of long-term orientation in buyer-seller relationships. Journal of marketing, v. 58, n. 2, p. 1, Apr. 1994.
GANSLER, J. S. Needed: a US defense industrial strategy. International security, v. 12, n. 2, p. 45-62, Fall 1987.
GOLDBERG, V. P. Regulation and administered contracts. The bell journal of economics, v. 7, n. 2, p. 426-448, Autumn 1976.
GRANOVETTER, M. Economic action and social structure: the problem of embeddedness. American journal of sociology, v. 91, p. 481-510, 1985.
GULATI, R. Does familiarity breed trust? The implications of repeated ties for contractual choice in alliances. Academy of management journal, v. 38, n. 1, p. 85-112, Feb. 1995.
GUSSO. Agentes da inovação: quem os forma, quem os emprega? In: DE NEGRI, J. A.; DE NEGRI, F.; COELHO, D. (Org.). Tecnologia, exportação e emprego. Brasília: Ipea, 2006.
HARTLEY, K.; SANDLER, T. Handbook of defence economics – defence in a globalized world. 2007.

50
B r a s í l i a , J a n u a r y 2 0 1 5
HUMPHRIES, A.; WILDING, R. Sustained monopolistic business relationships: A UK defence procurement case. European journal of marketing, v. 38, n. 1-2, p. 99-120, 1 Jan. 2004.
JANE’S DEFENCE SECTOR BUDGETS. [s. l.]: IHS, [s. d.].
LAIOS, L.; XIDEAS, E. An investigation into the structure of the purchasing function of state-controlled enterprises. Journal of business research, v. 29, n. 1, p. 13-21, Jan. 1994.
LINDBERG, T. M. The defense firm goes commercial: a new role for marketing. Industrial marketing management, v. 4, n. 5, p. 235-241, Oct. 1975.
MARKOWSKI, S.; HALL, P. Challenges of defence procurement. Defence and peace economics, v. 9, n. 1-2, p. 3-37, 1998.
MARKUSEN, A. R. Defence spending: a successful industrial policy? International journal of urban & regional research, v. 10, n. 1, p. 105-122, Mar. 1986.
MOLAS-GALLART, J. Defence procurement as an industrial policy tool: the Spanish experience. Defence and peace economics, v. 9, n. 1-2, p. 63-81, 1998.
MORAES, R. F. O mercado internacional de equipamentos militares: negócios e política externa. Brasília: Ipea, 2011 (Texto para Discussão, n. 1.596). Available in: <http://www.ipea.gov.br/portal/index.php?option=com_content&view=article&id=9768>. Access in: 17 Jan. 2013.
______. A inserção externa da indústria brasileira de defesa: 1975-2010. Brasília: Ipea, 2012a (Texto para Discussão, n. 1.715). Available in: <http://www.ipea.gov.br/portal/images/stories/PDFs/TDs/td_1715.pdf>. Access in: 17 Jan. 2013.
______. Operações de paz e comércio de armas: governança e desgovernança internacional na gestão de conflitos. In: KENKEL, K. M.; MORAES, R. F. O Brasil e as operações de paz em um mundo globalizado: entre a tradição e a inovação. Brasília: Ipea, 2012b.
PARKINSON, S. T. Factors influencing buyer-seller relationships in the market for high-technology products. Journal of business research, v. 13, n. 1, p. 49-60, Feb. 1985.
ROGERSON, W. P. Economic incentives and the defense procurement process. The journal of economic perspectives, v. 8, n. 4, p. 65-90, Oct. 1994.
SCHMIDT, F. H. Ciência, tecnologia e inovação em defesa: notas sobre o caso do Brasil. Radar: tecnologia, produção e comércio exterior, n. 24, 2013.
SCHMIDT, F. H.; MORAES, R. F.; ASSIS, L. R. S. A dinâmica recente do setor de defesa no Brasil: notas sobre o comportamento da demanda e o perfil das firmas contratadas. Radar: tecnologia, produção e comércio exterior, n. 19, May 2012.
51
Discussion Paper195 (1878a)
The Defense Industry in Brazil: characteristics and involvement of supplier firms
SILVA FILHO, E. B.; MORAES, R. F. Dos “dividendos da paz” à guerra contra o terror: gastos militares mundiais nas duas décadas após o fim da Guerra Fria – 1991-2009. Rio de Janeiro: Ipea, 2012 (Texto para Discussão). Available in: <http://ideas.repec.org/p/ipe/ipetds/1754.html>. Access in: 26 Nov. 2012
SMITH, R. P. Defence procurement and industrial structure in the U.K. International journal of industrial organization, v. 8, n. 2, p. 185-205, June 1990.
APPENDIX
Summary of statistics of defense suppliers, by group of material1
Source: ComprasNet, Rais/MTE and Secex/ MDIC
Note: 1 In this Appendix, for each group of material are considered companies that were defense suppliers at least once between 2001 and 2010. The table has repeated firms between groups, because companies have provided materials for more than one group.

52
B r a s í l i a , J a n u a r y 2 0 1 5
APP
END
IX
Sum
mar
y of
sta
tistic
s o
f def
ense
sup
plie
rs, b
y gr
oup
of m
ater
ial1
Gro
up o
f mat
eria
lN
umbe
r of
firm
sM
issin
g ra
is
Num
ber o
f m
anuf
actu
ring
firm
s
Num
ber
of n
on-
man
ufac
turin
g fir
ms
Num
ber o
f em
ploy
ees
2010
Tech
nica
l -s
cient
ific
empl
oyee
s 20
10
%
POTE
C
Num
ber o
f em
ploy
ees
with
hig
her
educ
atio
n
%
Empl
oyee
s w
ith h
ighe
r ed
ucat
ion
Tota
l sal
arie
s 20
10
Ave
rage
sa
lary
201
0 E
xpor
ting
firm
s 20
10%
Ex
porte
rs
Impo
rting
fir
ms
2010
%
Impo
rters
Engi
ne a
cces
sorie
s30
40
261.
000
40,
424
124
,120
.928
.439
,62
1.02
3,50
13,
33
10,0
Airc
raft
and
its s
truct
ural
co
mpo
nent
s13
44
516
.141
3.04
718
,96.
459
40,0
1.13
2.58
3.60
1,26
3.09
8,30
538
,56
46,2
Equi
pmen
t and
acc
esso
ries
for t
rain
ing
5515
1228
8.57
410
61,
21.
085
12,7
183.
038.
267,
8599
1,62
59,
17
12,7
Wea
pons
170
3027
113
13.6
4614
91,
12.
034
14,9
295.
989.
551,
1598
6,36
127,
120
11,8
Com
pone
nts
of e
lect
rical
&
elec
troni
c eq
uipm
ent
140
234
113
12.5
4112
51,
02.
072
16,5
240.
330.
509,
0397
4,04
10,
712
8,6
Airc
raft
com
pone
nts
and
acce
ssor
ies
50
05
190
00,
233
17,5
3.75
8.70
0,59
858,
040
0,0
120
,0
Equi
pmen
t for
fire
figh
ting,
re
scue
and
saf
ety
997
154
8675
723
.899
281
1,2
4.22
817
,745
6.26
6.42
4,85
953,
9526
2,6
787,
8
Com
mun
icatio
ns d
etec
tion
and
cohe
rent
radi
atio
n eq
uipm
ent
200
4212
146
3.52
638
610
,91.
484
42,1
114.
403.
421,
631.
204,
413
1,5
3115
,5
Equi
pmen
t fo
r lan
ding
and
op
erat
ion
of a
ircra
ft12
40
859
711
1,8
269
45,1
26.9
75.8
16,4
91.
280,
631
8,3
18,
3
Equi
pmen
t for
shi
ps a
nd
boat
s26
81
1735
91
0,3
4713
,24.
235.
462,
0180
2,68
00,
00
0,0
Equi
pmen
t for
mai
nten
ance
an
d re
pairs
938
085
4.78
621
0,4
744
15,6
83.9
67.2
11,3
790
5,02
11,
17
7,5
Stru
ctur
es a
nd p
refa
brica
ted
scaf
fold
ing
538
837
636
40,
741
6,5
6.84
6.62
6,33
874,
630
0,0
11,
9
Ove
ns, c
entra
l ste
amer
s an
d dr
ying
equi
pmen
t, nu
clear
re
acto
rs3
00
317
-0,
01
5,5
134.
053,
2167
6,73
00,
00
0,0
Tool
s an
d eq
uipm
ent f
or
labo
rato
ry19
31
1562
411
1,8
201
32,2
20.3
49.1
34,9
21.
373,
331
5,3
15,
3
Gro
up o
f mat
eria
lN
umbe
r of
firm
sM
issin
g ra
is
Num
ber o
f m
anuf
actu
ring
firm
s
Num
ber
of n
on-
man
ufac
turin
g fir
ms
Num
ber o
f em
ploy
ees
2010
Tech
nica
l -s
cient
ific
empl
oyee
s 20
10
%
Pote
c
Num
ber o
f em
ploy
ees
with
hig
her
educ
atio
n
%
Em
ploy
ees
with
hig
her
educ
atio
n
Tota
l sal
arie
s 20
10
Ave
rage
sa
lary
201
0 Ex
porti
ng
firm
s 20
10%
Ex
porte
rs
Impo
rting
fir
ms
2010
%
Impo
rters
(Con
tinue
s)

53
Discussion Paper195 (1878a)
The Defense Industry in Brazil: characteristics and involvement of supplier firms
Gro
up o
f mat
eria
lN
umbe
r of
firm
sM
issin
g ra
is
Num
ber o
f m
anuf
actu
ring
firm
s
Num
ber
of n
on-
man
ufac
turin
g fir
ms
Num
ber o
f em
ploy
ees
2010
Tech
nica
l -s
cient
ific
empl
oyee
s 20
10
%
POTE
C
Num
ber o
f em
ploy
ees
with
hig
her
educ
atio
n
%
Empl
oyee
s w
ith h
ighe
r ed
ucat
ion
Tota
l sal
arie
s 20
10
Ave
rage
sa
lary
201
0 E
xpor
ting
firm
s 20
10%
Ex
porte
rs
Impo
rting
fir
ms
2010
%
Impo
rters
Nuc
lear
wea
pons
mat
eria
l4
01
358
11,
71
2,0
475.
306,
7585
5,54
00,
00
0,0
Engi
nes,
turb
ines
and
co
mpo
nent
s2
01
128
475
26,3
142
50,1
17.6
88.4
90,2
03.
410,
712
100,
02
100,
0
Amm
uniti
on a
nd e
xplo
sives
407
924
8.40
212
91,
51.
490
17,7
223.
136.
528,
601.
309,
639
22,5
922
,5
Ship
s, sm
all b
oats
, pie
rs a
nd
float
ing
dyke
s29
75
1724
9-
0,0
145,
73.
052.
863,
7985
9,23
13,
42
6,9
Alar
m ,
signa
l det
ectio
n an
d sa
fety
sys
tem
s25
539
2019
63.
616
104
2,9
594
16,4
63.4
00.7
43,9
81.
009,
954
1,6
239,
0
Fabr
ics, l
eath
er, s
kins
, ten
ts
and
flags
355
426
3.40
19
0,3
399
11,7
45.7
12.7
21,2
797
9,16
411
,45
14,3
Clot
hing
, in
divi
dual
eq
uipm
ent a
nd in
signi
a11
23
624
21
0,4
239,
34.
277.
989,
541.
166,
351
9,1
327
,3
Sour
ce: C
ompr
asN
et, R
ais/
MTE
and
Sec
ex/ M
DIC
Obs
.: In
this
Appe
ndix
, for
eac
h gr
oup
of m
ater
ial a
re c
onsid
ered
com
pani
es th
at w
ere
defe
nse
supp
liers
at l
east
onc
e be
twee
n 20
01 a
nd 2
010.
The
tabl
e ha
s re
peat
ed fi
rms
betw
een
grou
ps, b
ecau
se c
ompa
nies
hav
e pr
ovid
ed m
ater
ials
for m
ore
than
on
e gr
oup.
(Con
tinua
tion)
Ipea – Institute for Applied Economic Research
PUBLISHING DEPARTMENT
CoordinationCláudio Passos de Oliveira
SupervisionEverson da Silva MouraReginaldo da Silva Domingos
TypesettingBernar José VieiraCristiano Ferreira de AraújoDaniella Silva NogueiraDanilo Leite de Macedo TavaresDiego André Souza SantosJeovah Herculano Szervinsk JuniorLeonardo Hideki Higa
Cover designLuís Cláudio Cardoso da Silva
Graphic designRenato Rodrigues Buenos
The manuscripts in languages other than Portuguese published herein have not been proofread.
Ipea Bookstore
SBS – Quadra 1 − Bloco J − Ed. BNDES, Térreo 70076-900 − Brasília – DFBrazilTel.: + 55 (61) 3315 5336E-mail: [email protected]


Composed in Adobe Garamond 11/13.2 (text)Frutiger 47 (headings, graphs and tables)
Brasília – DF – Brazil

Ipea’s missionEnhance public policies that are essential to Brazilian development by producing and disseminating knowledge and by advising the state in its strategic decisions.