the darpin difference - investor relations – molecular...
TRANSCRIPT

The DARPin®
Difference Offering Patients a New Dimension of Protein Therapeutics Patrick Amstutz, CEO Andreas Emmenegger, CFO
Presentation of the H1 2017 Financial Results
August 30, 2017 – Molecular Partners AG

©Molecular Partners – August 30, 2017- Page 2
192 0 0
253 80 3
254 142 92
254 181 148
3 6
87
40 40
122
61 61
185
183 183 231
114 154
0
167 226
0
205 255 63
229 255 155
127 127 127
166 166 166
191 191 191
217 217 217
• Introduction, Review H1 2017 Patrick Amstutz, CEO
& Highlights
• Financial Results H1 2017 Andreas Emmenegger, CFO
• Outlook 2017 Patrick Amstutz, CEO
• Q&A
Agenda

©Molecular Partners – August 30, 2017- Page 3
192 0 0
253 80 3
254 142 92
254 181 148
3 6
87
40 40
122
61 61
185
183 183 231
114 154
0
167 226
0
205 255 63
229 255 155
127 127 127
166 166 166
191 191 191
217 217 217
Review H1 2017

©Molecular Partners – August 30, 2017- Page 4
192 0 0
253 80 3
254 142 92
254 181 148
3 6
87
40 40
122
61 61
185
183 183 231
114 154
0
167 226
0
205 255 63
229 255 155
127 127 127
166 166 166
191 191 191
217 217 217
Research & Development Highlights H1 2017
• H1 2017 – Abicipar advances; MP0250 first oncology DARPin® in phase 2
• Abicipar: Allergan completed patient recruitment in both wet AMD phase 3 studies; four months ahead of schedule
• MP0250: First patients dosed in phase 2 Multiple Myeloma study; Trial in progress poster to be presented at ESMO Madrid in September 2017
• MP0250: IND submitted to FDA for MP0250 in EGFR-mutated Non-Small Cell Lung Cancer (EGFR mut NSCLC) in August 2017
• MP0250: Phase 1 recruitment completed with 45 patients in the trial
• MP0274: Full country approvals received in CH, UK for phase 1 trial; first patient expected for September 2017
• Immuno-oncology: Further data on proprietary immuno-oncology programs presented at EACR in Florence indicating tumor-restricted mode of action
©Molecular Partners – August 30, 2017- Page 5
192 0 0
253 80 3
254 142 92
254 181 148
3 6
87
40 40
122
61 61
185
183 183 231
114 154
0
167 226
0
205 255 63
229 255 155
127 127 127
166 166 166
191 191 191
217 217 217
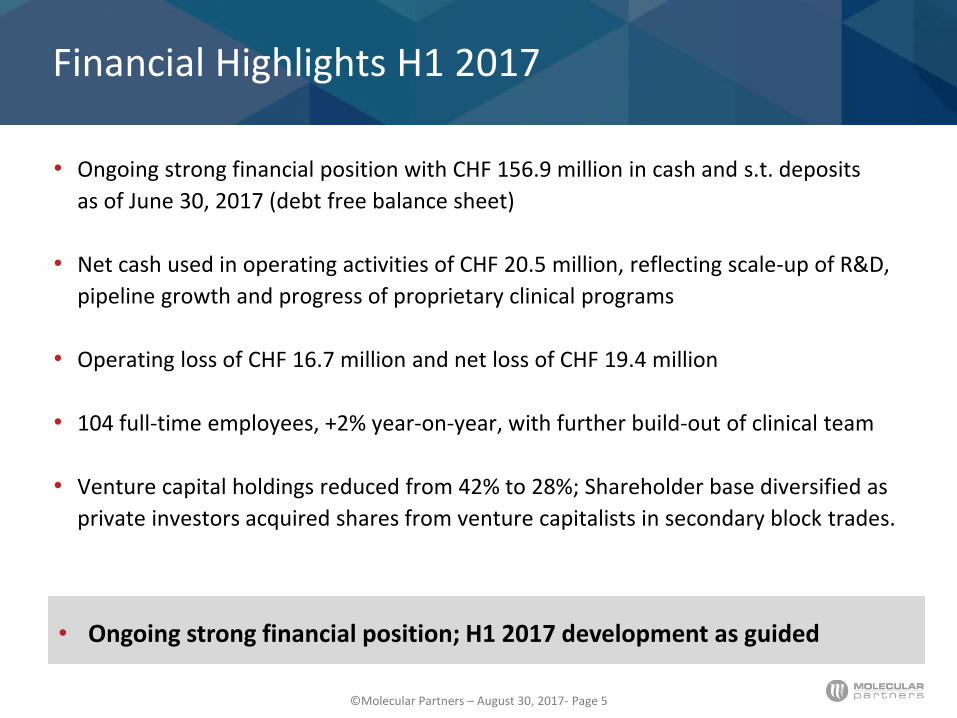
• Ongoing strong financial position with CHF 156.9 million in cash and s.t. deposits
as of June 30, 2017 (debt free balance sheet)
• Net cash used in operating activities of CHF 20.5 million, reflecting scale-up of R&D,
pipeline growth and progress of proprietary clinical programs
• Operating loss of CHF 16.7 million and net loss of CHF 19.4 million
• 104 full-time employees, +2% year-on-year, with further build-out of clinical team
• Venture capital holdings reduced from 42% to 28%; Shareholder base diversified as
private investors acquired shares from venture capitalists in secondary block trades.
Financial Highlights H1 2017
• Ongoing strong financial position; H1 2017 development as guided

©Molecular Partners – August 30, 2017- Page 6
192 0 0
253 80 3
254 142 92
254 181 148
3 6
87
40 40
122
61 61
185
183 183 231
114 154
0
167 226
0
205 255 63
229 255 155
127 127 127
166 166 166
191 191 191
217 217 217
Our strategy: Differentiated DARPin® products with high patient value
The DARPin® Difference – Real Benefit to the Patient
Expected Patient Benefit DARPin® Differentiation Status
Restore activity of SOC when cancer becomes resistant
MP0250: Blocking two escape pathways Ph2
For patients not profiting from SOC antibodies with ADCC
MP0274: Molecular handcuff forcing HER2+ cancer cells into apoptosis
Ph1
Opening a new therapeutic window for combinations
I/O DARPin® proteins: Tumor- restricted activity, …
Preclin
Non-inferiority to SOC with less frequent ocular injections
Abicipar: Long-acting VEGF inhibitor Ph3

©Molecular Partners – August 30, 2017- Page 7
192 0 0
253 80 3
254 142 92
254 181 148
3 6
87
40 40
122
61 61
185
183 183 231
114 154
0
167 226
0
205 255 63
229 255 155
127 127 127
166 166 166
191 191 191
217 217 217
Abicipar: Most Advanced DARPin® Therapy
Wet age-related macular degeneration (wet AMD)
Diabetic macular edema (DME)
Long-acting PEGylated mono-DARPin® protein blocking VEGF
Potentially transformative therapy with less frequent ocular injections compared
with standard of care
Phase 2 data suggest quarterly dosing and comparable efficacy to Lucentis
Drug Safety Monitoring Committee (DSMC): no changes recommended
Wet AMD Phase 3 read out: 1yr data in 2018
Allergan plans to start DME Phase 3 in 2018
Global license agreement with Allergan - all development costs borne by Allergan
Up to $360mn open milestones & low double-digit to mid-teen tiered royalties
Abicipar
USD 8 bn annual sales (2016) and growing (wAMD and DME)
SOC: Eylea and Lucentis: bi-monthly or monthly injections

©Molecular Partners – August 30, 2017- Page 8
192 0 0
253 80 3
254 142 92
254 181 148
3 6
87
40 40
122
61 61
185
183 183 231
114 154
0
167 226
0
205 255 63
229 255 155
127 127 127
166 166 166
191 191 191
217 217 217
MP0250 Blocks Tumor Escape
SOC Alone
HGF
VEGF
HGF
VEGF
MP0250
SOC + MP0250
TUMOR
PATHWAYS
HGF
VEGF
Untreated
MP0250

©Molecular Partners – August 30, 2017- Page 9
192 0 0
253 80 3
254 142 92
254 181 148
3 6
87
40 40
122
61 61
185
183 183 231
114 154
0
167 226
0
205 255 63
229 255 155
127 127 127
166 166 166
191 191 191
217 217 217
MP0250: A Strong Combination (anti-VEGF & HGF)
Multiple Myeloma (MM)
EGFR mutated Non-Small Cell Lung Cancer (NSCLC)
Potential in additional indications
First bi-specific biologic targeting VEGF and HGF
MP0250 attacks tumor on several levels
Directly inhibits tumor growth & survival
Induces unfavorable tumor microenvironment
Inhibits tumor escape from treatment (& metastasis)
Can be combined with standard therapy
Multiple Myeloma: Phase 2 initial safety data Q4 17, Efficacy data read out 2018
EGFR mut NSCLC: Phase 2 safety data 2018, Efficacy data read out 2019
Fully owned by Molecular Partners
MP0250

©Molecular Partners – August 30, 2017- Page 10
192 0 0
253 80 3
254 142 92
254 181 148
3 6
87
40 40
122
61 61
185
183 183 231
114 154
0
167 226
0
205 255 63
229 255 155
127 127 127
166 166 166
191 191 191
217 217 217
0 10 20 30 40 50 60
Cohort 2 1.5 mg
Cohort 3 4 mg/kg
MP0250: Signs of Efficacy in Ph1 (45 patients) Treatment Duration in weeks (Data cutoff: August 2017)
Cohort 1 0.5 mg/kg
Cohort 4
8 mg/kg
Cohort 5
12 mg/kg
-> 8mg/kg
Cohort 6
8 mg/kg 1h
Cohort 7
12 mg/kg
q3w 1h
Treatment ongoing
Do
se c
oh
ort
s (
mg
/kg
)
0.5
4.0
1.5
8.0
12/8
8.0
Exp.
12
Q3w
1h inf
0 10 20 30 40 50 60 weeks
• Efficacy
Significant reductions in tumor volume in 2
patients with 1 confirmed PR
Seven patients demonstrated prolonged stable
disease at week 22
Treatment duration was ≥ 3 months in 17 patients
(42 %) and ≥ 6 months in 4 patients (10 %)
Tolerability & Systemic Data
MTD: (8 mg/kg/q2w) (12mg/kg/q3w)
Main AEs consistent with VEGF inhibition
– Hypertension (66%), Proteinuria (29%),
Half-life: 12 days
No clearing or neutralizing ADA (0/24 patients)

©Molecular Partners – August 30, 2017- Page 11
192 0 0
253 80 3
254 142 92
254 181 148
3 6
87
40 40
122
61 61
185
183 183 231
114 154
0
167 226
0
205 255 63
229 255 155
127 127 127
166 166 166
191 191 191
217 217 217
Preclinical Rationale for NSCLC and MM MP0250
Lung Cancer Model
0 5 1 0 1 5 2 0 2 5
0
1 0 0 0
2 0 0 0
3 0 0 0
Tu
mo
r V
olu
me (
mm
3)
Treatment (Days)
Erlotinib
MP0250 + Erlotinib
MP0250
Vehicle
Vehicle MP0250 +
Bortezomib
Muscle
invasion
Bone
morphology
Multiple Myeloma Model
Tumor Growth LU6472 (NSCLC PDX)
Tumor Growth H929 Xenograft
©Molecular Partners – August 30, 2017- Page 12
192 0 0
253 80 3
254 142 92
254 181 148
3 6
87
40 40
122
61 61
185
183 183 231
114 154
0
167 226
0
205 255 63
229 255 155
127 127 127
166 166 166
191 191 191
217 217 217
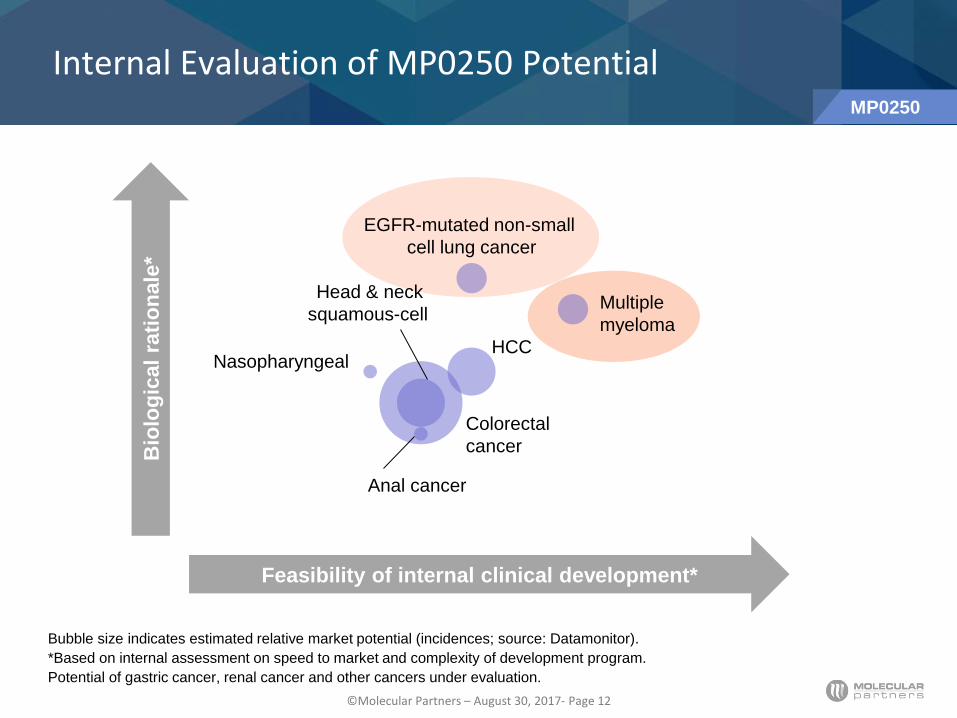
Internal Evaluation of MP0250 Potential
Nasopharyngeal
Head & neck
squamous-cell
EGFR-mutated non-small
cell lung cancer
Multiple
myeloma
HCC
Colorectal
cancer
Anal cancer
Bio
log
ical
rati
on
ale
*
Feasibility of internal clinical development*
Bubble size indicates estimated relative market potential (incidences; source: Datamonitor).
*Based on internal assessment on speed to market and complexity of development program.
Potential of gastric cancer, renal cancer and other cancers under evaluation.
MP0250

©Molecular Partners – August 30, 2017- Page 13
192 0 0
253 80 3
254 142 92
254 181 148
3 6
87
40 40
122
61 61
185
183 183 231
114 154
0
167 226
0
205 255 63
229 255 155
127 127 127
166 166 166
191 191 191
217 217 217
MP0274: Killing HER2+ Cells With New Mode of Action
HER2 expressing tumors
Binds to HER2 and induces apoptosis by strong inhibition of HER2 and
HER3-mediated signalling
Can directly kill Her2 positive cancer cells without the need for ADCC (Herceptin
& Perjeta)
New MoA may help patients who do not adequately respond to current therapies
Phase 1: first patient expected for Sep 2017 with initial phase 1 data in 2018
Fully owned by Molecular Partners
MP0274
©Molecular Partners – August 30, 2017- Page 14
192 0 0
253 80 3
254 142 92
254 181 148
3 6
87
40 40
122
61 61
185
183 183 231
114 154
0
167 226
0
205 255 63
229 255 155
127 127 127
166 166 166
191 191 191
217 217 217
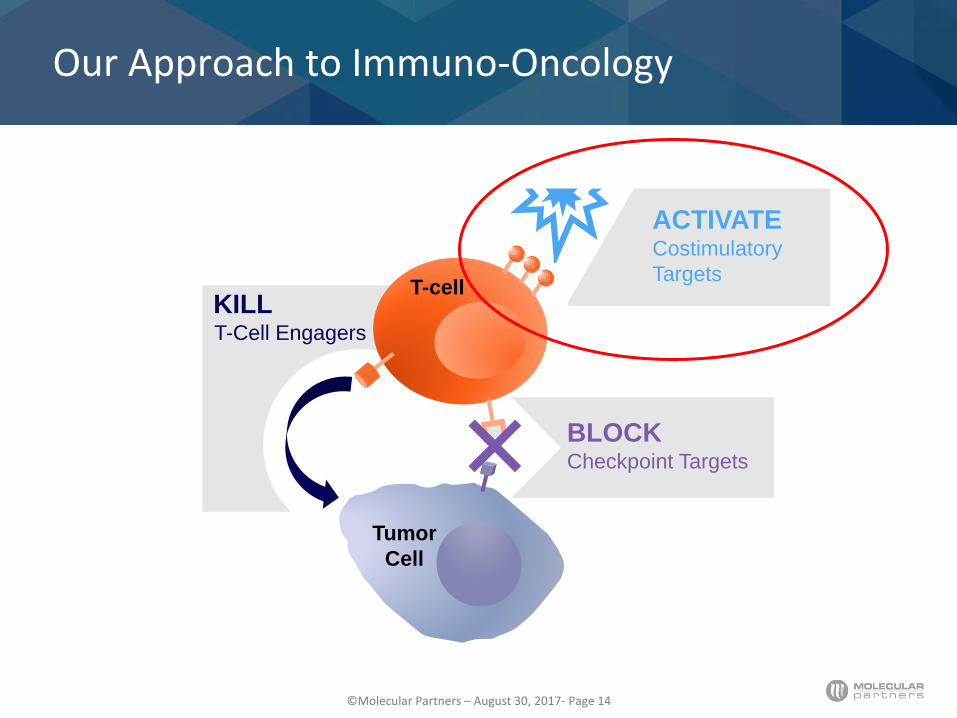
Our Approach to Immuno-Oncology
Tumor
Cell
T-cell
ACTIVATE Costimulatory
Targets
KILL T-Cell Engagers
BLOCK Checkpoint Targets

©Molecular Partners – August 30, 2017- Page 15
192 0 0
253 80 3
254 142 92
254 181 148
3 6
87
40 40
122
61 61
185
183 183 231
114 154
0
167 226
0
205 255 63
229 255 155
127 127 127
166 166 166
191 191 191
217 217 217
How do «Tumor-Restricted Agonist» Work
IN CIRCULATION (SYSTEMIC) IN THE TUMOR
T-cell target T-cell Cell
Activated
Tumor Cell
Activated
T-cell
Cell Tumor Cell
T-cell
Activated
Tumor Stroma
NO CLUSTERING = NO EFFECT CLUSTERING = ACTIVATION OF T-CELL
Tumor target in
a local cluster

©Molecular Partners – August 30, 2017- Page 16
192 0 0
253 80 3
254 142 92
254 181 148
3 6
87
40 40
122
61 61
185
183 183 231
114 154
0
167 226
0
205 255 63
229 255 155
127 127 127
166 166 166
191 191 191
217 217 217
Cell-based POC of DAPRin® Tumor Restricted Agonists
OX40 4-1BB1
OFF
Wit
ho
ut
clu
ste
rin
g
Wit
h c
luste
rin
g
OFF
ON
1 EACR 2017, Florence, demonstrating use of multi-specific DARPin® molecules in immuno-oncology for tumor restricted T-cell activation

©Molecular Partners – August 30, 2017- Page 17
192 0 0
253 80 3
254 142 92
254 181 148
3 6
87
40 40
122
61 61
185
183 183 231
114 154
0
167 226
0
205 255 63
229 255 155
127 127 127
166 166 166
191 191 191
217 217 217
Financial Results H1 2017

©Molecular Partners – August 30, 2017- Page 18
192 0 0
253 80 3
254 142 92
254 181 148
3 6
87
40 40
122
61 61
185
183 183 231
114 154
0
167 226
0
205 255 63
229 255 155
127 127 127
166 166 166
191 191 191
217 217 217
(CHF million; as per IFRS) H1 2017 H1 2016 change
Revenues 6.0 13.5 (7.5)
Total expenses1 (22.7) (22.0) (0.7)
Operating loss - EBIT (16.7) (8.5) (8.2)
Net finance expenses (2.7) (1.2) (1.5)
Net loss (19.4) (9.7) (9.7)
Net cash used in operations (20.5) (17.5) (3.0)
Cash balance 156.92 196.32 (39.4)
Financial Summary
1 Thereof non-cash costs of CHF 2.6 million in H1 2017 and CHF 2.5 million in H1 2016 2 Including CHF 38.3 million short-term time deposits (H1 2016: CHF 19.6 million)

©Molecular Partners – August 30, 2017- Page 19
192 0 0
253 80 3
254 142 92
254 181 148
3 6
87
40 40
122
61 61
185
183 183 231
114 154
0
167 226
0
205 255 63
229 255 155
127 127 127
166 166 166
191 191 191
217 217 217
EBIT De-composition
6.0
(16.1) (16.7)
(18.4)
(3.7) (0.6)
Revenues R&D expenses G&A expenses EBITDA D&A EBIT
EBIT de-composition per function (CHF million)

©Molecular Partners – August 30, 2017- Page 20
192 0 0
253 80 3
254 142 92
254 181 148
3 6
87
40 40
122
61 61
185
183 183 231
114 154
0
167 226
0
205 255 63
229 255 155
127 127 127
166 166 166
191 191 191
217 217 217
Assets Shareholders' equity& liabilities
• Strong balance sheet maintained
• CHF 156.9 million cash balance
(incl. s.t. deposits): 98% of total assets
• Solid equity base with CHF 118.3 million
• Debt free
• CHF 32.0 million deferred revenues to be
recognized as revenues in coming periods
Balance Sheet
Comments Balance sheet as of June 30, 2017 (CHF million)
Cash balance 156.9
Shareholders' equity 118.3
Other liabilities 10.7
Deferred revenues 32.0
161.0 Other assets 5.6
Other assets 4.1
161.0
©Molecular Partners – August 30, 2017- Page 21
192 0 0
253 80 3
254 142 92
254 181 148
3 6
87
40 40
122
61 61
185
183 183 231
114 154
0
167 226
0
205 255 63
229 255 155
127 127 127
166 166 166
191 191 191
217 217 217
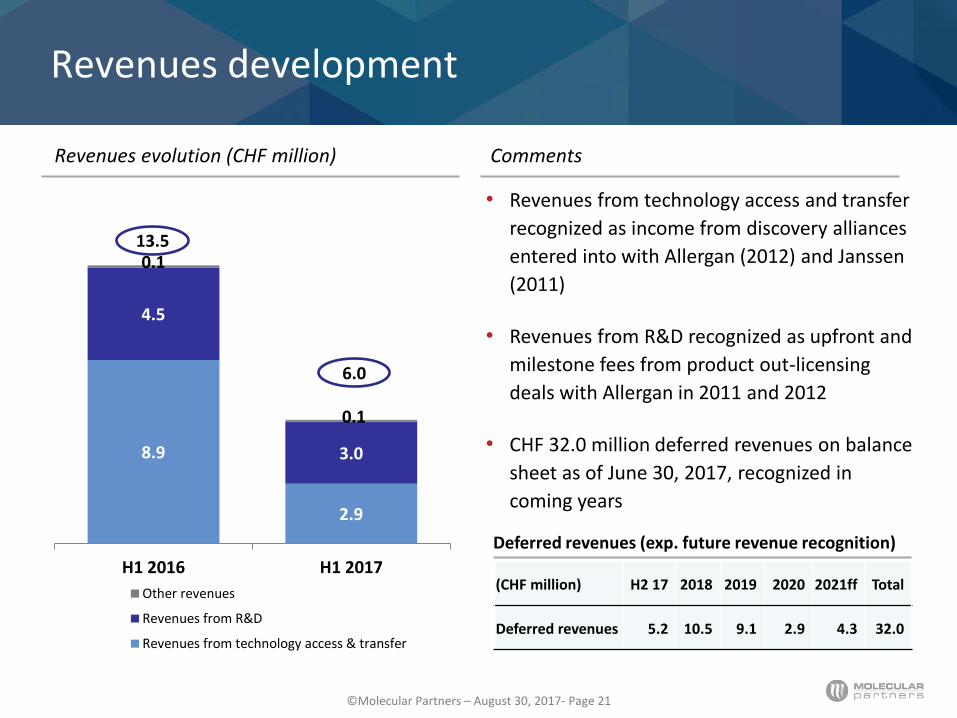
8.9
2.9
4.5
3.0
0.1
0.1
H1 2016 H1 2017
Other revenues
Revenues from R&D
Revenues from technology access & transfer
Revenues development
Revenues evolution (CHF million)
13.5
6.0
• Revenues from technology access and transfer
recognized as income from discovery alliances
entered into with Allergan (2012) and Janssen
(2011)
• Revenues from R&D recognized as upfront and
milestone fees from product out-licensing
deals with Allergan in 2011 and 2012
• CHF 32.0 million deferred revenues on balance
sheet as of June 30, 2017, recognized in
coming years
Deferred revenues (exp. future revenue recognition)
(CHF million) H2 17 2018 2019 2020 2021ff Total
Deferred revenues 5.2 10.5 9.1 2.9 4.3 32.0
Comments
©Molecular Partners – August 30, 2017- Page 22
192 0 0
253 80 3
254 142 92
254 181 148
3 6
87
40 40
122
61 61
185
183 183 231
114 154
0
167 226
0
205 255 63
229 255 155
127 127 127
166 166 166
191 191 191
217 217 217
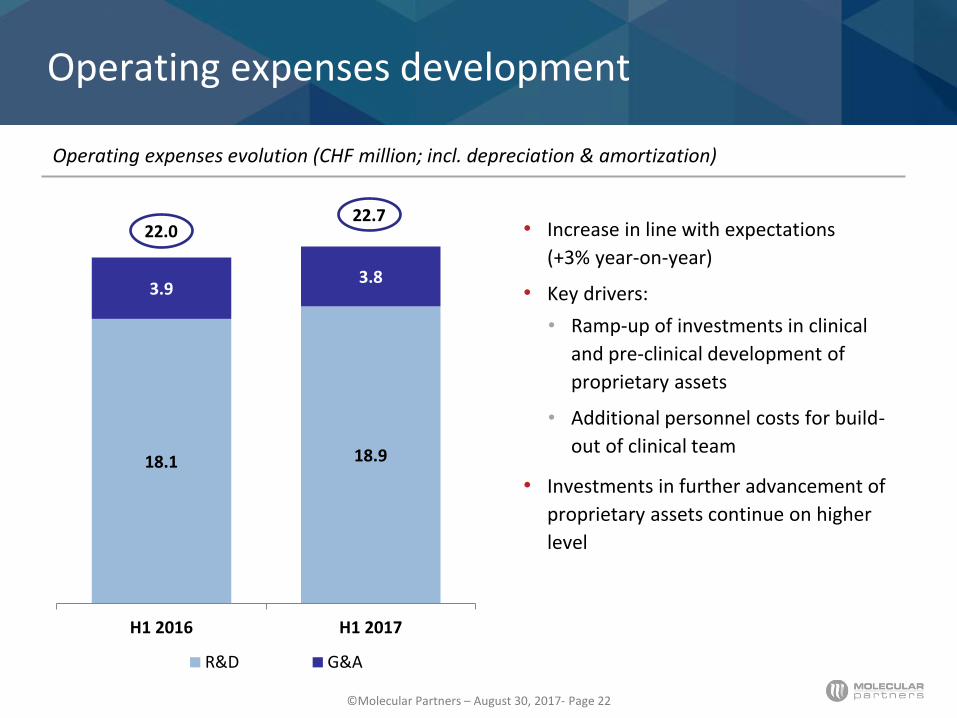
Operating expenses development
18.1 18.9
3.9 3.8
H1 2016 H1 2017
R&D G&A
Operating expenses evolution (CHF million; incl. depreciation & amortization)
22.7 22.0 • Increase in line with expectations
(+3% year-on-year)
• Key drivers:
• Ramp-up of investments in clinical
and pre-clinical development of
proprietary assets
• Additional personnel costs for build-
out of clinical team
• Investments in further advancement of
proprietary assets continue on higher
level

©Molecular Partners – August 30, 2017- Page 23
192 0 0
253 80 3
254 142 92
254 181 148
3 6
87
40 40
122
61 61
185
183 183 231
114 154
0
167 226
0
205 255 63
229 255 155
127 127 127
166 166 166
191 191 191
217 217 217
Shareholder Structure
• Listed on SIX Swiss Exchange (ticker symbol: MOLN)
• Included in key indices: SPI, SPI Extra,
SXI Life Sciences and SXI Bio+Medtech
• 20,794,606 shares outstanding
• CHF 610 million market cap. as of June 30, 2017
• No lock-up restrictions in place
• Formal free float as per SIX definition: 74%
Shareholder structure as of June 30, 2017 Highlights
26%
21%
53%
Pre-IPO investors (5 VC's)
Management, Board, Founders
Others
©Molecular Partners – August 30, 2017- Page 24
192 0 0
253 80 3
254 142 92
254 181 148
3 6
87
40 40
122
61 61
185
183 183 231
114 154
0
167 226
0
205 255 63
229 255 155
127 127 127
166 166 166
191 191 191
217 217 217
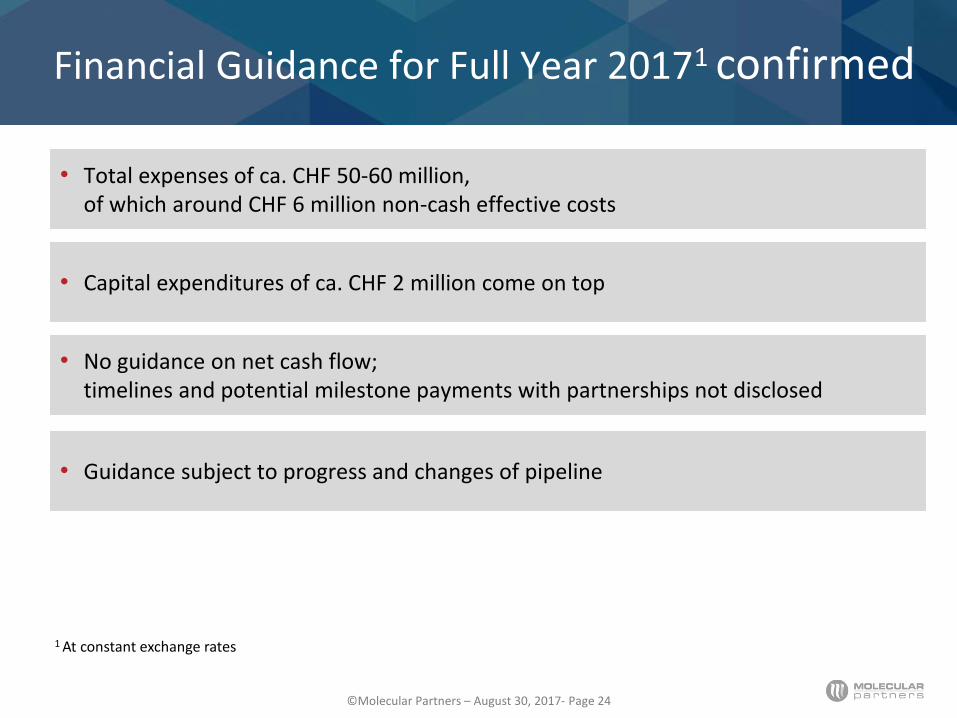
• Total expenses of ca. CHF 50-60 million, of which around CHF 6 million non-cash effective costs
• Capital expenditures of ca. CHF 2 million come on top
• No guidance on net cash flow; timelines and potential milestone payments with partnerships not disclosed
• Guidance subject to progress and changes of pipeline
1 At constant exchange rates
Financial Guidance for Full Year 2017
1 confirmed

©Molecular Partners – August 30, 2017- Page 25
192 0 0
253 80 3
254 142 92
254 181 148
3 6
87
40 40
122
61 61
185
183 183 231
114 154
0
167 226
0
205 255 63
229 255 155
127 127 127
166 166 166
191 191 191
217 217 217
Outlook

©Molecular Partners – August 30, 2017- Page 26
192 0 0
253 80 3
254 142 92
254 181 148
3 6
87
40 40
122
61 61
185
183 183 231
114 154
0
167 226
0
205 255 63
229 255 155
127 127 127
166 166 166
191 191 191
217 217 217
Abicipar**: Wet AMD
Outlook H2 2017 & Beyond
MP0250: Multiple Myeloma
MP0274: Her2 Multi-DARPin®
PD-1/VEGF Multi-DARPin®
Tumor-restricted Agonist
Several Discovery Programs
MP0250: EGFR mut NSCLC
Abicipar**: DME
2017 2018
Full enrollment of Ph3 1-year efficacy data Ph3
Start of Ph3
Initial safety data Ph2* Initial efficacy data Ph2
Initial safety data Ph2
First dosing in Ph1 Initial data Ph1
Preclinical data
*Definition of the safe dose of MP0250 in combination with Velcade allowing transition to the efficacy part of the study
**Abicipar under development and control of Allergan. All costs borne by Allergan.
√

©Molecular Partners – August 30, 2017- Page 27
192 0 0
253 80 3
254 142 92
254 181 148
3 6
87
40 40
122
61 61
185
183 183 231
114 154
0
167 226
0
205 255 63
229 255 155
127 127 127
166 166 166
191 191 191
217 217 217
IR Agenda
Date Event
October 26, 2017 Q3 2017 Management Statement
November 09, 2017 R&D Day in New York
February 08, 2018 Unaudited Financial Results 2017
March 16, 2018 Expected Publication of Annual Report 2017
April 18, 2018 Annual General Meeting for Business Year 2017

©Molecular Partners – August 30, 2017- Page 28
192 0 0
253 80 3
254 142 92
254 181 148
3 6
87
40 40
122
61 61
185
183 183 231
114 154
0
167 226
0
205 255 63
229 255 155
127 127 127
166 166 166
191 191 191
217 217 217
DARPin® Difference: unlock novel modes of action
Proof of Platform in the eye and systemically
Fast and cost effective drug discovery engine
Molecular Partners: Who We Are
Long-term Partnerships
Alliance with Allergan
Swiss listing (MOLN)
Cash CHF157 mn*
Financed well beyond key
value inflection points
Teamwork
Swiss biotech
100 team members
Discovery to phase 2 (POC)
Science & patients first
DARPin® Therapies
High patient value
DARPin® Difference
Abicipar in phase 3 (ophtha)
MP0250 in phase 2 (onco)
MP0274 into phase 1 (onco)
Broad preclin. I/O portfolio
$
*As of H1 17.
I/O, immuno-oncology.
DARPin® Platform

©Molecular Partners – August 30, 2017- Page 29
192 0 0
253 80 3
254 142 92
254 181 148
3 6
87
40 40
122
61 61
185
183 183 231
114 154
0
167 226
0
205 255 63
229 255 155
127 127 127
166 166 166
191 191 191
217 217 217
This presentation is not an offer to sell or a solicitation of offers to purchase or subscribe for shares of Molecular Partners AG, nor shall it or any part of it nor the fact of its distribution form the basis of, or be relied on in connection with, any contract or investment decision. This presentation is not an offering circular within the meaning of Article 652a of the Swiss Code of Obligations, nor is it a listing prospectus as defined in the listing rules of the SIX Swiss Exchange AG or a prospectus under any other applicable laws. Copies of this presentation may not be sent to countries, or distributed in or sent from countries, in which this is barred or prohibited by law. This document is not a prospectus or a prospectus equivalent document and investors should not subscribe for or purchase any securities referred to in this document. This document does not constitute a recommendation regarding the shares.
This presentation contains specific forward-looking statements, beliefs or opinions, including statements with respect to the product pipelines, potential benefits of product candidates and objectives, estimated market sizes and opportunities as well as the milestone potential under existing collaboration agreements, which are based on current beliefs, expectations and projections about future events, e.g. statements including terms like “potential”, “believe”, “assume”, “expect”, “forecast”, “project”, “may”, “could”, “might”, “will” or similar expressions. Such forward-looking statements are subject to known and unknown risks, uncertainties and other factors which may result in a substantial divergence between the actual results, financial situation, development or performance of Molecular Partners AG and investments and those explicitly or implicitly presumed in these statements. There are a number of factors that could cause actual results and developments to differ materially from those expressed or implied by these statements and forecasts. Past performance of Molecular Partners AG cannot be relied on as a guide to future performance. Forward-looking statements speak only as of the date of this presentation and Molecular Partners AG, its directors, officers, employees, agents, counsel and advisers expressly disclaim any obligations or undertaking to release any update of, or revisions to, any forward looking statements in this presentation. No statement in this document or any related materials or given at this presentation is intended as a profit forecast or a profit estimate and no statement in this document or any related materials or given at this presentation should be interpreted to mean that earnings per share for the current or future financial periods would necessarily match or exceed historical published earnings per share. As a result, you are cautioned not to place any undue reliance on such forward-looking statements.
This presentation is intended to provide a general overview of Molecular Partners AG’s business and does not purport to deal with all aspects and details regarding Molecular Partners AG. Accordingly, neither Molecular Partners AG nor any of its directors, officers, employees, agents, counsel or advisers nor any other person makes any representation or warranty, express or implied, as to, and accordingly no reliance should be placed on, the accuracy or completeness of the information contained in the presentation or of the views given or implied. Neither Molecular Partners AG nor any of its directors, officers, employees, agents, counsel or advisers nor any other person shall have any liability whatsoever for any errors or omissions or any loss howsoever arising, directly or indirectly, from any use of this information or its contents or otherwise arising in connection therewith.
The material contained in this presentation reflects current legislation and the business and financial affairs of Molecular Partners AG which are subject to change and audit.
Disclaimer

Thank you
©Molecular Partners – August 30, 2017- Page 31
192 0 0
253 80 3
254 142 92
254 181 148
3 6
87
40 40
122
61 61
185
183 183 231
114 154
0
167 226
0
205 255 63
229 255 155
127 127 127
166 166 166
191 191 191
217 217 217
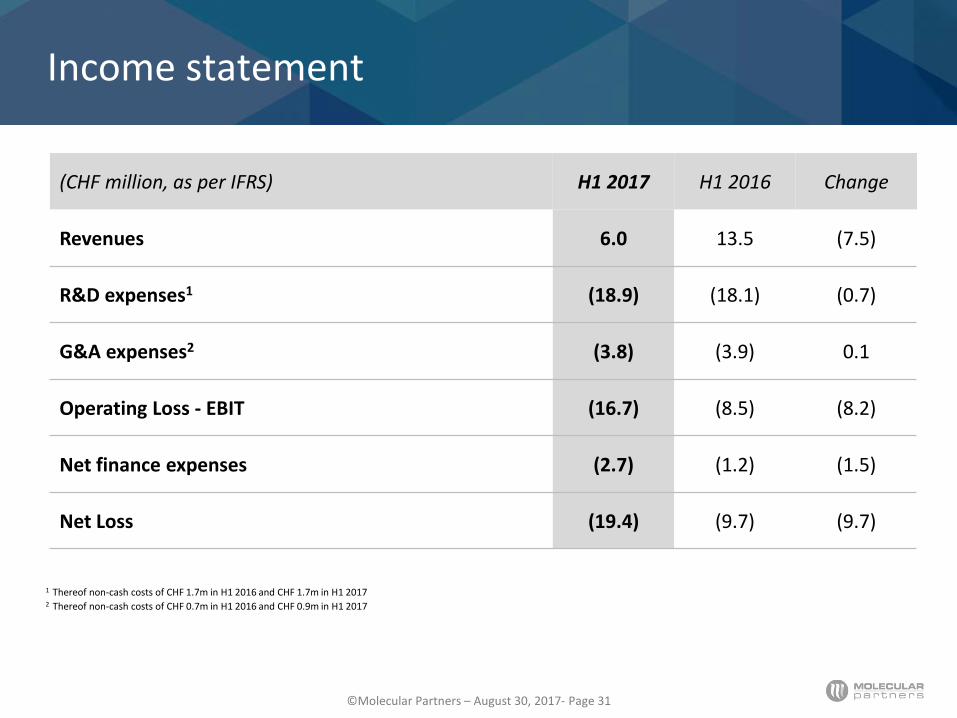
Income statement
1 Thereof non-cash costs of CHF 1.7m in H1 2016 and CHF 1.7m in H1 2017 2 Thereof non-cash costs of CHF 0.7m in H1 2016 and CHF 0.9m in H1 2017
(CHF million, as per IFRS) H1 2017 H1 2016 Change
Revenues 6.0 13.5 (7.5)
R&D expenses1 (18.9) (18.1) (0.7)
G&A expenses2 (3.8) (3.9) 0.1
Operating Loss - EBIT (16.7) (8.5) (8.2)
Net finance expenses (2.7) (1.2) (1.5)
Net Loss (19.4) (9.7) (9.7)

©Molecular Partners – August 30, 2017- Page 32
192 0 0
253 80 3
254 142 92
254 181 148
3 6
87
40 40
122
61 61
185
183 183 231
114 154
0
167 226
0
205 255 63
229 255 155
127 127 127
166 166 166
191 191 191
217 217 217
Cash Flow Statement
(CHF million, as per IFRS) H1 2017 H1 2016 Change
Net cash used in operations (20.5) (17.5) (3.0)
Net cash used in investing (8.1) (0.6) (7.5)
Net cash from financing 0.3 0.3 0.0
Exchange loss on cash positions (2.8) (0.8) (2.0)
Net decrease in cash & cash equivalents (31.1) (18.6) (12.5)

©Molecular Partners – August 30, 2017- Page 33
192 0 0
253 80 3
254 142 92
254 181 148
3 6
87
40 40
122
61 61
185
183 183 231
114 154
0
167 226
0
205 255 63
229 255 155
127 127 127
166 166 166
191 191 191
217 217 217
Balance Sheet
(CHF million, as per IFRS) 30 June
2017 31 Dec 2016
30 June 2016
Non-current assets 2.2 2.5 2.6
Other current assets1 1.9 1.4 1.7
Cash balance (incl. time deposits) 156.9 180.2 196.3
Shareholders’ equity 118.3 135.8 141.4
Non-current liabilities2 27.7 32.5 36.9
Current liabilities3 15.0 15.8 22.3
1 Prepayments and other assets, trade and other receivables
2 Thereof deferred revenues of CHF 21.5m in 1H 2017, CHF 26.8m in FY2016 and CHF 29.7m in 1H 2016 3 Thereof deferred revenues of CHF 10.5m in 1H 2017, CHF 10.5m in FY2016 and CHF 16.4m in 1H 2016

©Molecular Partners – August 30, 2017- Page 34
192 0 0
253 80 3
254 142 92
254 181 148
3 6
87
40 40
122
61 61
185
183 183 231
114 154
0
167 226
0
205 255 63
229 255 155
127 127 127
166 166 166
191 191 191
217 217 217
Molecular Partners AG
Wagistrasse 14
8952 Zürich-Schlieren
Switzerland
www.molecularpartners.com
T +41 755 77 00