the costs and financing of education: trends and policy...
TRANSCRIPT
Education in Developing Asia
Volume 3
The Costs and Financing of Education:
Trends and Policy Implications
Mark Bray
Asian Development BankComparative Education Research Centre
The University of Hong Kong
© 2002 Asian Development Bank
Jointly published by:
Asian Development Bank6 ADB AvenueMandaluyong CityP.O. Box 7890980 ManilaPhilippines
Fax: (632) 636 2444E-mail: [email protected]
and
Comparative Education Research CentreThe University of Hong KongPokfulam RoadHong Kong, China
Fax: (852) 2517 4737E-mail: [email protected]
Obtainable from either address.
Series: Education in Developing AsiaSeries editor: Mark Bray
Layout and index by Sara Wong.
The findings, interpretation, and conclusions expressed in this study are entirelythose of the author and should not be attributed in any manner to the AsianDevelopment Bank or the University of Hong Kong.
A summary of an earlier version of this booklet was presented as an article inVol.29, No.7 (1998) of the International Journal of Educational Research,published by Pergamon Press. The publishers of this booklet thank PergamonPress for permission to reproduce some of the materials from the journalarticle.
ISBN 971-561-405-1ADB Publication Stock No. 100501
The series
Education in Developing Asia
has five volumes:
1. Don Adams (2002): Education and National Development: Priorities,Policies, and Planning;
2. David Chapman (2002): Management and Efficiency in Education: Goalsand Strategies ;
3. Mark Bray (2002): The Costs and Financing of Education: Trends andPolicy Implications ;
4. W.O. Lee (2002): Equity and Access to Education: Themes, Tensions,and Policies ; and
5. David Chapman and Don Adams (2002): The Quality of Education:Dimensions and Strategies .
Series Editor:
Mark Bray
The Costs and Financing of Education:
Trends and Policy Implications

i
Contents
List of Tables iiiList of Figures ivList of Boxes ivList of Abbreviations vForeword vii
Introduction 1
Contextual Features 2
Scale and Nature of Existing Education Provision 4
Volume of Expenditures on Education 6Public Expenditures 6Private Expenditures 8
Economic Justification for Investment in Education 11
Unit Costs and their Determinants 17Meanings and Examples 18Goals, Determinants, and Manipulable Variables 20Dropout and Repetition Rates 25Technologies − New and Old 26
Cost Sharing in Education 31Changing Frameworks for Policy 31Political Forces and Budget Constraints 32Forms of Cost Sharing 34Alternatives to Cost Sharing 36
Cost Recovery and Student Support in Tertiary Education 38Fees 38Grants and Loans 39
Institutional Revenue-Earning Schemes 41
Privatization of Education 42Models for Privatization 43Effects of Privatization 44Private Tutoring − A Sector Deserving Particular Scrutiny 46
International Aid for Education 48
ii The Costs and Financing of Education
Particular Strategies for Particular Groups of Countries 52Poor, Middle-Income, and Rich Economies 53Transitional and Long-Standing Capitalist Economies 54Countries of Different Sizes 55
Conclusion 56
Note on the Author 59References 60Appendix 72Index 74
The Costs and Financing of Education iii
List of Tables
Table 1: Basic Statistics for Developing Member Countries 3Table 2: Gross Enrollment Rates in Selected Developing
Member Countries, by Level 5Table 3: Public Expenditures on Education in Selected
Developing Member Countries 7Table 4: Public Expenditures on Education as a Percentage
of GNP, by Region, 1980-1995 7Table 5: Private Enrollments as a Percentage of Total Enrollments,
Selected Developing Member Countries, 1995 8Table 6: Rates of Return to Education − International Comparisons 12Table 7: Rates of Return to Education, by World Region and Level 13Table 8: Unadjusted and Adjusted Social Rates of Return, by Level 14Table 9: Estimated Recurrent Unit Costs by Level, PRC, 1994 19Table 10: Unit Recurrent Costs per Full-Time Equivalent in
Higher Education, Viet Nam, 1993-1995 19Table 11: Unit Costs by Level and Province, PRC, 1995 20Table 12: Primary School Teachers' Weekly Hours of
Classroom Teaching, by Country and Region 22Table 13: Official Class Hours during the First Four Years
of Primary Education 22Table 14: Primary School Pupil/Teacher Ratios and Teachers' Salaries
as a Multiple of Per Capita GDP in Selected Developing MemberCountries, Around 1992 23
Table 15: Percentage of Grade 1 Pupils Reaching Grade 4,Selected Countries 25
Table 16: Indicators of Internal Efficiency, Indonesia, 1976 and 1996 26Table 17: Development Costs of Materials per Student
Learning-Hour, by Medium, United Kingdom, 1996 28Table 18: Distance Universities in Asia: Cost and Effectiveness Data 30Table 19: Central Government Revenues as a Percentage of GDP,
Selected Developing Member Countries 36Table 20: Regional Breakdown of Taxation Revenue by Type of Tax 36Table 21: Sources of Recurrent Income of Selected Indian
Universities, 1989/90-1991/92 38Table 22: Hidden Subsidies, Government Losses, and Average Loan
Recovery Ratios on Selected Student Loan Programs 40Table 23: Cost-Effectiveness of Private Secondary Schools,
Selected Countries, Early 1980s 44Table 24: Official Development Assistance Flows to Developing
Member Countries 49
iv The Costs and Financing of Education
Table 25: Trends in External and Internal Mobilization ofResources for Education, Nepal 51
Table 26: Official Development Assistance to Education andTraining, Viet Nam, 1991-1995 51
List of Figures
Figure 1: Household and Government Resourcing of Public PrimaryEducation in Selected Developing Member Countries 9
Figure 2: Annual Costs Per Student, by Level, Viet Nam, 1994 18Figure 3: Contributions of Major Aid Agencies as a Proportion of the
Total National Education Budget, Indonesia 50Figure 4: Agency Contributions to Education, by Subsector, Indonesia 50
List of Boxes
Box 1: Public versus Private Education − A False Dichotomy? 10Box 2: The Balance between General and Technical/Vocational Education 17Box 3: Internal Inefficiency in Education Systems − Lessons
from Bangladesh 29Box 4: Fees and Cost Sharing in Nepal 33Box 5: Locally Imposed Taxes for Education in the PRC 37Box 6: The Negative Impact of Transition on Preschools in Central Asia 55Box 7: What Role for the State in Financing Education? 58

The Costs and Financing of Education v
List of Abbreviations
ADB Asian Development BankDMC Developing Member CountryFTE Full-Time EquivalentDMC Developing Member CountryGDP Gross Domestic ProductGNP Gross National ProductHPAE High-Performing Asian EconomyLao PDR Lao People’s Democratic RepublicOECD Organisation for Economic Co-operation and
DevelopmentPPP Purchasing Power ParityPRC People’s Republic of ChinaUNDP United Nations Development ProgrammeUNESCO United Nations Educational, Scientific and Cultural
OrganizationUNICEF United Nations Children’s FundVET Vocational Education and Training
Currency Equivalents(As of 15 March 2000)
Currency UnitBaht (B) B1.00 = $0.02644 $1.00 = B37.8200Dong (D) D1.00 = $0.00007138 $1.00 = D14,009Nepalese Rupee (NRe/NRs) NRe1.00 = $0.01448 $1.00 = NRs69.0500Pakistan Rupee (PRe/PRs) PRe1.00 = $0.01927 $1.00 = PRs51.8900Pound Sterling (£) £1.00 = $1.5787 $1.00 = £0.6334Singapore dollar (S$) S$1.00 = $0.5821 $1.00 = S$1.7180Taka (Tk) Tk1.00 = $0.01967 $1.00 = Tk50.8500Yuan (Y) Y1.00 = $0.1208 $1.00 = Y8.2800
Note
In this booklet, “$” refers to US dollars, unless otherwise specified.
vii
Foreword
The Asian Development Bank (ADB) is a major source of funds and technicaladvice for the education sector in the Asian and Pacific region. ADB hasprovided nearly $3.5 billion for education since 1990, representing an averageof about 6 percent of total ADB lending per year during that period. ADBrecognizes that human development is the basis for national and economicdevelopment, and that education − particularly basic education − is afundamental element of human development. ADB seeks to ensure that itseducation investment is effectively targeted and efficiently utilized. It furtherrecognizes that a clear policy framework based on careful analysis of thestatus and development needs of the education sector is necessary foreffective investment.
ADB has therefore committed itself to a comprehensive process of reviewand analysis as the basis for preparing a new education sector policy paper.The policy paper will guide ADB in its support for education in the first years ofthe 21st century. It will be based on a series of activities, all designed to ensurethat the education policy adequately reflects the rapidly evolving circumstancesof the region.
ADB commissioned eight country case studies and five technical workingpapers as inputs to the policy formulation process. The case studies,undertaken by leading education research institutes in the countries con-cerned, analyzed the issues in education and the policies that had beendeveloped to address the issues. The technical working papers examinedselected cross-cutting issues in education development in the region. The casestudies and the technical working papers were discussed at a major regionalseminar involving representatives of government ministries of education,finance, and planning. Later, the case studies and working papers wereintegrated into a single publication Education and National Development inAsia: Trends, Issues, Policies, and Strategies. This study in turn was an inputinto ADB’s education sector policy paper.
The five technical working papers contain a great deal of useful data andanalysis, and it is important to ensure that they are fully available to educationpolicymakers, practitioners, and scholars in the region and elsewhere.Consequently, revised versions are being published separately in their entiretyjointly by ADB and the Comparative Education Research Centre of theUniversity of Hong Kong as part of this series entitled Education in DevelopingAsia. ADB hopes that the papers and their wider availability will contribute to a
The Costs and Financing of Education viii
viii
better understanding of the emerging challenges of education development inthe region. ADB is pleased to have the partnership of a well-known academicinstitution in this publication, and thanks the authors and their associates fortheir contribution.
Nihal Amerasinghe Akira SekiDirector DirectorAgriculture and Social SectorsDepartment (East)
Agriculture and Social SectorsDepartment (West)
Asian Development Bank Asian Development Bank
1
Introduction
This booklet is one of a series of five that focus on education in the developingmember countries (DMCs) of the Asian Development Bank (ADB). The otherfour booklets focus on education policy, management and administration,quality, and equity and access. To some extent, the foci of these bookletsoverlap. For example, most improvements in the quality of education requiresome finance, while most decisions on the financing of education haveimplications for equity and access. Because of this overlap, the booklets canusefully be read in conjunction with each other. However, the booklets havebeen designed as freestanding works which can also be read independently.
Like the other booklets, this one is primarily concerned with formalkindergarten, school, technical/vocational, and higher education systems. Thework is concerned not only with government financing of education but alsowith various forms of private, household, and community financing. Commentsare made on distance education, especially at the tertiary level. However, thefocus does not include training given by companies for their workers,supplementary adult education classes, or the majority of other kinds ofnonformal and informal education.
While the significance of the topic might be self-evident, its importancedeserves to be made explicit. All societies confront basic questions about thescale, nature, and balance of education financing. They must decide on thevolume of resources to allocate to education activities; identify ways togenerate those resources; and consider methods to maximize cost-effective-ness in education investment. Because these basic challenges confront allsocieties, they provide a thread of commonality throughout the region andthroughout the booklet.
At the same time, the emphases of particular questions, and the natures ofthe answers, vary substantially within the region. Relatively rich countries facedifferent challenges from relatively poor ones; former socialist states may havedifferent priorities from long-standing capitalist ones; and small countries havedifferent opportunities and constraints from large ones. These variationsprovide instructive contrasts which, as in all comparative studies, help identifycontours which might otherwise go unnoticed. Comparative analysis alsoprovides a set of experiences from which others can identify both models thatmight be desirable to emulate and mistakes that should be avoided.
In terms of geographic coverage, this booklet is concerned with the DMCsof ADB. For much discussion, the country is the basic unit of analysis.However, in many instances it is important to note both variations withincountries and themes that concern clusters of countries. These cannot all beexplored in a work of this length; but readers should constantly bear in mindthat national boundaries are artificial creations, and that many social, political,
2 The Costs and Financing of Education
and economic forces neither confine themselves tidily to those boundaries noraffect all parts of individual nation states with equal emphasis.
The study begins by presenting some background information on thecountries on which the analysis particularly focuses, on groups of countries,and on the Asian and Pacific region as a whole. It then turns to the scale ofeducation and the volume of expenditures, noting the balance betweengovernment and nongovernment inputs, and commenting on changes overtime.
The next section turns to matters of unit costs and their determinants. Itpresents information on differences between and within levels of education,and discusses the policy implications of these differences. This is followed by asummary of the debate on the respective roles of government and privatesectors in the education sector. In turn, this discussion leads to commentary ontrends in cost sharing and revenue generation at the system and institutionallevels. The following section notes the scale and orientation of external aid foreducation in some countries. The penultimate part looks at different strategiesfor different groups of countries, while the last section summarizes andconcludes.
Contextual Features
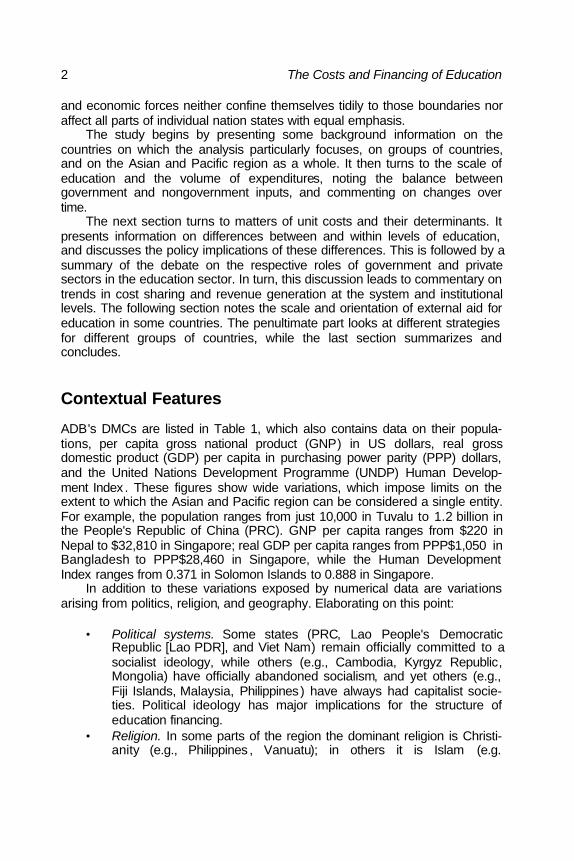
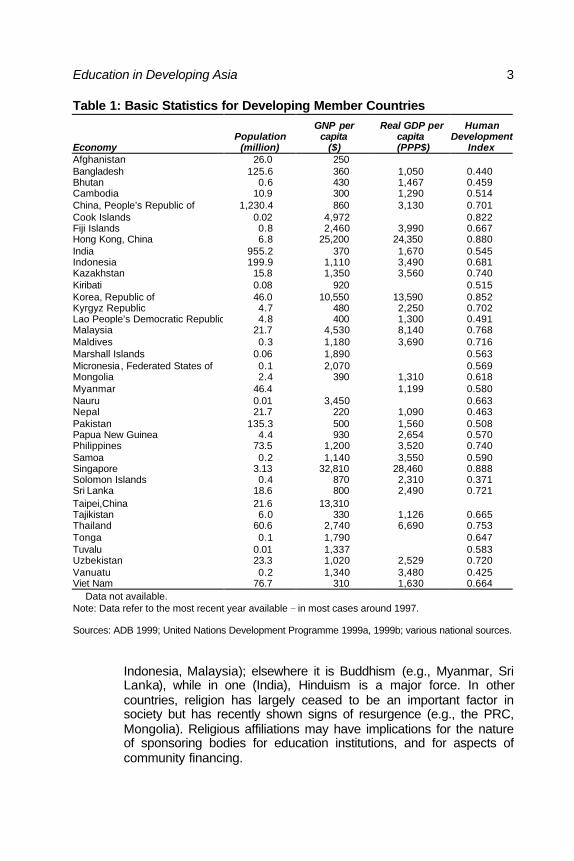
ADB's DMCs are listed in Table 1, which also contains data on their popula-tions, per capita gross national product (GNP) in US dollars, real grossdomestic product (GDP) per capita in purchasing power parity (PPP) dollars,and the United Nations Development Programme (UNDP) Human Develop-ment Index . These figures show wide variations, which impose limits on theextent to which the Asian and Pacific region can be considered a single entity.For example, the population ranges from just 10,000 in Tuvalu to 1.2 billion inthe People's Republic of China (PRC). GNP per capita ranges from $220 inNepal to $32,810 in Singapore; real GDP per capita ranges from PPP$1,050 inBangladesh to PPP$28,460 in Singapore, while the Human DevelopmentIndex ranges from 0.371 in Solomon Islands to 0.888 in Singapore.
In addition to these variations exposed by numerical data are variationsarising from politics, religion, and geography. Elaborating on this point:
• Political systems. Some states (PRC, Lao People's DemocraticRepublic [Lao PDR], and Viet Nam) remain officially committed to asocialist ideology, while others (e.g., Cambodia, Kyrgyz Republic,Mongolia) have officially abandoned socialism, and yet others (e.g.,Fiji Islands, Malaysia, Philippines) have always had capitalist socie-ties. Political ideology has major implications for the structure ofeducation financing.
• Religion. In some parts of the region the dominant religion is Christi-anity (e.g., Philippines , Vanuatu); in others it is Islam (e.g.
Education in Developing Asia 3
Table 1: Basic Statistics for Developing Member Countries
EconomyPopulation
(million)
GNP percapita
($)
Real GDP percapita
(PPP$)
HumanDevelopment
IndexAfghanistan 26.0 250 Bangladesh 125.6 360 1,050 0.440Bhutan 0.6 430 1,467 0.459Cambodia 10.9 300 1,290 0.514China, People’s Republic of 1,230.4 860 3,130 0.701Cook Islands 0.02 4,972 0.822Fiji Islands 0.8 2,460 3,990 0.667Hong Kong, China 6.8 25,200 24,350 0.880India 955.2 370 1,670 0.545Indonesia 199.9 1,110 3,490 0.681Kazakhstan 15.8 1,350 3,560 0.740Kiribati 0.08 920 0.515Korea, Republic of 46.0 10,550 13,590 0.852Kyrgyz Republic 4.7 480 2,250 0.702Lao People’s Democratic Republic 4.8 400 1,300 0.491Malaysia 21.7 4,530 8,140 0.768Maldives 0.3 1,180 3,690 0.716Marshall Islands 0.06 1,890 0.563Micronesia, Federated States of 0.1 2,070 0.569Mongolia 2.4 390 1,310 0.618Myanmar 46.4 1,199 0.580Nauru 0.01 3,450 0.663Nepal 21.7 220 1,090 0.463Pakistan 135.3 500 1,560 0.508Papua New Guinea 4.4 930 2,654 0.570Philippines 73.5 1,200 3,520 0.740Samoa 0.2 1,140 3,550 0.590Singapore 3.13 32,810 28,460 0.888Solomon Islands 0.4 870 2,310 0.371Sri Lanka 18.6 800 2,490 0.721Taipei,China 21.6 13,310 Tajikistan 6.0 330 1,126 0.665Thailand 60.6 2,740 6,690 0.753Tonga 0.1 1,790 0.647Tuvalu 0.01 1,337 0.583Uzbekistan 23.3 1,020 2,529 0.720Vanuatu 0.2 1,340 3,480 0.425Viet Nam 76.7 310 1,630 0.664 Data not available.Note: Data refer to the most recent year available − in most cases around 1997.
Sources: ADB 1999; United Nations Development Programme 1999a, 1999b; various national sources.
Indonesia, Malaysia); elsewhere it is Buddhism (e.g., Myanmar, SriLanka), while in one (India), Hinduism is a major force. In othercountries, religion has largely ceased to be an important factor insociety but has recently shown signs of resurgence (e.g., the PRC,Mongolia). Religious affiliations may have implications for the natureof sponsoring bodies for education institutions, and for aspects ofcommunity financing.

4 The Costs and Financing of Education
• Geography. Some parts of the region are very densely populated(e.g., Hong Kong, China; Singapore), while others are sparsely popu-lated (e.g., Kiribati, Mongolia). Again, some countries are scatteredarchipelagos (e.g., Indonesia, Solomon Islands), while others arebasically single blocks of land (e.g., Bangladesh, Pakistan). Popula-tion density influences the ease with which institutions can gaineconomies of scale, while the existence or absence of scatteredislands is a determinant of the primary means of communication.
The importance of these factors will become evident at various points inthe booklet, for they both determine and explain similarities and differences.Very few policy formulations can be uniformly applicable to the whole of theAsian and Pacific region. It therefore becomes necessary to identify particularpolicies which are appropriate for particular subregions, countries, and evenprovinces or districts.
However, it is also possible to identify some overarching commonalities.For example, almost all societies face issues concerning the role of the state ineducation. Likewise, almost all societies face issues related to expansion ofaccess, and to supply of and demand for highly trained personnel. In addition,all societies both benefit from and have to grapple with the advances intechnology which, among other effects, may change curricula and modes ofdelivery in education. Also, all societies have to address tensions betweenwell-established institutions and the new structures which may becomenecessary.
One striking feature, particularly during the period since the early 1990s,has been the advance of capitalist modes of operation in almost all parts of theregion. This has been especially obvious in the states which formallyabandoned socialism, but has also been evident in most of the states whichofficially maintained socialist regimes. Moreover, the advance of capitalistmodes of operation has been apparent even in countries which have longoperated capitalist economies but which have had government-protectededucation systems. The chief manifestation of the change has been theadvance of privatization in countries as different as India and Singapore.
Scale and Nature of Existing Education Provision
In order to see what is currently being financed, and what future needs will be,it is necessary to chart the scale and nature of existing education provision. Astarting point is with statistics on enrollment rates . These of course provideonly a partial picture. Even setting aside questions about the accuracy of thefigures on the numbers of pupils and school-age populations, from which theenrollment rates are calculated, the statistics say nothing about actualattendance of pupils. Nevertheless, they do provide a useful point of departure.
Table 2 shows that some countries are far from achieving universalprimary education, let alone substantial enrollment rates in secondary andtertiary education. Most obvious in this category are Afghanistan, Pakistan, and
Education in Developing Asia 5
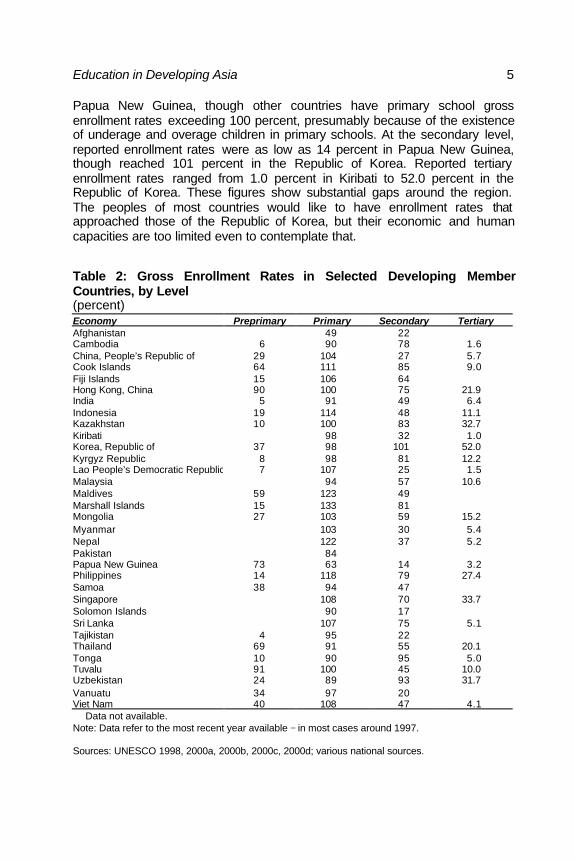
Papua New Guinea, though other countries have primary school grossenrollment rates exceeding 100 percent, presumably because of the existenceof underage and overage children in primary schools. At the secondary level,reported enrollment rates were as low as 14 percent in Papua New Guinea,though reached 101 percent in the Republic of Korea. Reported tertiaryenrollment rates ranged from 1.0 percent in Kiribati to 52.0 percent in theRepublic of Korea. These figures show substantial gaps around the region.The peoples of most countries would like to have enrollment rates thatapproached those of the Republic of Korea, but their economic and humancapacities are too limited even to contemplate that.
Table 2: Gross Enrollment Rates in Selected Developing MemberCountries, by Level(percent)Economy Preprimary Primary Secondary TertiaryAfghanistan 49 22 Cambodia 6 90 78 1.6China, People’s Republic of 29 104 27 5.7Cook Islands 64 111 85 9.0Fiji Islands 15 106 64 Hong Kong, China 90 100 75 21.9India 5 91 49 6.4Indonesia 19 114 48 11.1Kazakhstan 10 100 83 32.7Kiribati 98 32 1.0Korea, Republic of 37 98 101 52.0Kyrgyz Republic 8 98 81 12.2Lao People’s Democratic Republic 7 107 25 1.5Malaysia 94 57 10.6Maldives 59 123 49 Marshall Islands 15 133 81 Mongolia 27 103 59 15.2Myanmar 103 30 5.4Nepal 122 37 5.2Pakistan 84 Papua New Guinea 73 63 14 3.2Philippines 14 118 79 27.4Samoa 38 94 47 Singapore 108 70 33.7Solomon Islands 90 17 Sri Lanka 107 75 5.1Tajikistan 4 95 22 Thailand 69 91 55 20.1Tonga 10 90 95 5.0Tuvalu 91 100 45 10.0Uzbekistan 24 89 93 31.7Vanuatu 34 97 20 Viet Nam 40 108 47 4.1 Data not available.Note: Data refer to the most recent year available − in most cases around 1997.
Sources: UNESCO 1998, 2000a, 2000b, 2000c, 2000d; various national sources.

6 The Costs and Financing of Education
Statistics on preprimary education are generally more scarce than thoseon primary, secondary, or tertiary education. This is partly because in manycountries preprimary education is dominated by the private sector, andgovernments have incomplete data on the sector. In general, enrollment ratesat the preprimary level are low, though they are about 90 percent in HongKong, China, for example. In that society, the authorities have insisted thatpreprimary education is not an essential component of the education system.However, the majority of parents consider it essential, and primary schools inthat society generally assume that children have learned basic literacy andnumeracy in preprimary education.
Alongside the quantitative patterns indicated by the statistics onenrollment rates should be placed a commentary on qualitative variations. Thisis done in the booklet in this series on the quality of education (Chapman andAdams 2002), and need not be repeated. It is sufficient here to note that insome countries expenditure produces education with good quality (albeitalways with room for improvement), while in other countries quality is very low.The latter again indicates gaps that need more financing and/or more efficientuse of existing resources.
Volume of Expenditures on Education
Public Expenditures
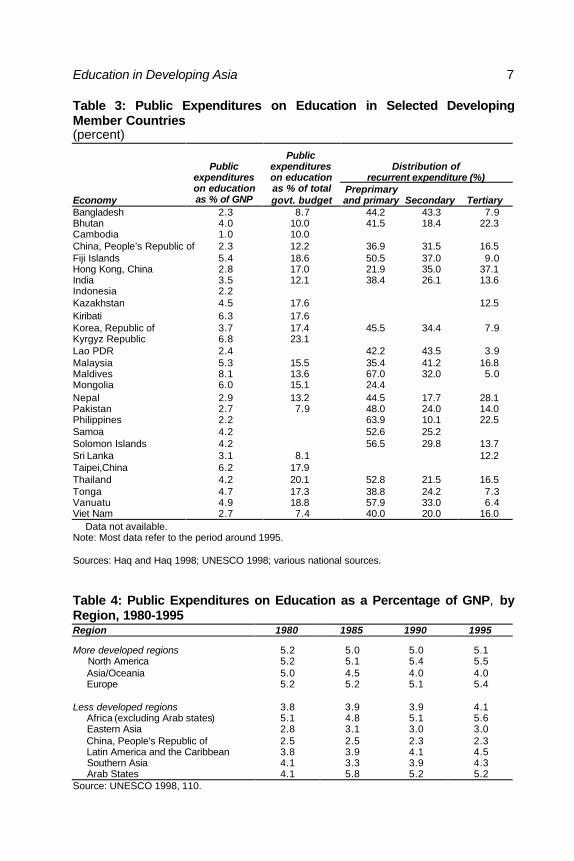
Table 3 presents information on the volume of public expenditures oneducation in DMCs. Once again, the variations are substantial. Whereasexpenditures by the Cambodian Government represented only 1.0 percent ofGNP, the figure for the Kyrgyz Republic was 6.8 percent. Public expenditureson education as a proportion of the total budget ranged from 7.4 percent in VietNam to 23.1 percent in the Kyrgyz Republic. Education was commonly thelargest item in government budgets.
Table 3 also shows figures on the distribution of government budgets atdifferent levels of education. The statistics are only for recurrent expenditures.In most countries, government capital expenditures would have been greater atthe tertiary than at the primary level, and probably also greater than at thesecondary level. Again the figures show major variations. Whereas theGovernment of the Lao PDR spent only 3.9 percent of its education budget onhigher education, in Hong Kong, China the figure was 37.1 percent. The formerfigure reflected the fact that the tertiary sector in the Lao PDR was very small,though scheduled for major expansion. The latter figure reflected a tertiarysector that had already been expanded to cover 25 percent of the age groupand that was basically publicly funded. Tertiary enrollment rates in the Republicof Korea were higher than in Hong Kong, China; but since the bulk of provisionwas private, only 7.9 percent of the Government's recurrent budget foreducation was allocated to the sector.
Table 4 shows regional aggregates over time. In Eastern Asia, publicexpenditures on education as a proportion of GNP rose slightly between 1980
Education in Developing Asia 7
Table 3: Public Expenditures on Education in Selected DevelopingMember Countries(percent)
Distribution ofrecurrent expenditure (%)
Economy
Publicexpenditureson educationas % of GNP
Publicexpenditureson educationas % of totalgovt. budget
Preprimaryand primary Secondary Tertiary
Bangladesh 2.3 8.7 44.2 43.3 7.9Bhutan 4.0 10.0 41.5 18.4 22.3Cambodia 1.0 10.0 China, People’s Republic of 2.3 12.2 36.9 31.5 16.5Fiji Islands 5.4 18.6 50.5 37.0 9.0Hong Kong, China 2.8 17.0 21.9 35.0 37.1India 3.5 12.1 38.4 26.1 13.6Indonesia 2.2 Kazakhstan 4.5 17.6 12.5Kiribati 6.3 17.6 Korea, Republic of 3.7 17.4 45.5 34.4 7.9Kyrgyz Republic 6.8 23.1 Lao PDR 2.4 42.2 43.5 3.9Malaysia 5.3 15.5 35.4 41.2 16.8Maldives 8.1 13.6 67.0 32.0 5.0Mongolia 6.0 15.1 24.4 Nepal 2.9 13.2 44.5 17.7 28.1Pakistan 2.7 7.9 48.0 24.0 14.0Philippines 2.2 63.9 10.1 22.5Samoa 4.2 52.6 25.2 Solomon Islands 4.2 56.5 29.8 13.7Sri Lanka 3.1 8.1 12.2Taipei,China 6.2 17.9 Thailand 4.2 20.1 52.8 21.5 16.5Tonga 4.7 17.3 38.8 24.2 7.3Vanuatu 4.9 18.8 57.9 33.0 6.4Viet Nam 2.7 7.4 40.0 20.0 16.0 Data not available.Note: Most data refer to the period around 1995.
Sources: Haq and Haq 1998; UNESCO 1998; various national sources.
Table 4: Public Expenditures on Education as a Percentage of GNP, byRegion, 1980-1995Region 1980 1985 1990 1995
More developed regions 5.2 5.0 5.0 5.1 North America 5.2 5.1 5.4 5.5 Asia/Oceania 5.0 4.5 4.0 4.0 Europe 5.2 5.2 5.1 5.4
Less developed regions 3.8 3.9 3.9 4.1 Africa (excluding Arab states) 5.1 4.8 5.1 5.6 Eastern Asia 2.8 3.1 3.0 3.0 China, People's Republic of 2.5 2.5 2.3 2.3 Latin America and the Caribbean 3.8 3.9 4.1 4.5 Southern Asia 4.1 3.3 3.9 4.3 Arab States 4.1 5.8 5.2 5.2Source: UNESCO 1998, 110.
8 The Costs and Financing of Education
and 1995, but in Southern Asia they fluctuated. In general, the less developedcountries of Asia devoted a smaller proportion of GNP to education than didtheir counterparts in Africa. This particularly reflected the low level of teachers'salaries in Asia as a proportion of per capita GNP. The proportion was alsobelow that in the more developed countries of North America, Asia/Oceania,and Europe. The proportion was particularly low in the PRC. Many observersconsider that the proportion should be raised in the PRC and in other countrieswhere it is especially low.
Private Expenditures
The nature of education expenditures in the Republic of Korea deserveselaboration, because it underlines the danger of citing government expendi-tures as if they were the only ones. Such a tendency is evident in manydocuments, but may lead to a very biased picture. In the Republic of Korea,nongovernment expenditures on education in 1994 formed 71.1 percent of totalexpenditures. During the period since 1977, private expenditures have grownmuch more rapidly than public ones (Paik 1995, 15).
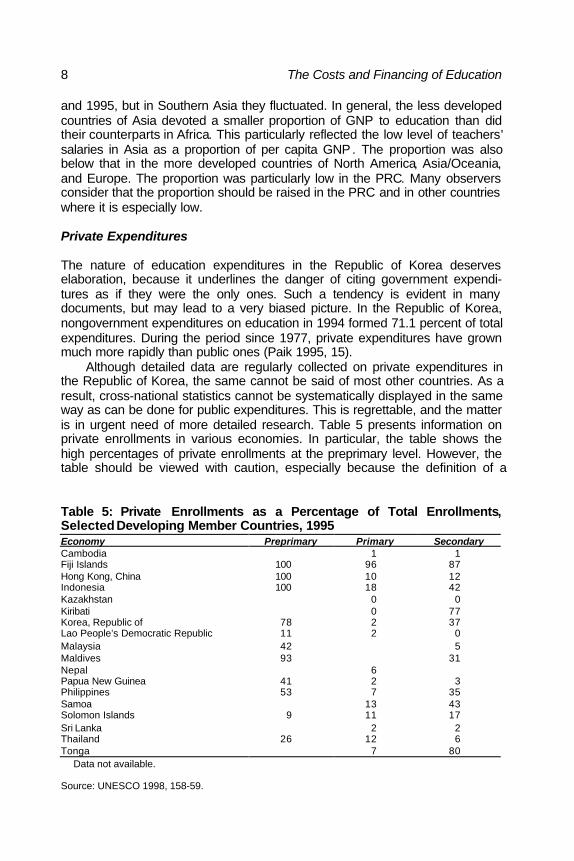
Although detailed data are regularly collected on private expenditures inthe Republic of Korea, the same cannot be said of most other countries. As aresult, cross-national statistics cannot be systematically displayed in the sameway as can be done for public expenditures. This is regrettable, and the matteris in urgent need of more detailed research. Table 5 presents information onprivate enrollments in various economies. In particular, the table shows thehigh percentages of private enrollments at the preprimary level. However, thetable should be viewed with caution, especially because the definition of a
Table 5: Private Enrollments as a Percentage of Total Enrollments,Selected Developing Member Countries, 1995Economy Preprimary Primary SecondaryCambodia 1 1Fiji Islands 100 96 87Hong Kong, China 100 10 12Indonesia 100 18 42Kazakhstan 0 0Kiribati 0 77Korea, Republic of 78 2 37Lao People’s Democratic Republic 11 2 0Malaysia 42 5Maldives 93 31Nepal 6 Papua New Guinea 41 2 3Philippines 53 7 35Samoa 13 43Solomon Islands 9 11 17Sri Lanka 2 2Thailand 26 12 6Tonga 7 80 Data not available.
Source: UNESCO 1998, 158-59.
Education in Developing Asia 9
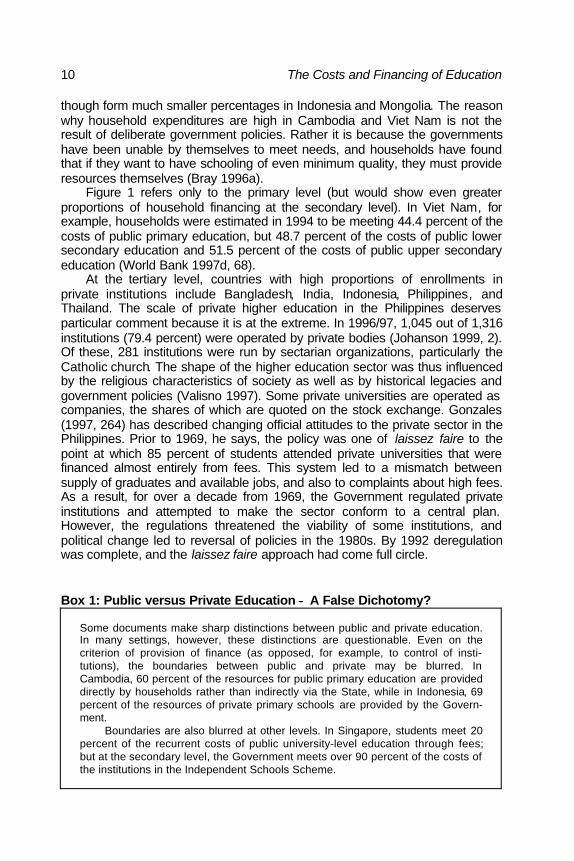
Figure 1: Household and Government Resourcing of Public PrimaryEducation in Selected Developing Member Countries
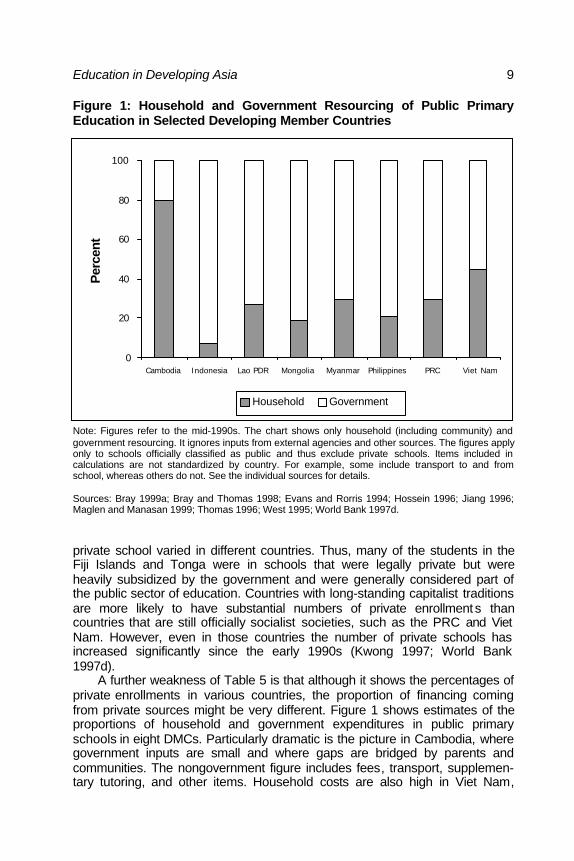
Note: Figures refer to the mid-1990s. The chart shows only household (including community) andgovernment resourcing. It ignores inputs from external agencies and other sources. The figures applyonly to schools officially classified as public and thus exclude private schools. Items included incalculations are not standardized by country. For example, some include transport to and fromschool, whereas others do not. See the individual sources for details.
Sources: Bray 1999a; Bray and Thomas 1998; Evans and Rorris 1994; Hossein 1996; Jiang 1996;Maglen and Manasan 1999; Thomas 1996; West 1995; World Bank 1997d.
private school varied in different countries. Thus, many of the students in theFiji Islands and Tonga were in schools that were legally private but wereheavily subsidized by the government and were generally considered part ofthe public sector of education. Countries with long-standing capitalist traditionsare more likely to have substantial numbers of private enrollments thancountries that are still officially socialist societies, such as the PRC and VietNam. However, even in those countries the number of private schools hasincreased significantly since the early 1990s (Kwong 1997; World Bank1997d).
A further weakness of Table 5 is that although it shows the percentages ofprivate enrollments in various countries, the proportion of financing comingfrom private sources might be very different. Figure 1 shows estimates of theproportions of household and government expenditures in public primaryschools in eight DMCs. Particularly dramatic is the picture in Cambodia, wheregovernment inputs are small and where gaps are bridged by parents andcommunities. The nongovernment figure includes fees, transport, supplemen-tary tutoring, and other items. Household costs are also high in Viet Nam,
0
20
40
60
80
100
Cambodia Indonesia Lao PDR Mongolia Myanmar Philippines PRC Viet Nam
Per
cent
Household Government
10 The Costs and Financing of Education
though form much smaller percentages in Indonesia and Mongolia. The reasonwhy household expenditures are high in Cambodia and Viet Nam is not theresult of deliberate government policies. Rather it is because the governmentshave been unable by themselves to meet needs, and households have foundthat if they want to have schooling of even minimum quality, they must provideresources themselves (Bray 1996a).
Figure 1 refers only to the primary level (but would show even greaterproportions of household financing at the secondary level). In Viet Nam, forexample, households were estimated in 1994 to be meeting 44.4 percent of thecosts of public primary education, but 48.7 percent of the costs of public lowersecondary education and 51.5 percent of the costs of public upper secondaryeducation (World Bank 1997d, 68).
At the tertiary level, countries with high proportions of enrollments inprivate institutions include Bangladesh, India, Indonesia, Philippines, andThailand. The scale of private higher education in the Philippines deservesparticular comment because it is at the extreme. In 1996/97, 1,045 out of 1,316institutions (79.4 percent) were operated by private bodies (Johanson 1999, 2).Of these, 281 institutions were run by sectarian organizations, particularly theCatholic church. The shape of the higher education sector was thus influencedby the religious characteristics of society as well as by historical legacies andgovernment policies (Valisno 1997). Some private universities are operated ascompanies, the shares of which are quoted on the stock exchange. Gonzales(1997, 264) has described changing official attitudes to the private sector in thePhilippines. Prior to 1969, he says, the policy was one of laissez faire to thepoint at which 85 percent of students attended private universities that werefinanced almost entirely from fees. This system led to a mismatch betweensupply of graduates and available jobs, and also to complaints about high fees.As a result, for over a decade from 1969, the Government regulated privateinstitutions and attempted to make the sector conform to a central plan.However, the regulations threatened the viability of some institutions, andpolitical change led to reversal of policies in the 1980s. By 1992 deregulationwas complete, and the laissez faire approach had come full circle.
Box 1: Public versus Private Education −− A False Dichotomy?
Some documents make sharp distinctions between public and private education.In many settings, however, these distinctions are questionable. Even on thecriterion of provision of finance (as opposed, for example, to control of insti-tutions), the boundaries between public and private may be blurred. InCambodia, 60 percent of the resources for public primary education are provideddirectly by households rather than indirectly via the State, while in Indonesia, 69percent of the resources of private primary schools are provided by the Govern-ment.
Boundaries are also blurred at other levels. In Singapore, students meet 20percent of the recurrent costs of public university-level education through fees;but at the secondary level, the Government meets over 90 percent of the costs ofthe institutions in the Independent Schools Scheme.
Education in Developing Asia 11
Economic Justification for Investment in Education
The scale of public and private expenditures on different levels and types ofeducation provides an indication of de facto priorities. However, it does notindicate the rationales for those priorities. Behind the expenditures areinstitutional and individual decisions that have social, political, and economicgoals. The social and political goals include raised levels of education in orderto improve public awareness of important issues, efforts to preserve existingsocial orders, desires to reduce inequalities of access, and concern to reducepopulation growth rates. However, more relevant to this particular documentare the economic goals.
Among the dominant strands of thought on the role of education ineconomic development is that it is an investment in human capital (OECD1998). Within this, is the view that it is possible to calculate rates of return frominvestment in education, and to do so by level and type of education. The workof Psacharopoulos (e.g., 1994, 1995) has become particularly well known inthis domain. Other key researchers include Schultz (e.g., 1961, 1987), Becker(e.g., 1975, 1995), and McMahon (e.g., 1997, 1998).
Table 6 shows statistics from a large number of studies of rates of returnto investment in education compiled by Psacharopoulos (1994). Private returnsaccrue to individuals, while social returns accrue to the whole society (includingthe individuals). In most cases, private returns are greater than social returnsbecause governments give more in subsidies than they take away in taxes.Regional aggregates are shown in Table 7.
On the basis of the figures in Table 6, together with related work,Psacharopoulos has argued that education is generally a good investment bothfor individuals and for whole societies. Within the education sector, Psacharo-poulos has argued, rates of return are particularly high at the primary level, andespecially in less developed countries. This suggests that in most circum-stances primary education deserves priority in the allocation of extraresources. This view has helped shape World Bank policy, and has also beenwidely accepted elsewhere (e.g., UNDP 2000). The World Bank (e.g., 1995,56) has argued on such evidence that expenditures in many countries havebeen misallocated between education subsectors, with too much emphasis onsecondary and higher education.
However, evidence from some countries seems to indicate that privaterates of return are falling over time (Tilak 1997a, 69). Moreover, the veryconcept of rate-of-return analysis in education has been subject to criticism(e.g., Leslie 1990; Bennell 1996; Curtin 1996). One argument is that greaterearnings for individuals with higher levels of education do not reflect theintrinsic value of education so much that school systems operate as screeningdevices in which only the more talented get through to higher levels. This viewdoes not nullify the value of investments in education, but casts a different lighton the reasons for earnings differentials at different levels of education. Othercriticisms of rate-of-return analysis are that the presentation of exact numbersgives the illusion of precision. Also, since rates are calculated on past data,they cannot necessarily predict what will happen in the future. Indeed, of

12 The Costs and Financing of Education
Table 6: Rates of Return to Education −− International Comparisons(percent)
Private SocialEconomy Year Primary Secondary Higher Primary Secondary HigherArgentina 1989 10.1 14.2 14.9 8.4 7.1 7.6Australia 1976 8.1 21.1 16.3Bolivia 1989 9.8 8.1 16.4 9.3 7.3 13.1Botswana 1983 99.0 76.0 38.0 42.0 41.0 15.0Brazil 1989 36.6 5.1 28.2 35.6 5.1 21.4Canada 1985 20.7 8.3 10.6 4.3Chile 1989 9.7 12.9 20.7 8.1 11.1 14.0Colombia 1989 27.7 14.7 21.7 20.0 11.4 14.0Hong Kong, China 1976 18.5 25.2 15.0 12.4India 1978 33.4 19.8 13.2 29.3 13.7 10.8Indonesia 1989 11.0 5.0 Jamaica 1989 20.4 15.7 17.7 7.9 Japan 1976 13.4 10.4 8.8 9.6 8.6 6.9Korea, Republic of 1986 10.1 17.9 8.8 15.5Malaysia 1978 32.6 34.5 Mexico 1984 21.6 15.1 21.7 19.0 9.6 12.9New Zealand 1966 20.0 14.7 19.4 13.2Nepal 1982 15.0 21.7 Pakistan 1975 20.0 11.0 27.0 13.0 9.0 8.0Papua New Guinea 1986 37.2 41.6 23.0 12.8 19.4 8.4Paraguay 1990 23.7 14.6 13.7 20.3 12.7 10.8Peru 1990 13.2 6.6 40.0 Philippines 1988 18.3 10.5 11.6 13.3 8.9 10.5Senegal 1985 33.7 21.3 23.0 8.9 Singapore 1966 20.0 25.4 6.6 17.6 14.1South Africa 1980 22.1 17.7 11.8 Sri Lanka 1981 12.6 16.1 Taipei,China 1972 50.0 12.7 15.8 27.0 12.3 17.7Thailand 1970 56.0 14.5 14.0 30.5 13.0 11.0United Kingdom 1978 11.0 23.0 9.0 7.0United States 1987 10.0 12.0 Zimbabwe 1987 16.6 48.5 5.1 11.2 47.6 -4.3 Data not available.
Source: Psacharopoulos 1994, 1340-1.
the full sets of social returns for Asia reported in Table 6, only two are basedon data more recent than 1978.
Even within the World Bank, the reliability of estimates of rates of return asguides for investment has been called into question, with one publication, forexample, stating (World Bank 1997c, 37) that:
Despite some claims that returns to primary education are invariably highacross countries of Africa, Asia and Latin America, there is growing skepti-cism. The work of such authors as Behrman and Birdsall (1985), Hinchliffe(1986), Knight and Sabot (1990), and Glewwe (1991) suggests that cal-culations have often incorporated upward biases. This has led Weale(1993) to argue that social returns to education will only rarely be in doubledigits.

Education in Developing Asia 13
This paragraph was used to explain how the relatively low estimates of rates ofreturn in India could be reconciled with the higher figures reported for othercountries. The World Bank publication (1997c, 36-8) presented two tables ofrates of return, one from the state of Andhra Pradesh in 1977 and the otherfrom the state of Maharashtra in 1988. The former showed social rates ofreturn which, after adjustment for wastage, unemployment, nonparticipation inthe labor force, and student ability, were only 7 percent at the primary level, 6percent for middle schools and general degrees, and negative for secondaryschools. The latter showed rates of return for primary and middle schools thatwere higher in urban than rural areas, and in most cases higher for femalesthan males, but that ranged from 3.5 to 8.3 percent. Nevertheless, thedocument pointed out, future rates of return could at least be expected to bepositive, and investment in education would also bring noneconomic benefits.
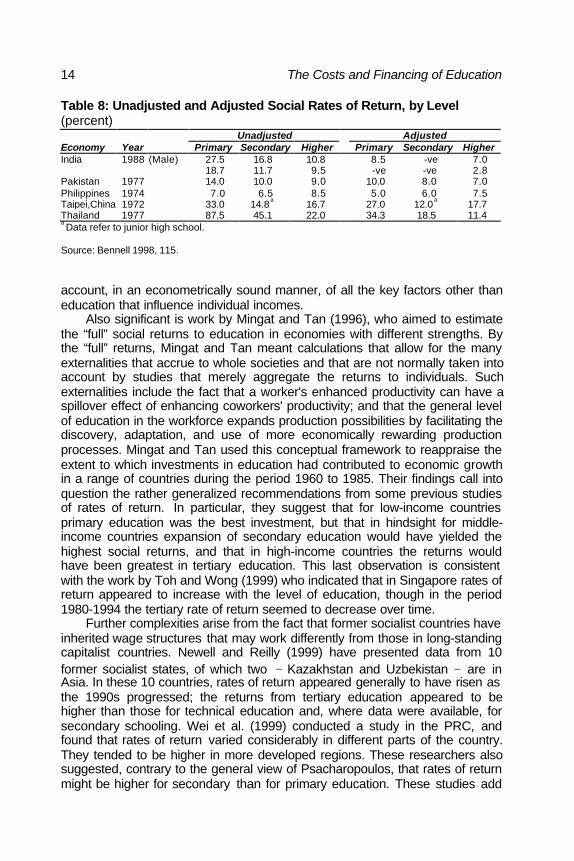
Challenge to Psacharopoulos' work with specific reference to Asia hasalso been presented by Bennell (1998). Two particular criticisms have beenleveled (p.110). The first is that regional aggregations presented by Psacharo-poulos are problematic because the individual country studies do not all coverevery level and type of education, and because they vary widely in the periodsof history when they were conducted. The second criticism is that Psacharo-poulos relied wherever possible on unadjusted rates of return, which impliedvery simplistic relationships between education and incomes and which failedto take sufficient account of the many other factors which influence incomes.Table 8 reproduces figures on the impact of such adjustment, which showedsignificantly lower estimates.
Bennell also highlighted two reporting errors among the 13 Asian countriesused in Psacharopoulos' regional aggregate, and noted the existence of otherstudies that had been excluded from Psacharopoulos' survey. He concluded(p.118) that aggregations "should be discarded altogether in any seriousdiscussion of education investment priorities both for the Asian continent as awhole and individual countries.” He agreed on the value of the concept of ratesof return, but added that the majority of studies that have attempted tocalculate rates of return for specific types of education and training areseriously flawed, mainly because sufficient data are rarely available to take
Table 7: Rates of Return to Education, by World Region and Level(percent)
Private SocialRegion Primary Secondary Higher Primary Secondary HigherSub-Saharan Africa 41.3 26.6 27.8 24.3 18.2 11.2Asia
a39.0 18.9 19.9 19.9 13.3 11.7
Europe/Middle East/ North Africa
a 87.4 15.9 21.7 15.5 11.2 10.6Latin America/Caribbean 26.2 16.8 19.7 17.9 12.8 12.3OECD 21.7 12.4 12.3 — 10.2 8.7— = not available.a Excluding Organisation for Economic Co-operation and Development (OECD) countries.
Source: Psacharopoulos 1994, 1328.
14 The Costs and Financing of Education
Table 8: Unadjusted and Adjusted Social Rates of Return, by Level(percent)
Unadjusted AdjustedEconomy Year Primary Secondary Higher Primary Secondary HigherIndia 1988 (Male) 27.5 16.8 10.8 8.5 -ve 7.0
18.7 11.7 9.5 -ve -ve 2.8Pakistan 1977 14.0 10.0 9.0 10.0 8.0 7.0Philippines 1974 7.0 6.5 8.5 5.0 6.0 7.5Taipei,China 1972 33.0 14.8
a16.7 27.0 12.0
a17.7
Thailand 1977 87.5 45.1 22.0 34.3 18.5 11.4a Data refer to junior high school.
Source: Bennell 1998, 115.
account, in an econometrically sound manner, of all the key factors other thaneducation that influence individual incomes.
Also significant is work by Mingat and Tan (1996), who aimed to estimatethe “full” social returns to education in economies with different strengths. Bythe “full” returns, Mingat and Tan meant calculations that allow for the manyexternalities that accrue to whole societies and that are not normally taken intoaccount by studies that merely aggregate the returns to individuals. Suchexternalities include the fact that a worker's enhanced productivity can have aspillover effect of enhancing coworkers' productivity; and that the general levelof education in the workforce expands production possibilities by facilitating thediscovery, adaptation, and use of more economically rewarding productionprocesses. Mingat and Tan used this conceptual framework to reappraise theextent to which investments in education had contributed to economic growthin a range of countries during the period 1960 to 1985. Their findings call intoquestion the rather generalized recommendations from some previous studiesof rates of return. In particular, they suggest that for low-income countriesprimary education was the best investment, but that in hindsight for middle-income countries expansion of secondary education would have yielded thehighest social returns, and that in high-income countries the returns wouldhave been greatest in tertiary education. This last observation is consistentwith the work by Toh and Wong (1999) who indicated that in Singapore rates ofreturn appeared to increase with the level of education, though in the period1980-1994 the tertiary rate of return seemed to decrease over time.
Further complexities arise from the fact that former socialist countries haveinherited wage structures that may work differently from those in long-standingcapitalist countries. Newell and Reilly (1999) have presented data from 10former socialist states, of which two − Kazakhstan and Uzbekistan − are inAsia. In these 10 countries, rates of return appeared generally to have risen asthe 1990s progressed; the returns from tertiary education appeared to behigher than those for technical education and, where data were available, forsecondary schooling. Wei et al. (1999) conducted a study in the PRC, andfound that rates of return varied considerably in different parts of the country.They tended to be higher in more developed regions. These researchers alsosuggested, contrary to the general view of Psacharopoulos, that rates of returnmight be higher for secondary than for primary education. These studies add
Education in Developing Asia 15
further weight to the argument that policy recommendations based on data onrates of return should not be oversimplified.
The role of technical/vocational education at the secondary level alsoremains controversial (Lewin 1993, 222-4; Mingat 1995, 24-5). One view is thatacademic studies do not provide sufficient ties to the needs of the labormarket, especially for students who leave school at the secondary stage, andthat technical/vocational training is necessary both for the direct skills that itprovides and for the attitudes that it inculcates. During the 1980s, thisperspective led to substantial expansion of secondary technical/vocationaleducation in the PRC, for example (Yang 1998). Between 1989 and 1994,enrollments in PRC secondary vocational schools increased by 45.8 percent,while enrollments in regular senior secondary schools declined by 7.2 percent(Jiang 1996, 40). This change reflected official policy, which encouraged boththe opening of new secondary vocational schools and the conversion of regularsecondary schools. Along related lines, a 1994 policy in Taipei,China has ledto experimentation with comprehensive high schools which seek to integratethe goals of general and vocational high schools and "to increase students'opportunities for exploring their vocational aptitudes" (Rau et al. 1996, 1).
An alternative view is that technical/vocational schools are necessarilymore costly than academic ones, and that the outcomes from such forms ofeducation do not usually justify the investments (Psacharopoulos 1991). Thisview is influenced by Foster's seminal (1966) paper entitled “The VocationalSchool Fallacy in Development Planning,” and asserts that curricula are bythemselves unable to change students' attitudes toward work when labormarket signals indicate that academic studies are more likely in reality to bringgreater private economic returns. Middleton et al. (1993, 187) have added that:
The prevocational skills provided in diversified curricula do not providemuch of an employment advantage because employers still need toprovide additional training. Larger modern-sector employers care lessabout whether young school-leavers have practical skills suitable for entry-level jobs and more about whether the students have the broad concep-tual and communicative skills that support continued learning. These latterskills, of course, can be developed at comparatively low cost in goodquality academic secondary programs…. To the extent that vocationalcourses have substituted for more thorough preparation in broad, generalskills, a diversified curriculum may even reduce a graduate's chances foremployment.
However, Bennell and Segerstrom (1998, 286) have asserted that theWorld Bank's reluctance to fund vocational education and training in thecontext of an expanding education sector budget is "essentially an ideologicallydriven overreaction that has been justified on the basis of a serious misreadingof the evidence concerning the role of public sector VET [vocational educationand training] at all stages of economic development.” They agree that public-sector VET has certainly been beset with a number of deep-seated problems,but they caution against overgeneralized approaches.
Similarly, Haq and Haq (1998, 97) have described the World Bank view as
16 The Costs and Financing of Education
"misleading,” adding that:
The lower social rates of return for technical education often result fromadopting education patterns which are less cost-effective and not twinnedwith employment opportunities in the market. Several studies have dem-onstrated that if school-based vocational education responds to marketdemand, the earnings of such graduates are higher than those of theircounterparts in general education…. Thus, social returns to vocational andtechnical education are sufficiently high, so long as this education is cost-effective and linked closely with market employment opportunities. Irrele-vant studies are no basis for sensible policies.
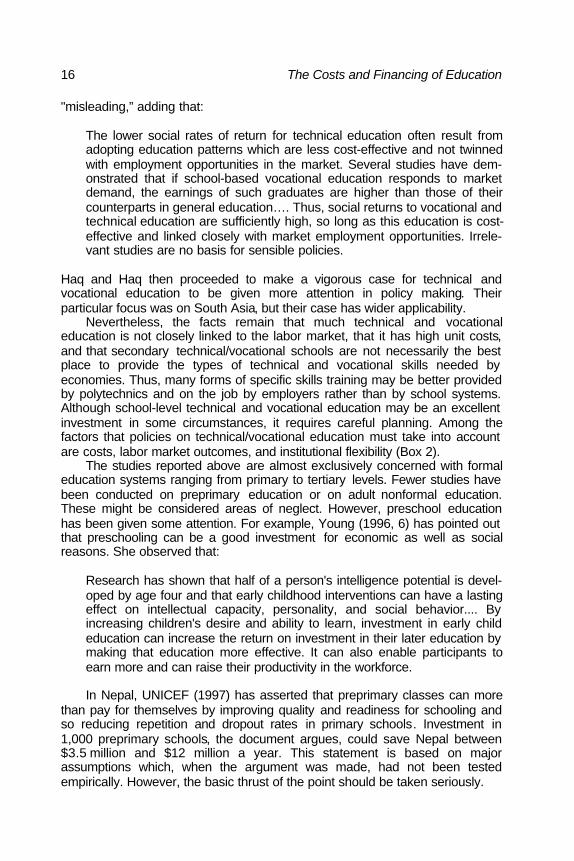
Haq and Haq then proceeded to make a vigorous case for technical andvocational education to be given more attention in policy making. Theirparticular focus was on South Asia, but their case has wider applicability.
Nevertheless, the facts remain that much technical and vocationaleducation is not closely linked to the labor market, that it has high unit costs,and that secondary technical/vocational schools are not necessarily the bestplace to provide the types of technical and vocational skills needed byeconomies. Thus, many forms of specific skills training may be better providedby polytechnics and on the job by employers rather than by school systems.Although school-level technical and vocational education may be an excellentinvestment in some circumstances, it requires careful planning. Among thefactors that policies on technical/vocational education must take into accountare costs, labor market outcomes, and institutional flexibility (Box 2).
The studies reported above are almost exclusively concerned with formaleducation systems ranging from primary to tertiary levels. Fewer studies havebeen conducted on preprimary education or on adult nonformal education.These might be considered areas of neglect. However, preschool educationhas been given some attention. For example, Young (1996, 6) has pointed outthat preschooling can be a good investment for economic as well as socialreasons. She observed that:
Research has shown that half of a person's intelligence potential is devel-oped by age four and that early childhood interventions can have a lastingeffect on intellectual capacity, personality, and social behavior.... Byincreasing children's desire and ability to learn, investment in early childeducation can increase the return on investment in their later education bymaking that education more effective. It can also enable participants toearn more and can raise their productivity in the workforce.
In Nepal, UNICEF (1997) has asserted that preprimary classes can morethan pay for themselves by improving quality and readiness for schooling andso reducing repetition and dropout rates in primary schools. Investment in1,000 preprimary schools, the document argues, could save Nepal between$3.5 million and $12 million a year. This statement is based on majorassumptions which, when the argument was made, had not been testedempirically. However, the basic thrust of the point should be taken seriously.
Education in Developing Asia 17
Box 2: The Balance between General and Technical/Vocational Education
Particularly in contexts of unemployment and perceived irrelevance of academiceducation, many policy advocates have favored investment in technical/ voca-tional education more than general education. Indonesia is one country in whichtechnical/vocational schools have been given emphasis. The sixth five-year plan(1993-98) called for 7.4 percent annual growth of technical/vocational seniorsecondary places, compared with only 5.1 percent for general senior secondaryplaces.
A 1997 World Bank report on Indonesia questioned the wisdom of thispolicy. It noted that technical/vocational schools were about 40 percent morecostly than general schools, that general schools were more popular amongstudents and parents, and that the labor market outcomes for graduates oftechnical/vocational schools were typically no better than for their generalistcompetitors. The report added that because technical/vocational programsdepend on bureaucratically determined factors, institutions cannot easily expandoperations when there is more demand, and have no incentive to contractoperations when there is less demand.
The World Bank (1997b, 78) recommended the Indonesian authorities toreconsider the budgetary priority given to technical/vocational schools, to findways to reduce costs in the sector, and to increase the general-education contentin the technical/vocational education streams. More specialized training, it wassuggested, could be left to polytechnics and to job-specific training in firms.Recommendations such as these do not attract universal agreement, but they domatch those made by education economists in many other countries.
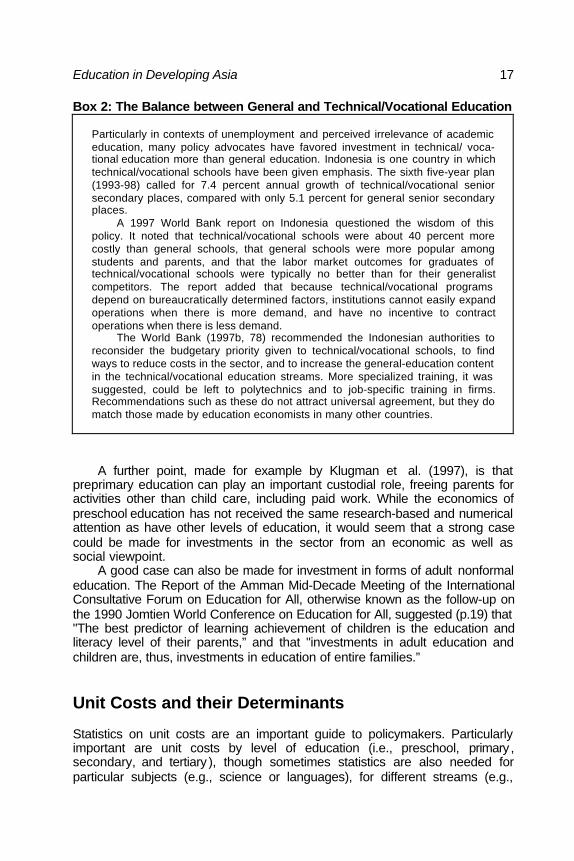
A further point, made for example by Klugman et al. (1997), is thatpreprimary education can play an important custodial role, freeing parents foractivities other than child care, including paid work. While the economics ofpreschool education has not received the same research-based and numericalattention as have other levels of education, it would seem that a strong casecould be made for investments in the sector from an economic as well associal viewpoint.
A good case can also be made for investment in forms of adult nonformaleducation. The Report of the Amman Mid-Decade Meeting of the InternationalConsultative Forum on Education for All, otherwise known as the follow-up onthe 1990 Jomtien World Conference on Education for All, suggested (p.19) that"The best predictor of learning achievement of children is the education andliteracy level of their parents,” and that "investments in adult education andchildren are, thus, investments in education of entire families.”
Unit Costs and their Determinants
Statistics on unit costs are an important guide to policymakers. Particularlyimportant are unit costs by level of education (i.e., preschool, primary ,secondary, and tertiary ), though sometimes statistics are also needed forparticular subjects (e.g., science or languages), for different streams (e.g.,

18 The Costs and Financing of Education
academic or technical), and for different parts of a country (e.g., differentprovinces).
Meanings and Examples
Most commonly in the present context, the term unit cost means the cost of aschool place occupied by a single student for one year (Coombs and Hallak1987, 51). However, this definition says nothing about attendance (i.e.,whether pupils actually occupy the spaces allocated to them). Nor does thedefinition say anything about the quality of teaching or learning. Pursuit ofqualitative dimensions might suggest a need to calculate the costs of changesin knowledge, skills and/or attitudes rather than mere provision of schoolplaces. Moreover some analyses focus on the unit costs per graduate, whichrequires inclusion of repetition and dropout rates in the calculation.
Figure 2 provides an example of the ways in which unit costs may beportrayed by giving data from Viet Nam. This particular figure is especiallyvaluable because it shows private costs as well as public ones (which are heredescribed as fiscal costs). The general progression in unit costs, frompreschool to tertiary, matches patterns in other countries. Among the striking
Figure 2: Annual Costs Per Student, by Level, Viet Nam, 1994(Dong '000)
Note: Data refer only to public institutions.
Source: World Bank 1997d, 68.
483 478
1649 1768 512 781
781 781
121 235
130
48 104
223
0
500
1,000
1,500
2,000
2,500
3,000
Preschool (169)
Primary (234)
Lower secondary
(458)
Upper secondary
(1095)
Vocational (1259)
Technical (2430)
Tertiary (2549)
Level/type of education and training (full economic costs in parentheses)
Fiscal costs Private costs
Education in Developing Asia 19
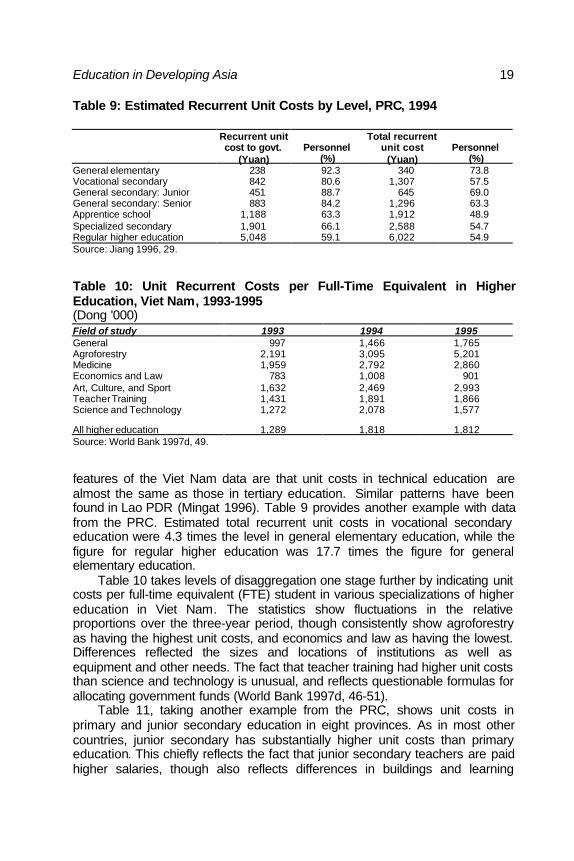
Table 9: Estimated Recurrent Unit Costs by Level, PRC, 1994
Recurrent unitcost to govt.
(Yuan)Personnel
(%)
Total recurrentunit cost
(Yuan)Personnel
(%)General elementary 238 92.3 340 73.8Vocational secondary 842 80.6 1,307 57.5General secondary: Junior 451 88.7 645 69.0General secondary: Senior 883 84.2 1,296 63.3Apprentice school 1,188 63.3 1,912 48.9Specialized secondary 1,901 66.1 2,588 54.7Regular higher education 5,048 59.1 6,022 54.9Source: Jiang 1996, 29.
Table 10: Unit Recurrent Costs per Full-Time Equivalent in HigherEducation, Viet Nam, 1993-1995(Dong '000)Field of study 1993 1994 1995General 997 1,466 1,765Agroforestry 2,191 3,095 5,201Medicine 1,959 2,792 2,860Economics and Law 783 1,008 901Art, Culture, and Sport 1,632 2,469 2,993Teacher Training 1,431 1,891 1,866Science and Technology 1,272 2,078 1,577
All higher education 1,289 1,818 1,812Source: World Bank 1997d, 49.
features of the Viet Nam data are that unit costs in technical education arealmost the same as those in tertiary education. Similar patterns have beenfound in Lao PDR (Mingat 1996). Table 9 provides another example with datafrom the PRC. Estimated total recurrent unit costs in vocational secondaryeducation were 4.3 times the level in general elementary education, while thefigure for regular higher education was 17.7 times the figure for generalelementary education.
Table 10 takes levels of disaggregation one stage further by indicating unitcosts per full-time equivalent (FTE) student in various specializations of highereducation in Viet Nam. The statistics show fluctuations in the relativeproportions over the three-year period, though consistently show agroforestryas having the highest unit costs, and economics and law as having the lowest.Differences reflected the sizes and locations of institutions as well asequipment and other needs. The fact that teacher training had higher unit coststhan science and technology is unusual, and reflects questionable formulas forallocating government funds (World Bank 1997d, 46-51). Table 11, taking another example from the PRC, shows unit costs inprimary and junior secondary education in eight provinces. As in most othercountries, junior secondary has substantially higher unit costs than primaryeducation. This chiefly reflects the fact that junior secondary teachers are paidhigher salaries, though also reflects differences in buildings and learning

20 The Costs and Financing of Education
Table 11: Unit Costs by Level and Province, PRC, 1995(Yuan)Province Primary Junior secondaryBeijing 1,015 1,923Shanghai 1,435 1,903Guangdong 704 1,236Zhejiang 679 970Sichuan 343 592Shaanxi 261 589Jiangxi 284 441Guizhou 186 385Source: Min 1997, 150.
materials. Even more striking are the interprovincial variations. Average unitcosts at the primary level in Beijing are over five times the costs in Guizhou.
Planners may also wish to know the unit costs of institutions of differenttypes at the same level. In Nepal, for example, unit recurrent costs ofgovernment-aided secondary schools in 1992 were NRs2,098 compared withNRs1,545 in community secondary schools and NRs6,008 in the private sector(World Bank 1994b, 58).
Goals, Determinants, and Manipulable Variables
An initial question for policymakers who have reviewed statistics such as thosepresented in Tables 9-11 is whether they should seek to hold unit costsconstant, decrease them, or increase them. Unit costs can also be describedas unit expenditures. The authorities in the PRC might consider, looking atTable 11, that expenditures in Guizhou Province should be raised rather thanlowered, in order to reduce regional inequalities. Much depends on thepolicymakers' dominant goals − and, of course, on available resources.
Further scrutiny of statistics such as those in Tables 9-11 would requiredistinction between recurrent and capital costs. Education remains a stronglylabor-intensive activity, especially at the lower levels. Despite efforts in somecontexts, only in unusual circumstances have teachers even partly beenreplaced by machines. Because of that, as illustrated by Table 9, theproportion of salaries in unit costs is typically very substantial. Capital costs, inthe form of buildings and equipment, tend to become more visible at higherlevels of education. The chief explanations for greater unit costs at higherlevels of education and in some specialties are that the teachers are paidmore, class sizes tend to be smaller, and buildings and equipment are moreelaborate, particularly in some specialties. In Lao PDR, for example, teachers'salaries formed 83.8 percent of public recurrent costs at primary level, but 80.6percent at junior secondary level, 35.5 percent in teacher education, 34.1percent in higher education, and only 28.7 percent in technical/vocationaleducation (Mingat 1996, 16).
These remarks already indicate some manipulable variables. Sinceteachers' salaries are generally the largest single item in education expendi-tures, they are a sensible place to begin analysis. In Singapore, teachers are
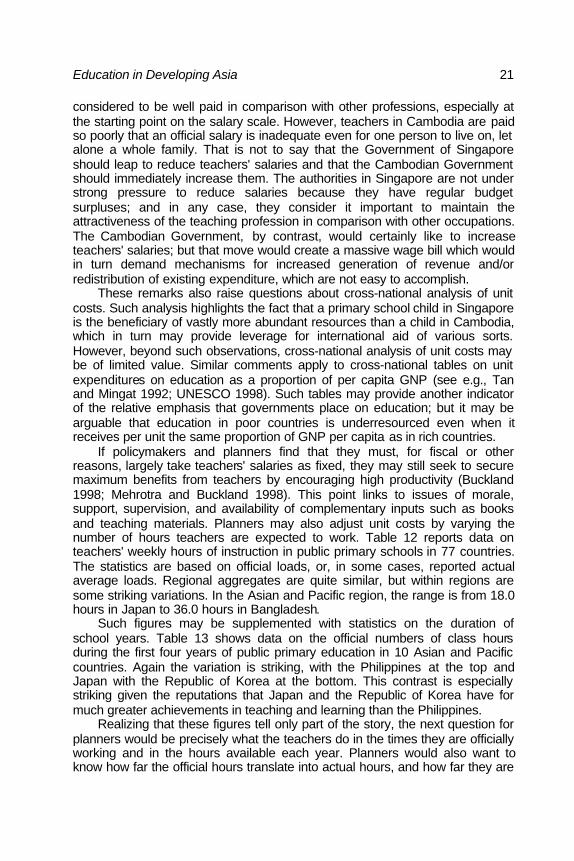
Education in Developing Asia 21
considered to be well paid in comparison with other professions, especially atthe starting point on the salary scale. However, teachers in Cambodia are paidso poorly that an official salary is inadequate even for one person to live on, letalone a whole family. That is not to say that the Government of Singaporeshould leap to reduce teachers' salaries and that the Cambodian Governmentshould immediately increase them. The authorities in Singapore are not understrong pressure to reduce salaries because they have regular budgetsurpluses; and in any case, they consider it important to maintain theattractiveness of the teaching profession in comparison with other occupations.The Cambodian Government, by contrast, would certainly like to increaseteachers' salaries; but that move would create a massive wage bill which wouldin turn demand mechanisms for increased generation of revenue and/orredistribution of existing expenditure, which are not easy to accomplish.
These remarks also raise questions about cross-national analysis of unitcosts. Such analysis highlights the fact that a primary school child in Singaporeis the beneficiary of vastly more abundant resources than a child in Cambodia,which in turn may provide leverage for international aid of various sorts.However, beyond such observations, cross-national analysis of unit costs maybe of limited value. Similar comments apply to cross-national tables on unitexpenditures on education as a proportion of per capita GNP (see e.g., Tanand Mingat 1992; UNESCO 1998). Such tables may provide another indicatorof the relative emphasis that governments place on education; but it may bearguable that education in poor countries is underresourced even when itreceives per unit the same proportion of GNP per capita as in rich countries.
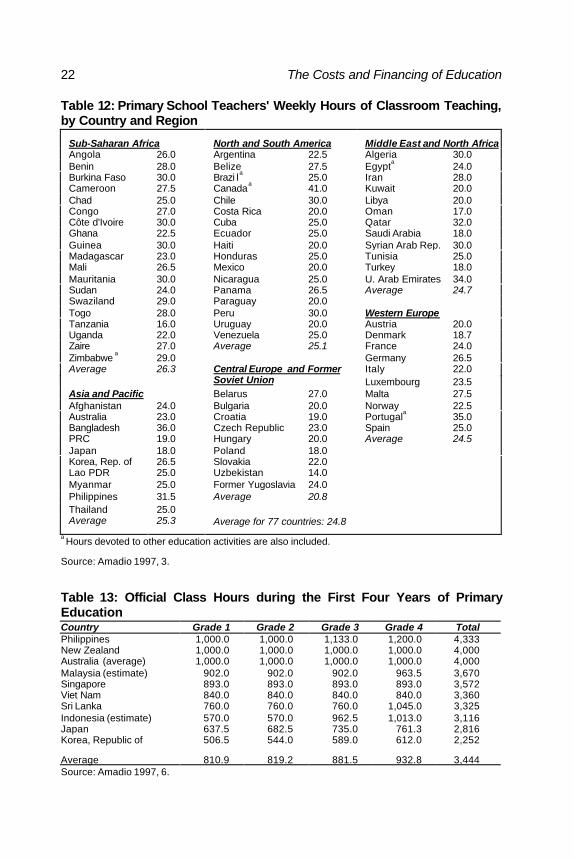
If policymakers and planners find that they must, for fiscal or otherreasons, largely take teachers' salaries as fixed, they may still seek to securemaximum benefits from teachers by encouraging high productivity (Buckland1998; Mehrotra and Buckland 1998). This point links to issues of morale,support, supervision, and availability of complementary inputs such as booksand teaching materials. Planners may also adjust unit costs by varying thenumber of hours teachers are expected to work. Table 12 reports data onteachers' weekly hours of instruction in public primary schools in 77 countries.The statistics are based on official loads, or, in some cases, reported actualaverage loads. Regional aggregates are quite similar, but within regions aresome striking variations. In the Asian and Pacific region, the range is from 18.0hours in Japan to 36.0 hours in Bangladesh.
Such figures may be supplemented with statistics on the duration ofschool years. Table 13 shows data on the official numbers of class hoursduring the first four years of public primary education in 10 Asian and Pacificcountries. Again the variation is striking, with the Philippines at the top andJapan with the Republic of Korea at the bottom. This contrast is especiallystriking given the reputations that Japan and the Republic of Korea have formuch greater achievements in teaching and learning than the Philippines.
Realizing that these figures tell only part of the story, the next question forplanners would be precisely what the teachers do in the times they are officiallyworking and in the hours available each year. Planners would also want toknow how far the official hours translate into actual hours, and how far they are
22 The Costs and Financing of Education
Table 12: Primary School Teachers' Weekly Hours of Classroom Teaching,by Country and Region
Sub-Saharan Africa North and South America Middle East and North AfricaAngola 26.0 Argentina 22.5 Algeria 30.0Benin 28.0 Belize 27.5 Egypt
a24.0
Burkina Faso 30.0 Brazi la
25.0 Iran 28.0Cameroon 27.5 Canada
a41.0 Kuwait 20.0
Chad 25.0 Chile 30.0 Libya 20.0Congo 27.0 Costa Rica 20.0 Oman 17.0Côte d'Ivoire 30.0 Cuba 25.0 Qatar 32.0Ghana 22.5 Ecuador 25.0 Saudi Arabia 18.0Guinea 30.0 Haiti 20.0 Syrian Arab Rep. 30.0Madagascar 23.0 Honduras 25.0 Tunisia 25.0Mali 26.5 Mexico 20.0 Turkey 18.0Mauritania 30.0 Nicaragua 25.0 U. Arab Emirates 34.0Sudan 24.0 Panama 26.5 Average 24.7Swaziland 29.0 Paraguay 20.0Togo 28.0 Peru 30.0 Western EuropeTanzania 16.0 Uruguay 20.0 Austria 20.0Uganda 22.0 Venezuela 25.0 Denmark 18.7Zaire 27.0 Average 25.1 France 24.0Zimbabwe
a29.0 Germany 26.5
Italy 22.0Average 26.3 Central Europe and FormerSoviet Union Luxembourg 23.5
Asia and Pacific Belarus 27.0 Malta 27.5Afghanistan 24.0 Bulgaria 20.0 Norway 22.5Australia 23.0 Croatia 19.0 Portugal
a35.0
Bangladesh 36.0 Czech Republic 23.0 Spain 25.0PRC 19.0 Hungary 20.0 Average 24.5Japan 18.0 Poland 18.0Korea, Rep. of 26.5 Slovakia 22.0Lao PDR 25.0 Uzbekistan 14.0Myanmar 25.0 Former Yugoslavia 24.0Philippines 31.5 Average 20.8Thailand 25.0Average 25.3 Average for 77 countries: 24.8
a Hours devoted to other education activities are also included.
Source: Amadio 1997, 3.
Table 13: Official Class Hours during the First Four Years of PrimaryEducationCountry Grade 1 Grade 2 Grade 3 Grade 4 TotalPhilippines 1,000.0 1,000.0 1,133.0 1,200.0 4,333New Zealand 1,000.0 1,000.0 1,000.0 1,000.0 4,000Australia (average) 1,000.0 1,000.0 1,000.0 1,000.0 4,000Malaysia (estimate) 902.0 902.0 902.0 963.5 3,670Singapore 893.0 893.0 893.0 893.0 3,572Viet Nam 840.0 840.0 840.0 840.0 3,360Sri Lanka 760.0 760.0 760.0 1,045.0 3,325Indonesia (estimate) 570.0 570.0 962.5 1,013.0 3,116Japan 637.5 682.5 735.0 761.3 2,816Korea, Republic of 506.5 544.0 589.0 612.0 2,252
Average 810.9 819.2 881.5 932.8 3,444Source: Amadio 1997, 6.
Education in Developing Asia 23
eroded by absenteeism and by noneducation activities. Some information onthese matters is available in some countries, though data have not beensystematically compiled in cross-national formats comparable to Table 12.Nevertheless, these observations make the point that planners have variablesthat can be manipulated.
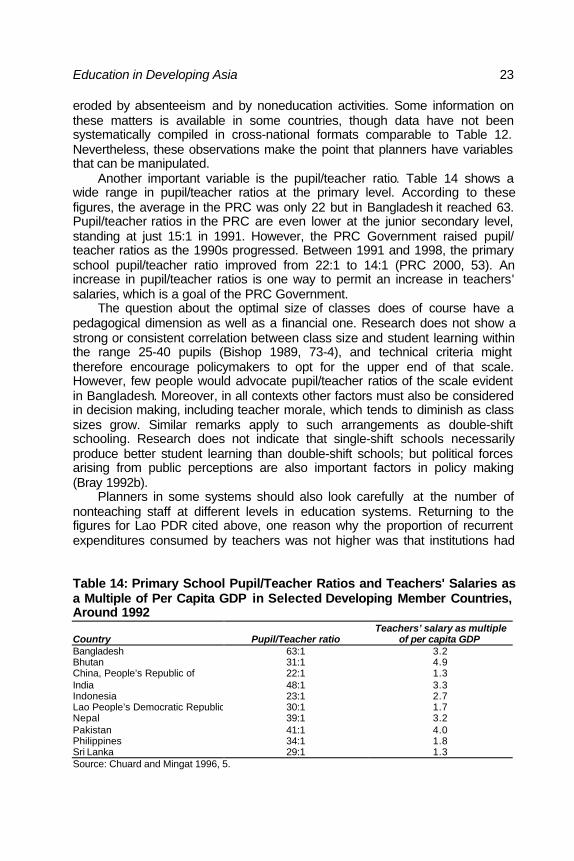
Another important variable is the pupil/teacher ratio. Table 14 shows awide range in pupil/teacher ratios at the primary level. According to thesefigures, the average in the PRC was only 22 but in Bangladesh it reached 63.Pupil/teacher ratios in the PRC are even lower at the junior secondary level,standing at just 15:1 in 1991. However, the PRC Government raised pupil/teacher ratios as the 1990s progressed. Between 1991 and 1998, the primaryschool pupil/teacher ratio improved from 22:1 to 14:1 (PRC 2000, 53). Anincrease in pupil/teacher ratios is one way to permit an increase in teachers'salaries, which is a goal of the PRC Government.
The question about the optimal size of classes does of course have apedagogical dimension as well as a financial one. Research does not show astrong or consistent correlation between class size and student learning withinthe range 25-40 pupils (Bishop 1989, 73-4), and technical criteria mighttherefore encourage policymakers to opt for the upper end of that scale.However, few people would advocate pupil/teacher ratios of the scale evidentin Bangladesh. Moreover, in all contexts other factors must also be consideredin decision making, including teacher morale, which tends to diminish as classsizes grow. Similar remarks apply to such arrangements as double-shiftschooling. Research does not indicate that single-shift schools necessarilyproduce better student learning than double-shift schools; but political forcesarising from public perceptions are also important factors in policy making(Bray 1992b).
Planners in some systems should also look carefully at the number ofnonteaching staff at different levels in education systems. Returning to thefigures for Lao PDR cited above, one reason why the proportion of recurrentexpenditures consumed by teachers was not higher was that institutions had
Table 14: Primary School Pupil/Teacher Ratios and Teachers' Salaries asa Multiple of Per Capita GDP in Selected Developing Member Countries,Around 1992
Country Pupil/Teacher ratioTeachers’ salary as multiple
of per capita GDPBangladesh 63:1 3.2Bhutan 31:1 4.9China, People’s Republic of 22:1 1.3India 48:1 3.3Indonesia 23:1 2.7Lao People’s Democratic Republic 30:1 1.7Nepal 39:1 3.2Pakistan 41:1 4.0Philippines 34:1 1.8Sri Lanka 29:1 1.3Source: Chuard and Mingat 1996, 5.

24 The Costs and Financing of Education
many nonteaching staff. At the primary level, they consumed only 9.0 percentof the public recurrent budget, but in technical/vocational education theyconsumed 13.8 percent, while corresponding figures for preschools and teachereducation were 16.4 and 35.5 percent (Mingat 1996, 16).
The chief reason for manipulating these and other variables should be tosecure for education systems the maximum efficiency in which optimal outputis gained from the available inputs. Other tools which planners can consider insuch a goal include operating multigrade teaching and biennial/triennial intakesfor small schools in remote areas, provision of boarding to make schoolslarger, and use of self-instructional materials for at least part of the curriculum(Windham 1988; Bishop 1989; Chapman 1993; Kumar 1995). Most of thesetools have been widely known for decades, and it might be thought that if theyhave not been applied already then little scope exists for using them now. Sucha remark would have some validity; but even a casual survey shows instancesin which proposals that previously fell on infertile ground have taken root whenreintroduced because the frameworks of decision making and implementationhave changed. In the centrally planned economies of the Soviet Union, forexample, cost analysis of the type that was routinely undertaken in capitalistsocieties was relatively rare. Deyoung and Balzhan (1997, 448), commentingon circumstances in Kazakhstan, highlight the value of an education sectorsurvey in the mid-1990s which was based on concepts that are commonplacein most other parts of the world but that were very different from the traditionsthat had prevailed locally:
Resource issues ... have been compounded in Kazakhstan by the fact thatthe costs of delivering well-coordinated and essential education servicesusing some criteria of system-wide efficiency were never determined hereor in most former Soviet Republics.
Even in countries that have undergone less dramatic transition, the factthat individuals, cultures, and school systems change means that existingtoolboxes may usefully be reviewed to see if tools can be found to improveefficiency. Taking the example of change in education systems, societies,which at one point in history aim to reach remote populations and get childreninto school by offering boarding places may find at a subsequent point inhistory that populations have grown, enrollment rates have risen, and largeboarding schools could usefully be replaced by smaller day schools which arecloser to pupils' homes.
Questions should also be raised about the cost-effectiveness of buildingdesigns. To many casual observers, the physical form of a school is the mostvisible and is therefore taken to be of great importance. However, studies ofthe effectiveness of teaching and learning indicate that once basic needs aresatisfied, further investment in construction is unlikely to repay strong dividendsin improved teaching and learning. The portfolios of education architects nowcontain many designs that can achieve clean, safe, bright, and well-ventilatedclassrooms at reasonable cost. Community decision making does not alwayslead to the best designs and to maximum cost-effectiveness; but experience in
Education in Developing Asia 25
many countries has shown that costs can be kept down by making good use oflocal materials and community inputs.
Two final remarks make a link back to the enrollment rates highlightedearlier. First, planners should in general assume that at the level of basiceducation, the unit costs of reaching the last few percent as enrollment ratesrise will be higher than the unit costs at lower enrollment rates . This is becauseof the additional costs incurred in reaching marginalized populations (Tsang1994). Such children may live in remote areas, be handicapped, or be simplyunwilling to attend school and thus require persuasion. Second, most Asiansystems of education are moving or have moved from mass primary to masssecondary education, and some are moving to mass tertiary education. Ingeneral, the financial burden of these moves becomes progressively steeperbecause the unit costs are greater at higher levels.
Dropout and Repetition Rates
When the focus shifts to the cost of producing graduates from segments ofschool systems, as opposed to the cost of providing a place for a student for asingle year, the significance of dropout and repetition rates comes into focus(Fiske 1998).
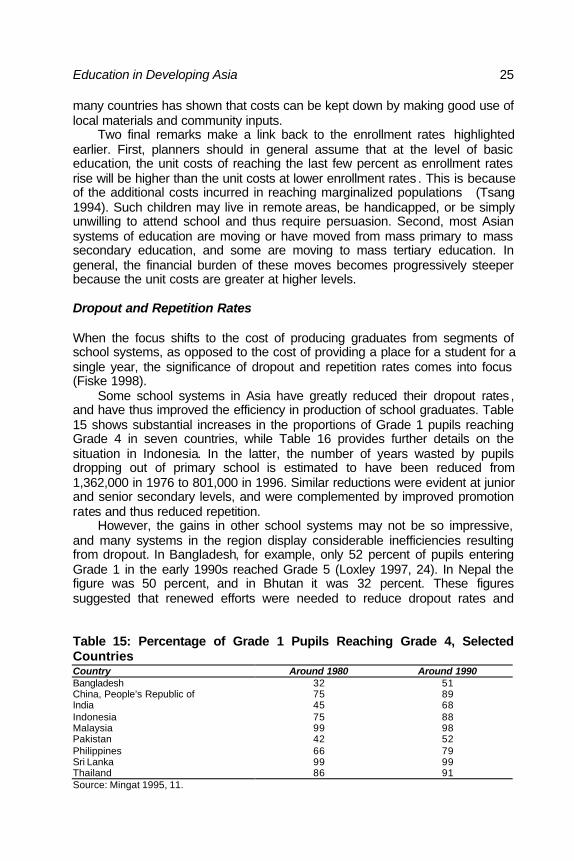
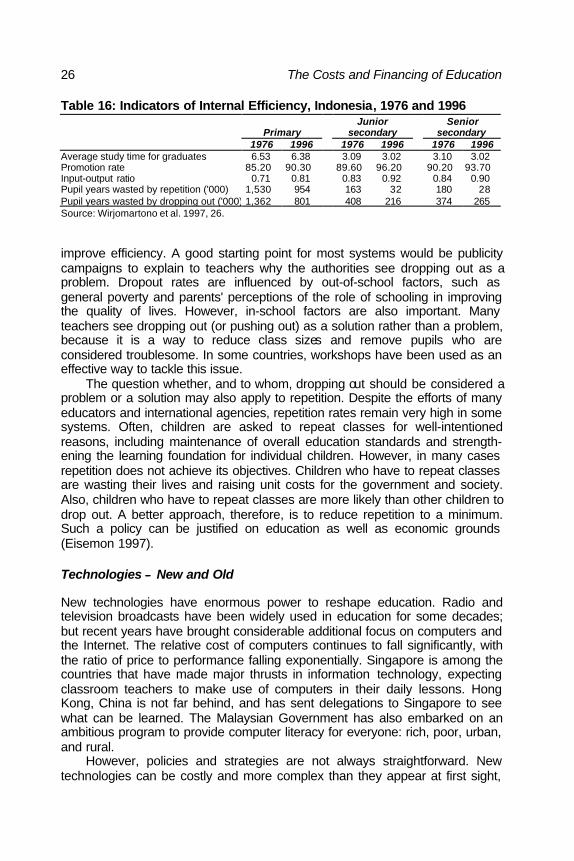
Some school systems in Asia have greatly reduced their dropout rates ,and have thus improved the efficiency in production of school graduates. Table15 shows substantial increases in the proportions of Grade 1 pupils reachingGrade 4 in seven countries, while Table 16 provides further details on thesituation in Indonesia. In the latter, the number of years wasted by pupilsdropping out of primary school is estimated to have been reduced from1,362,000 in 1976 to 801,000 in 1996. Similar reductions were evident at juniorand senior secondary levels, and were complemented by improved promotionrates and thus reduced repetition.
However, the gains in other school systems may not be so impressive,and many systems in the region display considerable inefficiencies resultingfrom dropout. In Bangladesh, for example, only 52 percent of pupils enteringGrade 1 in the early 1990s reached Grade 5 (Loxley 1997, 24). In Nepal thefigure was 50 percent, and in Bhutan it was 32 percent. These figuressuggested that renewed efforts were needed to reduce dropout rates and
Table 15: Percentage of Grade 1 Pupils Reaching Grade 4, SelectedCountriesCountry Around 1980 Around 1990Bangladesh 32 51China, People’s Republic of 75 89India 45 68Indonesia 75 88Malaysia 99 98Pakistan 42 52Philippines 66 79Sri Lanka 99 99Thailand 86 91Source: Mingat 1995, 11.
26 The Costs and Financing of Education
Table 16: Indicators of Internal Efficiency, Indonesia, 1976 and 1996
PrimaryJunior
secondarySenior
secondary1976 1996 1976 1996 1976 1996
Average study time for graduates 6.53 6.38 3.09 3.02 3.10 3.02Promotion rate 85.20 90.30 89.60 96.20 90.20 93.70Input-output ratio 0.71 0.81 0.83 0.92 0.84 0.90Pupil years wasted by repetition ('000) 1,530 954 163 32 180 28Pupil years wasted by dropping out ('000) 1,362 801 408 216 374 265Source: Wirjomartono et al. 1997, 26.
improve efficiency. A good starting point for most systems would be publicitycampaigns to explain to teachers why the authorities see dropping out as aproblem. Dropout rates are influenced by out-of-school factors, such asgeneral poverty and parents' perceptions of the role of schooling in improvingthe quality of lives. However, in-school factors are also important. Manyteachers see dropping out (or pushing out) as a solution rather than a problem,because it is a way to reduce class sizes and remove pupils who areconsidered troublesome. In some countries, workshops have been used as aneffective way to tackle this issue.
The question whether, and to whom, dropping out should be considered aproblem or a solution may also apply to repetition. Despite the efforts of manyeducators and international agencies, repetition rates remain very high in somesystems. Often, children are asked to repeat classes for well-intentionedreasons, including maintenance of overall education standards and strength-ening the learning foundation for individual children. However, in many casesrepetition does not achieve its objectives. Children who have to repeat classesare wasting their lives and raising unit costs for the government and society.Also, children who have to repeat classes are more likely than other children todrop out. A better approach, therefore, is to reduce repetition to a minimum.Such a policy can be justified on education as well as economic grounds(Eisemon 1997).
Technologies −− New and Old
New technologies have enormous power to reshape education. Radio andtelevision broadcasts have been widely used in education for some decades;but recent years have brought considerable additional focus on computers andthe Internet. The relative cost of computers continues to fall significantly, withthe ratio of price to performance falling exponentially. Singapore is among thecountries that have made major thrusts in information technology, expectingclassroom teachers to make use of computers in their daily lessons. HongKong, China is not far behind, and has sent delegations to Singapore to seewhat can be learned. The Malaysian Government has also embarked on anambitious program to provide computer literacy for everyone: rich, poor, urban,and rural.
However, policies and strategies are not always straightforward. Newtechnologies can be costly and more complex than they appear at first sight,
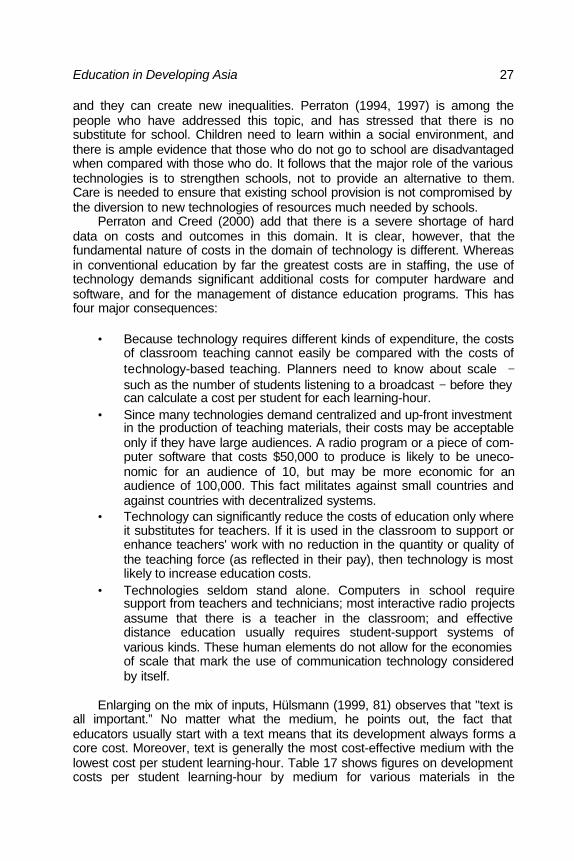
Education in Developing Asia 27
and they can create new inequalities. Perraton (1994, 1997) is among thepeople who have addressed this topic, and has stressed that there is nosubstitute for school. Children need to learn within a social environment, andthere is ample evidence that those who do not go to school are disadvantagedwhen compared with those who do. It follows that the major role of the varioustechnologies is to strengthen schools, not to provide an alternative to them.Care is needed to ensure that existing school provision is not compromised bythe diversion to new technologies of resources much needed by schools.
Perraton and Creed (2000) add that there is a severe shortage of harddata on costs and outcomes in this domain. It is clear, however, that thefundamental nature of costs in the domain of technology is different. Whereasin conventional education by far the greatest costs are in staffing, the use oftechnology demands significant additional costs for computer hardware andsoftware, and for the management of distance education programs. This hasfour major consequences:
• Because technology requires different kinds of expenditure, the costsof classroom teaching cannot easily be compared with the costs oftechnology-based teaching. Planners need to know about scale −such as the number of students listening to a broadcast − before theycan calculate a cost per student for each learning-hour.
• Since many technologies demand centralized and up-front investmentin the production of teaching materials, their costs may be acceptableonly if they have large audiences. A radio program or a piece of com-puter software that costs $50,000 to produce is likely to be uneco-nomic for an audience of 10, but may be more economic for anaudience of 100,000. This fact militates against small countries andagainst countries with decentralized systems.
• Technology can significantly reduce the costs of education only whereit substitutes for teachers. If it is used in the classroom to support orenhance teachers' work with no reduction in the quantity or quality ofthe teaching force (as reflected in their pay), then technology is mostlikely to increase education costs.
• Technologies seldom stand alone. Computers in school requiresupport from teachers and technicians; most interactive radio projectsassume that there is a teacher in the classroom; and effectivedistance education usually requires student-support systems ofvarious kinds. These human elements do not allow for the economiesof scale that mark the use of communication technology consideredby itself.
Enlarging on the mix of inputs, Hülsmann (1999, 81) observes that "text isall important.” No matter what the medium, he points out, the fact thateducators usually start with a text means that its development always forms acore cost. Moreover, text is generally the most cost-effective medium with thelowest cost per student learning-hour. Table 17 shows figures on developmentcosts per student learning-hour by medium for various materials in the
28 The Costs and Financing of Education
Table 17: Development Costs of Materials per Student Learning-Hour, byMedium, United Kingdom, 1996
MediumCost per student learning-hour (£)
Ratio to print cost
Print 500 1Radio 27,000 x50
15,000 x30Television 125,000 x250
90,000 x180Video 84,000 x170
18,000 x36Audio 17,000 x34CD-ROM 20,000 x40Source: Hülsmann 1999, 81.
United Kingdom. Video and audio cassettes have considerably higherdevelopment costs, and have often been treated by course developers as add-ons that increase the interest and attractiveness of courses and distinguishthem from simple correspondence courses. The development costs of text arethe same whether presented in print or on screen, so long as the text is not re-edited in hypertext. If the text is simple, with no further facilities such as searchcapacities, both learners and providers tend to prefer the printed format. Theeffectiveness of providing enhancements to text depends on the learningobjectives. Increased interactivity increases demand on student time so that,for example, hypertext formats are not always seen as an advantage tostudents and may also disorient them.
Perraton and Creed (2000) add the point that primary education in mostcountries, and particularly poor ones, is already a low-cost activity. Because ofthis, few technology-based projects can be justified on the grounds of cost-reduction. Indeed, most of the dramatic stories about widening access in poorcountries rely on low technology. Box 3 mentioned the nonformal programsoperated by the Bangladesh Rural Advancement Committee (BRAC), which isone widely noted example of a substantial increase in the supply of basiceducation. Other oft-cited cases are the “escuela nueva” in Colombia and theEDUCO scheme in El Salvador (Rugh and Bossert 1998; Sawada 1999).These programs have relied on community partnership and alternativemanagement structures rather than on high technology.
Nevertheless, Potashnik and Adkins (1996, 2) argue that pilot initiativescan and should be embarked upon, even in societies with too few textbooksand inadequate sanitation facilities. Their assertion is that the introduction ofinformation and communications technology should not wait until a country hasreached some predetermined state of economic or education development:
Even in countries that do not believe in the cost-effectiveness of infor-mation technology as a tool for mass education, it is important that theybegin acquiring experience using this technology for educational pur-poses. Otherwise, educators in developing countries will be marginalizedin the international dialogue in education. Short-term concerns

Education in Developing Asia 29
for equity at the national level must be balanced by longer-term concernsfor equity at the international level.
Moreover, at secondary and tertiary levels of education, unit costs ofconventional education are usually considerably greater than at the primarylevel. This means that new technologies may be attractive as avenues toalternative modes of delivery. Like their counterparts in other regions, manyAsian tertiary institutions have made increasing use of distance learning asupplement to, or a replacement for, face-to-face teaching. Since the early1980s, distance education has expanded rapidly in Bangladesh; PRC; HongKong, China; India; Indonesia; Japan; Republic of Korea; Pakistan; Philippines;Sri Lanka; Thailand; and Viet Nam (ADB 1987, 1990, 1997c; Dhanarajan 1996;Wong 1993). Eight of the 18 autonomous distance education universities listedby Moore (1992) were located in Asia. Three of them were highlighted as beingamong the largest in the world, namely the Indira Gandhi National OpenUniversity founded in India in 1985, the Sukhothai Thammathirat OpenUniversity founded in Thailand in 1978, and the Allama Iqbal Open Universityfounded in Pakistan in 1974. In addition, the PRC has a whole system of radioand television universities, numbering 45 in 1997/98 (Ding 1999, 182). Smallerin absolute scale, but nevertheless of considerable significance, is a distanceeducation system operated by the University of the South Pacific for its 12member states.
Table 18 presents some comparative figures on unit costs in distance
Box 3: Internal Inefficiency in Education Systems −− Lessons fromBangladesh
Many education systems in Asia have low rates of internal efficiency. In Bangla-desh, production of a secondary school graduate in theory requires 10 suc-cessive years of schooling. A World Bank study (1996, 6) estimated that ingovernment schools this should require a total cost of Tk14,860. However, highdropout and repetition push the actual investment per graduate to 21.3 years anda cost of Tk34,577. This is equivalent to a waste per graduate of Tk19,717 or 132percent higher than the standard cycle cost. Thus for every taka spent on primaryand secondary education, another Tk1.32 were wasted due to system ineffi-ciency.
Dropout rates also substantially raised the unit costs of graduates from gov-ernment-run nonformal programs. During the early 1990s, in the Integrated Non-Formal Education Program (INFEP) the dropout rate averaged 20 percent in two-year programs for children and adolescents, 20 percent for the one-year programfor adults, and 5 percent for one-year preprimary programs. However, thedropout rate in the three-year programs for adolescents offered by the nongov-ernment Bangladesh Rural Advancement Committee (BRAC) averaged just 5percent, and was only 2 percent in the children's program. The sharp differencebetween government and nongovernment schemes appeared to be partly relatedto differences in teacher training and supervision. BRAC teachers had moretraining, and their supervisors were in the field more often. In some cases it isworth investing more in education systems to improve their efficiency.

30 The Costs and Financing of Education
Table 18: Distance Universities in Asia: Cost and Effectiveness DataCost per student
Country/Institution Type of costDistance
(1)Conventional
(2)(1)/(2)(%) Measure used
Rate(%)
Thailand:Sukhothai ThammathiratOpen University
Average costper student
B7,023 B49,957 14.1 Percent dropouts 50.0
Pakistan:Allama Iqbal OpenUniversity
Average costper student,1988 estimate
PRs4,585 PRs20,960 21.9 Mean rate ofdropouts for allcourses
42.5
China Radio andTelevision University
Average costper student,1981
Y1,000 Y2,000 50.0 Percent graduatedin 1982 from 1979enrollees
69.0
Korea Air andCorrespondenceUniversity
Total cost perstudent peryear, 1981
$125 $1,250 10.0 Percent dropoutsafter first year ofstudy
50.0
Source: World Bank 1994a, 34.
education and conventional methods for four Asian institutions. In all cases, theunit costs in distance education appear substantially lower than those inconventional institutions. However, these costs are per student rather than pergraduate. Dropout rates are generally higher in distance education programs;though, as noted by Hülsmann (1999, 75), many students in distanceeducation are chiefly concerned with the content of specific modules and donot aim to earn degrees.
While policymakers should take seriously the opportunities offered by newtechnologies and by distance education, they should not be dazzled by them.Again, the words of caution expressed by Perraton and Creed (2000) about thepaucity of empirical research on costs and effects should be borne in mind.Needed research would include examination of the relative qualities of the twomodes of delivery, and of the labor market outcomes of graduates fromdistance-education programs. Dhand (1996) has highlighted seriousdeficiencies in the effectiveness of B.Ed. degrees offered by distanceeducation in India, and it is likely that many of Dhand's remarks find aresonance in other contexts. Moreover, although some technologies appear toreduce unit costs, this is partly because costs have been shifted. Whereteaching materials are available on the Internet , the cost of computer time,telephone charges, print, collating, and paper fall on the receiving institution.As conventional printing allows major economies of scale, even after allowingfor distribution, the absolute costs of making print material available to any oneschool may be increased by Internet use. Because schools vary in their wealth,decentralizing expenditure in this way is likely to decrease rather than increaseequity between them (Perraton and Creed 2000, 78).
Further, technologies require humans to operate them, which in turndemands investment in training to secure skills and change attitudes. There islittle reason to assume that these costs will decline: indeed, the growingcomplexity of many technologies may mean that they will increase. Also,
Education in Developing Asia 31
human investments are more costly, and somewhat less reliable, than theinvestments in machines. Thus in many settings the old technologies ofexercise books, pencils, and textbooks remain the most important and cost-effective domains for investment, especially at the level of basic education.
Cost Sharing in Education
Changing Frameworks for Policy
The 1980s and 1990s brought a worldwide change of emphasis in the matterof cost sharing and cost recovery in education. This change of emphasis hasaffected Asia as well as other regions. Policy changes have not been evident inall countries to an equal extent; but the overall thrust of trends is unmistakable.
During the first four decades following the end of the Second World War,the dominant feature of international pronouncements was that publiceducation should be free of charge, especially at the level of basic education.Article 26 of the 1948 United Nations Declaration of Human Rights stated that:
Everyone has the right to education. Education shall be free, at least in theelementary and fundamental stages.
The 1959 Declaration on the Rights of the Child stated that:
The child is entitled to receive education, which shall be free and compul-sory, at least in the early stages.
And Article 13 of the 1966 International Covenant on Economic, Social andCultural Rights declared that:
(a) Primary education shall be compulsory and available free to all.(b) Secondary education in its different forms, including technical and
vocational secondary education, shall be made generally availableand accessible to all by every appropriate means, and in particular bythe progressive introduction of free education.
(c) Higher education shall be made equally accessible to all, on the basisof capacity, by every appropriate means, and in particular by the pro-gressive introduction of free education.
The chief justification was that education was a major route for social mobility,and the possibility of poor people being excluded from education by fees wasconsidered inequitable.
However, Article 28 of the 1989 Convention on the Rights of the Childbrought a subtle shift. The Convention indicated that signatory states would:
(a) Make primary education compulsory and available free to all;
32 The Costs and Financing of Education
(b) Encourage the development of different forms of secondary education... make them available and accessible to every child, and take ap-propriate measures such as the introduction of free education andoffering of financial assistance in the case of need;
(c) Make higher education accessible to all on the basis of capacity byevery appropriate means.
Particularly obvious is the shift of philosophy concerning point (c). Education isstill generally accepted as a public good that can benefit societies as a wholeas well as individuals (Levin 1987; Solmon and Fagnano 1995), but especiallyin higher education, a general worldwide swing of opinion now favors fees,supported as necessary by loans and other mechanisms to protect the poor(Ziderman and Albrecht 1995; Tilak 1997a, 2000; Task Force on HigherEducation and Society 2000).
Arguments in favor of fees at the tertiary level are partly based on thesubstantial private benefits that accrue to tertiary graduates and on the factthat tertiary education has high unit costs that cannot easily be borne solely bygovernments. Arguments favoring fees are also based on concern for equity.Among tertiary enrollments, students from rich families always form a muchlarger proportion than students from poor families, and it is widely consideredunreasonable to subsidize rich families when that measure will reduce theresources available for allocation to the poor. It is of course recognized thatstudents from poor families also study in tertiary institutions, and that propor-tions of such students should be increased. However, since tertiary graduatesin general receive greatly enhanced lifetime earnings, it is argued that even thepoor can finance their studies through loans that can later be repaid.
The cost and equity arguments are to some extent valid in secondaryeducation, and can also be used to justify cost recovery at that level. However,unit costs to government are lower at the secondary level, and enrollment ratesacross socioeconomic groups are usually more balanced. These particulararguments are therefore less powerful at the secondary level.
At the primary level, the arguments are even more difficult to sustain. Unitcosts are generally lowest at this level. In countries with low enrollment rates,school populations are likely to contain more children from middle-income andrich groups than from poor groups; but since all governments claim to wish toattract the poor to primary school, they are unwilling to discourage enrollmentsthrough imposition of fees. Moreover, in systems in which enrollmentsapproach universality, fee-free education is likely to give greater governmentresources to poor families than to rich ones, simply because poor families arelikely to have larger numbers of children than rich families. In addition,evidence exists from some settings (see e.g., Behrman and Knowles 1999)that where fees are imposed, they particularly discourage the schoolattendance of girls.
Political Forces and Budget Constraints
The above arguments would seem to favor charging fees for tertiary educationto permit the redistribution of resources to the poor. One way to serve the poor
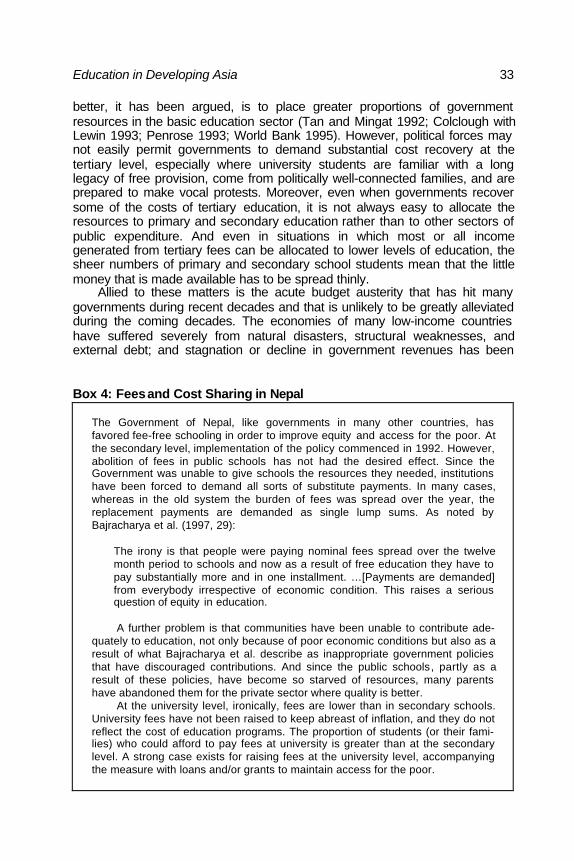
Education in Developing Asia 33
better, it has been argued, is to place greater proportions of governmentresources in the basic education sector (Tan and Mingat 1992; Colclough withLewin 1993; Penrose 1993; World Bank 1995). However, political forces maynot easily permit governments to demand substantial cost recovery at thetertiary level, especially where university students are familiar with a longlegacy of free provision, come from politically well-connected families, and areprepared to make vocal protests. Moreover, even when governments recoversome of the costs of tertiary education, it is not always easy to allocate theresources to primary and secondary education rather than to other sectors ofpublic expenditure. And even in situations in which most or all incomegenerated from tertiary fees can be allocated to lower levels of education, thesheer numbers of primary and secondary school students mean that the littlemoney that is made available has to be spread thinly.
Allied to these matters is the acute budget austerity that has hit manygovernments during recent decades and that is unlikely to be greatly alleviatedduring the coming decades. The economies of many low-income countrieshave suffered severely from natural disasters, structural weaknesses, andexternal debt; and stagnation or decline in government revenues has been
Box 4: Fees and Cost Sharing in Nepal
The Government of Nepal, like governments in many other countries, hasfavored fee-free schooling in order to improve equity and access for the poor. Atthe secondary level, implementation of the policy commenced in 1992. However,abolition of fees in public schools has not had the desired effect. Since theGovernment was unable to give schools the resources they needed, institutionshave been forced to demand all sorts of substitute payments. In many cases,whereas in the old system the burden of fees was spread over the year, thereplacement payments are demanded as single lump sums. As noted byBajracharya et al. (1997, 29):
The irony is that people were paying nominal fees spread over the twelvemonth period to schools and now as a result of free education they have topay substantially more and in one installment. …[Payments are demanded]from everybody irrespective of economic condition. This raises a seriousquestion of equity in education.
A further problem is that communities have been unable to contribute ade-quately to education, not only because of poor economic conditions but also as aresult of what Bajracharya et al. describe as inappropriate government policiesthat have discouraged contributions. And since the public schools, partly as aresult of these policies, have become so starved of resources, many parentshave abandoned them for the private sector where quality is better.
At the university level, ironically, fees are lower than in secondary schools.University fees have not been raised to keep abreast of inflation, and they do notreflect the cost of education programs. The proportion of students (or their fami-lies) who could afford to pay fees at university is greater than at the secondarylevel. A strong case exists for raising fees at the university level, accompanyingthe measure with loans and/or grants to maintain access for the poor.
34 The Costs and Financing of Education
accompanied by continued rapid population growth. The last decade hasbrought particularly severe economic difficulties to the former and remainingsocialist states, but pressures have also been heavy in many capitalistsocieties. The result of these forces is that although most governments wouldlike to be able to provide fee-free primary and secondary education − andsome even enshrine this in their Constitutions − the practical realities of makingends meet require at least some contribution from parents and communities.
Reflecting these realities was the fact that the 1990 World Declaration onEducation for All did not include a statement that schooling should be free ofcharge. Instead, the Final Report of the Conference (WCEFA 1990a, 31)included open discussion of fees ; and Article 7 of the Declaration itself(WCEFA 1990b, 7) stressed the importance of partnerships:
National, regional, and local education authorities have a unique obligationto provide basic education for all, but they cannot be expected to supplyevery human, financial or organizational requirement for this task. Newand revitalized partnerships at all levels will be necessary... [including]partnerships between government and nongovernment organizations, theprivate sector, local communities, religious groups, and families.
A subsequent meeting convened by the United Nations Economic Commissionfor Africa (1997, 2) emphasized that cost sharing in the form of user chargesshould be considered only after a thorough examination of other options forfinancing social services, but nevertheless countenanced cost sharing at alllevels of education. In a related vein, the World Bank (1999, 19) has stated that"In principle, fees and other contributions paid by nonpoor beneficiaries couldfree up public resources for targeting to the poor.”
Forms of Cost Sharing
The most obvious form of cost sharing is in fees (sometimes called levies orcontributions) paid by the consumers of education services. Fees may bedetermined at the government level, which is particularly common in tertiaryeducation, or at the school level.
Some education institutions also gain income from factories, businesses,and other enterprises. This was especially common in communist societiesduring the period of central planning, when factories were seen as part of thesocial fabric of their localities. The advent of market economies has requiredenterprises to pay more attention to profits, and in many instances reducedtheir willingness to contribute to schools. However, even in long-standingcapitalist societies examples of enterprises contributing to schools may easilybe found. Martin (1996) gave examples of corporations in the Philippines thathave become part of an adopt-a-school program. In Manila, three elementaryand two secondary schools have benefited, receiving inputs from an oil refinery,a match manufacturer, a detergent company, and a large multinationalhamburger outlet. In Singapore, banks, supermarkets and other companies

Education in Developing Asia 35
have donated cash and goods to schools, and have been able to claim taxrelief on these donations from the Government.
A third form of cost sharing may involve communities. Such communitiesmay be of many kinds, including ones based on geographic proximity, religion,ethnicity, and race. In several countries of the region, community financingreaches significant levels. For example:
• In Bhutan in 1998, 115 community primary schools operated inparallel with 128 fully government primary schools and 42 governmentjunior high schools with primary sections (Bhutan 1999, 25).
• In the PRC in 1994, 32.4 percent of primary teachers, and 7.4 percentof lower secondary teachers, were “minban” personnel, most of whomwere employed by collectives and village communities (PRC 2000,55).
• In Bangladesh, government primary schools constituted only 48.7percent of all formal primary schools in 1993. Nongovernmentschools, of which the majority were operated by villages and othercommunities, and some of which were not registered with the Gov-ernment, formed 22.2 percent; and the remainder were Islamicmadrasahs (World Bank 1996, 29).
• In Nepal, 18 percent of secondary schools in 1991 were operated bycommunities with little or no support from the Government (WorldBank 1994b, 2, 4).
Linking back to the point about religious diversity made at the beginning ofthis booklet, religious bodies in the Asian and Pacific region are involved ineducation to greatly differing extents. Islamic communities are prominentsponsors of schools not only in Bangladesh but also in Indonesia and Pakistan,while Christian communities are prominent sponsors in such countries as thePhilippines and Vanuatu. Buddhist, Hindu, and other religious communitiesalso play major roles in some settings.
When it works well, community financing can spread the burden ofresourcing education so that it does not rest solely with either governments orparents, while community financing can also promote local interest in schools.However, governments commonly view community financing with ambivalencebecause it can also exacerbate regional and social inequalities, and does notalways operate efficiently (Bray 1996b; Bray with Lillis 1988). Partly for thesereasons, the PRC Government aims to phase out community employment ofteachers. Between 1994 and 1998 the number of community-employedteachers was reduced significantly, though the reduction was offset in someparts of the country by an increased number of substitute teachers employedon comparable terms (PRC 2000, 56). Moreover, in other systems commu-nities have been given greater rein than before. In Cambodia, for example,communities used to be prohibited from employing their own teachers, but thishas been permitted since 1991.

36 The Costs and Financing of Education
Alternatives to Cost Sharing
The chief alternative to cost sharing is a system of taxation that generatessufficient revenue for the government to pay for services. Of course even insuch a system, society, which includes the consumers of services, stillultimately pays for the costs incurred; but the payment is indirect rather thandirect.
Table 19 provides some figures on the scale of central government taxand nontax revenues in selected countries. The fact that it shows figures onlyfor central governments is a weakness; but the table is nevertheless useful. Inthis sample of countries, the average of both tax and nontax revenue formed alarger share of GDP in 1995 than in 1980. However, the capacity and/or
Table 19: Central Government Revenues as a Percentage of GDP, SelectedDeveloping Member Countries
Tax revenue Nontax revenue Total revenueCountry 1980 1995 1980 1995 1980 1995Bangladesh 7.7 2.9 10.6 China, People’s Republic of 5.7 4.6 10.3Indonesia 20.2 16.4 1.8 6.2 22.0 22.6Korea, Republic of 15.3 17.7 8.0 6.5 23.3 24.2Malaysia 23.4 20.6 4.4 6.6 27.8 27.2Mongolia 20.3 5.0 25.3Nepal 6.6 9.1 2.9 4.3 9.5 13.4Pakistan 13.3 15.3 5.5 7.2 18.8 22.5Papua New Guinea 20.5 18.9 2.8 2.3 23.3 21.2Philippines 12.5 16.0 5.9 4.9 18.4 20.9Singapore 17.5 17.2 4.0 4.6 21.5 21.8Sri Lanka 19.1 18.0 5.4 10.8 24.5 28.8Thailand 13.2 17.1 6.6 7.4 19.8 24.5
Average 15.4 16.0 4.6 5.9 20.0 21.9 Data not available.Note: Figures in italics are for years other than that specified.
Source: World Bank 1997e, 240-1.
Table 20: Regional Breakdown of Taxation Revenue by Type of Tax(percentage of GDP)CountryType/Region
Average GNPper capita ($)
Totaltaxes
Incometaxes
Domestictaxes
Foreigntaxes
Socialsecurity
Wealth &property Other
Industrialized 13,477 31.2 11.0 9.4 0.7 8.9 1.1 0.1Developing 1,241 18.2 5.5 5.2 5.1 1.3 0.5 0.5Africa 621 19.5 6.7 4.8 6.8 0.4 0.4 0.4Asia 743 14.8 4.5 4.5 5.5 0.0 0.2 0.2Europe 3,361 21.9 5.8 6.9 2.8 5.1 1.1 1.1Middle East 2,339 14.7 4.8 2.3 4.2 1.2 1.5 1.5Notes: Figures are weighted averages for the three years closest to 1987 for which data wereavailable. Income taxes include individual and corporate taxes. Domestic taxes include general salestaxes and excises. Foreign taxes include import and export duties.
Source: Burgess 1997, 316-7.
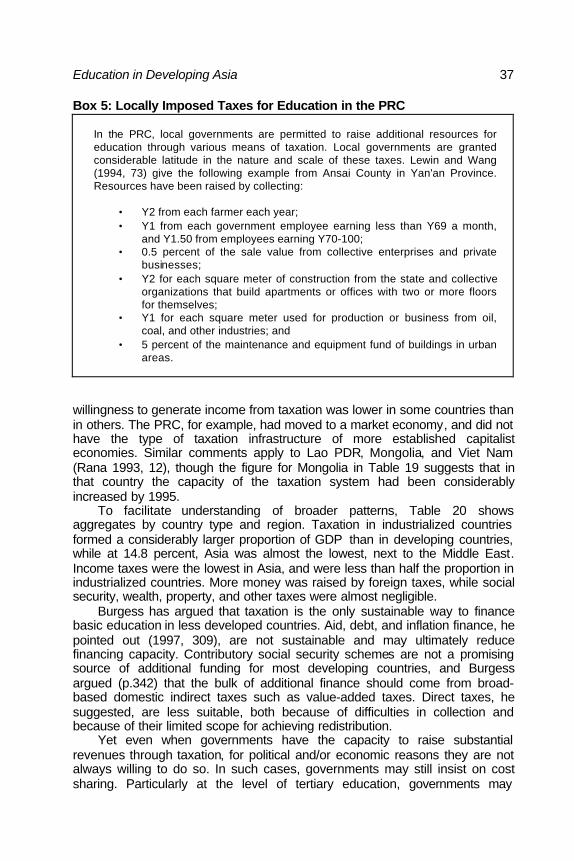
Education in Developing Asia 37
Box 5: Locally Imposed Taxes for Education in the PRC
In the PRC, local governments are permitted to raise additional resources foreducation through various means of taxation. Local governments are grantedconsiderable latitude in the nature and scale of these taxes. Lewin and Wang(1994, 73) give the following example from Ansai County in Yan'an Province.Resources have been raised by collecting:
• Y2 from each farmer each year;• Y1 from each government employee earning less than Y69 a month,
and Y1.50 from employees earning Y70-100;• 0.5 percent of the sale value from collective enterprises and private
businesses;• Y2 for each square meter of construction from the state and collective
organizations that build apartments or offices with two or more floorsfor themselves;
• Y1 for each square meter used for production or business from oil,coal, and other industries; and
• 5 percent of the maintenance and equipment fund of buildings in urbanareas.
willingness to generate income from taxation was lower in some countries thanin others. The PRC, for example, had moved to a market economy, and did nothave the type of taxation infrastructure of more established capitalisteconomies. Similar comments apply to Lao PDR, Mongolia, and Viet Nam(Rana 1993, 12), though the figure for Mongolia in Table 19 suggests that inthat country the capacity of the taxation system had been considerablyincreased by 1995.
To facilitate understanding of broader patterns, Table 20 showsaggregates by country type and region. Taxation in industrialized countriesformed a considerably larger proportion of GDP than in developing countries,while at 14.8 percent, Asia was almost the lowest, next to the Middle East.Income taxes were the lowest in Asia, and were less than half the proportion inindustrialized countries. More money was raised by foreign taxes, while socialsecurity, wealth, property, and other taxes were almost negligible.
Burgess has argued that taxation is the only sustainable way to financebasic education in less developed countries. Aid, debt, and inflation finance, hepointed out (1997, 309), are not sustainable and may ultimately reducefinancing capacity. Contributory social security schemes are not a promisingsource of additional funding for most developing countries, and Burgessargued (p.342) that the bulk of additional finance should come from broad-based domestic indirect taxes such as value-added taxes. Direct taxes, hesuggested, are less suitable, both because of difficulties in collection andbecause of their limited scope for achieving redistribution.
Yet even when governments have the capacity to raise substantialrevenues through taxation, for political and/or economic reasons they are notalways willing to do so. In such cases, governments may still insist on costsharing. Particularly at the level of tertiary education, governments may

38 The Costs and Financing of Education
consider it appropriate for users to pay directly for at least some of the costs oftheir studies. They may also find that individuals are more willing to do thisthan to countenance general increases in taxation.
A compromise policy, which at least allows taxpayers to know preciselywhere their money is going, is to impose taxes designated specifically for theeducation sector. This is common practice in the PRC, where many localgovernments have taxed enterprises either on their total volume of business oron their profits (Lewin and Wang 1994, 29). Local governments may also raiserevenue from farmers, government employees, and owners of buildings (Box5).
Cost Recovery and Student Support in Tertiary Education
Fees
In 1984, the World Bank presented statistics on recurrent expenditures metfrom tuition fees in different countries. It indicated that when the document waswritten, in only 20 countries, areas, or provinces of the world did tuition feesaccount for over 10 percent of recurrent expenditures (World Bank 1994a, 41).The scale of fees was not related to the incomes of countries, but there wasvariation across regions. Sub-Saharan Africa, North Africa, the Middle East,and Eastern Europe had little or no tradition of cost recovery in public highereducation. However, public-institution fees exceeded 10 percent of recurrentexpenditures in one out of five Latin American countries and in half of theAsian countries in the sample.
Table 21: Sources of Recurrent Income of Selected Indian Universities,1989/90-1991/92(percent)
InstitutionGovt.
grants FeesPrintingPress Farm Loans
Endow-ments Misc. Total
Central UniversitiesAligarh Muslim 97.4 1.1 0.0 1.0 0.2 0.0 0.3 100.0Banaras Hindu 89.4 0.8 0.6 7.2 0.0 0.4 1.6 100.0Hyderabad 94.7 1.9 0.0 0.7 0.0 0.0 2.6 100.0Jawaharlal Nehru 92.7 1.0 1.0 2.0 0.7 0.0 2.6 100.0Pondicherry 86.7 8.3 0.5 0.3 0.0 0.0 4.1 100.0Viswa Bharati 97.9 0.5 0.2 0.7 0.0 0.0 0.7 100.0Average 93.2 1.2 0.4 3.7 0.1 0.1 1.3 100.0
State UniversitiesBombay 11.5 39.0 28.3 2.2 4.1 0.0 15.1 100.0Calcutta 91.2 7.5 0.0 0.1 0.0 0.3 0.8 100.0Karnataka 53.5 5.5 1.8 0.1 12.7 15.1 11.3 100.0Kerala 58.3 30.1 4.5 1.2 1.9 0.0 4.0 100.0Madras 15.7 46.8 1.0 0.2 4.5 0.4 31.4 100.0Mohanlal Sukhadia 91.3 8.1 0.0 0.3 0.0 0.0 0.2 100.0Utkal 59.2 22.1 0.0 0.5 2.2 0.7 15.3 100.0Average 54.3 21.2 5.3 0.6 4.3 5.3 9.0 100.0
Source: Tilak 1997b, 11.

Education in Developing Asia 39
For analysis of some countries, disaggregation of national averages isnecessary. Table 21 shows different fee incomes in selected universities inIndia. Fee incomes in the sample of central universities averaged below 2percent of total income, but in state universities they averaged 21.2 percent.Among the state universities shown, the range was from 8.1 to 46.7 percent.
As the 1990s progressed, in some parts of Asia fees increased further. InHong Kong, China, where the authorities had imposed uniform fees across allpublic institutions, they decided in 1991 to raise fees from 12 percent ofrecurrent costs (which was already a substantial increase from the situation inthe mid-1980s) to 18 percent in 1997. Fees have also greatly increased in thePRC. Many institutions have admitted private (self-sponsored) students athigher fees than students paid for by the state, and in 1995 the average fee inmany institutions was between 25 and 30 percent of recurrent costs (Zhang1997). The Government sought to standardize the situation, setting a guidelinethat in 1997 fees should meet 20 percent of recurrent costs (World Bank1997a, 47). In Singapore, differential fees were charged by academicdiscipline. In arts and social sciences, fees were increased from 10 percent ofthe recurrent cost in 1986/87 to 20 percent in 1992/93. The Government hasdeclared its intent to raise fees further to 25 percent (Selvaratnam 1994, 81-3),though it has also decided to set uniform fees rather than divergent ones forindividual clusters of disciplines.
Grants and Loans
People who oppose increases in fees usually do so mainly on the grounds thatfees are likely to exclude individuals from the poorest segments of society. Partof the response by policymakers has been to provide an array of supportschemes, including grants and loans. Grants may be linked not only to theincomes of applicants but also to academic performance and to efforts toattract students to particular types of training. Loan schemes usually contain asubstantial proportion of hidden grants.
Among the international authorities on student loans are Woodhall (1987,1991, 1997) and Ziderman and Albrecht (1995). These authors have highlighteda wide range of models, of which the two main types are mortgage loans andincome-contingent loans. Mortgage loans are more common, and requirestudents to repay sums over a specified period, usually with fixed monthlypayments. Income-contingent loans provide faster avenues for repayment byhigh-income graduates, and safety nets for low-income graduates, by linkingthe size of repayment to graduates' incomes. Most loan schemes provide forliving expenses as well as tuition fees. Some loan schemes are administeredby government agencies, while others are operated by commercial banks.
The hidden grant elements of loans take the form of subsidized interestrates, leniency for low-income students, and tolerance of default on repayment.Table 22 shows figures compiled by Ziderman and Albrecht of hiddensubsidies and government losses in 20 countries. The hidden grant throughsubsidized interest rates ranged from 13 to 93 percent of the loans, whileaverage loan recovery ratios varied substantially. In addition, loan schemes

40 The Costs and Financing of Education
Table 22: Hidden Subsidies, Government Losses, and Average LoanRecovery Ratios on Selected Student Loan Programs
Economya
Nominalinterest
rate (%)b
Realinterest
rate(%)c
Max. orprojected
repay-ment
period(years)d
Hiddengrant tostudents
(% ofloan)e
Govt.losswith
default(%)f
Govt. losswith default& admini-
strativecosts (%)g
Averageloan
recoveryratio (%of loan)h Yeari Estimates
Mortgage LoansBarbados 8.0 4.1 12 13 18 33 67 1988 Default 5%,
Administrative 2%
Brazil I 15.0 -35.0 5 91 94 98 2 1983 Default 30%,Administrative 2%
Brazil II 318.0 -14.9 8 62 65 71 29 1989 Default 10%,Administrative 2
Chile varies 1.0 10 48 69 82 18 1989 Administrative 2%
Colombia I 11.0 -10.6 8 73 76 87 13 1978 Administrative 2%
Colombia II 14.0 3.0 5 29 38 47 53 1985 Administrative 2%
Denmark 8.0 1.6 10 52 56 62 38 1986 Administrative 1%
Finland 6.5 -0.6 10 45 46 52 48 1986 Default 2%,Administrative 1%
Honduras 12.0 -3.0 8 51 53 73 27 1991 Administrative 5%
Hong Kong, China 0.0 -6.3 5 43 43 47 53 1985 Administrative 2%
Indonesia 6.0 -2.3 10 57 61 71 29 1985 Default 10%,Administrative 1%
Jamaica I 6.0 -10.7 9 74 84 92 8 1987 Administrative 2%
Jamaica II 12.0 -5.6 9 56 62 70 30 1988 Default 20%,Administrative 2%
Japan 0.0 -1.4 20 50 51 60 40 1987 Administrative 1%
Kenya 2.0 -6.9 10 70 94 103 1989 Administrative 2%
Norway 11.5 5.6 20 33 33 48 52 1986 Administrative 1%
Quebec 10 5.2 10 31 31 37 63 1989 Administrative 1%
Sweden I 4.3 -3.0 20 61 62 70 30 1988 Administrative 1%
United Kingdom 6.0 0.0 7 26 30 41 59 1989 Default 5%,Administrative 1%
United States 8.0 3.8 10 29 41 53 47 1986 Administrative 2%
Venezuela 4.0 -23.0 20 93 98 108 1991 Administrative 3%
Income Contingent LoansAustralia varies 0.0 17 48 52 57 43 1990 Evasion 3%,
Administrative 0.5%Sweden II varies 1.0 10 28 30 33 67 1990 Evasion 3%,
Administrative 0.5%
Notes:a Economies with I and II refer to situations where the loan program underwent reform.
b Nominal interest rate refers only to the rate during repayment.
c Real interest rates use purchasing power parity formula, where inflation is based on the average ofthe 1980-1988 period as reported in the World Bank Development Report, except in instances notedwhere a five-year average of inflation was calculated from the data date.
d The repayment length is the maximum prescribed in the loan, except for the two income-contingentloans where it is the repayment length that is implied by the average income profile of a graduate.This does not include grace periods.
e The hidden grant percentage is calculated as a discounted cash flow of the student's account, andtherefore excludes default and administrative costs.
f The government loss due to default subtracts the percentage of default from each year of therepayment stream.
g The loss with default and administrative costs subtracts an annual administrative cost related tooutstanding debt each year.
h The loan recovery ratio is equal to 100 minus government loss with default and administrative costs.
i Year is the date from which loan information was collected, and from which inflation calculationswere made.
Source: Ziderman and Albrecht 1995, 70-1.

Education in Developing Asia 41
may demand substantial administrative costs. These figures demonstrate thatloan schemes are much less efficient as a mechanism for recovery of coststhan is widely assumed.
In the light of such statistics, much attention has focused on ways toimprove the efficiency of cost-recovery schemes. When such a scheme wasinitiated in 1969 in Hong Kong, China, loans were interest free. However, in1987 a 2.5 percent charge was placed on loans, and a 1996 report recom-mended that the authorities should raise this to between 5.8 and 8.5 percent,while simplifying administration (Ernst and Young 1996, 122). Similarly,continued scrutiny of schemes in the PRC is permitting the authorities to plugsome of the leaks in the system set up in the early 1990s (Li and Bray 1992;World Bank 1997a).
Institutional Revenue-Earning Schemes
In some countries, institutions have been increasingly required to secureadditional funds from other sources. In Mongolia, for example, some schoolsmanage their own flocks of sheep (ADB 1994); in Nepal, schools commonlyrent out buildings and use land for other noneducation purposes (Thapa andSingh 1995); and in the PRC, schools run cafeterias and use buildings fordiscos and other forms of revenue-earning entertainment (Kwong 1996).Tertiary institutions have also been required to generate their own revenues.Table 21 showed, somewhat unusually, an institution in India that reportedlyraised 28.3 percent of its recurrent income from a printing press. It alsoreferred to farms and to endowments. Many institutions in the region nowsolicit donations from their alumni. Many are also encouraging teaching staffand others to undertake consultancy services, while some are moving intodirect business ventures.
The scale of revenue obtainable from such sources depends strongly onthe general wealth of the societies in which the institutions operate, on thenature of specialties offered by the institutions, and on the frameworks set bygovernments. Prosperous societies are obviously better able to support suchinitiatives than impoverished ones, though the irony is that institutions inprosperous societies have in general faced less need to secure independentrevenues because their governments have been more able to providesubstantial budget allocations. Institutions and individuals specializing inapplied science and commerce have more opportunities to market their skillsthan their counterparts specializing in history or philosophy. Governments canfacilitate moves by offering tax exemptions for donations to public institutions.
Viet Nam is among the countries in which higher education institutionshave been forced by the escalating cost of living and the inadequacy ofrevenues from the government to earn independent revenues. Pham andSloper (1995, 174) have indicated that in 1991, Viet Nam's College ofConstruction was able to add 28.3 percent to its budget by taking on externalcontracts. Comparable figures were 22.0 percent for the Foreign LanguagesUniversity, 11.0 percent for the College of Mining and Geology, 10.5 percent

42 The Costs and Financing of Education
for the Teachers Training College of Vinh, and 4.2 percent for the TechnicalTeachers College No.1. Pham and Sloper comment that the scale of suchincome generation chiefly depends on:
• the product or service that can be provided (which does not alwaysrelate to the primary mission of the institutions);
• the entrepreneurial capability and culture within the institution; and• the state of institutional infrastructure − personnel, organizational and
technical − which creates the basis for delivering a desired product orservice.
Institutions in urban locations generally have greater opportunities than thosein rural areas. However, in Viet Nam rural institutions have been able togenerate revenues by raising poultry, producing vegetables, managingrestaurants, and tailoring clothes. Critics observe that such activities deflect thestaff from their primary missions as specialized providers of higher education.Advocates usually agree, but point out that the activities at least permit theinstitutions to survive in harsh economic climates.
An example of a very different sort may be taken from Singapore.Although the country has a buoyant economy and a government with a historyof budget surpluses, even there the 1990s brought a philosophy that highereducation institutions should develop their own sources of revenue and reducedependence on the Government. In 1991, appeals were launched bySingapore's two universities for newly created endowment funds with a targetof S$1 billion (Selvaratnam 1994, 81). To boost the funds, the Governmentcontributed S$500 million, and committed itself to matching up to S$250 millionduring the following five years if the universities could secure that amount fromnongovernment sources.
Privatization of Education
Within the Asian and Pacific region, as in other parts of the world, shifts in theownership, management and control of education institutions may beobserved. In some cases this involves an increased role for governments; butin other cases it involves a reduced role. The latter is more common than theformer. This is partly because the balance has shifted so markedly towardpublic ownership, management, and control during the last few decades, andthe pendulum has begun to swing back.
The few places where the government is playing an increased role includesettings where the private sector has been dominant and is considered to needregulation and/or support. Macau, China is one such place, though it isidiosyncratic in its long legacy of government neglect and laissez faire attitudestoward the private sector (Adamson and Li 1999). Neighboring Hong Kong,China had a much more prominent role for the Government throughout the 20th
century, but has also witnessed increased government support for andregulation of the private sector through its direct subsidy scheme for secondary

Education in Developing Asia 43
schools and through subsidies and training for private kindergartens(Government of Hong Kong 1997a, 1997b).
More common, however, have been shifts toward privatization ofeducation. An official ADB document has stated that "Support for the privatesector in DMCs is an important part of ADB's operational policy in achieving itsstrategic objectives" (ADB 1997a, 8). This general philosophy may beappropriate in the economic sphere. In education, however, the role of theprivate sector is controversial.
Models for Privatization
Privatization, by definition, is a process − an “-ization” − rather than a state;and, as indicated above, the countries of the Asian and Pacific region display awide range of starting points. The term may also encompass a wide array ofmodels. In some systems, privatization has arisen as a result of deliberatepolicy; but in others, it is the result of unplanned changed. Four major modelsmay be identified as follows (Bray 1998):
• Transfer of ownership of public schools. Deliberate transfer of owner-ship (and, by implication, control) of existing public schools to privatehands is perhaps the most striking form of privatization. Such a moveis especially radical when it involves a shift from not-for-profit to com-mercial operation, though this type of change is rare.
• Shifting sectoral balance without redesignating existing institutions.This form of privatization occurs through a more evolutionary shift inthe balance of types of institution. Thus, the number and size of gov-ernment schools might be held constant, but the number and size ofparallel private schools might be permitted or encouraged to increase.Alternatively, the government sector might expand, but the privatesector might expand more. Or the government sector might contract,but the private sector might not contract so much, might remainconstant, or might expand.
• Increased government funding and support for private schools.Governments may strengthen the private sector by giving financialand other support to private schools. Some governments are experi-menting with systems of vouchers, in which families can choose tosend children to private schools but meet some or all the costs from afinancial allocation earmarked by the government.
• Increased private financing and/or control of government schools. Inthis form of privatization, schools remain nominally under governmentownership but the proportion of finance and/or control by nongovern-ment sources is increased. Governments in some countries have ex-perienced a severe fiscal crisis, and parents and communities havehad to increase financial contributions to their schools in order tobridge gaps. In other countries, governments' financial health hasremained strong but for ideological and other reasons the authoritieshave required school principals to be more responsive to the market
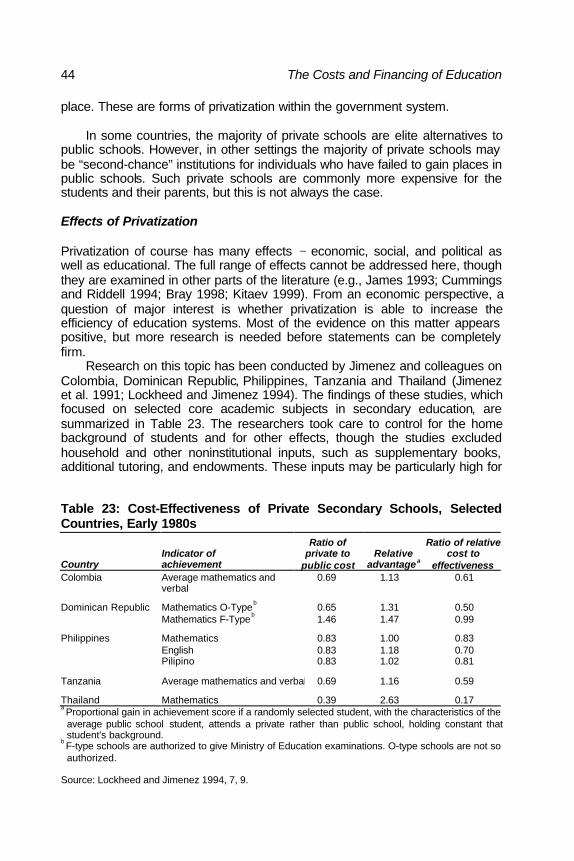
44 The Costs and Financing of Education
place. These are forms of privatization within the government system.
In some countries, the majority of private schools are elite alternatives topublic schools. However, in other settings the majority of private schools maybe “second-chance” institutions for individuals who have failed to gain places inpublic schools. Such private schools are commonly more expensive for thestudents and their parents, but this is not always the case.
Effects of Privatization
Privatization of course has many effects − economic, social, and political aswell as educational. The full range of effects cannot be addressed here, thoughthey are examined in other parts of the literature (e.g., James 1993; Cummingsand Riddell 1994; Bray 1998; Kitaev 1999). From an economic perspective, aquestion of major interest is whether privatization is able to increase theefficiency of education systems. Most of the evidence on this matter appearspositive, but more research is needed before statements can be completelyfirm.
Research on this topic has been conducted by Jimenez and colleagues onColombia, Dominican Republic, Philippines, Tanzania and Thailand (Jimenezet al. 1991; Lockheed and Jimenez 1994). The findings of these studies, whichfocused on selected core academic subjects in secondary education, aresummarized in Table 23. The researchers took care to control for the homebackground of students and for other effects, though the studies excludedhousehold and other noninstitutional inputs, such as supplementary books,additional tutoring, and endowments. These inputs may be particularly high for
Table 23: Cost-Effectiveness of Private Secondary Schools, SelectedCountries, Early 1980s
CountryIndicator ofachievement
Ratio ofprivate to
public costRelative
advantagea
Ratio of relativecost to
effectivenessColombia Average mathematics and
verbal0.69 1.13 0.61
Dominican Republic Mathematics O-Typeb
0.65 1.31 0.50Mathematics F-Type
b1.46 1.47 0.99
Philippines Mathematics 0.83 1.00 0.83English 0.83 1.18 0.70Pilipino 0.83 1.02 0.81
Tanzania Average mathematics and verbal 0.69 1.16 0.59
Thailand Mathematics 0.39 2.63 0.17a Proportional gain in achievement score if a randomly selected student, with the characteristics of theaverage public school student, attends a private rather than public school, holding constant thatstudent's background.
b F-type schools are authorized to give Ministry of Education examinations. O-type schools are not soauthorized.
Source: Lockheed and Jimenez 1994, 7, 9.
Education in Developing Asia 45
private schools, and could therefore be important to the comparison.Nevertheless, on the data that were available, the studies suggested thatprivate schools generally achieved better results at lower costs, and as suchwere more cost effective than public schools.
However, one study in India seemed to contradict these findings. Itfocused on primary school mathematics and reading in Tamil Nadu, andindicated that fully private schools were the least cost effective. Government-aided schools were the most cost effective, and fully government schools wereintermediate (Bashir 1994, 264; 1997, 153). In contrast, another Indian studyon both primary and secondary schools in Uttar Pradesh, produced findingsmore in line with those of Jimenez and colleagues. The magnitude of findingsdiverged considerably for junior and senior secondary schools; but in bothtypes of institution private unaided schools were shown to be considerablymore cost effective than aided and government schools (Kingdon 1994, 233).
To explain the differences in effectiveness, most authors highlight theimportance of management practices. Lockheed and Jimenez (1994, 15)showed that head teachers in private schools generally have more control overschool-level decisions that can affect student achievement. This includesselection of teachers, adaptation of the curriculum, improvement of instruc-tional practice, and choice of textbooks. To identify cost factors, Lockheed andJimenez conducted a small follow-up survey to their main research, in whichthey paired elite and nonelite private and public schools in each of thecountries. This survey did not show dramatic differences in the resources andphysical facilities in the pairs of schools, but the private schools appeared touse these inputs more cost effectively.
Several studies have also observed that private schools are lessconstrained by the conditions of service and accompanying salaries that aremandatory in the public service. In India, for example, many private schoolshire teachers with lower qualifications who are less costly but not necessarilyless effective than their counterparts in the public schools (Kingdon 1994, 175).Cost-saving patterns are also evident in Japan, where many private schoolsemploy (i) teachers who have retired from the public sector, (ii) women whohave been unable to secure career-track positions in large companies or thecivil service, and (iii) part-time staff (James and Benjamin 1988, 101).
However, while the research seems on balance to show that privateschools are more cost effective than public ones, most researchers stillunderline the need for caution. Riddell (1993), following careful review of thework not only by Jimenez and colleagues but also by other researchers,stressed (p.384) that "there is no overwhelming conclusion regarding the [cost-effectiveness] advantages of private schools over public schools, notwith-standing statements to the contrary.”
Moreover, as noted by Lockheed and Jimenez (1994, 18), the fact thatparticular samples of private schools might appear more efficient thancomparable samples of public schools is not necessarily in itself a strongargument for privatization. First, full-scale privatization would by definitionremove some of the advantages which the private schools currently exploit: forexample, there would not be enough retired teachers and people seeking part-

46 The Costs and Financing of Education
time jobs for every school to gain efficiencies to the extent that were previouslydemonstrated when only a few institutions were seeking such personnel.Second, some management practices can be improved within the publicsector: head teachers can be given greater freedom to manage resources andadapt curricula, without their schools necessarily being privatized.
It is also important to address the argument that the existence of privateschools helps to improve the efficiency of public institutions. Presenting thisargument in one country, a World Bank report (1993b, 193-4) has stated that:
A mixed system of government and private schools will not only reducethe financial burden on public resources, thereby freeing up the educationbudget to address teacher salary shortfalls, maintenance needs, and otheroperational improvements, but it will also improve the productivity andquality of public education, as government schools compete with privateschools.
Such an outcome is far from generalizable or certain. Much depends onwhether private and public schools really do compete, and on the ways inwhich managers of public schools respond to such competition. In mostsettings, private and public schools serve different markets. Elite privateschools do not compete even with ordinary public schools, because mostpeople cannot afford the fees ; alternative-curriculum private schools do notcompete with mainstream-curriculum public schools, because most people donot want the alternative curriculum; and second-chance private schools do notcompete with the public sector, because the students in those private schoolswould rather be in public ones.
The operation and impact of voucher schemes are also related to thisdiscussion. Many models for voucher schemes have been proposed (Hakim etal. 1994; West 1997), and the reform in Chile, where families have been giventhe opportunity to use public resources to pay for places in private schools, isamong the best-known examples of the practice (Espínola 1994; Rounds Parry1997; Carnoy 1998). The Chilean reform increased choice and permittedreduction of unit costs in the education system. However, information on thecharacteristics of different schools did not flow easily to parents, and urbanfamilies had greater choice than rural ones. Key factors in the Chilean reformwere a setting which did not permit political opposition, and a capacity at bothcentral and municipal levels to make accurate counts of students and toimpose effective penalties for inaccurate reporting. West (1997, 100) points outthat cross-national experience with voucher schemes remains limited and thatit is too early to reach firm general conclusions on their advantages anddisadvantages. Nevertheless, policymakers in Asia as much as in other partsof the world may certainly find various models of voucher schemes worthconsideration.
Private Tutoring −− A Sector Deserving Particular Scrutiny
The scale, modes of operation, and implications of supplementary private
Education in Developing Asia 47
tutoring have been seriously neglected both in policy debates and in theacademic literature (Bray 1999b). In some countries such tutoring is a massiveenterprise. For example:
• A Sri Lankan survey found that in Colombo, 60 percent of OrdinaryLevel students and 84 percent of Advanced Level students receivedprivate tutoring (de Silva 1994, 4).
• In the Republic of Korea, private tutoring consumed 37.4 percent ofout-of-school education expenditures in 1994 (Paik 1995, 24), farexceeding the proportions devoted to books (19.3 percent), stationery(7.4 percent), transportation (6.4 percent), or uniforms, boarding, andother expenses (29.5 percent).
• A 1992 survey of urban parts of Bangladesh found that 65 percent ofpupils in government primary schools received private tutoring, whichconsumed 43 percent of the direct private costs of education for thetotal number of parents in the sample (World Bank 1996, 53).
Private tutoring has also been shown to be a substantial activity in parts ofCambodia (ADB 1996a; Bray 1999a), Malaysia (Marimuthu et al. 1991),Myanmar (Gibson 1992), and Singapore (George 1992).
While more research is needed on the topic, some points are clear:
• Private tutoring is a major sphere of activity, not only in prosperouscountries but also in impoverished ones.
• Private tutoring is growing. In societies such as Hong Kong, Chinaand Singapore where it has long roots, it is expanding, while incountries where it was not previously evident, such as the PRC andViet Nam, it has emerged.
• Private tutoring is found at all levels, but is especially common in theyears in which students take public examinations, both primary(where relevant) and secondary .
• The organizational structures for private tutoring are varied. Sometutoring is individualized and takes place in either the clients' or thetutors' homes. At the other end of the scale are institutions thatoperate from many campuses. Some enterprises even operate on aninternational basis. Kumon, which is a company specializing inmathematics tutoring and is headquartered in Japan, is an example.
• The quality of private tutoring is very varied. In few societies dogovernments set (let alone enforce) regulations on teacher qualifica-tions, class size, etc. Much tutoring is of the “cramming” type, withvery questionable pedagogical characteristics.
• Private tutoring may be found in both rural and urban areas, though itis more common in the latter than in the former.
It is far from certain that the unfettered growth of private tutoring, which hasbecome a feature of many societies, is desirable. Governments should at leastmonitor the scale and nature of private tutoring, so that they are aware not only
48 The Costs and Financing of Education
of its impact on household budgets but also of its implications for the qualityand effectiveness of mainstream schooling. Private tutoring is an instrument formaintaining or increasing social and geographic inequalities. While itpresumably gives good private rates of return to the individual clients, it is notself-evidently an activity deserving encouragement.
International Aid for Education
International aid is a significant source of both finance and expertise for manyof ADB's developing member countries. Some countries of course receivemore aid than others; the nature and purpose of the aid also varies. Many ofthe issues relating to aid in general, and to aid for education in particular, havebeen explored in detail elsewhere (e.g., Lee 1991; Tisch and Wallace 1994;Serageldin 1995; King and Buchert 1999), and do not need repetition here.However, a few salient points should be noted.
Table 24 presents data on the scale of official development assistanceflows to DMCs between 1982 and 1997. The volume of flows reflects not onlythe sizes of the DMCs concerned but also various political factors. For someDMCs in some years a negative sign is recorded, meaning that resourcesflowed out rather than in. For the years 1982 and 1987, no figures are recordedfor Kazakhstan, Kyrgyz Republic or Uzbekistan because, while presumablyresources flowed within the Soviet Union, they were part of a differentframework.
Indonesia is among the countries in which external aid for education hasplayed an increasingly prominent role. Figure 3 shows the percentages ofcontributions of three major external agencies, namely UNDP, World Bank,and ADB, to the total education budget during the periods of five 5-year plans(Repelitas). The picture is of significant growth, from 0.6 percent in the firstplan (1968-73) to 12.1 percent in the fifth (1988-93). Figure 4 indicates thedestination of the funds. Primary education received 67.3 percent of the total inRepelita I, but nothing in the next three plans and only 1.3 percent in RepelitaV. By contrast, nonformal education received only 0.2 percent in Repelita I but18.5 percent in Repelita II and 16.0 percent in Repelita V.
In Nepal, external assistance has played an even more important role.Table 25 indicates the trend between 1981-85 and 1997/98. External financingwas already substantial, forming 19.7 percent of the total public budget foreducation in 1981-85; but by 1997/98 it had expanded to 52.8 percent. Figuressuch as these raise questions, both in Nepal and in other countries where aidlevels have been comparable, about the extent to which policies and prioritiesare dominated by external agents rather than by the governments and peoplesof the countries concerned. In Nepal, much of the early assistance was fortechnical higher education, but the bulk of assistance in 1997/98, reflecting thepriorities of external agencies, was for basic and primary education. Whereasin 1981-85, 68.2 percent of assistance was in the form of grants, in 1997/98the proportion was only 22.5 percent. From the viewpoint of the externalagencies, the importance of loans rather than grants lay not only in the fact that

Education in Developing Asia 49
the resources of the agencies would be repaid and thus would be self-sustaining, but also that, at least in theory, the recipient governments wouldscrutinize projects more carefully and be more committed to their success.However, at the national level short-term political considerations have often
Table 24: Official Development Assistancea Flows to Developing MemberCountries($ million)Economy 1982 1987 1992 1997Afghanistan 9.3 45.0 204.3 278.9Bangladesh 1,341.2 1,790.3 1,820.7 1,144.0
b
Bhutan 11.3 42.1 56.2 67.5b
Cambodia 43.9 14.2 206.8 370.0b
China, People’s Republic of 524.0 1,381.6 3,049.6 5,042.2b
Cook Islands 10.4 11.0 17.2 10.0Fiji Islands 35.4 35.9 63.4 38.8
b
Hong Kong, China 7.9 19.4 -39.0 India 1,643.9 1,702.9 2,423.0 591.6
b
Indonesia 906.3 1,245.9 2,078.9 1,106.6Kazakhstan 9.5 519.6Kiribati 15.1 18.4 26.8 15.8Korea, Republic of 34.0 11.2 -3.0 4,502.0
b
Kyrgyz Republic 3.5 214.7b
Lao People’s Democratic Republic 38.3 55.0 164.9 327.7b
Malaysia 135.3 363.4 205.5 -70.2b
Maldives 5.4 18.6 38.1 15.0b
Marshall Islands 7.7 63.0Micronesia, Federated States of 13.9 96.0Mongolia 3.0 122.9 322.1
b
Myanmar 318.9 352.6 115.1 102.5b
Nauru 0.2 2.6Nepal 200.9 353.0 433.2 454.8
b
Pakistan 915.6 820.2 1,009.3 1,103.9b
Papua New Guinea 310.7 317.7 442.1 296.5b
Philippines 333.4 732.2 1,718.0 549.3b
Samoa 22.8 34.6 53.4 28.2b
Singapore 20.5 23.3 19.9 Solomon Islands 28.4 57.1 44.7 36.3
b
Sri Lanka 415.5 477.0 638.0 510.0b
Taipei,China -6.4 -8.5 5.9 Tajikistan 9.7
b92.5
b
Thailand 388.9 469.9 772.5 6,231.7b
Tonga 17.4 21.3 23.6 25.4b
Tuvalu 6.2 25.7 8.4 10.1Uzbekistan 1.4 74.7
b
Vanuatu 26.0 51.0 40.6 27.5b
Viet Nam 135.5 111.0 575.1 849.6b
Data not available.a
Official development assistance is defined as concessional flows to developing countries andmultilateral institutions provided by official agencies, including state and local governments, or bytheir executive agencies, administered with the objective of promotion of economic developmentand welfare of the developing countries and containing a grant element of at least 25 percent.
b Refers to net flows of long-term public and publicly guaranteed debt from official creditors andgrants, including technical cooperation grants. This category is wider than that of officialdevelopment assistance.
Sources: ADB 1996b, 49; 1999, 49.

50 The Costs and Financing of Education
Figure 3: Contributions of Major Aid Agencies as a Proportion of theTotal National Education Budget, Indonesia
Note: The periods covered by the plans are: I 1968-73; II 1973-78; III 1978-83; IV 1983-88; V 1988-93.
Source: Wirjomartono et al. 1997, 62.
Figure 4: Agency Contributions to Education, by Subsector, Indonesia
Repelita I PS67.3%
GS
2.1%
VS22.9%
NF
0.2%
O7.5%
Repelita III
NF
8.1%
GS
6.1% O
4.8%
VS
32.6%
HE
48.4%
Repelita IIO
5.8%
GS16.4%
NF18.5%
VS
16.2%
HE43.0%
Repelita IV
VS11.5%
GS
9.1%O
9.5%
HE69.9%
Repelita V
NF16.0%
HE16.6%
VS
30.3%
GS
8.8%
PS
1.3%O
27.0%
PS = Primary School; GS = General Secondary School; VS = Vocational Secondary School;HE = Higher Education; NF = Nonformal Education; O = Other (may include funds for severalsubsectors).
Source: Wirjomartono et al. 1997, 65.
0 .6
4 .7
6 .9
1 1 . 11 2 . 1
0
2
4
6
8
1 0
1 2
1 4
R e p e l i t a I Repel i ta I I Repelita III Repel i ta IV R e p e l i t a V
Perc
ent

Education in Developing Asia 51
taken precedence over long-term economic ones, and one effect of theexpanded proportion of loan assistance has been a greatly increased nationaldebt.
In the socialist and former socialist states, patterns of external assistancehave changed markedly during the last decade. Resources flowed within andfrom the Soviet Union, but few resources for education came into the SovietUnion from outside. Mongolia was among the countries receiving substantialresources from the Soviet Union. Indeed in some years, inflows of Sovietresources amounted to over 30 percent of GDP (People’s Republic ofMongolia 1991). In 1988 about 50,000 Soviet civilians and large numbers ofmilitary personnel worked in Mongolia, contributing to all aspects of theeconomy and government. By 1993, however, their numbers had plummeted.Since that time, external aid has been received from many bilateral andmultilateral agencies in the Western bloc, but this has not completely replacedthe scale of the resources that was previously received from the Soviet Union.
Aid from the Western bloc has also become a major input to theeconomies of the PRC, Lao PDR, and Viet Nam. For illustrative purposes,Table 26 shows official development assistance for education and training inViet Nam between 1991 and 1995. The total volume increased markedly overthat period (even allowing for the fact that these are in current prices).Technical/managerial education received the largest slice in 1991 and 1993,but by 1995 this had been overtaken by tertiary education.
Table 25: Trends in External and Internal Mobilization of Resources forEducation, Nepal(percent)
1981-85 1986-90 1991-92 1993-95 1997/98Internal 80.3 83.6 92.0 68.7 47.2External 19.7 16.4 8.0 31.3 52.8
Grants 68.2 31.4 27.2 44.0 22.5Loans 31.8 68.6 72.8 56.0 77.5
Source: Bajracharya et al. 1997, 76.
Table 26: Official Development Assistance to Education and Training,Viet Nam, 1991-1995($ ‘000)
1991 1993 1995a
$ '000 % $ '000 % $ '000 %Sector policy and planning 299 3 769 4 1,338 4Primary schooling 517 6 2,170 11 4,682 12Secondary schooling 2,135 24 2,489 13 465 1Tertiary education 1,778 20 3,784 20 19,770 52Technical/Managerial 3,648 41 7,957 42 9,894 26Nonformal 483 5 1,809 10 1,647 4
Total 8,860 100 18,978 100 37,796 100a Planned.
Source: World Bank 1997d, 41.

52 The Costs and Financing of Education
At the other end of the scale are countries that, for ideological or otherreasons, have relatively small inflows of external resources. Myanmar is in thiscategory, while the Indian Government has been unwilling to take substantialloans for education. These observations underscore the complexity of thenational and international dynamics that must be considered.
Other issues include absorptive capacity, coordination with and betweenexternal agencies, and the conditionalities imposed by some externalagencies. In Cambodia, nearly half the Government's 1994 budget foreducation was financed by bilateral and multilateral agencies (ADB 1996a, 73).Some projects were in competition with each other for scarce counterpartpersonnel, and major inefficiencies were caused by limitations in nationalinfrastructure. Some of the conditionalities imposed by the external agenciesconcerned technical matters such as availability of management structures, butothers had broader political implications. For example, in 1997 the UnitedStates Government suspended most of its aid, including that in the educationsector, in protest against what it perceived to be antidemocratic actions and aquasi coup d'état.
These political factors underline the fact that external aid is rarely a stablesource of finance for national governments. Burgess (1997, 313), focusing onbasic health and education, points out that:
Levels of aid finance to specific basic health and education projectsfluctuate widely depending on the vagaries of Western donors. Resourcesreleased are also unlikely to increase in line with economic and populationgrowth. This failure to satisfy stability and buoyancy criteria is particularlyserious given that the bulk of costs in basic health and education projectsare recurrent.
These points, Burgess emphasizes, underline the necessity for governments torely on domestic resources, and particularly taxation, for the bulk of theireducation financing. However, Burgess agrees that aid can play a useful role infinancing large capital-intensive projects, especially ones which demandforeign exchange. Examples might be at the tertiary level, where start-up costsand technical demands are high. External aid can also, perhaps, play a role inhelping to generate increased domestic revenues through taxation.
Particular Strategies for Particular Groups of Countries
Throughout this booklet, stress has been placed on the diversity of countriesand of the circumstances that face them. This creates difficulties in generali-zation, but it is possible to identify commonalities within particular groups. Themost obvious factor for grouping is economic strength or weakness. Othercriteria for classifying states include political history (particularly to identify thestates which have made a transition from socialism), and size of country.

Education in Developing Asia 53
Poor, Middle-Income, and Rich Economies
Although Hong Kong, China, Nauru, and Singapore are classified as ADBDMCs, their economic circumstances are vastly different from those ofBangladesh, Cambodia, India, and Mongolia. The economic differencesbetween economies are reflected both in their current education systems andin approaches to the future. The prosperous economies already have highenrollment rates at all levels. Their governments and peoples remain rightlydissatisfied about qualitative aspects in their education systems, but the gapbetween them and the low-income groups is vast. The rich economies canmeaningfully consider grasping new technologies for education on a widescale, can aim to become global centers of expertise in certain aspects ofresearch, and can afford to look after their handicapped and other disad-vantaged citizens in a way that cannot be contemplated by poor societies.
At the other end of the scale are the countries in which enrollment rates ,even for basic education, have never approached universality and are nowstagnating or declining. Investment priorities in these countries are more likelyto aim at raising enrollments than at improving quality, though of course thelatter may be a route to the former. Despite the remarks made above about theneed to be part of strategic innovations, for the poor countries investments inbooks may still be more important and cost effective than investments incomputers; and while their governments may be attracted to philosophies ofprivatization both as a way to improve efficiency and to help in sharing theburden, the governments should still aim to contribute more to the educationsector than they are currently doing.
In the middle is a group of countries that aspires to raise their profile andjoin the top rank. Throughout the region and beyond, analysts in middle-income countries have sought to identify the factors that have contributed tothe so-called East Asian Miracle (World Bank 1993a), including those whichare linked to the education sector, in order to emulate those which can beemulated. Whether simple formulas can be distilled from the experiences of theeight high-performing Asian economies (HPAEs) is a matter of dispute (Morrisand Sweeting 1995; Lewin 1998; Mingat 1998; Mundle 1999). Nevertheless,the topic has naturally attracted considerable attention from many sides.
To some observers, however, the economic collapse in many parts of theregion during the second half of 1997 meant that the image of a miracle hadbecome somewhat tarnished (Desai 1998). The most-affected countries wereIndonesia, Republic of Korea, Malaysia, and Thailand. Although subsequentyears brought some recovery, the crisis underlined the fragility not only ofeconomic systems but also of country groupings for policy analysis. One resultof the events was that a new grouping entered the arena, namely of seeminglyvigorous economies that had suffered abrupt economic collapse (Godement1999; Mallet 2000).
Even with such fluidity, however, the obvious fact remains that countries indifferent income groups must be viewed differently for the purposes of policyanalysis in education as much as in other sectors. Variations betweencountries in different income groups have underpinned the bulk of earlierdiscussion in this booklet, as remarked, for example, in the commentary on
54 The Costs and Financing of Education
rates of return by level of education in countries of different income groups.Differences between countries in different income groups have also dominatedhuge segments in the literature on education and development. As such, it isnot necessary to dwell on the topic here; but clearly the matter must be bornein mind in all discussions of strategies and priorities.
Transitional and Long-Standing Capitalist Economies
The economies that have recently made a transition from centrally plannedsocialism face distinctive challenges that differ from those in long-standingcapitalist economies. The formerly socialist DMCs are Cambodia, Kazakhstan,Kyrgyz Republic, Mongolia, Tajikistan, and Uzbekistan. The countries thatremain officially socialist but have moved to market economies form anothergroup facing challenges that, in many respects, are similar. The countries inthis group are PRC, Lao PDR, and Viet Nam.
Most countries of the former Soviet Union, together with Mongolia, hadstrong education systems prior to the political changes that overtook them inthe early 1990s (Kitaev 1996; Gannicott 1998; UNICEF 1998). Their peoplesthus look with considerable ambivalence at the serious deterioration that hastaken place in at least some sectors. For example, Kazakhstan's public budgetfor education, which in 1990 represented 7 percent of GDP, fell to half thatamount shortly after the 1991 political transition. A 1995 ADB review (p.13)noted that the education sector was still "being pushed by frequent ad-hocexpenditure reductions which, in the absence of a comprehensive and feasiblesector adjustment policy and program, impact negatively on previously attained... standards,” and an official report written five years later (Kazakhstan 2000)did not show much improvement. In the former Soviet republics of CentralAsia, the preschool sector has been hit particularly hard (Box 6).
The challenge to reorient both education systems and wider frameworkshad still not been effectively achieved in most former Soviet systems by thelate 1990s. The Soviet system had not encouraged institutions to monitor theirexpenses and conserve resources. Thus schools in some countries foundthemselves paying huge bills for utilities that previously they had taken forgranted and that, even after they became conscious of them, they could noteasily control e.g., because heating was supplied centrally and could not beturned off (ADB 1994, 1995, 1996c). Ministries and institutions also had to lookwith fresh eyes on such issues as teacher deployment and the numbers ofnonteaching staff in schools.
Most of the transition economies faced tensions arising from theemergence of private institutions in higher education, which operated with littleor no government supervision and control. In Mongolia, for example, privatetertiary institutions mushroomed shortly after the official transition to capitalismin 1991 (Bray et al. 1994, 37). Many of these institutions focused on foreignlanguages, while others were specialized in such subjects as law, culture, andsports. By 1995 the institutions numbered 36 and catered to 24 percent ofpost-secondary students (Erdenesuren 1997, 83). However, they were veryvariable in quality; and the fact that the average size was just 70 studentsraised questions on whether they were operating with sufficient economies of
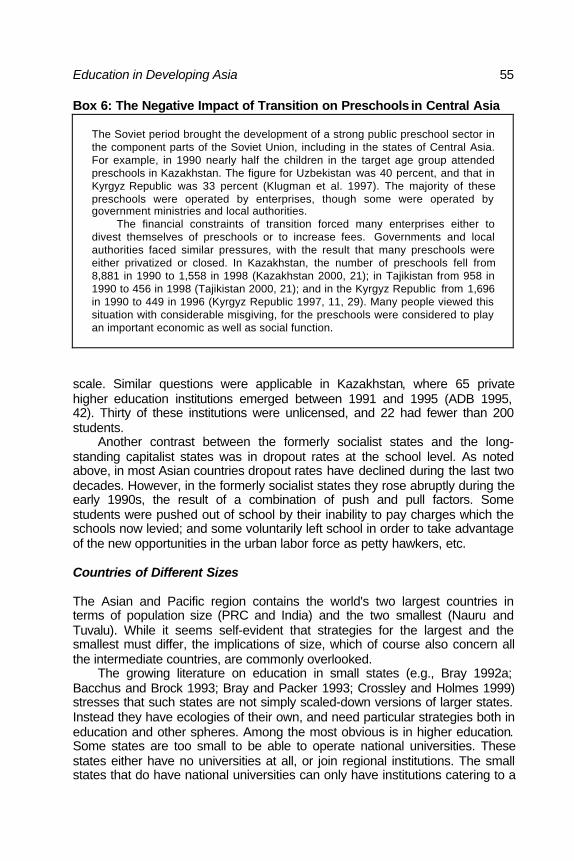
Education in Developing Asia 55
Box 6: The Negative Impact of Transition on Preschools in Central Asia
The Soviet period brought the development of a strong public preschool sector inthe component parts of the Soviet Union, including in the states of Central Asia.For example, in 1990 nearly half the children in the target age group attendedpreschools in Kazakhstan. The figure for Uzbekistan was 40 percent, and that inKyrgyz Republic was 33 percent (Klugman et al. 1997). The majority of thesepreschools were operated by enterprises, though some were operated bygovernment ministries and local authorities.
The financial constraints of transition forced many enterprises either todivest themselves of preschools or to increase fees. Governments and localauthorities faced similar pressures, with the result that many preschools wereeither privatized or closed. In Kazakhstan, the number of preschools fell from8,881 in 1990 to 1,558 in 1998 (Kazakhstan 2000, 21); in Tajikistan from 958 in1990 to 456 in 1998 (Tajikistan 2000, 21); and in the Kyrgyz Republic from 1,696in 1990 to 449 in 1996 (Kyrgyz Republic 1997, 11, 29). Many people viewed thissituation with considerable misgiving, for the preschools were considered to playan important economic as well as social function.
scale. Similar questions were applicable in Kazakhstan, where 65 privatehigher education institutions emerged between 1991 and 1995 (ADB 1995,42). Thirty of these institutions were unlicensed, and 22 had fewer than 200students.
Another contrast between the formerly socialist states and the long-standing capitalist states was in dropout rates at the school level. As notedabove, in most Asian countries dropout rates have declined during the last twodecades. However, in the formerly socialist states they rose abruptly during theearly 1990s, the result of a combination of push and pull factors. Somestudents were pushed out of school by their inability to pay charges which theschools now levied; and some voluntarily left school in order to take advantageof the new opportunities in the urban labor force as petty hawkers, etc.
Countries of Different Sizes
The Asian and Pacific region contains the world's two largest countries interms of population size (PRC and India) and the two smallest (Nauru andTuvalu). While it seems self-evident that strategies for the largest and thesmallest must differ, the implications of size, which of course also concern allthe intermediate countries, are commonly overlooked.
The growing literature on education in small states (e.g., Bray 1992a;Bacchus and Brock 1993; Bray and Packer 1993; Crossley and Holmes 1999)stresses that such states are not simply scaled-down versions of larger states.Instead they have ecologies of their own, and need particular strategies both ineducation and other spheres. Among the most obvious is in higher education.Some states are too small to be able to operate national universities. Thesestates either have no universities at all, or join regional institutions. The smallstates that do have national universities can only have institutions catering to a

56 The Costs and Financing of Education
very limited range of specialties. The governments of small states are generallywell advised to compare carefully the costs and benefits of operating their owninstitutions with the alternative of sending students to foreign universities. Theymay well find that the latter is less expensive and preferable in terms of quality.Small states may also need to consider similar trade-offs in the design andadministration of examinations, teacher training, and curriculum development.
In contrast, large countries face major problems of coordination arisingfrom the huge numbers of people and institutions involved. This is among thedomains where analysts of the PRC and India feel that they can learnstrategies from each other (Ahmed et al. 1991; Drèze and Sen 1995). Morepositively, large countries can generate such significant economies of scalethat they can operate highly specialized institutions, which could not becontemplated even in medium-sized states. Thus the PRC, for example, hasspecialist universities for agriculture, transport, teacher education, and evenaeronautics.
The nature of external aid projects may also need to differ in small andlarger states. Small states are more likely to need either small or multifacetedprojects, and they will require implementation strategies that take into accountthe scarcity of counterpart personnel, the personalized nature of bureauc-racies, and the fact that small amounts of money have a much greater profile(Coyne and Bray 1999). Large countries, in contrast, usually have access tomany more specialized personnel. They can also absorb substantial projects;and they are likely to have greater scope for shifting resources around should itbe necessary to develop particular components of projects at short notice.
Conclusion
This booklet began by remarking that the Asian and Pacific region has bothconsiderable diversity and major commonalities. The juxtaposition of theseelements has provided the basis for this analysis, which has highlightedcontrasts and similarities.
All countries of the region now operate in a context of globalization,especially in terms of economic interdependence, and in an environment inwhich national development is almost universally considered in terms ofcapitalist structures. In all countries, education is seen as a major investmentfor economic and social goals. It is arguable that some governments do notinvest as much in the sector as it merits. In some cases the gap is bridged bythe private sector; though in some countries the private sector is alsounderdeveloped. The nature and consequences of private financing are notsimple, and more investigation is needed into the implications of:
• household and community contributions to public institutions;• private institutions that operate in parallel to public ones; and• private tutoring that supplements public schooling.

Education in Developing Asia 57
On the specific matter of fees in public institutions, various declarationssponsored by the United Nations and its specialist agencies in the 1940s,1950s, and 1960s argued that education should be free of charge, especially atthe basic level but also at higher levels. Concerning tertiary education, a broadconsensus of opinion now recognizes that fees are desirable, not only as amechanism for limiting the burden on the public purse but also as a way torestrict what could otherwise be the nonequitable effects of fee-free education.Most governments that charge fees in tertiary education also provide grantsand scholarships for needy students, and some have experimented with loanschemes. Experience with loans has highlighted the many administrativecomplexities that make such schemes less attractive in practice than theymight appear in principle; but even in the absence of efficient loan schemes,the economic and social justifications for demanding at least some fees forhigher education remain strong. Of course governments must also heedpolitical factors, and one key factor in successful introduction of reform is theability to show the general public that, contrary to widespread belief, theprovision of fee-free higher education is inequitable rather than equitable.
At lower levels of education, fees in public institutions are less easy tojustify. A particularly strong argument can be presented for fee-free primaryeducation, given the externalities that whole societies gain from highenrollment rates . However, some governments suffer such severe fiscal stressthat they are unable by themselves to provide fee-free primary education of anacceptable minimum quality. Moreover, some observers stress the importanceof households and communities making at least some contribution to schoolsin order to promote feelings of ownership and public interest in the operation ofthe schools. Because of these factors, throughout the Asian and Pacific regionmany policymakers have underlined the importance of partnerships and thevalue of community participation (Bray 2000). The dominant consensus is thatthe public sector should remain the principal provider of education (Box 7), butthat partnership schemes can be valuable provided that they pay carefulattention to socioeconomic, rural-urban, and regional equity.
In the region as a whole, major quantitative strides have been madeduring recent decades in the provision of primary, secondary and, to someextent, tertiary education. Where quantitative targets have been achieved,much of the attention is turning to quality. However, the attainment of universalor near-universal primary education increases demand for secondaryeducation, while that of universal or near-universal secondary educationincreases demand for tertiary education. One projection is that demand foruniversity enrollments in Asia will nearly triple during the next few decades(ADB 1997b, 174). Such demand will require innovative ways to providesupply, rather than mere expansion of existing models. In this domain, thecontributions of technology and the potential for distance education provideexciting possibilities.
Many policy analysts recommend that, particularly at the tertiary level,demand is best satisfied by the private sector rather than through government
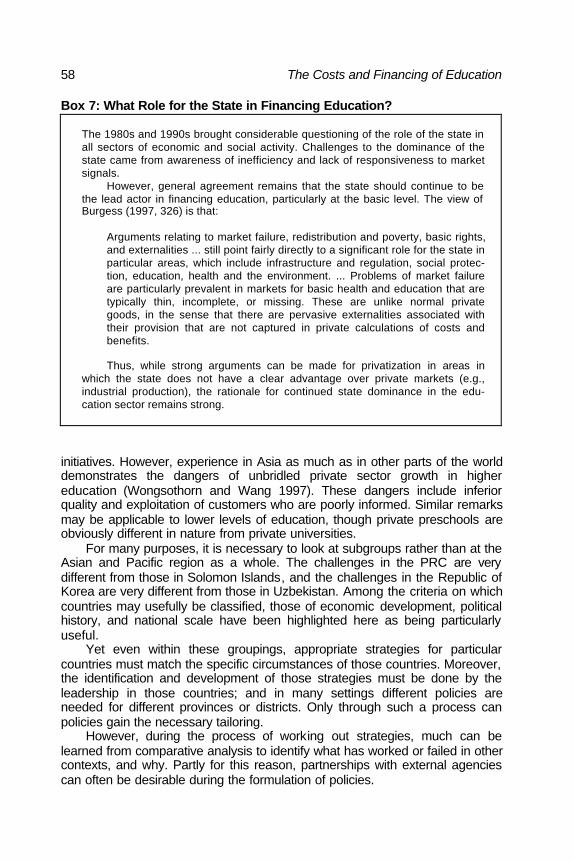
58 The Costs and Financing of Education
Box 7: What Role for the State in Financing Education?
The 1980s and 1990s brought considerable questioning of the role of the state inall sectors of economic and social activity. Challenges to the dominance of thestate came from awareness of inefficiency and lack of responsiveness to marketsignals.
However, general agreement remains that the state should continue to bethe lead actor in financing education, particularly at the basic level. The view ofBurgess (1997, 326) is that:
Arguments relating to market failure, redistribution and poverty, basic rights,and externalities ... still point fairly directly to a significant role for the state inparticular areas, which include infrastructure and regulation, social protec-tion, education, health and the environment. ... Problems of market failureare particularly prevalent in markets for basic health and education that aretypically thin, incomplete, or missing. These are unlike normal privategoods, in the sense that there are pervasive externalities associated withtheir provision that are not captured in private calculations of costs andbenefits.
Thus, while strong arguments can be made for privatization in areas inwhich the state does not have a clear advantage over private markets (e.g.,industrial production), the rationale for continued state dominance in the edu-cation sector remains strong.
initiatives. However, experience in Asia as much as in other parts of the worlddemonstrates the dangers of unbridled private sector growth in highereducation (Wongsothorn and Wang 1997). These dangers include inferiorquality and exploitation of customers who are poorly informed. Similar remarksmay be applicable to lower levels of education, though private preschools areobviously different in nature from private universities.
For many purposes, it is necessary to look at subgroups rather than at theAsian and Pacific region as a whole. The challenges in the PRC are verydifferent from those in Solomon Islands, and the challenges in the Republic ofKorea are very different from those in Uzbekistan. Among the criteria on whichcountries may usefully be classified, those of economic development, politicalhistory, and national scale have been highlighted here as being particularlyuseful.
Yet even within these groupings, appropriate strategies for particularcountries must match the specific circumstances of those countries. Moreover,the identification and development of those strategies must be done by theleadership in those countries; and in many settings different policies areneeded for different provinces or districts. Only through such a process canpolicies gain the necessary tailoring.
However, during the process of working out strategies, much can belearned from comparative analysis to identify what has worked or failed in othercontexts, and why. Partly for this reason, partnerships with external agenciescan often be desirable during the formulation of policies.

59
Note on the Author
Mark Bray holds a personal chair professorship in comparative education atthe University of Hong Kong, where he has been based since 1986. Hepreviously taught in secondary schools in Kenya and Nigeria, and at theUniversities of Edinburgh, Papua New Guinea, and London. He has under-taken numerous consultancies for national governments and internationalagencies including Asian Development Bank, Commonwealth Secretariat,UNESCO, UNICEF, and the World Bank. This work has taken him to over 20countries in the Asian and Pacific region, as well as to numerous countries inAfrica, the Caribbean, Europe, and North America. Much of his research workhas focused on the costs and financing of education, and on the distinctivefeatures of education in small states. Correspondence: Comparative EducationResearch Centre, The University of Hong Kong, Pokfulam Road, Hong Kong,China. E-mail: [email protected].
60
References
Adamson, Bob, and Li, Titus. 1999. Primary and Secondary Schooling. InEducation and Society in Hong Kong and Macau: Comparative Perspec-tives on Continuity and Change, edited by Bray, Mark and Koo, Ramsey.Hong Kong: Comparative Education Research Centre, University of HongKong, 35-57.
Ahmed, Manzoor, Cheng, K.M., Jalaluddin, A.K., and Ramachandran, K. 1991.Basic Education and National Development: Lessons from China andIndia. New York: UNICEF.
Amadio, Massimo. 1997. Primary Education: Length of Studies and InstructionalTime. Educational Innovation and Information [International Bureau ofEducation, Geneva] 92: 2-7.
Asian Development Bank (ADB). 1987. Distance Education in Asia and thePacific. 2 Vols. Manila: ADB.
. 1990. Distance Education in South Asia. Manila: ADB.. 1994. Mongolia: Education and Human Resource. Manila: ADB.. 1995. The Financing of Education in Kazakstan. Annex 2 of Kazakstan
Education and Training Sector Study. Manila: ADB.. 1996a. Cambodia: Education Sector Strategy Study. Manila: ADB.. 1996b. Key Indicators of Developing Asian and Pacific Countries .
Manila: ADB.. 1996c. Kyrgyz Republic: Education and Training Master Plan. Manila:
ADB.. 1997a. Asian Development Bank: Basic Information. Manila: ADB.. 1997b. Emerging Asia: Changes and Challenges. Manila: ADB.. 1997c. Distance Education for Primary School Teachers . Manila: ADB.. 1999. Key Indicators of Developing Asian and Pacific Countries .
Manila: ADB.Bacchus, Kazim, and Brock, Colin, eds. 1993. The Challenge of Scale: Educa-
tional Development in the Small States of the Commonwealth. London:The Commonwealth Secretariat.
Bajracharya, H.R., Thapa, B.K., and Chitrakar, R. 1997. Nepal Case Study.Study of Trends, Issues and Policies in Education. Manila: ADB.
Bashir, Sajitha. 1994. Public versus Private in Primary Education: Comparisonsof School Effectiveness and Costs in Tamil Nadu. Ph.D. thesis, LondonSchool of Economics, University of London.
. 1997. The Cost Effectiveness of Public and Private Schools: KnowledgeGaps, New Research Methodologies, and an Application in India. InMarketizing Education and Health in Developing Countries: Miracle or

Education in Developing Asia 61
Mirage?, edited by Colclough, Christopher. Oxford: Clarendon Press, 124-64.
Becker, Gary S. 1975. Human Capital: A Theoretical and Empirical Analysis,with Special Reference to Education. Second edition. Princeton: PrincetonUniversity Press.
. 1995. Human Capital and Poverty Alleviation. HRO Working PaperNo.52. Washington, DC: World Bank.
Behrman, Jere, and Birdsall, Nancy. 1985. The Quality of Schooling: QuantityAlone is Misleading. American Economic Review 75(3):928-46.
Behrman, Jere, and Knowles, James C. 1999. Household Income and ChildSchooling in Vietnam. The World Bank Economic Review 13(2):211-56.
Bennell, Paul. 1996. Using and Abusing Rates of Return: A Critique of theWorld Bank’s 1995 Education Sector Review. International Journal ofEducational Development 16(3):235-48.
. 1998. Rates of Return to Education in Asia: A Review of the Evidence.Education Economics 6(2):107-20.
Bennell, Paul, and Segerstrom, Jan. 1998. Vocational Education and Trainingin Developing Countries: Has the World Bank got it Right? InternationalJournal of Educational Development 18(4):271-87.
Bhutan, Royal Government of. 1999. Education for All: An Assessment of theProgress. Thimphu: Education Division, Ministry of Health and Education.
Bishop, G. 1989. Alternative Strategies for Education. London: Macmillan.Bray, Mark. 1992a. Educational Planning in Small Countries. Paris: UNESCO.. 1992b. Multiple-Shift Schooling. In International Perspectives on
Educational Productivity, edited by Chapman, David W. and Walberg,Herbert J. Greenwich, Connecticut: JAI Press, 251-68.
. 1996a. Counting the Full Cost: Parental and Community Financing ofEducation in East Asia. Washington, DC: The World Bank in collaborationwith UNICEF.
. 1996b. Decentralization of Education: Community Financing. Wash-ington, DC: World Bank.
. 1998. Privatisation of Secondary Education: Issues and Policy Implica-tions. In Education for the Twenty-first Century: Issues and Prospects.Paris: UNESCO, 109-33.
.1999a. The Private Costs of Public Schooling: Household and Commu-nity Financing of Primary Education in Cambodia. Paris: UNESCO Inter-national Institute for Educational Planning in collaboration with UNICEF.
.1999b. The Shadow Education System: Private Tutoring and its Impli-cations for Planners. Fundamentals of Educational Planning No.61. Paris:UNESCO International Institute for Educational Planning.
. 2000. Community Partnerships in Education: Dimensions, Variations,and Implications . Paris: Education for All Secretariat, UNESCO.
Bray, Mark, Davaa, S., Spaulding, S., and Weidman J. 1994. Transition fromSocialism and the Financing of Higher Education: The Case of Mongolia.Higher Education Policy 7(4):36-42.

62 The Costs and Financing of Education
Bray, Mark with Lillis, Kevin, eds. 1988. Community Financing of Education:Issues and Policy Implications in Less Developed Countries . Oxford:Pergamon Press.
Bray, Mark, and Packer, Steve. 1993. Education in Small States: Concepts,Challenges and Strategies . Oxford: Pergamon Press.
Bray, Mark, and Thomas, R. Murray, eds. 1998. Financing of Education inIndonesia. Manila: Asian Development Bank/Hong Kong: ComparativeEducation Research Centre, University of Hong Kong.
Buckland, Peter. 1998. Making Quality Education Affordable: What have weLearned? Paper presented at ‘Basic Education: A Vision for the 21st
Century’, UNICEF Innocenti Global Seminar, Florence, Italy.Burgess, Robin S.L. 1997. Fiscal Reform and the Extension of Basic Health
and Education Coverage. In Marketizing Education and Health in Devel-oping Countries: Miracle or Mirage?, edited by Colclough, Christopher.Oxford: Clarendon Press, 307-46.
Carnoy, Martin. 1998. National Voucher Plans in Chile and Sweden: DidPrivatization Reforms Make for Better Education? Comparative EducationReview 42(3):309-37.
Chapman, David W. 1993. Improving the Effectiveness and Efficiency ofSchooling: What have we Learned from Eight Years of IEES Research?Tallahassee: Improving the Efficiency of Education Systems IEES Project,Learning Systems Institute, Florida State University.
Chapman, David, and Adams, Don. 2002. The Quality of Education: Dimen-sions and Strategies . Series ‘Education in Developing Asia’. Manila: AsianDevelopment Bank and Hong Kong: Comparative Education ResearchCentre, University of Hong Kong.
China, People’s Republic of (PRC). 2000. National Report for EFA 2000Assessment. Beijing: National Commission for UNESCO, Ministry of Edu-cation.
Chuard, Dominique, and Mingat, Alain. 1996. Analysis of Dropout and StudentLearning in Primary Education in Bhutan. RETA 5560 Regional Workshopon Dropout of Primary Students in South Asia: Prevention Strategies andNational Action Plans. Manila: ADB.
Colclough, Christopher with Lewin, Keith. 1993. Educating All the Children:Strategies for Primary Schooling in the South. Oxford: Clarendon Press.
Coombs, Philip H., and Hallak, Jacques. 1987. Cost Analysis in Education: ATool for Policy and Planning. Baltimore: Johns Hopkins University Press.
Coyne, Geoffrey, and Bray, Mark. 1999. External Aid and Education in SmallStates: Structural Issues, and Insights from a World Bank Assisted Projectin Solomon Islands. Asia Pacific Journal of Education 19(1):32-42.
Crossley, Michael, and Holmes, Keith. 1999. Educational Development in theSmall States of the Commonwealth: Retrospect and Prospect. London:The Commonwealth Secretariat.
Cummings, William K., and Riddell, Abby, eds. 1994. Alternative Policies forthe Finance, Control, and Delivery of Basic Education. InternationalJournal of Educational Research 21(8):751-76.

Education in Developing Asia 63
Curtin, T.R.C. 1996. Social Investment: Project Appraisal and Human CapitalTheory. Project Appraisal 11(2):66-78.
de Silva, Ariyadasa. 1994. Extra-School Tutoring in the Asian Context withSpecial Reference to Sri Lanka. Maharagama, Sri Lanka: Department ofEducational Research, National Institute of Education.
Desai, V.V. 1998. A New Miracle Needed. Far Eastern Economic Review161(1):36.
Deyoung, Alan J., and Balzhan, Suzhikova. 1997. Issues in Post-SovietSecondary School Reform: The Case of Kazakstan. International Journalof Educational Reform 6(4):441-54.
Dhanarajan, Gajaraj. 1996. Distance Education: Status and Issues. Paperpresented at the ADB/UNESCO Regional Seminar on Capacity Building inDistance Education for Training of Primary School Teachers, Bangkok, 21October.
Dhand, Harry. 1996. How Effective is Teachers’ Training through DistanceEducation in India? Perspectives in Education 12(3):127-42.
Ding, X. 1999. Distance Education in China. In Higher Education through Openand Distance Learning, edited by Harry, K. London: Routledge, 176-89.
Drèze, Jean, and Sen, Amartya. 1995. India and China. In India: EconomicDevelopment and Social Opportunity, edited by Drèze, Jean and Sen,Amartya. New Delhi: Oxford University Press, 57-87.
Eisemon, Thomas Owen. 1997. Reducing Repetition: Issues and Strategies .Fundamentals of Educational Planning No.55. Paris: UNESCO Interna-tional Institute for Educational Planning.
Erdenesuren, B. 1997. Mongolian Private Institutions: An Introduction to theirContributions and Problematic Issues requiring Urgent Rectification. InPrivate Higher Education in Asia and the Pacific, edited by Wongsothorn,Tong-In and Wang, Yibing. Bangkok: UNESCO Principal Regional Officefor Asia and the Pacific (PROAP) and Southeast Asia Ministers of Edu-cation Organisation (SEAMEO) Regional Centre for Higher Education andDevelopment (RIHED), Vol.II, 83-102.
Ernst and Young Ltd. 1996. Consultancy Study on the Local Student FinanceScheme. Hong Kong: Ernst and Young/Hong Kong Government StudentFinancial Assistance Agency.
Espínola, Viola. 1994. The Decentralization of the Education System in Chile1980-1994. Santiago: Centro de Investigación y Desarrollo de la Educatión.
Evans, Kiri, and Rorris, Adam. 1994. Cost-Effectiveness of Primary Educationin Myanmar. Yangon: UNICEF.
Fiske, Edward B. 1998. Wasted Opportunities when Schools Fail. Series‘Education for All: Status and Trends’. Paris: UNESCO.
Foster, P.J. 1966. The Vocational School Fallacy in Development Planning. InEducation and Economic Development , edited by Anderson, C.A. andBowman, M.J. Chicago: Aldine, 142-63.
Gannicott, Kenneth. 1998. Education Sector Reform in Transitional Economiesof Asia. In Social Sector Issues in Transitional Economies of Asia, editedby Brooks, Douglas and Myo Thant. Hong Kong: Oxford University Pressfor the Asian Development Bank, 117-72.

64 The Costs and Financing of Education
George, Cherian. 1992. About $260 Million a Year Spent on Tutors’ Fees.Straits Times, 4 April.
Gibson, U Saw. 1992. Non-Government Expenditure on Education. WorkingPaper No.4.3. Education Sector Study Project, Yangon: Myanmar Edu-cation Research Bureau.
Glewwe, Paul. 1991. Schooling Skills and the Returns to Government Invest-ment in Education: An Exploration using Data from Ghana. LivingStandards Measurement Study Working Paper 79. Washington, DC:Policy Research Department, World Bank.
Godement, François. 1999. The Downsizing of Asia. London: Routledge.Gonzales, Andrew. 1997. Philippines. In Asian Higher Education: An Interna-
tional Handbook and Reference Guide, edited by Postiglione, G. and Mak,G.C.L. Westport, Connecticut: Greenwood Press, 265-84.
Hakim, S., Seidenstat, P., and Bowman, G.W., eds. 1994. Privatizing Educationand Educational Choice: Concepts, Plans and Experiences. New York:Praeger.
Haq, M., and Haq, K. 1998. Human Development in South Asia 1998. Karachi:Oxford University Press.
Hinchliffe, Keith. 1986. Monetary and Non-Monetary Returns to Education inAfrica. EDT Discussion Paper 46. Washington, DC: Education andTraining Department, World Bank.
Hong Kong, Government of. 1997a. Direct Subsidy Scheme. AdministrationCircular No.50/97. Hong Kong: Education Department, Government ofHong Kong.
. 1997b. Progress Report: The 1997 Policy Address. Hong Kong:Government Printer.
Hossein, S. 1996. Unpublished data on costs and financing of education inMongolia. Washington, DC: World Bank.
Hülsmann, T. 1999. The Costs of Distance Education. In Higher Educationthrough Open and Distance Learning, edited by Harry, K. London:Routledge, 72-84.
International Consultative Forum on Education for All. 1996. Education for All:Achieving the Goal – Final Report of the Mid-Decade Meeting of the Inter-national Consultative Forum on Education for All. Paris: UNESCO.
James, Estelle. 1993. Why is there Proportionately More Enrollment in PrivateSchools in Some Countries? Working Paper Series 1069. Washington,DC: Country Economics Department, World Bank.
James, Estelle, and Benjamin, Gail. 1988. Public Policy and Private Educationin Japan. New York: Macmillan.
Jiang, Minghe. 1996. Education Sector in Transitional Economies: China CaseStudy Report. Document for TA Project ‘Social Sectors in Asian TransitionEconomies’. Manila: ADB.
Jimenez, E., Lockheed, M.E., Luna, E., and Paqueo, V. 1991. School Effectsand Costs for Private and Public Schools in the Dominican Republic.International Journal of Educational Research 15(5):393-410.
Johanson, R.K. 1999. Higher Education in the Philippines. Technical Back-ground Paper No.3 for ADB and the World Bank Philippine Education for
Education in Developing Asia 65
the 21st Century: The 1998 Philippines Education Sector Study. Manila:ADB.
Kazakhstan, Republic of 2000. Education for All − 2000: Country Report.Astana: Ministry of Education.
King, Kenneth, and Buchert, Lene, eds. 1999. Changing International Aid toEducation: Global Patterns and National Contexts. Paris: UNESCO Pub-lishing.
Kingdon, Geeta Gandhi. 1994. An Economic Evaluation of School Manage-ment-Types in Urban India: A Case Study of Uttar Pradesh. Ph.D. thesis,University of Oxford.
Kitaev, Igor. 1996. Educational Finance in Central Asia and Mongolia. Educa-tional Forum Series No.7. Paris: UNESCO International Institute for Edu-cational Planning.
. 1999. Private Education in Sub-Saharan Africa: A Re-examination ofTheories and Concepts Related to its Development and Finance. Paris:UNESCO International Institute for Educational Planning.
Klugman, J., Marnie, S., Micklewright, J., and O’Keefe, P. 1997. EnterpriseDivestiture of Kindergartens and Childcare Arrangements in Central Asia.In Household Welfare in Central Asia, edited by Falkingham, J., Klugman,J., Marnie, S., and Micklewright, J. London: Macmillan, 183-201.
Knight, J.B., and Sabot, R.H. 1990. Education, Productivity, and Inequality:The East African Natural Experiment. Oxford: Oxford University Press.
Kumar, Kuldip, ed. 1995. School Effectiveness and Learning Achievement atPrimary Stage: International Perspectives. New Delhi: National Council ofEducational Research and Training.
Kwong, Julia. 1996. The New Educational Mandate in China: Running Schools,Running Businesses. International Journal of Educational Development16(2):185-94.
. 1997. The Reemergence of Private Schools in Socialist China.Comparative Education Review 41(3):244-59.
Kyrgyz Republic, Ministry of Education, Science and Culture. 1997. CountryReport: Regional Study of Trends, Issues and Policies in Education.Bishkek: Ministry of Education, Science and Culture, and Manila: ADB.
Lee, Jungsoo. 1991. External Finance and the Role of Multilateral FinancialInstitutions in South Asia: Changing Patterns, Prospects and Challenges .ADB Economic Staff Paper No.50. Manila: ADB.
Leslie, Larry L. 1990. Rates of Return as an Informer of Public Policy: WithSpecial Reference to the World Bank and Third World Countries. HigherEducation 20(3):271-86.
Levin, Henry M. 1987. Education as a Public and Private Good. Journal ofPolicy Analysis and Management 6(4):628-41.
Lewin, Keith. 1993. Investing in Technical and Vocational Education: A Reviewof the Evidence. The Vocational Aspect of Education 45(3):217-27.
. 1998. Education in Emerging Asia: Patterns, Policies and Futures intothe 21st Century. International Journal of Educational Development 18(2):81-118.

66 The Costs and Financing of Education
Lewin, Keith, and Wang, Ying Jie. 1994. Implementing Basic Education inChina: Progress and Prospects in Rich, Poor and National Minority Areas.Research Report No.101. Paris: UNESCO International Institute for Edu-cational Planning.
Li Shouxin, and Bray, Mark. 1992. Attempting a Capitalist Form of Financing ina Socialist System: Student Loans in the People's Republic of China.Higher Education 23(4):375-87.
Lockheed, Marlaine E., and Jimenez, Emmanuel. 1994. Public and PrivateSchools in Developing Countries . HRO Working Paper No.43. Washing-ton, DC: World Bank.
Loxley, William. 1997. Preventing Primary School Dropout. ADB Review (May-June):21-24.
Maglen, L., and Manasan, R.G. 1999. Education Costs and Financing in thePhilippines . Technical Background Paper No.2 for ADB and the WorldBank Philippine Education for the 21st Century: The 1998 Philippines Edu-cation Sector Study. Manila: ADB.
Mallet, Victor. 2000. The Trouble with Tigers: The Rise and Fall of South-eastAsia. London: HarperCollins.
Marimuthu, T., Singh, J.S., Ahmad, K., Lim, H.K., Mukherjee, H., Oman, S.,Chelliah, T., Sharma, J.R., Salleh, N.M., Yong, L., Leong, L.T., Sukarman,S., Thong, L.K., and Jamaluddin, W. 1991. Extra-school Instruction, SocialEquity and Educational Quality. Report prepared for the InternationalDevelopment Research Centre, Singapore.
Martin, Anita H. 1996. A Case Study of School-Parent-Community Partner-ships via the Parent Teacher Associations (PTA). Bangkok: East Asia andPacific Regional Office, UNICEF.
McMahon, W.W. 1997. Conceptual Framework for Measuring the Total Socialand Private Benefits of Education. International Journal of EducationalResearch 27(6):453-81.
. 1998. Education and Growth in East Asia. Economics of EducationReview 17(2):159-72.
Mehrotra, Santosh, and Buckland, Peter. 1998. Managing Teacher Costs forAccess and Quality. Staff Working Papers, Evaluation, Policy andPlanning Series No. EPP-EVL-98-004. New York: UNICEF.
Middleton, J., Ziderman, A., and van Adams, A. 1993. Skills for Productivity:Vocational Education and Training in Developing Countries. New York:Oxford University Press.
Min, Weifang. 1997. Basic Education and National Development: CurrentIssues and Strategies for China. Educational Research Journal [HongKong Educational Research Association] 12(2):142-51.
Mingat, Alain. 1995. Towards Improving our Understanding of the Strategy ofHigh Performing Asian Economies in the Education Sector. Paper pre-sented at the International Conference on Financing Human ResourceDevelopment in Advanced Asian Economies, Asian Development Bank,Manila, 17-18 November.
. 1996. Elements on the Cost and Financing of Education in Lao PDR.Dijon, France: University of Dijon.
Education in Developing Asia 67
. 1998. The Strategy used by High-performing Asian Economies inEducation: Some Lessons for Developing Countries. World Development26(4):695-715.
Mingat, Alain, and Tan, Jee-Peng. 1996. The Full Social Returns to Education:Estimates Based on Countries' Economic Growth Performance. HumanCapital Development Working Paper No.73. Washington, DC: World Bank.
Mongolia, People’s Republic of. 1991, National Economy of the MPR 1921-1991. Ulaanbaatar: State Statistical Office of the Mongolian People'sRepublic.
Moore, M.G. 1992. Distance Education at Postsecondary Level. In The Ency-clopedia of Higher Education, edited by Clark, Burton R. and Neave, Guy.Oxford: Pergamon Press, 1097-106.
Morris, Paul, and Sweeting, Anthony, eds. 1995. Education and Developmentin East Asia. New York: Garland.
Mundle, S. 1999. Financing Human Development: Some Lessons fromAdvanced Asian Countries. World Development 26(4):659-72.
Newell, A., and Reilly, B. 1999. Rates of Return to Educational Qualifications inthe Transitional Economies. Education Economics 7(1):67-84.
Organisation for Economic Co-operation and Development (OECD). 1998.Human Capital Investment: An International Comparison. Paris: Centre forEducational Research and Innovation, Organisation for EconomicCo-operation and Development.
Paik, Sung-Joon. 1995. Educational Finance in Korea: Its Development,Current Issues, and Policy Directions. Paper for the workshop onFinancing Human Resource Development in Asia. Manila: ADB.
Penrose, Perran. 1993. Affording the Unaffordable: Planning and FinancingEducation Systems in Sub-Saharan Africa. Occasional Papers on Educa-tion No.7. London: Overseas Development Administration.
Perraton, Hilary. 1994. Comparative Cost of Distance Teaching in HigherEducation: Scale and Quality. In Economics of Distance Education:Recent Experience, edited by Dhanarajan, G., Ip, P.K., Yuen, K.A., andSwales, C. Hong Kong: Open Learning Institute Press, 19-30.
. 1997. Cost-Effectiveness in Primary Teacher Training throughDistance Education. In Distance Education for Primary School PrimaryTeachers. Manila: ADB, 111-55.
Perraton, Hilary, and Creed, Charlotte. 2000. Applying New Technologies andCost-effective Delivery Systems in Basic Education. Paris: Education forAll Secretariat, UNESCO.
Pham Quang Sang, and Sloper, David. 1995. Funding and Financial Issues. InHigher Education in Vietnam: Change and Response, edited by Sloper,David and Le Thac Can. Singapore: Institute of Southeast Asian Studies,161-81.
Potashnik, Michael, and Adkins, Douglas. 1996. Cost Analysis of InformationTechnology Projects in Education: Experiences from Developing Countries.Education and Technology Series Vol.1, No.3. Washington, DC: WorldBank.
68 The Costs and Financing of Education
Psacharopoulos, George. 1991. Vocational Education Theory, VOCED 101:Including Hints for ‘Vocational Planners’. International Journal of Educa-tional Development 11(3):193-99.
. 1994. Returns to Investment in Education: A Global Update. WorldDevelopment 22(9):1325-43.
. 1995. Building Human Capital for Better Lives . Washington, DC: WorldBank.
Rau, D.C., Lin, T.C., Dai, C.Y., and Hsu, H.G. 1996. The Current Reform ofVocational Education Program for Secondary School in Taiwan. Paperpresented at the Conference of the Comparative Education Society ofAsia, Tokyo.
Rana, Pradumna B. 1993. Reforms in the Transitional Economies of Asia.Occasional Paper No.5. Manila: Economics and Development ResourceCenter, ADB.
Riddell, Abby R. 1993. The Evidence on Public/Private Educational Trade-offsin Developing Countries. International Journal of Educational Development13(4):373-86.
Rounds Parry, Taryn. 1997. Theory Meets Reality in the Education VoucherDebate: Some Evidence from Chile. Education Economics 5(3):307-31.
Rugh, Andrea, and Bossert, Heather. 1998. Involving Communities: Partici-pation in the Delivery of Education Programs. Washington, DC: USAID.
Sawada, Yasuyuki. 1999. Community Participation, Teacher Effort, and Edu-cational Outcome: The Case of El Salvador’s EDUCO Program. Wash-ington, DC: World Bank.
Schultz, T.W. 1961. Investment in Human Capital. American Economic Review51(1):1-17.
. 1987. Education and Population Quality. In Economics of Education:Research and Studies , edited by Psacharopoulos, George. Oxford:Pergamon Press, 11-14.
Selvaratnam, Viswanathan. 1994. Innovations in Higher Education: Singaporeat the Competitive Edge. Technical Paper No.222. Washington, DC: WorldBank.
Serageldin, Ismail. 1995. Nurturing Development: Aid and Cooperation inToday's Changing World. Washington, DC: World Bank.
Solmon, L.C., and Fagnano, C.L. 1995. Benefits of Education. In InternationalEncyclopedia of Economics of Education, edited by Carnoy, Martin.Second edition. Oxford: Pergamon Press, pp.114-25.
Tajikistan, Republic of. 2000. Education for All 2000: National Report.Dushanbe: Ministry of Education.
Tan, J.P., and Mingat, A. 1992. Education in Asia: A Comparative Study ofCost and Financing. Washington, DC: World Bank.
Task Force on Higher Education and Society. 2000. Higher Education inDeveloping Countries: Peril and Promise. Washington, DC: World Bank.
Thapa, B.K., and Singh, G.B. 1995. Financial Situation of Primary Schools inNepal: Implications for Educational Planning. Kathmandu: ResearchCentre for Educational Innovation and Development, Tribhuvan University.

Education in Developing Asia 69
Thomas, C. 1996. Unpublished data on costs and financing of education in LaoPeople’s Democratic Republic. Washington, DC: World Bank.
Tilak, Jandhyala B.G. 1997a. Lessons from Cost Recovery in Education. InMarketizing Education and Health in Developing Countries: Miracle orMirage?, edited by Colclough, Christopher. Oxford: Clarendon Press, 63-89.
. 1997b. The Dilemma of Reforms in Financing Higher Education inIndia. Higher Education Policy 10(1):7-21.
. 2000. Education and Development: Lessons from Asian Experience.New Delhi: National Institute of Educational Planning and Administration.
Tisch, Sarah J., and Wallace, Michael B. 1994. Dilemmas of DevelopmentAssistance: The What, Why and Who of Foreign Aid. Colorado: Westview.
Toh, M.H., and Wong, C.S. 1999. Rates of Return to Education in Singapore.Education Economics 7(3):235-53.
Tsang, Mun C. 1994. Cost Analysis of Educational Inclusion of MarginalizedPopulations. Fundamentals of Educational Planning 48, Paris: UNESCOInternational Institute for Educational Planning.
United Nations Educational, Scientific and Cultural Organization (UNESCO).1998. World Education Report 1998: Teachers and Teaching in aChanging World. Paris: UNESCO.
. 2000a. A Synthesis Report of Education for All Assessment in the Eastand South East Asia Sub-Region. Bangkok: UNESCO Principal RegionalOffice for Asia and the Pacific.
. 2000b. A Synthesis Report of Education for All Assessment in theSouth and West Asia Sub-Region. Bangkok: UNESCO Principal RegionalOffice for Asia and the Pacific.
. 2000c. A Synthesis Report of Education for All Assessment in theTrans-Caucasus and Central Asia Sub-Region. Bangkok: UNESCO Prin-cipal Regional Office for Asia and the Pacific.
. 2000d. Pacific Regional Synthesis: Education for All 2000 Assessment .Bangkok: UNESCO Principal Regional Office for Asia and the Pacific.
United Nations Children’s Fund (UNICEF). 1997. The Case for Pre-PrimaryEducation: The Cost Effectiveness of Shishu Kaksha Centres in Nepal.Kathmandu: UNICEF.
.1998. Education for All? The MONEE Project, Regional MonitoringReport No.5. Florence: UNICEF International Child Development Centre.
United Nations Development Programme (UNDP). 1999a. Human Develop-ment Report 1999. New York: Oxford University Press for the UnitedNations Development Programme.
. 1999b. Pacific Human Development Report 1999. Suva: United NationsDevelopment Programme.
. 2000. Contributions of Multilateral and Bilateral Agencies TowardAchieving EFA Goals in the Asia-Pacific Region. Bangkok: UNESCOPrincipal Regional Office for Asia and the Pacific.
United Nations Economic Commission for Africa. 1997. Addis AbabaConsensus on Principles on Cost Sharing in Education and Health in Sub-

70 The Costs and Financing of Education
Saharan Africa. Addis Ababa: United Nations Economic Commission forAfrica.
Valisno, Mona D. 1997. Private Higher Education in the Philippines: Perform-ance and Challenges in the 21st Century. In Private Higher Education inAsia and the Pacific, edited by Wongsothorn, Tong-In, and Wang, Yibing.Bangkok: UNESCO Principal Regional Office for Asia and the Pacific(PROAP) and Southeast Asia Ministers of Education Organisation(SEAMEO) Regional Centre for Higher Education and Development(RIHED), Vol.II, 86-102.
World Conference on Education for All (WCEFA). 1990a. World Conference onEducation for All: Final Report. New York: Inter-Agency Commission,WCEFA.
. 1990b. World Declaration on Education for All. New York: Inter-AgencyCommission, WCEFA.
Weale, Martin. 1993. A Critical Evaluation of Rate of Return Analysis. Eco-nomic Journal 103: 729-37.
Wei, X., Tsang, M.C., Xu, W., and Chen, L.K. 1999. Education and Earnings inRural China. Education Economics 7(2):167-87.
West, Edwin G. 1997. Education Vouchers in Principle and Practice: A Survey.The World Bank Research Observer 12(1):83-103.
West, Lorraine A. 1995. Regional Economic Variation and Basic Education inRural China. Robert S. McNamara Fellowship Report. Washington, DC.World Bank.
Windham, Douglas. 1988. Improving the Efficiency of Educational Systems:Indicators of Educational Effectiveness and Efficiency. Tallahassee:Improving the Efficiency of Education Systems IEES Project, LearningSystems Institute, Florida State University.
Wirjomartono, S.H., Jiyono, Suryadi, A., Indriyanto, B., Purwadi, A., Cahyana,A., and Chamidi, S. 1997. Indonesia Case Study. Study of Trends, Issuesand Policies in Education. Manila: ADB.
Wong Suk Ying, ed. 1993. Distance Education in Asia and the Pacific: CountryPapers. Paris: UNESCO.
Wongsothorn, Tong-In, and Wang, Yibing, eds. 1997. Private Higher Educationin Asia and the Pacific. Bangkok: UNESCO Principal Regional Office forAsia and the Pacific (PROAP) and Southeast Asia Ministers of EducationOrganisation (SEAMEO) Regional Centre for Higher Education and De-velopment (RIHED).
Woodhall, Maureen. 1987. Lending for Learning: Designing a Student LoanProgramme for Developing Countries . London: The CommonwealthSecretariat.
. 1991. Student Loans in Higher Education: Asia. Paris: UNESCOInternational Institute for Educational Planning.
. 1997. The Reform of Higher Education Finance in DevelopingCountries: Some Implementation Issues. Paper presented at the WorldBank Human Development Week, University of Maryland, College Park.
World Bank. 1993a. The East Asian Miracle: Economic Growth and PublicPolicy. New York: Oxford University Press.

Education in Developing Asia 71
. 1993b. Viet Nam: Transition to the Market . Washington, DC: WorldBank.
. 1994a. Higher Education: The Lessons of Experience. Washington,DC: World Bank.
. 1994b. Nepal: Critical Issues in Secondary Education and Options forReform. Washington, DC: World Bank.
. 1995. Priorities and Strategies for Education: A World Bank Review.Washington, DC: World Bank.
. 1996. Bangladesh: Education Expenditure Review. Washington, DC:World Bank.
. 1997a. China: Higher Education Reform. Washington, DC: WorldBank.
. 1997b. Indonesia: Suggested Priorities for Education. Washington, DC:World Bank.
. 1997c. Primary Education in India. Washington, DC: World Bank.. 1997d. Vietnam: Education Financing. Washington, DC: World Bank.. 1997e. World Development Report 1997. Washington, DC: World
Bank.. 1999. Education Sector Strategy. Washington, DC: World Bank.Young, Mary Eming. 1996. Early Child Development: Investing in the Future.
Washington, DC: World Bank.Yang, Jin. 1998. General or Vocational? The Tough Choice in the Chinese
Education Policy. International Journal of Educational Development 8(4):289-304.
Zhang, Minxuan. 1997. Conceptions and Choices: A Comparative Study onStudent Financial Support Policies . Beijing: People’s Education Press [inChinese].
Ziderman, Adrian and Albrecht, Douglas. 1995. Financing Universities inDeveloping Countries. London: Falmer Press.
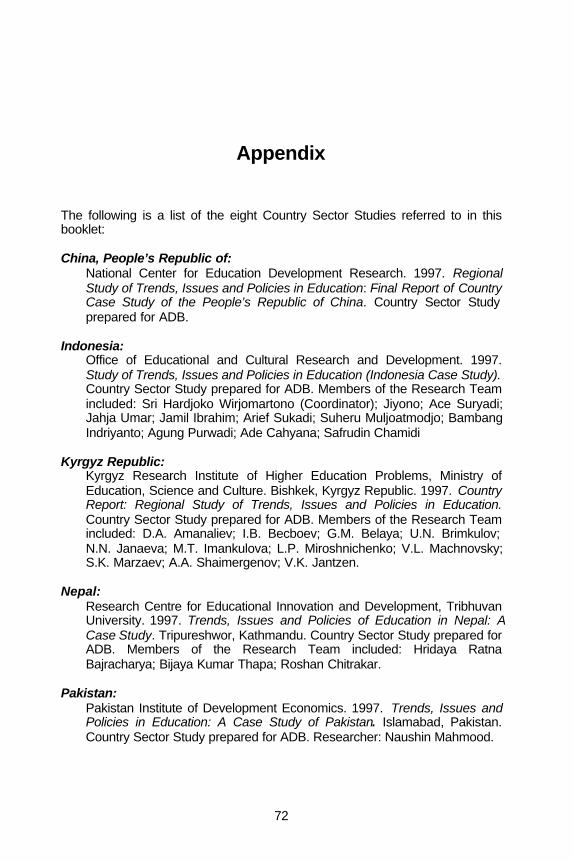
72
Appendix
The following is a list of the eight Country Sector Studies referred to in thisbooklet:
China, People’s Republic of:National Center for Education Development Research. 1997. RegionalStudy of Trends, Issues and Policies in Education: Final Report of CountryCase Study of the People’s Republic of China. Country Sector Studyprepared for ADB.
Indonesia:Office of Educational and Cultural Research and Development. 1997.Study of Trends, Issues and Policies in Education (Indonesia Case Study).Country Sector Study prepared for ADB. Members of the Research Teamincluded: Sri Hardjoko Wirjomartono (Coordinator); Jiyono; Ace Suryadi;Jahja Umar; Jamil Ibrahim; Arief Sukadi; Suheru Muljoatmodjo; BambangIndriyanto; Agung Purwadi; Ade Cahyana; Safrudin Chamidi
Kyrgyz Republic:Kyrgyz Research Institute of Higher Education Problems, Ministry ofEducation, Science and Culture. Bishkek, Kyrgyz Republic. 1997. CountryReport: Regional Study of Trends, Issues and Policies in Education.Country Sector Study prepared for ADB. Members of the Research Teamincluded: D.A. Amanaliev; I.B. Becboev; G.M. Belaya; U.N. Brimkulov;N.N. Janaeva; M.T. Imankulova; L.P. Miroshnichenko; V.L. Machnovsky;S.K. Marzaev; A.A. Shaimergenov; V.K. Jantzen.
Nepal:Research Centre for Educational Innovation and Development, TribhuvanUniversity. 1997. Trends, Issues and Policies of Education in Nepal: ACase Study. Tripureshwor, Kathmandu. Country Sector Study prepared forADB. Members of the Research Team included: Hridaya RatnaBajracharya; Bijaya Kumar Thapa; Roshan Chitrakar.
Pakistan:Pakistan Institute of Development Economics. 1997. Trends, Issues andPolicies in Education: A Case Study of Pakistan. Islamabad, Pakistan.Country Sector Study prepared for ADB. Researcher: Naushin Mahmood.

Education in Developing Asia 73
Papua New Guinea:Institute of National Affairs. 1997. Regional Study of Trends, Issues andPolicies in Education: Papua New Guinea Country Case Study. CountrySector Study prepared for ADB.
Philippines:Development Academy of the Philippines. 1997. Policies, Trends andIssues in Philippine Education. A Case Study Commissioned byUNESCO-Bangkok, Thailand for ADB. The Task Force Members included:Ramon C. Bacani; Napoleon B. Imperial; Juan M. Sabulao; MarioTaguiwalo; Charles C. Villaneuva; Carmencita T. Abella; Alma Bella Z.Generao. Research Team Members included: Elizabeth Y. Manugue -Research Lead; Eduardo T. Gonzalez; Anicetas C. Laquian; Merialda F.Nadunop; Mercedita C. Amar; Shiela D. Valencia.
Viet Nam:National Institute for Educational Development. 1997. Regional Study ofTrends, Issues and Policies in Education: Viet Nam Case Study. Hanoi,Viet Nam. Country Sector Study prepared for ADB.
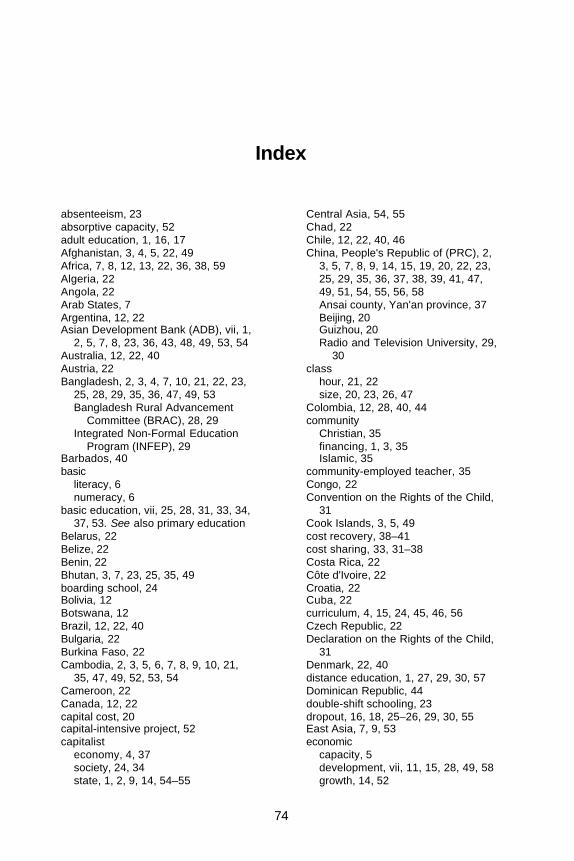
74
Index
absenteeism, 23absorptive capacity, 52adult education, 1, 16, 17Afghanistan, 3, 4, 5, 22, 49Africa, 7, 8, 12, 13, 22, 36, 38, 59Algeria, 22Angola, 22Arab States, 7Argentina, 12, 22Asian Development Bank (ADB), vii, 1,
2, 5, 7, 8, 23, 36, 43, 48, 49, 53, 54Australia, 12, 22, 40Austria, 22Bangladesh, 2, 3, 4, 7, 10, 21, 22, 23,
25, 28, 29, 35, 36, 47, 49, 53Bangladesh Rural Advancement
Committee (BRAC), 28, 29Integrated Non-Formal Education
Program (INFEP), 29Barbados, 40basic
literacy, 6numeracy, 6
basic education, vii, 25, 28, 31, 33, 34,37, 53. See also primary education
Belarus, 22Belize, 22Benin, 22Bhutan, 3, 7, 23, 25, 35, 49boarding school, 24Bolivia, 12Botswana, 12Brazil, 12, 22, 40Bulgaria, 22Burkina Faso, 22Cambodia, 2, 3, 5, 6, 7, 8, 9, 10, 21,
35, 47, 49, 52, 53, 54Cameroon, 22Canada, 12, 22capital cost, 20capital-intensive project, 52capitalist
economy, 4, 37society, 24, 34state, 1, 2, 9, 14, 54–55
Central Asia, 54, 55Chad, 22Chile, 12, 22, 40, 46China, People's Republic of (PRC), 2,
3, 5, 7, 8, 9, 14, 15, 19, 20, 22, 23,25, 29, 35, 36, 37, 38, 39, 41, 47,49, 51, 54, 55, 56, 58Ansai county, Yan'an province, 37Beijing, 20Guizhou, 20Radio and Television University, 29,
30class
hour, 21, 22size, 20, 23, 26, 47
Colombia, 12, 28, 40, 44community
Christian, 35financing, 1, 3, 35Islamic, 35
community-employed teacher, 35Congo, 22Convention on the Rights of the Child,
31Cook Islands, 3, 5, 49cost recovery, 38–41cost sharing, 33, 31–38Costa Rica, 22Côte d'Ivoire, 22Croatia, 22Cuba, 22curriculum, 4, 15, 24, 45, 46, 56Czech Republic, 22Declaration on the Rights of the Child,
31Denmark, 22, 40distance education, 1, 27, 29, 30, 57Dominican Republic, 44double-shift schooling, 23dropout, 16, 18, 25–26, 29, 30, 55East Asia, 7, 9, 53economic
capacity, 5development, vii, 11, 15, 28, 49, 58growth, 14, 52
Education in Developing Asia 75
Ecuador, 22education
expenditure, 2, 6–10, 11, 20, 21, 38,47
investment, vii, 1, 11, 13, 14, 15, 16,17, 11–17, 27, 29, 53, 56
nonformal, 1, 16, 17, 29, 48, 50, 51quality, 1, 6, 16, 18, 46, 48, 57
Egypt, 22El Salvador, 28enrollment rate, 4, 5, 6, 8, 10, 15, 24,
25, 32, 53, 57equity, 1, 29, 30, 32, 33, 57Europe, 7, 8, 13, 22, 36, 38, 59external aid, 2, 48, 51, 52, 56Fiji Islands, 2, 3, 5, 7, 8, 9, 49Finland, 40France, 22free education, 31, 32, 33, 34, 57Germany, 22Ghana, 22globalization, 56grant, 33, 38, 39–41, 48, 49, 51, 57.
See also scholarshipGross Domestic Product (GDP), 36,
37, 51, 54per capita, 2, 3, 23
Gross National Product (GNP), 6, 7, 8per capita, 2, 3, 8, 21, 36
Guinea, 22Haiti, 22headteacher, 45, 46higher education, 1, 6, 10, 11, 12, 13,
14, 19, 20, 32, 38, 41, 42, 48, 50,54, 55, 57, 58. See also tertiaryeducation
high-performing Asian economies(HPAEs), 53
Honduras, 22, 40Hong Kong, China, 3, 4, 5, 6, 7, 8, 12,
26, 29, 39, 40, 41, 47, 49, 53, 59Direct Subsidy Scheme, 42
householdbudget, 48cost, 9expenditure, 9, 10financing, 1, 10
Human Development Index, 2, 3Hungary, 22India, 3, 4, 5, 7, 10, 12, 13, 14, 23, 25,
29, 30, 39, 41, 45, 49, 53, 55, 56Andhra Pradesh, 13
Indira Gandhi National OpenUniversity, 29
Maharashtra, 13Tamil Nadu, 45Uttar Pradesh, 45
Indonesia, 3, 4, 5, 7, 8, 10, 12, 17, 22,23, 25, 26, 29, 35, 36, 40, 48, 49,50, 53
inherited wage structure, 14input-output ratio, 26internal efficiency, 26, 29International Covenant on Economic,
Social and Cultural Rights, 31Iran, 22Italy, 22Jamaica, 12, 40Japan, 12, 21, 22, 29, 40, 45, 47Jomtien World Conference on
Education for All, 17Kazakhstan, 3, 5, 7, 8, 14, 24, 48, 49,
54, 55Kenya, 40kindergarten, 1. See also preprimary
education, preschool educationKiribati, 3, 4, 5, 7, 8, 49Korea, Republic of, 3, 5, 7, 8, 12, 22,
36, 49Korea Air and Correspondence
University, 30Kuwait, 22Kyrgyz Republic, 2, 3, 5, 6, 7, 48, 49,
54, 55labor
force, 13, 55market, 15, 16, 17, 30
Lao People's Democratic Republic(Lao PDR), 2, 3, 5, 6, 7, 8, 19, 20,22, 23, 37, 49, 51, 54
Latin America, 7, 12, 13Libya, 22loan, 32, 33, 38, 39–41, 48, 51, 52, 57Luxembourg, 22Macau, 42Madagascar, 22Malaysia, 2, 3, 5, 7, 8, 12, 22, 25, 36,
47, 49, 53Maldives, 3, 5, 7, 8, 49Mali, 22Malta, 22market economy, 37Marshall Islands, 3, 5, 49Mauritania, 22Mexico, 12, 22
76 The Costs and Financing of Education
Micronesia, Federated States of, 3, 49Middle East, 13, 22, 36, 37, 38Mongolia, 2, 3, 4, 5, 7, 10, 36, 37, 41,
49, 51, 53, 54Myanmar, 3, 5, 22, 47, 49, 52Nauru, 3, 49, 53, 55Nepal, 2, 3, 5, 7, 8, 12, 16, 20, 23, 25,
33, 35, 36, 41, 48, 49, 51New Zealand, 12, 22Nicaragua, 22nongovernment organization, 34nonteaching staff, 23, 24, 54North America, 7, 8, 22, 59Norway, 22, 40Oceania, 7, 8Oman, 22Organisation for Economic Co-
operation and Development(OECD), 13
Pakistan, 3, 4, 5, 7, 12, 14, 23, 25, 29,35, 36, 49Allama Iqbal Open University, 29, 30
Panama, 22Papua New Guinea, 3, 5, 8, 12, 36, 49,
59Paraguay, 12, 22Peru, 12, 22Philippines, 2, 3, 5, 7, 8, 10, 12, 14, 21,
22, 23, 25, 29, 34, 35, 36, 44, 49adopt-a-school program, 34Manila, 34
Poland, 22policy making, 16, 23political ideology, 2population, 2, 3, 4, 24, 25, 55
density, 4growth, 11, 34, 52
Portugal, 22preprimary education, 5, 6, 7, 8, 16, 17.
See also kindergarten, preschooleducation
preschool education, 16, 17, 18, 24,54, 55, 58. See also kindergarten,preprimary education
primaryeducation, 4, 5, 6, 7, 8, 9, 10, 11,
12, 13, 14, 17, 19, 20, 21, 22, 23,24, 25, 26, 28, 29, 31, 34, 47, 48,51, 57. See also basic education
school, 5, 6, 9, 10, 16, 21, 22, 23,25, 32, 35, 45, 47, 50
privatecost, 18, 43–48
economic return, 15enrollment, 8, 9, 44expenditure, 8–10, 11, 47financing, 1, 9, 43, 56institution, 10, 54, 56rate of return, 11, 12, 13, 48school, 9, 10, 43, 44, 45, 46tutoring, 46–48, 56
privatization, 4, 42–48, 53, 58promotion rate, 25, 26public
budget, 48, 54education, 9, 31, 46institution, 57school, 9, 33, 43, 44, 45, 46
pupil/teacher ratio, 23purchasing power parity (PPP) dollars,
2, 3Qatar, 22Quebec, 40rate-of-return analysis, 11, 12, 13, 14,
15, 48, 54regional
aggregation, 6, 13, 21inequality, 20, 35
religion, 2, 35Buddhism, 3Catholic church, 10Christianity, 2Hinduism, 3Islam, 2, 35
remote area, 24, 25. See also ruralarea
repetition, 16, 18, 25–26, 29, 48resource mobilization, 51rural area, 13, 26, 42, 46. See also
remote areaSamoa, 3, 5, 7, 8, 49Saudi Arabia, 22scholarship, 57. See also grantsecondary
education, 4, 5, 6, 7, 8, 10, 11, 12,13, 14, 15, 17, 19, 20, 23, 25, 26,29, 31, 32, 33, 34, 44, 47, 51, 57
school, 13, 15, 16, 20, 33, 34, 35,42, 44, 45, 50, 59
sectarian organization, 10Senegal, 12Singapore, 2, 3, 4, 5, 10, 12, 14, 20,
21, 22, 26, 34, 36, 39, 42, 47, 49, 53Endowment Funds, 42Independent Schools Scheme, 10
single-shift schooling, 23

Education in Developing Asia 77
Slovakia, 22social
mobility, 31rate of return, 12, 13, 14, 16
social security scheme, 37socialism, 2, 4, 9, 34, 51, 52, 54Solomon Islands, 2, 3, 4, 5, 7, 8, 49, 58South America, 22South Asia, 7, 16Soviet system, 24, 54Soviet Union, 22, 24, 48, 51, 54, 55Spain, 22Sri Lanka, 3, 5, 7, 8, 12, 22, 23, 25, 29,
36, 49Sudan, 22Swaziland, 22Sweden, 40Syrian Arab Republic, 22Taipei,China, 3, 7, 12, 15, 49Tajikistan, 3, 5, 49, 54, 55Tanzania, 22, 44taxation, 35, 36, 37, 52teacher
deployment, 54education, 20, 24, 56morale, 23qualification, 45, 47salary, 8, 19, 20, 21, 23, 46training, 19, 29, 56working hours, 21, 22
teachingclassroom, 22, 27multigrade, 24technology-based, 27
technical/vocational education, 1, 14,15, 16, 17, 19, 24, 31, 48, 51
technologycomputer, 26, 27, 30, 53information, 26, 28Internet, 26, 30
tertiaryeducation, 1, 4, 5, 6, 7, 10, 14, 16,
17, 18, 19, 25, 29, 32, 33, 34, 37,38–41, 51, 52, 57. See alsohigher education
graduate, 32institution, 29, 32, 41
Thailand, 3, 5, 7, 8, 10, 12, 14, 22, 25,29, 36, 44, 49, 53Sukhothai Thammathirat Open
University, 29, 30Togo, 22Tonga, 3, 5, 7, 8, 9, 49tuition fee, 9, 10, 31, 32, 33, 34, 38, 39,
46, 55, 57Tunisia, 22Turkey, 22Tuvalu, 2, 3, 5, 49, 55Uganda, 22unemployment, 13, 17unit costs, 2, 16, 17–31, 32, 46United Arab Emirates, 22United Kingdom, 12, 28, 40United Nations, 57United Nations Declaration of Human
Rights, 31United Nations Development
Programme (UNDP), 2, 48United Nations Economic Commission
for Africa, 34United States, 12, 40urban area, 13, 26, 37, 42, 46, 47Uruguay, 22Uzbekistan, 3, 5, 14, 22, 48, 49, 54, 55,
58Vanuatu, 2, 3, 5, 7, 35, 49Venezuela, 22, 40Viet Nam, 2, 3, 5, 6, 7, 9, 10, 18, 19,
22, 37, 41, 42, 47, 49, 51, 54vocational education and training
(VET), 15. See alsotechnical/vocation education
voucher scheme, 46World Bank, The, 11, 12, 15, 38, 48World Declaration on Education for All,
34Yugoslavia, 22Zaire, 22Zimbabwe, 12, 22