the cost of living and real wages in eighteenth century...
TRANSCRIPT
The Cost of Living and Real Wages in Eighteenth Century EnglandAuthor(s): Elizabeth W. GilboyReviewed work(s):Source: The Review of Economics and Statistics, Vol. 18, No. 3 (Aug., 1936), pp. 134-143Published by: The MIT PressStable URL: http://www.jstor.org/stable/1927839 .
Accessed: 13/03/2013 05:02
Your use of the JSTOR archive indicates your acceptance of the Terms & Conditions of Use, available at .http://www.jstor.org/page/info/about/policies/terms.jsp
.JSTOR is a not-for-profit service that helps scholars, researchers, and students discover, use, and build upon a wide range ofcontent in a trusted digital archive. We use information technology and tools to increase productivity and facilitate new formsof scholarship. For more information about JSTOR, please contact [email protected].
.
The MIT Press is collaborating with JSTOR to digitize, preserve and extend access to The Review ofEconomics and Statistics.
http://www.jstor.org
This content downloaded on Wed, 13 Mar 2013 05:02:10 AMAll use subject to JSTOR Terms and Conditions
THE COST OF LIVING AND REAL WAGES IN EIGHTEENTH CENTURY ENGLAND
THE course of the cost of living and that of real wages over time is a subject of never
failing interest to the economist.' In studies of the business cycle, in explanations of the chang- ing well-being of the laboring class, as in vari- ous other connections, trends of living costs and of real wages are important features. One does not need to cite examples, since the phenomenon is so common.
The movements of these indices during the eighteenth century are of special significance, not merely to the economic historian but also to the economic theorist. This century was one
of particularly important changes on the tech- nical side of industrial production. What effect did these changes have on the well-being of the working class? Were all parts of England simi- larly affected?
The author has worked previously on the English wage situation in the eighteenth century and has made some attempt to estimate real wages on the basis of wheat prices and contem- porary comment.2 At the time of this earlier research, there were no adequate data from which a cost of living index for this period might be derived.
Thanks to the generosity of Sir William Bever- idge and the English section of the International Committee on Price History, some sixty price series covering the eighteenth century have been made available to Dr. Boody. Some of these
series go back to i66o; most of them to I695. A number of them extend to I8I5 or I820. All were taken from original manuscript sources and have not as yet been published.3 Thirty of them were sufficiently continuous to be utilized in our cost of living index. Even with these, a great amount of interpolation was necessary. The methods by which the latter was accomplished are explained in detail in the statistical appendix, but here it may be said that Tooke, Rogers, and the Parliamentary Reports provided the main bases for such expediencies.'
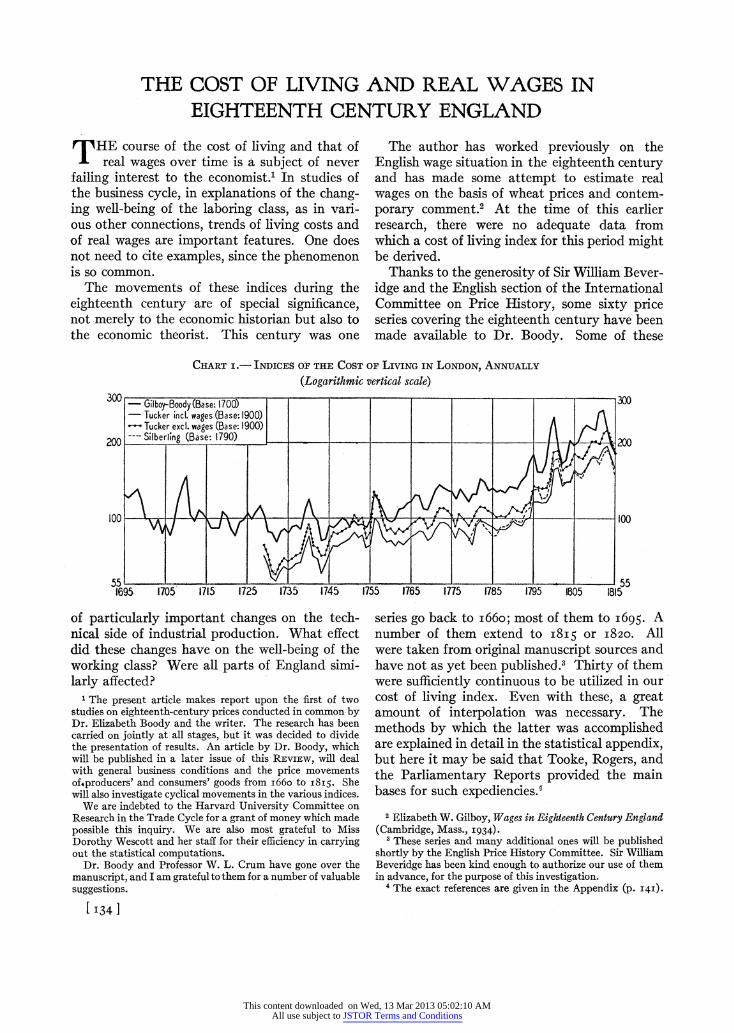
CHART I.- INDICES OF THE COST OF LIViNG IN LONDON, ANNUALLY (Logarithmic vertical scale)
- Gilboy-Boody (Base: 1700) 300 Tucker incJ. wages (Base: 1900) Tucker excl. wages (Base: 1900) Silberling_(Base-. 1790) _____
100 181
55 ___ __
1695 1705 1715 1725 1735 1745 1755 1765 1775 1785 1795 1805 1815
1 The present article makes report upon the first of two studies on eighteenth-century prices conducted in common by Dr. Elizabeth Boody and the writer. The research has been carried on jointly at all stages, but it was decided to divide the presentation of results. An article by Dr. Boody, which will be published in a later issue of this REVIEW, will deal with general business conditions and the price movements of.producers' and consumers' goods from i66o to I8I5. She will also investigate cyclical movements in the various indices.
We are indebted to the Harvard University Committee on Research in the Trade Cycle for a grant of money which made possible this inquiry. We are also most grateful to Miss Dorothy Wescott and her staff for their efficiency in carrying out the statistical computations.
Dr. Boody and Professor W. L. Crum have gone over the manuscript, and I am grateful to them for a number of valuable suggestions.
2 Elizabeth W. Gilboy, Wages in Eighteenth Century England (Cambridge, Mass., I934).
3 These series and many additional ones will be published shortly by the English Price History Committee. Sir William Beveridge has been kind enough to authorize our use of them in advance, for the purpose of this investigation.
4 The exact references are given in the Appendix (p. I4I).
[ I34 I
This content downloaded on Wed, 13 Mar 2013 05:02:10 AMAll use subject to JSTOR Terms and Conditions

COST OF LIVING AND REAL WAGES IN ENGLAND I35
The final index (see Chart i) is a weighted arithmetic average of -price relatives, with I700 as a base, extending over the decades from I695 to i8I5. It is composed of thirty-one price
series, relating, as far as data permit, to goods which were consumed by the English laborer of that period. The commodities were divided into five groups: (i) cereals, (2) animal products, (3) beverages and condiments, (4) candles and coal, and (5) clothing.. Unweighted arithmetic aver-. ages of price relatives were computed for each
group (see Chart 2). The final index was based upon these group indices with the following weights: cereals, 5; animal products, 2; candles and coal, i; beverages and condiments, i; cloth-
ing, i. The weights were determined after a careful study of sample budgets published by Eden and Davies.' It was found that the aver-
CHART 2.- GILBOY-BOODY INDEX OF THE COST OF LIVING IN LONDON, BY GROUPS, ANNUALLY
(Base: 1700. Logarithmic vertical scale)
100 100
/\J\ \ ~~~Bevera ies and co ndiments 100
V"4 V %.%F- V v v- 1 100
I I I I I I I I | f 1 dCndle andcoa 100 VV C9X100
v'\A, A A Anml rdut
, 95 1 05 1 15 J725 1 35 1745 17.55 17 05 1775 1 85 1 95 l8 5 18 0 18500
1695 1705 1715 1725 1735 1745 1755 1765 1775 1785 1795 1805 1815 1825
1 Sir Frederick Eden, State of the Poor, Vols. i-InI (London, I797), and David Davies, The Case of the Laborers in Hus- bandry (Bath, I795). Thirty-five budgets were examined in detail; rough averages of expenditure for the several budgetary
This content downloaded on Wed, 13 Mar 2013 05:02:10 AMAll use subject to JSTOR Terms and Conditions

I36 THE REVIEW OF ECONOMIC STATISTICS
age laborer spent 40 per cent of his total expendi- ture for bread and flour, 20 per cent for animal products, 9 per cent for sugar, tea, beer, etc., 4 per cent for "groceries" (soap, candles, etc.), I5 per cent for rent and fuel, and 8 per cent for clothing. In our index, no attempt was made to allow for rent expenditure, and cereals were given a somewhat greater weight. This latter step has justification in that the Eden and Davies budgets apply to the years I79o-96, when the laborer's budget was more diversified and included a relati+vely smaller expenditure on cereals than in the first half of the century.
It will be noticed that in Group I, bread does not enter the index until I728; in Group III- for which the first year of the index is i700
rather than I695 -tea enters in I740 and beer in I 715; in Group V, linen enters in I700, stock- ings and felt hats in I7I2. Groups III and V include several series which end before i8I5: for example, ale in I8I2; white pepper and raisins in I799; hair in I778; kersey and linen in I795; and leather backs in I792. The majority of the series cover the main part of the period, and this is particularly true of those in the most heavily weighted groups. Before I700, however, and after I790 the index is definitely less satis- factory than over the other decades. Although most of the prices refer to London or its vicinity, less inaccuracy than might be supposed is involved in using the index as representative of England. Prices, particularly for grains, showed little regional divergence. On the other hand, a similar statement cannot be made relative to wages; and our indices of money wages can be
STATISTICAL SOURCES The actual series used in our index, with their
sources, are as follows: 1 Source
I. Cereals Biscuit, I695-I8I4 Admiralty, Treasurers' and Con-
tract Ledgers Barley, I695-I822 Kent Quarter Sessions Records
to I79I; Tooke, 792-I822 Beans, I684-I822 Royal Household, Lord Stew-
ards' Accounts to I790; Tooke, I79I-I822
Flour, I695-I826 Admiralty, Treasurers' and Con- tract Ledgers
Oats, I695-I822 Winchester College Rents to i8o6; Tooke, I807-22
Peas, I695-I826 Admiralty, Treasurers' and Contract Ledgers
Rye, I695-I822 Kent Quarter Sessions Records to 1785; Tooke, I79I-I822 (Data interpolated from movement of barley series, I786-90)
Wheat, I695-I822 Admiralty, Treasurers' and Contract Ledgers to i8oi; Tooke, I802-22
Bread, I728-I8I5 Westminster School and Abbey Accounts to I784, Parlia- mentary Report (I8I4-I5), I785-i815
II. Animal Products Beef for Salting, Admiralty, Treasurers' and
I695-I824 Contract Ledgers to I796; Tooke, I797-I824
Butter, I695-I826 Admiralty, Treasurers' and Contract Ledgers
Cheese, I695-I826 Admiralty, Treasurers' and Contract Ledgers
Pork Hogs, I695-I822 Admiralty, Treasurers' and Contract Ledgers to I8I3; Tooke, I8I4-22
items were secured; and the percentage of each to total expenditure was computed.
' The periods listed are those for which the series are available. In computing the cost of living index, however, the earliest year used for any one series is I695; the latest, i8I5. Certain of the group indices were extended a few years beyond I8I5.
2 This was substituted for the tea series of the Price History Committee, which did not start until I 763 and showed almost no changes in level. The amount of the import duty was added to the East India Company's selling price.
III. Beverages and Condiments Tea (Bohea), British Document 390, Parlia-
I740-I822 mentary Papers, I845, VoL. 46, 1912
Ale, I695-I8I2 Royal Household, Lord Stew- ards' Accounts
Beer, I7I5-I8I8 Chelsea Hospital Accounts Cider, I695-I828 Royal Household, Lord Stew-
ards' Accounts Hops, I695-I826 Admiralty, Treasurers' and
Contract Ledgers Sugar, I70-i822 Westminster School and Abbey
Accounts to I784; Tooke, i785-i822
Malt, I695-I826 Admiralty, Treasurers' and Contract Ledgers
White Pepper, I70o-99 Royal Household, Lord Stew- ards' Accounts
Raisins, 1701-99 Westminster School and Abbey Accounts to I776; Royal Household, Lord Stewards' Accounts, I777-99
IV. Candles and Coal Coal, I683-I826 Admiralty, Treasurers' and
Contract Ledgers Tallow Candles, Admiralty, Treasurers' and
I660-I830 Contract Ledgers to I799; Royal Household, Lord Stew- ards' Accounts, I800-30
V. Clothing Hair, I695-I778 Admiralty, Treasurers' Ledgers
and Bill Books Kersey, I660-I795 Admiralty, Treasurers' Ledgers
and Bill Books Leather Backs, Admiralty, Treasurers' Ledgers
I660-I792 Brussels Linen, Royal Household, Lord Stew-
I 700-35; Irish Linen, ards' Accounts I736-95
Stockings (blue yarn), Greenwich Hospital Accounts I7I2-I827
Felt Hats, I7I2-I827 Greenwich Hospital Accounts Broadcloth, I660-I830 Westminster School and Abbey
Accounts
This content downloaded on Wed, 13 Mar 2013 05:02:10 AMAll use subject to JSTOR Terms and Conditions

COST OF LIVING AND REAL WAGES IN ENGLAND
used to represent wage movements only in the regions to which they refer.
In a cost of living index, it is desirable to include only retail prices, for it is well known that wholesale and retail prices show differences in movement. Unfortunately the statistician who dares to deal with past periods cannot usually choose what he will use. He rriust take what is available and make the most of it. The prices here employed cannot clearly be marked as either retail or wholesale prices. The Admi- ralty prices (providing half of the series) are probably closely related to wholesale prices; on the other hand, the Greenwich Hospital, Chelsea, Westminster, Kent, and Royal House- hold prices are definitely akin to retail prices, in the opinion of the English Price History Com- mittee. The index is, therefore, neither a whole- sale nor a retail price average but something in between. All series represent contract prices. The contracts vary from a very short period of a few months to periods of several years. The only group which is markedly influenced by long-period contracts is the clothing group (see Chart 2). On the whole, the series within any one of the several groups showed a great similar- ity`of movement, and all the commodities were selected either for their places in the laborers' budgets, or for their influences upon some article actually consumed. We are well aware of the defects of the index, but it is probably a better measure than has yet been found of the general course of the cost of living for the period.
COST OF LIVING MOVEMENT According to the index presented in Chart i
and Table i, the broad tendency of living costs was slightly downward from the period I708-II until about I755. A distinctly upward move- ment began in the late 'fifties, which was accel- erated in the inflationary period after 1790, and which culminated in the peaks of i8oo and I8I2.
The index fluctuated around the level of the base year, I700, until the 'fifties, rose to about I5o by I793, and to 270 by 18I2. The peaks are attributable, for the most part, to excep- tionally bad harvests in particular years, nota- bly, i698, I70, 1740, I756, I766, 1782, I795, i8oo, and i8I2. The rise in I698 was influenced also by monetary difficulties; that of 17o8-Io by the fact that Admiralty prices were unusually high as a result of a heavy discount on Navy
Bills. The whole period after I790 was, of course, influenced by inflation. Pronounced cyclical movements are apparent, but they will not be dealt with here.
Among the group indices, the widest short- time fluctuations appear in cereals, with animal products not far behind. The two groups move together quite closely, except for a difference
TABLE i.- ANNUAL INDICES OF THE COST OF LIVING IN LONDON
(Base: I700)
Year Index Year Index Year Index
I695 I24 I735 88 I775 I28 I696 I22 I736 93 1776 I20
i697 I26 I737 94 1777 13I I698 I3I I738 9I I778 123 I699 ii8 1739 I09 I779 II7
I700 100 1740 II9 I780 I25
I70I I00 174I I03 178I I25
I702 9I I742 98 I782 144
1703 99 I743 82 I783 I39
I704 88 I744 83 I784 129
I705 95 1745 94 1785 132
1706 86 I746 92 1786 I28
1707 94 I747 95 I787 I30 I708 ii6 I748 I00 1788 I27
I709 I35 I749 98 I789 I34
I7I0 147 I750 93 I790 I33
I71I I04 175I 98 179I 13I
I7I2 98 I752 94 I792 I40 I713 io8 1753 95 I793 I48 1714 I05 I754 92 I794 I68
17I5 I00 I755 98 I795 I79 I7I6 92 I756 I25 I796 I53 17I7 92 I757 ii8 I797 I52
I7I8 92 I758 io8 I798 i65 I719 io6 I759 99 I799 229
I720 I02 1760 97 i8oo 252
I72I 9I I76I 99 i8oi I90
1722 86 I762 I09 I802 i66 1723 97 1763 II0 I803 I7I 1724 99 I764 II5 I804 204
I725 I05 I765 II7 I805 I96 I726 I00 1766 124 i8o6 20I I727 io6 1767 123 I807 226 I728 I12 I768 I09 i8o8 236
I729 102 1769 io8 I809 229
1730 89 I770 ii8 i8io 225
173I 88 177I 130 i8ii 266 1732 8i 1772 I36 I8I2 270
1733 89 1773 13I I8I3 224
1734 9I 1774 I29 I8I4 I98
........ ... i8I5 183
This content downloaded on Wed, 13 Mar 2013 05:02:10 AMAll use subject to JSTOR Terms and Conditions

I38 THE REVIEW OF ECONOMIC STATISTICS
in timing of the upward trend. With cereals the rise begins in the 'fifties; with animal products, in the late 'thirties. The other three groups move less violently and are little affected by years of bad harvest. Beverages and condiments rise until I7I4 and then decline slowly until the middle 'fifties. The upward movement then initiated is less marked than in the other two food groups. The rise in coal and candles begins in the 'thirties but is not pronounced until the end of the century. The clothing group shows great stability: after dropping sharply in the
first decade of the eighteenth century to about 80 (I 700 = I00), the index remained close to this figure until the 'nineties. Clothing prices do not rise noticeably until after iSoo aDcd reach their peak in I8I4.
The movement of the group indices is con- sistent with other information from contem- porary sources. Textile prices, particularly cotton,1 declined during the century. So did the prices of certain imported luxuries such as tea, coffee, spices, and the like. Contemporary comment is unanimous in stating that many of these commodities were included in the laborer's budget for the first time in the latter eighteenth century. Grain and meat prices were known to increase in the last half of the century, with attendant misery on the part of the working classes, especially in years of bad harvest. The final index is largely influenced by the cereal and animal products groups,
although the extreme violence of the short-time fluctuations and the severity of the rise in the late eighteenth and early nineteenth centuries is mitigated by the stability in prices of the other three groups.
WAGES
Chart 3 indicates the movement of money wages in London and Lancashire as compared with that of the cost of living. The indices of money wages (Table 2) were computed from data on daily wage rates of common labor,
mostly in the building trades.2 The London index is an arithmetic average of price relatives of the daily wage rates of bricklayvers', masons' paviours', and plasterers' labor at Westminster Abbey, with I700 used as the base year. The Lancashire index is a simple series of price rela- tives, on a s700 of the daily zvages of labor on buildings and roads. These two series were found to represent wage rates in London and the north of England, respectiVely, in the study mentioned above.
The stability of wages over long periods of years is evident, particularly in the Loncion index.3 Money wages in London rose slightly until the 'forties, and the level agailn advanced in the 'sixties and 'eighties. The Lancashire series went up much more sharply. There was
CHART 3.- GILBOY-BOODY INDICES OF THE COST OF LIVING IN LONDON, MONEY WAGES IN LONDON, AND MIONEY WAGES IN LANCASHIRE, ANNUALLY
(Base: I700. Logarithmic vertical scale)
- Cost of living index I ---Money wages, Lancashire| 8
--Money wages,London
200 100
80 1705 1715 1725 1 7 17O 1695 1705 1715 1725 1735 1745 1755 1765 1775 1785 1795 1805 I31
1 We were not able to secure a series of cotton prices suffi- ciently continuous to include in the index. MIr. A. P. Wads- worth - author with Miss Mann of The Cottont Trade and Industrial Lancashire, I600-I780 (Manchester, England, Ig3 i) - wrote to Dr. Boody recently that he has been unable to find a good series of cotton prices for this period.
2 See lVages in Eighteenth Century Englan;d, Appendix II, for the original series. Laborers' wages were used rather than those of craftsmen because the latter are less complete and more subject to quality differences. The long-time movements of the two are very similar, except that craftsmen's wages ordinarily rise first in periods of advance. They are also on a higher level throughout the century, as might be expected.
3Year-to-year fluctuations in wage rates cannot be relied upon, especially in the Lancashire series, since they may rep- resent quality and place differences that could not be entirely eliminated.
This content downloaded on Wed, 13 Mar 2013 05:02:10 AMAll use subject to JSTOR Terms and Conditions
COST OF LIVING AND REAL WITAGES IN ENGLAND I39
an irregular rise from I700 to I730, stability at the new level until the late 'fifties, and a steep rise in the 'sixties, until by I768 the index was at 200, where it remained, with the exception of one year, until I78I. In the 'eighties and 'nineties, an upward movement to a still higher level took place. Over the century, money wages in the North moved upward in a far greater degree than in London.
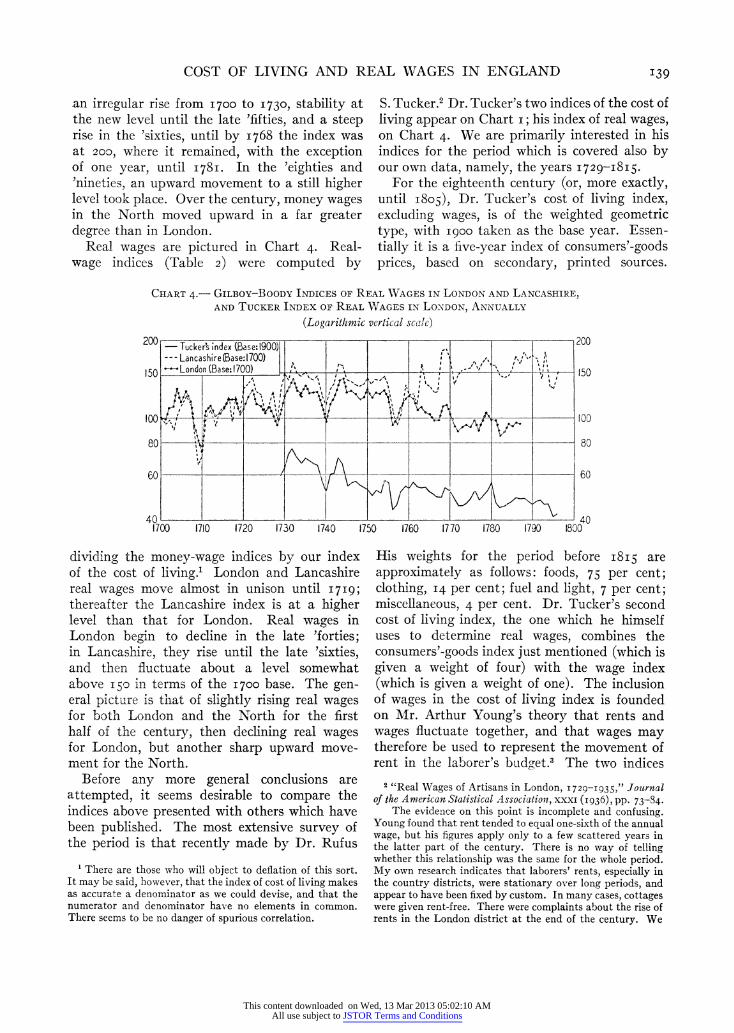
Real wages are pictured in Chart 4. Real- wage indices (Table 2) were computed by
dividing the money-wage indices by our index of the cost of living.' London and Lancashire real wages move almost in unison until I7I9; thereafter the Lancashire index is at a higher level than that for London. Real wages in London begin to decline in the late 'forties; in Lancashire, they rise until the late 'sixties, and then fluctuate about a level somewhat above I50 in terms of the I700 base. The gen- eral picture is that of slightly rising real wages for both London and the North for the first half of the century, then declining real wages for London, but another sharp upward move- ment for the North.
Before any more general conclusions are attempted, it seems desirable to compare the indices above presented with others which have been published. The most extensive survey of the period is that recently made by Dr. Rufus
S. Tucker.2 Dr. Tucker's two indices of the cost of living appear on Chart i; his index of real wages, on Chart 4. We are primarily interested in his indices for the period which is covered also by our own data, namely, the years I729-I8I5.
For the eighteenth century (or, more exactly, until I805), Dr. Tucker's cost of living index, excluding wages, is of the weighted geometric type, with I900 taken as the base year. Essen- tially it is a five-year index of consumers'-goods prices, based on secondary, printed sources.
His weights for the period before I8I5 are approximately as follows: foods, 75 per cent; clothing, I4 per cent; fuel and light, 7 per cent; miscellaneous, 4 per cent. Dr. Tucker's second cost of living index, the one which he himself uses to determine real wages, combines the consumers'-goods index just mentioned (which is given a weight of four) with the wage index (which is given a weight of one). The inclusion of wages in the cost of living index is founded on Mr. Arthur Young's theory that rents and wages fluctuate together, and that wages may therefore be used to represent the movement of rent in the laborer's budget. The two indices
CHART 4.- GILBOY-BOODY INDICES OF REAL WVAGES IN LONDON AND LANCASHIRE, AND TUCKER INDEX OF REAL WAGES IN LONDON, ANNUALLY
(Logarithmic vertical scI1C) 200 200 -Tucker's index (Base:1900) -2
--- Lancashire(Base:1700) 150 --London(Base:1700) 150
80~ ~~~~~N -'8
60 6~~~~~~~~~~~~~~~~~~~~00
00 17 1 80 1700 1710 1120 1130 1740 1750 1760 1770 1780 1790 1800
1 There are those who will object to deflation of this sort. It may be said, however, that the index of cost of living makes as accurate a denominator as we could devise, and that the numerator and denominator have no elements in common. There seems to be no danger of spurious correlation.
2 "Real Wages of Artisans in London, I729-I935, Joucrnal of the American Statistical Associationt, xxxi (I936), pp. 73-84.
The evidence on this point is incomplete and confusing. Young found that rent tended to equal one-sixth of the annual wage, but his figures apply only to a few scattered years in the latter part of the century. There is no way of telling whether this relationship was the same for the whole period. My own research indicates that laborers' rents, especially in the country districts, were stationary over long periods, and appear to have been fixed by custom. In many cases, cottages were given rent-free. There were complaints about the rise of rents in the London district at the end of the century. We
This content downloaded on Wed, 13 Mar 2013 05:02:10 AMAll use subject to JSTOR Terms and Conditions
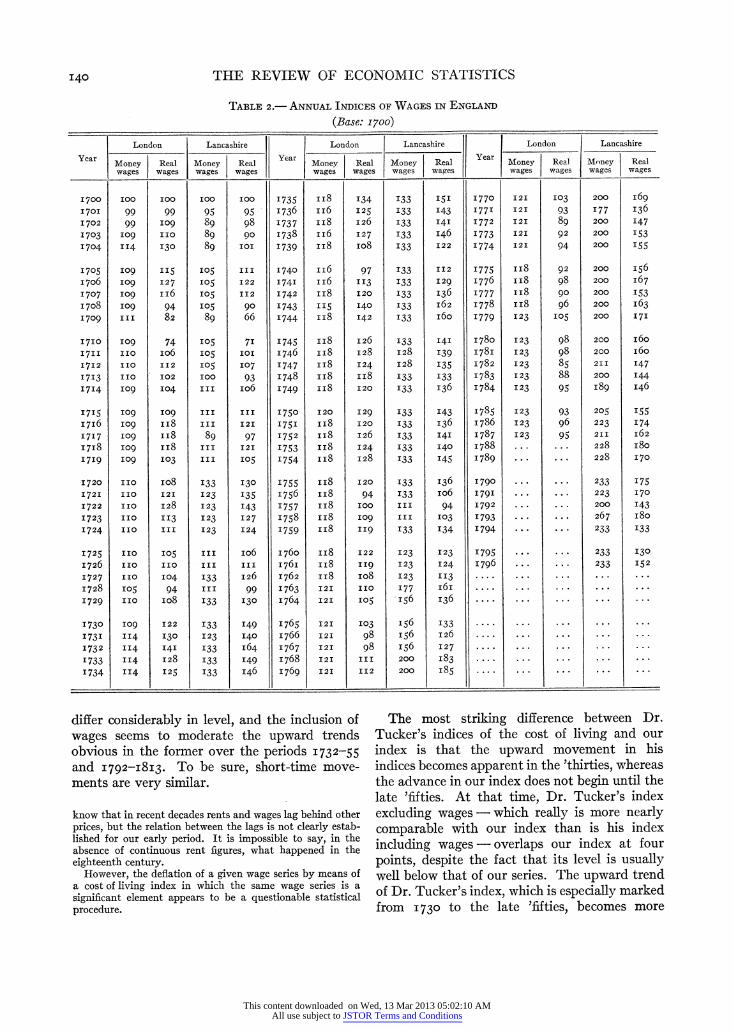
I40 THE REVIEW OF ECONOMIC STATISTICS
differ considerably in level, and the inclusion of wages seems to moderate the upward trends obvious in the former over the periods I732-55 and I792-I8I3. To be sure, short-time move- ments are very similar.
The most striking difference between Dr. Tucker's indices of the cost of living and our index is that the upward movement in his indices becomes apparent in the 'thirties, whereas the advance in our index does not begin until the late 'fifties. At that time, Dr. Tucker's index excluding wages - which really is more nearly comparable with our index than is his index including wages - overlaps our index at four points, despite the fact that its level is usually well below that of our series. The upward trend of Dr. Tucker's index, which is especially marked from I730 to the late 'fifties, becomes more
TABLE 2.- ANNUAL INDICES OF WAGES IN ENGLAND
(Base: 1700) London Lancashire London Lancashire London Lancashire
Year Year Year Money Real Money Real Monev Real Money Real Money Real Money Real wages wages wages wages wages wages wages wages wages wages wages wages
I700 IOO 100 IOO 100 1735 II8 134 133 151 1770 121 103 200 I69
1701 99 99 95 95 1736 II6 I25 133 143 177I 121 93 177 I36
I702 99 IO9 89 98 1737 II8 126 133 141 1772 121 89 200 147
I703 1O9 IIO 89 90 1738 II6 127 133 146 1773 121 92 200 153
I704 II4 130 89 101 I739 II8 io8 I33 122 1774 121 94 200 155
1705 IO9 II5 I05 III 1740 ii6 97 I33 II2 1775 II8 92 200 156 1706 1O9 127 105 122 1741 II6 113 I33 I29 1776 II8 98 200 I67
1707 1O9 II6 I05 I12 1742 II8 I20 133 I36 1777 II8 90 200 153
1708 1O9 94 I05 90 1743 115 I40 133 I62 1778 II8 96 200 I63
1709 III 82 89 66 1744 II8 142 133 i6o 1779 123 105 200 I7I
I710 1O9 74 105 7I 1745 II8 126 133 141 I780 123 98 200 i6o I7II IIO io6 105 IOI 1746 II8 128 128 139 178I 123 98 200 i6o 1712 110 112 105 I07 1747 II8 124 128 135 1782 123 85 2II 147
17I3 110 102 100 93 I748 II8 II8 133 133 1783 123 88 200 144
I714 1o9 104 III io6 1749 II8 120 133 136 1784 123 95 I89 I46
I715 1O9 IO9 III III 1750 120 129 133 I43 1785 123 93 205 155
I7I6 1O9 II8 III I2I 1751 II8 120 133 136 1786 I23 96 223 '74
1717 1O9 II8 89 97 1752 II8 126 133 I41 1787 123 95 2II I62
I7I8 1O9 II8 III 121 1753 II8 124 133 140 1788 ... 228 i8o 1719 IO9 103 III 105 1754 II8 128 133 145 1789 ... 228 170
I720 110 io8 I33 130 1755 II8 120 133 136 1790 ... ... 233 175
I721 110 121 I23 135 1756 II8 94 I33 io6 1791 ... 223 170
I722 110 I28 123 143 1757 II8 100 III 94 1792 ... ... 200 143
I723 IIO II3 I23 127 I758 II8 IO9 III I03 I793 ... ... 267 i8o 1724 IIO III I23 I24 1759 II8 II9 I33 I34 I794 ... ... 233 I33
I725 IIO I05 III io6 I760 II8 I22 I23 I23 I795 . . ... 233 I30
I726 IIO IIO III III I76I II8 II9 123 124 I796 ... ... 233 I52
I727 IIO I04 I33 I26 I762 II8 io8 I23 I13 .. ... ... ...
I728 I05 94 III 99 I763 12I IIO I77 i6i ... ... ...
I729 IIo io8 I33 I30 I764 I2I I05 I56 I36 . , ... ... ...
I730 1O9 I22 I33 I49 I765 12I I03 I56 133 ... ... ...
I73I I14 I30 I23 I40 I766 I21 98 I56 I26 . .. ... ...
I732 II4 I41 I33 I64 1767 I2I 98 I56 127 ... ... ... ...
I733 II4 I28 I33 I49 1768 I21 III 200 I83 ... ...
I734 II4 I25 I33 I46 1769 I21 II2 200 I85 . ... . ..
know that in recent decades rents and wages lag behind other prices, but the relation between the lags is not clearly estab- lished for our early period. It is impossible to say, in the absence of continuous rent figures, what happened in the eighteenth century.
However, the deflation of a given wage series by means of a cost of living index in which the same wage series is a significant element appears to be a questionable statistical procedure.
This content downloaded on Wed, 13 Mar 2013 05:02:10 AMAll use subject to JSTOR Terms and Conditions

COST OF LIVING AND REAL WAGES IN ENGLAND
gradual from the latter decade until the 'nineties, when it is again steeply inclined.
Dr. Tucker's index of real wages reflects the difference in trend (see Chart 4), showing a con- tinuous declining trend throughout the period, whereas our real-wage index for London does not decline until the 'fifties. The difference appears to be a result of the divergence in trend existing between Dr. Tucker's cost of living index and ours. This divergence may be due to the fact that Dr. Tucker interpolated from a few series 1 within the five-year periods of his original cost of living index; this would be true particularly if these series rose above his five- year points in the intervening years. At any rate, Dr. Tucker's general conclusion that real wages in England declined throughout the eighteenth century2 is not confirmed, even by our London index, and is strongly opposed by our index for Lancashire.
Chart i also contains Professor Silberling's cost of living index from I779 to i8I5.3 His index is a weighted geometric average of price rela- tives, each series weighted individually, of fifteen commodities, on the base I790. The nine series for food and drink are given a total weight of 75 per cent; the four series for cloth- ing, approximately I4 per cent; and the coal and candles series together make up approx- imately ii per cent of the total. Within the food group, animal products are weighted almost as heavily as cereals. Since Professor Silberling's weights are derived from nineteenth century budgets, it is not surprising that they should differ to some extent from ours.4 The Silberling index follows the Tucker index (including wages) very closely, particularly at the end of the period. This is interesting inasmuch as the Tucker index is an average of retail prices,5 whereas the Silberling index is a wholesale price index. Possibly the difference between retail and wholesale prices in this period is less than
is generally supposed. More probably, the use of annual series and of contract prices (by Dr. Tucker) has obscured any differences in movement that may exist. Both these indices differ in level and to some extent in trend from our index. The difference in level is undoubtedly due to the variant base years employed, while some divergence in trend may arise from the use of a geometric index by Tucker and Silber- ling as opposed to the arithmetic form that we utilized. However, the extent of the trend difference between Tucker's index and ours can- not be explained on this technical ground alone.
CONCLUSIONS Crude as our index is, it is based on the most
complete, continuous, and homogeneous series now available. It affords a better basis for estimating the condition of the working classes in eighteenth-century England than the grain prices used earlier.6 It is necessary to modify somewhat the conclusion there expressed con- cerning the trend of the standard of living of the London laborer. The present index shows a much more certain decline in real wages for London in the last half of the century. Real wages in the North, however, rose consistently during the entire hundred years, as indicated by the earlier investigation. An index of real wages in the west of England was not computed in connection with the present inquiry, but it would undoubtedly show a decline, and, indeed, one that started much earlier than that of London. Regional differences in the course of real wages in eighteenth-century England are very evident. Sufficient data are not at present available to make anv statements concerning the movement of real wages in England as a whole for this period.
It is of considerable interest to note that real wages as well as money wages in the North increased in the latter half of the century, when the cost of living was rising. It is Dr. Tucker's opinion that gains in real wages are made almost entirely in periods of falling prices.7
1 What these series are Dr. Tucker does not say, except that wheat was used before 1735.
2 Op. cit., p. 82. 3 "British Prices and Business Cycles, 1779-I850," this
REVIEW, V (1923), pp. 2 23-6I. 4 Weighting animal products equally with cereals is not
justifiable, howevTer, for any part of the eighteenth century, as far as laborers' budgets are concerned.
6 The Greenwich Hospital prices which Dr. Tucker uses are more related to retail than wholesale prices, but they are certainly affected by contracts and discounts, and cannot be called pure retail prices.
6 Gilboy, op. cit. Detailed analysis of non-statistical evi- dence on real wages will be found here, as well as examination of the effects of hours of work, unemployment, etc., for which no continuous figures exist. It may be said that this non- statistical evidence tends to emphasize the rise in real wages in the North, and to mitigate the extent of the decline in London.
I Op. cit., p. 84.
This content downloaded on Wed, 13 Mar 2013 05:02:10 AMAll use subject to JSTOR Terms and Conditions

142 THE REVIEW OF ECONOMIC STATISTICS
Mr. Keynes states that money wages may be expected to rise in periods of rising prices but that real wages will ordinarily fall, except per- haps in the case of a single industry.' It is possible that the Lancashire wages fall into the category of Mr. Keynes' exception. Although these wages are for common labor and labor in the building trades, not for industrial labor, they may reflect the increasing demand for labor set in motion by the expanding cotton and woolen industries. I am inclined to think, how- ever, that the cause lies deeper than changes in a single industry. Increasing real wages may occur simultaneously with advancing prices in periods when extraordinary industrial and tech- nical changes are under way. Such changes are in the nature of external economies and affect more than a single firm or a single industry. In
the eighteenth century, the north of England was undergoing such changes and, although the cotton industry was in the van of this "indus- trial revolution," it was only one element in the process. Under such circumstances, it might not be unreasonable to expect real wages and money wages to rise together. Even if money wages lag behind prices, as they frequently do, real wages need not fall except for a very short period at first. Once wages begin to in- crease, they may rise relatively faster and in greater proportion than prices, thus making possible a real-wage increase despite the lag. In the north of England, money wages and prices rose almost simultaneously. From I760 to I775, prices went up about 40 per cent, while wages increased approximately 70 per cent. There appears to be no inherent reason why this situation should not be repeated, if similar economic conditions should occur.
ELIZABETH W. GILBOY
I J. M. Keynes, The General Theory of Employment, Interest, and Money (NTew York, 1936), p. Io.
COMMITTEE ON RESEARCH IN THE SOCIAL SCIENCES HARVARD UNIVERSITY
STArISTICAL APPENDIX
Descriptiox of Series It is not possible in a short paper of this type to print and
describe the series in full. The relation of these prices to retail and wholesale prices and the main sources of the series are given in the article itself. It should be added here that most of the series are quoted in harvest years, from October to October, and that October I700 to October I70I is called I700, SO that the year I700 is really made up in large part of I70I.
No correction for harvest years versus calendar years was made in the index as a whole, although in interpolating for certain of the grain series, an adjustment was made. These series are listed below. On the whole, no clear and consistent difference in the timing of the movements of our index in comparison with the other indices was shown. Some differ- ences in the timing of the peaks are noticeable in our index as compared with Tucker's and Silberling's, but these differ- ences are not uniform throughout the period. They may, however, be attributable to the use of the harvest year. It is to be noted, however, that the peaks after I790, particularly I795, I8oo, and I8I2, coincide with the description of harvests and price movements given in Business Annals.'
Statistical Method An arithmetic index was chosen because the authors felt
the data too unsatisfactory to warrant the extra time and expense necessary for the calculation of a geometric index. Miss Bezanson found that the geometric index was very little
different from the arithmetic in her study of eighteenth-century Philadelphia prices.2 The year i 700 was selected as a base year since we were particularly interested in comparing changes in the last part of the century with the beginning and since I700 appeared to be a fairly "normal" year at the beginning of the period for almost all the series. It is to be noted that the index fluctuates about the level of the year I700 for the first half of the century.
Interpolation Interpolations in the clothing and fuel groups were made
by Dr. Boody, and her methods will be published in a forth- coming article in this REVIEW. I was responsible for interpo- lation in the cereal, animal products, and beverages and condiments groups. There is not space to print the original series or an itemized list of interpolations. In general the procedure was as follows:
I. Where one or two years were missing, if no comparable series could be found from other sources, an arithmetic average of the two adjoining years was taken. There were a few interpolations of this sort in almost every series.
2. When a number of years were missing, or it was desired to extend the series, the original series was charted with a comparable series derived from another source. In every case of this sort, there were one or more overlapping years, and in most cases a number of overlapping years. If the series were similar during the overlapping years, with no difference in level or timing, the new series was substituted for the old without any change. This was done in the case of bread.
1 W. L. Thorp and W. C. Mitchell, Business Annals (National Bureau of Economic Research, New York, I926), pp. 150-55.
2 Anne Bezanson, Robert D. Gray, and Miriam Hussey, Prices in Colonial Pennsylvania (Philadelphia, I935).
This content downloaded on Wed, 13 Mar 2013 05:02:10 AMAll use subject to JSTOR Terms and Conditions
COST OF LIVING AND REAL WAGES IN ENGLAND
Interpolation was based on the series quoted from Wholesale and Retail Prices.' If a constant difference in level was observed, but the movement was the same, a figure for I700 was computed for the new series by the following simple method:
Let x = the required estimate for I 700 a = the I700 value for the original series b = the value of any given year for the original series b,=the value of the same given year for the new series
then x b_ a b
The new series was then corrected for the difference in level and added on to the original series. In the case of more than one overlapping year, an average of the estimated values for 1700 was taken as the base. This method assumes that a constant difference in level existed between the two series throughout the century, and although this assumption is doubtless not completely justified, it seemed more reasonable to make the adjustment than to add the interpolated series with no allowance for differences in level.
This method was used in the case of rye, beef, cheese, pork hogs, and sugar. For these commodities, the interpolated series
were taken from Tooke 2 in all cases except cheese. The original cheese series was composed of figures for Cheshire and Suffolk cheese which had to be adjusted in the same way.
3. In some series there was no figure for I700. In the case of tea, this figure was determined by the above method of proportions from comparable figures listed in Rogers.3 For the beer series, the I 700 figure was assurmied to be t1he same as that for I7I5. The I70I value for raisins was used as that for I700. Certain gaps in the raisins series were also filled in from Rogers.
4. AMissing years in the flour series were interpolated from Greenwich Hospital figures by adding one shilling to the Greenwich values. The overlapping values indicated roughly a constant difference of this amount.
5. In some instances. the interpolated series showed clearly a constant lag in relation to the original series. This was adjusted by moving forward the interpolated figures. It is probably due to the difference between harvest years and calendar years. Barley, wheat, beans, and oats, taken from Tooke, were adjusted in this way.
' House of Commons Report (London, I903).
2 Thoutghts and Details of the High and Low Prices ...frorn I793 to I822 (London, I824).
I History of Agriclultuire and Prices, Vol. vii, Part I (London I1902).
This content downloaded on Wed, 13 Mar 2013 05:02:10 AMAll use subject to JSTOR Terms and Conditions