the corrections system in new hampshire - rockefeller … · rockefeller center. policy research...
TRANSCRIPT

The Class of 1964 Policy Research Shop —Celebrating 10 Years of Service to New Hampshire and Vermont—
THE CORRECTIONS SYSTEM IN NEW HAMPSHIRE
State and County Operations and Expenditures
Presented to the New Hampshire House Committee on Criminal Justice and Public Safety
PRS Policy Brief 1415-10 June 8, 2015
Prepared By:
Emma Sisson Irene Cofie
Joseph Bernstein Alex Woodruff
Jeeihn Lee
This report was written by undergraduate students at Dartmouth College under the direction of professors in the
Rockefeller Center. Policy Research Shop (PRS) students produce non-partisan policy analyses and present their findings in a non-advocacy manner. The PRS is fully endowed by the Dartmouth Class of 1964 through a
class gift in celebration of its 50th Anniversary given to the Center. This endowment ensures that the Policy Research Shop will continue to produce high-quality, non-partisan policy research for policymakers in New
Hampshire and Vermont. The PRS was previously funded by major grants from the U.S. Department of Education, Fund for the Improvement of Post-Secondary Education (FIPSE) and from the Ford Foundation and
by initial seed grants from the Surdna Foundation and the Lintilhac Foundation. Since its inception in 2005, PRS students have invested more than 50,000 hours to produce more than 130 policy briefs for policymakers in
New Hampshire and Vermont.
Contact: Nelson A. Rockefeller Center, 6082 Rockefeller Hall, Dartmouth College, Hanover, NH 03755
http://rockefeller.dartmouth.edu/shop/ • Email: [email protected]

TABLE OF CONTENTS
EXECUTIVE SUMMARY 11. INTRODUCTION 12. OPERATIONS AND DEMOGRAPHICS OF STATE CORRECTIONS SYSTEM 2
2.1 STATE PRISON POPULATION TRENDS 32.2 RACE, AGE, EDUCATION 5
3. OPERATIONS AND DEMOGRAPHICS OF COUNTY JAILS 73.1 COUNTY JAIL OPERATIONS 83.2 JAIL STAFFING AND OCCUPANCY 83.3 GENDER AND RACE 93.4 CONVICTION STATUS 103.5 CASE STUDY: GRAFTON COUNTY JAIL 10
3.5.1 Length of Stay 113.5.2 Criminal Charges 123.5.3 Education, Age, and Race 12
4. FINANCES OF THE STATE CORRECTIONS SYSTEM 154.1 STATE CORRECTIONS SPENDING BY CATEGORY 154.2 NEW ENGLAND STATES 154.3 MAJOR EXPENSES BY AREA 17
5. FINANCES OF COUNTY CORRECTIONS SYSTEMS 185.1 COUNTY COSTS AND BUDGETS 18
6. CONCLUSION 20APPENDIX 23
APPENDIX A. SUMMARY OF CORRECTIONS REPORTS UTILIZED 23REFERENCES 25

1
EXECUTIVE SUMMARY Prison and jail populations have declined in most states since 2010, but have increased in New Hampshire. Corrections costs have also risen in New Hampshire in recent years. Understanding the reasons for corrections cost growth is complicated by a lack of systematic information on county jail spending in the state. This report aggregates information on the New Hampshire state and county corrections systems in order to analyze their finances, operational structures, and characteristics of inmates. It evaluates a range of budgetary and demographic information sources, since no single data source describes all ten county jails and all state prisons. Specifically, the analysis utilizes 2014 and 2015 information from state and county Departments of Corrections, federally reported data, and detailed Grafton County jail data. The first half of the report describes state and county inmates in terms of their gender, race, age, education, conviction status, and sentence lengths. The second half analyzes costs of state prisons and county jails, including costs for medical care and wages. Among other findings, the analysis shows that county jails account for over 40 percent of corrections spending in New Hampshire, with jail inmates awaiting trial and those with drug charges representing high-cost groups. Spending on medical care for state prisoners is comparable to state prison security spending. The report concludes by discussing implications for policymakers and budgets, including how New Hampshire might reduce its corrections spending while maintaining its historically low crime rates. 1. INTRODUCTION Since the 1980s, New Hampshire prison and jail populations have risen significantly. In 2014, the average daily state prison and jail population was a combined 5,000, twice as large as in 1990.1 Most states experienced significant growth in the 1980s, 1990s, and 2000s. In response, “significant policy efforts have been devoted to controlling the growth in the number of prison inmates.” 2 Several New Hampshire counties established drug courts, seeking to reduce recidivism and costs for non-violent offenders with histories of substance use. In 2015, the New Hampshire Senate Judiciary Committee considered a bill to eliminate mandatory minimum sentencing for some offenses. Despite interest from some New Hampshire policymakers in adjusting approaches to corrections, available data on state and county corrections is surprisingly incomplete. Line items in the ten counties’ corrections budgets tend to be defined differently. For example, inmate medical care, a significant expense, is reported differently across counties. Additionally, two of the largest counties, Hillsborough and Merrimack, have not made FY 2014 or 2015 corrections budgets available online. While several counties, including Grafton County, are regularly transparent and willing to report demographic summaries for their jail populations—in publicly available reports or when requested—information for other counties is difficult and sometimes impossible to find. A consistent finding of this report is that streamlining county level data collection and reporting processes can greatly improve efforts to evaluate county corrections systems. To address the lack of available information, this report aggregates and describes available data on the demographic compositions and spending for the state and

2
county corrections systems. The goal is to provide descriptive snapshots of the prisons and jails, as well as benchmarks for legislators and policy researchers. As an overview of the findings, total state and county corrections spending in New Hampshire was $182.4 million in the most recent fiscal year. Table 1 summarizes the costs, showing that state level corrections accounted for $105.2 million, or 58 percent, of total corrections spending in the state. County jails comprised $77.2 million, or 42 percent, of the total.
Table 1. Summary of State and County Corrections Spending and Inmate Populations, New Hampshire
Annual Costs Inmates
State $105.2 million 3,018
County $77.2 million 1,933
Total $182.4 million 4,918 Note: Report findings on spending and inmate populations. State totals are for 2014; county totals are for 2015.
New Hampshire currently has three state prisons and ten county jails. Of all 4,918 New Hampshire inmates in these facilities, roughly 40 percent are in jails and 60 percent in state prisons. Consequently, the average annual cost per inmate is $34,900 for state prisoners and $39,900 for those held in jails. 3 These figures indicate that per-inmate jail costs in New Hampshire are noticeably higher than per-inmate state prison costs. Nationally, the average annual cost is $31,286 per state prisoner, somewhat lower than in New Hampshire.4 Taken together, New Hampshire spends at least $137 per resident each year on corrections directly.5 The remainder of the report describes these and other findings in more depth. In Section 2, we describe the operational structure and inmate populations of the state corrections system. Section 3 examines the operations and inmate characteristics of the ten county corrections systems. Sections 4 and 5 provided a detailed snapshot of the finances of the state and county systems, respectively. 2. OPERATIONS AND DEMOGRAPHICS OF STATE CORRECTIONS SYSTEM The New Hampshire Department of Corrections (NH DOC) currently operates three state prisons: the New Hampshire State Prison for Men, located in Concord, the New Hampshire State Prison for Women, located in Goffstown, and the Northern New Hampshire Correctional Facility (NCF), located in Berlin. The mission of the state prisons is to provide a secure correctional system to support offenders through effective supervision and appropriate treatment. The prisons have a combination of minimum, medium, and maximum-security units. The NH State Prison for Men is the state’s largest prison facility. The State Prison for Women accommodates minimum, medium, and close custody female inmates. The Northern NH
3
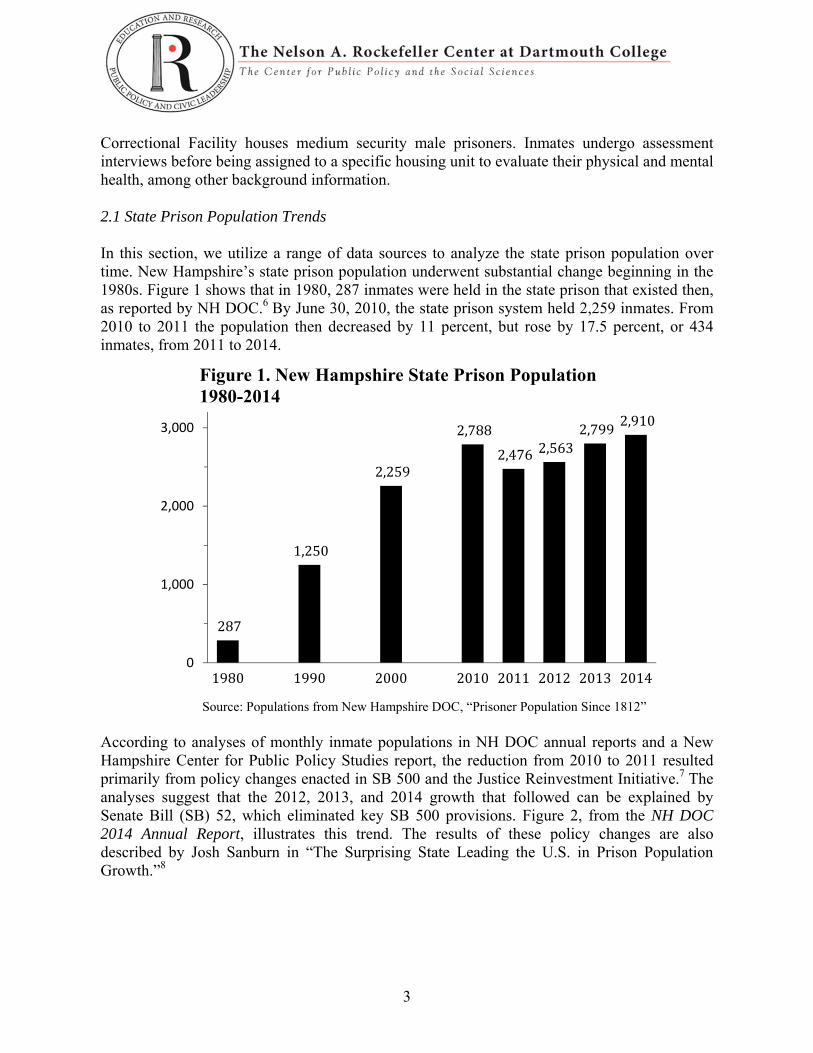
Correctional Facility houses medium security male prisoners. Inmates undergo assessment interviews before being assigned to a specific housing unit to evaluate their physical and mental health, among other background information. 2.1 State Prison Population Trends In this section, we utilize a range of data sources to analyze the state prison population over time. New Hampshire’s state prison population underwent substantial change beginning in the 1980s. Figure 1 shows that in 1980, 287 inmates were held in the state prison that existed then, as reported by NH DOC.6 By June 30, 2010, the state prison system held 2,259 inmates. From 2010 to 2011 the population then decreased by 11 percent, but rose by 17.5 percent, or 434 inmates, from 2011 to 2014.
Source: Populations from New Hampshire DOC, “Prisoner Population Since 1812”
According to analyses of monthly inmate populations in NH DOC annual reports and a New Hampshire Center for Public Policy Studies report, the reduction from 2010 to 2011 resulted primarily from policy changes enacted in SB 500 and the Justice Reinvestment Initiative.7 The analyses suggest that the 2012, 2013, and 2014 growth that followed can be explained by Senate Bill (SB) 52, which eliminated key SB 500 provisions. Figure 2, from the NH DOC 2014 Annual Report, illustrates this trend. The results of these policy changes are also described by Josh Sanburn in “The Surprising State Leading the U.S. in Prison Population Growth.”8
287
1,250
2,259
2,788
2,476 2,5632,799
2,910
0
1,000
2,000
3,000
1980 1990 2000 2010 2011 2012 2013 2014
Figure 1. New Hampshire State Prison Population 1980-2014

4
Figure 2. Legislation Impact on NH Sentenced Inmate Population
Source: NH DOC, 2014 Annual Report, p. 16. By contrast, the prison population in other states fell over this same time period. Examining the number of state prisoners per 100,000 adults offers a reliable method to compare multiple states and years. The rate can account for growth in the general population over time and any faster or slower growth among adults relative to children. To calculate this imprisonment rate, we collect data on all state prisoners from the Bureau of Justice Statistics (BJS) Corrections Statistical Analysis Tool.9 The BJS data describe state prison populations at the end of each calendar year, rather than the end of the state fiscal year, as in NH DOC data. Figure 3 presents the state prisoner count per 100,000 adults in New Hampshire and across all states. From 2010 to 2013, the rate in all states fell from 686 to 650, a 5.3 percent drop. In New Hampshire, the rate increased from 268 to 287. This represents an increase of 7.1 percent, or 13.8 percent from the 2011 low value following the passage of SB 52. As demonstrated in the following sections, this imprisonment growth translated into higher corrections spending during this period in New Hampshire.
203
417
665 686 673 654 650
49
161
243268 252 267 287
-
100
200
300
400
500
600
700
1980 1990 2000 2010 2011 2012 2013
Figure 3. State Prisoners per 100,000 Adults, New Hampshire and All States
All States
NH
10/1/2010 11/1/2011 7/1/2012 7/1/2013 7/1/2014

5
2.2 Race, Age, Education Figure 4 indicates that 85 percent of the 2,910 state prison inmates in 2014 are white. Black or African American inmates comprised six percent of the population, and those of Hispanic ethnicity also represented six percent. Figure 5 displays the distribution of state prisoners by age category. Forty-six percent of inmates are between 26 and 40 years old, while approximately 40 percent are 41 or older.
Volunteers from Granite State High School (GSHS) completed educational assessments for 467 incoming inmates in 2014.10 Those assessments indicate that 24 percent have a GED and 23 percent have a high school diploma. GSHS also makes basic education available to inmates. Table 2 indicates that 60 GED certificates, 18 High School Equivalency Test (HiSET) certificates, and two high school diplomas were granted.
Table 2. Education Certificates Awarded in NH State Prisons, FY 2014
GED 60 High School Equivalency Test 18 High School Diploma 2 Total GED/HS Certificates 80
6%0% 0%
6%
85%
1% 2%0%
20%
40%
60%
80%
Hispanic AmericanIndian orAlaskaNative
Asian Black orAfrican
American
White Other Unknown
Figure 4. Race and Ethnicity of State Prison Population, October 2014
0%
5%
10%
15%
20%
18-24 25-29 30-34 35-39 40-44 45-49 50-54 55-59 60+
Figure 5. Age of State Inmate Population, October 2014

6
Automotive Mechanism 33 Building Trades 52 Business Education 182 Computer Education 153 Culinary Arts 91 Intro to the Workforce 71 Total Career/Technical Certificates 601
Source: New Hampshire DOC, 2014 Annual Report
2.3 Crime Type and Sentence Length Approximately half of state prisoners in 2014 were convicted of a crime against persons, such as assault, domestic violence, reckless conduct, or criminal threats.11 Twenty-five percent of the inmates were sentenced for property crimes, 15 percent for drug or alcohol offenses, and 10 percent for other or unknown offenses. Figure 6 shows the distribution of inmates by criminal offense type.
The minimum sentence for 55 percent of state prisoners was between one and three years.12 The most common maximum sentence in state prison was between five and 10 years. Those with maximum sentences of 20 years or more comprised 15 percent of the prison population.
15%
50%
25%
10%
0%
20%
40%
60%
Drugs/Alcohol Personal Property Other/Unreported
Figure 6. State Inmate Population by Crime Type, October 2014
Less than 1 year
1 to 3 years 3 to 5 years 5 to 10 years 10 to 20 yearsGreater than 20
yearsUnreported
Minimun 58 1,560 293 606 101 214 27
Maximum 24 352 526 858 649 423 27
0
400
800
1,200
1,600
NumberofInmates
Figure 7. Minimum and Maximum Sentence CategoryDistributions, October 2014 State Prisoners
Minimun
Maximum

7
2.4 Technical Parole Violations New Hampshire’s state prison budget may be high partly because of state prisoners who recidivate, or return to custody. The New Hampshire DOC regularly conducts recidivism analyses. The analyses show that 43.1 percent of state prisoners released in 2009 returned to prison in the subsequent three years.13 However, the recidivism rate has declined in recent years. Among state prisoners released in 2005, the rate was 49.6 percent.
Forty-four percent of returning offenders were convicted of violating the conditions of their parole (i.e., technical violations). Figure 8 describes these violations. They often include failing to report to a parole officer, changing residence without permission, drug or alcohol use, or community drug treatment failure. Additionally, the reasons offenders return to prison vary by the type of crime. Offenders convicted of violent crimes are less likely to return to prison on a new sentence or charge.
Figure 8. Technical Violations for Offenders Released in 2009 and Returned to State Prison within 3 Years (N=268)
Source: New Hampshire DOC Annual Report.
3. OPERATIONS AND DEMOGRAPHICS OF COUNTY JAILS The state and county corrections systems operate relatively autonomously from each other. According to the National Association of Counties’ annual “State Prisons and County Jails” report, in New Hampshire:
[P]ersons receiving a sentence of less than one year serve their time in a local jail. Persons receiving a sentence of one year or more serve their time in one of the four state facilities. The relationship between counties and the state and counties and other counties is an informal, quid pro quo relationship, where at some point in time, each one houses prisoners for another. A one-on-one trade exists between the counties and the state; for every prisoner the state sends, they take on one county inmate. There are no state reimbursements provided in this system.14

8
Essentially, counties must house prisoners sentenced to up to one year without reimbursement from the state, a different relationship than the majority of states.15 3.1 County Jail Operations While counties receive money from the state, each county lists its corrections budget as funded without state support. The current practice is for county jails to house prisoners up to one year, at which point a sentence longer than that would transfer to a state prison, where they would then be funded by the State Department of Corrections. Many of those currently serving time in county jails are pre-trial, suggesting that many people cannot afford bail. However, this requires jails to spend money on inmates who have not even been sentenced yet.16 While the individual counties—excluding Hillsborough and Merrimack Counties—do list corrections line item spending in their annual budgets, demographic and operational data was far less accessible for the majority of counties. Thus, while Section 5 includes the majority of this budgetary data, the data here in Section 3 come from a variety of resources, including the counties themselves, the New Hampshire Association of Counties, the National Association of Counties, and the National Institute of Justice. 3.2 Jail Staffing and Occupancy The ten county jails range in occupancy, staffing, and number of inmates housed each year. Table 1 summarizes these data. The final column describes the inmate-to-staff ratio. On average, New Hampshire’s county jails have 2.6 inmates per staff member. However, the ratios for Grafton and Merrimack Counties are 1.6 and 1.3, respectively—much lower than the average. As Section 4.1 demonstrates, Grafton County spends 61 percent of its corrections budget on wages, which suggests significant investment in maintaining a low inmate-to-staff ratio. Strafford and Belknap Counties have inmate-to-staff ratios of 4.4 and 4.2, respectively, higher than the ten-county average. The two counties differ in their jail population sizes: Strafford County has the second largest population and Belknap County has one of the smaller jail populations. However, wages account for 50 percent or less of both counties’ corrections budgets: 42 percent in Strafford and 50 percent in Belknap County. Table 3 also provides information about the jail occupancy rate in each county. Based on the daily average inmate population, the majority of county jails are below full capacity. Only Belknap County exceeds its number of beds available, by up to 26 percent at times. Hillsborough County, on the other hand, uses only 64 percent of its available beds on average. However, the manner in which counties record their number of inmates is not identical across counties, making it difficult to determine whether all beds are necessary.

9
Table 3. County Jails’ Number of Staff, Average Daily Inmates, and Beds Available in 2015
Staff Inmates (daily)
Beds Inmates-to-Staff Ratio
Hillsborough 177 464 725 2.6 Strafford 85 375 495 4.4 Rockingham 104 263 383 2.5 Merrimack 155 203 247 1.3 Cheshire 82 198 230 2.4 Grafton 75 118 150 1.6 Sullivan 54 110 - 2.0 Belknap 26 100 87 3.9 Carroll 37 62 73 1.7 Coos 22 40 61 1.8 Total 816 1,933 2,561* 2.4
Notes: Derived from the Association of Counties and individual county budgets (see Appendix A). For Carroll County, the weekly average inmate count, rather than the daily average, is reported. Merrimack County’s number of inmates is estimated using its cumulative annual total of 2,410. Belknap County lists its daily average inmates as a range of 90 to 110, so the table reports the middle point. *Total beds includes Sullivan County, using the average daily inmate population as the bed number.
3.3 Gender and Race The following tables summarize the gender and race distributions of jail populations in select counties. The tabulations are based on data from the Annual Survey of County Jails collected by the National Institute of Justice. Certain counties’ jails are same-sex only; thus, Coos and Rockingham Counties have minute female populations, while others have higher populations.
Table 4. Jail Population, Select Counties, June 29, 2013
Daily Inmates
Gender
County Male Female
Coos 30 30 100% 0 0% Grafton 128 105 82% 23 18% Merrimack 181 156 86% 25 14% Rockingham 295 292 99% 3 1% Hillsborough 596 472 79% 124 21%
Total 1,230 1,055 86% 175 14% Notes: Derived from National Institute of Justice (NIJ), Annual Survey of County Jails

10
The racial makeup of the county jails is similar to the state prison demographics. Caucasians make up 81 percent of the county jail population, slightly less than the states’ percentage. Most notably, the racial makeup between counties is divergent; Coos County’s population is 97 percent Caucasian, while Hillsborough County’s is 75 percent, significantly lower.
Table 5. Race of Jail Inmates, Select Counties, June 29, 2013
County White Black Hispanic
Asian, AI, Unknown
Coos 29 97% 0 0% 1 3% 0 0% Grafton 117 91% 6 5% 4 3% 1 1% Merrimack 151 83% 10 6% 9 5% 1 1% Rockingham 253 86% 20 7% 21 7% 1 0% Hillsborough 449 75% 53 9% 70 12% 8 1%
Total 999 81% 89 7% 105 9% 11 1% Notes: Derived from NIJ, Annual Survey of County Jails. AI = American Indian
3.4 Conviction Status As Table 5 demonstrates, many of those serving time in New Hampshire county jails have not been convicted of a crime and are awaiting trial, perhaps due to an inability to afford bail. Housing these prisoners more than doubles the jail population in certain counties, such as Rockingham and Hillsborough Counties.17
Table 6. Conviction Status Among Jail Inmates, Select Counties, June 29, 2013
County Convicted, Sentenced
Unconvicted, Awaiting Trial
Other Unconvicted
Coos 19 63% 11 37% 0 0% Grafton 58 45% 70 55% 0 0% Merrimack 38 21% 133 73% 10 6% Rockingham 127 43% 168 57% 0 0% Hillsborough 223 37% 314 53% 59 10% Total 465 38% 696 57% 69 6% Notes: Derived from NIJ, Annual Survey of County Jails.
3.5 Case Study: Grafton County Jail This section describes the demographic characteristics and average length of stay for Grafton County jail inmates held for any length of time between January 1, 2014 and October 30, 2014. The data include 973 individuals, the cumulative population over the 10-month period. The sample therefore differs from the daily inmate populations described in other sections, and includes many individuals held for only one or two days. The Grafton County Department of
11
Corrections provided the de-identified data in response to our request to conduct an analysis of costs and demographic backgrounds of New Hampshire county corrections populations. Of all jail inmates, 681 were men and 292 were women.
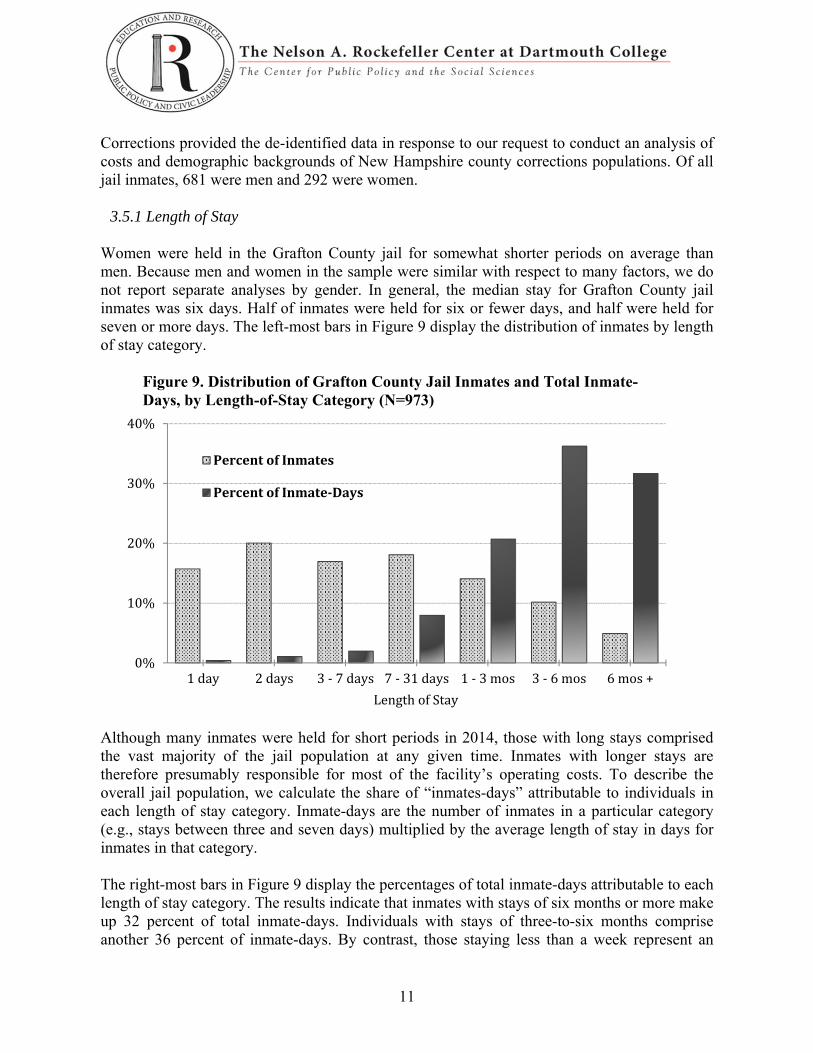
3.5.1 Length of Stay Women were held in the Grafton County jail for somewhat shorter periods on average than men. Because men and women in the sample were similar with respect to many factors, we do not report separate analyses by gender. In general, the median stay for Grafton County jail inmates was six days. Half of inmates were held for six or fewer days, and half were held for seven or more days. The left-most bars in Figure 9 display the distribution of inmates by length of stay category.
Figure 9. Distribution of Grafton County Jail Inmates and Total Inmate-Days, by Length-of-Stay Category (N=973)
Although many inmates were held for short periods in 2014, those with long stays comprised the vast majority of the jail population at any given time. Inmates with longer stays are therefore presumably responsible for most of the facility’s operating costs. To describe the overall jail population, we calculate the share of “inmates-days” attributable to individuals in each length of stay category. Inmate-days are the number of inmates in a particular category (e.g., stays between three and seven days) multiplied by the average length of stay in days for inmates in that category. The right-most bars in Figure 9 display the percentages of total inmate-days attributable to each length of stay category. The results indicate that inmates with stays of six months or more make up 32 percent of total inmate-days. Individuals with stays of three-to-six months comprise another 36 percent of inmate-days. By contrast, those staying less than a week represent an
0%
10%
20%
30%
40%
1day 2days 3‐7days 7‐31days 1‐3mos 3‐6mos 6mos+
LengthofStay
PercentofInmates
PercentofInmate‐Days

12
extraordinarily small share of the county jail population on any given day. To describe these and other inmates, we next evaluate gender and criminal charge information.
3.5.2 Criminal Charges The number of days inmates were held varied depending on their criminal charges. The vast majority of the 155 individuals arrested with any intoxication-related charges (as defined by New Hampshire R.S.A., Chapter 172) were held for one or two days. Figure 10 summarizes the days inmates with any intoxication charge were held. It is important to note that inmates often had multiple charges. An individual described in this figure might also have an assault or criminal contempt charge, for example. Figures 10 and 11. Length of Stay for Grafton County Jail Inmates with:
Any Intoxication Charge (N=155) Any Drug Charge (N=146)
Individuals with any drug-related charge typically had longer jail stays. For the 146 individuals with drug-related charges (as defined by R.S.A., Chapter 318, separate from intoxication charges), most were held over a week. Forty-three percent remained in jail for over a month. These individuals appear to comprise a large proportion of the total jail population and inmate-days in the Grafton system.
3.5.3 Education, Age, and Race The Grafton County data also describe the educational attainment for 928 of the jail inmates. Twenty-three percent had some level of college education, and 21 percent did not graduate high school or receive a GED equivalent.
0
10
20
30
40
50
60
70
80
1day 2days 3‐7days
7‐31days
1to6months
NumberofInmates
0
10
20
30
40
50
60
70
1day 2days 3‐7days
7‐31days
1to3months
3to6months
6monthsormore

13
Figure 12. Educational Attainment for Grafton Jail Inmates
Figure 13 summarizes the average number of days in jail for inmates at different educational attainment levels. Individuals with a GED or equivalent had substantially longer stays than those at other education levels. Forty-five inmates had no education information. Importantly, these 45 inmates were also missing other background information and had average stays of almost 100 days, suggesting that further effort should be made to collect information about all inmates.
Figure 13. Average Length of Stay by Educational Attainment, Grafton Jail Inmates (N=928)
Figure 14 displays the age distribution of Grafton County jail inmates. The median age was 31 years old. The normal curve outline indicates that the age distribution is skewed, with many individuals under age 30.18
NoHighSchool20%
GED/Equivalent23%
HighSchoolGrad30%
SomeCollege15%
CollegeDegree7% Missing
Data5%
0 20 40 60
NoHighSchool
GED/Equivalent
HighSchoolGrad
SomeCollege
CollegeDegree
AverageLengthofStayinDays

14
Figure 14. Age Distribution, Grafton County Jail Inmates (N=973)
Ninety-three percent of the Grafton County jail population in 2014 was white. The data do not describe Hispanic ethnicity, meaning that some of the “white” inmates may be Hispanic. Table 4 displays the distribution of 2014 inmates by race category.
Table 7. Race of Grafton County Jail Inmates
N %
American Indian/AN 10 1.0 Asian 10 1.0 Black 20 2.1 Unknown 28 2.9 White 905 93.0
All 973 100.0
Notes: Hispanic ethnicity information not available. AN = Alaska Native
White inmates tended to be held in jail for less time than non-white inmates. The median length of stay was six days for white inmates and 16 days for non-white inmates in the Grafton Jail. The difference in length of stay between white and non-white inmates was large and statistically significant even after holding constant an inmate’s age and charge type (e.g., drug, contempt, or intoxication charge).

15
4. FINANCES OF THE STATE CORRECTIONS SYSTEM This section summarizes trends in state level corrections spending in New Hampshire. The tables and figures identify categories of spending using the Governor’s Operating Budget and NH DOC annual reports for fiscal years 2014 and 2015. The totals do not include any county level spending, which is paid for separately through local taxes. 4.1 State Corrections Spending by Category Table 8 summarizes all state level corrections spending based on the FY 2014 Governor’s Operating Budget.19 The total NH DOC budget is $104.19 million. The bottom of Table 1 displays the $1.06 million budgeted for information technology (IT) for corrections, which is listed elsewhere in the Governor’s Budget. IT includes hardware and software for corrections facilities. In sum, total state level corrections spending was $105.24 million in FY 2014. The amount represents 1.9 percent of state spending in all areas. The amount from the General Fund represents between seven and eight percent of General Fund spending. 4.2 New England States Like many New England states, New Hampshire’s state corrections spending as a share of total state spending is relatively low. The National Associate of State Budget Officers (NASBO) reports that state corrections budgets in New England states ranges from 2.0 to 2.8 percent of total spending in FY 2014.20 One unique feature of New Hampshire is that state corrections are funded almost exclusively through the General Fund. Less than one percent is paid for by federal sources, and only four percent comes from other sources. As a result, the share of General Fund spending devoted to corrections is higher in New Hampshire. This may be largely due to New Hampshire county jails not being budgeted for at the state level. Table 9 summarizes this information for New England states.

16
Table 8. New Hampshire State Corrections Spending, FY2014*
Budget
($Millions) Positions
State Prison for Men 29.512 274 SecurityŦ 21.827 243 Kitchen, Maintenance, Laundry** 7.335 29 Administration 0.349 2
Medical Services 24.668 137 Medical and Dental 10.432 53 Mental Health & Secure Psychiatric 9.541 49
Pharmacy 2.555 9 Residential Treatment Program 2.139 26
Berlin Prison/Northern Corr. Facility 12.939 139 District Offices 8.633 87 Institutional Programs 6.358 71
Programs 5.573 66 Vocational Training & Canteen Ops 0.785 5
Community Corrections 5.335 57 Community Corrections 1.534 18 Men's Prison Minimum Sec. Unit 1.297 13 Calumet House 1.020 10 SHEA Farm 0.879 9 North End House 0.604 7
Administration/Financial Services 4.081 14 State Prison For Women 3.708 31 Office of the Commissioner 2.509 27
Commissioner's Office 1.265 9 Human Resources 0.692 11 Parole Board 0.364 4 Business Information Unit 0.188 3
Correctional Industries/Inventory 2.929 20 Security and Training 1.540 19 Professional Standards 1.264 13 Correction Grants 0.709 2
Department of CorrectionsϮ 104.186 891 Information Technology for Corrections 1.059 -
Total Corrections Spending 105.244 891
Notes: *Based on FY2014 Governor's Recommended Budget. Ŧ Security includes $18.6 in services, pay, benefits, $2.6 in overtime and holiday pay, and $0.6 for other expenses. **Includes warehouse expenses. ϮDOC funds come from General Fund ($99,815,785), federal sources ($167,919), and other sources ($4,201,947).

17
Table 9. State Level Corrections Spending, New England, FY 2014
Corrections Spending (Millions)
% of Total
Spending
% of General
Fund
Residents (Millions)
Connecticut $686 2.3% 4.0% 3.60 Maine 160 2.0 4.9 1.33 Massachusetts 1,403 2.4 4.5 6.75 New Hampshire 105 2.0 7.9 1.33 Rhode Island 194 2.5 5.7 1.06 Vermont 150 2.8 10.2 0.63
Source: NASBO, State Expenditure Report (2014) 4.3 Major Expenses by Area The largest category of DOC spending in 2014 was the State Prison for Men. The prison accounted for almost 28 percent ($29.5 million) of the total DOC budget.21 Within the Men’s Prison budget, security comprised 74 percent of spending, including $18.6 million in services, pay, and benefits and $2.6 million in overtime and holiday pay. Health services represent the second largest category of corrections spending in New Hampshire. The Medical and Forensic Services DOC budget in FY 2014 was $24.7 million, with 137 positions.22 The largest subcategories include medical and dental care, followed by mental health programs and the Secure Psychiatric Unit. Although not shown in Table 8, medical payments to providers represent the largest cost within the medical, dental, and mental health categories, 50 percent of the medical-dental division budget and 80 percent of the mental health division budget. The third largest source of spending in 2014 was the Berlin Prison. Notably, $1,252,269 of the Berlin Prison budget was dedicated to heat, electricity, and water. As expected, prisons accounted for about 77 percent of total DOC expenses in FY 2014. The average daily cost per offender was $91.89. The Bureau of Prisons reports that the fee to cover the average daily cost of prisoners in FY 2013 was $80.25. Thus, the daily expenses in NH prisons are comparatively higher than the national average.23

18
The next biggest expenses were overhead and administration (8.5 percent) and probation and parole (8.2 percent). Additionally, the number of positions in each department is associated with the department’s salary costs. The greater the number of positions, the higher the cost. There is an exception, however, in the budget of the Office of the Commissioner. Costs for the nine positions in the Commissioner’s Office are $1,265,260, compared to $691,650 for the 11 positions in the Office’s Human Resources division.24 5. FINANCES OF COUNTY CORRECTIONS SYSTEMS As stated earlier, each county provides its own resources for the Departments of Corrections. The counties provide a variety of programs that cost each county different amounts. For instance, the counties with drug courts spend just less than $1.9 million each year on these courts. Belknap County also operates a Restorative Justice program, costing $170,552 for FY 2015.25 Hillsborough County allocates $100,000 for personnel for the county’s Mental Health Court.26 Because of the individualistic manner in which the counties report their costs, it is impossible to completely compare each line item of each county’s corrections budget. However, Section 5 provides the cost data available for each county and analyzes certain drivers of costs. 5.1 County Costs and Budgets New Hampshire’s ten counties combined have budgets of approximately $507.8 million for Fiscal Year 2015. Of this money, over $77.2 million will go to county Corrections Departments, whish is approximately 15 percent of total county spending. Hillsborough, Merrimack, Rockingham, and Strafford Counties spend the most on their Corrections
0.3% 0.4%5.3% 8.2% 8.5%
77.3%
0%
20%
40%
60%
80%
PrisonIndustries
Grants
TransitionalHousing
Probation/Parole
Overhead
Expenses/Adm
insitration
PrisonsFigure15.MajorStateLevelCorrectionsExpenses,New
Hampshire,FY2014(outof$100.2million)

19
departments, while Coos spends the least. This corresponds with the population of each county, though, as Coos County has the smallest population and Hillsborough County the largest.27 While Carroll County’s corrections did not change from 2014 to 2015, all of the other counties actually increased their corrections spending, with Rockingham County actually spending 13.4 percent more in 2015. Furture research might track the growth of spending with relation to change in inmate population or personnel. See Table 10 for further data.
Table 10. County Corrections and Total Budgets (millions of dollars)
Total County Budget 2015
Total Corrections
Budget 2015
% Budget on
Corrections
Total Corrections
Budget 2014
% Change in Corrections 2014-2015
Belknap 27.3 3.6 13.2 3.4 +5.9 Carroll 28.0 3.2 11.4 3.2 0.0 Cheshire 42.7 6.1 14.3 5.8 +5.2 Coos 34.1 2.3 6.7 2.2 +4.6 Grafton 39.0 4.8 12.3 4.5 +6.7 Hillsborough 87.3 15.6 17.9 - - Merrimack* 81.6 (14.5) 17.8 14.5 - Rockingham 80.1 12.7 15.9 11.2 +13.4 Strafford 57.9 10.1 17.4 9.7 +4.1 Sullivan 29.8 4.3 14.4 - - Total 507.8 77.2 18.4 54.5 -
Notes: Derived from Association of Counties, 2015, and county budgets (see Appendix A) *Merrimack corrections information is based on its 2014 budget. Hillsborough County budget information obtained through the New Hampshire Association of Counties.
As mentioned in Section 3.1, the counties vary in their staffing and how much of their budget they dedicate to staff salaries. Rockingham County spends $4.8 million on wages, though they have fewer staff members than Hillsborough County. However, Hillsborough County’s FY 2015 data are not available, making direct comparisons difficult. In contrast, Merrimack County spends over $7 million, or approximately half of their corrections budget, on 155 staff members and personnel; while $7 million may seem like a significant amount of money, Grafton County also spends over half of its budget on wages.

20
Table 11. County Corrections Spending on Wages, Insurance, Selected Services (thousands of dollars)
Wages Health
Insurance Workers’
Comp Retirement
Funds Dietary Services
Inmate Medical Services
Belknap 1,800 627 47 395 215 99 Carroll 1,306 633 30 322 210 201 Cheshire 3,253 - 69 756 351 302 Coos 626 284 23 239 235 248 Grafton 2,890 422 30 587 245 176 Hillsborough - - - - - - Merrimack* 7,273 1,967 182 1,615 437 524 Rockingham 4,803 1,251 210 1,171 927 1,835 Strafford 4,188 - 119 1,096 657 1,953 Sullivan 2,126 301 58 453 538 231 Total 28,265 - 768 6,634 3,815 5,569
Notes: Derived from individual county budgets obtained online and Association of Counties, 2015 (see Appendix A). * Merrimack County’s data are from FY 2014, provided by the New Hampshire Association of Counties. Hillsborough does not list full budgets online; county totals do not include its data.
The dearth of data from Hillsborough and Merrimack County makes it difficult to compare its spending to other counties. Initially, the $927,000 for dietary services in Rockingham County appears disproportionately high, and the amounts for inmate medical services in counties besides Rockingham and Strafford appear disproportionately low. However, the differences may be due to how the counties define and report those services, and may be in line with Hillsborough and Merrimack, were those budget categories known. Future research might examine Hillsborough and Merrimack corrections spending, and all counties’ definitions of budget categories (e.g., inmate medical services). 6. CONCLUSION While corrections spending declined in most states in recent years, it has risen in New Hampshire since 2012. The rise follows three decades of considerable prison and jail spending growth, as illustrated in Figure 3 above.28 As a result, the state has constructed new facilities, such as the New Hampshire Correctional Facility for Women. One of the primary goals of this report is to precisely document the state prison and county jail costs in New Hampshire. County corrections budgets, in particular, are often exceedingly difficult to determine from publicly available sources. Perhaps due to such difficulty, policy researchers often exclude county jail costs when describing corrections in New Hampshire. This report’s findings indicate that county jails account for almost four in 10 dollars spent in the state on corrections. Spending per inmate is higher at the county level than the state level,

21
perhaps because of issues of scale and inefficiency. Specifically, each of the ten counties maintains a jail and corrections system, which cannot be cost-efficient for counties with few offenders. Additionally, we find that approximately 18 percent of county budgets are dedicated to corrections. Given the substantial county jail spending in New Hampshire, it is likely that policy analysis underestimates how much taxpayers spend on corrections. Further efforts might be made to (1) make county jail costs transparent and accessible to the public, and (2) incorporate jail costs in research on corrections systems. The findings also show that inmate medical care accounts for a substantial share of state level corrections spending. Medical care in FY 2014 cost $24.7 million, more than the entire security budget for the men’s prison, $21.8 million (see Table 8). Given that approximately 40 percent of New Hampshire state prisoners are age 40 or older—including 8 percent age 60 or older—this high cost of health care is not entirely surprising. Older inmates have significantly higher health care needs. Older offenders also have significantly lower recidivism rates, suggesting that policies that impose long sentences on older, low-risk offenders may not be cost-beneficial. Policymakers might generate enormous savings by identifying and potentially revisiting the penalties most often applied to older individuals. The report also provides descriptive snapshots of the state prison and county jail populations. A notable finding is that a majority of jail inmates are not convicted of a crime, and are awaiting trial (see Table 6). Unconvicted inmates are often individuals with restrictive pretrial release conditions and who cannot afford to post bail. The unconvicted group represents a substantial cost to taxpayers; they likely account for over half of the $77.2 million county jail spending. Researchers and policymakers might therefore consider ways to improve to bail and pretrial detainment process. Research by the Laura and John Arnold Foundation in 2013 shows that detaining individuals prior to a hearing generates worse outcomes relative to not detaining individuals.29 The studies also conclude that persons awaiting bail are relatively low public safety risks. Several states are modifying or considering modifying their bail processes, including Vermont in its recently proposed H. 221. This report does not focus on policy levers to reduce corrections costs, but instead analyzes existing costs and inmate populations. Nevertheless, the data uncover several significant policy implications. As noted above, policymakers can evaluate the effectiveness of alternate bail and pretrial programs in other states. Additionally, the data reveal a large share of jail inmates detained for drug charges. In Grafton County, individuals with drug charges are incarcerated much longer and make up a sizeable share of total inmate-days; and 15 percent of state prisoners are incarcerated for a drug crime. Reducing statutorily defined mandatory minimum sentences for drug offenses is frequently shown to reduce prison costs while not increasing crime rates. (Mandatory sentencing laws require judges to prescribe specific sentences without considering many characteristics of the offender and crime.) Senate testimony in 2013 by Jessica Eaglin from Brennan Center describes some key research.30 A Vera Institute report shows that many states have recently modified mandatory drug sentencing laws, perhaps recognizing that they may have been useful in a past era, but are counterproductive in the context of low or falling crime rates.31 New Hampshire has historically maintained low crime rates. Policymakers might investigate which RSAs contain mandatory sentencing penalties for

22
drugs, and which ones police and community supervision experts believe are triggered most frequently for non-violent offenders. Finally, many states have found success in new community supervision policies and innovative community crime prevention programs.32 Figure 8 shows that technical violations bring many New Hampshire offenders back to prison. The state’s parole and community supervision policies are worth investigating in depth. Policymakers can consult police, community supervision, and parole experts, who have a close view of offenders most helped and hurt by existing policies. In general, criminology researchers have reached some consensus about strategies to reduce costs while maintaining public safety. 33 Policy changes require time, political will, and coordination among stakeholders. However, with 18 percent of New Hampshire county spending and almost eight percent of General Fund spending dedicated to corrections, the upside is considerable.

23
APPENDIX
Appendix A. Summary of Corrections Reports Utilized State Division of Field Services Supervision Summary, October 2014. NH DOC Monthly Facility
Crime Summary Report. Retrieved from: http://www.nh.gov/nhdoc/government.html. Inmate Population by Crime Type, October 2014. NH DOC Monthly Facility Crime Summary
Report. Retrieved from: http://www.nh.gov/nhdoc/government.html. Inmate Population by Demographics, October 2014. NH DOC Monthly Facility Crime
Summary Report. Retrieved from: http://www.nh.gov/nhdoc/government.html. New Hampshire Department of Corrections Annual Report: State Fiscal Year ending June 30,
2013. Retrieved from:http://www.nh.gov/nhdoc/divisions/publicinformation/index.html. Prison Admission/Releases Summary, October 2014. NH DOC Monthly Facility Crime
Summary Report. Retrieved from: http://www.nh.gov/nhdoc/government.html. County Annual Report of the Grafton County Commissioners, State Fiscal Year 2013. Retrieved from:
www.co.grafton.nh.us/wp-content/uploads/2013/09/FY13-Report.pdf. Belknap County 2015 Budget Recommendations. Retrieved from:
http://www.belknapcounty.org/pages/belknapcounty_webdocs/budget Caroll County 2015 Budget Expenditures. Retrieved from:
http://www.carrollcountynh.net/pages/CarrollcountyNH_Commissioner/Approved Budgets
Cheshire County Budget 2015. Retrieved from: http://www.co.cheshire.nh.us/Finance/index.html
Coos County Budget Appropriations, Fiscal Year 2015. Retrieved from: http://www.cooscountynh.us/county-info/pages/budgets-financial-reports
Grafton County Demographics, October 2014. Grafton County Department of Corrections. Retrieved from: Programs Sergeant
Grafton County Fiscal Year 2015 Budget. Retrieved from: http://www.co.grafton.nh.us/operating-budgets/
“Impacts on County Jails.” Florida Association of Counties. 2009. Retrieved from: http://www.fl-counties.com/advocacy/public-safety/impacts-to-county-jails.
Merrimack County Department of Corrections 2014 Budget, retrieved from the New Hampshire Association of Counties.
Rockingham County Approved Budget, 2015. Retrieved from: http://www.co.rockingham.nh.us/finance/finance.htm
Strafford County 2015 Approved Budget. Retrieved from: http://www.co.strafford.nh.us/icons/commissioner-s-office
Sullivan County Fiscal Year 2015 Budget Final Expenditures. Retrieved from: http://www.sullivancountynh.gov/index.php?n=budget_taxes_amp_audit

24
General Broomhead, S., Moreno, R., and Subramanian, R. Recalibrating Justice: A Review of 2013
State Sentencing and Corrections Trends. Vera Institute of Justice. July 2014. Carson, E. A. Prisoners in 2013. U.S. Department of Justice, Office of Justice Programs
Bureau of Justice Statistics. September 2014. “Chronological History.” New Hampshire Department of Corrections. Retrieved from:
http://www.nh.gov/nhdoc/chronological.html. Interstate Commission for Adult Offender Supervision. 2014. Retrieved from:
http://www.interstatecompact.org/Tools/StateProfiles.aspx. New Hampshire Senate Bill 323. Retrieved from:
http://www.gencourt.state.nh.us/legislation/2014/SB0323.html New Hampshire Statute II 30:B 15. Retrieved from:
http://www.gencourt.state.nh.us/rsa/html/II/30-B/30-B-15.htm. Norton, S., Barrick, D., Delay, D., & Decker, K. (2013). What is New Hampshire?
New Hampshire Center for Public Policy Studies. Shelden, R., and Teji, S. Collateral Consequences of Interstate Transfer of Prisoners. Center
on Juvenile and Criminal Justice. July 2012. Retrieved from: http://www.cjcj.org/uploads/cjcj/documents/Out_of_state_transfers.pdf.
State of New Hampshire, Office of Energy and Planning Regional Planning Commissions. “County Population Projections, 2013 by Age and Sex.” Retrieved from: https://www.nh.gov/oep/data-center/population-projections.htm
The Price of Prisons: What Incarceration Costs Taxpayers, New Hampshire. The Vera Institute of Justice, Center on Sentencing and Corrections. January 2012. Retrieved from http://www.vera.org/files/price-of-prisons-new-hampshire-fact-sheet.pdf.

25
REFERENCES 1 National Association of State Budget Officers, State Expenditure Report (2014), https://www.nasbo.org/sites/default/files/State%20Expenditure%20Report%20%28Fiscal%202012-2014%29S.pdf; National Association of State Budget, State Spending for Corrections (2013), https://www.nasbo.org/sites/default/files/pdf/State%20Spending%20for%20Corrections.pdf; also see Figure 3 in the current report. 2 Daniel Barrick, Dennis Delay, Daniel Lautenschlager, Kerry A. McHugh, Stephen Norton, What is New Hampshire? New Hampshire Center for Public Policy Studies (2013), p. 118. 3 The per-inmate values are calculated as total corrections spending divided by the total number of inmates. The marginal cost of housing and security for each additional inmate per year will differ 4 Vera Institute of Justice, The Price of Prisons: What Incarceration Costs Taxpayers, New Hampshire Fact Sheet, (January 2012), http://www.vera.org/files/price-of-prisons-new-hampshire-fact-sheet.pdf, p. 9. 5 This amount is total state and county corrections spending divided by the number of New Hampshire residents (1.33 million). The Brookings-Urban Institute Tax Policy Center estimates a similar per capita corrections amount of $138 (see http://slfdqs.taxpolicycenter.org/pages.cfm). 6 New Hampshire Department of Corrections, “Prisoner Population Since 1812,” http://www.nh.gov/nhdoc/population.html. 7 New Hampshire Center for Public Policy Studies, NH Corrections and Crime, Post SB500. Interbranch Criminal and Juvenile Justice Council (September 2014). 8 Josh Sanburn, “The Surprising State Leading the U.S. in Prison Population Growth.” TIME (September 2014). 9 Ann E. Carson and Joseph Mulako-Wangota, “Count of total jurisdiction population, December 31,” Bureau of Justice Statistics. Generated using the Corrections Statistical Analysis Tool (CSAT)-Prisoners, www.bjs.gov. (May 2015). 10 New Hampshire Department of Corrections Annual Report: State Fiscal Year ending June 30, 2014. Retrieved from: http://www.nh.gov/NHDOC/divisions/publicinformation/documents/annual-report-2014.pdf 11 New Hampshire Department of Corrections, “Monthly Facility Crime Summary Report.” 12 Ibid. 13 New Hampshire Department of Corrections, Annual Report: State Fiscal Year ending June 30, 2014. Retrieved from: https://www.nh.gov/nhdoc/divisions/publicinformation/documents/annual-report-2014.pdf 14 “State Prisons and County Jails.” National Association of Counties, 2010. 15 Ibid. 16 “Incarceration’s Front Door: The Misuse of Jails in America.” Vera Institute of Justice Report, February 2015, p. 5. 17 Calculated from National Institute of Justice, Annual Survey of County Jails 18 Hillsborough County’s age distribution is similar; 61 percent of its inmates are below the age of thirty-two. These data come directly from the Hillsborough Department of Corrections. 19 Governor’s Operating Budget: State Fiscal Year ending June 30, 2014. Retrieved from: http://admin.state.nh.us/budget/Budget2014-2015/GovernorsBudgetBill.pdf#02-46 ; pp. 488-546 20 NASBO, State Expenditure Report.

26
21 New Hampshire Department of Corrections Annual Report: State Fiscal Year ending June 30, 2014. Retrieved from: http://www.nh.gov/NH DOC/divisions/publicinformation/documents/annual-report-2014.pdf; pp. 504-509. 22 Ibid, 516-522. 23 http://www.gpo.gov/fdsys/pkg/FR-2014-05-12/pdf/2014-10859.pdf 24 Governor’s Operating Budget: State Fiscal Year ending June 30, 2014. Retrieved from: http://admin.state.nh.us/budget/Budget2014-2015/GovernorsBudgetBill.pdf#02-46; pgs 488-492. 25 See Belknap County Budget in Appendix A 26 Data from Superintendent Dionne of Hillsborough County. 27 State of New Hampshire, “County Population Projections, 2013 By Age and Sex,” p. 9 28 New Hampshire’s growth in corrections spending was similar to New England states in the 1980s, 1990s, and 2000s. See Figure 3 above and NASBO, State Spending for Corrections, https://www.nasbo.org/sites/default/files/pdf/State%20Spending%20for%20Corrections.pdf 29 Laura and John Arnold Foundation, “Pretrial Criminal Justice Research” (2013), http://www.arnoldfoundation.org/sites/default/files/pdf/LJAF-Pretrial-CJ-Research-brief_FNL.pdf 30 Jessica Eaglin, “Senate Testimony: Reevaluating Mandatory Minimums' Effectiveness,” Brennan Center (September 2013), http://www.brennancenter.org/analysis/brennan-center-submits-testimony-hearing-mandatory-minimums 31 Ram Subramanian and Ruth Delaney, “Playbook for Change? States Reconsider Mandatory Sentences,” Vera Institute of Justice (2014), http://www.vera.org/sites/default/files/resources/downloads/mandatory-sentences-policy-report-v2b.pdf. 32 Trends in Sentencing and Corrections. Retrieved from: http://www.ncsl.org/Documents/CJ/TrendsInSentencingAndCorrections.pdf 33 See Alison Lawrence, “Managing Corrections Costs,” National Conference of State Legislatures (2014), http://www.ncsl.org/documents/cj/managingcorrectionscosts.pdf; Alison Lawrence, “Trends in State Sentencing and Corrections,” National Conference of State Legislatures (2013), http://www.ncsl.org/Documents/CJ/TrendsInSentencingAndCorrections.pdf;